1. Introduction
In the era of big data, as the precision and volume of map data continue to improve, applications such as smart cities and navigation systems are increasingly demanding multi-scale map information. Map generalization technology has therefore become an important means for processing large-scale, multi-scale geospatial data. Consequently, efficiently performing comprehensive operations on massive, multi-source map data has become a key and challenging issue in current map generalization research. Meanwhile, there is growing attention on the runtime of algorithms in map generalization [
1,
2]. As a complex spatial information abstraction process during scale transformation [
3,
4], map generalization must also enhance the algorithmic efficiency of its operators [
5,
6,
7], such as selection, simplification, mergence, collapse, and displacement when confronted with geospatial big data. Given that map generalization involves multiple complex processes, including modeling, feature construction, and decision-making, achieving rapid map generalization has been a significant challenge.
In the visualization of point features, such as residential areas and road survey points, real-time map generalization is manifested in the selection of a subset from massive point data to adapt to current zoom-in/zoom-out requirements. The selection process must be highly efficient in order to quickly output a generalized result. Feature selection, the process of selecting a subset of geographic objects to represent the overall feature distribution in map space during scaling transformation, is regarded as the most intricate operator in map generalization due to its requirement for global decision-making [
8,
9]. Cartographers must consider a range of contextual conditions to determine which objects should be selected [
10,
11]. In particular, a point cluster—where a group of points are selected as a unit—has received significant attention as a potential bottleneck of running time in map generalization [
12,
13,
14]. This is because many map features, such as buildings, electrical and communication stations, and labels, are often greatly abstracted as point features during the selection process, leading to frequent use of point cluster selection during map generalization. Moreover, in practical scenarios, the number of point features can typically reach tens of thousands, and in some national-level applications, even millions or more. Such large volumes of data significantly impact the speed of map generalization and pose a major challenge for designing efficient algorithms.
Methods for achieving point cluster generalization are mostly implemented through selection operations. Research in this area generally focuses on two main issues: quantity control and selection quality. The core of the quantity control problem is determining the number of points that should be selected by the algorithm during the map scaling process from large to small scales. Traditionally, the quantitative reference standard for this problem has relied mainly on the Topfer’s radical model [
15]. In addition, selection criteria based on fractal theory are also commonly used to control the quantity [
16,
17]. Compared with the quantity problem, more research has focused on the issue of selection quality. This problem can be simplified to “which ones to select”—that is, which points to retain during the generalization process to achieve a satisfactory simplification result while maintaining good visual performance. Numerous studies have implemented point selection using methods based on coordinates [
18], point importance [
19], the Voronoi diagram structure of points [
20,
21,
22], and machine learning [
23]. These methods can preserve the original morphological characteristics of point clusters in their respective aspects after the selection process. However, it is worth noting that most of these methods have been validated on small-volume datasets, and when faced with large-scale point cluster data—ranging from tens of thousands to millions—the complex modeling and iterative processes lead to enormous computational overhead, making it difficult to meet the demands of real-time map generalization.
In fact, many software applications (such as QGIS and ArcGIS) still encounter significant challenges when handling massive point cluster selection (data at the level of hundreds of thousands or millions). Therefore, against the backdrop of rapidly growing geospatial big data, algorithms with high computational complexity are struggling to meet the needs for fast map generalization. To address this problem, we propose an improved method for massive point clusters based on Delaunay triangulations. By analyzing the Voronoi-diagram-area-based method proposed by Ai and Liu [
20], we investigated the workflow of the algorithm, identified the components that consume significant computational resources, and optimized them using a Delaunay triangulation. In map generalization research, constructing Delaunay triangulations for geographic features is a commonly employed solution. Owing to its excellent connectivity and effective spatial partitioning properties, the Delaunay triangulation has been applied in several studies on the generalization of polyline and polygon features [
24,
25], and it offers advantages over other methods in eliminating shape details. Based on this, we developed a point cluster selection method capable of handling massive data.
This study contributes significantly to the existing literature in the following ways:
- (1)
Realizes a more efficient method for point cluster selection, achieving satisfactory results.
- (2)
Presents a method for selecting large-volume point clusters (ranging from tens of thousands to even millions) for the first time.
- (3)
Compares our method to traditional methods, machine learning techniques, and professional software to evaluate its performance.
The remainder of this paper is organized as follows.
Section 2 introduces and summarizes the current research on point cluster generalization.
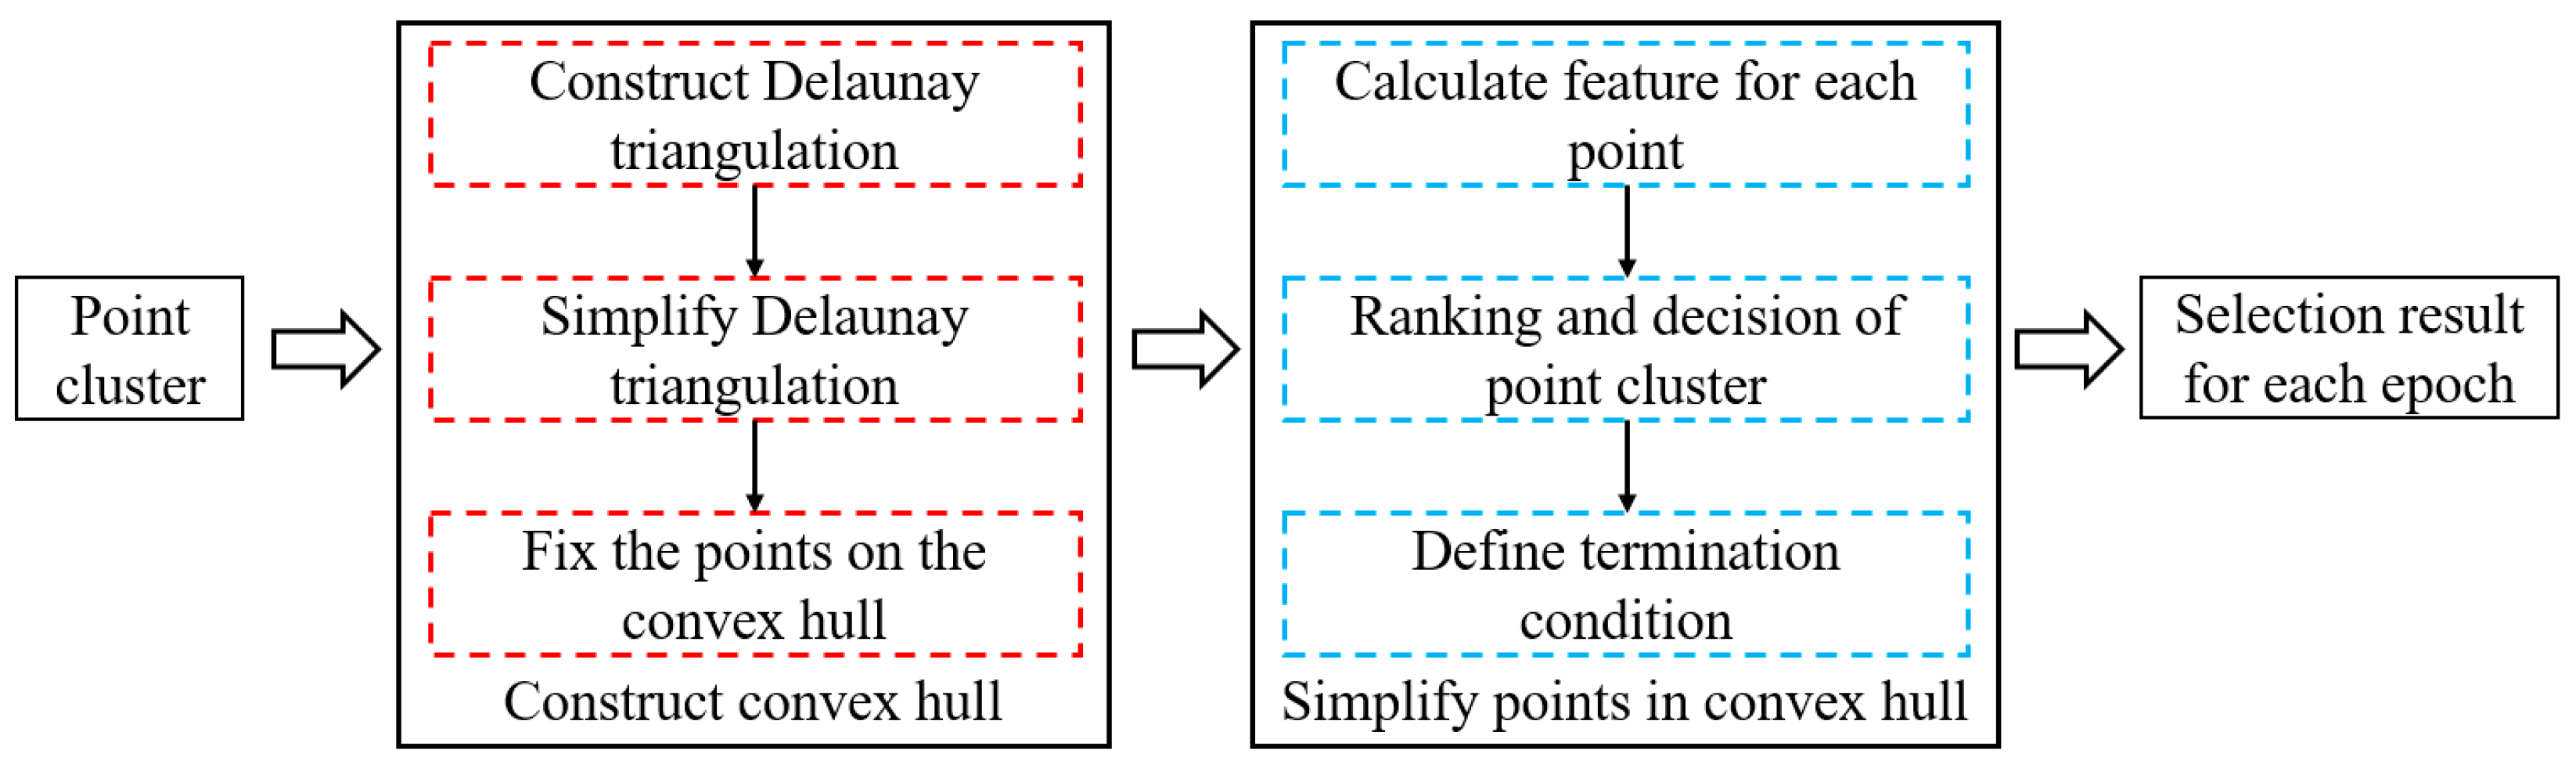
Section 3 outlines the method used to construct our selection method based on the Delaunay triangulation.
Section 4 presents and discusses the experimental results. Finally,
Section 5 concludes our work and highlights future directions.
2. Related Works
Current research on algorithms for point cluster generalization can be roughly divided into three categories. The first category of algorithms mainly considers the spatial distribution characteristics of the original point clusters during the selection process, including the preservation of density features, geometric distribution, and topological characteristics. For example, Wu [
18] employed multi-level nesting of the convex hulls of point clusters along with polyline feature simplification algorithms to effectively preserve the contour information and distribution characteristics of the original clusters; De Berg [
26] used an iterative approach in algorithm to preserve, to the greatest extent, the clustering contours and the number of clusters in the original point cluster; Qian [
27] proposed an algorithm that transforms the representation of points from coordinate space to a circle character space, whereby the centroids of point clusters are computed and clustered to preserve the distribution center, distribution range, and clustering characteristics of the original data, thus enabling point cluster selection based on circle character transformation.
The second category of algorithms achieves automatic generalization of point clusters primarily by evaluating the importance parameters of the points, and during the generalization process, these algorithms selectively consider certain distribution features. In this category, the design of the importance parameters is the key focus of the point cluster simplification process. To this end, some scholars have proposed effective parameters to control the selection of points. For instance, Langran and Poiker [
19] proposed the residential area spatial ratio algorithm, regarding each residential area as a point feature and drawing a circle with radius
centered at the residential area, where
represents the weight of point
and
is a constant. In the selection process, the points are first sorted in descending order according to this parameter and then selected based on certain geometric criteria, thereby effectively preserving the neighbor relationships and distribution density of the original point clusters. Similarly, gravity model algorithms and nearest-neighbor index parameters have also been proposed to achieve point cluster selection. Van Kreveld [
28] introduced an algorithm for increasing circle radius by regarding the point cluster as a circle centered at the original point cluster with radius
. In this method, the weight of a point is proportional to the circle’s radius, and the constant
is chosen to ensure that no two circles within the cluster overlap. This proportionality ensures that points with higher weights are more likely to be retained during the generalization process. In addition, the local density and relative local density parameters proposed by Sadahiro [
29], the density parameters extracted via quadtree by Burghardt [
30], and the Voronoi diagram area of point features proposed by Ai and Liu [
20] have all proven to be effective control parameters for achieving automatic generalization of point clusters [
21,
22].
The third category of algorithms realizes automatic point cluster selection through methods such as genetic algorithms and machine learning. Deng [
31] first divided the point clusters into smaller clusters based on density, calculated the number of points that needed to be retained in each sub-cluster, and then further simplified the points using convex hull algorithms combined with genetic algorithms. Meanwhile, Cai [
23] introduced a method that employs a Kohonen network to capture and map the features of points for generalization, thereby enabling the generalized result to preserve the original clusters’ density and internal texture.
Although existing algorithms have achieved good performance on their respective issues, research on point cluster generalization has been relatively limited in recent years. Moreover, most methods are highly complex and generally only applicable to small-volume point clusters. In addition, while the emergence of deep learning has led some scholars to employ graph neural networks for simplifying larger point clusters (in the order of tens of thousands of points), these approaches still require considerable time for feature extraction and network model training, and thus do not exhibit a clear efficiency advantage [
12]. Consequently, it is essential to design an efficient algorithm for point cluster generalization that can be applied to massive point datasets. This study intends to employ a method based on the Delaunay triangulation to achieve automated generalization of massive data points. In fact, owing to its excellent spatial partitioning and connectivity capabilities, the Delaunay triangulation has already been applied in many effective generalization algorithms for polyline and polygon features [
32,
33,
34,
35]. Thus, combining the Delaunay triangulation with point feature generalization emerges as a strategy with considerable feasibility.
4. Experiments and Discussion
The experiments of massive point cluster selection supported by the Delaunay triangulation were implemented with C# in Visual Studio 2012 platform with the support of the Windows 10 systems. The hardware comprises an Intel Core i7-10750H processor, a six-core, twelve-thread CPU clocked at 2.6 GHz, with a maximum turbo frequency of 5.0 GHz. Additionally, it boasts 16 GB of DDR4 RAM. The hardware is further equipped with an NVIDIA GeForce GTX 2070 Super graphics card.
4.1. Experiment Data and Comparing Methods
4.1.1. Experiment Data
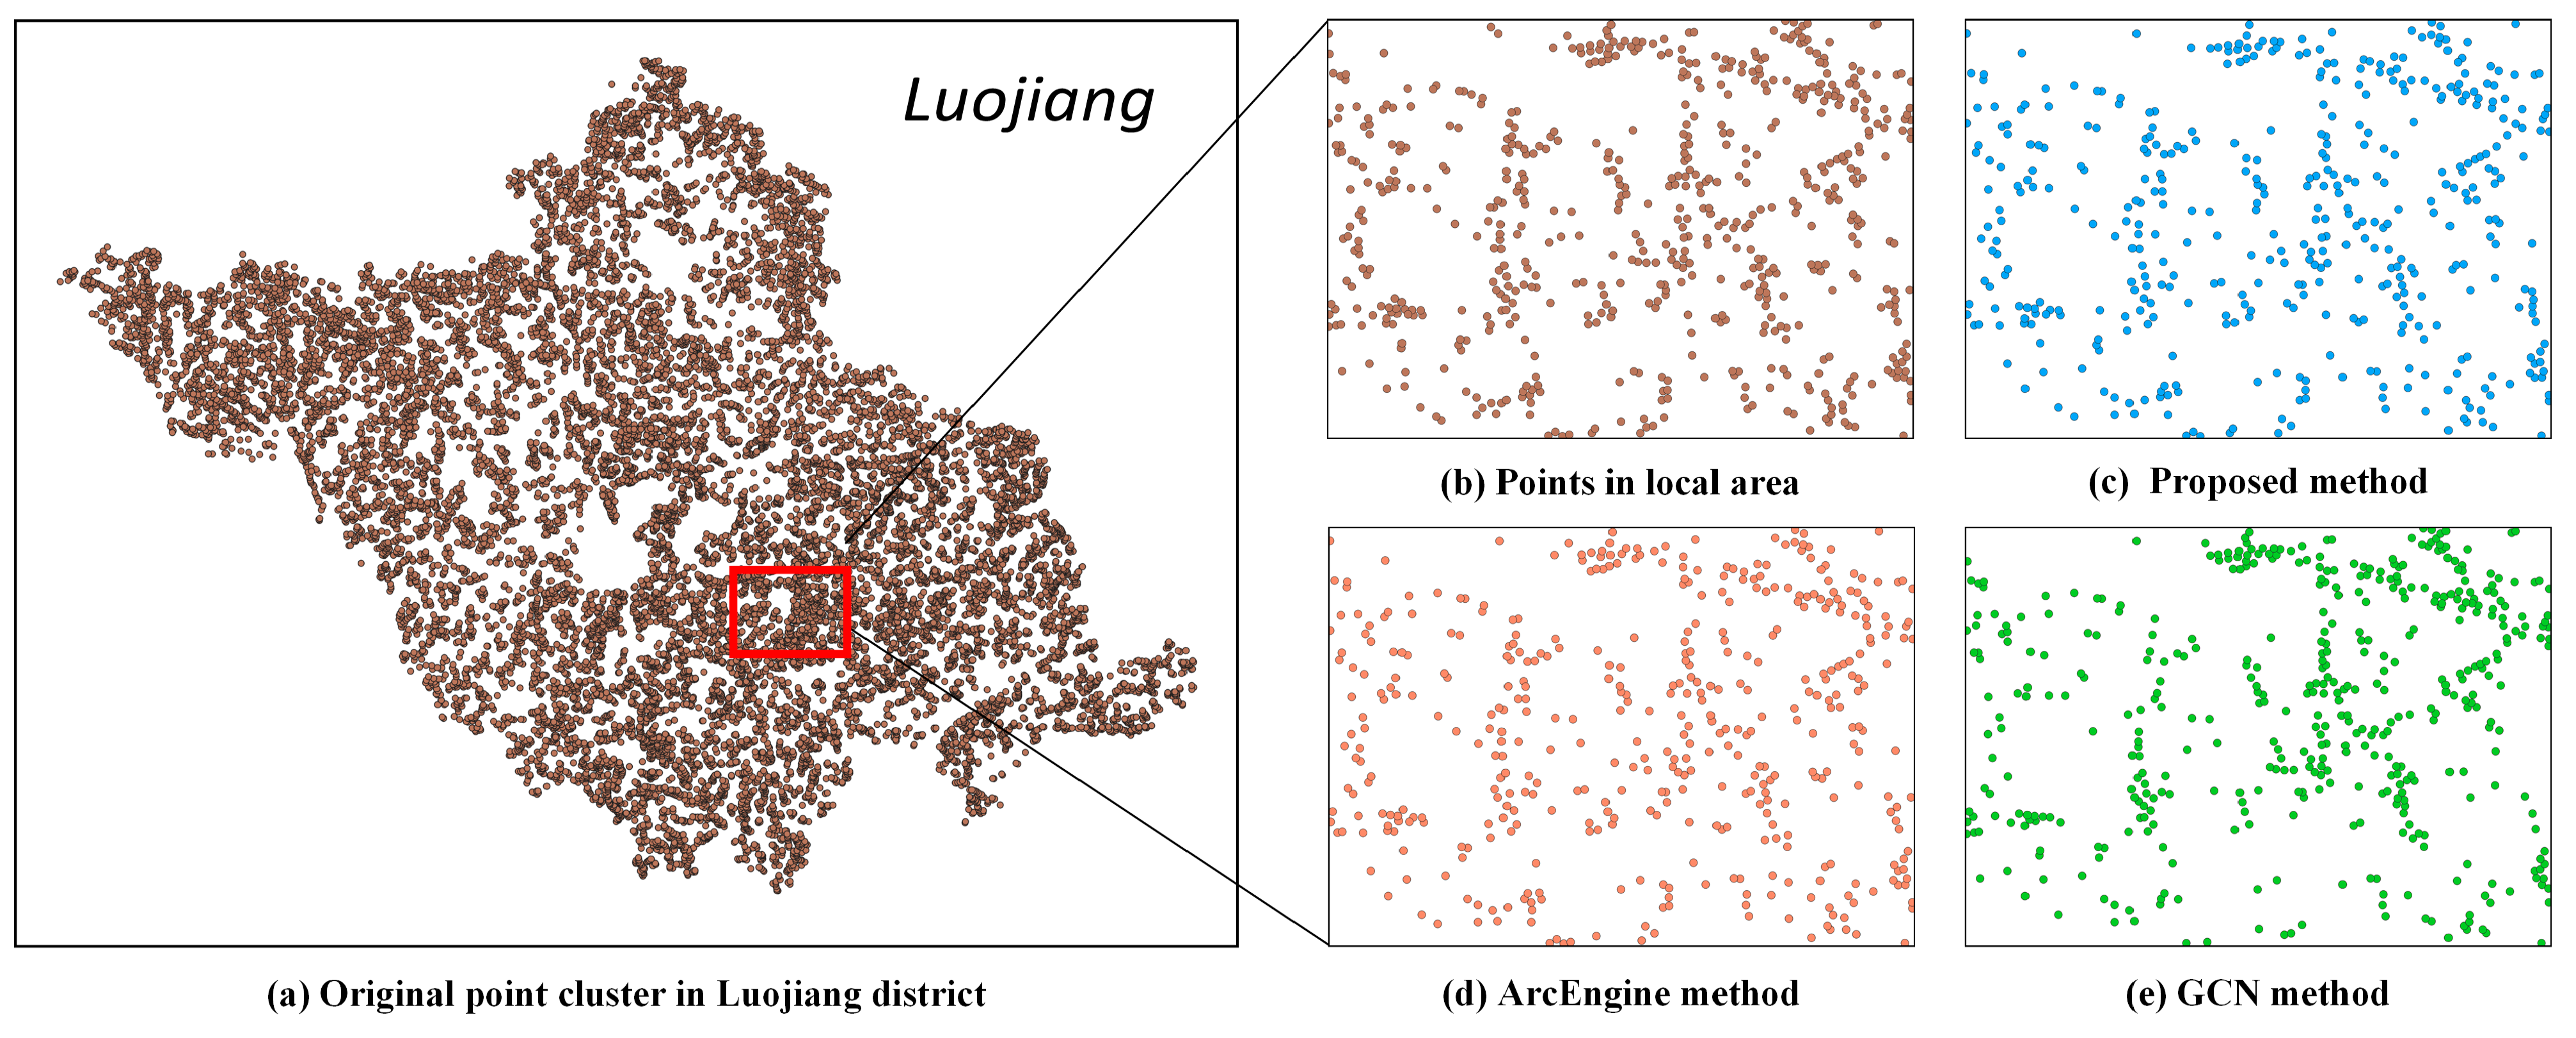
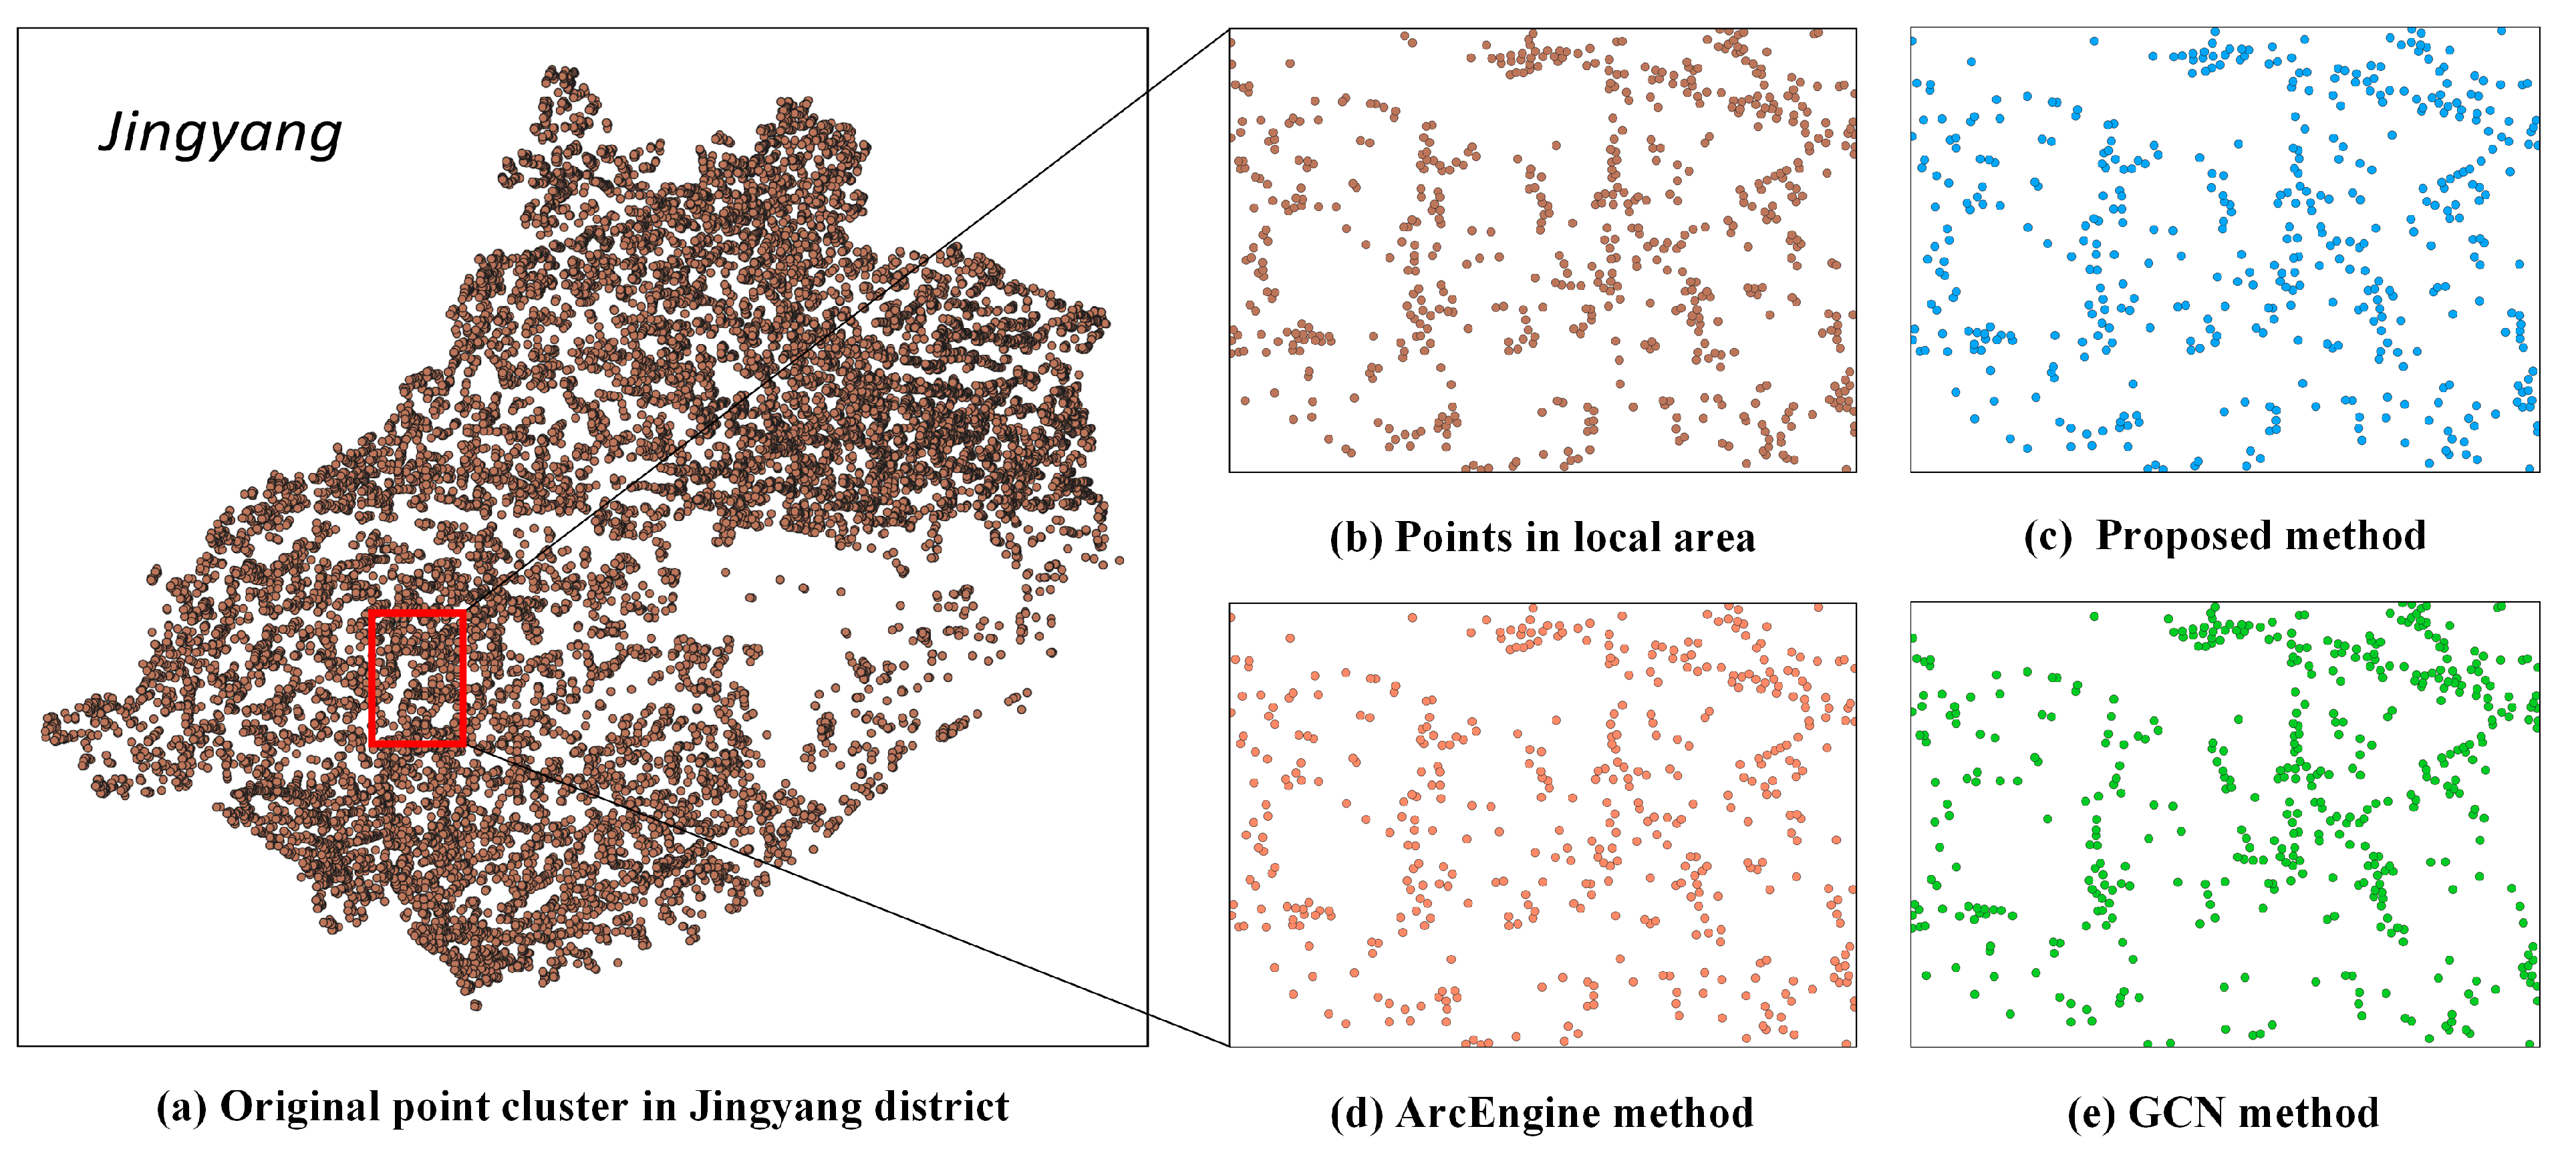
Three datasets of point clusters are employed as experimental data. The first two point clusters were abstracted from singular dwelling buildings in Luojiang and Jingyang districts of Sichuan Province (
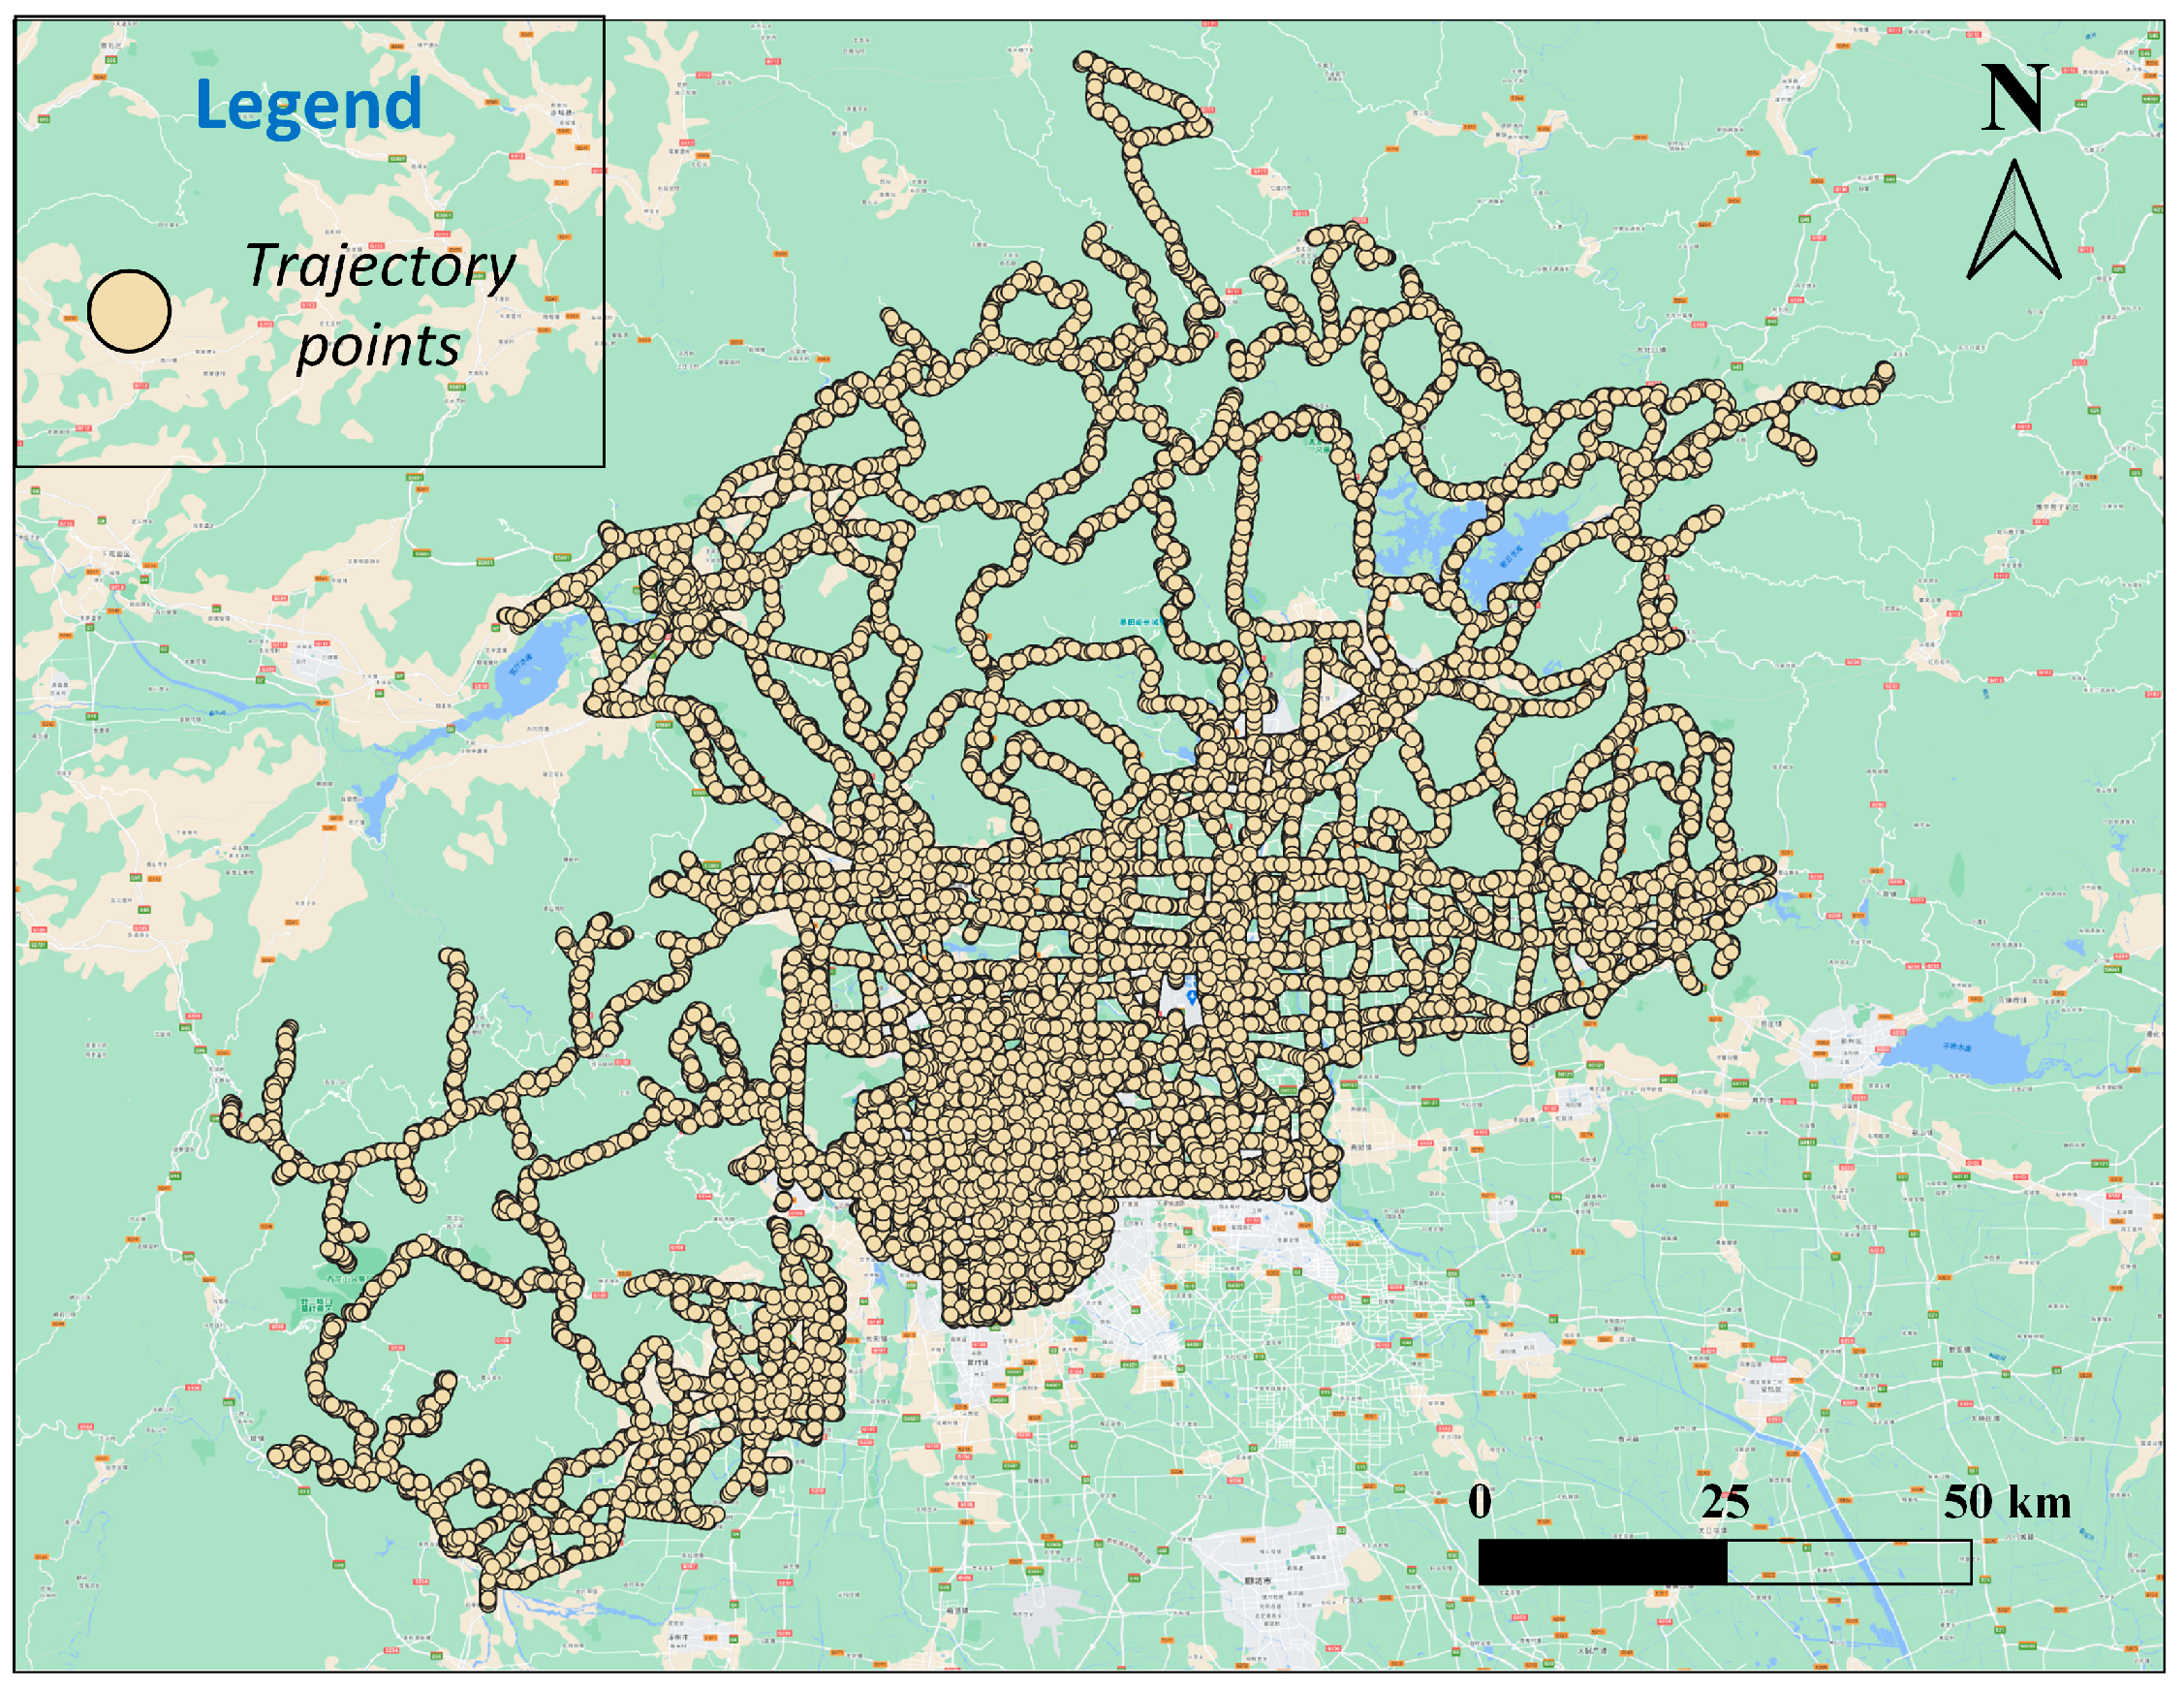
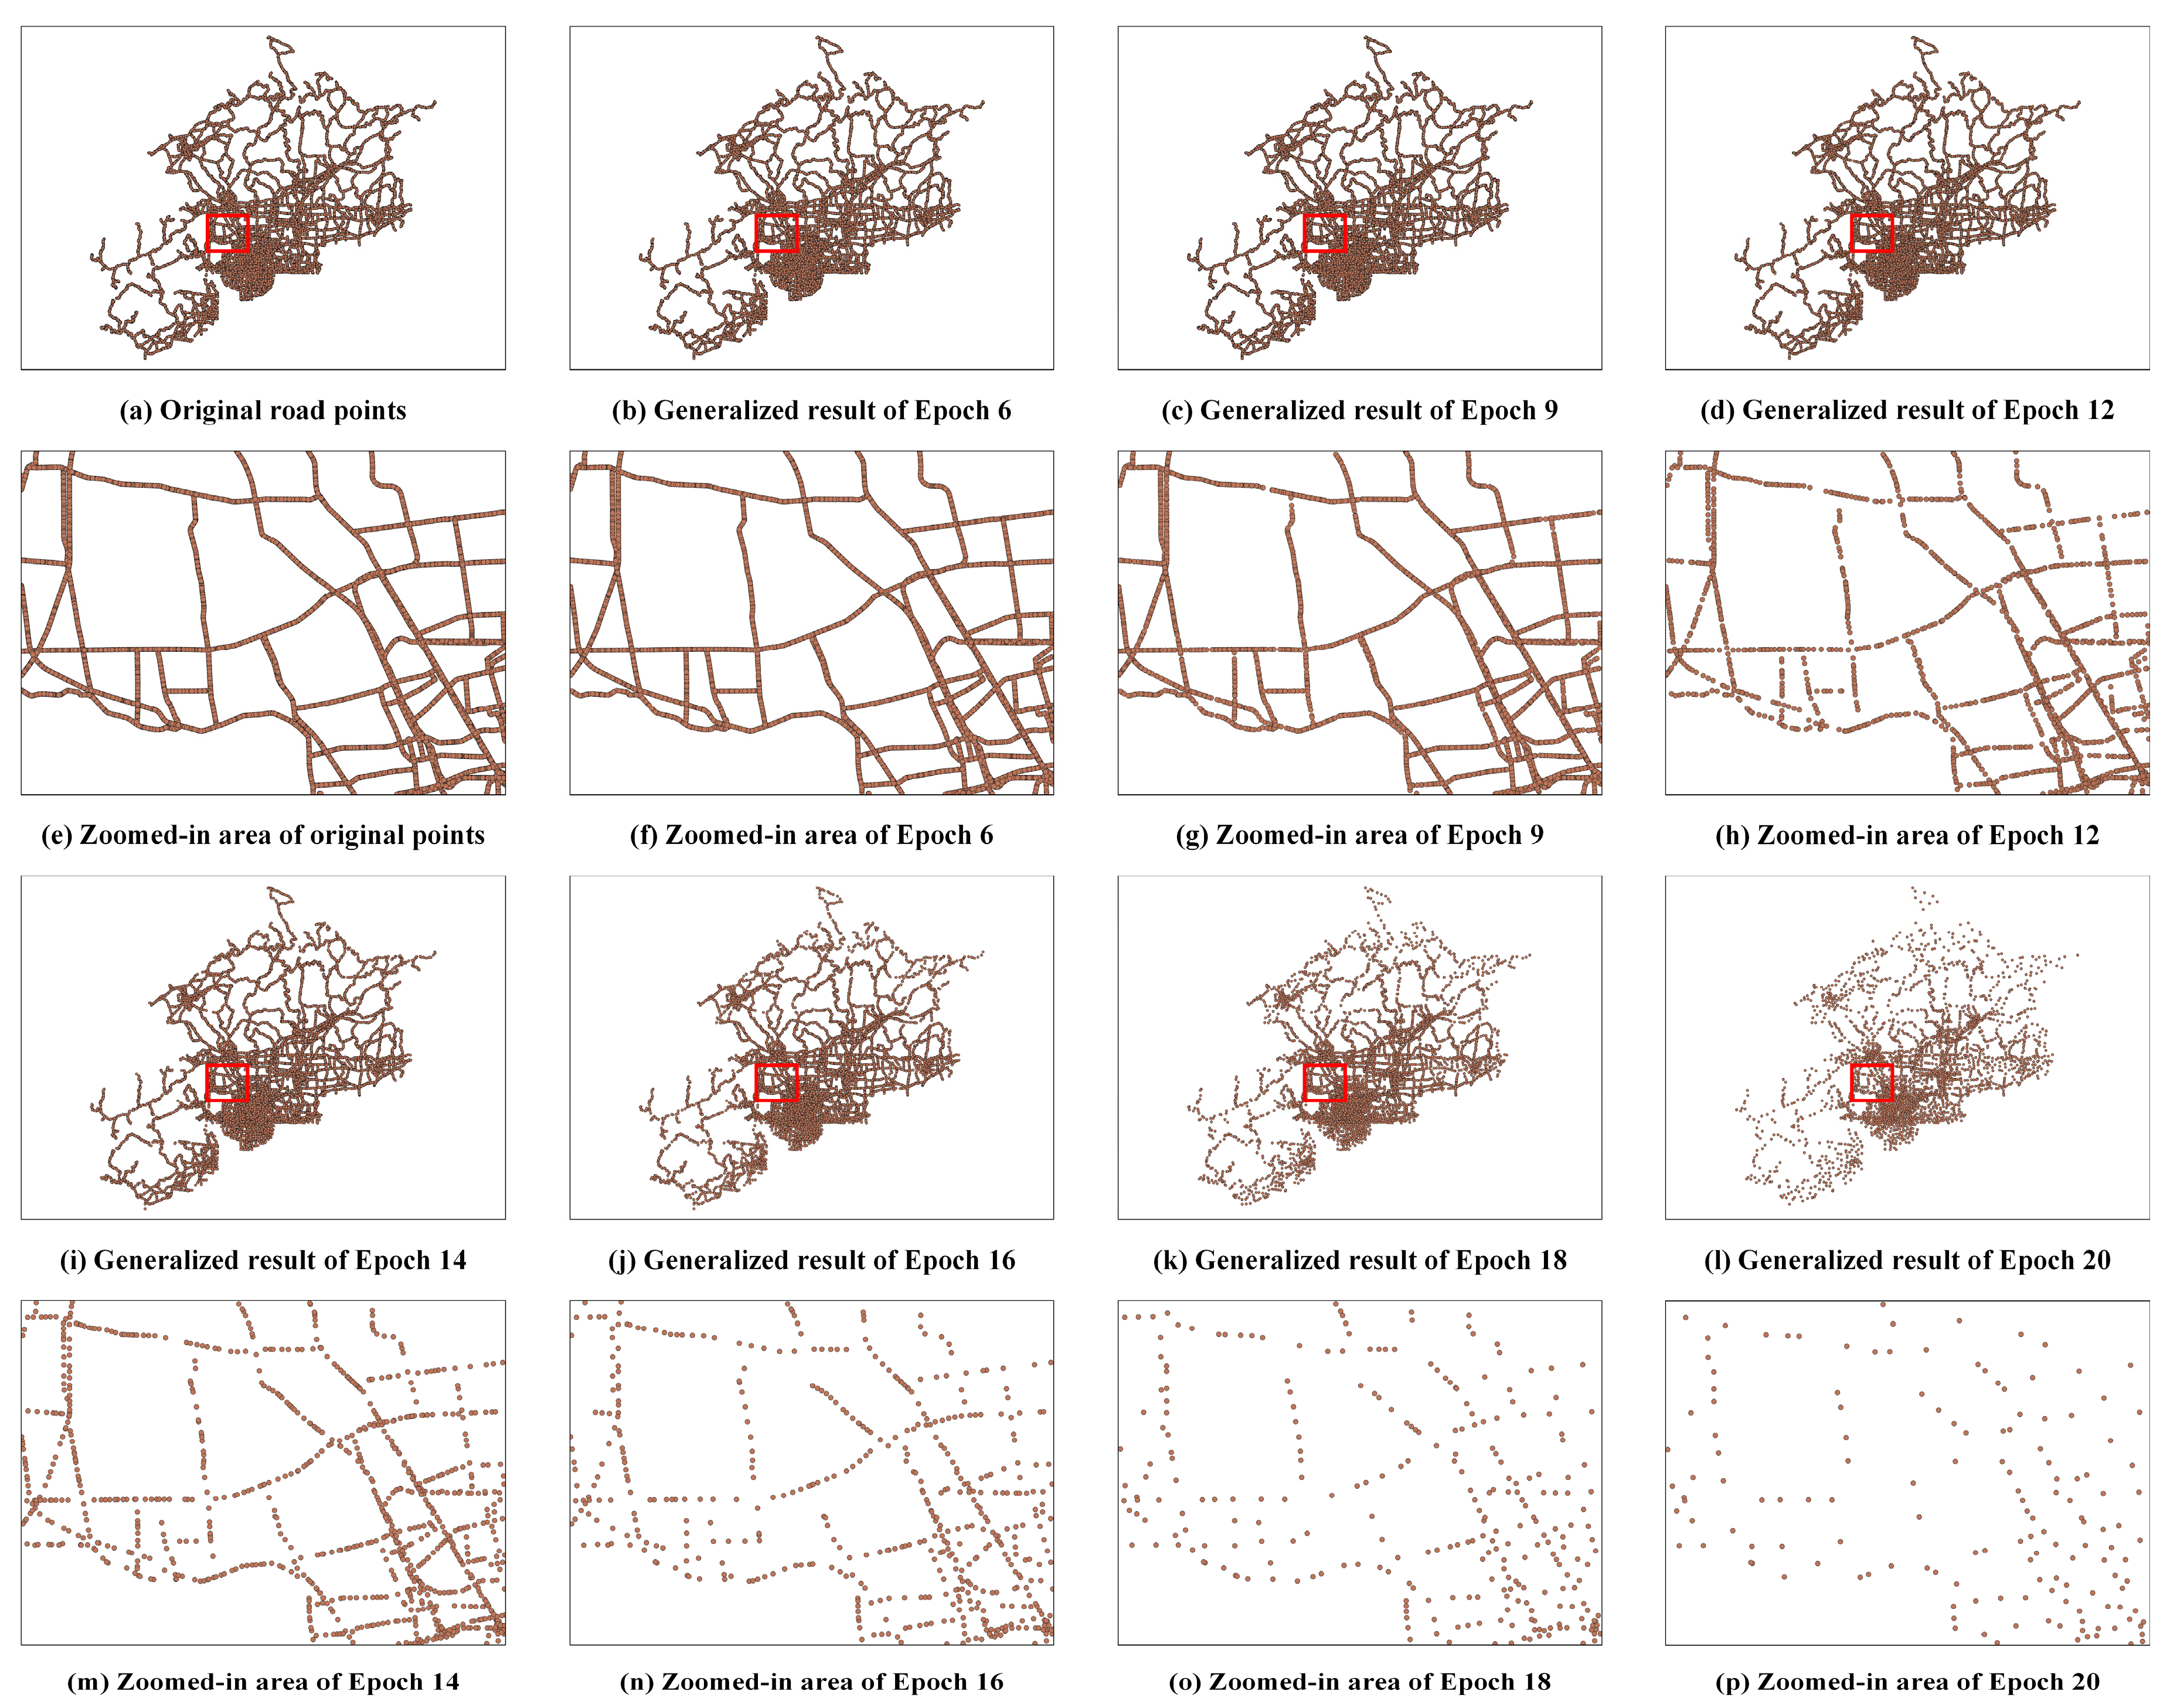
Figure 5), encompassing 16,028 and 16,466 points, respectively. The third point cluster consists of trajectory points from the urban area of Beijing (
Figure 6), totaling 1,045,236 points. Abstracted dwelling building datasets are one of the most classical types of point cluster data, and the experimental data selected are appropriate for map generalization studies in terms of both data volume and distribution. Meanwhile, the trajectory point dataset contains a massive amount of data, and its generalization can effectively validate the computational efficiency of the proposed algorithm.
4.1.2. Comparing Methods
To assess the computational efficiency of our approach, we employ state-of-the-art machine learning techniques, specifically Graph Convolutional Networks (GCN) and the ArcEngine software (Version 10.2), for comparative analysis. The reason for selecting these two algorithms as comparison methods is that they generally perform well in generalization results and are usually superior to other generalization methods. The specifics of these comparison methods are as follows:
Machine Learning [
12]: This method is essentially a data-driven approach based on Graph Convolutional Networks (GCN), which uncovers the implicit rules of point cluster generalization by learning from data samples at two different map scales. The machine learning approach first converts the point clusters into a graph structure, where each point corresponds to a graph node and the edges are defined based on the Delaunay triangles connecting the points. The algorithm extracts various features of the points and inputs them into the constructed graph neural network model for training. The generalization results achieved by this method perform well in most aspects.
ArcEngine: The ArcEngine-based method is primarily implemented by constructing a Voronoi diagram for the point clusters. The algorithm builds the Voronoi diagram structure for the point clusters on the basis of the Delaunay triangulation, and then uses the area of the Voronoi cells as a control parameter to progressively delete and simplify the point clusters. This method is considered a classic selection algorithm.
Both of these algorithms are excellent solutions in the field of point cluster generalization research, and compared to earlier generalization algorithms, they can handle slightly larger-volume point cluster data (in the order of tens of thousands). Comparing the selection algorithm proposed in this study with these two outstanding methods provides a more intuitive demonstration of the efficiency advantages of our algorithm.
4.2. Efficiency Comparison
The driving force behind this study is achieving high efficiency. To substantiate this claim, we conducted comparisons between our method and other approaches, documenting the time consumed for each epoch, as presented in
Table 1,
Table 2 and
Table 3. The time consumed for a single epoch is measured after processing all points, whether selected or unselected. Notably, since the Graph Convolutional Network (GCN) method relies on supervised learning with samples of selection results for each epoch individually, we specifically conducted an experiment for the first epoch (denoted as ‘Epoch 1’) and recorded its corresponding time consumption.
As illustrated in
Table 1 and
Table 2, the time consumed by our proposed method and the ArcEngine method gradually decreased in tandem with a reduction in the number of point clusters in Jingyang and Luojiang districts. Notably, the high efficiency of our proposed method is evident in every epoch within these two cases. For instance, during the 1st epoch in Jingyang district, our proposed method required only 0.283 s, a significant improvement over the 157.701 s needed by the ArcEngine method. This advantage of our method can also be reflective of the scenario of the decreased data volume. Although the GCN method only incurs time consumption for a single epoch, the training and predicting time of 35.448 s and 2.753 s, respectively, are significantly higher than the time consumed by our method.
In contrast to the results obtained with ten-thousand-point clusters, the time consumption of our method increases when processing millions of trajectory points. Nevertheless, it remains lower than the processing times observed with the ArcEngine and GCN methods when handling ten thousand building points. Furthermore, both the ArcEngine and GCN methods prove ineffective in processing millions of trajectory points. This outcome underscores the significant efficiency advantage of our proposed method over other approaches.
4.3. Visualization of Selection Result
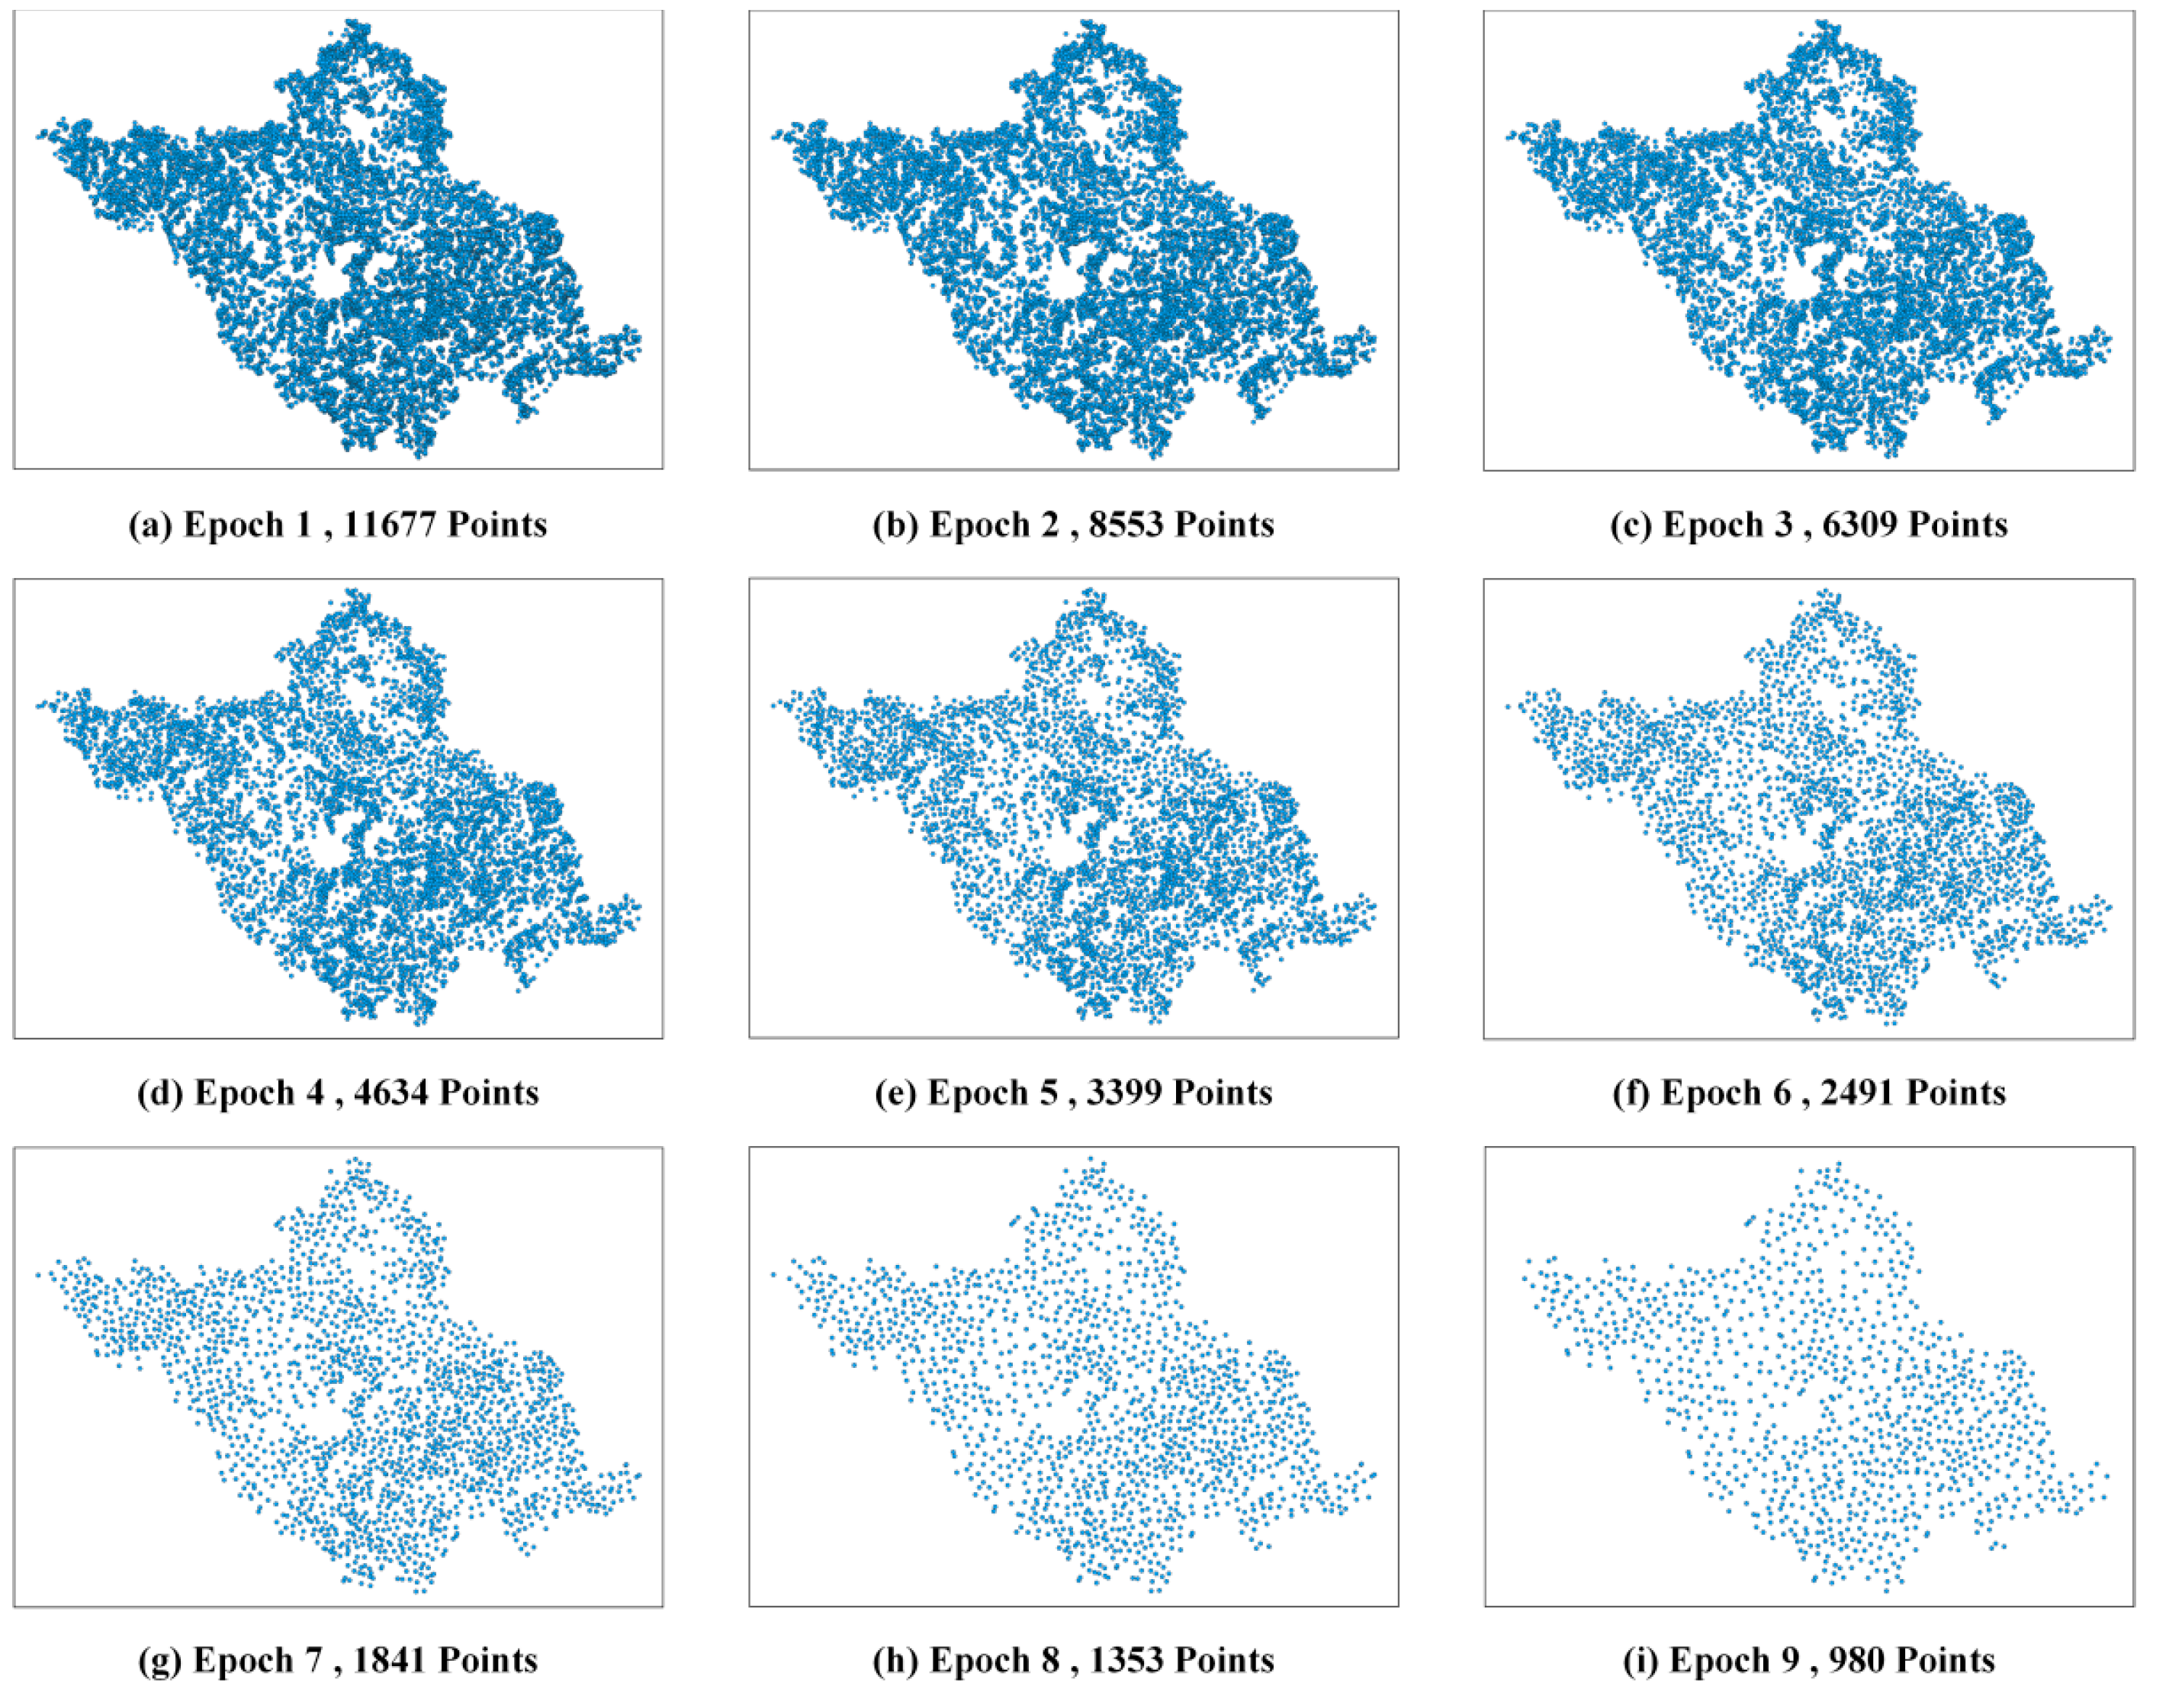
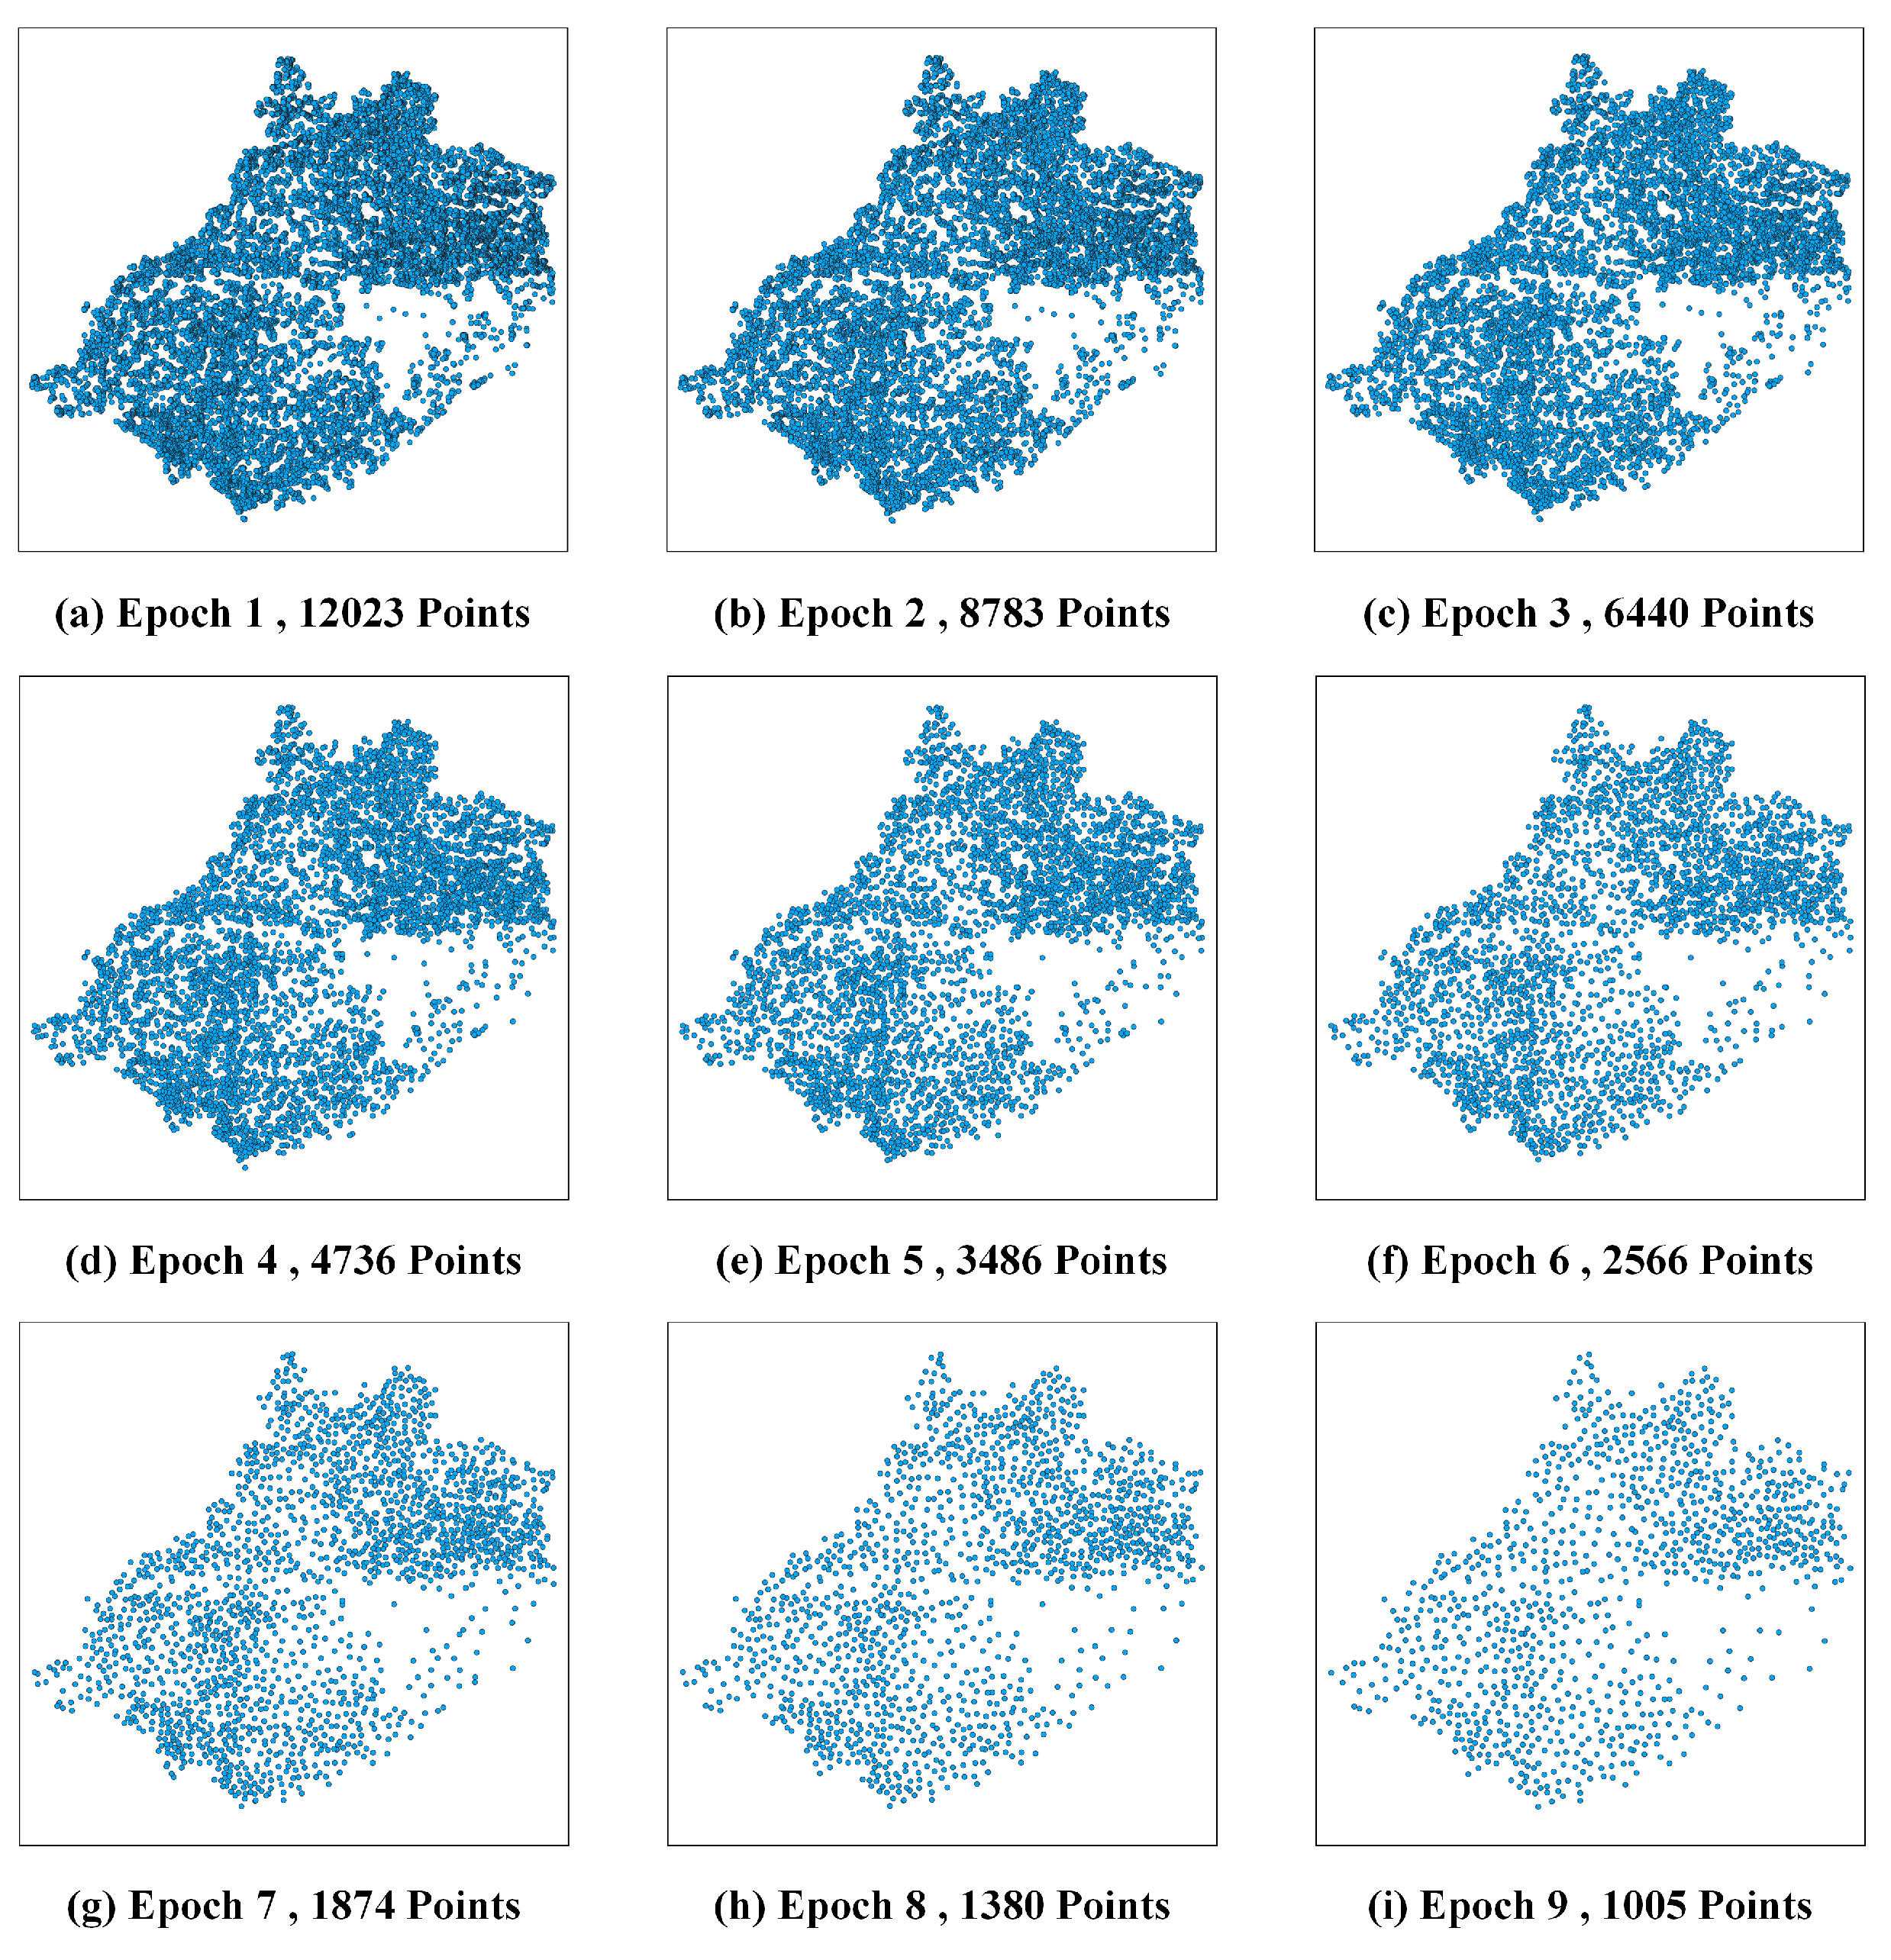
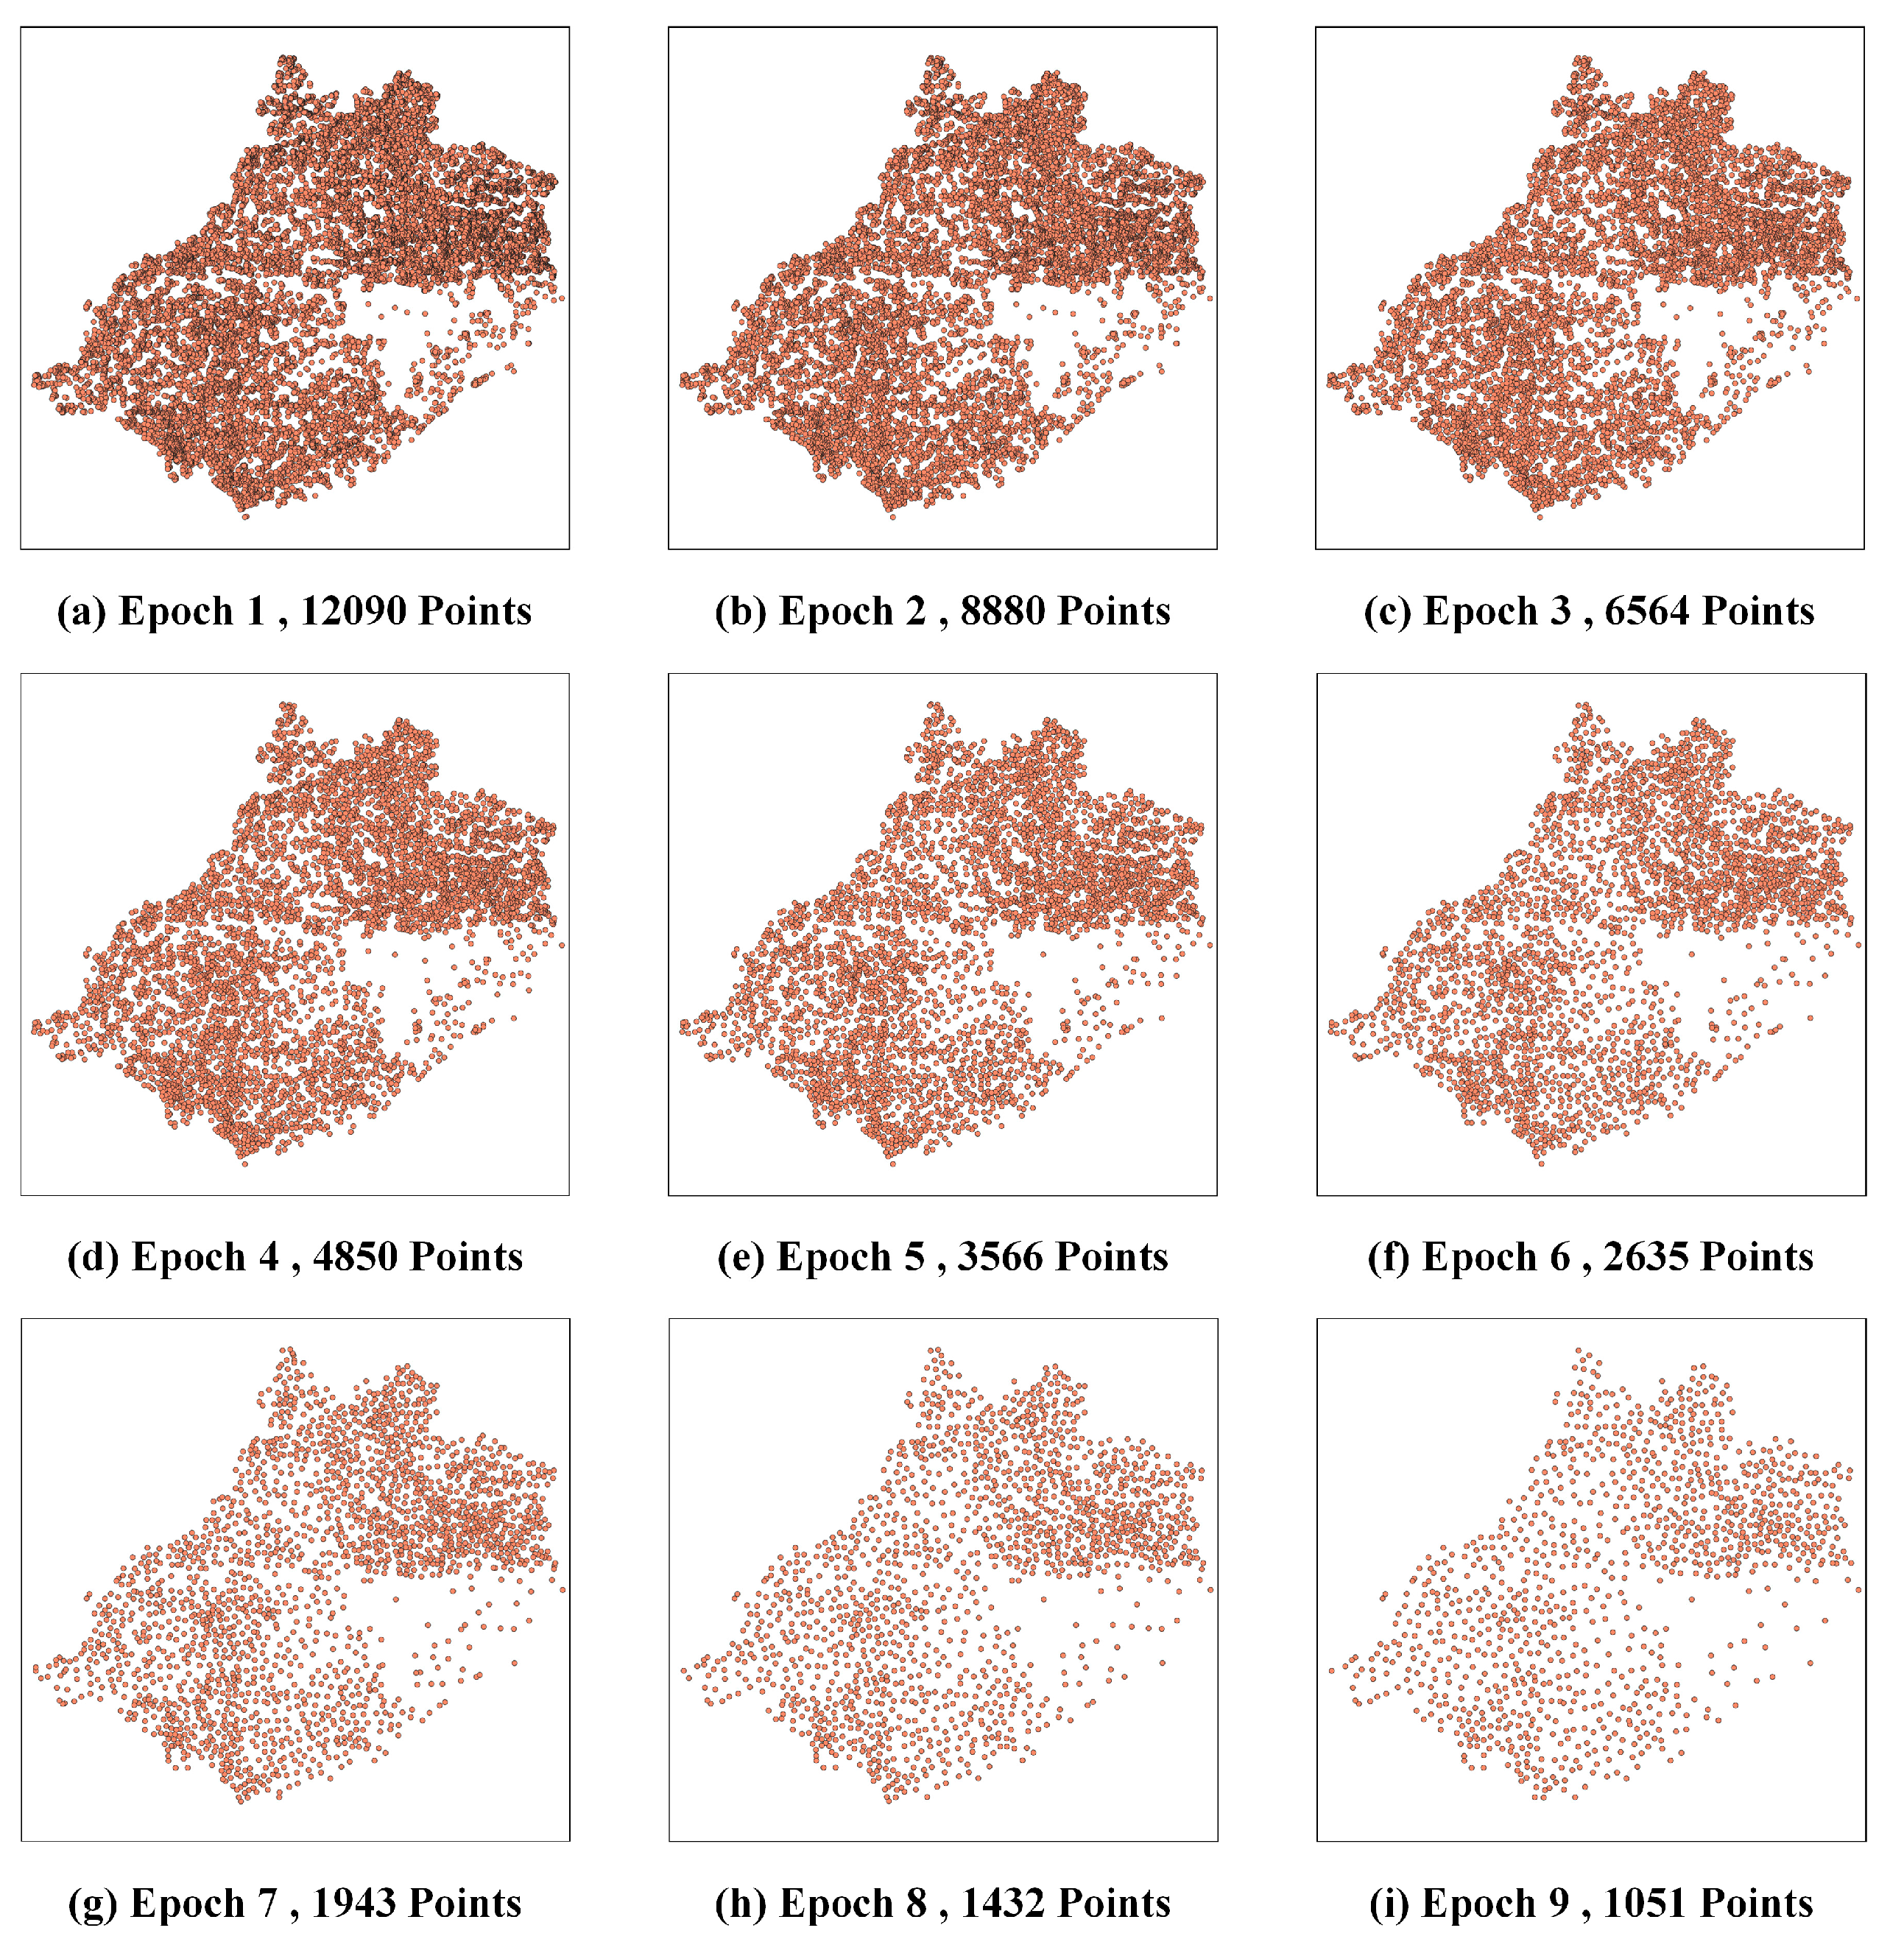
As depicted in the results of multiple epochs within the Luojiang district (
Figure 7 and
Figure 8) and the Jingyang district (
Figure 9 and
Figure 10), our proposed method consistently preserves both the identical number and spatial distribution of points when compared to the ArcEngine method. For instance, in the Luojiang district during the 9th epoch (
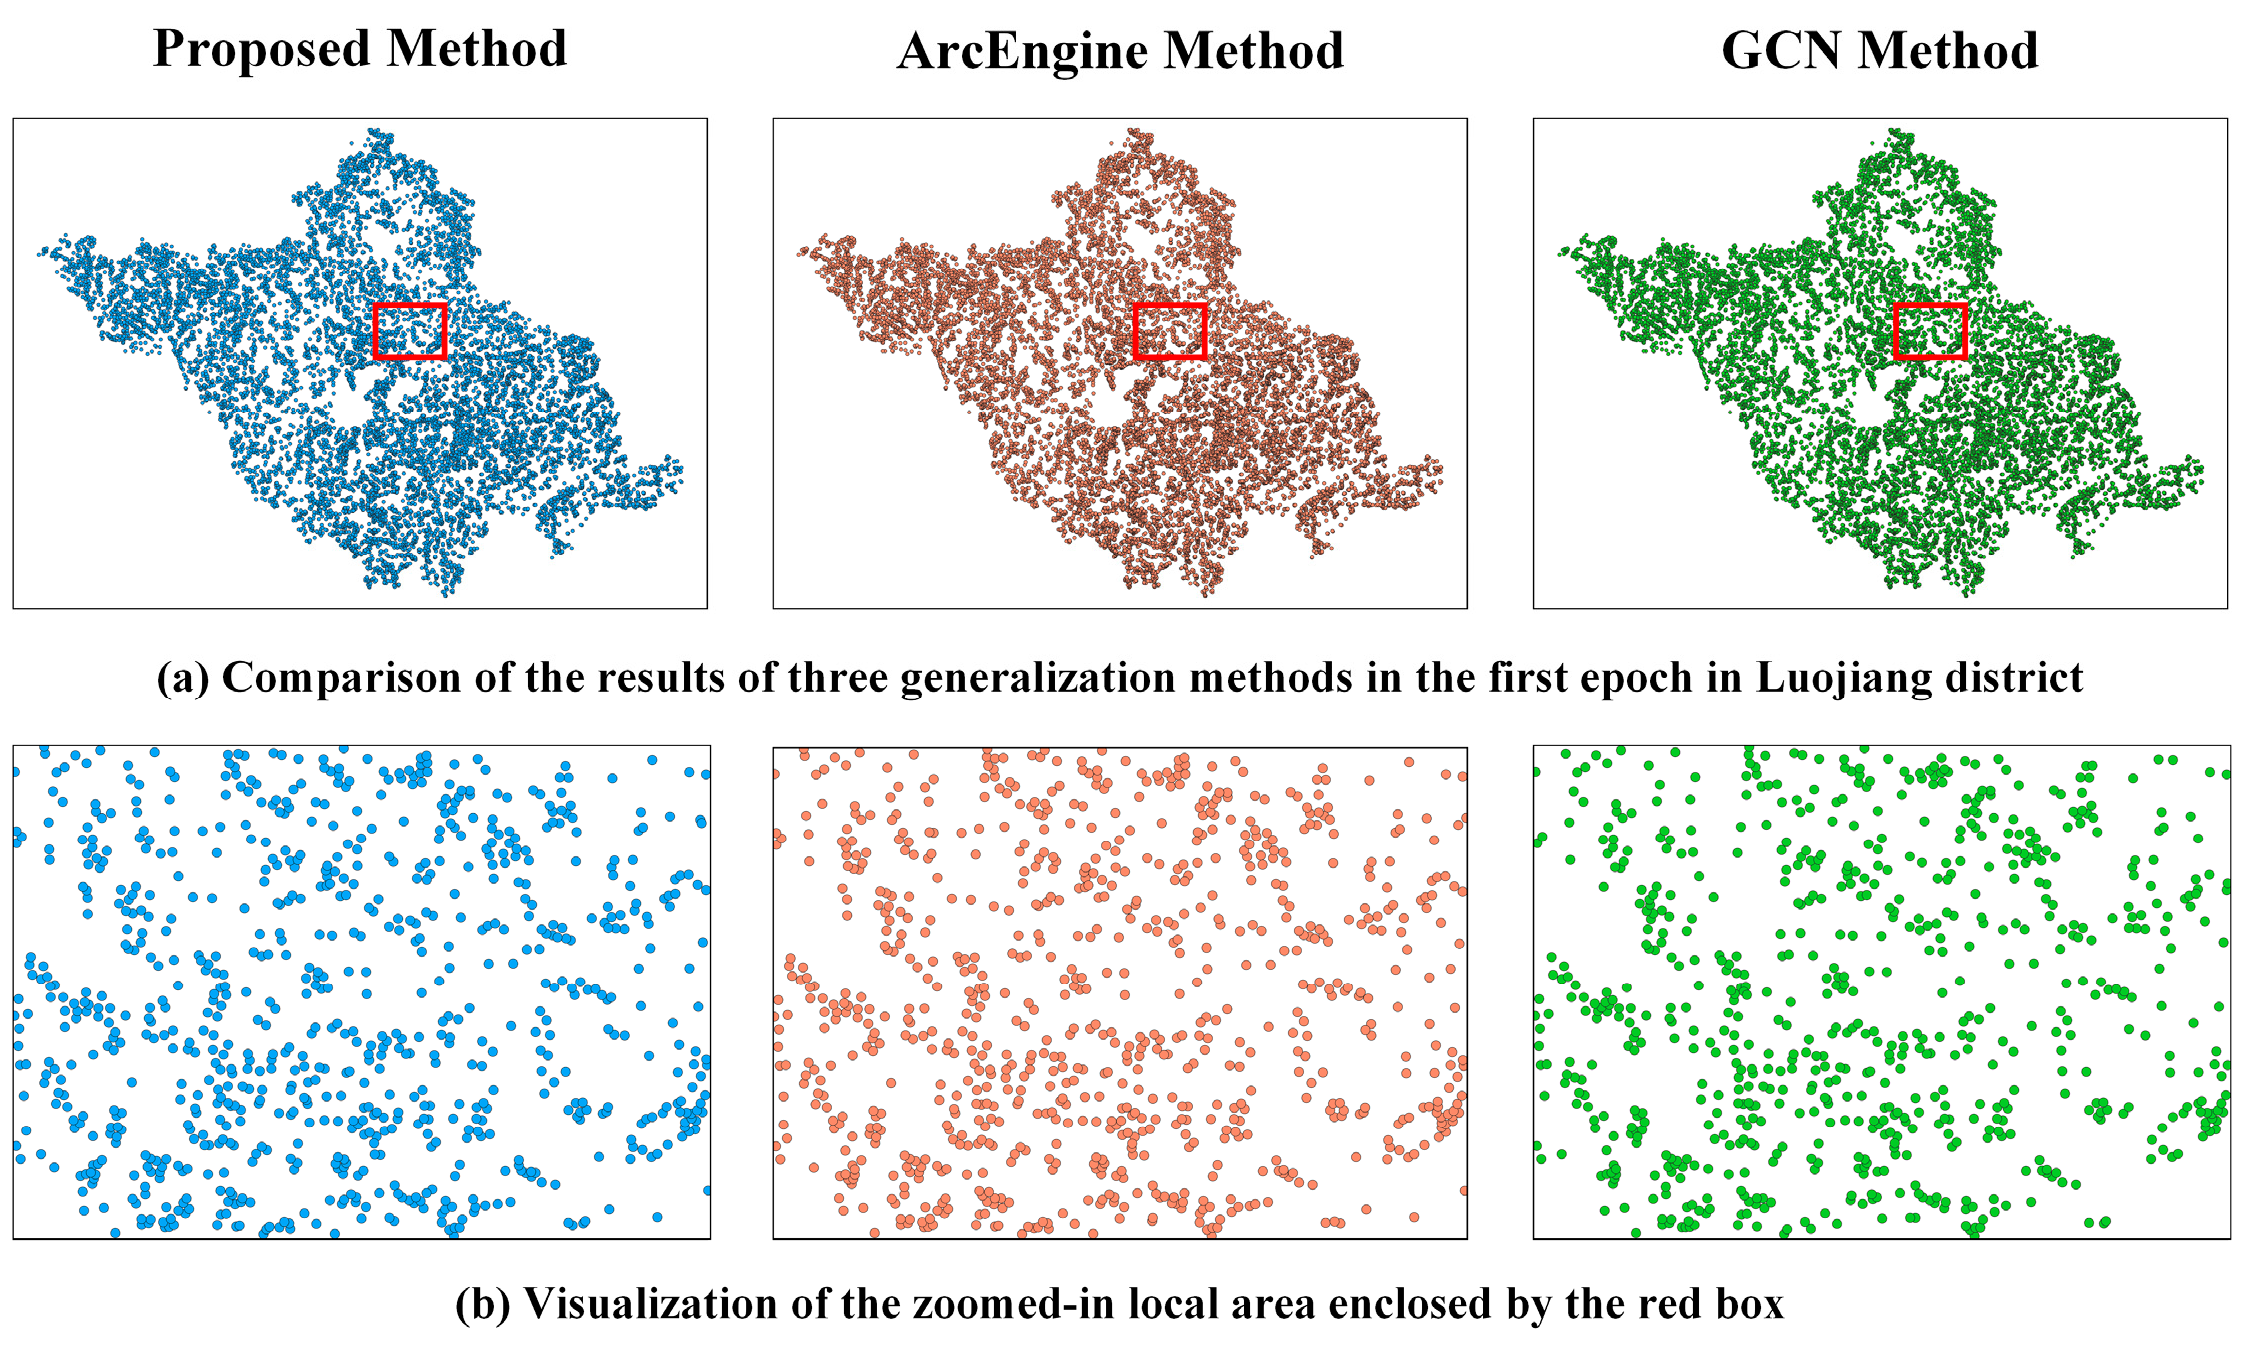
Figure 7), our method selected 980 points, closely approximating 1023 points chosen by the ArcEngine method. Additionally, the spatial distribution of the selected points in both methods closely mirrors that of the original point clusters. Furthermore, this pattern is evident not only in the 9th epoch but also observed when comparing the 1st epoch results among our proposed method, the ArcEngine method, and the GCN method (
Figure 11,
Figure 12,
Figure 13 and
Figure 14).
From a local perspective (
Figure 13 and
Figure 14), the local structure of the points generalized by our proposed method closely aligns with that of other methods and the original structure before selection. In summary, our method consistently achieves satisfactory results in point cluster selection, comparable to other methods, as evidenced by spatial visualization. This is further demonstrated in the selection of millions of points, as illustrated in
Figure 15.
4.4. Evaluation of Selection Result
Using dot density maps to visually assess the results of point cluster selection is a commonly employed method. Dot density maps assign gray values based on the point density in proximity to each pixel, thereby converting point clusters into images that accurately depict their overall visual representation. Dot density maps can be generated using ArcToolbox in ArcGIS. Additionally, the Structural Similarity Index (SSIM), introduced by [
37], serves as a crucial quantitative metric for evaluating the similarity between two dot density maps. Hence, in this study, we employ a dot density map and the SSIM metric to assess the selection results of point clusters; the SSIM value for each epoch is used to quantify the similarity between the original point cluster and the selected point cluster during that specific epoch.
During the generalization process, although the number of points is gradually decreasing, the dot density maps produced by our proposed method consistently maintain a similar spatial density distribution in each simplification epoch. This pattern is also observed in the ArcEngine method. From a quantitative standpoint (
Table 4), the SSIM gradually decreases in tandem with the strength of generalization. Notably, the SSIM values of our proposed method closely align with those of the ArcEngine method and, in multiple epochs, even surpass them. This outcome underscores that our proposed method can deliver satisfactory performance from a quantitative perspective.
During the generalization process, although the number of points is gradually decreasing, the dot density maps produced by our proposed method consistently maintain a similar spatial density distribution in each simplification epoch.
4.5. Discussion
Our proposed method stands out primarily for its remarkable efficiency in handling point clusters at scales ranging from tens of thousands to even millions. Unlike traditional methods designed for smaller clusters, where efficiency concerns are often overlooked, our approach excels in processing large-volume data. Noteworthy traditional methods, such as convex hull merging [
18], genetic algorithms [
31], Circle feature transformation [
27], and Kohonen networks [
23], grapple with efficiency challenges due to complex or iterative operations.
For example, the convex hull merging method incurs a significant time cost when constructing convex hulls for each layer of points, and the algorithm essentially relies on the generalization of polyline features, an approach that easily overlooks the neighbor relationships between adjacent points within convex hulls at various levels. The genetic algorithm involves a binary iterative process and exhibits high time complexity during execution, resulting in poor computational efficiency. The Circle feature transformation algorithm is highly dependent on various subjectively set parameters such as cluster threshold and circle radius. The setting of threshold parameters is easily influenced by the cartographer’s subjective judgment, making it challenging to handle point clusters with large data volumes. Kohonen networks and GCN methods belong to supervised learning approaches and rely on high-quality samples obtained through repeated experiments and precise hyperparameter settings. The labeling of sample data and the extraction of point feature characteristics incur significant time costs, thereby affecting the simplification efficiency. Additionally, the ArcEngine method requires excessive time to construct the Voronoi diagram by connecting the centers of triangles, which further increases the algorithm’s complexity and overall time consumption.
In contrast, our proposed method only requires constructing the Delaunay triangulation, the fundamental operator of traditional methods, without any subsequent operators (e.g., iterative training or subjective hyperparameter setting) that entail high time costs. Consequently, our method achieves remarkable efficiency in processing point clusters at scales of tens of thousands and even millions.
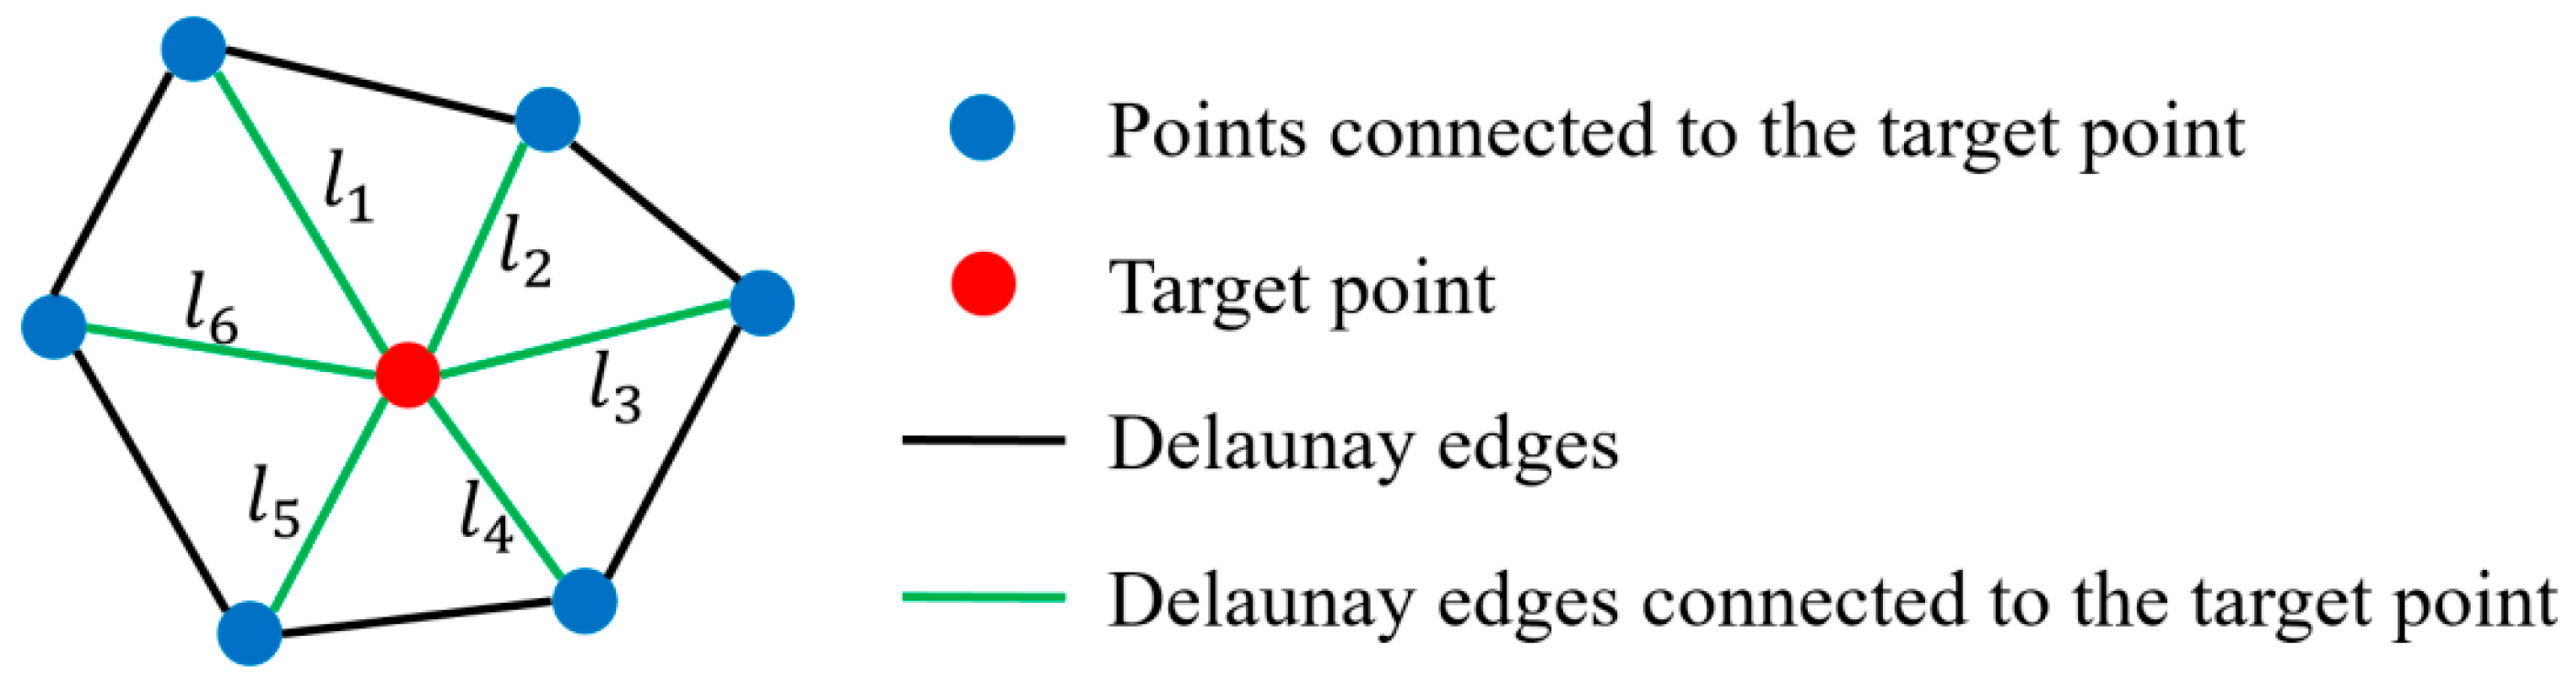
Beyond its efficiency, our method demonstrates exceptional performance. By calculating the mean distance of each point and introducing the concept of a “fixed point”, inspired by [
20], it effectively highlights local structures between adjacent points. These simple yet powerful operators contribute to the robustness of our method, enabling it to process numerous point clusters with ease, even at high volumes.
5. Conclusions
In this study, we introduced a point cluster generalization method based on the Delaunay triangulation that is applicable to clusters ranging from tens of thousands to millions or more points. In the algorithm, we first construct the Delaunay triangulation for the point cluster and extract the inner points within the convex hull structure. Next, we design the mean distance of Delaunay edges for each point as an indicator to quantify the importance of each point within the cluster. Finally, we adopt the concept of “fixed points” by sorting the points during the algorithm’s execution and fixing the neighbors of the points targeted for deletion. This prevents local areas within the point cluster from being over-generalized during the selection process. We also provide a detailed explanation of the evaluation procedure for this method and validate its computational efficiency through comparative experiments. Experimental results on large-volume point clusters show that our method not only achieves visual and performance results comparable to those of the ArcEngine and GCN methods but also offers significantly higher computational efficiency. This indicates that our method can efficiently produce a simplified result for large-volume point clusters with minimal time consumption, which is a feature always overlooked by traditional generalization methods. As the scale and volume of map data continue to expand, the demand for efficient map generalization algorithms increases, and the proposed algorithm enables multiscale visualization of large-volume data on publicly available geographic viewers. Therefore, the improvements in algorithm efficiency and practicality underscore the significance of our proposed point cluster selection method.
Meanwhile, our proposed algorithm has certain limitations in terms of point quantity control and the integration of semantic information, both of which require further improvement in future research. First, regarding point quantity control, our method employs the concept of “fixed points”, with a selection epoch terminating only when all points are marked as fixed. However, this termination criterion is not scale-specific. To produce a generalized result for a specific scale, the number of points remaining after selection should serve as a reference threshold. This is achieved through the radical law based on the target scale. In a given epoch, the final result should be determined by choosing the candidate whose number of selected points is closest to the target scale. Second, our method does not take semantic information into account. In practical applications, point features such as landmark buildings and government institutions inherently contain important semantic information, making them less likely to be deleted during map generalization. For example, when simplifying scattered settlements, it is necessary to consider differences in the geographical significance of settlements, such as administrative levels and the distribution of relevant road networks. In future research, semantic information could be translated into weights and incorporated into the calculation of mean distances, thereby promoting the integration of geometric and semantic information.


