Article

Quantifying Administrative and Functional Border Effects on Commuting and Non-Commuting Flows: A Case Study of the Shanghai-Suzhou-Jiaxing Area

School of Architecture, Southeast University, Nanjing 210096, China
*
Author to whom correspondence should be addressed.
ISPRS Int. J. Geo-Inf. 2025, 14(3), 133; https://doi.org/10.3390/ijgi14030133
Submission received: 12 February 2025 / Accepted: 18 March 2025 / Published: 20 March 2025

Abstract

:
As cities continuously expand and with the advancement of regional integration, the flows of people, goods, and information have spread beyond their original administrative borders. The top-down administrative borders and bottom-up functional borders divide city regions into areas with different attributes and hierarchical structures. Although existing studies have quantified border effects from the perspective of spatial interaction, these have not clarified the differentiated effects between administrative and functional borders on different flows of activities. Without considering the original administrative borders, this study first proposed a fine-grained spatial unit clustering method based on spatial interaction networks of commuting and non-commuting flows to delineate functional borders. Then, the administrative and functional border effects are evaluated through the gravity model, revealing their influence on travel flows of the city region. This study takes the case study of a mega-city region, the Shanghai-Suzhou-Jiaxing (SSJ) area in China, using mobile phone data. The results indicate that the commuting and non-commuting networks in the SSJ area exhibit a cross-border polycentric hierarchical spatial structure. Both administrative and functional borders have significant effects on spatial interactions, but compared to commuting flows, non-commuting flows are more sensitive with functional borders. Provincial borders exert the most prominent positive effect and exhibit spatial heterogeneity. Meanwhile, the results of border effects might be utilized by policymakers to focus more on promoting the spatial integration of cross-border regions within the SSJ area.

1. Introduction

Since the 1990s, with the advancement of regional integration and the continuous improvement of transportation infrastructure, the cross-regional flows of people, business, goods, and information has led to a reconsideration of geographical borders and their effects. Traditionally, scholars predominantly focused on top-down administrative borders which had gained significant attention due to trade barriers and market fragmentation, suggesting that these administrative borders had significantly negative effects on regional trade [1,2,3,4]. As cross-border socio-economic interdependencies and regional cooperation increased, scholars began to argue that borders also provided opportunities for negotiation and innovation, thus indicating positive effects [5,6]. Due to the limitations of administrative borders in delineating the true dynamics of spatial interactions, scholars have looked for alternative geographical borders, leading to the prominence of bottom-up functional borders [7,8]. Functional borders represent the true scope of a region’s labor force and economic activity, being internally coherent and externally self-contained in terms of spatial interactions. Within these areas, most flows contain both their origins and destinations internally, with only a minority crossing the border [9,10]. Thus, from the perspective of border effects, functional borders exhibit a negative effect on flows.
Recently, scholars have begun to explore the combined effects of administrative and functional borders on spatial interactions, focusing on their obstructive effects in overlapping situations [11,12]. However, previous studies have demonstrated that functional borders are often inconsistent with administrative borders [13,14,15]. According to border effect theory, borders can either weaken or strengthen interactions between regions [4,16]. This suggests that the effect of administrative and functional borders on spatial interactions may not always align. Therefore, it is necessary to construct an integrated measurement model of administrative and functional borders to investigate the heterogeneous effects of borders on spatial interactions within city regions.
The flow of humans has long been a focus of scholarly attention and is considered a crucial indicator for defining functional borders and assessing border effects. Existing studies often utilize commuting flows to measure spatial interaction patterns within cities or regions [13,17,18]. However, commuting only represents approximately 1/3 of all human activities [19], while a large number of non-commuting movements also reflect socio-economic connection. Moreover, with the development of transportation infrastructure, residents’ travel behavior is no longer solely driven by survival needs or constrained by geographic distances, leading to increasingly complex, diverse, and personalized travel and activity behaviors [15,20]. Meanwhile, scholars have observed that different types of activity flows, such as commuting, shopping, and leisure, contribute to the formation of heterogeneous spatial structures of city region: a region may appear integrated when analyzed through the spatial interactions of one activity, yet seem loosely connected when examined from the perspective of another [21,22,23]. In this context, the incorporation of commuting and non-commuting flows enables a deeper and more comprehensive understanding of how various borders influence spatial interactions within city regions. This approach not only fills a gap in existing research on border effects but also offers valuable guidance for developing more targeted strategies in spatial planning and governance to achieve cross-border integration.
The human mobility data provides an opportunity for a breakthrough for delineating functional borders and measuring the border effects of city regions. Unlike traditional survey data, which are individually collected by local authorities, new forms of mobility data (e.g., social media and mobile phone data) allow for the analysis of large population and finer-grained networks that transcend multi-level administrative borders [17]. In addition, location and time information from mobility data can be used to identify the attributes of people’s stops, such as home, work, or visit, and to further classify travel behaviors [20], allowing the construction of spatial interaction networks based on commuting and non-commuting activities.
To address the abovementioned research gaps, this paper proposes three specific research questions: (1) What is the spatial relationship between functional borders and administrative borders? (2) How do administrative and functional borders affect people flows, respectively? and (3) What are the similarities and differences in the border effects on commuting and non-commuting flows? To answer these questions, this study proposed an analytical framework that explores administrative and functional border effects from a multi-activity perspective using mobile phone data and complex network analysis methods. Access was provided to commuting and non-commuting flow data from a selected month by China Unicom in 2023. A representative mega-city region, the Shanghai-Suzhou-Jiaxing (SSJ) area was selected as the study area. First, we aggregated spatially contiguous urban units into separate urban clusters and delineated functional urban communities (FUC) by community detection on the spatial interaction networks of commuting and non-commuting flows. Meanwhile, the PageRank method was used to examine the characteristics of these FUCs. Second, the gravity model was developed to quantify administrative and functional borders effects based on the types and ranks of these borders. Finally, this study provides a thorough scientific understanding of the geographic borders within a city region, offering valuable insights to guide spatial governance and planning.
The structure of this article is outlined as follows: Section 2 reviews the previous literature in this field. Section 3 describes the study area and datasets used in the research, along with a comprehensive explanation of the methods used. Section 4 presents a case study conducted in the SSJ area of China. Drawing from the case study results, Section 5 discusses the key findings and policy implications of the study. Finally, Section 6 summarizes the study and suggests pathways for future research.

2. Literature Review

2.1. Delineation of Functional Borders Through Human Flow Data

Advances in information and communication technologies have enabled the collection of human flow data from diverse sources such as public transportation systems, social media and mobile phones. These datasets offer valuable insights into human spatiotemporal behaviors in a non-intrusive, continuous manner [24]. In recent years, researchers have utilized these data to construct spatial interaction networks based on different spatial units and to delineate functional borders with various clustering principles (Table 1).
Previous studies directly aggregate human flow data among all spatial units, using clustering methods such as community detection algorithms to delineate FUCs [12,25,28,29]. To depict a more stable and regularized regional spatial structure, researchers have identified the home, work, and other places by identifying the length, duration and frequency of stay and visit, which in turn categorizes each user’s travel into a specific type of activity (e.g., commuting activity). Then, each type of travel flow is aggregated to delineate FUCs of specific activities [17,18,27]. Moreover, it has been found that travel flows of different activities [15] and people [13] have different spatial structures and distributions of FUCs.
It has been shown that scale differences in spatial units may lead to different relationships between functional borders and administrative borders. For example, Zhang et al. [17] constructed a spatial interaction network in the Shenzhen-Dongguan-Huizhou area of China to delineate the border of FUCs. The findings indicated a strong alignment between functional borders and administrative borders. Similar conclusions were reached by Liu et al. [28] for the Beijing-Tianjin-Hebei region based on mobile phone data. However, Yin et al. [7] found the emergence of urban functional communities across administrative borders based on Twitter data and 1 km × 1 km grids. Yu et al. [29] constructed a spatial interaction network of the Pearl River Delta (PRD) urban agglomeration based on mobile phone data and Voronoi polygons, and found that functional communities across administrative borders emerged on the scale of district/county level.
Overall, research on the delineation of functional borders and comparative analysis with administrative borders has attracted considerable interest in recent years. However, there is a lack of comparative analyses of functional borders and administrative borders of city regions based on fine spatial units. This may lead to the neglect of FUCs across administrative borders at the scale of district/county level [30]. Furthermore, most of the existing literature focuses on the analysis of commuting activities, and the functional borders of other types of activities are rarely considered, even though these activities do not have the same spatial structure [15]. Therefore, this study chooses to construct a finer-grained spatial interaction network based on mobile phone data to delineate FUCs through commuting and non-commuting activities, and to analyze them in relation to administrative borders.

2.2. Effect of Spatial Interaction: Administrative and Functional Borders

The term “border effect” is used to describe the impact of geospatial border in influencing spatial interactions on both sides. The initial focus of research on border effects was on administrative borders. The study of administrative border effect can be traced back to the 1990s, when the advent of cross-border trade and regional integration among developed countries prompted a surge of research into the macro-level constraints imposed by national borders on trade [1,2,3,4]. McCallum [4] firstly introduced the border effect to analyze cross-border trade between American and Canada which is regarded as one of the six major puzzles in international macroeconomics. As regional integration has become increasingly multidimensional, research on border effects has expanded beyond trade networks to encompass other networks, including those of knowledge dissemination [31], corporate collaboration [32], and human flow [33]. Along with deepening regional integration and state-rescaling, megacities, metropolitan areas, and global city regions have become the basic spatial units of global competition, and cross-border development has thus taken a turn towards micro-regionalism, from the supranational down to the subnational level. Western scholars have primarily examined the effects of national borders within cross-border metropolitan regions [6,34], whereas Chinese scholars have studied the effects of provincial and municipal borders in metropolitan areas such as the Yangtze River Delta and Beijing-Tianjin-Hebei region [35,36,37]. Being barriers, borders have been conceived of as bridges or interfaces. Thus, the phenomenon of a cross-border region raises the questions of the changing role and significance of high-level administrative borders (e.g., national borders and provincial borders) [5,6].
Unlike top-down delineated administrative borders, functional borders are an emergent outcome of spatial interactions from a bottom-up process [38,39]. Since the 21st century, scholars have used telephone data [40,41], social media data [7,42], public transportation data [14,43], and mobile phone data [15,17,44] to investigate the spatial representation of functional border effects. Research findings indicate that at the national scale, functional borders often overlap significantly with administrative borders ([7,40,42]), but at the regional and urban scales, functional borders frequently exhibit spatial misalignment with administrative borders [14,15]. In recent years, some scholars have quantified the functional border effect coefficient based on the gravity model, and the results show that functional borders can impede spatial interactions [11,12]. Considering that functional borders are identified by clustering spatial units with stronger interactions, this conclusion aligns with the principle of functional border identification. Meanwhile, studies have found that interaction intensity varies among functional regions of different centralities [26]. This suggests that the border effect of spatial interactions may differ depending on the ranks of functional borders that are crossed.
Although researchers have conducted studies on administrative and functional borders effects, the coordinated effects of them on spatial interaction still are not clarified. Meanwhile, it is evident that scholars have found that different ranks of administrative and functional borders do not have identical effects on spatial interactions. Therefore, in constructing the model to measure border effects, this study not only follows the traditional gravity model by including administrative and functional borders as dummy variables, but also includes the hierarchical gap of borders crossed between origins (O) and destinations (D). This approach aims to provide a more comprehensive analysis of the factors influencing spatial interactions.

3. Data and Methods

3.1. Study Area and Datasets
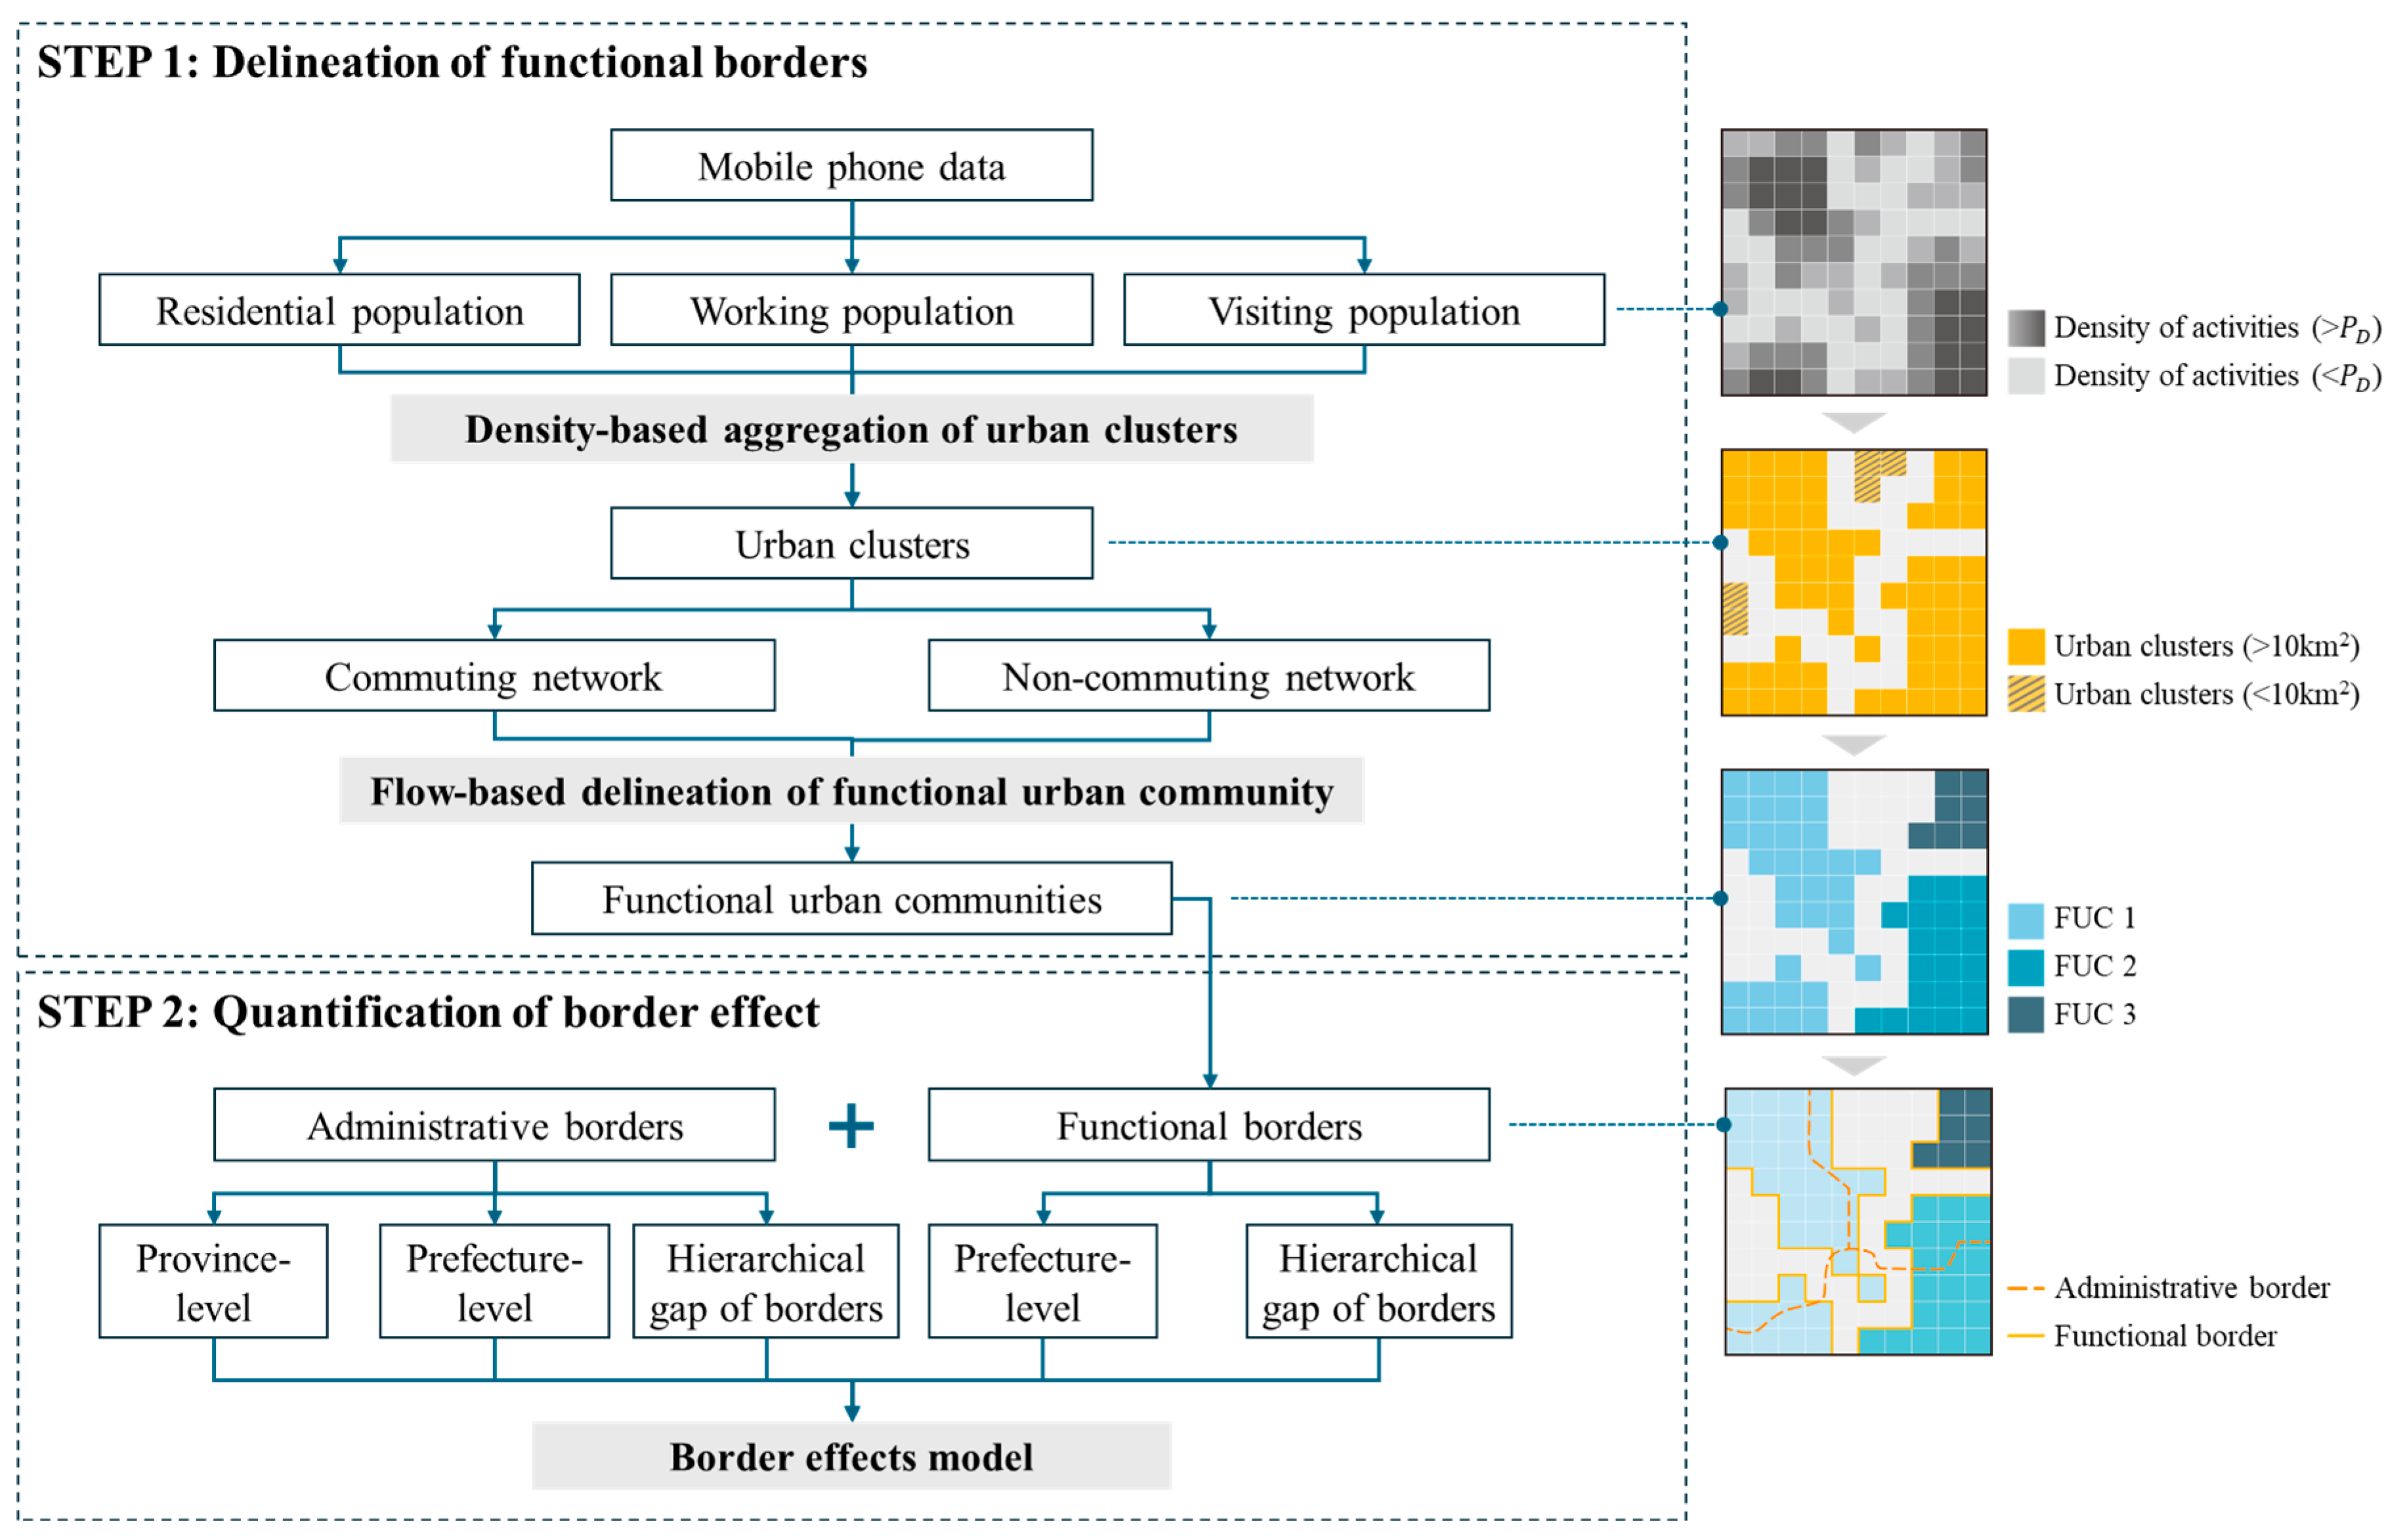
To explore the effect of administrative and functional borders of city regions, this study takes a mega-city region, Shanghai-Suzhou-Jiaxing (SSJ) area, as the study area (Figure 1). Shanghai, as a hub connecting flows within the Yangtze River Delta region, is the core city in this mega-city region [45]. During the process of inter-jurisdictional regionalization, the spatial connection between Suzhou, Jiaxing, and Shanghai has become increasingly close [23]. In particular, the peripheral regions of Jiangsu and Zhejiang have generated significant territorial competitiveness during their cross-border integration with Shanghai [46], attracting numerous industrial zones and residential neighborhoods, which has led to substantial cross-border human flows. After the Strategy for Integrated Development of Yangtze River Delta was elevated to the status of national strategy, the Outline of the integrated regional development of the Yangtze River Delta issued by the Communist Party of China Central Committee and the State Council, designated Qingpu District (Shanghai), Wujiang District (Suzhou), and Jiangshan County (Jiaxing) within the study area as a demonstration zone [47], highlighting that the area is at the forefront of regional integrated development.
The study area includes Shanghai, a provincial-level municipality, and Suzhou and Jiaxing, the prefecture-level cities in Jiangsu and Zhejiang. Namely, they are 16 districts belonging to Shanghai, 5 districts, and 4 county-level cities belonging to Suzhou, 2 districts and 3 county-level cities and 2 counties. Therefore, the study area includes administrative borders at the provincial-level and district/county-level. By 2022, the resident population within the study area reached 42.62 million people.
This study relies on extensive mobile phone data provided by China Unicom, one of the three major mobile communication carriers in China. In order to identify the regular behavioral patterns of users, the collection time interval is set to the whole month of June 2023 (22 weekdays and 8 weekends). The locations of mobile phone users were approximated by the positions of serving base transceiver stations, each covering an area roughly approximated by Voronoi polygons of about 0.2 km² [30]. The spatial analysis units bigger than Voronoi polygons can encompass several base stations, thus capturing mobile phone users’ locations effectively. Meanwhile, Wei et al. [48] demonstrated that the estimates of polycentric structure are more accurate and precise with the shrinking of analysis unit size. Therefore, the mobile phone data aggregated in 1 km × 1 km grids, while ensuring data accuracy, allows for a more precise representation of the urban functional structure. This spatial resolution has been widely used in empirical studies for constructing inter-city flow networks and identifying urban functional areas [30,49,50].
The dataset includes location information of the estimated home, work, and visit place of each mobile phone user in the SSJ area (Table 2). The residence is determined as the location with the longest stops between 9 pm and 8 am within a month. Similarly, the workplace is identified as the location with the longest stops between 7 am and 7 pm on weekdays. The number of commuters is calculated as the total number of individuals traveling between their residence and workplace on weekdays for at least 10 days in a month. The visit place is defined as stops with a duration exceeding 2 h and a frequency of less than 8 times on weekends. The number of non-commuters is the total number of residents traveling between their residence and visit places on weekends. The mobile phone data detected 2,404,126 commuting flows and 1,776,492 non-commuting flows among 22,002 grids. The flow density is calculated based on the number of commuters and non-commuters between the origin (O) grid and the destination (D) grid (Table 3).

3.2. Methods

To delineate functional borders and quantify border effects, we took the following steps (Figure 2). First, we merge grid cells into urban clusters under a threshold of activity density. Second, we delineate the functional borders between grid cells in the urban clusters based on the community detection algorithm. Finally, we calculate administrative and functional borders effects on spatial interaction based on the gravity model.

3.2.1. Delineating Functional Border

(1)
Density-based aggregation of urban clusters
Through the density-based clustering of urban areas, this study aims to filter out dispersed and fragmented grids from small towns and rural areas, thereby facilitating the delineation of cohesive FUCs and continuous functional borders. Additionally, the clustering process focuses on incorporating areas with the highest activity intensity and densest spatial interactions within the city region, which supports the fitting of the subsequent border effect model.
This study uses the mean method to synthesize the comprehensive population activity density index P , and defines the median value of P as the population activity density threshold P D , which refers to the minimum population in city region. Grids with greater value than P D will be identified as urban units. The formula for population activity density P is as follows:
P = P h × P w × P v 3 ,
where P h is the living population of the grids, P w is the working population of the grids, and P v is the visiting population of the grids.
Then, the urban clustering algorithm is utilized to aggregate urban units into clusters under P D [51,52]. An urban cluster is initiated from randomly selected, unprocessed urban units, and iteratively incorporates the nearest urban units until all neighboring units have been examined, thereby forming a complete urban cluster. This process is repeated by selecting an unprocessed urban unit to form a new cluster, continuing until all units are allocated to an urban cluster. In this study, all eight neighbors are considered for clustering. Additionally, each urban cluster must meet certain area criteria, with a minimum cluster area set at 10 km² [49].
(2)
Flow-based delineation of FUCs
To construct the network from the commuting and non-commuting flow datasets, an origin–destination (OD) matrix was established to represent flows between all spatial grids. Each grid C i corresponds to a node V i . If n residents from grid C i go to grid C j for work or visit, the weight of edge E i j is assigned as W . This process results in the creation of a weighted directed graph, N . Based on commuting and non-commuting networks, community detection algorithms are used to identify homogenous communities with similar characteristics or high-value flows [53], which subsequently delineates functional borders.
Although various algorithms are available for community detection, the Infomap [54] is considered one of the best-performing approaches [55,56]. This algorithm enables the classification of millions of nodes in directed networks within minutes [57,58]. Numerous studies have applied Infomap to address domain-specific problems, such as revealing spatial groupings of different species [59] or clustering the direct citation network of the Astro dataset [60]. In urban studies, Infomap has been used to delineate FUCs at multiple scales [14,26,61]. Furthermore, empirical studies have demonstrated that the community detection results of Infomap exhibit a high correlation with the spatial distribution of administrative borders, making it particularly suitable for comparing border effects [28].
(3)
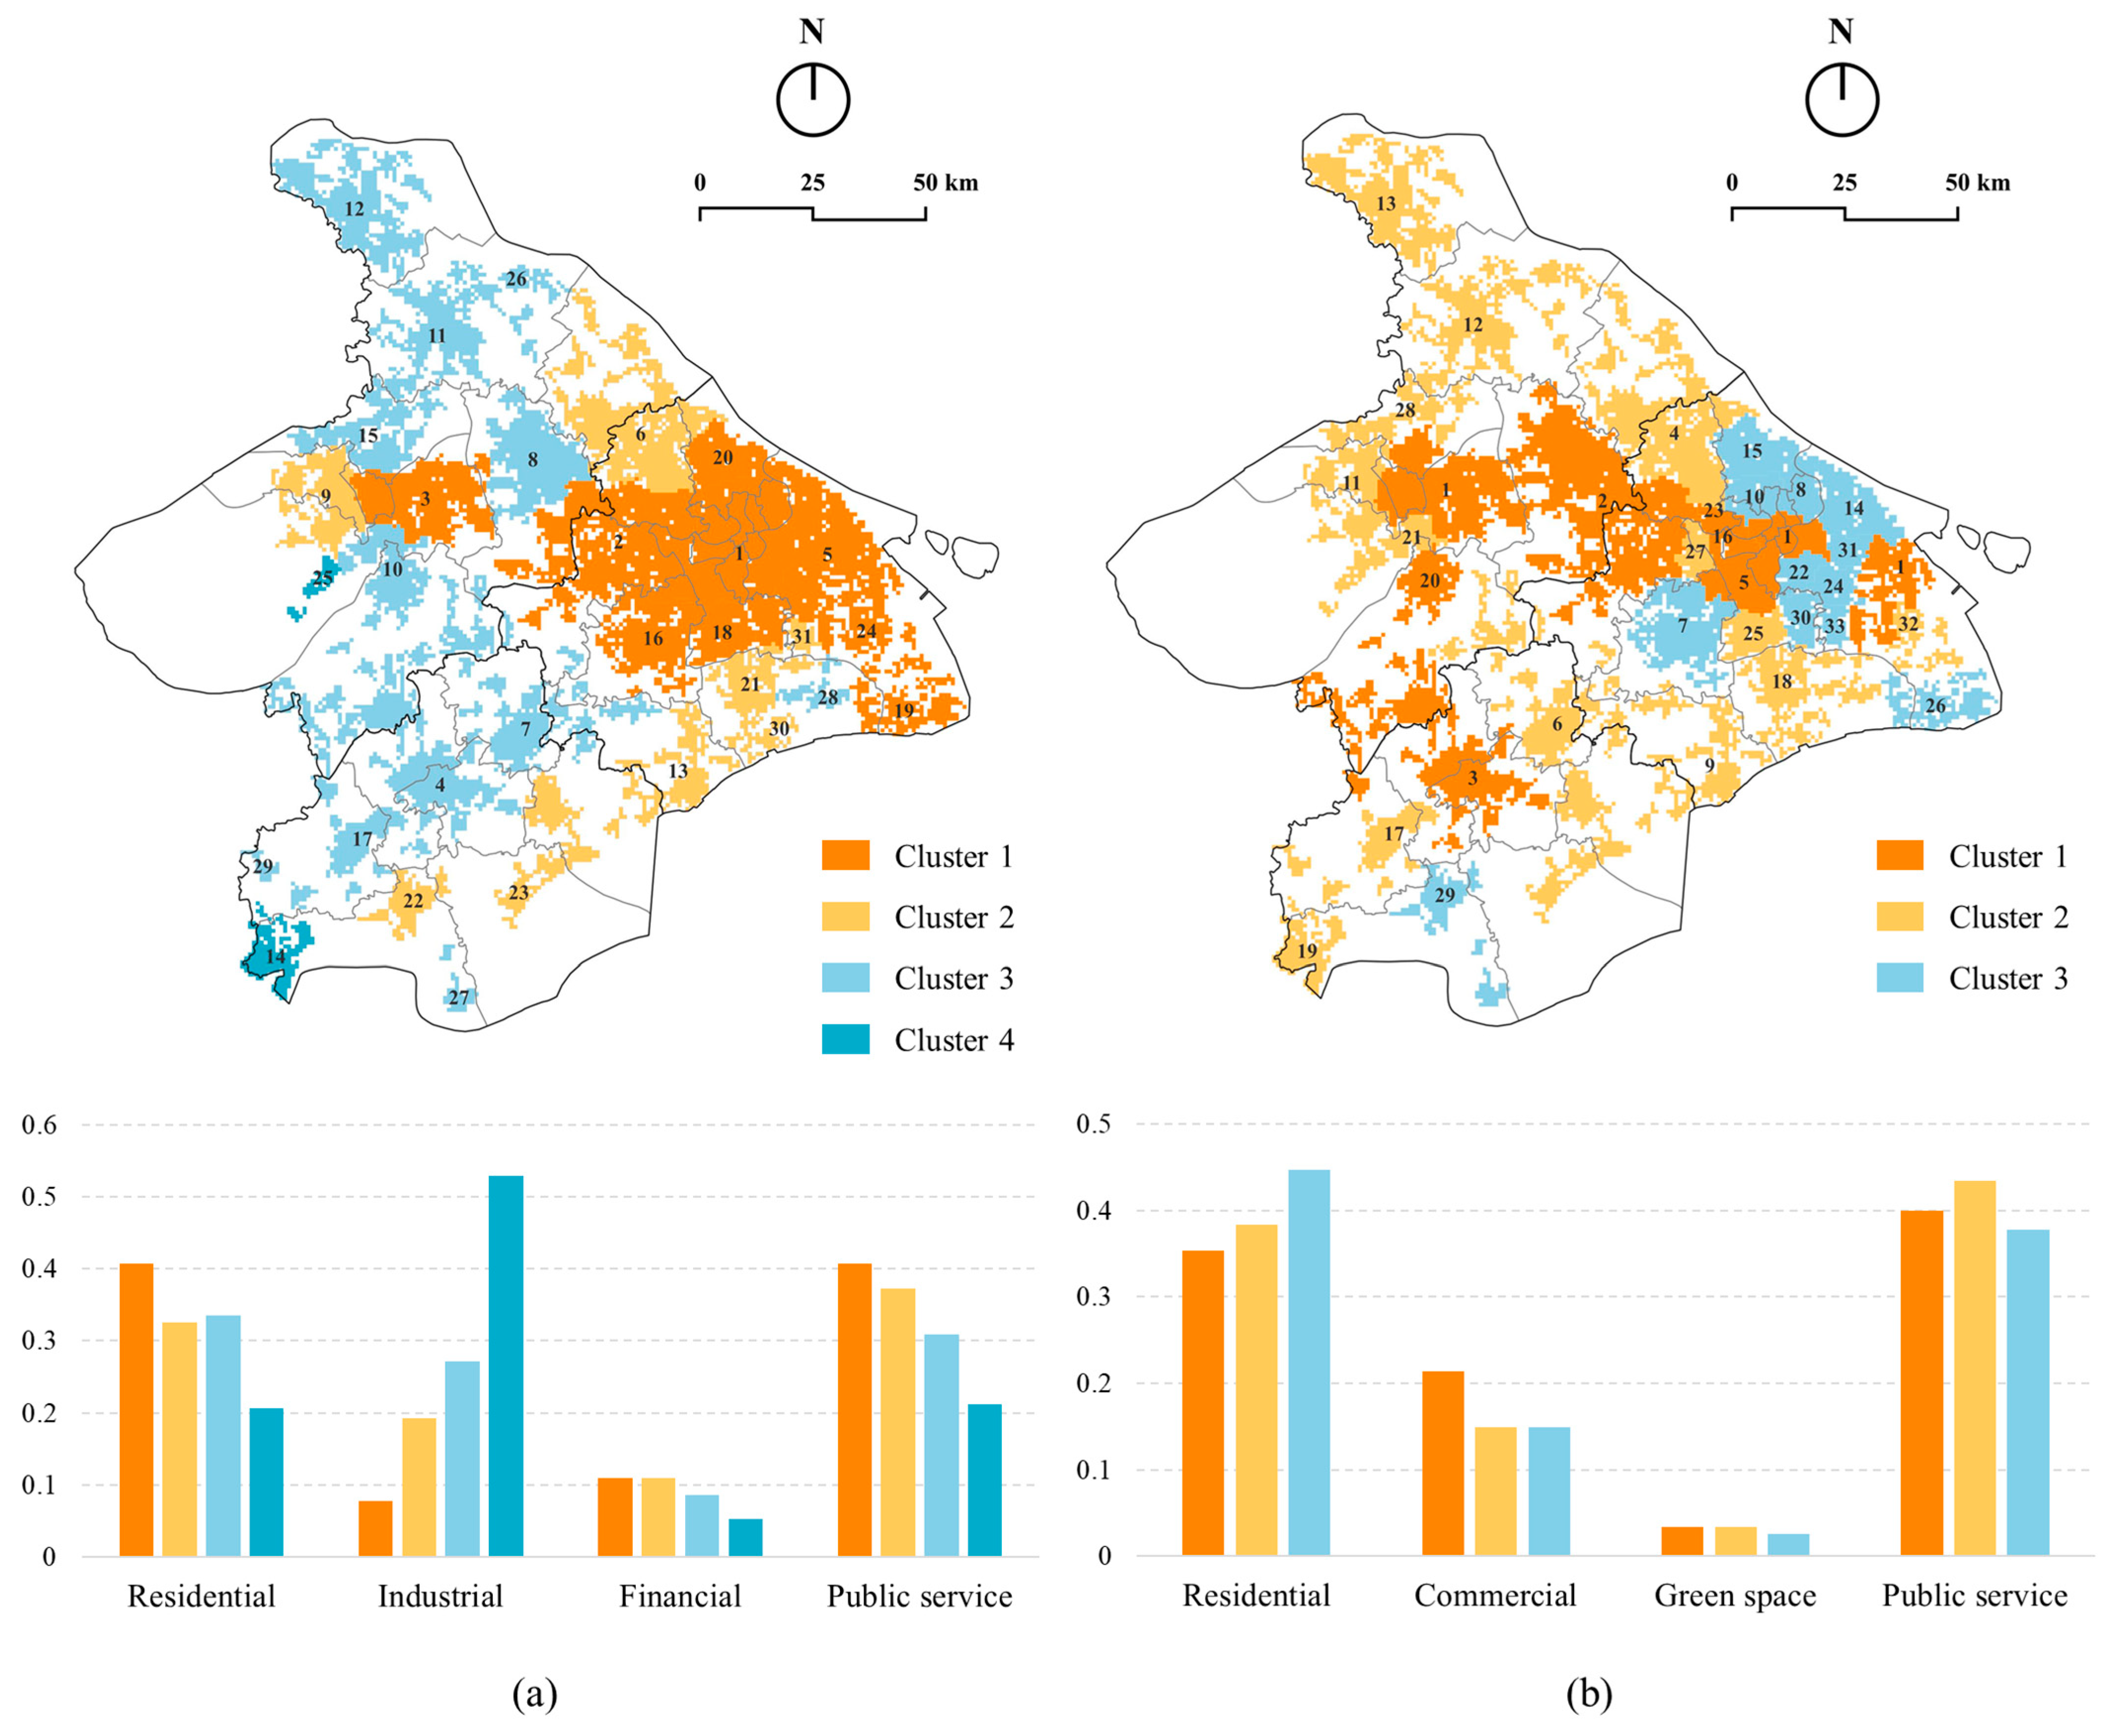
Functional characterization of FUCs
To understand the spatial characteristics of FUCs’ function, the POIs data were used to reveal similar patterns of functional characteristics among FUCs. The POIs data were collected via the API of Amap in 2023. Based on urban functions categories (Table S1), such as residential, industrial, and commercial, which are associated with commuting and non-commuting activities, POIs were aggregated and counted for each urban function within every FUCs. Through taking the urban functions proportion of FUCs as input, FUCs with similar functional characteristics are identified using the hierarchical clustering method (Figure S1).
(4)
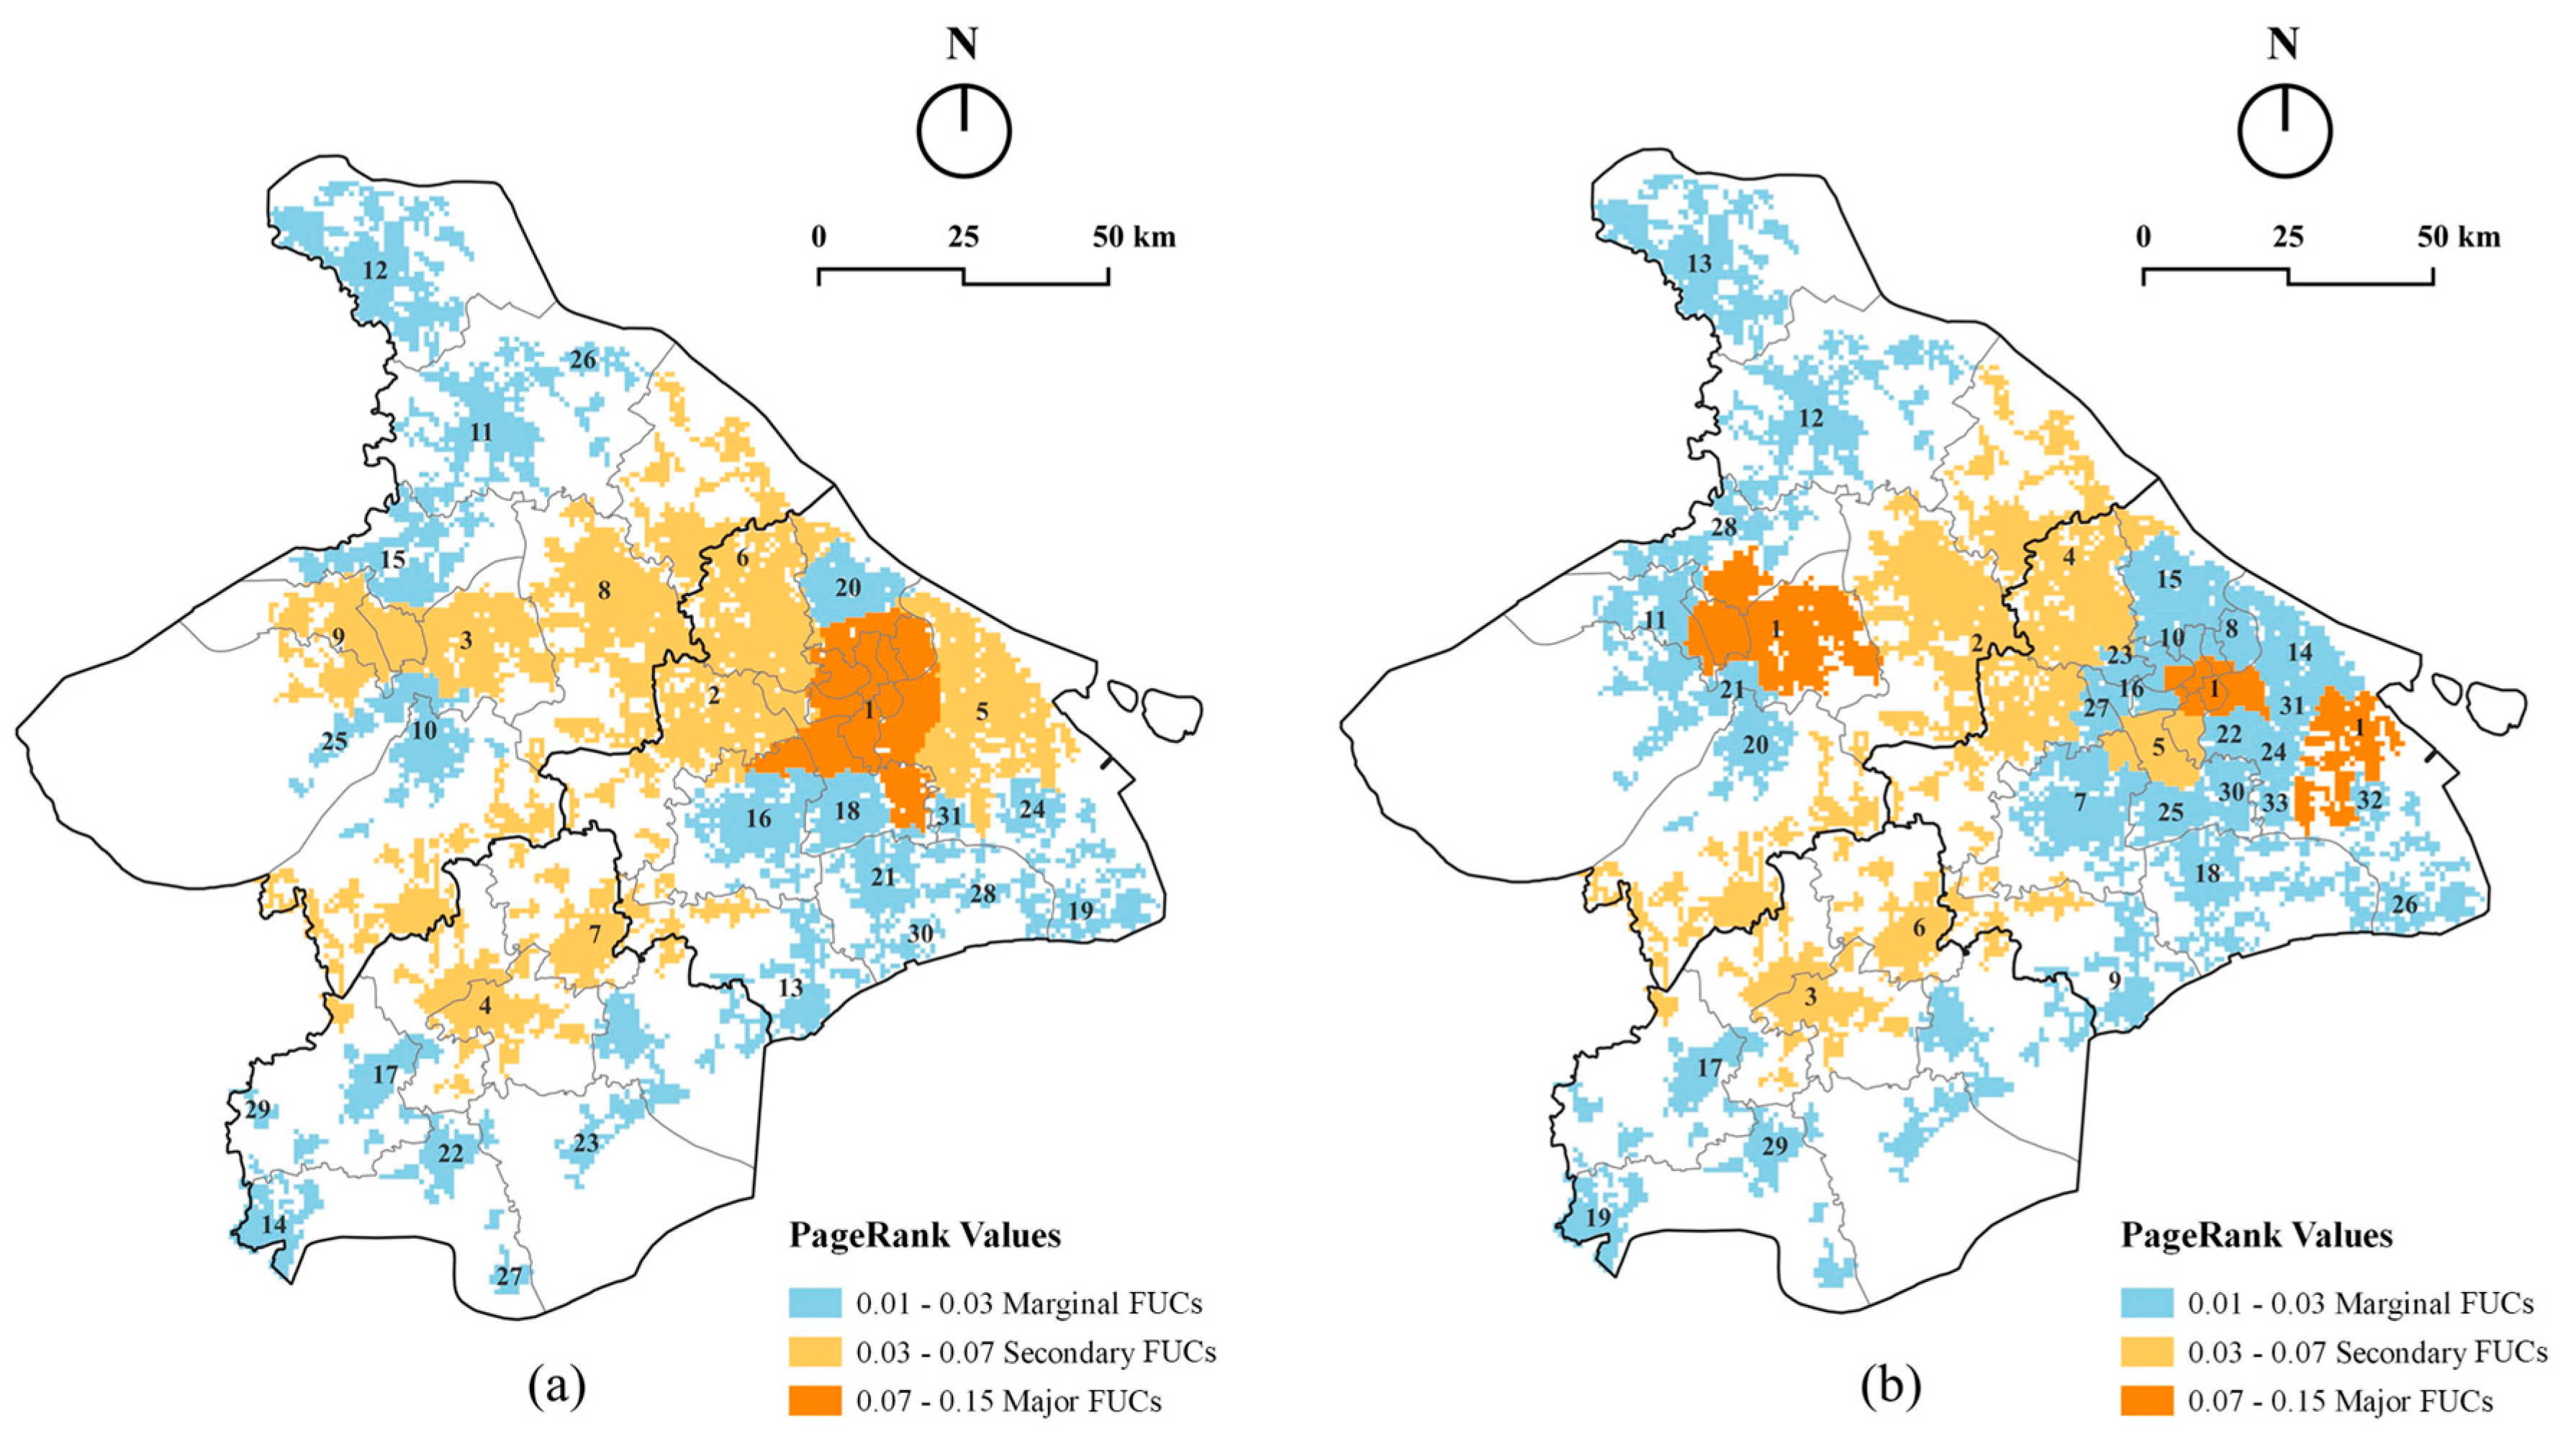
Centrality analysis of FUCs
PageRank algorithm is used to rank the importance of identified functional areas and classify the ranks of functional borders. Compared to other centrality metrics such as degree and betweenness, PageRank evaluates the importance of nodes more comprehensively by accounting for both the quantity and quality of links connecting with them [62]. Based on the results of PageRank value, FUCs are classified as major FUCs, secondary FUCs and marginal FUCs through Natural Breaks. The value of PageRank for FUC i is formulated as:
P R i = 1 d n f + d j B i P R j L i ,
where d represents the damping factor, commonly set to 0.85 [63]; n f is the total number of FUCs; B i is the set of FUCs with human flows originating from FUC i ; and L i is the number of links out from FUC j , weighted by the quantity of human flows.

3.2.2. Quantifying Border Effect

The gravity model is a classic and widely applied method for measuring border effects. Traditionally, the gravity model for spatial interaction is expressed as (base on Kabir et al. [64]):
T i , j = k P i α P j β r i , j θ ,
where T i , j is flows of humans, k is a proportionality constant, P i is the population in spatial unit i , r i , j is the shortest distance of network between i and j , and α , β , and θ are constant parameters.
Human flows are influenced by the border effect. As a result, the effective flow distance is not limited to geographic distance but also includes additional length attributed to the border effect and random variations. McCallum [4] converted the gravity model to an exponential form by adding the border as a dummy variable, with the flow between spatial unit i and j formalized as:
l n T i , j = α l n P i + β l n P j θ l n r i , j + l n k + φ B + ε ,
where B is the border spanned by the flow between spatial unit i and j ; φ is the parameter of the border effect; and ε is the stochastic error term.
In this study, the original border model was adapted to:
l n T i , j = α l n P i + β l n P j θ l n r i , j + l n k + φ 1 B a p + φ 2 B a d + φ 3 B a l + φ 4 B f + φ 5 B f l + ε .
As shown in Table 4, B a p is the provincial border, B a d is the district/county border, and B a l is the hierarchical gap between districts/counties; B f is the FUC border and B f l represents the hierarchical gap between FUCs. B a l and B f l are defined as the absolute value of the difference obtained by subtracting the ranks of the areas where spatial units i and j are located. The rank and dummy value of district/county and FUC is shown in Table 5.

4. Empirical Results

4.1. Delineation of Functional Borders

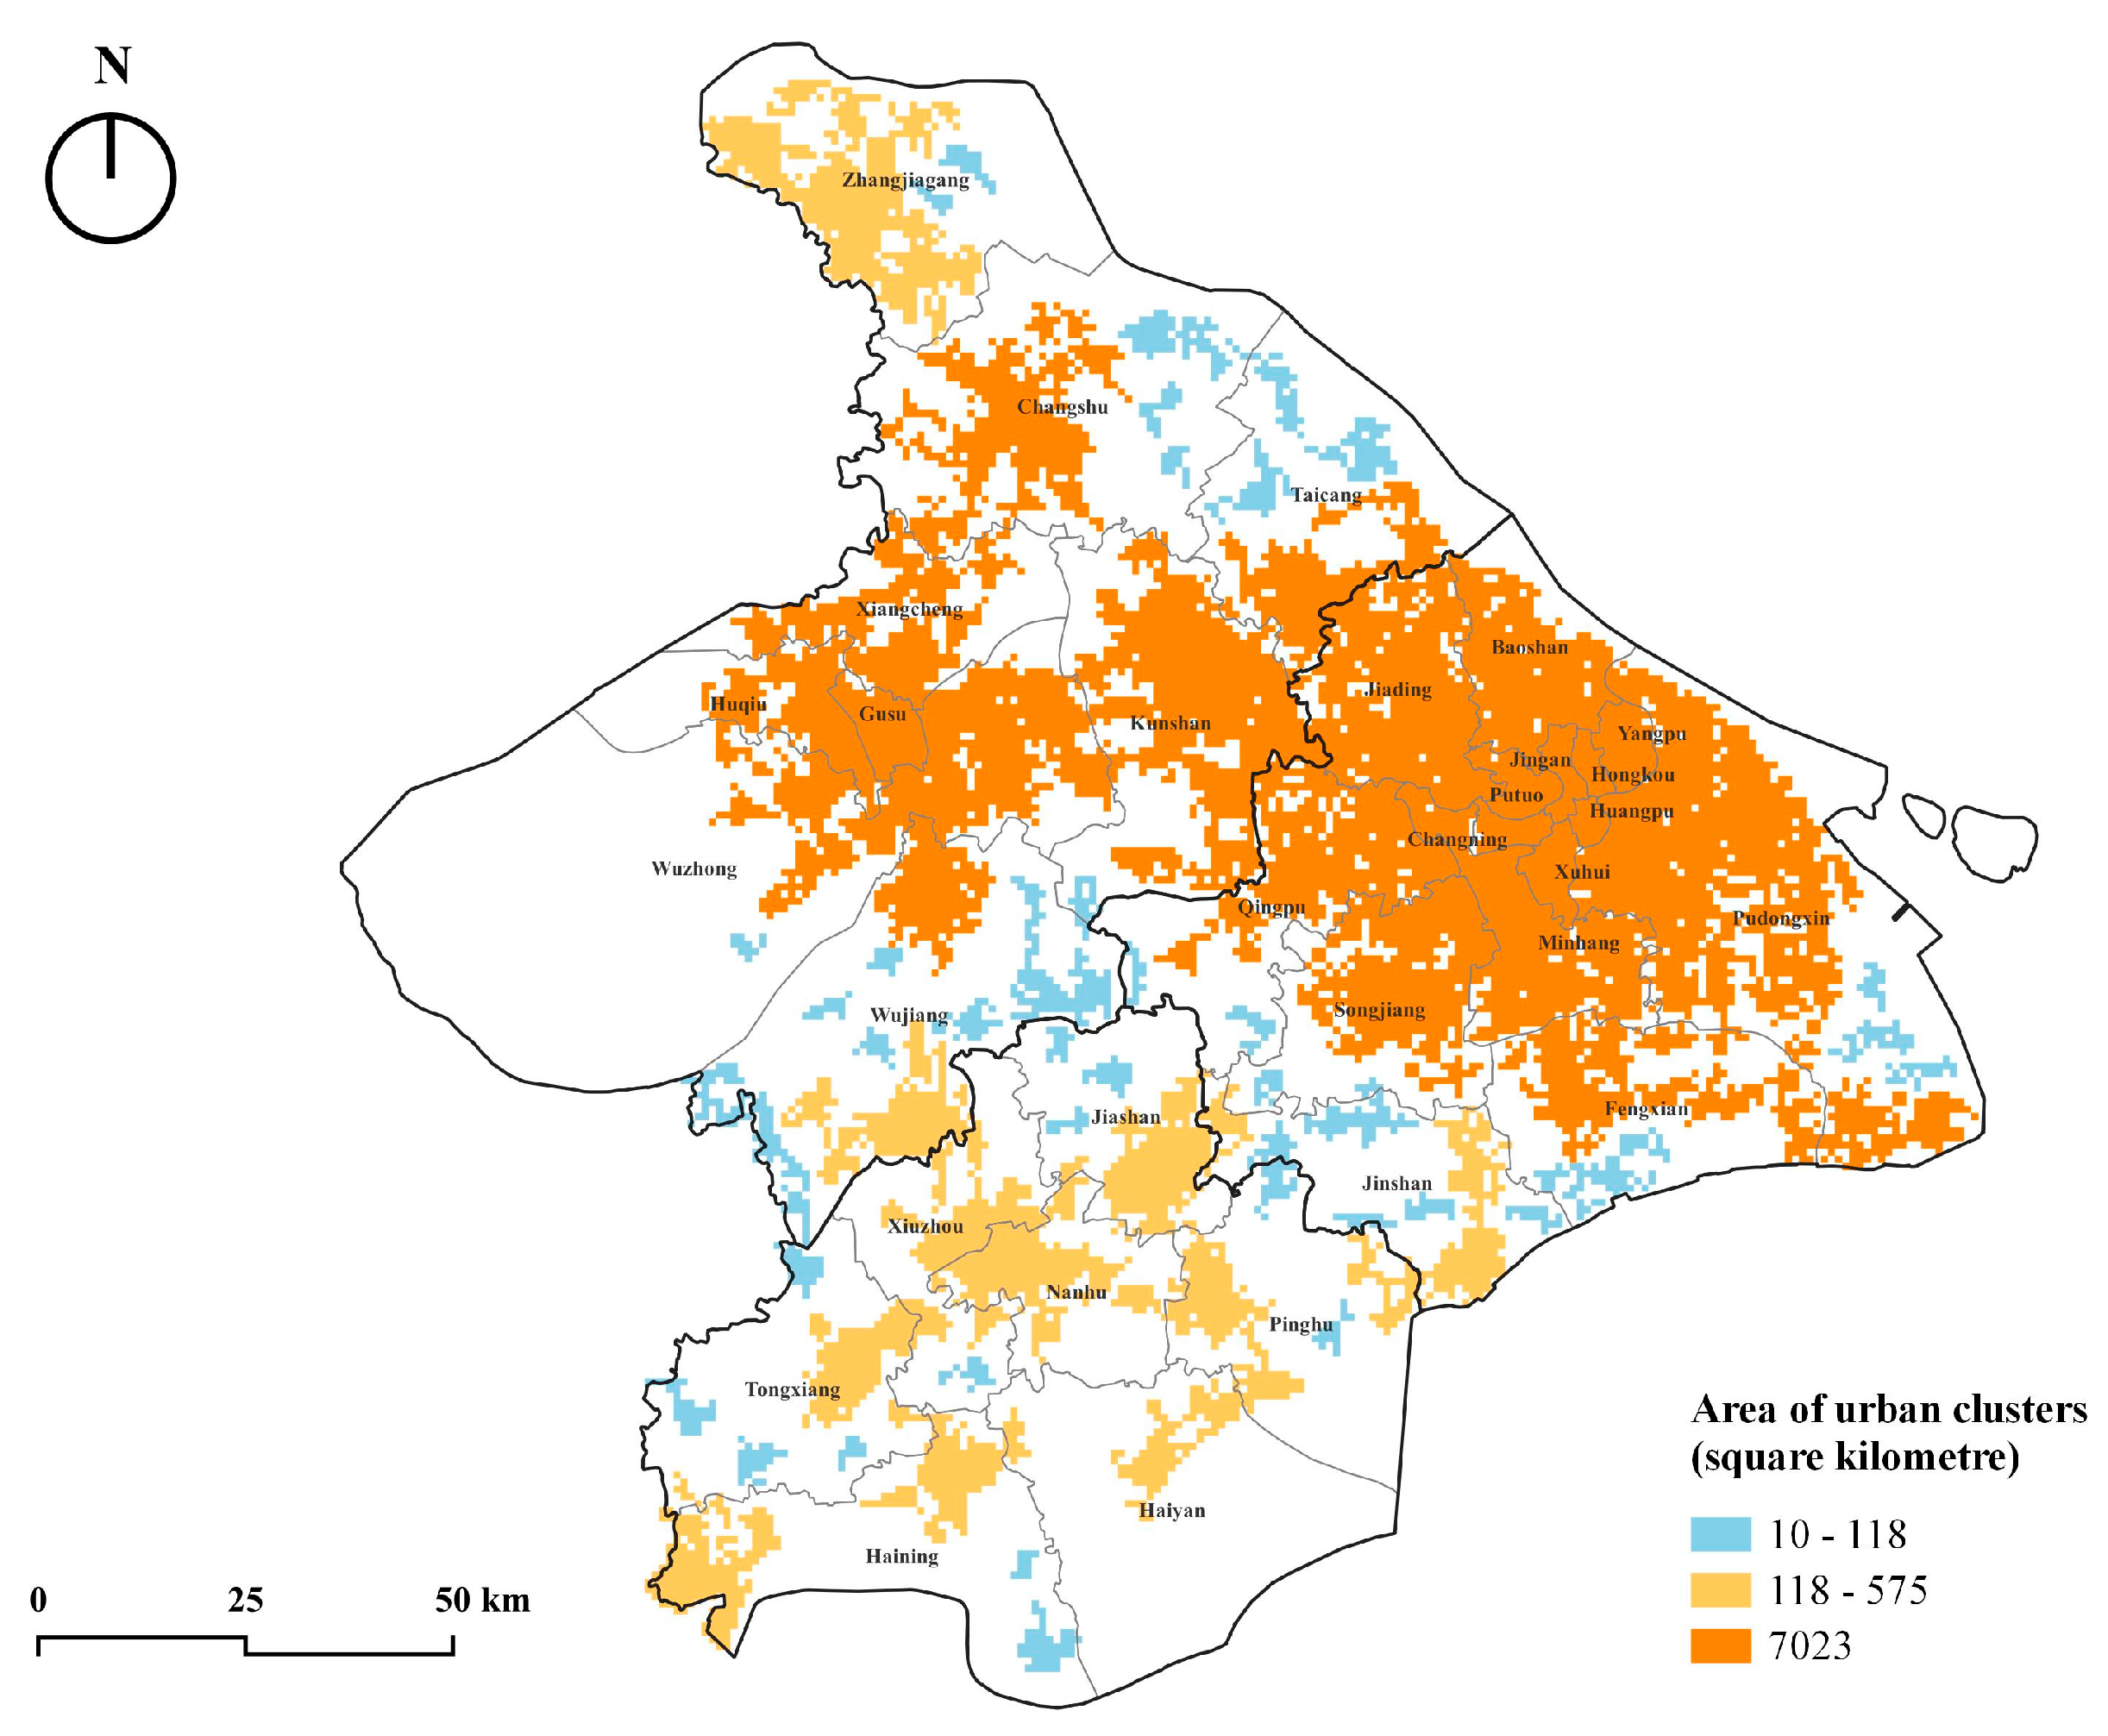
4.1.1. Aggregating Urban Clusters

Figure 3 shows the urban clusters within the SSJ area using population activity density. A total of 10425 grids are aggregated into urban clusters. Based on their size, all urban clusters are classified into three ranks using the natural breaks method. The first-ranked urban cluster covers the area continuously between the central regions of Shanghai and Suzhou, including the peripheral districts of Shanghai, such as Jiading and Qingpu, as well as county-level cities in Suzhou, including Changshu and Taicang, accounting for 67% of the total urban cluster area. The second-ranked category includes eight urban clusters, mainly covering the central area of Jiaxing and its county-level cities, along with Zhangjiagang (a county-level city in Suzhou), accounting for 22% of the area. The third-ranked category includes 39 urban clusters, primarily distributed along the provincial borders between Shanghai and Jiaxing, as well as Suzhou and Jiaxing.
From the spatial distribution of urban clusters, it can be observed that the provincial border between Shanghai and Suzhou has facilitated the development of urban areas on both sides. In contrast, the provincial borders between Shanghai and Jiaxing, and between Suzhou and Jiaxing, have hindered the development of urban areas on either side. By examining satellite imagery and the spatial planning of the three cities, it becomes evident that the strict ecological and agricultural regulations in these regions have constrained urban spatial development. Therefore, activity density of spatial units does not fully capture the provincial border effect, necessitating further analysis from the perspective of spatial interactions.

4.1.2. Delineating and Characterizing Functional Urban Communities

According to Figure S1, at the scale of district/county-level, 31 and 33 FUCs were identified in the commuting and non-commuting networks, respectively, with modularity values of 0.69 and 0.77, indicating robust community detection results at this scale. Figure 4 shows that the spatial distribution of FUCs in the two networks is similar, with the main difference in the central urban area of Shanghai. The relatively unified functional area in the commuting network is divided into several smaller functional areas in the non-commuting network. This difference may be attributed to the only set of spatially disconnected functional areas in non-commuting network, where Shanghai’s central urban area, parts of Pudong New Area, and Suzhou’s central urban area form to one FUC (FUC 1 in Figure 4b). This FUC reduces connectivity between surrounding spatial units, resulting in the formation of several independent FUCs.
A comparison of functional and administrative borders reveals that the functional borders in peripheral areas of the SSJ area are largely aligned with district/county-level borders, such as Zhangjiagang in Suzhou (FUC 12 in Figure 4a and FUC 13 in Figure 4b). Mismatches primarily occur at the junctions of the three cities, such as the FUC across the Shanghai-Suzhou-Jiaxing provincial border (FUC 7 in Figure 4a and FUC 6 in Figure 4b), as well as at the central urban areas, such as the FUC across the Shanghai district border (FUC 1 in Figure 4a,b). The results of density-based urban area clustering demonstrate that the dispersed and isolated urban clusters at the confluence of Shanghai, Suzhou, and Jiaxing form closely connected FUCs. This indicates that the physical separation of urban clusters by borders has not weakened functional interaction.
The spatial distribution of different clusters and the average proportion of different functions in each cluster were illustrated in Figure 5. In the commuting network, the SSJ area is segmented into four clusters, arranged sequentially from Shanghai and central urban areas of Suzhou to suburban areas of Suzhou and Jiaxing. Within these clusters, the proportions of residential, financial, and public service functions gradually decline, while industrial functions increase significantly. In the non-commuting network, three clusters were generated in the SSJ area. Cluster 1 is primarily concentrated in the central urban areas of all three cities as well as in the cross-border region between Shanghai and Suzhou. Cluster 2 is mainly distributed across the suburban areas and cross-border regions among three cities. Cluster 3 predominantly comprises the FUCs surrounding central urban areas of Shanghai. From Cluster 1 to Cluster 3, the proportions of commercial and green space functions progressively increase, accompanied by a rise in residential functions. The spatial variations in FUCs’ functions suggest that the cross-border region between Shanghai and Suzhou have absorbed spill-over resources from Shanghai, evolving into comprehensive functional nodes within the SSJ area.
The PageRank results indicate that the commuting network contains 1 major FUC, 8 secondary FUCs, and 22 marginal FUCs, while the non-commuting network consists of 1 major FUC, 5 secondary FUCs, and 27 marginal FUCs. Compared to the non-commuting network, the commuting network has more secondary FUCs, suggesting a more balanced residence-work relationship of the SSJ area. As shown in Figure 6, the major and secondary FUCs of both networks are primarily distributed in central urban areas and cross-border regions. From a multi-activity perspective, the SSJ area has developed a cross-border polycentric hierarchical spatial structure.

4.2. The Effects of Administrative and Functional Borders

4.2.1. Border Effect on Commuting and Non-Commuting Flows

As explained in Section 3.2.2, this study measures border effects through the gravity model. All commuting and non-commuting flows between urban units are included in the measurement of the border effect. Model I is a base model that does not contain border variables, while Models II to IV are models that incorporate border variables. The regression results are presented in Table 6. The results indicate that introducing border variables improves the performance of the gravity model for spatial interaction (Models II and III), and the combined introduction of administrative and functional borders significantly enhances the model’s goodness-of-fit (Model IV). In all eight models of the commuting and non-commuting networks, all the explanatory variables have a variance inflation factor (VIF) value of less than 5, indicating that there is no obvious multi-collinearity.
The results of Model IV indicate that commuting and non-commuting networks have similar border effects: administrative borders have a greater influence on human flows than functional borders, with provincial borders having significant positive effects. Provincial borders demonstrate a significant positive effect, effectively reducing the geographic distance between spatial units by 2 times. The hierarchical gap of administrative borders exerts a noticeable negative effect on both types of flow, equivalent to increasing the geographic distance by approximately 0.2 times, indicating that human flows within the SSJ area tend to exhibit horizontal flows between districts/counties of the same administrative rank.
Specifically, the border effects of the commuting and non-commuting networks differ in the following aspects. District/county borders have a greater negative effect on commuting flow (coefficient with −0.129) but have a minimal effect on non-commuting flows (coefficient with −0.006). This suggests that people prefer to work within the district/county in which they live but are willing to travel to other districts/counties for leisure. In contrast, functional borders represent less of a barrier to commuting flows (coefficient with −0.001) than non-commuting flows (coefficient with −0.043). Based on the modularity of community detection, more flows between spatial units are classified within communities in the non-commuting network, resulting in larger functional borders effects. The hierarchical gap of functional borders is the only variable that has opposite effects on the two types of flows, having a positive effect on commuting flows (coefficient with 0.028) but a negative effect on non-commuting flows (coefficient with −0.010). This suggests that a significant proportion of residents are willing to commute to FUCs with a higher or lower functional rank than their home FUC, such as moving from secondary to major FUCs. In contrast, most residents prefer to spend their leisure time within their home FUCs or in FUCs of the same functional rank.

4.2.2. Spatial Characteristic of Province Border Effect

To further explore the spatial distribution of the impact of provincial borders on human flows, this study constructed separate models for the provincial border effects on flows within cross-border FUCs and flows between non-cross-border FUCs. Model I is a basic model without border variables, while Model II is a model that incorporates provincial border variables. All VIF values are below 5, suggesting that there is no significant multicollinearity among the variables.
As shown in Table 7, the models for commuting and non-commuting flows show similar patterns. The inclusion of the provincial border variable resulted in a greater improvement in the gravity model for cross-border FUCs compared to non-cross-border FUCs. This suggests that the provincial border effect is more effective in explaining the factors influencing human flows in cross-border regions. This could be attributed to the geographical proximity of cross-border regions to the provincial border, which makes individuals more likely to engage in activities such as work and visit across the border. However, the coefficients for the provincial border variable in cross-border regions are about half of those in non-cross-border regions, indicating that the provincial border has a stronger positive effect on human flows in non-cross-border regions. This demonstrates that the provincial border effect has spatial heterogeneity, suggesting a weaker influence on cross-border regions.

5. Discussion

5.1. Multi-Activity Networks: The Cross-Border Polycentric Spatial Structure of Mega-City Region

This study identifies FUCs based on the distributions and interactions of residential, working, and visiting populations within spatial units. The results confirm that using fine-grained spatial units (i.e., 1 km grids), rather than administrative units, helps preserve the bottom-up spatial structure of city regions, especially in urban areas where built-up spaces are closely connected and spread across borders. Delineating FUCs based on district/county-level spatial units may underestimate or overestimate the integration of districts and counties due to ignoring the spatial heterogeneity of inter-district/county flows. Furthermore, compared to previous studies [29], this study places greater emphasis on selecting a similar number of FUCs to the number of districts and counties, which is more conducive to comparing functional borders and administrative borders in the SSJ area.
The study shows that the FUCs formed by commuting and non-commuting flows have similar but not identical spatial distributions. Both networks exhibit cross-border FUCs around the provincial border of the SSJ area, which differs from previous results on community detection within Shanghai [14,26,65]. Moreover, building upon previous studies of FUCs clustered by unit attributes such as employment and built-up intensity, this study delineated cross-border FUCs between Jiaxing and the other two cities not only FUCs between Shanghai and Suzhou [66,67], suggesting that future research on spatial structure of city regions should focus on spatial interaction. The differences between the two networks lie mainly in the major FUC, where the urban centers of Shanghai and Suzhou and parts of Shanghai’s suburbs are aggregated into the same FUC in the non-commuting network. There are two reasons for this phenomenon: firstly, people tend to choose more distant destinations for leisure and consumption; secondly, the well-developed regional transport system, such as the high-speed railway, has significantly reduced travel time costs. As a result, spatial units of the non-commuting network that are far apart show stronger spatial interactions than adjacent units. The spatial structure of non-commuting also confirms the role of central cities as consumption centers of a city region [68].
Previous studies on administrative border effects have found that during the stage of evaporation, the dissolution of barriers leads to urban land expansion in cross-border regions (Figure 3), and interactions between city centers become particularly strong, resulting in a functional polycentric hierarchical structure within the city region (Figure 7a) [69]. This model is proposed based on the hypothesis that administrative borders act as obstructions to spatial interactions. However, our centrality analysis of the FUCs reveals that the emergent cross-border FUCs—formed through the integration of towns across provincial borders in the SSJ area—assume a subcentral role in both commuting and non-commuting networks. The SSJ area has fostered a new cross-border polycentric hierarchical structure, particularly between Shanghai and Suzhou (Figure 7b). Consequently, this study redefines the evaporation stage, based on the hypothesis that administrative borders can function as resources rather than mere obstructions. In the evaporation stage, city regions would integrate resources along the administrative borders which help to raise new subcenters in the cross-border region to decrease regional polarization. The spatial arrangement of these cross-border FUCs aligns with the strategic objectives of the “demonstration zones of cooperation” in the Outline of the integrated regional development of the Yangtze River Delta [47] and the Spatial Cooperative Plan of Greater Shanghai Metropolitan Area [70]. This alignment substantiates the foundational capacity and potential of these cross-border regions for integrated development, corroborating their strategic significance within regional planning initiatives.

5.2. Multi-Border Effect: Hybrid Influencing Factors of Spatial Interaction

The results demonstrate that incorporating both administrative and functional borders into the gravity model is effective in revealing the factors affecting travel flows within the SSJ area. Compared with the study of spatial interaction at macro (e.g., nations or city clusters) or micro (e.g., city) scales, if only administrative borders are measured at the city region scale, the physical factors, such as natural and infrastructural entities may be overlooked; and if only functional borders are measured, the economic and institutional factors, such as gaps in the gross domestic product (GDP), and the willingness to cooperate between districts/counties may be neglected. Additionally, this study shows that the hierarchical gap of administrative borders has a significant effect on human flows, consistent with Wang et al. [69], who found that the wider the gap between cities of different administrative ranks is, the larger the border effect tends to be. Furthermore, this study also reveals that the hierarchical gap of functional borders significantly influences human flows, which has not received sufficient attention in previous research.
The results of border effects quantification indicate that at the scale of district/county-level, commuting flows are more significantly influenced by district/county borders, whereas non-commuting flows are more strongly affected by functional borders. This could be due to the spatial distribution of various facilities within the SSJ area. As all three cities are at a high level of economic development and the spatial distribution of industrial facilities (e.g., companies and factories) is relatively even, people prefer to commute within their home districts/counties or across between districts/counties at the same administrative rank. The negative effect of administrative borders on commuting flows also aligns with studies in Belgium and the Netherlands [33,71]. Otherwise, large consumption facilities (e.g., shopping centers and exhibitions), are primarily concentrated in central urban areas, prompting people to cross district/county borders. The concentration of such facilities also results in a more compact and focused range of non-commuting activity spaces, leading to higher community modularity in the network of non-commuting flows, thereby amplifying the negative effects of functional borders. This is consistent with Liu et al. [15], who conducted community detection based on commuting, shopping, and dining activities of Beijing residents.
To further explore the spatial heterogeneity of provincial border effects within the SSJ area, this study categorizes the impact of provincial borders on spatial interactions based on the locations of the borders and FUCs (Figure 8). Both Figure 8 and Table 7 indicate that the positive effect of provincial borders on human flow within cross-border FUCs is lower compared to flows among other FUCs. This phenomenon is closely linked to the well-developed regional transportation infrastructure in the SSJ area. The regional transportation system of the SSJ area, such as the Shanghai-Nanjing Intercity Railway, reduces travel time among urban centers to approximately 30 min, significantly lowering the cost of long-distance travel between other FUCs. The maturity of the regional transportation system enables residents living away from provincial borders to travel effortlessly to other cities, thereby amplifying the positive impact of provincial borders in the SSJ area as revealed by the border effect model. Meanwhile, Figure 8 reveals that the positive effect of provincial borders between Shanghai-Suzhou, Suzhou-Jiaxing, and Shanghai-Jiaxing is progressively increasing, particularly within the commuting network. This reflects the uneven integration within the SSJ area. During the process of regional integration, Suzhou has proactively absorbed industrial and technological spill-over from Shanghai, leading to the formation of producer service clusters that support Shanghai’s industry. Thus, compared to residents of Suzhou, those in Jiaxing demonstrate a greater willingness to cross provincial borders in pursuit of higher incomes and improved employment opportunities.

5.3. Policy Implications

The findings of this study have several policy implications. First, our study indicates that the cross-border regions have become significant functional nodes within the SSJ area. Although regional authorities have emphasized strengthening cooperation between adjacent provinces and have established several cross-provincial collaborative development areas, the central urban areas of cities and counties continue to be designated as functional nodes of the regional network instead of the cross-border region [47,70]. Future regional and local authorities should consider treating cross-border regions as unified entities for spatial governance and economic development, thereby reconstructing the regional functional structure. Second, it is crucial to adjust the spatial distribution of public service facilities at the city-region level, particularly for major public service centers. From the residents’ travel perspective, this adjustment could reduce distances and costs of non-commuting trips; from the regional development perspective, it could help alleviate pressure on public services in central urban areas and promote differentiated development among districts and counties. Thirdly, during the regionalization process, multi-level governments in different administrative regions tend to prioritize their own interests, resulting in an uneven integration process. With the Strategy for Integrated Development of Yangtze River Delta being elevated to a national priority, the SSJ area should leverage central government decision-making bodies—such as the Leading Group for Integrated Development of the Yangtze River Delta—to coordinate planning efforts in Suzhou and Jiaxing. Through such coordinated efforts, these two cities can effectively harness central support to collaboratively absorb the functional spillover from the core city, thereby mitigating uneven integration and spatial polarization.

6. Conclusions

With the advancement of regional integration, particularly in mega-city region, both top-down administrative borders and bottom-up functional borders have been reflecting spatial interactions. To comprehensively reveal the border effects on human flows within city region, this study constructs spatial interaction networks of commuting and non-commuting flows through mobile phone data and 1 km × 1 km fine-grained spatial units. Density-based clustering and community detection algorithms are used to delineate functional borders, and the PageRank algorithm is employed to classify the rank of functional borders. Based on this, this study quantifies the impact of administrative and functional borders on human flows through the gravity model. The case study for this work is performed with real travel flow data in Shanghai-Suzhou-Jiaxing area, China.
This study presents three key findings. First, high-level administrative borders in the SSJ area function as resources. The evaporation of these administrative barriers has led to the emergence of a cross-border polycentric hierarchical structure in both commuting and non-commuting networks. Second, for both activity flows, administrative borders have a greater effect on human flows than functional borders, which is particularly prominent for the provincial borders. And compared to commuting flows, non-commuting flows are more sensitive with functional borders. Third, the spatial heterogeneity of provincial border effects suggests that while the regional infrastructure in the SSJ area has nearly achieved integration, economic and industrial development remains unevenly integration. Overall, this study reveals the spatial structure and border effects of the SSJ area, providing insights for improving regional and urban planning.
This study has several limitations. First, this study utilizes mobile phone data to represent spatial interactions. However, mobile phone coverage significantly varies among different demographic groups, such as various age groups and income levels. Moreover, the unavoidable noise from users with multiple devices may further skew the data. These factors inevitably lead to sample bias and the potential overestimation or underestimation of travel flows. Second, the study used mobile phone data to classify commuting and non-commuting flows, but it could not differentiate specific activities within non-commuting flows, such as shopping, sporting, and seeking healthcare, making it difficult to comprehensively reveal the FUCs from a multi-activity view. Future research could incorporate POI data to refine the categories of travel flows. Third, the border model in this study only used basic explanatory variables, such as population, distance and border type, while ignoring attributes like the functional and morphological characteristics of spatial units, which might have led to an over- or underestimation of border effects. Future studies could further refine and expand the explanatory variables for border effects. Fourth, urban and regional systems are complex networks involving multiple flows, but this study only analyzed border effects on human flows. Thus, future studies should examine border effects on networks of other flows, such as goods and information, in order to gain deeper insights into regional structures.

Supplementary Materials

The following supporting information can be downloaded at: https://www.mdpi.com/article/10.3390/ijgi14030133/s1, Table S1: Urban function categories and associated POI types; Figure S1: Hierarchical clustering of FUAs: (a) commuting network; (b) non-commuting network; Figure S2: Results of community detection vary with Markov times: (a) commuting network; (b) non-commuting network.

Author Contributions

Conceptualization, Yige Li and Jin Duan; Methodology, Yige Li and Ying Jiang; Data curation, Yige Li; Writing – original draft, Yige Li; Writing – review & editing, Ying Jiang and Jin Duan; Visualization, Ying Jiang; Project administration, Jin Duan; Funding acquisition, Jin Duan. All authors have read and agreed to the published version of the manuscript.

Funding

This research was funded by National Key Research and Development Program of China (2019YFD1100700).

Data Availability Statement

Mobile phone data are not publicly available to preserve privacy. POI data was obtained from public websites.

Conflicts of Interest

The authors declare no conflict of interest.

References

  1. Chen, N. Intra-national versus international trade in the European Union: Why do national borders matter? J. Int. Econ. 2004, 63, 93–118. [Google Scholar] [CrossRef]
  2. Evans, C.L. The economic significance of national border effects. Am. Econ. Rev. 2003, 93, 1291–1312. [Google Scholar] [CrossRef]
  3. Feenstra, R.C. Border effects and the gravity equation: Consistent methods for estimation. Scott. J. Political Econ. 2002, 49, 491–506. [Google Scholar] [CrossRef]
  4. McCallum, J. National Borders Matter: Canada-U.S. Regional Trade Patterns. Am. Econ. Rev. 1995, 85, 615–623. [Google Scholar]
  5. Sohn, C. Modelling Cross-Border Integration: The Role of Borders as a Resource. Geopolitics 2014, 19, 587–608. [Google Scholar] [CrossRef]
  6. Sohn, C.; Licheron, J. The multiple effects of borders on metropolitan functions in Europe. Reg. Stud. 2018, 52, 1512–1524. [Google Scholar] [CrossRef]
  7. Yin, J.; Soliman, A.; Yin, D.; Wang, S. Depicting urban boundaries from a mobility network of spatial interactions: A case study of Great Britain with geo-located Twitter data. Int. J. Geogr. Inf. Sci. 2017, 31, 1293–1313. [Google Scholar] [CrossRef]
  8. De Montis, A.; Caschili, S.; Chessa, A. Commuter networks and community detection: A method for planning sub regional areas. Eur. Phys. J. Spec. Top. 2013, 215, 75–91. [Google Scholar] [CrossRef]
  9. Ma, S.; Long, Y. Functional urban area delineations of cities on the Chinese mainland using massive Didi ride-hailing records. Cities 2020, 97, 102532. [Google Scholar] [CrossRef]
  10. Farmer, C.J.Q.; Fotheringham, A.S. Network-based functional regions. Environ. Plan. A Econ. Space 2011, 43, 2723–2741. [Google Scholar] [CrossRef]
  11. Jin, M.; Gong, L.; Cao, Y.; Zhang, P.; Gong, Y.; Liu, Y. Identifying borders of activity spaces and quantifying border effects on intra-urban travel through spatial interaction network. Comput. Environ. Urban Syst. 2021, 87, 101625. [Google Scholar] [CrossRef]
  12. Chen, W.; Chen, X.; Cheng, L.; Liu, X.; Chen, J. Delineating borders of urban activity zones with free-floating bike sharing spatial interaction network. J. Transp. Geogr. 2022, 104, 103442. [Google Scholar] [CrossRef]
  13. Shen, Y.; Batty, M. Delineating the perceived functional regions of London from commuting flows. Environ. Plan. A Econ. Space 2019, 51, 547–550. [Google Scholar] [CrossRef]
  14. Liu, X.; Gong, L.; Gong, Y.X.; Liu, Y. Revealing travel patterns and city structure with taxi trip data. J. Transp. Geogr. 2015, 43, 78–90. [Google Scholar] [CrossRef]
  15. Liu, J.; Meng, B.; Shi, C. A multi-activity view of intra-urban travel networks: A case study of Beijing. Cities 2023, 143, 104634. [Google Scholar] [CrossRef]
  16. Anderson, J.E.; van Wincoop, E. Gravity with gravitas: A solution to the border puzzle. Am. Econ. Rev. 2003, 93, 170–192. [Google Scholar] [CrossRef]
  17. Zhang, B.; Zhong, C.; Gao, Q.; Shabrina, Z.; Tu, W. Delineating urban functional zones using mobile phone data: A case study of cross-boundary integration in Shenzhen-Dongguan-Huizhou area. Comput. Environ. Urban Syst. 2022, 98, 101872. [Google Scholar] [CrossRef]
  18. Zhang, W.; Fang, C.; Zhou, L.; Zhu, J. Measuring megaregional structure in the Pearl River Delta by mobile phone signaling data: A complex network approach. Cities 2020, 104, 102809. [Google Scholar] [CrossRef]
  19. Ding, C.; Liu, C.; Zhang, Y.; Yang, J.; Wang, Y. Investigating the impacts of built environment on vehicle miles traveled and energy consumption: Differences between commuting and non-commuting trips. Cities 2017, 68, 25–36. [Google Scholar] [CrossRef]
  20. Liu, J.; Meng, B.; Yang, M.; Peng, X.; Zhan, D.; Zhi, G. Quantifying spatial disparities and influencing factors of home, work, and activity space separation in Beijing. Habitat Int. 2022, 126, 102621. [Google Scholar] [CrossRef]
  21. Burger, M.J.; Van der Knaap, B.; Wall, R.S. Polycentricity and the Multiplexity of Urban Networks. Eur. Plan. Stud. 2014, 22, 816–840. [Google Scholar] [CrossRef]
  22. Shu, X.; Han, H.; Huang, C.; Li, L. Defining Functional Polycentricity From a Geographical Perspective. Geogr. Anal. 2020, 52, 169–189. [Google Scholar] [CrossRef]
  23. Cui, C.; Wu, X.; Liu, L.; Zhang, W. The spatial-temporal dynamics of daily intercity mobility in the Yangtze River Delta: An analysis using big data. Habitat Int. 2020, 106, 102174. [Google Scholar] [CrossRef]
  24. Wu, C.; Smith, D.; Wang, M.S. Simulating the urban spatial structure with spatial interaction: A case study of urban polycentricity under different scenarios. Comput. Environ. Urban Syst. 2021, 89, 101677. [Google Scholar] [CrossRef]
  25. Zhou, M.; Yue, Y.; Li, Q.; Wang, D. Portraying Temporal Dynamics of Urban Spatial Divisions with Mobile Phone Positioning Data: A Complex Network Approach. ISPRS Int. J. Geo-Inf. 2016, 5, 240. [Google Scholar] [CrossRef]
  26. Wang, T.; Yue, W.; Ye, X.; Liu, Y.; Lu, D. Re-evaluating polycentric urban structure: A functional linkage perspective. Cities 2020, 101, 102672. [Google Scholar] [CrossRef]
  27. Yu, Q.; Li, W.; Yang, D.; Zhang, H. Mobile Phone Data in Urban Commuting: A Network Community Detection-Based Framework to Unveil the Spatial Structure of Commuting Demand. J. Adv. Transp. 2020, 2020, 8835981. [Google Scholar] [CrossRef]
  28. Liu, X.T.; Huang, J.W.; Lai, J.; Zhang, J.; Senousi, A.M.; Zhao, P. Analysis of urban agglomeration structure through spatial network and mobile phone data. Trans. GIS 2021, 25, 1949–1969. [Google Scholar] [CrossRef]
  29. Yu, W.; Shao, Z.; Huang, X.; Li, D.; Fan, Y.; Xu, X. Multi-scale cross-city community detection of urban agglomeration using signaling big data. Geo-Spat. Inf. Sci. 2023, 27, 1348–1361. [Google Scholar] [CrossRef]
  30. Chen, Z.; Yeh, A.G.-O. Delineating functional urban areas in Chinese mega city regions using fine-grained population data and cellphone location data: A case of Pearl River Delta. Comput. Environ. Urban Syst. 2022, 93, 101771. [Google Scholar] [CrossRef]
  31. Fischer, M.M.; Scherngell, T.; Jansenberger, E. The geography of knowledge spillovers between high-technology firms in Europe: Evidence from a spatial interaction modeling perspective. Geogr. Anal. 2006, 38, 288–309. [Google Scholar] [CrossRef]
  32. Hjaltadottir, R.E.; Makkonen, T.; Mitze, T. Inter-regional innovation cooperation and structural heterogeneity: Does being a rural, or border region, or both, make a difference? J. Rural Stud. 2020, 74, 257–270. [Google Scholar] [CrossRef]
  33. Persyn, D.; Torfs, W. A gravity equation for commuting with an application to estimating regional border effects in Belgium. J. Econ. Geogr. 2016, 16, 155–175. [Google Scholar] [CrossRef]
  34. Capello, R.; Caragliu, A.; Fratesi, U. Measuring border effects in European cross-border regions. Reg. Stud. 2018, 52, 986–996. [Google Scholar] [CrossRef]
  35. Li, X.; Xu, X. On the temporo-spatial variations of the border effects: Approach and empirics. Geogr. Res. 2006, 25, 792–802. [Google Scholar]
  36. Wang, X.; Zhao, Z.; Cao, W.; Wang, S. Study of network characteristics and inter-provincial boundary effect of the Yangtze River Delta urban agglomeration: From the perspective of population flow. Geogr. Res. 2021, 40, 1621–1636. [Google Scholar]
  37. Wang, C.; Liu, H.; Zhang, M. Exploring the mechanism of border effect on urban land expansion: A case study of Beijing-Tianjin-Hebei region in China. Land Use Policy 2020, 92, 104424. [Google Scholar] [CrossRef]
  38. Batty, M. The New Science of Cities; The MIT Press: Cambridge, MA, USA, 2013. [Google Scholar]
  39. Batty, M.; Cheshire, J. Cities as Flows, Cities of Flows. Environ. Plan. B Plan. Des. 2011, 38, 195–196. [Google Scholar] [CrossRef]
  40. Sobolevsky, S.; Szell, M.; Campari, R.; Couronné, T.; Smoreda, Z.; Ratti, C. Delineating Geographical Regions with Networks of Human Interactions in an Extensive Set of Countries. PLoS ONE 2013, 8, e81707. [Google Scholar] [CrossRef]
  41. Ratti, C.; Sobolevsky, S.; Calabrese, F.; Andris, C.; Reades, J.; Martino, M.; Claxton, R.; Strogatz, S.H. Redrawing the Map of Great Britain from a Network of Human Interactions. PLoS ONE 2010, 5, e14248. [Google Scholar] [CrossRef]
  42. Kallus, Z.; Barankai, N.; Szüle, J.; Vattay, G. Spatial Fingerprints of Community Structure in Human Interaction Network for an Extensive Set of Large-Scale Regions. PLoS ONE 2015, 10, e0126713. [Google Scholar] [CrossRef] [PubMed]
  43. Zhang, J.; Liu, X.; Senousi, A.M. A multilayer mobility network approach to inferring urban structures using shared mobility and taxi data. Trans. Gis 2021, 25, 2840–2865. [Google Scholar] [CrossRef]
  44. Liu, X.; Yan, X.; Wang, W.; Titheridge, H.; Wang, R.; Liu, Y. Characterizing the polycentric spatial structure of Beijing Metropolitan Region using carpooling big data. Cities 2021, 109, 103040. [Google Scholar] [CrossRef]
  45. Cheng, Y.; LeGates, R. China’s hybrid global city region pathway: Evidence from the Yangtze River Delta. Cities 2018, 77, 81–91. [Google Scholar] [CrossRef]
  46. Tang, M.; Luo, X.L.; Ying, W.Y. Multi-level governance in the uneven integration of the city regions: Evidence of the Shanghai City Region, China. Habitat Int. 2022, 121, 102518. [Google Scholar] [CrossRef]
  47. The CPC Central Committee; General Office of the State Council. Outline of the Integrated Regional Development of the Yangtze River Delta; People’s Publishing House: Beijing, China, 2019. [Google Scholar]
  48. Wei, L.; Luo, Y.; Wang, M.; Cai, Y.Y.; Su, S.L.; Li, B.Z.; Ji, H.Y. Multiscale identification of urban functional polycentricity for planning implications: An integrated approach using geo-big transport data and complex network modeling. Habitat Int. 2020, 97, 102134. [Google Scholar] [CrossRef]
  49. Cao, W.; Dong, L.; Cheng, Y.; Wu, L.; Guo, Q.; Liu, Y. Constructing multi-level urban clusters based on population distributions and interactions. Comput. Environ. Urban Syst. 2023, 99, 101897. [Google Scholar] [CrossRef]
  50. Liu, K.; Murayama, Y.; Ichinose, T. Exploring the relationship between functional urban polycentricity and the regional characteristics of human mobility: A multi-view analysis in the Tokyo metropolitan area. Cities 2021, 111, 103109. [Google Scholar] [CrossRef]
  51. Rozenfeld, H.D.; Rybski, D.; Andrade, J.S.; Batty, M.; Stanley, H.E.; Makse, H.A. Laws of population growth. Proc. Natl. Acad. Sci. USA 2008, 105, 18702–18707. [Google Scholar] [CrossRef]
  52. Rozenfeld, H.D.; Rybski, D.; Gabaix, X.; Makse, H.A. The Area and Population of Cities: New Insights from a Different Perspective on Cities. Am. Econ. Rev. 2011, 101, 2205–2225. [Google Scholar] [CrossRef]
  53. Javed, M.A.; Younis, M.S.; Latif, S.; Qadir, J.; Baig, A. Community detection in networks: A multidisciplinary review. J. Netw. Comput. Appl. 2018, 108, 87–111. [Google Scholar] [CrossRef]
  54. Rosvall, M.; Bergstrom, C.T. Maps of random walks on complex networks reveal community structure. Proc. Natl. Acad. Sci. USA 2008, 105, 1118–1123. [Google Scholar] [CrossRef] [PubMed]
  55. Ahn, Y.-Y.; Bagrow, J.P.; Lehmann, S. Link communities reveal multiscale complexity in networks. Nature 2010, 466, 761–764. [Google Scholar] [CrossRef] [PubMed]
  56. Fortunato, S. Community detection in graphs. Phys. Rep. 2010, 486, 75–174. [Google Scholar] [CrossRef]
  57. Bohlin, L.; Edler, D.; Lancichinetti, A.; Rosvall, M. Community Detection and Visualization of Networks with the Map Equation Framework. In Measuring Scholarly Impact: Methods and Practice; Ding, Y., Rousseau, R., Wolfram, D., Eds.; Springer International Publishing: Cham, Switzerland, 2014; pp. 3–34. [Google Scholar]
  58. Aldecoa, R.; Marín, I. Exploring the limits of community detection strategies in complex networks. Sci. Rep. 2013, 3, 2216. [Google Scholar] [CrossRef]
  59. Edler, D.; Guedes, T.; Zizka, A.; Rosvall, M.; Antonelli, A. Infomap Bioregions: Interactive Mapping of Biogeographical Regions from Species Distributions. Syst. Biol. 2016, 66, 197–204. [Google Scholar] [CrossRef]
  60. Velden, T.; Yan, S.; Lagoze, C. Mapping the cognitive structure of astrophysics by infomap clustering of the citation network and topic affinity analysis. Scientometrics 2017, 111, 1033–1051. [Google Scholar] [CrossRef]
  61. Yao, Y.; Wang, J.; Hong, Y.; Qian, C.; Guan, Q.; Liang, X.; Dai, L.; Zhang, J. Discovering the homogeneous geographic domain of human perceptions from street view images. Landsc. Urban Plan. 2021, 212, 104125. [Google Scholar] [CrossRef]
  62. Brin, S.; Page, L. The anatomy of a large-scale hypertextual Web search engine. Comput. Netw. ISDN Syst. 1998, 30, 107–117. [Google Scholar] [CrossRef]
  63. Xu, J.; Li, A.; Li, D.; Liu, Y.; Du, Y.; Pei, T.; Ma, T.; Zhou, C. Difference of urban development in China from the perspective of passenger transport around Spring Festival. Appl. Geogr. 2017, 87, 85–96. [Google Scholar] [CrossRef]
  64. Kabir, M.; Salim, R.; Al-Mawali, N. The gravity model and trade flows: Recent developments in econometric modeling and empirical evidence. Econ. Anal. Policy 2017, 56, 60–71. [Google Scholar] [CrossRef]
  65. Huang, L.; Yang, Y.; Gao, H.; Zhao, X.; Du, Z. Comparing Community Detection Algorithms in Transport Networks via Points of Interest. IEEE Access 2018, 6, 29729–29738. [Google Scholar] [CrossRef]
  66. Lu, X.; Yang, G.; Chen, S. An Improved Method to Identify Built-Up Areas of Urban Agglomerations in Eastern and Western China Based on Multi-Source Data Fusion. Land 2024, 13, 974. [Google Scholar] [CrossRef]
  67. Li, K.; Niu, X. Delineation of the Shanghai Megacity Region of China from a Commuting Perspective: Study Based on Cell Phone Network Data in the Yangtze River Delta. J. Urban Plan. Dev. 2021, 147, 04021022. [Google Scholar] [CrossRef]
  68. Zhou, Y.; Yang, C.; Chen, M.; Liu, Y.; Yuan, Q. Commuting versus consumption: The role of core city in a metropolitan area. Cities 2023, 141, 104495. [Google Scholar] [CrossRef]
  69. Wang, C.; Liu, H.; Zhang, M.; Wei, Z. The border effect on urban land expansion in China: The case of Beijing-Tianjin-Hebei region. Land Use Policy 2018, 78, 287–294. [Google Scholar] [CrossRef]
  70. Shanghai Municipal People’s Government; Jiangsu Provincial People’s Government; Zhejiang Provincial People’s Government. Spatial Cooperative Plan of Greater Shanghai Metropolitan Area; Shanghai Municipal People’s Government: Shanghai, China; Jiangsu Provincial People’s Government: Nanjing, China; Zhejiang Provincial People’s Government: Hangzhou, China, 2022. [Google Scholar]
  71. Tordoir, P.P.; van Raan, A.F.J.; Poorthuis, A. Effects of municipal boundaries measured by combining urban scaling and spatial interaction. J. R. Soc. Interface 2023, 20, 20220775. [Google Scholar] [CrossRef]
Figure 1. Spatial distribution of the SSJ area.
Ijgi 14 00133 g001
Figure 2. Method framework of this study.
Ijgi 14 00133 g002
Figure 3. Urban clusters aggregated by activity densities of living, working, and visiting.
Ijgi 14 00133 g003
Figure 4. Spatial distribution of FUCs: (a) commuting network; (b) non-commuting network.
Ijgi 14 00133 g004
Figure 5. Spatial distribution of functional clusters and average proportions of different functions: (a) commuting network; (b) non-commuting network.
Ijgi 14 00133 g005
Figure 6. Spatial distribution of PageRank values: (a) FUCs of commuting network; (b) FUCs of non-commuting network.
Ijgi 14 00133 g006
Figure 7. The spatial structure model of the SSJ area: (a) the theoretical structure in the evaporation stage of border effect; (b) the empirical structure in the evaporation stage of border effect.
Ijgi 14 00133 g007
Figure 8. Provincial border effects on flows among three groups of cities: (a) commuting network; (b) non-commuting network.
Ijgi 14 00133 g008
Table 1. The spatial characteristics of data and principle of functional border delineation.
StudiesSpatial ScaleSpatial UnitsData SourcesPrinciple of Data Clustering
Liu et al. [14]CityRegular gridsTaxi trip-
Zhou et al. [25]CityRegular grids and TAZsMobile phone-
Yin et al. [7]NationalRegular gridsSocial media-
Wang et al. [26]CityCommunitiesTaxi trip-
Yu et al. [27]CityTAZsMobile phoneCommuting activity
Zhang et al. [18]Mega-city regionDistricts/countiesMobile phoneCommuting activity
Liu et al. [28]Mega-city regionDistricts/countiesMobile phone-
Jin et al. [11]CityTAZsMobile phone-
Chen et al. [12]CityTAZsFree-floating bike-
Zhang et al. [17]City regionSub-districtsMobile phoneCommuting activity
Yu et al. [29]Mega-city regionVoronoi polygonsMobile phoneWeekdays and weekends
Liu et al. [15]CityRegular gridsMobile phoneMulti-activity
This studyMega-city regionRegular gridsMobile phoneMulti-activity
Table 2. The data format of mobile users’ residence, workplace and visit place.
Person IDResidence GridWorkplace GridVisit Place Grid 1Visit Place Grid 2
1L_40271L_48611L_50232L_25889
2L_47914L_30998L_56496L_48611
Table 3. The data format of commuting and non-commuting flow density among grids.
Origin (O) Gird IDDestination (D) Grid IDNumber of CommutersNumber of Non-Commuters
L_40271L_48611986
L_40271L_502325218
Table 4. Dummy values of administrative and functional borders variables.
Types of BordersVariablesAdds.Value
Administrative borderProvincial border B a p 1
District/county border B a d 1
Administrative hierarchical gap B a l A i A j
Functional borderFUC border B f 1
Functional hierarchical gap B f l F i F j
Table 5. Dummy values of administrative and functional areas in the SSJ area.
The Rank of Administrative Districts/Counties (A)The Rank of FUCs (F)Value
Districts of provincial-level municipality (districts of Shanghai)Major FUCs2
Districts of prefecture-level cities (districts of Suzhou and Jiaxing)Secondary FUCs1
Counties of prefecture-level cities (counties of Suzhou and Jiaxing)Marginal FUCs0
Table 6. Administrative and functional border effects on commuting and non-commuting flows.
VariablesCommuting FlowsNon-Commuting Flows
Model IModel IIModel IIIModel IVModel IModel IIModel IIIModel IV
Coef.Coef.Coef.Coef.Coef.Coef.Coef.Coef.
Constant0.186 ***
(0.008)
−0.109 ***
(0.008)
0.118 ***
(0.008)
−0.078 ***
(0.008)
1.330 ***
(0.010)
1.190 ***
(0.010)
1.200 ***
(0.010)
1.177 ***
(0.010)
O population0.191 ***
(0.001)
0.215 ***
(0.001)
0.194 ***
(0.001)
0.214 ***
(0.001)
0.118 ***
(0.010)
0.136 ***
(0.001)
0.125 ***
(0.001)
0.136 ***
(0.001)
D population0.151 ***
(0.001)
0.201 ***
(0.001)
0.155 ***
(0.001)
0.200 ***
(0.001)
0.104 ***
(0.010)
0.130 ***
(0.001)
0.111 ***
(0.001)
0.130 ***
(0.001)
Distance0.406 ***
(0.001)
0.669 ***
(0.001)
0.595 ***
(0.001)
0.676 ***
(0.001)
0.428 ***
(0.010)
0.650 ***
(0.001)
0.586 ***
(0.001)
0.642 ***
(0.002)
Province border 1.226 ***
(0.003)
1.235 ***
(0.003)
1.091 ***
(0.003)
1.080 ***
(0.004)
District/county border −0.126 ***
(0.002)
−0.129 ***
(0.002)
−0.020 ***
(0.002)
−0.006 ***
(0.002)
Administrative hierarchical gap −0.119 ***
(0.001)
−0.121 ***
(0.001)
−0.111 ***
(0.002)
−0.109 ***
(0.002)
FUC border −0.002 ***
(0.002)
−0.001 ***
(0.002)
−0.180 ***
(0.003)
−0.043 ***
(0.003)
Functional hierarchical gap 0.015 ***
(0.001)
0.028 ***
(0.002)
−0.019 ***
(0.001)
−0.010 ***
(0.001)
Adj. R20.2760.3930.3050.4090.2830.3750.3150.395
Robust standard errors in parentheses. *** Significant at the 1% level.
Table 7. Province border effects on flows within cross-border FUCs and flows among non-cross-border FUCs.
VariablesCommuting FlowsNon-Commuting Flows
Cross-Border
FUCs
Non-Cross-Border FUCsCross-Border
FUCs
Non-Cross-Border FUCs
Model IModel IIModel IModel IIModel IModel IIModel IModel II
Coef.Coef.Coef.Coef.Coef.Coef.Coef.Coef.
Constant−1.243 ***
(0.026)
−1.113 ***
(0.025)
−0.332 ***
(0.011)
−0.191 ***
(0.010)
0.001 ***
(0.027)
−0.111 ***
(0.026)
0.798 ***
(0.014)
0.881 ***
(0.012)
O population0.305 ***
(0.002)
0.303 ***
(0.002)
0.226 ***
(0.001)
0.233 ***
(0.001)
0.235 ***
(0.002)
0.238 ***
(0.002)
0.147 ***
(0.001)
0.168 ***
(0.001)
D population0.281 ***
(0.002)
0.274 ***
(0.002)
0.174 ***
(0.001)
0.221 ***
(0.001)
0.226 ***
(0.002)
0.239 ***
(0.002)
0.126 ***
(0.001)
0.154 ***
(0.001)
Distance0.796 ***
(0.003)
0.976 ***
(0.003)
0.437 ***
(0.001)
0.841 ***
(0.001)
0.928 ***
(0.003)
1.068 ***
(0.003)
0.437 ***
(0.001)
0.813 ***
(0.002)
Province border 0.764 ***
(0.005)
1.576 ***
(0.003)
0.709 ***
(0.005)
1.617 ***
(0.004)
Adj. R20.4470.5100.3090.4730.5290.5700.2830.450
Robust standard errors in parentheses. *** Significant at the 1% level.
Disclaimer/Publisher’s Note: The statements, opinions and data contained in all publications are solely those of the individual author(s) and contributor(s) and not of MDPI and/or the editor(s). MDPI and/or the editor(s) disclaim responsibility for any injury to people or property resulting from any ideas, methods, instructions or products referred to in the content.

