1. Introduction
Climate change fostered by anthropic activities is recognized worldwide as the main threat to human and non-human life, undermining the basis of human and natural systems [
1]. The energy sector has emerged as the primary focal point for climate mitigation efforts [
2], with national and international policies increasingly geared towards transitioning to a carbon-neutral global economy, including initiatives like the US Inflation Reduction Act, or the European Commission’s REPowerEU plan [
3,
4,
5]. This transition necessitates a substantial expansion of renewable energy sources, particularly wind and solar power [
6]. Projections from the International Energy Agency suggest that by 2028, renewable energy will constitute over 42% of global electricity generation, with wind and photovoltaic energy production expected to double, reaching 25% [
3]. However, the environmental urgency of scaling up renewable energies requires appropriate strategies for safeguarding the planet’s biodiversity and ensuring sustainable human development.
Despite their benefits, renewable energy sources have raised several concerns, particularly regarding their impacts on ecosystems, communities, land occupation, and scenic landscapes at local and regional scales. Potential socio-environmental impacts include habitat fragmentation, soil degradation, water resource depletion, and disturbance to local ecosystems and wildlife. Additionally, large-scale solar panel system arrays on the landscape can be a source of concern for local communities and stakeholders involved in agriculture, tourism, and cultural heritage preservation [
7,
8,
9,
10].
Amid the development of sustainable energy alternatives to cope with these possible impacts of renewable energy production, agrivoltaics systems (hereafter agriPV) are gaining momentum worldwide as a promising solution to address the growing demand for renewable energy and food security. In these dual-purpose installations, photovoltaic panels are strategically elevated at a significant height above the ground, typically several meters, or sufficiently interspaced. This deliberate positioning creates a spacious area underneath or between the panels, allowing for the continuation of conventional farming practices while simultaneously reducing carbon footprint and increasing economic opportunities for farmers [
11,
12,
13,
14]. Yeligeti [
15] recently estimated a global potential of 217 Terawatts production on 4.64 million km
2 of agricultural lands, according to the feasibility and profitability of several crops. However, the implementation of these projects, particularly in the form of large-scale industrial ones, could perpetuate most of the significant environmental and social impacts mentioned above, if not properly planned and managed. Although scientific investigations and currently implemented projects are promising in reducing competition for land and safeguarding food security, and while other potential benefits for crops such as reduced water evaporation, heat stress mitigation, and protection from extreme weather are encouraging [
13,
14,
16], from a social perspective, the siting of agriPV is not exempt from conflicts with local communities if their concerns and values are not adequately considered. Issues such as land-use changes, potential impacts on traditional agricultural practices and agroecosystems or nearby natural and semi-natural ecosystems, and the perceived disruption of rural landscapes can generate opposition and hinder project acceptance [
17,
18].
Consequently, there has been a growing interest in developing suitability analyses and maps and identifying the best site locations for agriPV projects, together with the analysis and definition of areas socio-culturally and environmentally sensitive [
19] to the potential impacts of these projects, with the aim of minimizing potential conflicts and impacts and addressing agriPV to the right places.
Recent research in this field has employed a combination of Geographic Information Systems (GIS) and Multi-Criteria Decision Analysis (MCDA, hereafter spatial MCDA or sMCDA) methodologies, by overlaying and weighting diverse geographical criteria: most investigations, related to ground-mounted PV or agriPV, combine technical and economic factors, such as solar energy potential, crop production, and closeness to power lines and/or socio-cultural and environmental aspects, such as protected areas, urban centers, and cultural heritage sites [
11,
20,
21,
22,
23].
Singh Rathore and Kumar [
24] highlighted the significant and yet underutilized potential of GIS, broadly speaking, in supporting all phases of Environmental Impact Assessment (EIA) studies, typically mandatory for agriPV projects, ranging from initial screening to the comprehensive evaluation of visual, environmental, and social impacts.
sMCDA can also incorporate experts’ opinions, stakeholder engagement, and public participation processes, ensuring that the concerns and values of local communities, environmental organizations, and other relevant stakeholders are taken into account.
Within the European efforts for decarbonization, for Italy, one of the European nations that is consolidating itself as a major player in solar energy growth thanks to its geographical position, it is crucial to establish effective regulation for the renewable energy sector in a historical moment of exponential growth of project proposals, fueled by European funding. In 2021, Legislative Decree 199, transposing Directive (EU) 2018/2001 on the promotion of renewable energy resources (RES), introduced the concept of solar belts as part of Italy’s strategy to accelerate the development of renewable energy. Solar belts are preferred areas identified by technical and environmental criteria for the installation of agriPV systems, which benefit from an expedited authorization process [
25].
Recently, the issuance of two new key decrees between May and June 2024 [
26,
27] marks a fundamental step in the regulatory framework for RES installations, defining agriPV projects as the unique kind of photovoltaic RES permitted in agricultural lands and delegating sub-administrative units to define suitable areas. In particular, the Ministerial Decree of 21 June 2024, which entered into force on 3 July, set a deadline of 180 days for the adoption of regional laws on ‘suitable areas’, which expired in the first week of January 2025. However, as of the date of this study (September 2024), only five regions (Calabria, Lombardy, Piedmont, Apulia, Sardinia) of 22 had legislated on suitable areas, leaving the mapping incomplete and continuing to represent a significant obstacle [
28].
Current regulations still only provide written texts without including official regional or sub-regional maps. In the absence of these, private operators are forced to independently prepare and submit their project plans, along with the necessary documentation for EIA, exposing the process to the risk of inaccuracies and divergent interpretations, causing delays.
Lately, Fattorusso [
20] has proposed a methodology for agriPV land eligibility analysis using sMCDA at Italian regional scale, highlighting the necessity to investigate sMCDA methodologies and explore criteria useful to make agriPV sustainable not only as a food–energy nexus but also considering social and cultural aspects and the surrounding landscape.
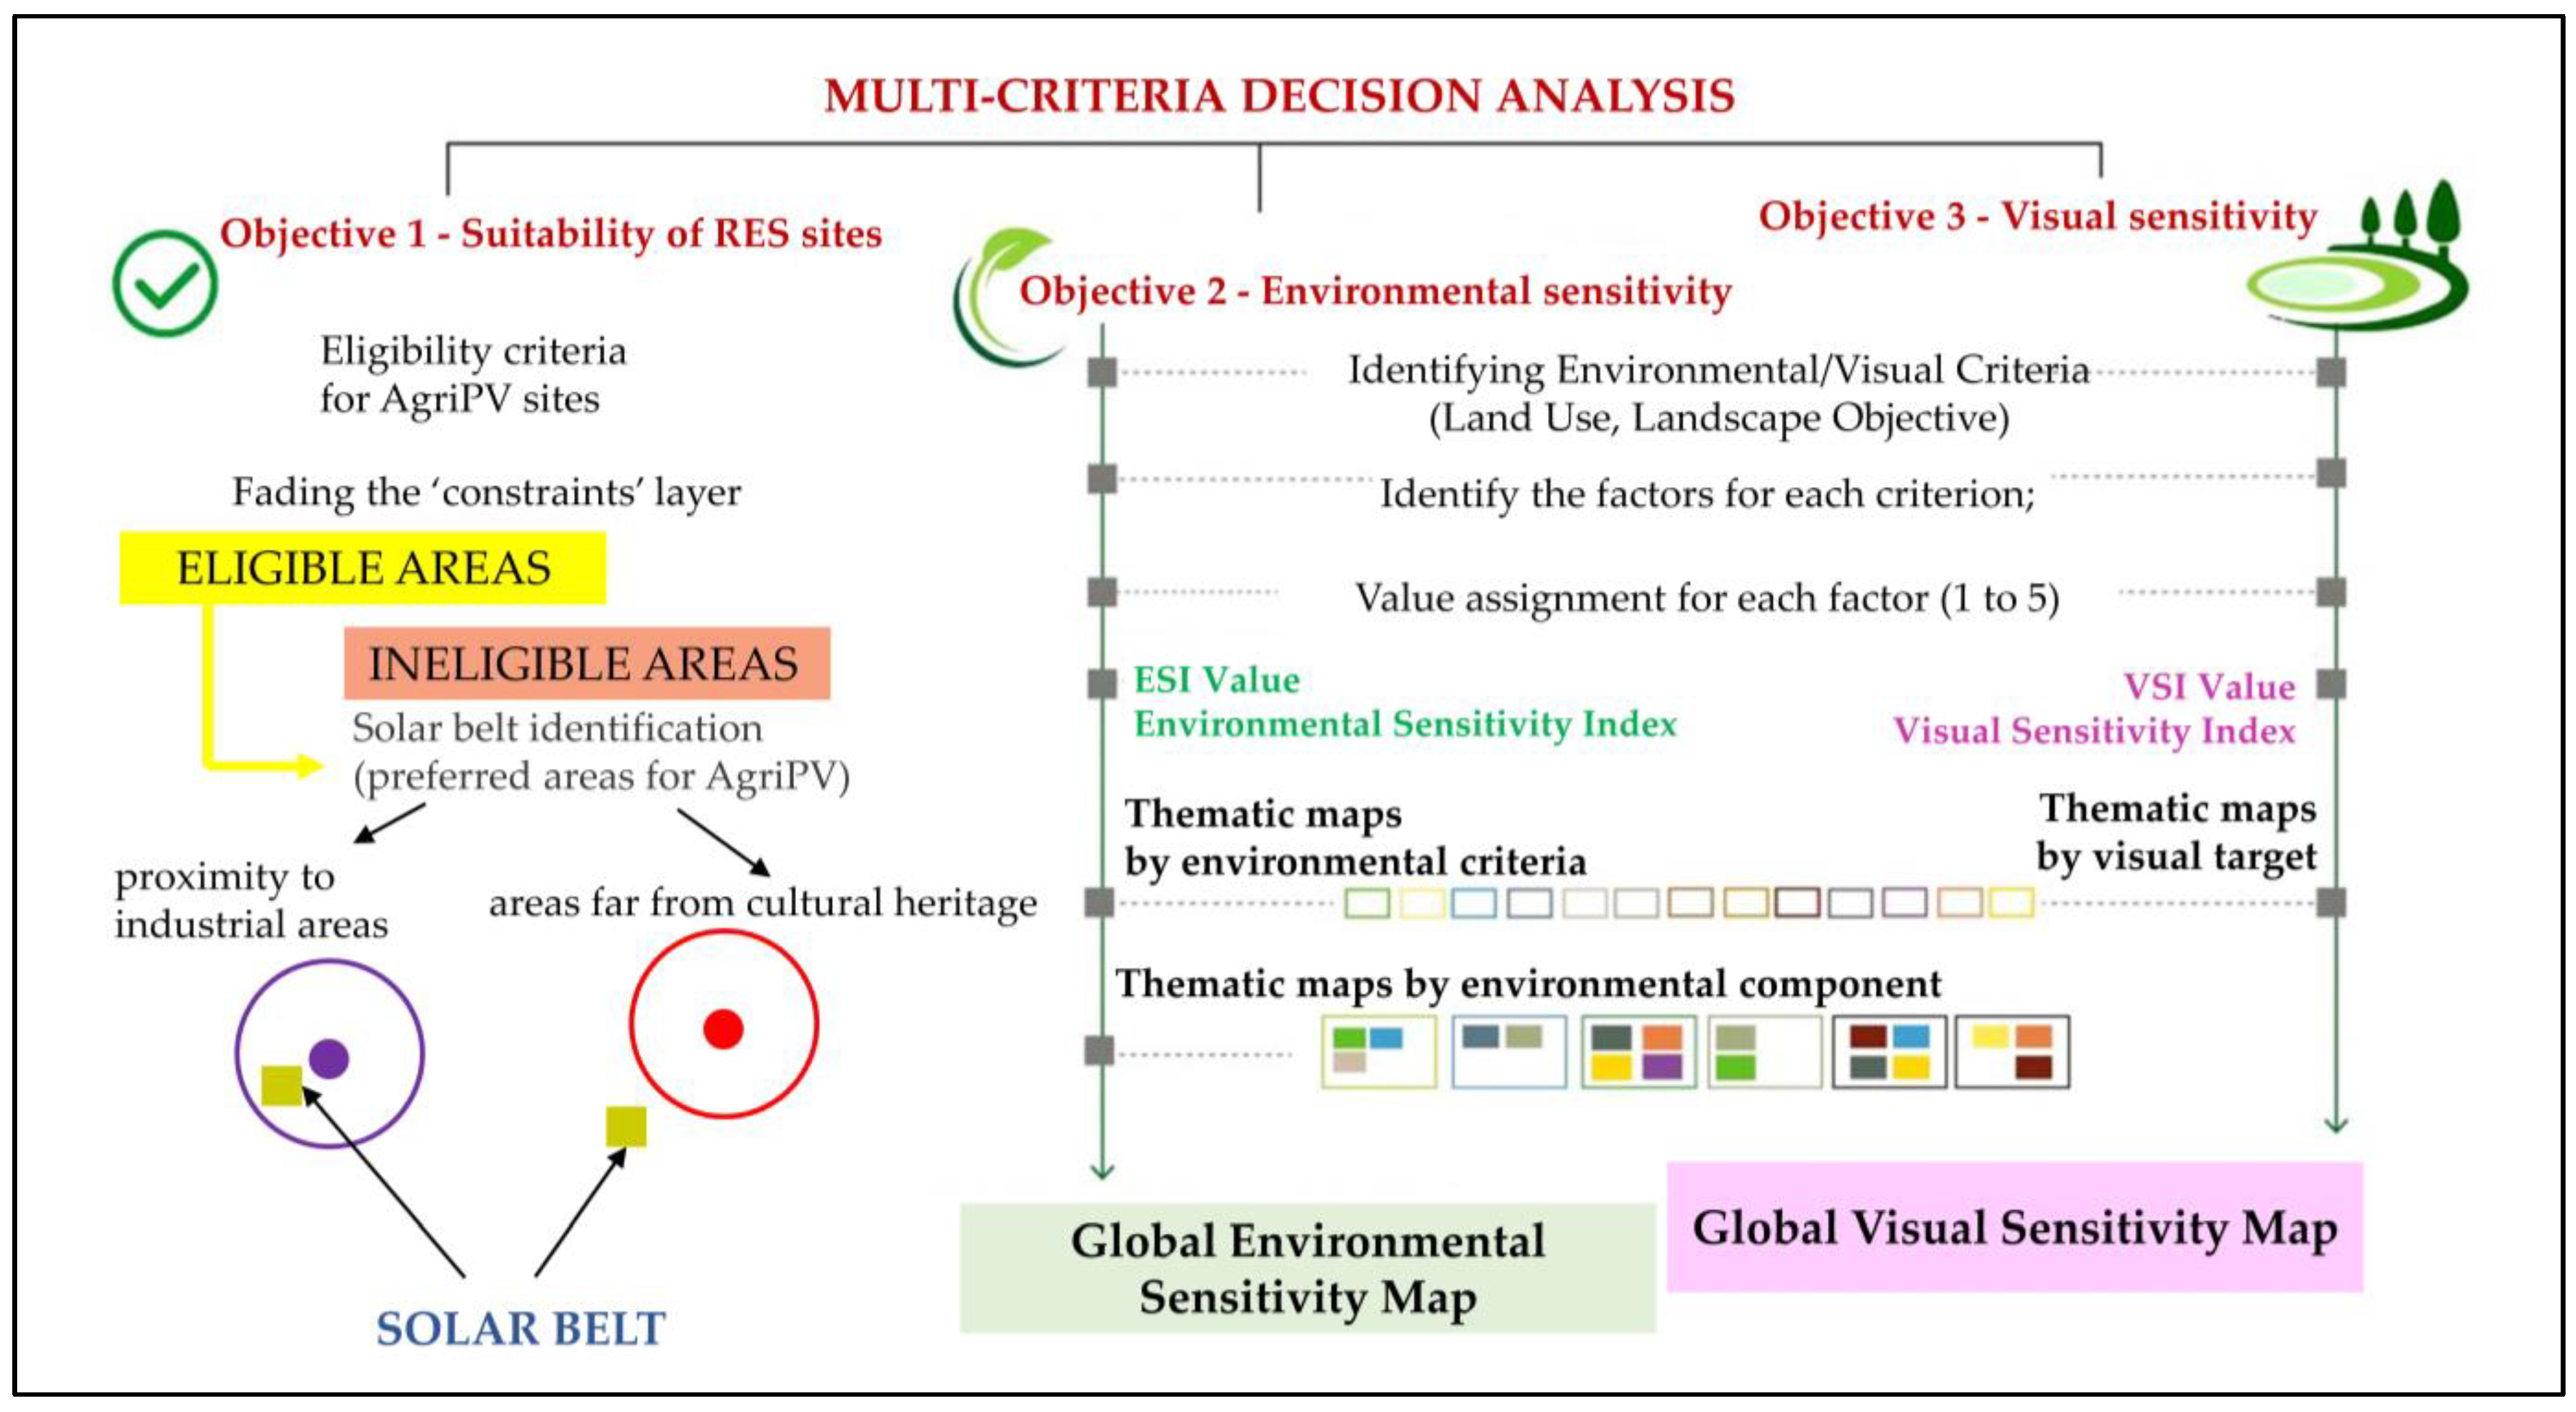
In this framework, the main objective of this study is to develop and test a replicable methodology for assessing and mapping suitable areas for agriPV siting in the Italian territory, considering aspects of environmental and visual sensitivity. Specific objectives are to (1) develop a methodology for assessing suitability of a territory according to legislation; (2) develop a methodology for assessing environmental sensitivity to agriPV projects; (3) develop a methodology for assessing visual sensitivity to agriPV projects; and (4) test and validate the proposed methodologies using the Viterbo province (Lazio region) as a case study.
2. Materials and Methods
This research uses a combination of geospatial data and analysis, thematic maps, and sMCDA to identify areas suitable for the installation of agriPV projects. This is achieved by defining suitable belt areas based on Italian legislation (objective 1 in
Figure 1) and integrates both environmental (objective 2 in
Figure 1) and visual sensitivity (objective 3 in
Figure 1) analysis.
The process begins with the collection and analysis of data, which are then integrated into the open-source GIS software QGIS (version 3.28) [
29] to create spatial models that serve as the basis for further spatial analyses. The database for the project consists of an open-source spatial dataset, incorporating information available for most Italian regions. To ensure comparability, the datasets were reprojected to the EPSG: 32633–WGS 84/UTM Zone 33N reference system. Spatial overlay and distance analysis were performed using geoprocessing functions such as difference, buffering, and clipping, within the boundaries of the study case, i.e., the Viterbo province (objective 4).
2.1. Workflow for Suitability Areas, Environmental and Visual Sensitivity Mapping
Figure 1 shows the workflows diagram. We extensively used the QGIS model designer tool, which allows chaining several geo-operations in a unique model (hereafter GIS model) to simplify the workflows for criteria and index production and easily adapt the procedure to different contexts and changes in legislation.
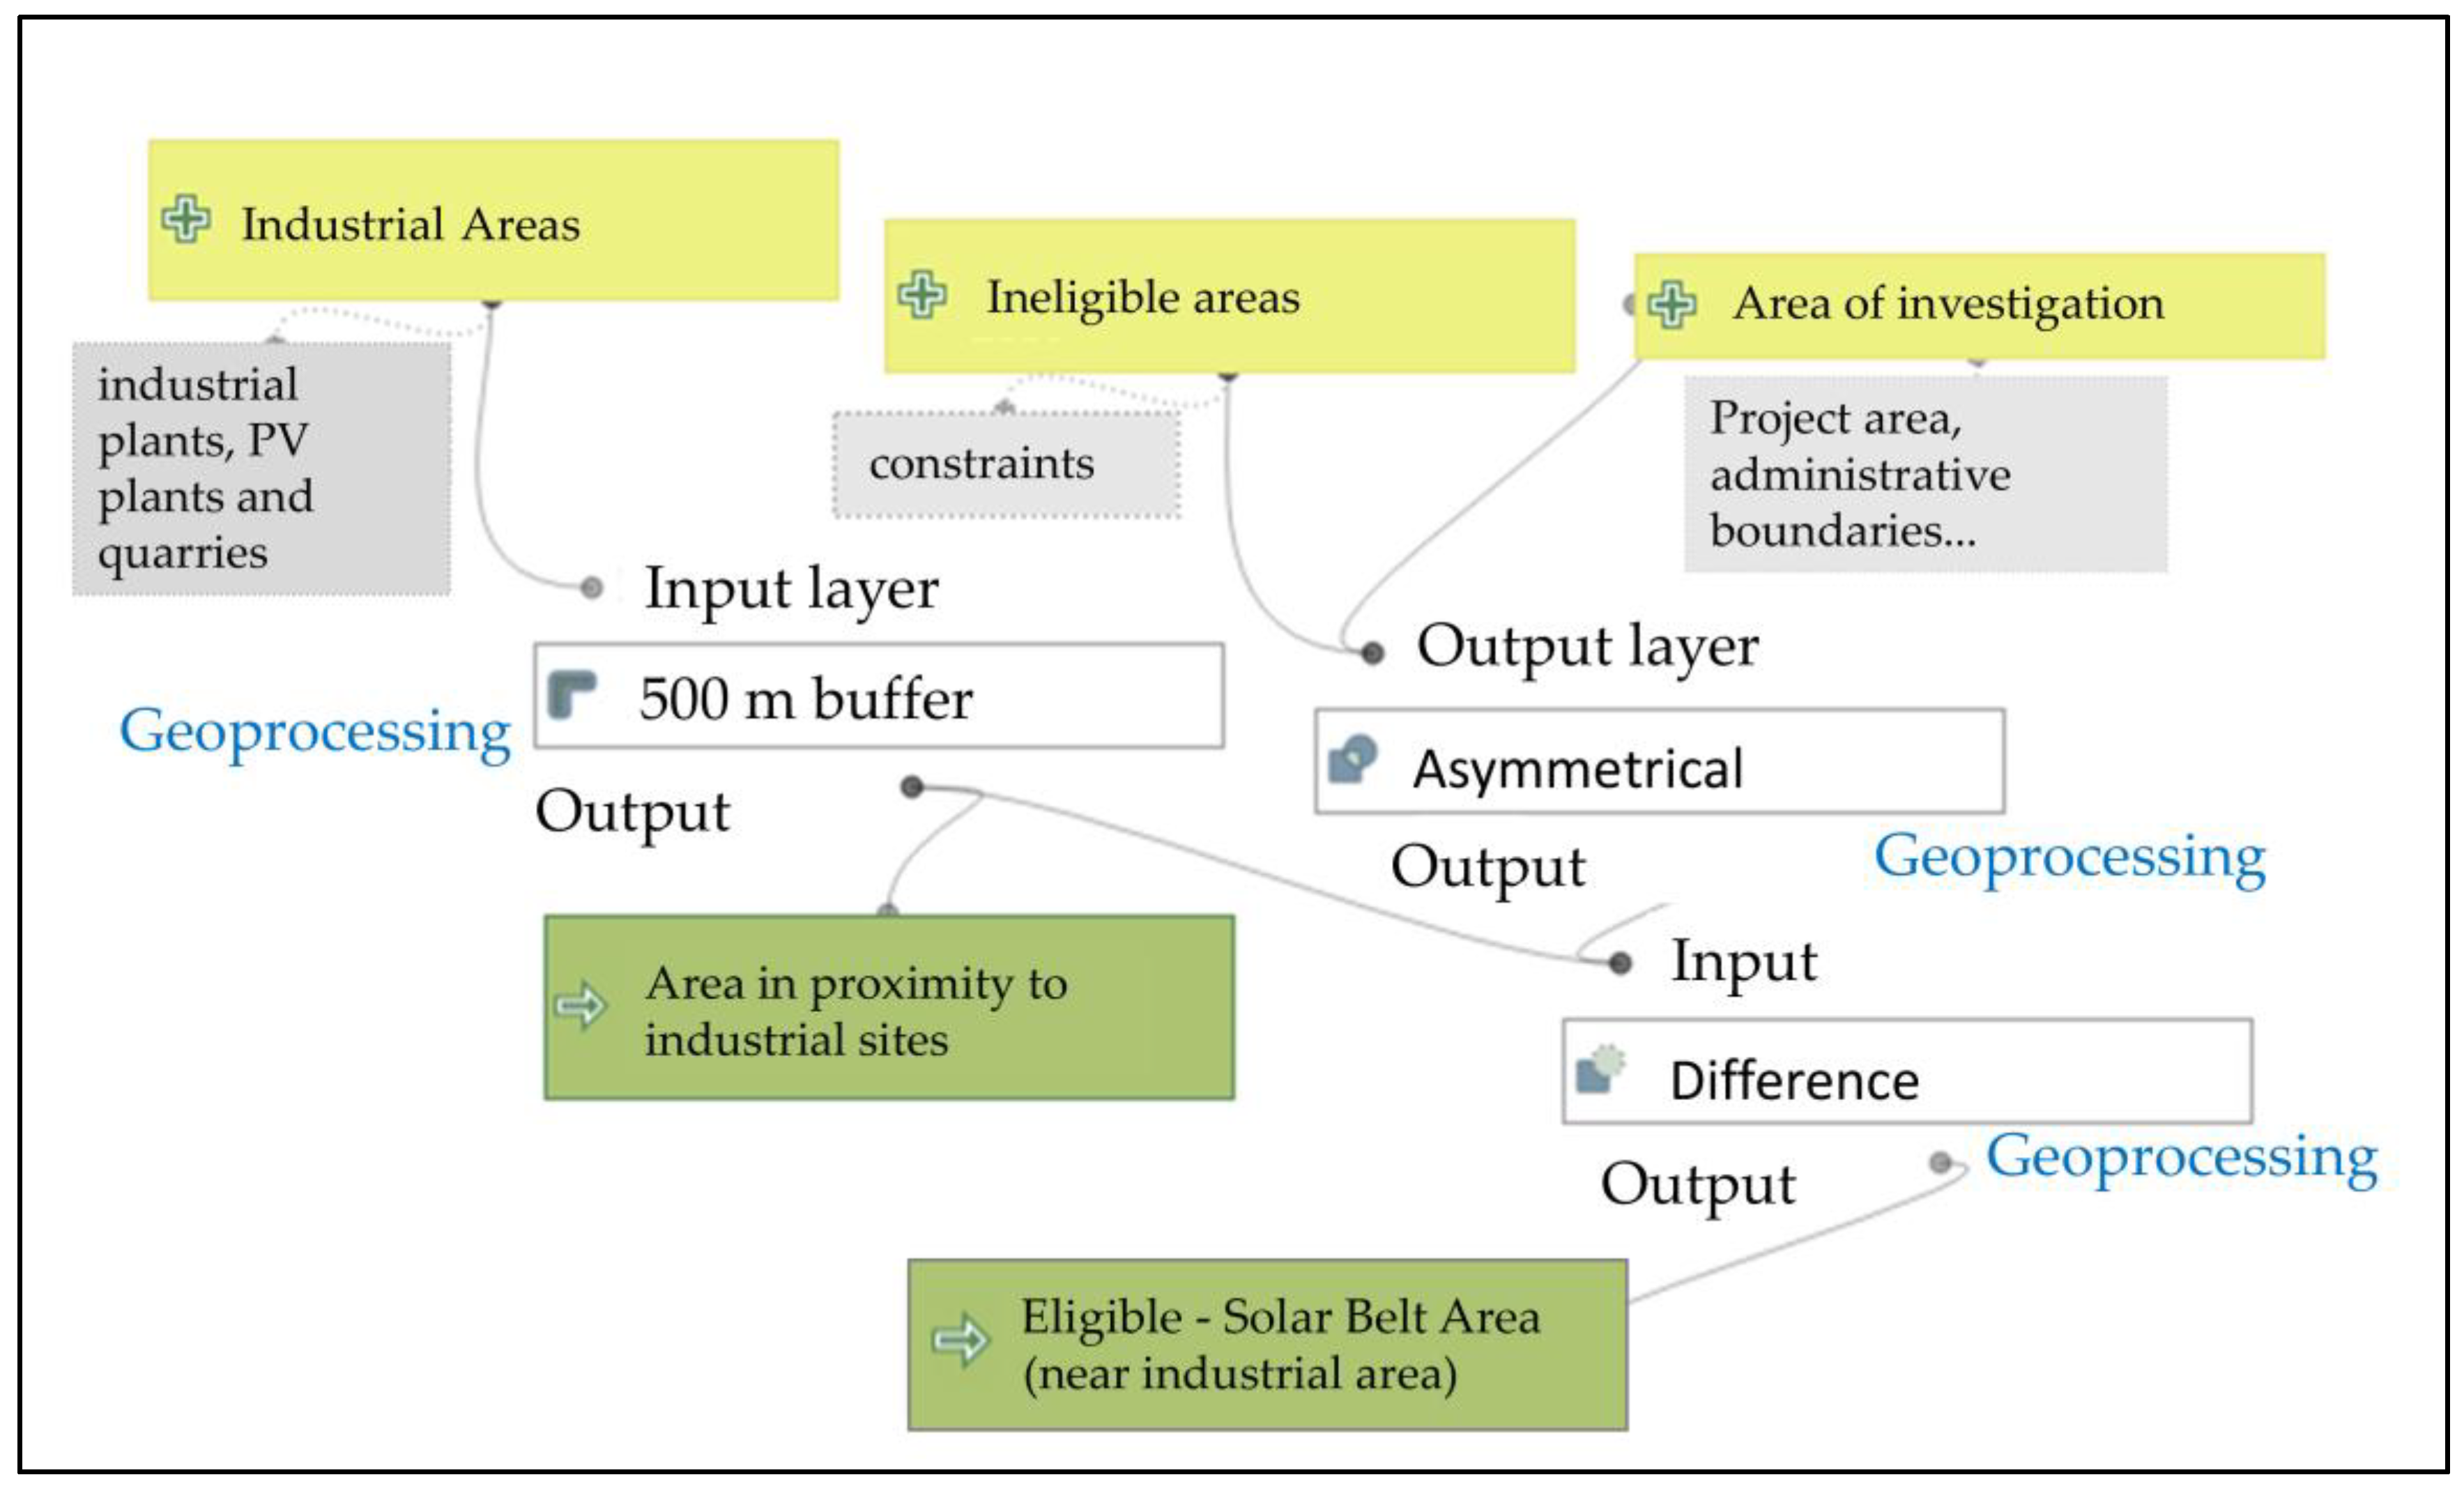
To achieve the first objective, a workflow was developed to identify the solar belts for the installation of agriPV plants in compliance with Italian legislation, on the basis of key criteria such as distance from industrial zones and the absence of landscape constraints.
To assess the environmental sensitivity (second objective) of potential sites with the least impact for the construction of agriPV, a mapping process was conducted using a set of environmental criteria, including biodiversity protection, soil and subsoil quality, water resources, and landscape.
Each criterion was assigned a numerical value on a scale from 1 (less sensitive) to 5 (highly sensitive), known as the Environmental Sensitivity Index (ESI, see
Table 1). This scale, calibrated on the basis of the experience of industry professionals and sectoral guidelines [
30], facilitates the identification of the most sensitive areas, enabling the planning of appropriate mitigation measures to minimize potential environmental impacts. Additionally, progressive buffers were established around the most sensitive resources, ensuring further protection from disturbances related to the installation of renewable energy systems.
The assessment of the visual impact (objective 3) of an agriPV system was conducted in accordance with the Ministry of Culture’s guidelines [
31]. The analysis focused on key elements of visual sensitivity, identifying and mapping three main components: scenic roads, historic centers, and urban areas. Geoprocessing with progressive buffers were applied to these elements. A Visual Sensitivity Index (VSI) on a scale from 1 to 5 (see
Table 1) was assigned to each component to quantify the landscape value and the potential visual impact of the proposed intervention.
To standardize and quantify the data, each vector factor was then converted into raster maps of the same spatial resolution (100 × 100 m), based on the values from 1 to 5 assigned to each raster cell. This process identifies homogeneous areas, measurable in hectares (the standard commercial unit in the energy sector). Finally, criteria were combined using the linear weighted sum method, one of the most used methods in sMCDA, which combines multiple criteria scores by assigning weights to each criterion and summing the products, providing a straightforward approach to evaluate and rank alternatives based on their overall performance across various factors [
32].
To conclude the process, a global assessment tool was designed to facilitate the comparison of results for decisionmakers. A single database was created in QGIS by calculating the average value of all pixel values for each factor and for EVI and ESI and the percentage of suitable or not suitable land for agriPV plant installation within each municipality of Viterbo Province. To preserve the nuances associated with local specificities, it was decided not to round the values but to retain the decimal points. This approach enables the comparison and functional ranking of the results among the 60 municipalities.
2.2. Study Area and Data Input
To test the methodology outlined, the province of Viterbo (Lazio region, see
Figure 2, while the geographical framework of the province is available in
Figure S1 of the Supplementary Materials) was selected as a case study (objective 4), as it serves as an exemplary case of territorial conflict between environmental protection and the goals of agriPV projects.
The Province of Viterbo, currently a central hub for renewable energy development in Italy, ranks first among Italian provinces in terms of the highest installed power per capita, with 2.49 kW per person. Additionally, it accounts for 80% of the renewable energy measures approved in the Lazio region in 2023 [
33].
The potential associated with the area’s high solar radiation can be found in
Figure S31 of the Supplementary Materials related to the latest research from the Italian National Agency for New Technologies, Energy and Sustainable Economic Development (ENEA) [
34].
The province covers an area of 3615 km
2 with a population of 308,187 and is characterized by low population density (85 inhabitants/km
2), one of the lowest in the region (300 inhabitants/sq km) and in the country (200 inhabitants/km
2) [
35]. The distribution of land use in the Province of Viterbo is characterized by the predominance of agricultural areas (about 70%), followed by woods and forests (about 25% of the province and 21% of Lazio). Built-up areas and infrastructure occupy a smaller percentage of the territory, about 5%, according to land use land cover (LULC) updated in 2018 (see
Table 2).
While this situation highlights the great potential of the area, it has also led to growing tensions between institutions, citizens, and operators in the sector. The high potential of the territory for renewable energy production is in conflict with the need to protect valuable environmental and landscape heritage. In the case under consideration, approximately 68% of the area is constrained, creating a complex situation where different interests are pitted against each other.
Table 2 summarizes the main dataset used for the construction of the geodatabase of the study area, including sources, format, publication year, and the level of detail of the original data. For a detailed presentation of the dataset used, please refers to the
Tables S2–S5 contained in the section ‘Detailed information of
Table 2’, ‘Input data for the configuration of the Territorial Database’ in the
Supplementary Materials.
3. Results
This section has been divided into three parts, corresponding to the three objectives of the project, using the case study of Viterbo province (obj. 4) as an example of the possible results produced by the analysis.
3.1. Suitability of AgriPV Sites and Solar Belt
The first model identifies suitable land located in priority areas related to the proximity of industrial installations. The main steps of the process are as follows:
Step 1. Identification of spatial constraints (unsuitable areas), including protected areas, nature parks, nature reserves, and other restricted areas. The constraints were merged into a single dataset representing the ‘unsuitable areas’ (
Figure S3 of the Supplementary Materials).
Step 2. Data extraction (industrial zones): data on industrial plants were extracted from the productive plants category of the LULC of the Lazio region. These data constitute the starting point for the creation of the buffer and the subsequent spatial analysis (
Figure S1 of the Supplementary Materials).
Step 3. Buffer creation: a 500 m buffer was created around the industrial plants. This buffer helps identify areas around industrial plants that, according to the regulations, are suitable for the installation of agriPV systems.
Step 4. Subtraction of constraints from the study area: once the dataset of non-suitable areas was created, a subtraction process was carried out with the entire study area. This resulted in the identification of suitable areas for the installation of agriPV systems (
Figure S2 of the Supplementary Materials).
The second graphic model refers to another criterion established by the Italian legal framework, which identifies preferential areas for agriPV systems in the absence of cultural assets. To this end, data on cultural assets from the Regional Territorial Landscape Plan and the Ministry of Culture’s Webgis were integrated.
The resulting areas, which have no constraints and are located within the industrial plants buffer or sufficiently far away from historical elements, were named the solar belts.
A map of areas potentially suitable for the installation of the agriPV System for Viterbo province was then drawn up by applying the two graphic models and on the basis of the legislation in force at the time of the analysis (an extract of the map is shown in
Figure 4; the whole map is presented in
Figure S4 of the Supplementary Materials). It is important to note that the RES legislation in Italy is constantly evolving, and the use of models allow the adaptability and replicability in different contexts and according to future changes in Italian regulations. In fact, for example, the decree (Ministerial Decree of 21 June 2024) requires regions to define their own buffer zone (ranging from 500 m to 7 km) around cultural heritage sites, with the current standard set at 500 m.
Maps such as the one shown in
Figure 4 can provide a useful tool for various stakeholders: from investors who can quickly visualize where to prioritize investments, to environmental consultants who can clearly identify areas with simplified authorization procedures, to local public authorities for their planning activities. The solar belts close to industrial zones offer a unique combination of logistical benefits such as utilizing existing grid connections or repurposing brownfield sites.
3.2. Environmental Sensitivity
To assess environmental sensitivity (Objective 2), 14 thematic maps were developed using specific criteria to analyze the different environmental components that contribute to environmental impact assessment in the European context.
The factors and criteria were defined based on two main approaches:
the progressive spatial distance from a specific target
the intrinsic characteristics of landscape areas or land use, as identified in regional or national planning maps.
In the first approach, and in the absence of specific regulations defining protection and attention buffers for areas adjacent to sensitive features such as protected zones, this study has opted to adopt the 500 m buffer measure and its multiples and submultiples, in line with the provisions of Legislative Decree 199/2021 and the Decree on areas suitable for RES plants. These sectoral regulations have established that this minimum distance represents an optimal compromise in social, functional, environmental, ecological, and visual terms to ensure a balanced coexistence between the construction of agriPV installations and the protection of the analyzed features [
31].
Regarding the second approach, even if agriPV projects deal with agricultural areas, in the analysis we considered some non-agricultural land covers, such as urban or semi-natural areas, as factors and not as constraints. This is necessary because of the spatial scale used to produce land-use and land-cover data or landscape categories by public administrations, which usually range between 1:10,000 and 1:100,000, and could include smaller agricultural spaces in other dominant classes, where agriPV projects could be proposed.
The following paragraphs present the workflows for the production of the individual thematic maps and their ESI value, which were then combined to produce the global maps, providing a more comprehensive overview. The datasets refer to the details provided in
Table 2 and
Tables S2–S5 in the Supplementary Materials.
3.2.1. Proximity to Protected Areas
The installation of agriPV systems requires careful consideration of proximity to protected areas. Although Italian regulations prohibit installation within these areas, they do not provide specific guidelines for the surrounding zones, making case-by-case analysis necessary. Specifically, for the case study, it is highlighted that the Viterbo province has an environmental and ecological heritage of great value, characterized by a variety of landscapes and a rich biodiversity. The province is home to 22 protected natural areas, including regional parks, nature reserves, and wetlands of international importance.
These areas protect a rich variety of habitats, including forests, lakes, volcanoes, coastal areas, and marshes. Sensitive areas and their ESI values were identified through the creation of three buffer zones from protected areas:
- -
1500 m–1001 m (ESI value = 1): Areas located between 1501 m and 1001 m from a protected area are assigned a lower ESI value of 1. These areas are considered less sensitive in terms of their proximity to protected zones, likely because they are farther from areas under direct conservation management and may be less impacted by protection measures.
- -
1000 m–501 m (ESI value = 3): As the distance decreases to between 1000 m and 501 m, the ESI value increases to 3. Areas within this range are more sensitive because they are closer to protected areas, meaning they are more likely to be influenced by the conservation measures in place. These zones could experience higher ecological pressure or benefits from the adjacent protected areas.
- -
500 m–1 m (ESI value = 5): Finally, areas located within 500 m of a protected area are assigned the highest ESI value of 5. These areas are considered the most sensitive, as they are immediately adjacent to or within very close proximity to areas that are actively managed for conservation. These areas may experience the most direct ecological impacts from the protected zones, both positive (e.g., biodiversity conservation) and negative (e.g., human encroachment or disturbance from adjacent areas).
This gradation of ESI values reflects increasing environmental sensitivity as one approaches protected areas. It highlights the importance of considering proximity to conservation zones when evaluating the environmental impact or risk of human activities in a given area. The map for this criterion is presented in
Figure 5a and is included in the
Supplementary Materials as Figure S5.
3.2.2. Proximity to the Forest and Natural System
In Italy, the installation of agriPV systems is prohibited within forested areas, though no regulations exist for the surrounding areas. Therefore, it is crucial to establish an ESI to determine the design parameters for agriPV systems based on the progressive distance from forested areas.
The forest system in the Viterbo province is a complex ecosystem that includes woods, forests, wooded areas, and arable land with trees. It is predominantly covered by oak, beech, and chestnut forests.
Most of these forests are protected by the Ministry of Culture due to their intrinsic environmental and landscape value. The implementation of renewable energy projects near wooded areas is a potential environmental impact that must be carefully managed. This can be achieved by preparing specific measures during the construction phase, as well as through targeted landscape design when selecting mitigation strategies. These measures ensure alignment with the tree and shrub species native to the area.
The assignment of the ESI index was carried out according to the procedures outlined in the previous paragraph for protected areas, based on progressive distance from the original LULC data representing the forest system
Figure S6 of the Supplementary Materials).
3.2.3. Hydrogeological and Geomorphological Structure
For the characterization of the hydrogeological and geomorphological risk factors, vector data from the Central Apennine Basin Authority website in Italy were used. The classification of risk and vulnerability in the different basins of Lazio region proved to be challenging (a detailed overview is provided in
Table S4 in the Supplementary Materials). The ESI values for various environmental factors are assigned as follows:
- -
Geomorphological Hazard–Areas to be Attended: These areas are assigned an ESI value of 3, indicating a moderate level of sensitivity that requires attention in terms of environmental management or mitigation strategies.
- -
Medium Hydraulic Hazard: Areas identified as having a medium hydraulic hazard are assigned an ESI value of 4, reflecting a higher sensitivity that calls for careful consideration and measures to minimize potential environmental impacts.
- -
High Geomorphological and Hydraulic Hazard: Areas categorized as high geomorphological or hydraulic hazard are classified as constraints, meaning they are highly sensitive and require stringent protection or management measures to prevent environmental degradation. The map can be consulted in
Figure S7 of the Supplementary Materials.
3.2.4. Land-Use Classification
The assessment is based on the dataset of the LULC of 2018. The criterion used to assign a different sensitivity value to each land-use category is essentially based on the value of each area. Particular attention has been paid to orchards because, despite the fact that agriPV projects allow for the relocation of tree elements, orchards, together with wooded areas and natural environments, represent an important resource to be protected. The ESI indices have been identified as indicated in
Table 3 (map available in
Figure 5b and in
Figure S8 of the Supplementary Materials).
3.2.5. Land Capability Class
This classification, which takes into account the physical and chemical characteristics of soils and the environmental context [
36], was used to identify areas unsuitable for hosting agriPV installations, in line with regional guidelines. This map is based on the Land Capability Map of the Lazio region, which divides soils into eight classes, where class I has the highest quality and class VIII the lowest. ESI values have been assigned in a progressive manner, starting with classes V, VI, VII, and VIII of lower quality with ESI 1, class IV with ESI 2, class III with ESI 4, and class II with ESI 5, considering class I as the constraint factor (
Figure S9 of the Supplementary Materials).
3.2.6. Proximity to the Water System
The sensitivity of the area was considered proportional to the distance from water bodies. The dataset was created by combining layers from the regional technical map of the Lazio region. The ESI index was assigned progressively from 1 to 5, with 100 m intervals up to a distance of 500 m. The original data were derived from the hydrological grid (including primary and secondary watercourses) available within the shapefiles of the Lazio region’s Landscape Plan (
Figure S10 of the Supplementary Materials). Sensitivity buffers started from the end of the constrained zones around water courses established by law. In fact, the regulations establish an inviolable buffer zone of 150 m from main rivers and 10 m from minor watercourses.
3.2.7. Ecological Network
The areas of highest ecological value have been identified based on the regional ecological network plan of 2021. The network is an essential part of the regional plan of protected natural areas. The main objective is to highlight the areas of greatest naturalness and the connections between them for the purpose of establishing new protected areas and environmental assessments. The three main elements of the regional ecological network, as identified in the official documents, are as follows.
- -
Primary central areas: these are large natural areas with high functional and qualitative value for maintaining the vitality of target populations. They form the backbone of the ecological network. Primary core areas are characterized by centrality and are typically large in size, capable of supporting populations with high biodiversity and significant numbers. This helps reduce the risk of extinction for the populations, while also serving as a crucial source of dispersal for mobile individuals that can colonize (or recolonize) new external habitats.
- -
Secondary central areas: these areas, while still important for the overall ecological network, tend to be smaller or less central than primary core areas. They support biodiversity and contribute to the resilience of the system, but they may not have the same extensive functional role in supporting large populations. Secondary core areas play a supplementary role in linking and reinforcing primary core areas, contributing to habitat connectivity and acting as refuges for species, especially during periods of environmental stress or change.
- -
The connecting areas refer to the identified zones linking primary and secondary core areas, aligned with the specific ecosystem functions of areas important for forest species and open habitat species.
With reference to the hierarchy established by the ecological network plan of the Lazio region, the following evaluations have been assigned: the connecting areas were assigned an ESI value of 3, the central secondary areas (core) a value of 4, and the primary central areas (core) a value of 5. The choices are in line with the regional indications of the importance of the roles of the areas considered (
Figure S11 of the Supplementary Materials).
3.2.8. Landscape Areas
The evaluation of this factor is based on the landscape areas defined in the Lazio landscape plan. The landscape system has been established according to the type, significance, and integrity of the landscape values present. These landscape areas form, through their morphological and geographical continuity, systems of homogeneous and recognizable elementary units within the territorial context. The map is available in
Figure S12 of the Supplementary Materials.
Table 4 shows the ESI values to the landscape components.
It is worth briefly introducing a discussion on high-value protected agricultural products, such as PDO (Protected Designation of Origin), PGI (Protected Geographical Indication), and DOC (Controlled Designation of Origin), among others. These designations should be included as additional criteria in the ESI analysis. However, the dataset available for the Lazio region is provided at a scale of 1:250,000, but for the specific needs of this study, which involves provincial-level analysis, a maximum scale of 1:25,000 is required. In the guidelines for agriPV plants, the Lazio region specifies that, for areas of high value, which have been analyzed at a scale of 1:250,000, detailed studies are required for an accurate assessment of individual cases.
3.2.9. Exposure
Exposure, understood as orientation to the points of the compass, is a key factor for soils. It includes a number of elements that influence the amount of solar radiation a soil receives, the microclimate that is created and, consequently, the fertility and productivity of the soil itself. Exposure acts in terms of degradation of soil structure, drought, or excessive soil erosion and affects the environmental sensitivity of a soil.
The exposure map is based on the Digital Terrain Model (DTM) at 10 m of spatial resolution. The ESI values have been assigned according to orientation (
Table 5).
In the case of agriPV systems, it is noted that south-facing exposure would offer an advantage for the system’s productivity. At the same time, increased exposure results in more sensitive soils. In this context, a high sensitivity index was assigned, as these areas require careful consideration during the design phase. The thematic map for the exposure factor is included in the
Supplementary Materials (Figure S13 of the Supplementary Materials).
3.2.10. Slope
Slope is an influential factor in the identification of areas of special ecological and environmental suitability, as the degree of slope depends on the function of water regulation and the risk of soil erosion.
Table 6 shows the five ESI classes with increasing values as slope increases, in proportion to the environmental sensitivity of the terrain. This environmental sensitivity is also inversely proportional to the complexity of implementing RES installations, especially in the case of large-scale installations such as agriPV. The classification is based on a combination of industry bibliography and professional experience. The thematic map for this factor is included in the
Supplementary Materials in Figure S14.
3.2.11. Home Range and Core Areas of Mammals as a Function of Protection Level
Nesting sites and the presence of sensitive species must be protected, with designs carefully planned to minimize disturbance to wildlife.
The evaluation of the presence of mammals was performed processing the point datasets obtained from the Lazio mammal atlas project [
37], a valuable resource providing information on the distribution and conservation status of species in the region. To create area layers, we performed the Kernel Density Estimation (KDE) method [
38]. This method allows for estimating the probability of an animal’s use of an area. In the KDE analysis, two percentage thresholds, 95% and 50%, are used to distinguish two areas within the territory frequented by an animal: the core area and the home range.
The core area represents the zone of maximum use by the animal, where the majority of its activity takes place, while the home range includes the entire area used by the animal for its movements and activities. The home range encompasses all areas where there is even a minimal probability of finding the animal. This condition is influenced by factors such as food, water, shelter availability, and the presence of predators or competitors. The application of the KDE method was carried out using a model builder available on sector-specific websites, updated in 2022 [
39].
The ESI values assigned to home range and core areas are shown in
Table 7. In this context, even non-protected species were assigned a level 1 of ESI.
3.2.12. Home Range and Core Areas of Micromammals
The management of a renewable energy facility requires a careful approach to wildlife conservation, particularly microfauna. Although areas designated for agriPV systems are often already fenced off, limiting the impact on larger species, microfauna, such as small mammals and insects, are highly mobile and more vulnerable to changes in land use. It is therefore essential to identify the main preferred corridors of microfauna so that the links to be protected can be considered at the design stage.
Starting from the data and the procedure described in the previous paragraph, the data that could be attributed to the home range of the micromammals were selected and processed into a new dataset to produce the map in
Figure 6b and
Figure S16 of the Supplementary Materials.
3.2.13. Bird-Nesting Probability
Birds play a crucial role in agricultural ecosystems, contributing to pest control and seed dispersal, but they may also be at risk of colliding with photovoltaic panels or being disturbed by environmental changes caused by the system’s installation.
The map was produced using data from the Atlas of Breeding Birds of Lazio. In particular, data on the nesting probability of the various species were analyzed, obtaining a density map showing the areas with the greatest concentration of breeding birds. The ESI value was assigned based on this map, considering both the density of sightings and the probability of nesting. For the definition of home range and core, please refer to the paragraphs above. The map is shown in
Figure S17 of the Supplementary Materials, while
Table 8 presents the ESI values.
3.2.14. Probability of Birds of Prey Nesting
Following on from the above, raptor nesting has been included in the factors, based on data available on the Lazio region website. The dataset shows the distribution of birds of prey on a 10 × 10 km grid. Raptors are sensitive species and, as such, it is necessary to maintain an approximate range during the mapping phases. The assignment of the ESI value is a function of the probability of nesting (certain, probable, and possible) in
Table 8. The map is available in
Figure S18 of the Supplementary Materials.
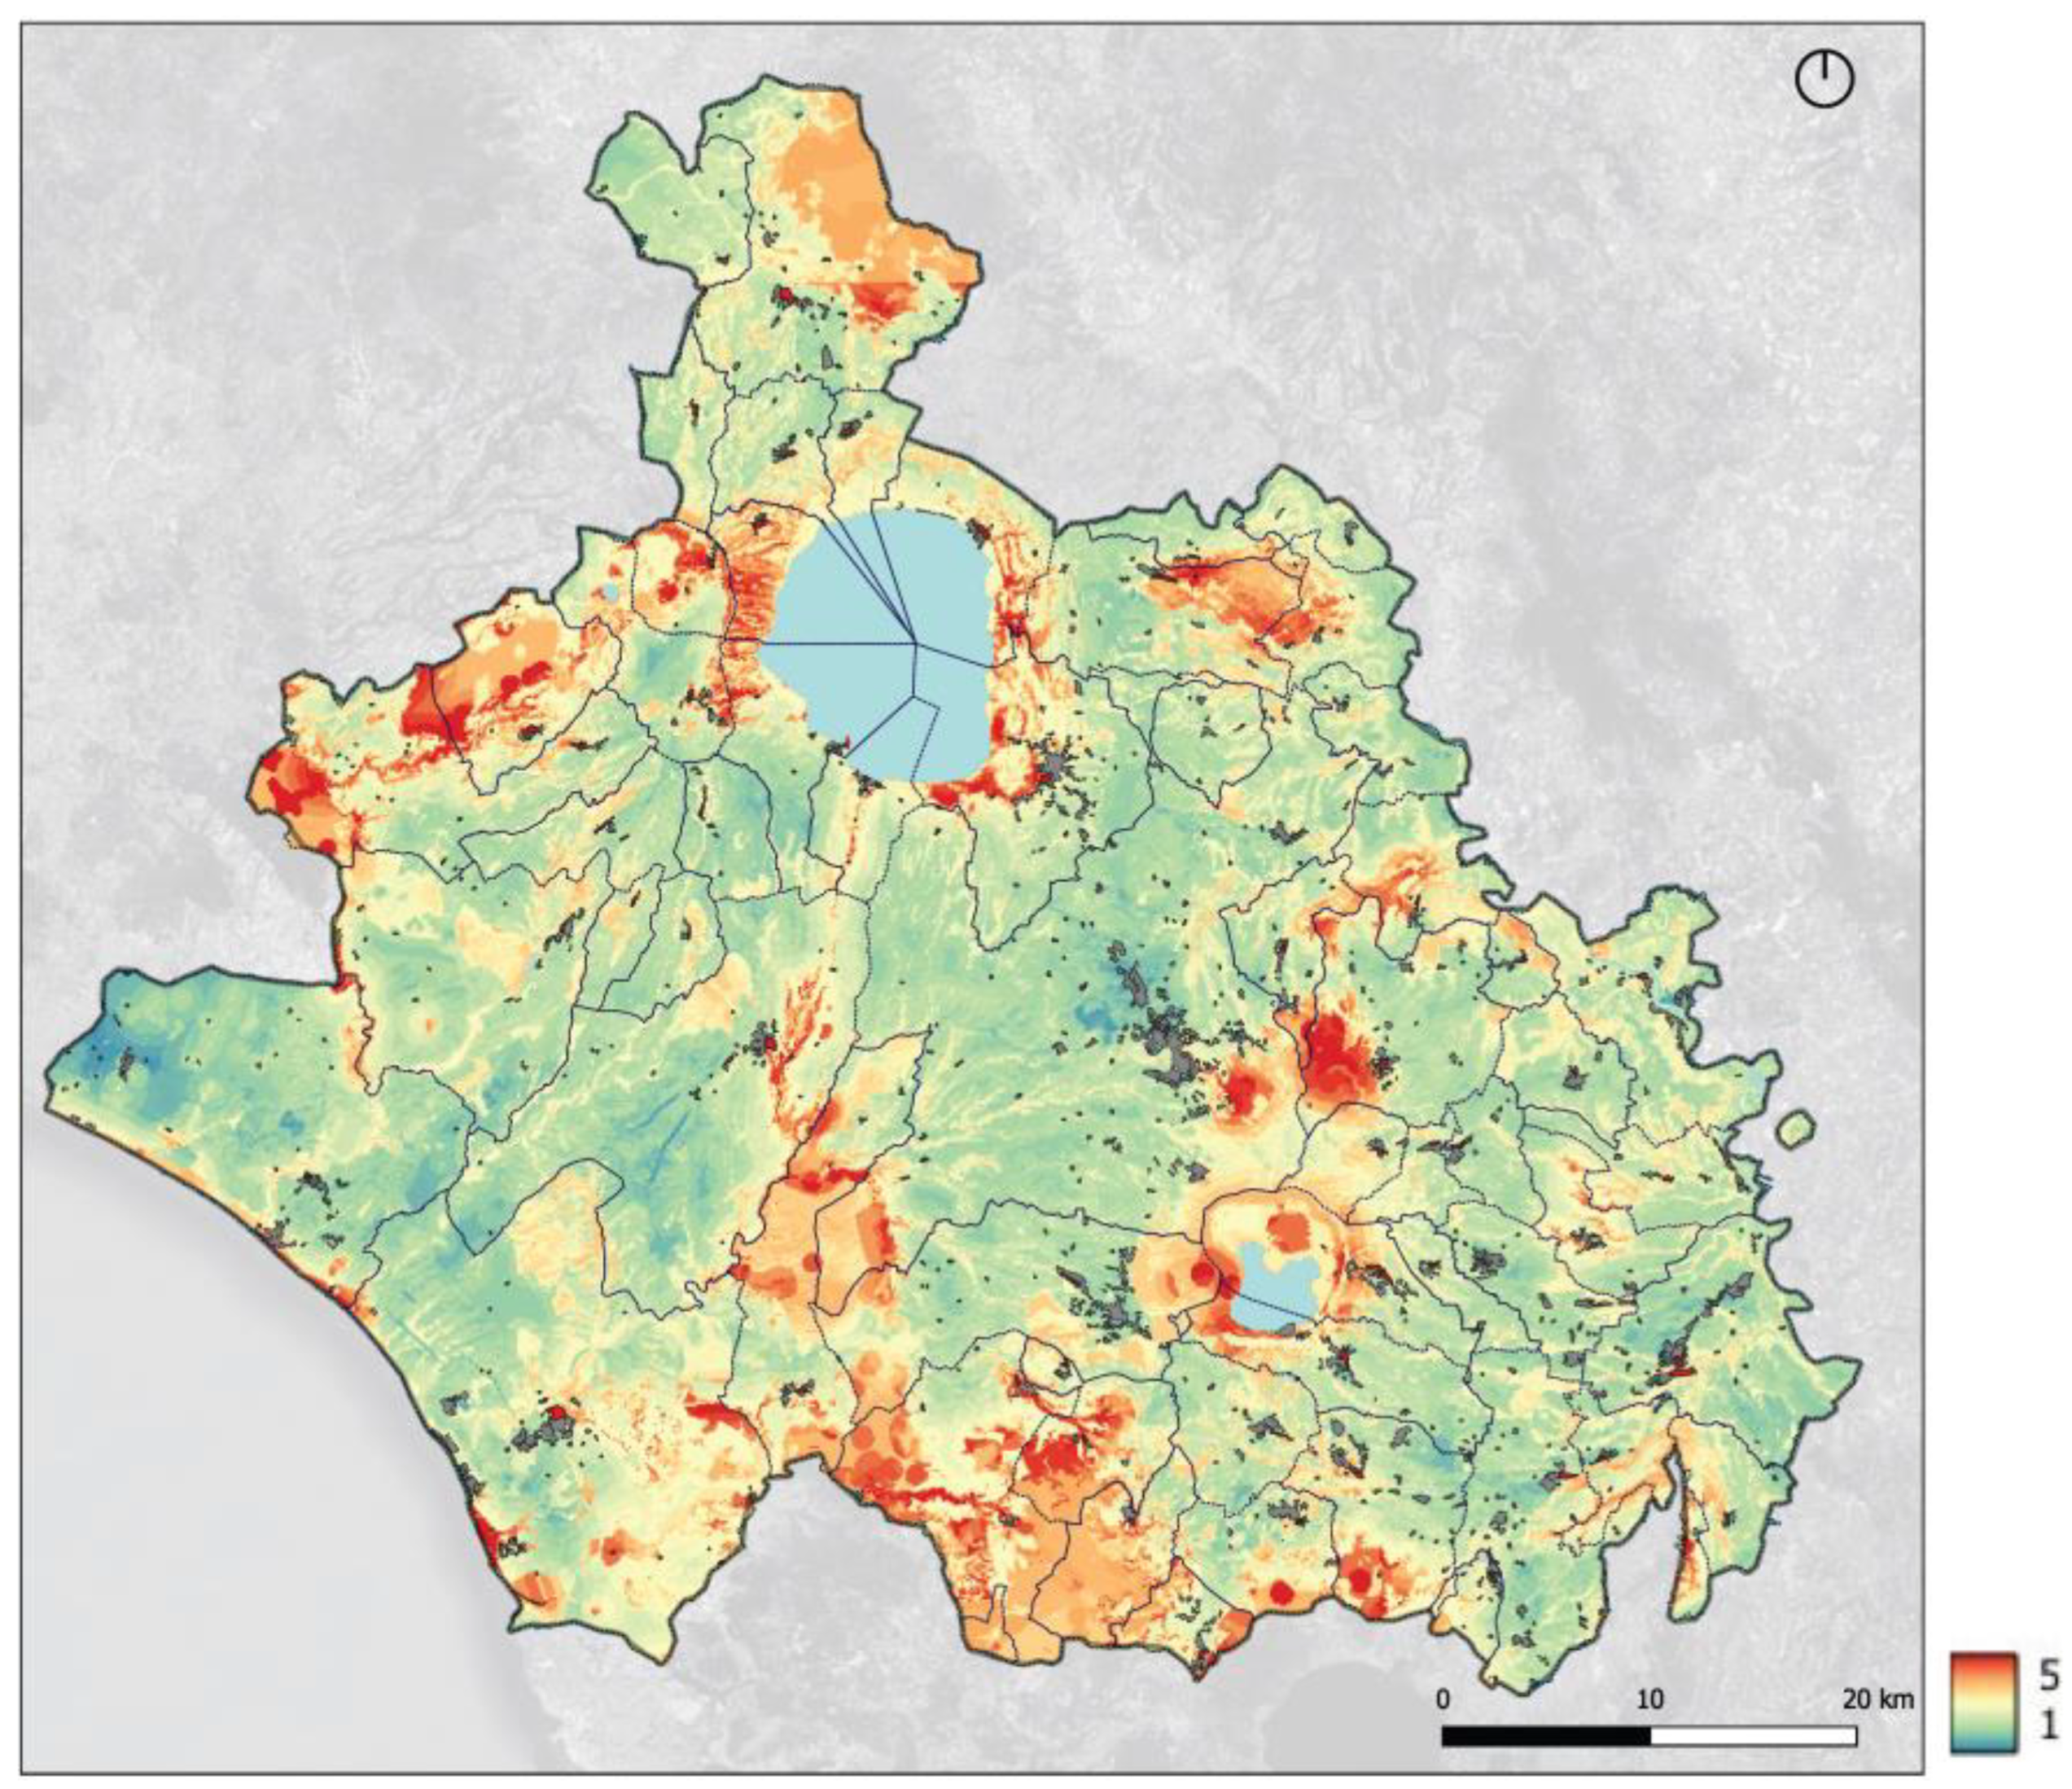
3.2.15. Thematic Maps of Environmental Sensitivity
The 14 thematic maps were overlaid and their values summed to produce six thematic summary maps that group the criteria into homogeneous environmental components (soil, water, biodiversity/fauna, biodiversity/avifauna, biodiversity/flora, and landscape; see
Table 9 and the maps in
Figures S19–S24). In the final phase, these thematic summary maps were combined, resulting in an overall global ESI map (
Figure 7). This map highlights the most sensitive areas and those most suitable for the installation of an agriPV system, considering the overlay of all components.
For this case study, the relative weight between criteria is set as equal, assuming all factors have the same importance. However, it is important to note that the methodology is flexible, and weights between criteria can be changed to reflect the opinions of stakeholders or to take into account different regional contexts that reflect varying territorial complexities. For example, in areas with a predominantly agricultural focus, the agricultural component may carry more weight. Conversely, in regions with significant natural habitats and ecological networks, the component related to protected areas may have a greater influence.
It is evident that biodiversity is a cross-cutting factor across all components, as it encompasses the assessment and cataloging of plant species present in a given territory, with particular focus on characterizing vegetation and plant species of ecological or conservation importance. This includes the identification and mapping of significant plant communities, as well as the analysis of vulnerability conditions arising from various pressure factors and the overall environmental degradation status. Furthermore, both the direct and indirect effects, both short term and long term, that may impact floral components and natural ecosystems are carefully examined, including potential irreversible consequences.
Evaluating environmental sensitivity through the combination of these factors is essential to ensure that agriPV projects are developed sustainably, minimizing impacts on local ecosystems and enhancing coexistence with nature. Using an approach based on the analysis of these indices allows for the identification of the most suitable areas for plant construction and the adoption of mitigation strategies to minimize negative effects on the environment.
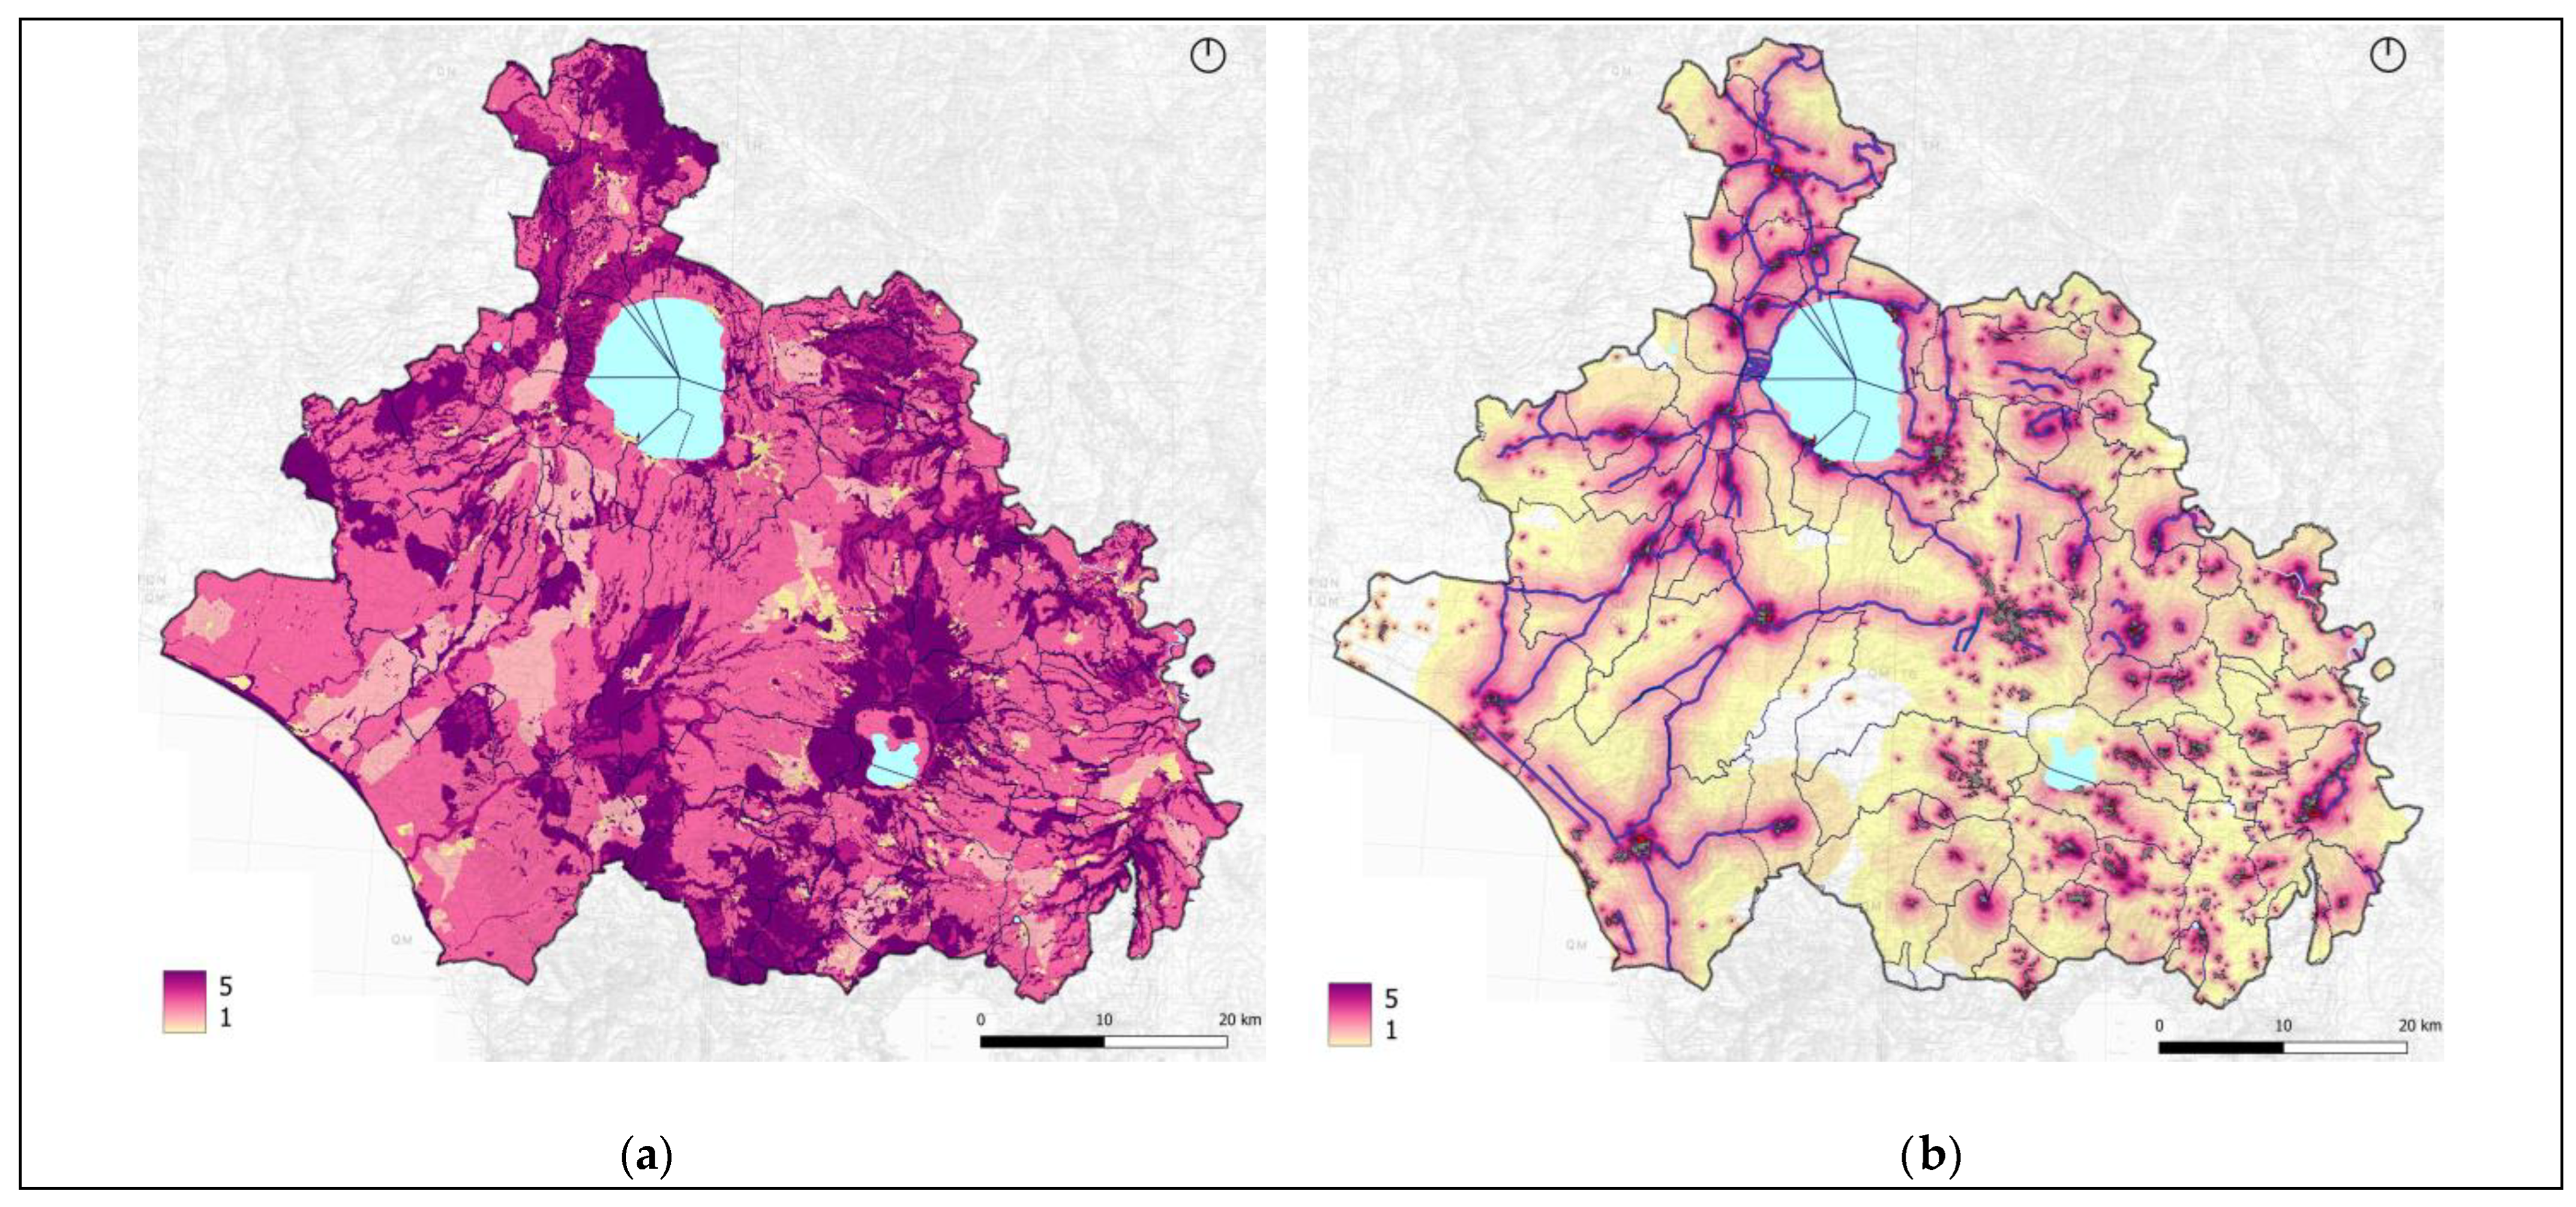
3.3. Visual Sensitivity
Following the same detailed approach used for environmental sensitivity, three factors of visual sensitivity were identified and measured at receptors sensitive to the landscape component (scenic roads, historic and urban areas) according to a Visual Sensitivity Index (VSI) scale.
The VSI ranges from 1 to 5, reflecting the ability to discern landscape details at different distances. A high VSI (5) indicates very high sensitivity, allowing for the perception of individual elements and multisensory factors up to 500 m. As the distance increases, sensitivity diminishes, becoming negligible beyond 5000 m, where only a background plane is visible.
Each dataset produced for every criterion was then rasterized, assigning the VSI index to each cell to generate the specific criteria maps and subsequently the global map.
In constructing the visual sensitivity factors, in addition to the 500 m reference distance established by current regulations as a social compromise between the distance of sensitive elements and the impact of agriPV systems, it was deemed appropriate to use the visual analysis techniques outlined in the Guidelines for the Analysis, Protection, and Enhancement of the Scenic–Perceptual Aspects of the Landscape, developed in 2014 [
40].
The aforementioned guidelines provide an analysis based on visibility bands. In the first plane, where the observation area is between 0 and 500 m, individual elements are distinguishable, and multisensory factors such as sounds and smells can be perceived. In the middle plane, where the observation range is between 500 and 1200 m, changes in structure and individual elements can be perceived against a background. In the next plane, known as the ‘Second Plane,’ with an observation range between 1200 and 2500 m, the effects of texture, color, and chiaroscuro become apparent. In the final plane, in the background, between 2500 and 5000 m, the contours and shapes of large masses are predominantly distinguishable. The distance to the horizon depends on the observer’s height and the Earth’s curvature. For an average person at sea level, the horizon is usually about 5 km away, and the dip of the horizon increases with altitude.
The evaluations are based on these factors related to the progressive distance between the target and the observer, and they are detailed below for each factor.
3.3.1. Proximity to Visual Systems
The landscape regulations of the Lazio region require the identification of a system of views, including vantage points, scenic routes, and visual cones. The original data are sourced from the landscape plan of the Lazio region. The dataset identifies precautionary distances from visual areas based on visual sensitivity. From these input data, a 500 m multi-buffer was generated for five iterations.
Table 10 shows the generated ranges and the assigned indices. The map was generated based on panoramic views and referring to what has been presented, and is available in the
Supplementary Materials as Figure S25.
3.3.2. Proximity to Historic Centers
Historic centers are identified as privileged visual elements due to their conformation and location. The factor is based on the precautionary distances from historic centers according to visual sensitivity. The precautionary visual sensitivity zones have been assigned a VSI measured within 5 km, in accordance with what has been explained for visual systems in the previous paragraph (
Table 10). The thematic criterion map is available in the
Supplementary Materials as Figure S26.
3.3.3. Proximity to Urban Centers
A major challenge is to implement agriPV projects close to urban centers in a way that maximizes benefits and minimises negative impacts. This requires a careful planning approach that takes into account all environmental, social, and urban planning aspects. agriPV projects may face resistance from citizens living in the affected areas, who may perceive a negative impact on their quality of life or a change in their familiar environment.
The factor is based on precautionary distances from urban centers according to visual sensitivity. The precautionary visual sensitivity zones have been assigned a VSI based on the 500 m module identified as the basic module for measuring the minimum visual and social impact of agriPV installations on sensitive receptors. From these input data, a 100 m multi-buffer was generated for 5 circles. The VSI was determined by assigning a value from 1 to 5 to sub-multiples of 500 m (100–200–300–400–500). Refer to
Figure S27 in the Supplementary Materials.
3.3.4. Global Map of Visual Sensitivity
If the analysis reveals that certain portions of the territory are excessively exposed and visible, those areas can be excluded from the project, thereby reducing the overall visual impact and allowing for more suitable design solutions in those zones. Furthermore, the VSI guides the design of mitigation measures that, in cases of high visual sensitivity, can effectively minimize visual intrusion.
It is also interesting to compare the global VSI map with the landscape areas ESI map generated according to the approach outlined in
Section 3.2.8 (
Figure 8a). In some specific cases, even though the ESI of a landscape area may be high, if the visual sensitivity factor is lower, it may be possible to focus less on long-range mitigation measures and instead target more significant details at the local scale.
3.4. A Global Assessment Tool for Decision-Makers
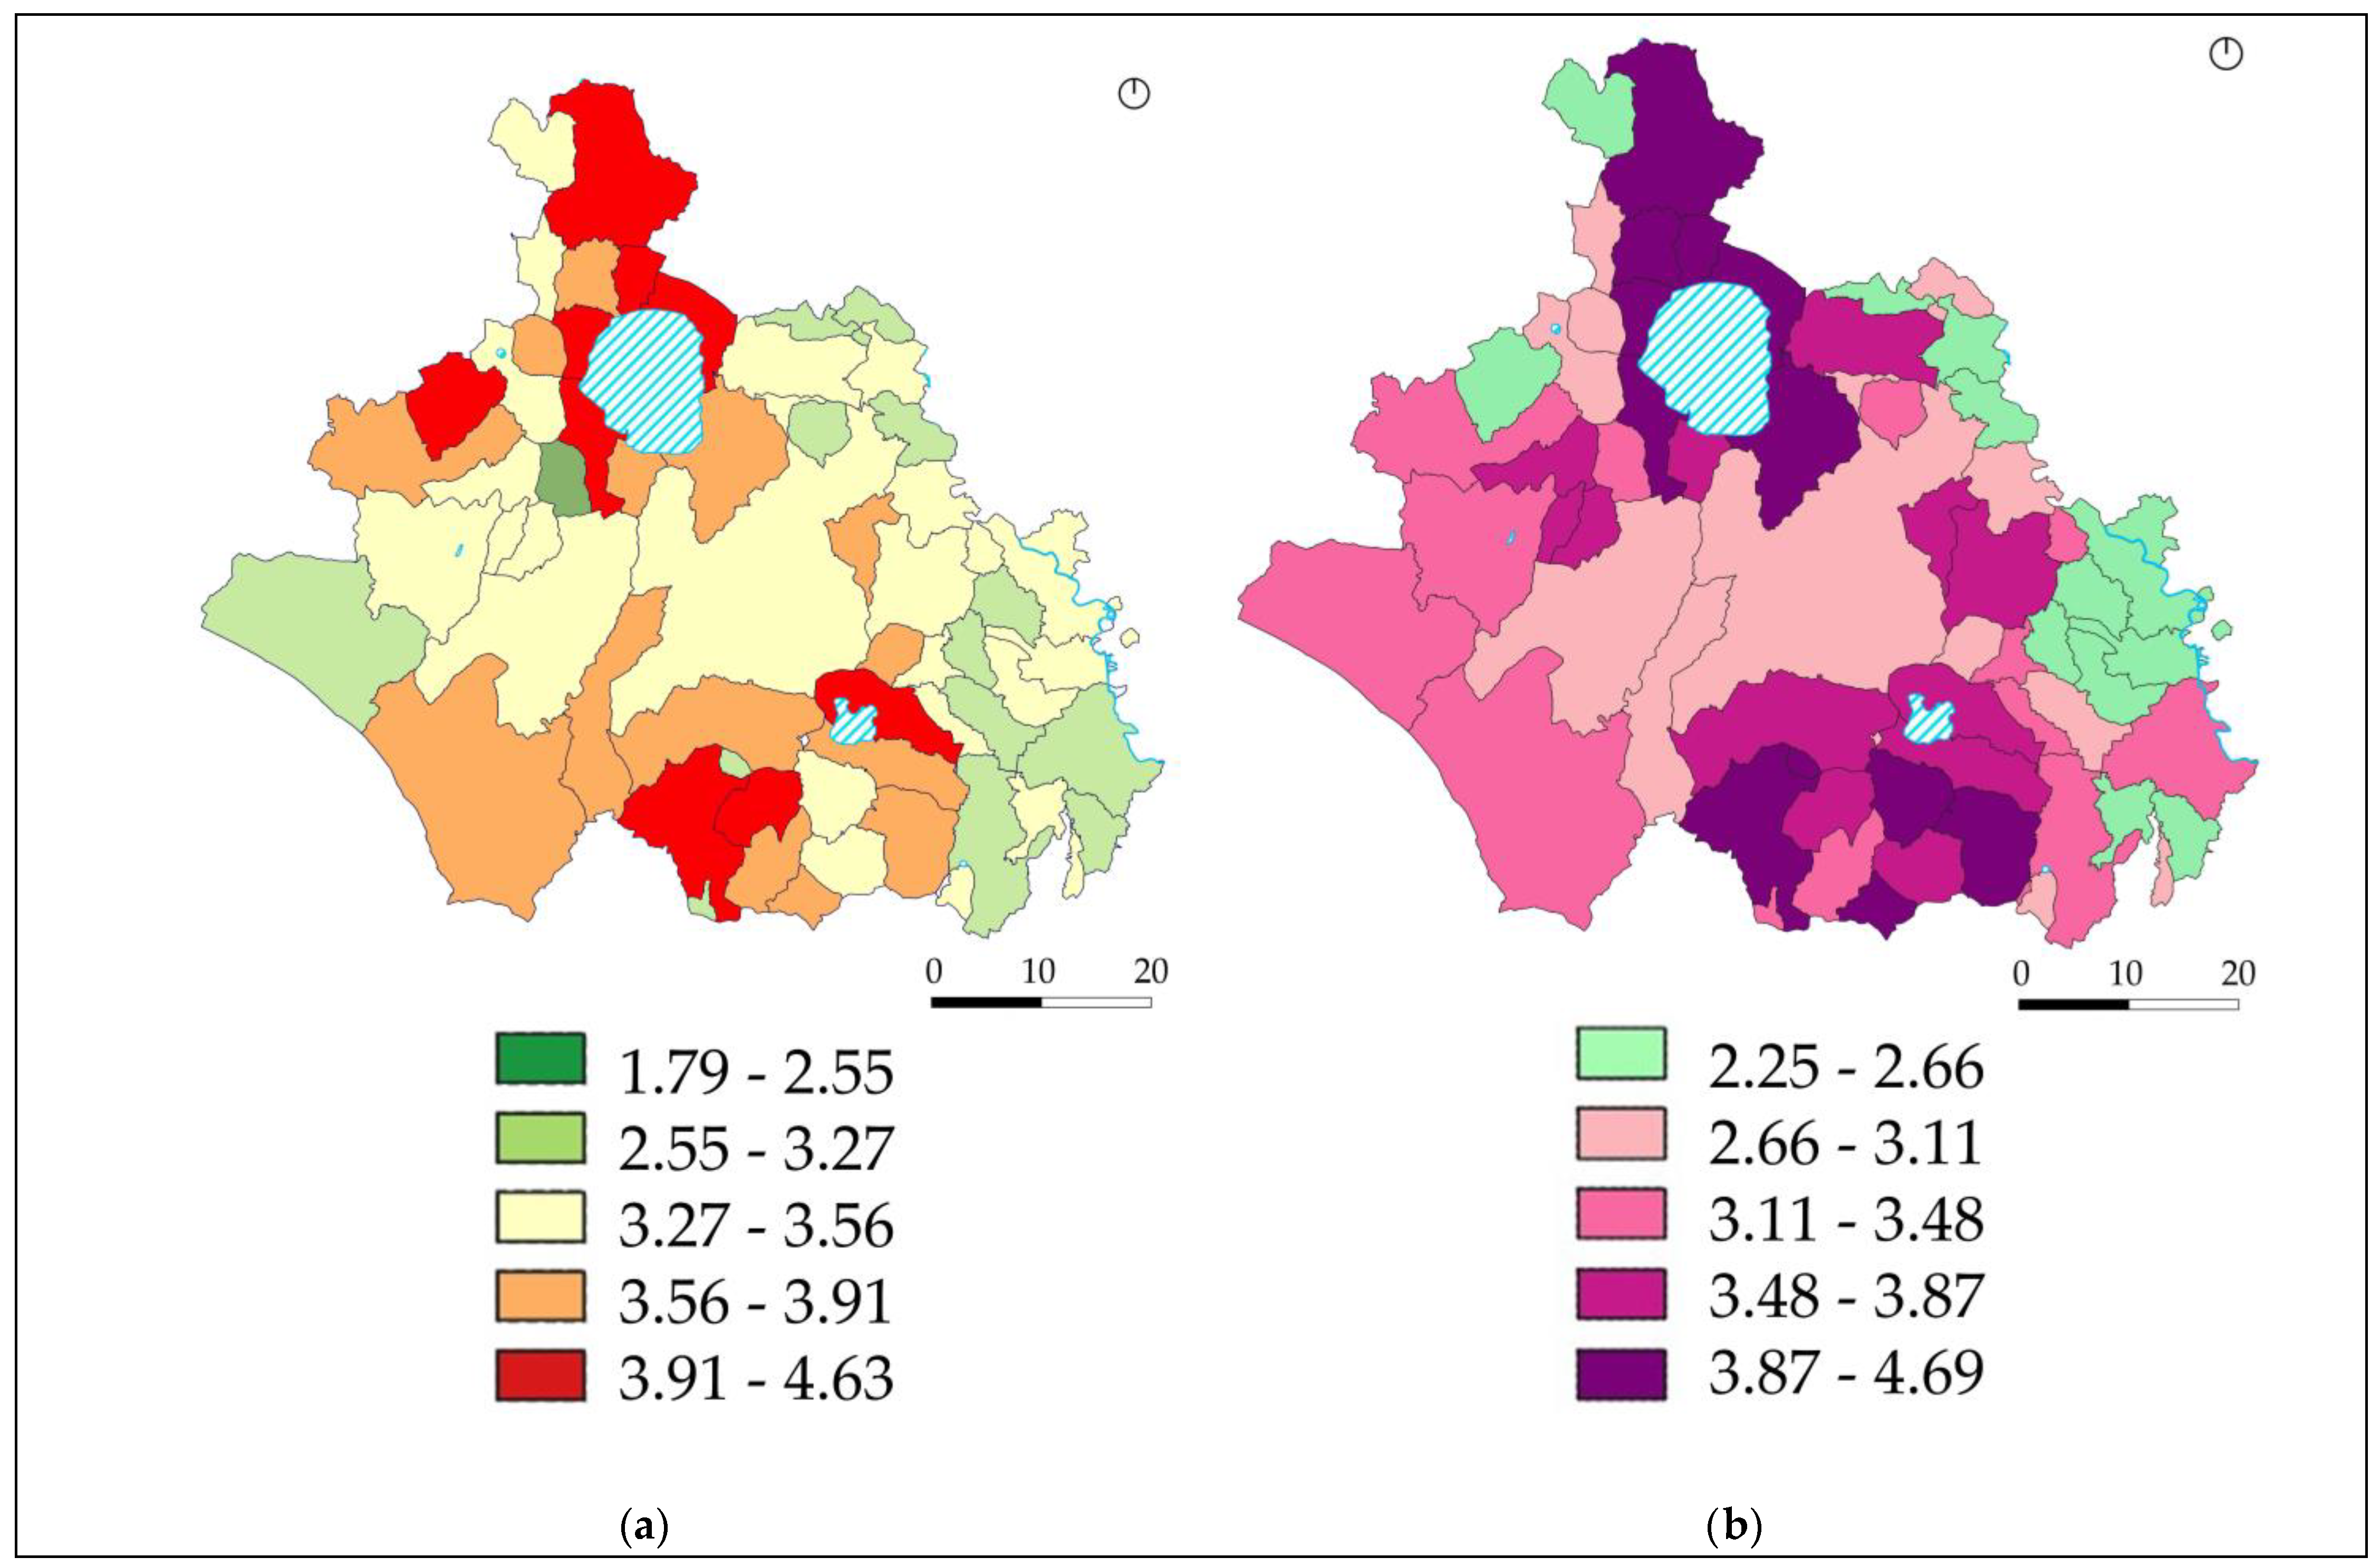
Figure 9a for global ESI and
Figure 9b for VSI index show two output map examples of the global assessment tool, i.e., the GIS project that displays the percentage of suitable or unsuitable areas and the average pixel values for EVI and ESI and their factors for each municipality in the Viterbo province.
This tool is designed to assist decisionmakers in interpreting and comparing results, allowing an analysis of the factors, helping to interpret the information, understand how the scenario evolves, and identify areas with the greatest potential for the installation of sustainable AgriPV plants. This method provides a clear and detailed overview of territorial suitability and environmental and visual sensitivity in each municipality of the Viterbo province.
By changing the symbology in QGIS, it is possible to assess each type of index in relation to each factor, as well as the global summaries for suitability, environmental sensitivity, and visual sensitivity.
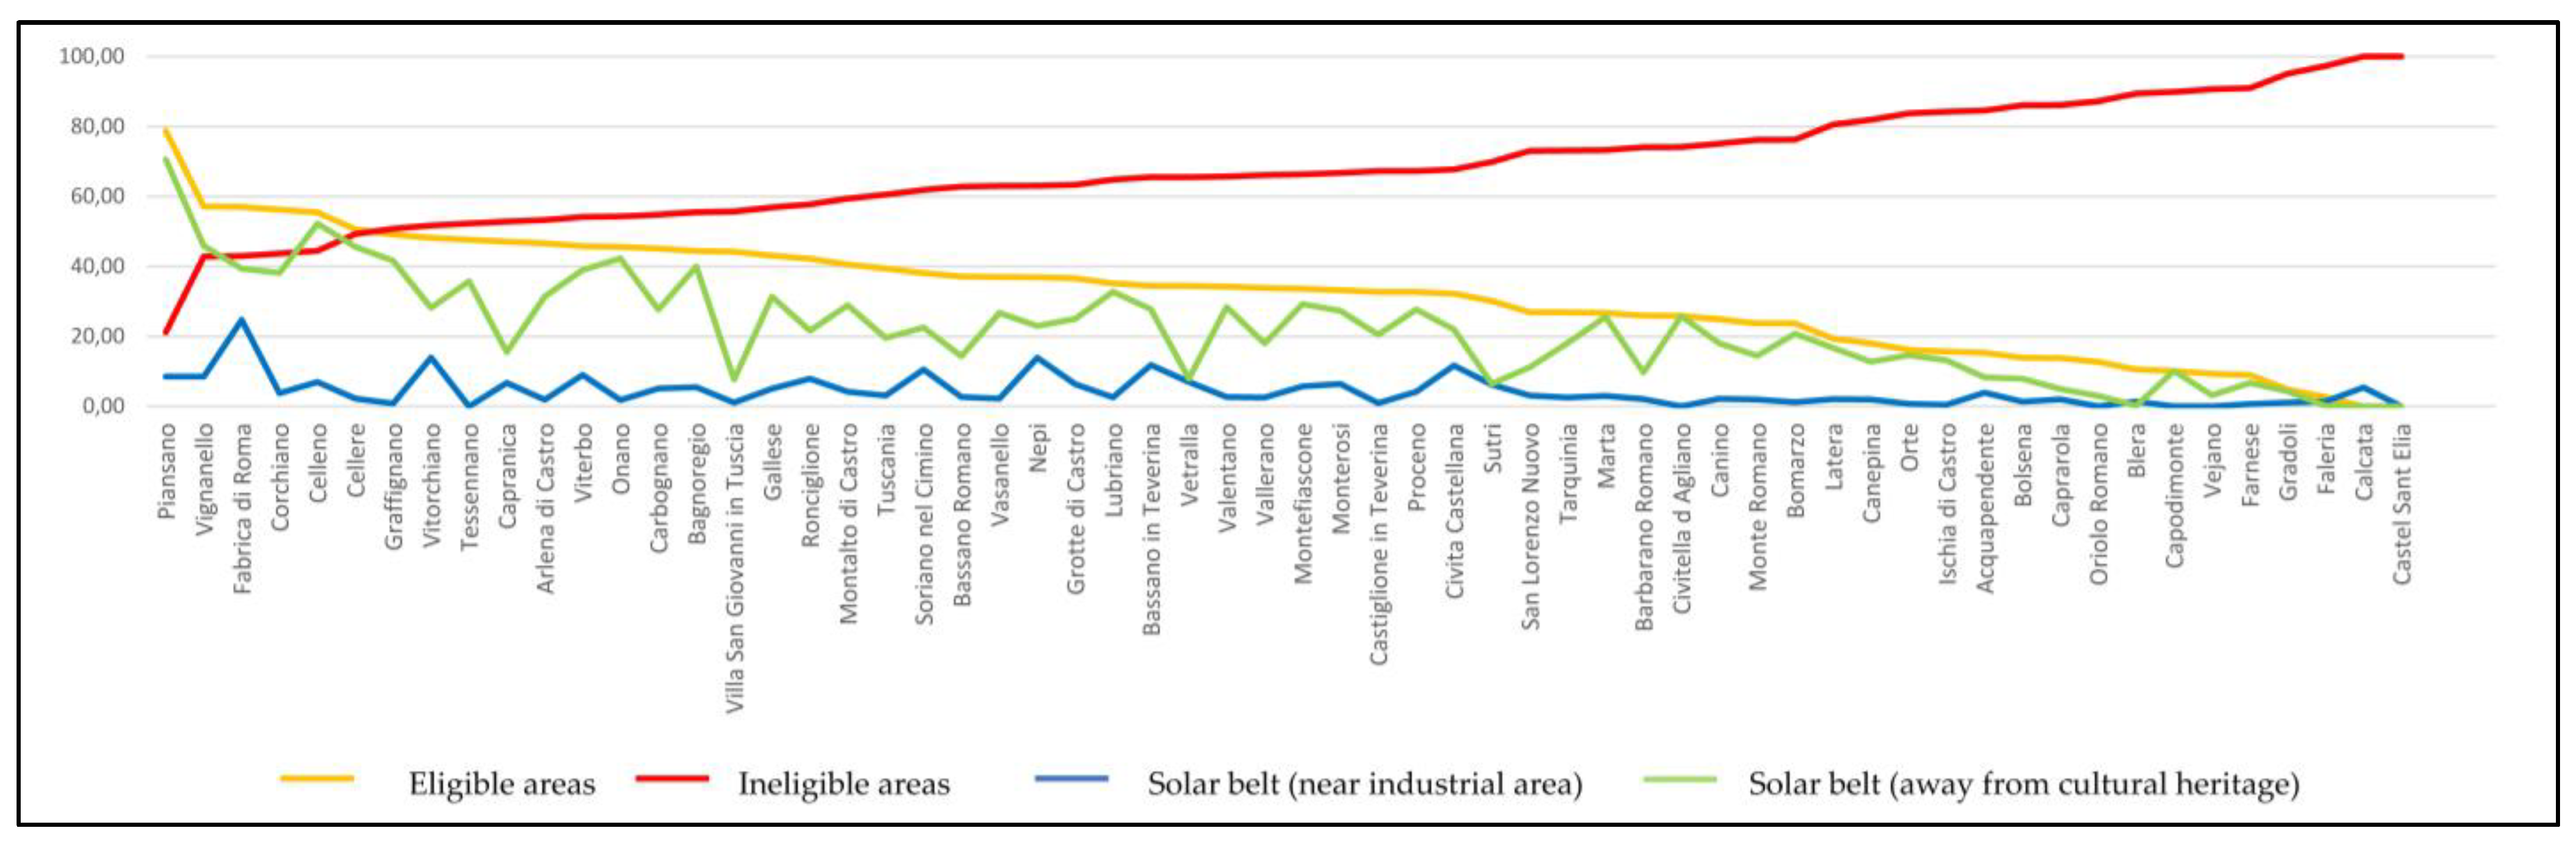
Beginning with the suitability data, an interesting pattern emerges regarding the geographical distribution of areas for agriPV systems. The analysis reveals a concentration of suitable areas in the northern part of the province, while the southern regions are less favorable. This discrepancy may be attributed to factors such as the territory’s morphology, the presence of protected areas, or the varying agricultural characteristics of the municipalities.
The top five municipalities in terms of percentage of suitability areas include Piansano, with the highest value, followed by Vignanello, Fabrica di Roma, Corchiano, and Celleno (chart in
Figure 10). The combination of the agricultural vocation of these areas with their low population density makes them particularly suitable for the installation of large-scale AgriPV plants. On the other hand, Calcata and Castel Sant’Elia have no suitable areas, while Gradoli and Faleria, despite having some favorable areas, are limited to less than 250 hectares.
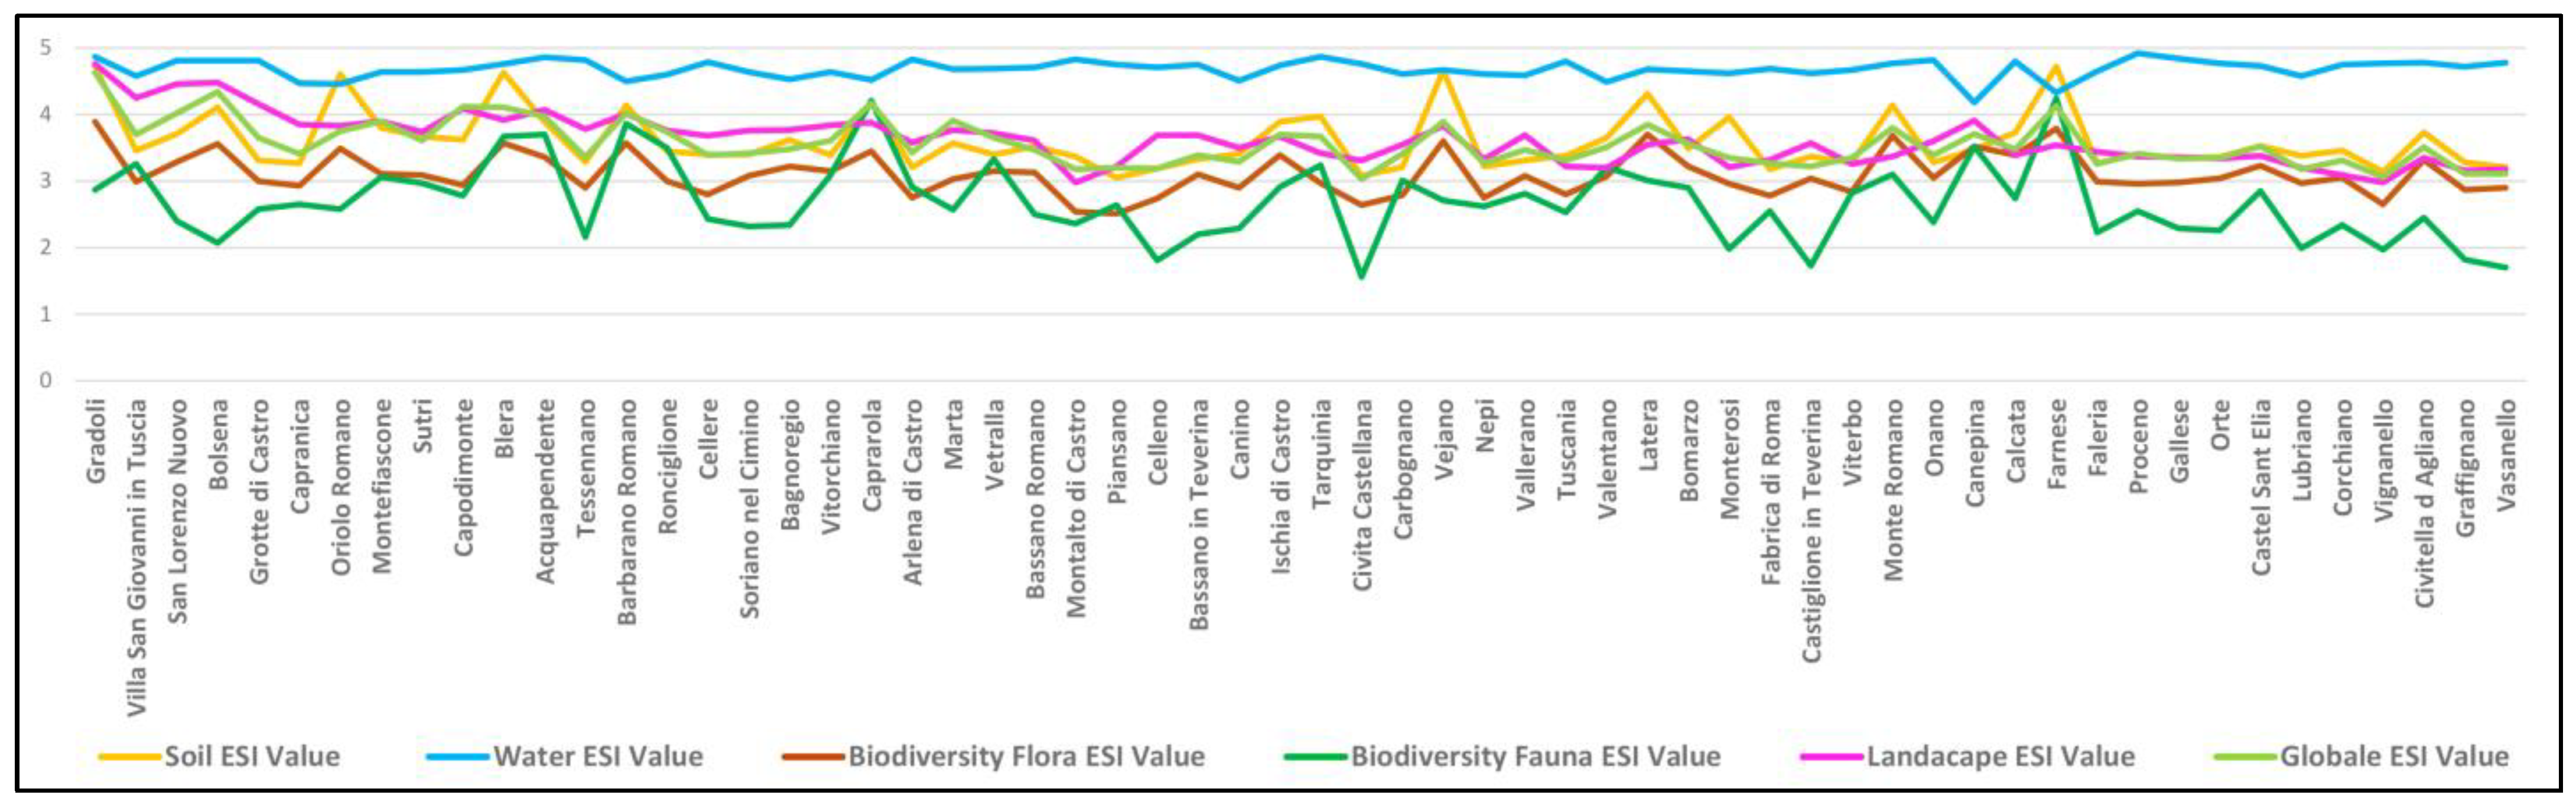
The ESI analysis highlights areas with significant differences in terms of environmental vulnerability (chart in
Figure 11). Gradoli, Bolsena, Caprarola, Farnese, Capodimonte, Blera, San Lorenzo, and Barbano Romano municipalities have a high overall ESI—higher than 4, confirming their environmental value, also linked to the presence of Lake Bolsena and the volcanic origins of the towns. Piansano, Montalto di Castro, and Civita Castellana have a medium/low ESI sensitivity, indicating a lower level of criticality compared to other municipalities.
4. Discussion
The proposed workflows and GIS models developed offer a flexible, scalable, and adaptable approach to evaluating suitable areas and sensitive territories for agriPV installation siting. The calibration of indices, based on suitability, environmental, and visual sensitivity criteria, can be easily modified to meet the specific characteristics of each Italian region and adapt to different territorial contexts. Moreover, it can be extended to other types of renewable energy production systems, reflecting the unique aspects of various renewable energy technologies.
The sMCDA conducted in this case study reveals that site selection for agriPV systems cannot rely solely on a binary logic of suitability versus non-suitability. Such a binary division based on predefined criteria could be limiting and insufficient for capturing the nuances of each territory. Instead, classifying territories based on environmental and visual sensitivity offers a more informed approach to design decisions and provides a common evaluation framework for decision-making processes, even though legal suitability criteria primarily dictate the project’s feasibility. By identifying the most sensitive areas that are still suitable for agriPV projects, it becomes possible to align projects more closely with sustainability objectives.
The analysis of territorial suitability for agriPV system installation in the province of Viterbo, in light of recent regulatory updates in Italy, becomes increasingly important with the 2024 Suitable Areas Decree [
27]. This decree introduces a new paradigm for identifying suitable areas for renewable energy installations, with a particular focus on solar belts. The mapping of suitable areas, required to be drafted by each region and autonomous province, excludes other areas that were previously deemed suitable.
The analysis highlights a clear geographical distribution of suitable areas. While the northern part of the province is more suited for agriPV system installation, the southern region shows lower suitability, possibly due to land morphology, the presence of protected areas, or differing agricultural land use. This geographical disparity underscores the necessity for an integrated approach that considers the territorial and environmental specifics of each municipality.
Analyzing various environmental and visual components in terms of their sensitivity allows the design process to be guided effectively using the indices derived from the study. For example, regarding biodiversity and wildlife, several strategies can be implemented to mitigate environmental impacts. In areas where significant movements of microfauna have been observed, measures such as installing permeable fences with a 30 cm-high base can facilitate the passage of microfauna while preventing larger species from entering. Additionally, creating ecological corridors composed of natural and cultivated herbaceous strips can help connect fragmented habitats, enhancing biodiversity and promoting the movement of microfauna. In the presence of significant visual impacts, it may be necessary to shift the location of the plant, modify its design, or adopt solutions like vegetation screening to reduce the impact on the landscape. In essence, a complete sustainable implementation of agriPV projects could be guaranteed by balancing environmental and visual sensitivity, by implementing sMCDA approaches that allow the combination of criteria from both spheres. For instance, in areas with high biodiversity but low visual impact, environmental criteria might be weighted more heavily. Conversely, in culturally significant landscapes, visual sensitivity may take precedence. Mitigation strategies can also play a role in this balance: innovative panel designs or strategic placement can reduce visual impacts, while biodiversity-friendly management practices can enhance environmental outcomes. Additionally, participatory planning processes involving local communities, environmental experts, and landscape architects can help identify optimal solutions that respect both sensitivities.
More generally, this article contributes to practices and reflections on the use of sensitivity mapping (SM) on environmental assessment.
SM for more than 50 years has accompanied the beginning, development, and consolidation of the environmental assessment and, although it is recognized as a key best practice in environmental assessment, it has not become a common practice. Despite the development and availability of open-source GIS tools, SM has not yet been a standard way of operating for the identification, description, and assessment of impacts and a systemic and territorial procedure to define significance, prevent undesirable impacts, and promote sustainability [
41].
The lack of structural implementation of SM could be a combination of two elements. From one side, the discontinuity of requirements and references for environmental assessment by the environmental authorities: many examples of web GIS tools implemented by the environmental authorities are created and then abandoned; the last example is the web Sensitivity Maps created by the EPA Ireland [
19]. From the proponent side (or the environmental consulting in the EIA market), the GIS approach on environmental assessment and the requirement to prepare a SM of each project to be evaluated is compared with other less time-consuming methodologies [
24].
SM alone or combined with sMCDA contributes to the implementation of appropriate ecological economics approaches to recognize the values attributed by different territorial actors to ecosystems, beyond state or market logics [
42,
43,
44].
The case presented is about an SM dealing with environmental and visual sensitivity applied to environmental assessment of projects related to agriPV. However, SM has many potentialities, from one side, in the articulated tiered ex ante evaluations from policies to operations; on the other side, including in the GIS platforms, different components of sensitivity: environmental, cultural, and social, in a perspective-integrated sustainability.
The climate emergency requiring a growing supply of renewable energy is offering an unexpected ‘bonanza context’ to agriPV from policies and science, with enthusiastic endorsement as ‘the best win–win solution.’ This apparently easy solution conceals other potential for solar energy production in urban and industrial areas [
45].
However, in the framework of ecological economics, SM can help for a more complete mapping and disclosure of political economy and political ecology dimensions to implement just transition processes, not just energy transition solutions [
46,
47,
48,
49].
Comprehensive SM mapping can offer a key contribution to the transparency of decisionmaking processes, facilitating the multiple function of environmental ex ante evaluation and supporting the different dimensions of increasing requirement of impact assessment: climate change, biodiversity, and just transition.


