1. Introduction
Under the combined influence of urbanization and the increasingly severe global climate change issues, climate disasters, especially extreme weather events such as heavy rainfall and floods, have severely impacted global urban public safety [
1,
2]. Data from the “China Flood and Drought Prevention Bulletin 2023” showed that since 2000, until 2023, the average number of people killed by floods in China is 1011 per year, the area of crops affected by floods was 9153.87 thousand hectares, and the direct economic loss due to floods was 173.5 billion CNY (23.8 billion USD) [
3]. To reduce the property losses caused by flood disasters, many related studies have been conducted domestically and internationally, with urban flood resilience assessment becoming a hot topic [
1]. Holling (1973) defined ecological resilience as the ecosystems’ ability to adjust, withstand, and bounce back their balance after disasters [
4]. Subsequently, other scholars abroad have further studied this concept, evolving the theory of resilience from the engineering aspect, then to ecological, and later to adaptive resilience [
5]. The research paradigm has gradually encompassed multiple disciplines, including disaster science, economics, and ecology [
6,
7,
8]. Many studies referred to the ability of resist, sustain, and recover from the flood [
9,
10]. Different frameworks to quantify urban flood resilience have been discovered. Many of the discoveries included social, economic, environment, community, and so on index metrics. Rose et al. (2004) narrowed the definition of resilience based on economic theory, incorporating disequilibrium factors and production losses into the parameters of the Computable General Equilibrium (CGE) model, demonstrating the adaptive resilience changes in the Portland metropolitan area’s water services in relation to water shortages and other factors [
11]. Yoann et al. (2021) developed a regional resilience synergy assessment model based on urban technology and the urban and social composition, and demonstrated that the model exhibits reproducibility across different time periods within French Polynesia [
12]. A system for evaluating urban disaster resilience in China was developed, encompassing six aspects such as economic, social, and environmental resilience. The assessment of urban resilience was then carried out using the weighted summation method [
13]. Yiran (2024) assessed the vulnerability of suburban roads to flooding and their impact on mobility, filling the research gap in the suburban areas of Accra, south of the Sahara Desert [
14].
There is much research about methods of assessing urban flood resilience. Jones combined cell phone management and remote interviews to reveal the resilient adaptation and resilience of different economic groups after flooding [
15]. The evaluation system of Shanghai central urban area was constructed by selecting the direct indicators related to flooding [
16]. Sun et al. (2021) used cities in Jiangsu as the study area and employed panel data from 2009 to 2018 to assess the flood resilience levels of these cities, while also using the Theil index to explore the spatial correlation characteristics of regional resilience development [
17]. Others considered the process of flood disaster and studied the urban flood resistance ability before the disaster, during the flood, and after the flood [
18,
19]. Currently, there is limited research on urban cluster resilience and the spatial distribution of resilience between urban clusters. First, coupling analysis with other systems, such as economic development level [
20], urbanization development level [
21], and land use types [
22]. Second, evaluating specific subsystems within urban resilience, such as regional economic resilience [
23,
24] or climate resilience [
25].
As for urban flood resilience, scholars have characterized it as the ability to withstand, adapt, and recover from flood [
26]. Urban flood resilience is influenced not only by natural resources, but also by the extent of socio-economic progress [
27]. Regarding resilience assessment models, Liu et al. (2018) constructed an evaluation model for flood disaster prevention by using the Pressure-State-Response (PSR) framework [
28]. Li et al. (2022) used the Analytic Hierarchy Process (AHP) to assess urban flood resilience to waterlogging and applied it to the flood-prone Kunshan City [
29]. Abenayake et al. (2018) further evaluated community flood resilience by incorporating ecosystem service vulnerability [
27]. In terms of research methods, existing studies mainly employ factor analysis [
30], network analysis [
31], and machine learning methods to conduct a quantitative analysis of influencing factors for resilience assessment [
32]. Urban agglomerations, as spatial organizations formed after urbanization reaches a mature stage, not only share similar natural conditions and economic development levels, but also facilitate better collaboration in the flood disaster response, thereby enhancing the overall urban resilience. Therefore, analyzing flood resilience within urban agglomerations holds significant importance. However, most studies tend to focus on evaluation models based on the structural composition of cities to assess urban resilience, with less attention given to the impact of key indicator factors such as urban greenery, social public services, and emergency response capabilities on urban flood resilience.
Based on the above analysis, this paper will designate YRD as the study area and 2000, 2010, and 2020 as the temporal scales. This study will use the key factors that trigger flood disasters, combined with the entropy weight method, to construct a resilience evaluation index system. The analysis will examine the characteristics and changes in urban flood resilience in the YRD at different temporal and spatial scales. On this basis, the evaluation results will be analyzed, and spatial autocorrelation analysis will be applied to investigate the correlation of urban flood resilience levels among cities. This approach will identify the weak links in cities’ responses to flood disasters and provide recommendations for improving urban flood resilience.
2. Materials and Methods
2.1. Overview of Study Area
Situated in the lower reaches of the Yangtze River, the YRD lies within an alluvial plain in eastern China. It is one of the most highly urbanized regions in the country and plays a crucial role in national economic stability. Additionally, the YRD is situated in a monsoon climate zone with abundant precipitation and is predominantly composed of plains, making it highly susceptible to flood disasters. Therefore, the YRD is selected as the study area to assess flood resilience from an urban perspective and to provide theoretical support for risk reduction and management in the region.
The planning scope of the Yangtze River Delta Regional Integrated Development Plan, officially issued in 2019, is to include the entire area of the four provinces and cities of Jiangsu, Zhejiang, Anhui, and Shanghai, as shown in
Figure 1. The area of the region is 211,700 km
2.The YRD has superior and rich natural resources and is located in a subtropical monsoon region, where the climate is marked by concurrent rainfall and high temperatures, and the average rainfall throughout the year is 980–2000 mm. The terrain of the region is mainly plain, with high terrain in the southwest and northeast, rich water resources, a high density of the river network, and diversified types of land use. This abundant natural resource base plays a significant role in supporting the social and economic progress of the YRD. As a result, it lays a strong foundation for the region’s continued development and growth. In 2023, the GDP of the three provinces and one city in total exceeded 30 trillion CNY (4.11 trillion USD), representing 24.4% of the GDP in China. By the end of 2023, the YRD had a total population of 238 million, with a high level of urbanization. However, the growth of an extensive economy has led to the destruction of the region’s ecological space and a decline in its ability to withstand ecological disasters.
2.2. Data Sources
The statistical data in this article cover the cities of the YRD. Specific indicator data are sourced from the Jiangsu Statistical Yearbook URL (accessed on 28 September 2024) (
https://www.jiangsu.gov.cn/col/col84736/index.html), Zhejiang Statistical Yearbook URL (accessed on 28 September 2024) (
https://tjj.zj.gov.cn/col/col1525563/index.html), Shanghai Statistical Yearbook URL (accessed on 28 September 2024) (
https://tjj.sh.gov.cn/tjnj/index.html), Anhui Statistical Yearbook URL (accessed on 28 September 2024) (
https://tjj.ah.gov.cn/ssah/qwfbjd/tjnj/index.html), as well as the statistical bulletins of the respective prefecture-level cities and the China Water and Drought Disaster Prevention Bulletin URL (accessed on 28 September 2024) (
http://www.mwr.gov.cn/sj/tjgb/zgshzhgb/). In this study, there were a few missing values. However, given the rigorous statistical review process of the statistical yearbooks and the small proportion of missing data, which did not affect the overall dataset, the missing values were estimated using the average year-on-year growth rate from the preceding and following years, ensuring data completeness.
2.3. Indicator System Construction
The concept of urban flood resilience is complexity, it is crucial to comprehensively use various types of indicator data for measurement and relative values for the assessment of domain resilience. Research scholars have proposed various kinds of indicator system construction research [
33,
34,
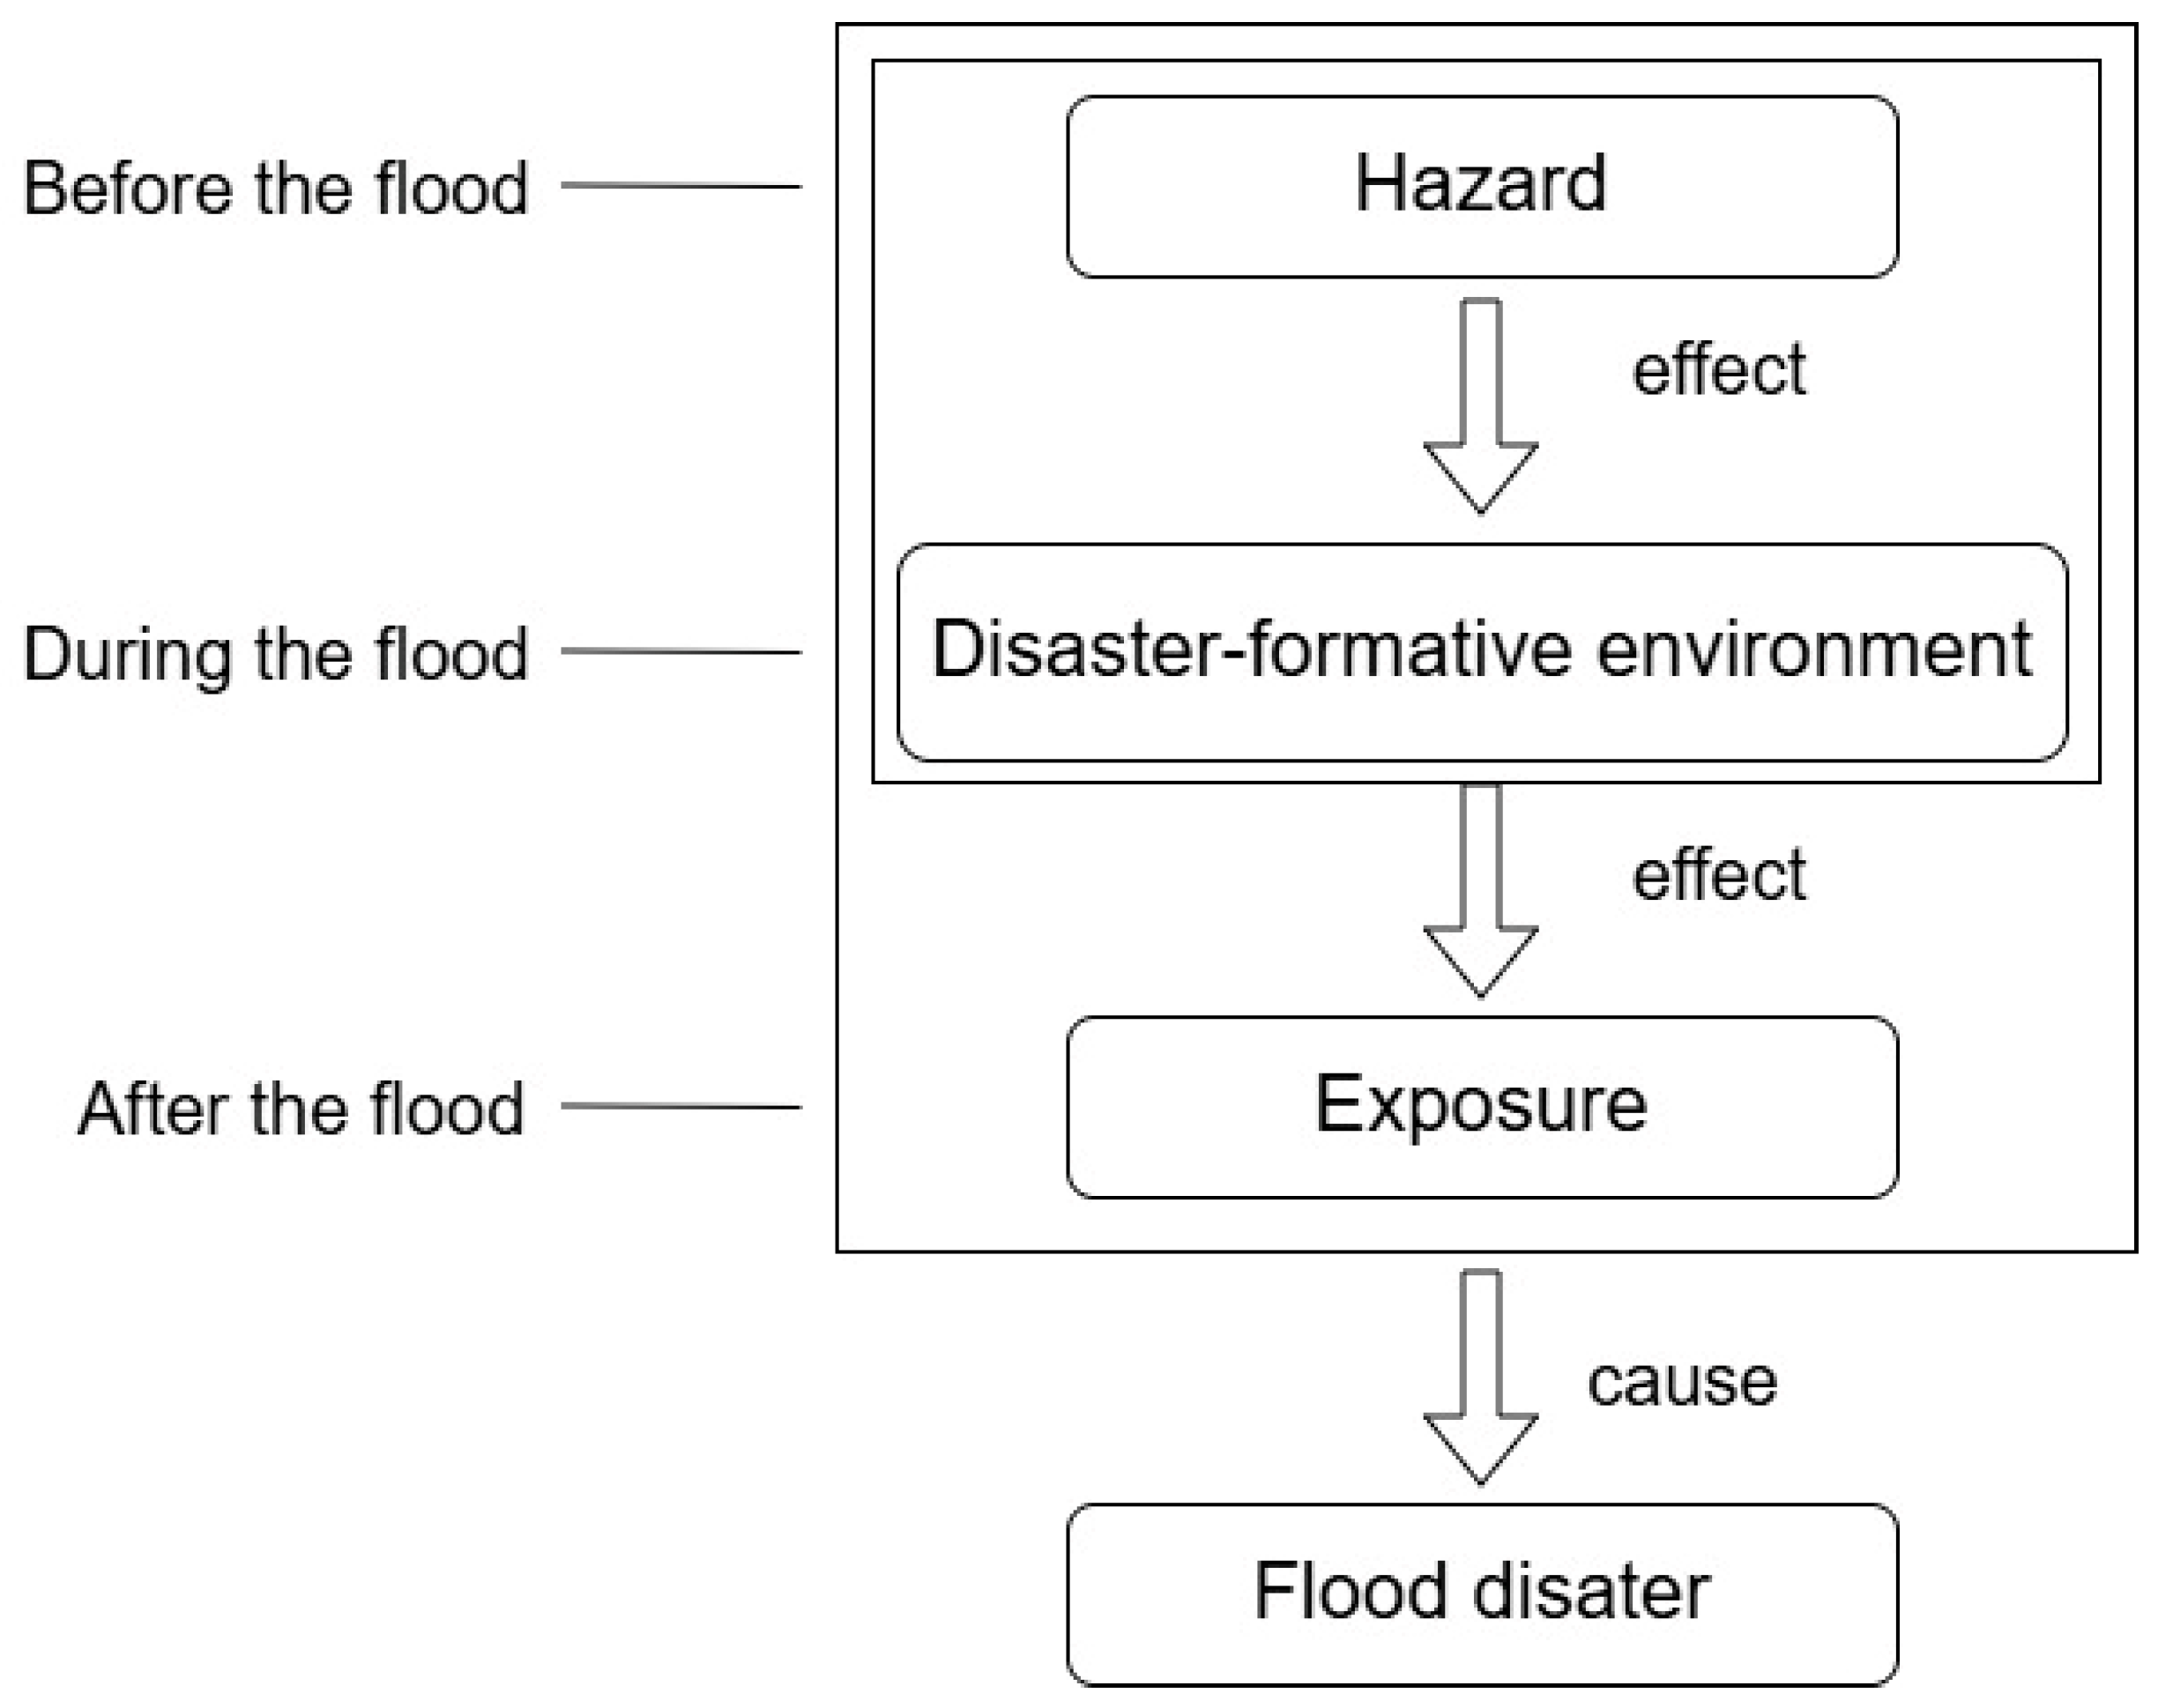
35]. Based on the perspective of flood disasters and the different stages of cities when facing disasters, this paper divides the evaluation index system into three categories: a hazard, disaster formative environment, and exposure. Among them, a hazard refers to various factors that can trigger, exacerbate, or cause disasters, such as heavy rainfall or high temperatures. These factors are crucial in the process of disasters. Accurately identifying and evaluating hazards can help predict potential flood risks. The disaster-formative environment refers to the basic environment in which disasters form and occur, i.e., the conditions and factors that are favorable to the occurrence or the development and evolution of disasters, and includes both natural and social aspects, such as a high proportion of impermeable surfaces or urbanization. The exposure is the object that suffers from the impact of disasters and bears the consequences of disasters in the process of disaster occurrence, such as permanent residents.
Floods formed by the causative factors acting on the exposure in the gestation environment are the product of the combined action of the three, and the hazards they bring include human casualties, economic losses, and crop damage. The interactions between the causative factors, the incubation environment, and the affected body are shown in
Figure 2.
This study focuses on the YRD, which has a high level of urbanization, and seeks to examine the flood resilience from a socio-economic viewpoint. This study focuses on the connection between human society and the environment, particularly how socio-economic activities in urban areas shape the environment. It selects indicators that have direct or indirect effects on resilience from the perspective of human society and urban environments, excluding traditional environmental factor indicators, thus offering an alternative perspective for resilience assessment. This study selected 22 assessment indicators based on relevant research to assess the index under the context of flood disasters [
36,
37,
38,
39,
40,
41,
42,
43,
44], as shown in
Table 1.
In the hazard aspect, this study primarily reflects factors that can exacerbate or trigger natural flood disasters. As one of the key factors for floods, higher precipitation increases the probability of flood occurrence. Therefore, the average precipitation is used as a negative indicator for this study. The rise in temperature increases the occurrence of heavy rainfall, which may intensify the flood. It is also used as a negative indicator to evaluate flood resilience. Landform determines the precipitation runoff patterns, thus affecting the occurrence of floods. This study selects two indicators—per green space per capita and the greening coverage of built-up areas—to assess the impact of urban green space on the regulation of topographical and hydrological processes, reflecting the positive impact. The disaster-formative environment is the foundational environment for disasters, and through assessing the physical protective capacity, sheltering capacity, and disaster communication ability of urban environments during floods, this study analyzes the resilience index of the urban infrastructure. This study selects indicators from three aspects—the Drainage Facility, Disaster Shelter, and Disaster Delivery—to reflect the city’s capacity to respond to floods. Drainage facilities reduce the risk of urban flood. Since the urban drainage system is highly related to the road system and the road drainage function enriches the drainage situation in the city, this study selects the density of drainage pipes in built-up areas and road mileage by city to reflect this. Disaster shelters are represented by the number of star-rated hotels and number of accommodation businesses, reflecting the city’s emergency shelter capacity. The disaster communication ability is reflected through the TV coverage rate and broadcast coverage, which shows the city’s communication ability. The indicators above have a positive impact on flood resilience. Exposure refers to the objects that bear the post-disaster impact. This study selects Medical Condition, Life Security, Industrial Economy, and Affected Object for evaluation, examining the city’s ability to provide medical security, life security, economic stability, and protection for vulnerable groups. Indicators like health and medical beds per 10,000 people and healthcare personnel per 10,000 people reflect the strength of medical resources, positively influencing flood resilience. Life security is represented by grain production, the number of catering businesses, and the number of social insurance participants, reflecting the city’s capacity for food security, social service provision, and social insurance. Industrial Economy aims to indicate the economic growth and social stability, with indicators like GDP per capita, per capita disposable income, employment, and tertiary industry share. The tertiary industry share mainly includes services and tourism, which can influence the post-disaster resource distribution and social service recovery, while also being affected by floods. The resident population indicates that a higher population density exacerbates disaster damage, while the average number of students in higher education per 10,000 population reflects the proportion of highly educated individuals. People with a higher education level have the stronger ability to resist flood. An insufficient farmland drainage capacity can lead to severe crop damage, so the crop-sown area is also included as an indicator. In the exposure aspect, except for the resident population and crop-sown area, which have a negative impact, the rest have a positive impact.
2.4. Weight Determination and Model Building
This study focuses on the objective evaluation of urban flood resilience indices under flood disaster conditions. The entropy weight method, which dictates weights based on data variability, reduces the interference of subjective judgment. Unlike methods based on subjective judgment, such as the AHP, the entropy weight method offers greater objectivity, ensuring a rational weight assignment while maintaining robustness and broad applicability. Therefore, this study employs the entropy weight method for analysis [
45,
46]. In urban flood resilience assessment, the information entropy of evaluation indexes usually refers to the uniformity of the horizontal distribution of their data. The specific application of the method based on previous research is as follows [
47,
48].
The initial values are dimensionless and the standard values are obtained.
Negative indicators:
where
is the standardized value of the
i-th indicator for the
j-th region, and
is the original value of indicator
i in
j.
and
are the minimum and maximum values of the cities in the
i-th indicator, respectively.
The weight of the indicator:
Entropy values under the indicator:
Weight of the
i-th indicator:
The evaluation system for different dimensions is calculated as follows
where
is the evaluation index of different dimensions of each region,
is the weight of the
ith indicator, and
is the normalized value of the
i-th indicator in city
j.
The urban flood resilience index is as follows
where
is the urban flood resilience index,
is the evaluation index under the hazard dimension,
is the evaluation index under the disaster-formative environment dimension, and
is the evaluation index under the exposure dimension.
2.5. Spatial Autocorrelation Analysis
Spatial autocorrelation analysis evaluates the differences or similarities between spatially adjacent values through statistical methods, thereby revealing the clustering or dispersion levels of flood resilience across cities within the urban agglomeration. Local spatial autocorrelation (LISA) further refines this analysis, uncovering anomalous patterns in flood resilience indices at the local scale. By identifying areas of a high or low flood resilience concentration, LISA better reveals the disparities in response capabilities across regions during flood events, thus highlighting the spatial characteristics of the resilience. It investigates if the values of a given factor show a strong correlation with those of neighboring spatial points [
49]. The specific application of the method based on previous research is as follows.
where
represents the local Moran’s
I index;
and
are the resilience values of city
and city
, respectively;
is the average resilience value of the study area; and
represents the spatial weight matrix measuring the relationship between city
i and city
j.
2.6. Stepwise Multiple Regression
Stepwise multiple regression is based on the contribution of selected independent variables to the dependent variable. By gradually introducing variables into the regression equation and repeatedly selecting, the independent variables that contribute the most to the dependent variable are obtained. Using the least squares method, the optimal regression equation is derived. Based on previous research, the formula is as follows [
50].
where
is the sample size,
is the number of variables,
is the coefficient, and
is the residual error term.
3. Results
3.1. Urban Flood Resilience Level Zoning
The finalized data of each indicator weight for the flood resilience index data of YRD are shown in
Table 2.
To analyze the urban flood resilience, the model was employed to calculate the indicator values. For clarity and ease of interpretation, the results were categorized into five categories: the high-value zone, slightly high-value zone, medium-value zone, slightly low-value zone, and low-value zone. Among the various GIS classification methods, the natural breaks method was selected for its ability to automatically identify the natural distribution of data, thereby objectively capturing inherent patterns. Compared to other classification techniques, the natural breaks method avoids the subjectivity of manual classification and offers more accurate and effective grouping, particularly for datasets with an uneven distribution or extreme values. So, this paper applies the natural breaks method to classify the index.
3.1.1. Hazard Resilience Index Zoning
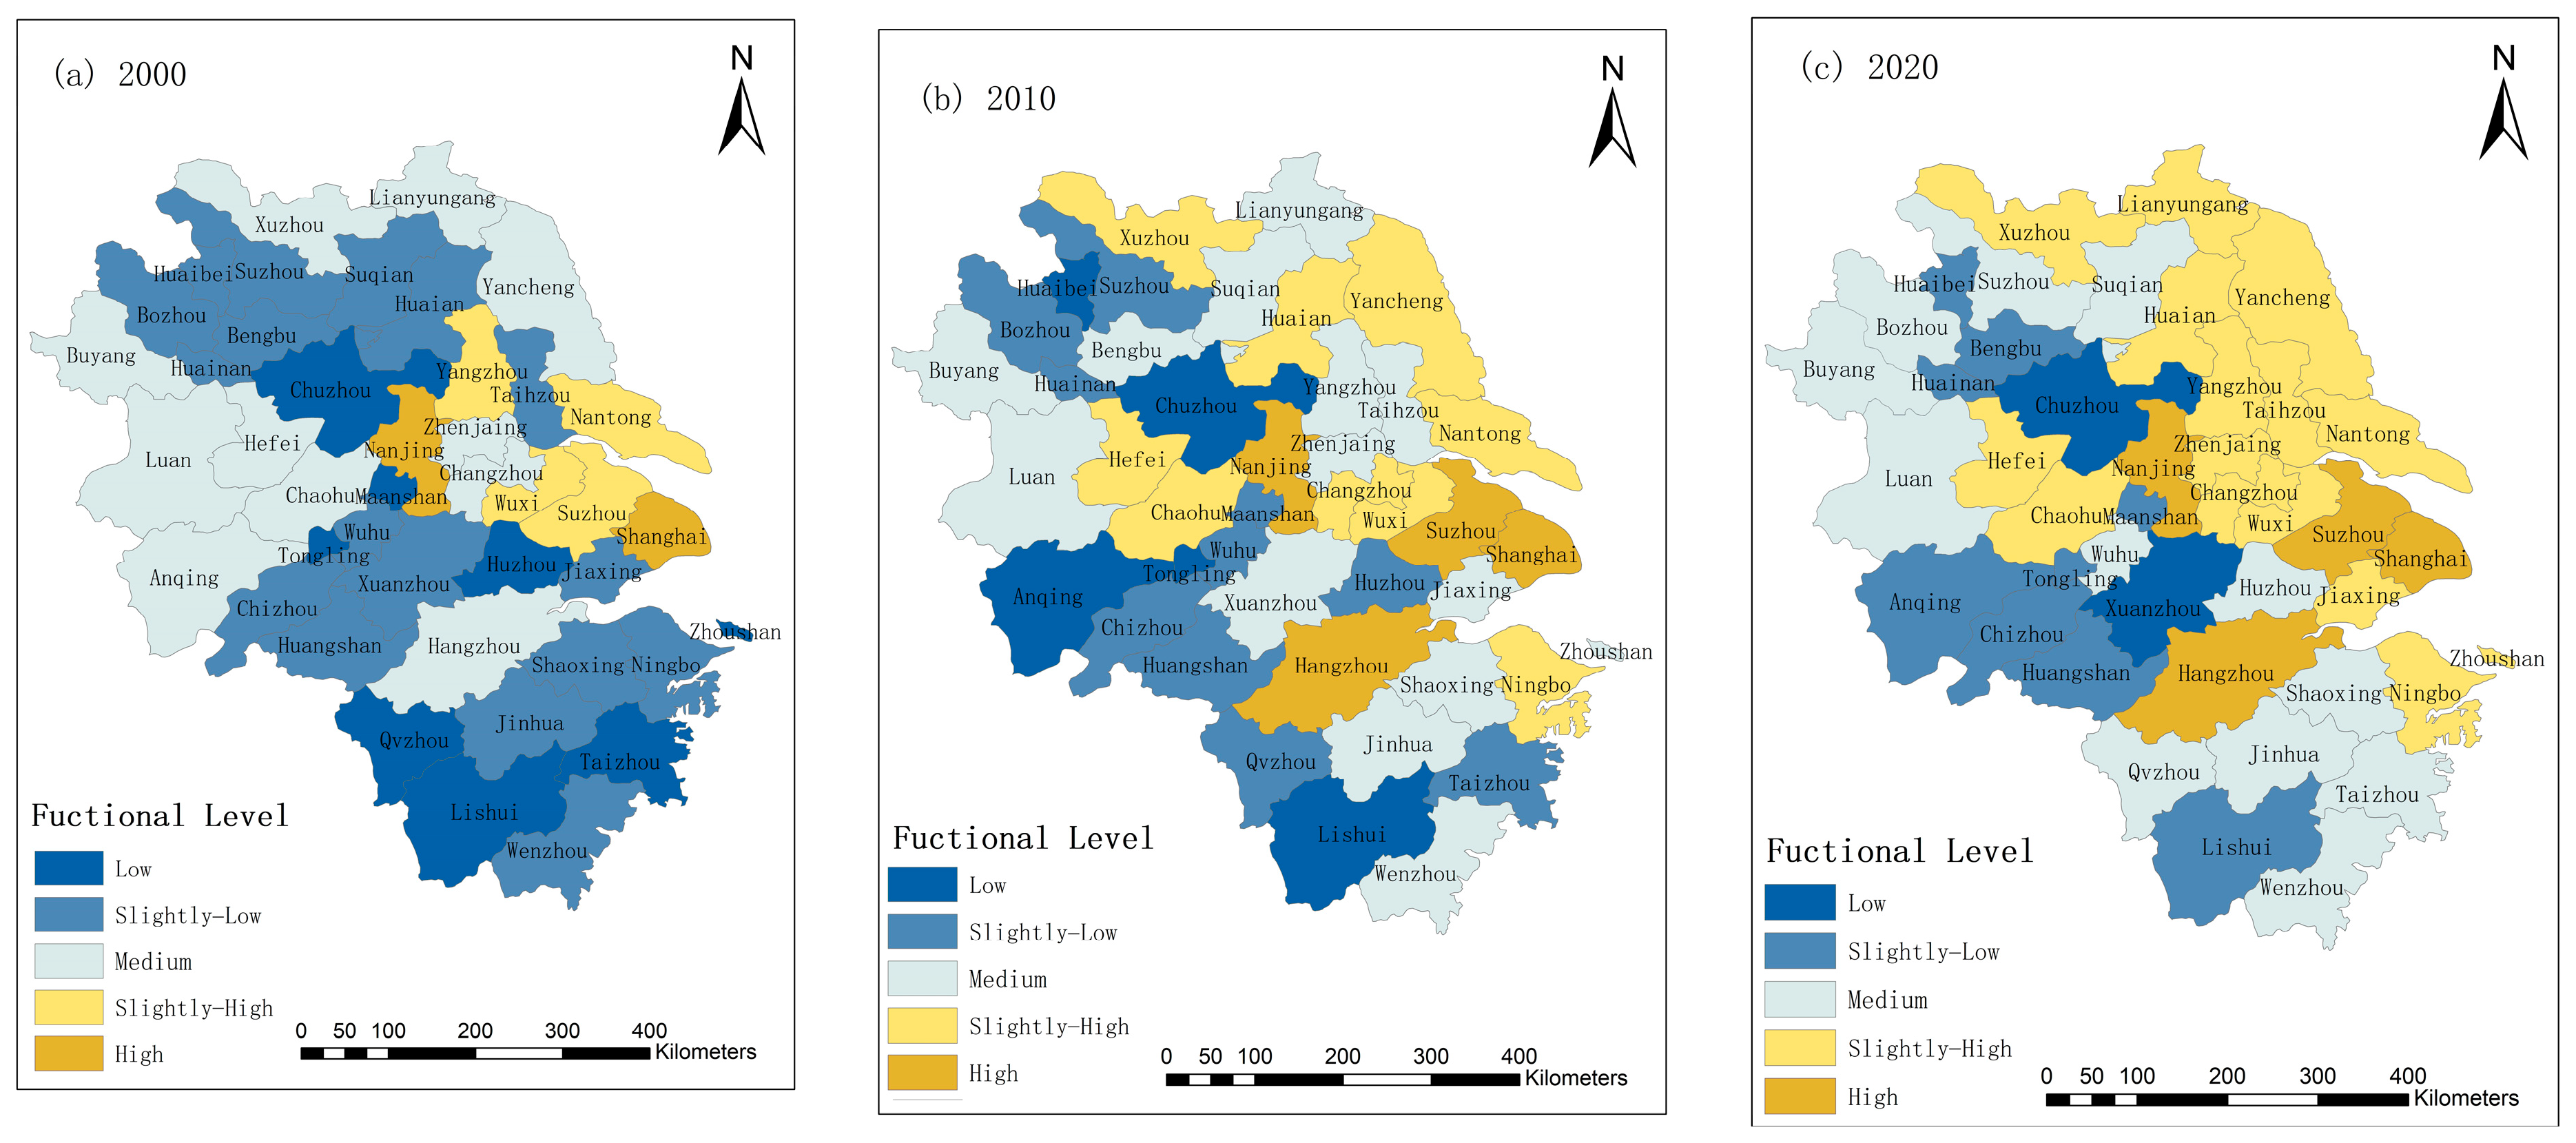
The hazard is one of the key indicators to respond to the degree of flooding and has a close relationship with the risk. This study divides the index into five categories by applying the natural breakpoint method, and the results of this study are shown in
Figure 3.
From
Figure 3a, the resilience index of hazards in the YRD in 2000 mainly consisted of low-value and slightly low-value zones, with no high-value zones. The slightly high-value zones are concentrated in Hefei, Chaohu, and Nanjing, which have more built-up green spaces compared to other cities and have lower negative impact factors such as rainfall than other regions. From
Figure 3b, the distribution of the resilience index of hazards in 2010 is still dominated by low-value and slightly low-value zones, but overall, it has improved compared to the previous research stage, such as Suzhou, Huaibei, Chuzhou, and other cities, while the resilience index of hazards in a few cities has declined, such as in Jinhua, Quzhou, and other areas, which is due to the expansion of built-up area in these areas, resulting in the shrinkage of the green vegetation.
Figure 3c shows that the resilience index of the hazard has obviously improved, and the high and slightly high value are concentrated in the northern part of the YRD, while the low and slightly low values are still concentrated in the southern part of the city. Overall, we can analyze the relatively high resilience of the hazard in the central and northeastern regions, such as Chizhou City, Xuzhou City, Chaohu City, Nanjing City, etc., in 2000, and gradually gather to the northern region, such as Lianyungang City, Suqian City, Yangzhou City, etc., in 2020. The resilience intensity of cities in the southern region, such as Wenzhou City, Jiaxing City, etc., in the past two decades is basically in the low-value and slightly low-value zone.
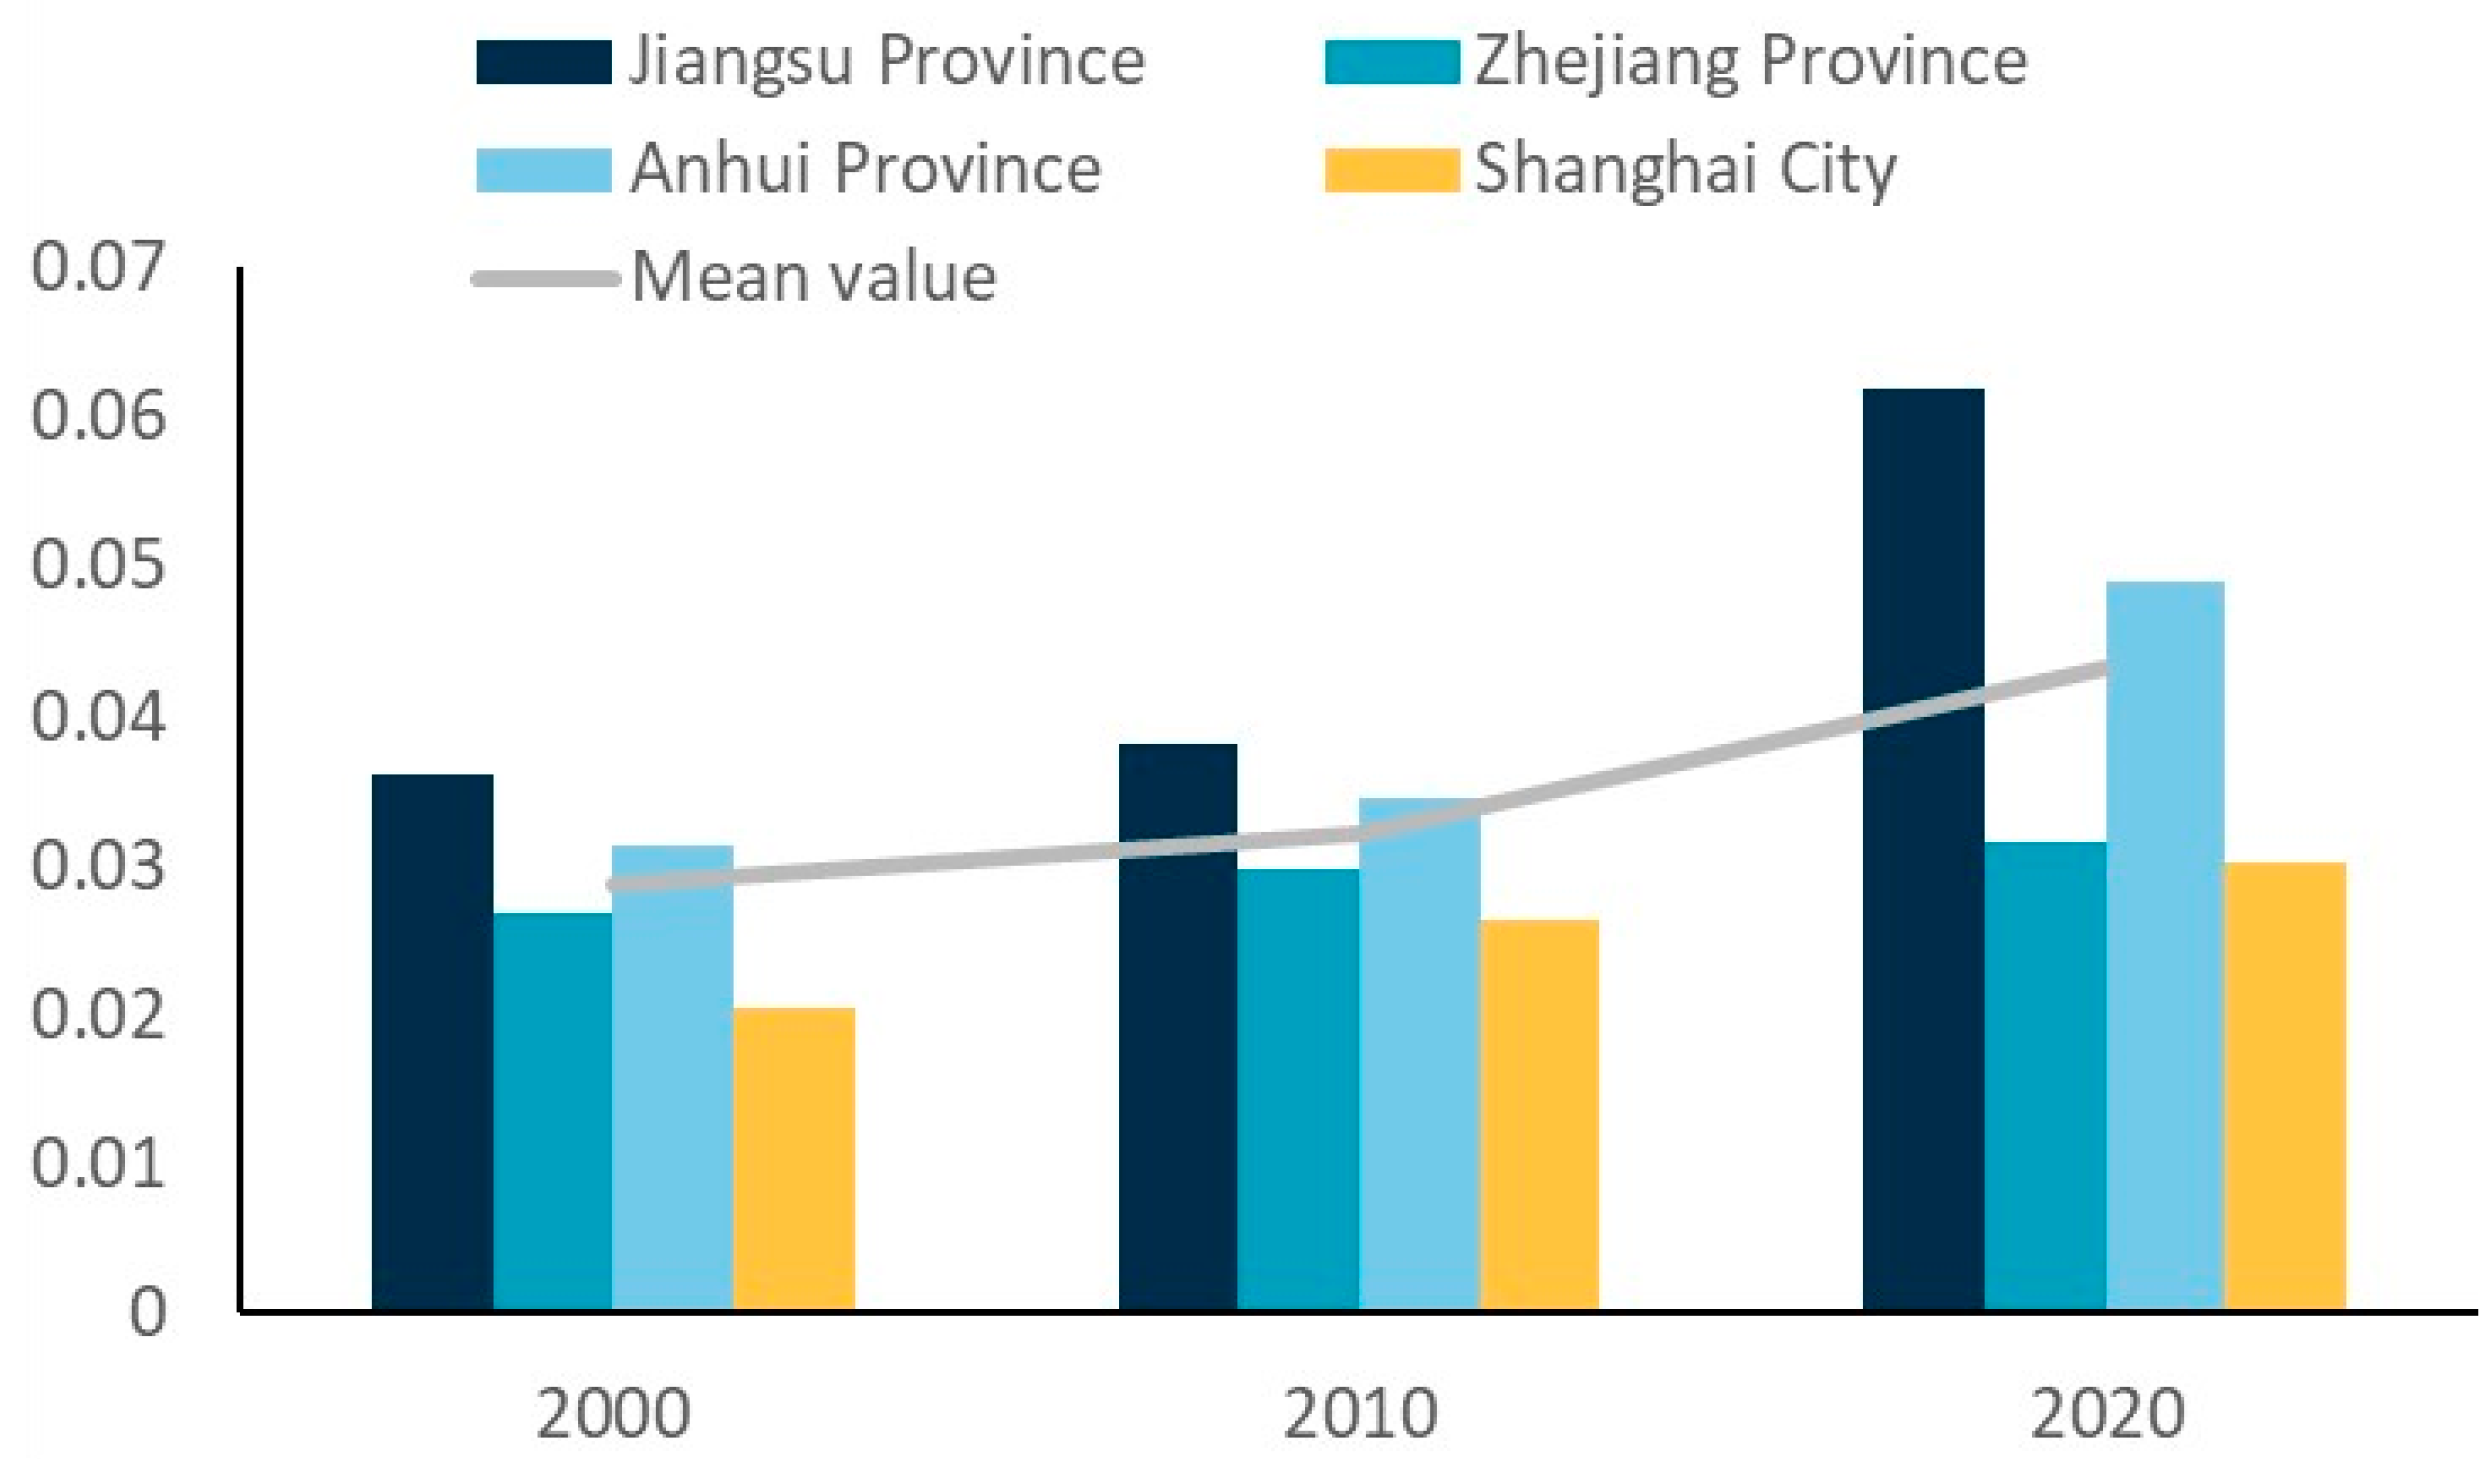
From
Figure 4, comparing the hazard resilience index in the YRD since 2000, it can be observed that the resilience index has increased over the past two decades. Overall, Jiangsu Province exhibits the highest hazard resilience and the fastest development rate. The hazard resilience index for the entire YRD shows a clear upward trend. With the growing recognition of ecological protection, the government has focused on environmental construction, leading to improvements in indicators such as per capita urban park green space and the greening coverage rate of built-up areas. However, the negative impacts of natural disasters on urban flood resilience, exacerbated by global warming and other climate change factors, such as increased rainfall, have also been on the rise, which has slowed the rate of increase in hazard resilience.
3.1.2. Disaster-Formative Environment Resilience Index Zoning
The disaster-formative environment resilience index, as an indicator of a region’s ability to withstand disaster, is typically associated with factors such as the area’s infrastructure development. The index for three time periods since 2000 was uniformly classified into five categories, as shown in
Figure 5.
From
Figure 5a, it can be observed that the disaster-formative environment resilience in the YRD in 2000 exhibited a pattern of higher resilience in the eastern region and lower resilience in the western region, with neighboring cities showing similar resilience indices. The high-value areas were concentrated in Shanghai, with slightly high values distributed in cities such as Shaoxing, Nanjing, and Suzhou.
Figure 5b shows that by 2010, the high-value resilience areas were located in the eastern and southern regions, including economically developed cities like Hangzhou, Shanghai, Nanjing, and Wenzhou. By 2020, the distribution of the disaster-formative environment resilience index remained largely unchanged compared to 2010, with Nanjing and Zhoushan showing improvements to high-value areas, while most regions remained in slightly low- and medium-value categories. Overall, the spatial distribution of disaster-formative environment resilience was relatively stable, and is related to the city’s economic level, social policies, and communication response. High- and slightly high-value areas were concentrated in economically developed cities, such as provincial capitals.
From
Figure 6, it can be observed that the highest disaster-formative environment resilience index is found in Shanghai; however, the rate of increase has slowed. This slowdown is attributed to rapid economic growth and improvements in people’s living standards. For example, when heavy rainfall occurs, the upgraded drainage infrastructure has reduced the risk of flood disasters. Additionally, the development of technology, such as media channels, has enabled timely warnings to residents, helping them avoid flood risks. However, as infrastructure continues to improve, it has gradually limited the rate of increase in the disaster-formative environment resilience index.
3.1.3. Exposure Resilience Index Zoning
The exposure resilience index shows the ability of human society to respond to and overcome from disasters. The resilience indices of the exposure in different time periods of the study area were unified, classified, and visualized. The results of the classification and calculation are shown in
Figure 7.
From
Figure 7a, it can be observed that in 2000, the exposure resilience index in the YRD predominantly showed low and slightly low values, with high-value zones concentrated in the eastern cities such as Shanghai, Suzhou, and Nanjing.
Figure 7b shows that by 2010, some cities, such as Yancheng and Huaian, had seen improvements in their exposure resilience index, with Hangzhou showing the fastest increase.
Figure 7c illustrates that by 2020, the index in the urban cluster had generally reached a slightly high value, showing a significant spatial improvement compared to earlier stages. The high- and slightly high-value zones, which were once concentrated in the northeastern and some central cities, gradually gathered in cities like Shanghai, Nanjing, and Suzhou by 2000, and later in the northeastern regions, such as Shanghai, Hangzhou, and Wuxi in 2020.
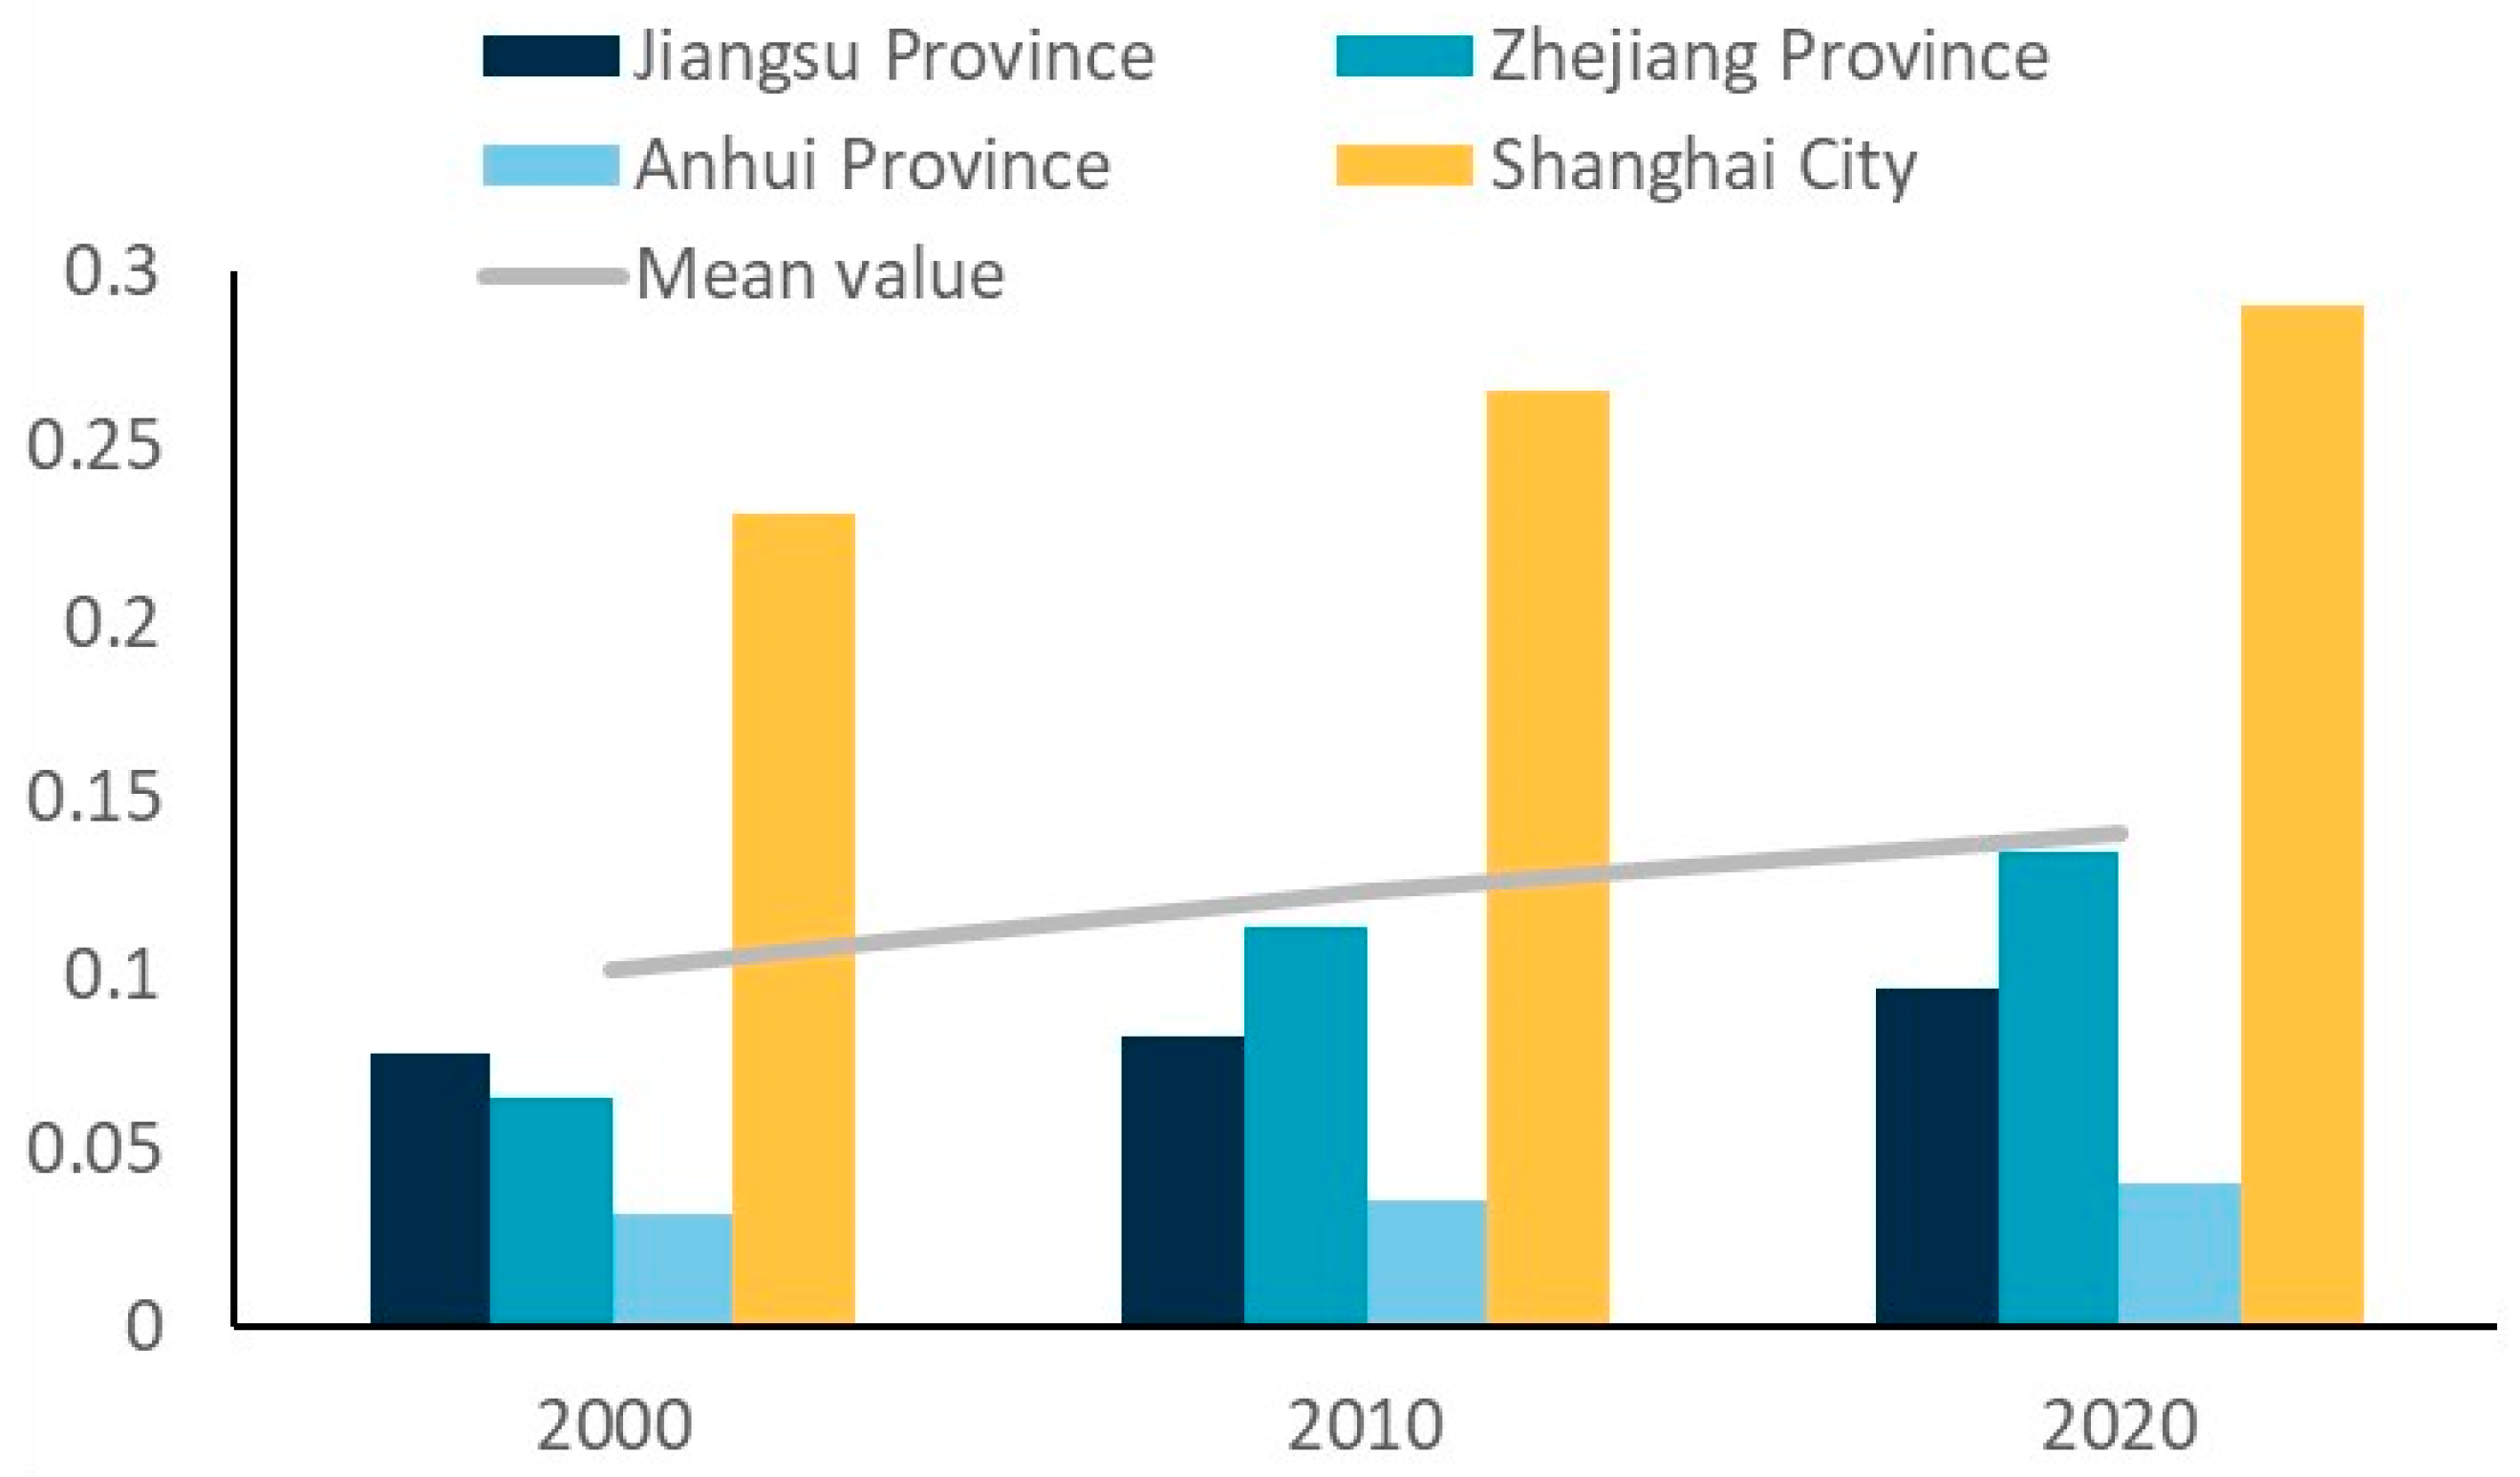
From
Figure 8, it can be observed that the exposure resilience index in the YRD increased steadily across the provinces, with Shanghai being significantly higher than the other provinces, and Anhui province having the lowest index. This indicates that Shanghai has the highest capability to resist and recover from disasters to pre-disaster levels. Between 2000 and 2020, the index steadily increased from 0.199 in 2000 to 0.216 in 2010, and further to 0.243 in 2020. This reflects the enhanced ability of the YRD to respond to and recover from disasters during this period, with improvements in urban flood control measures, healthcare, and other infrastructure developments.
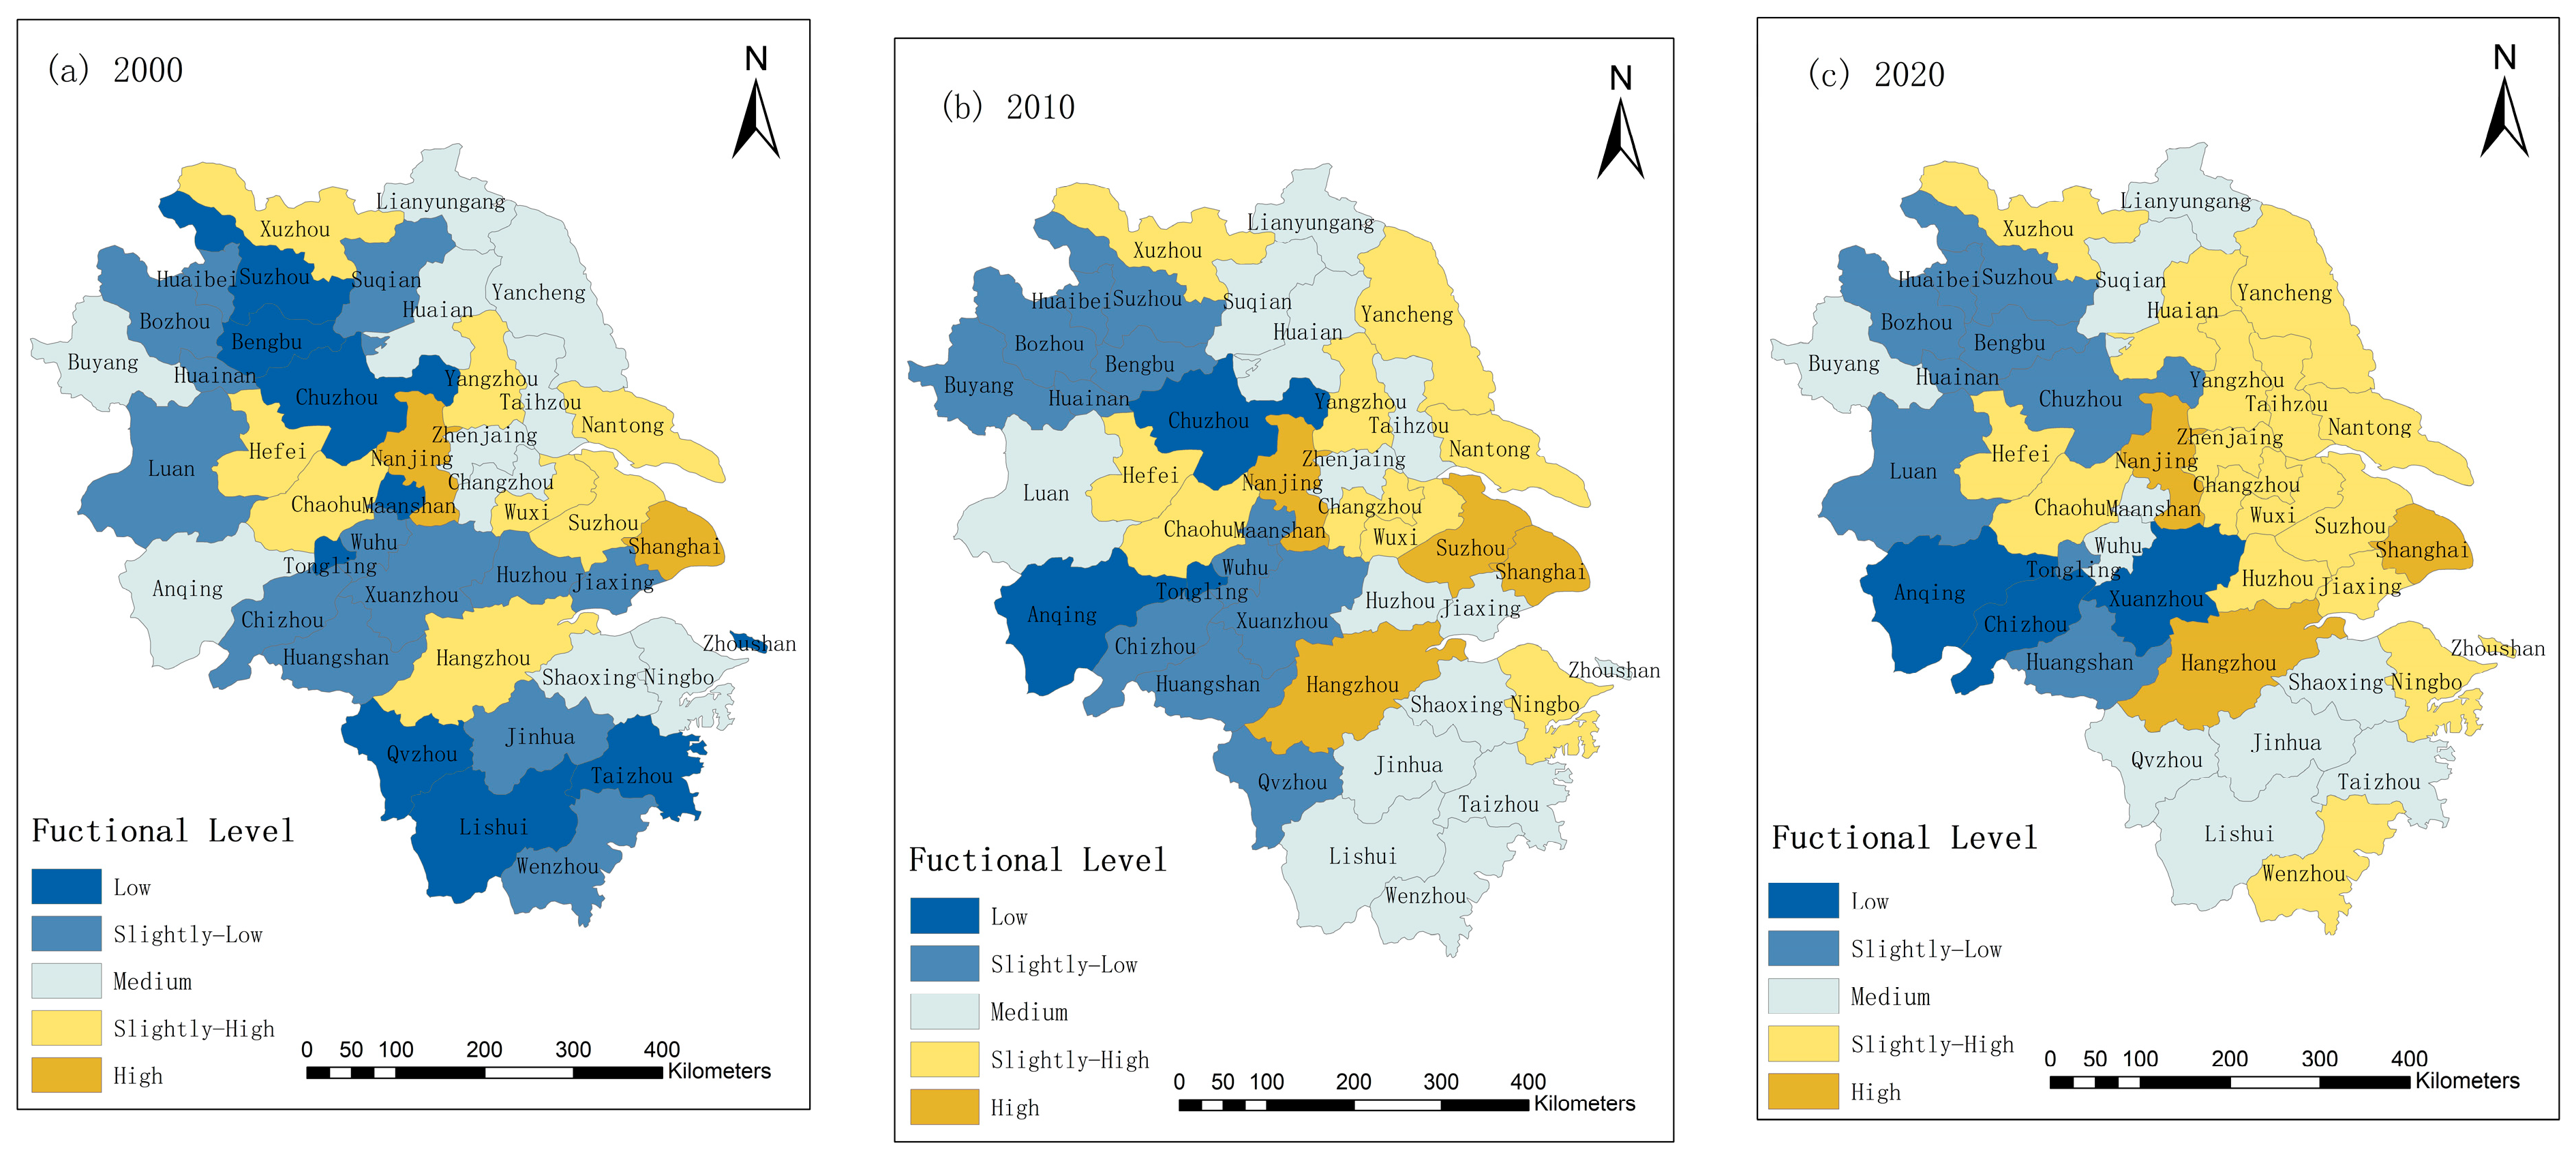
3.1.4. Comprehensive Urban Flood Resilience Index Zoning
By comprehensively considering the three indicator systems of the hazard, disaster-formative environment, and exposure, the comprehensive flood resilience index of the YRD was derived. The final results are shown in
Figure 9.
From
Figure 9a, it can be observed that in 2000, the high and slightly high flood resilience index areas in the YRD exhibited a relatively dispersed distribution. High-value areas included Shanghai and Nanjing, while slightly high-value areas included cities such as Hangzhou, Chaohu, and Xuzhou. Low-value zones were concentrated in cities such as Lishui and Wenzhou in the southern part of the city cluster, as well as cities in the northern part, such as Suzhou and Huaibei. By 2010 (
Figure 9b), Hangzhou and Suzhou had improved from slightly high to high flood resilience index zones. Although the index of most cities had increased, the overall flood resilience level of the city cluster remained at a moderate level. From
Figure 9c, it is shown that in 2020, the cities in the eastern region had flood resilience indices in the slightly high- and high-value categories. Shanghai, Nanjing, and Hangzhou, as provincial capital cities, had high flood resilience indices. While resilience indices in other provinces were in relatively good shape, most cities in Anhui Province still had low resilience levels. The urban flood resilience indices of the YRD showed a general pattern where coastal cities had higher flood resilience indices than inland cities. The high-value zones gradually expanded from Nanjing and Shanghai to include Shanghai, Nanjing, and Hangzhou. Slightly high-value areas expanded from eastern cities in the Jiangsu Province and Hefei, the capital of the Anhui Province, to include Ningbo and Zhoushan in the Zhejiang Province. The middle-value areas were mostly concentrated within the Zhejiang Province. The low-value and slightly low-value areas were concentrated in cities in the Anhui Province with weaker economic development levels.
From
Figure 10, it can be observed that between 2000 and 2020, Shanghai’s urban resilience index was significantly higher than the other three provinces. It increased steadily from 0.654 to 0.683, showing a growth rate of 4.5%. Among these provinces, Zhejiang had the fastest growth in its average urban resilience index, rising from 0.189 to 0.401, an increase of 117%. Jiangsu ranked second in terms of the flood resilience index, with an average value growing from 0.295 to 0.428, a growth rate of 45.4%. Anhui’s flood resilience index increased from 0.191 to 0.324, a growth rate of 69.2%. The average annual urban flood resilience of the YRD showed a significant upward trend, rising from 0.332 to 0.399, and finally reaching 0.459. This indicates that despite the warming climate and increased rainfall, urban areas have strengthened their ability to resist flood disasters. With the improvement in disaster prevention and ecological environmental awareness, urban flood resilience has been enhanced, and the corresponding preventive systems, as well as post-disaster recovery mechanisms such as medical institutions and insurance coverage, have significantly improved.
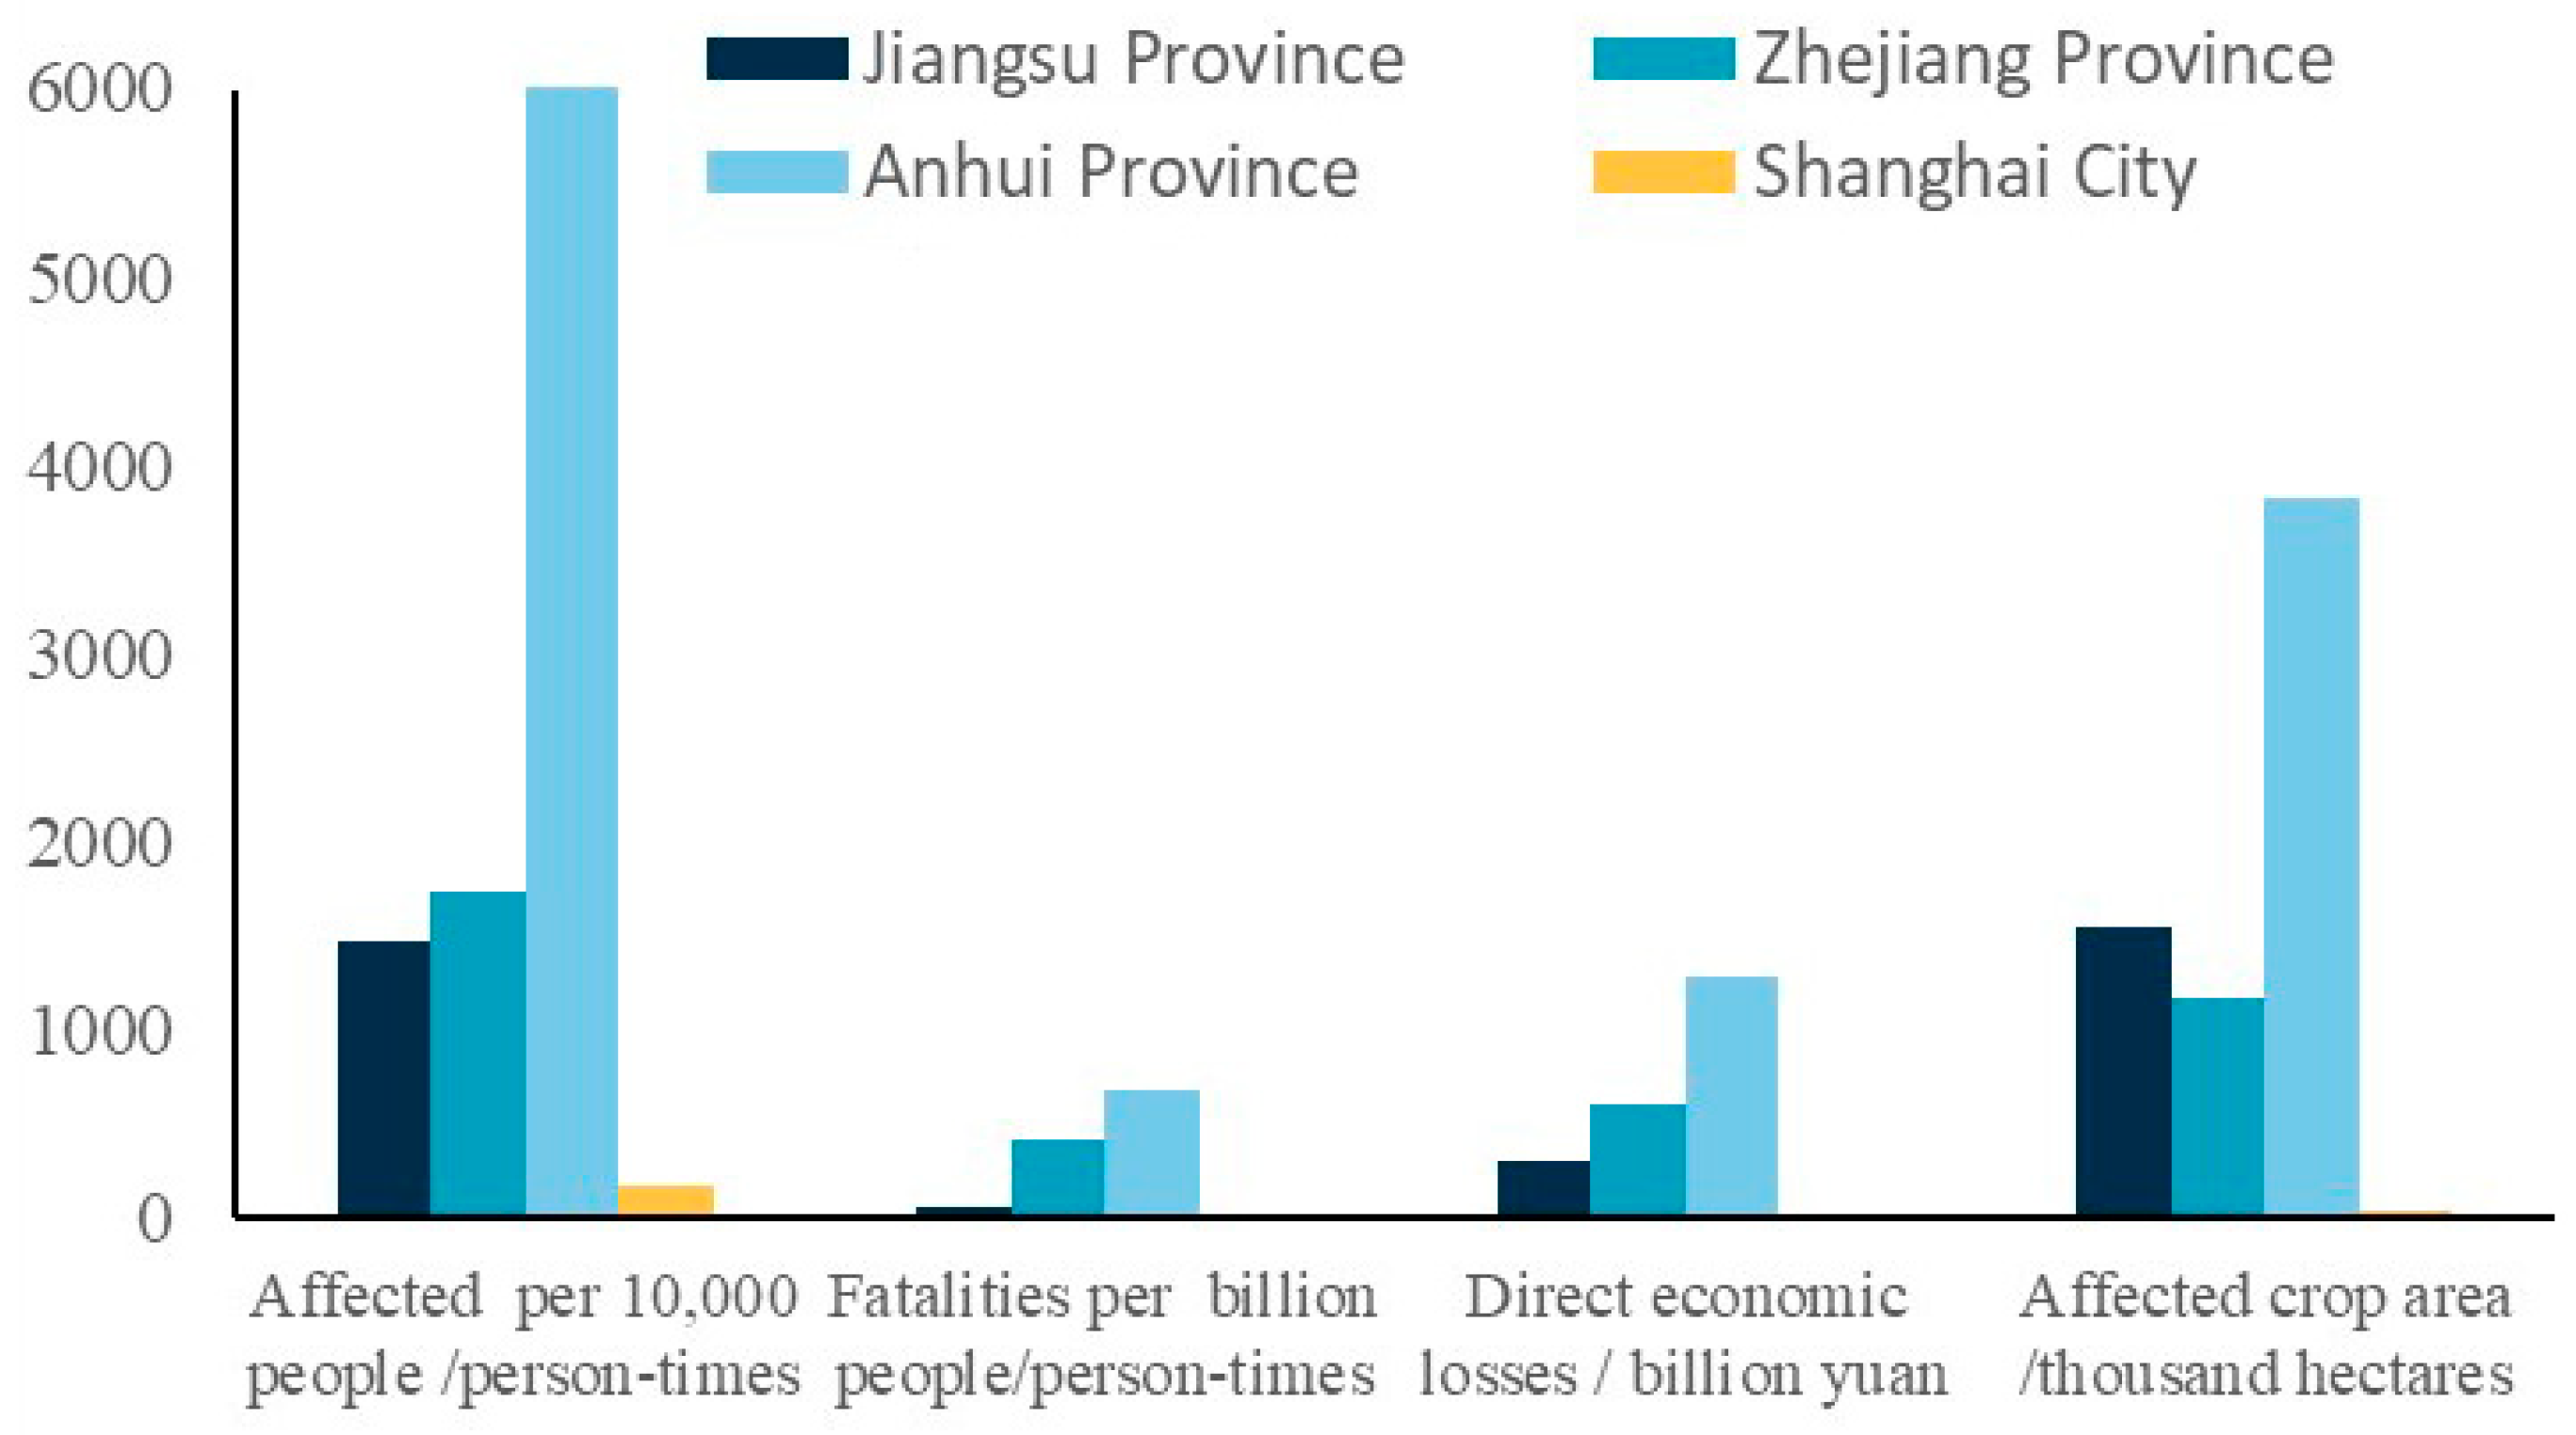
To validate the credibility of the results, statistical data from the China Flood and Drought Disaster Prevention Bulletin 2015–2020 were selected for comparison, focusing specifically on the data corresponding to the final year of the model results. Actual disaster indicators at the provincial scale were chosen, including the disaster-affected population per 10,000 people, fatalities per billion people, direct economic losses, and affected crop area. The statistics obtained are shown in
Figure 11. The figure demonstrates that in recent flood disaster events, the Anhui Province was the most severely affected, with indicators such as fatalities and economic losses due to flooding far higher than those in other regions. This indicates that the city’s flood prevention and disaster reduction capacity is weak, which aligns with the conclusion derived from the research. The Zhejiang and Jiangsu provinces experienced similar disaster impacts, but overall, Zhejiang was more severely affected. In contrast, Shanghai was minimally impacted by the flood disaster, with the effect being nearly negligible. The actual disaster situation is consistent with the results derived from the research, suggesting that the model is credible and can effectively reflect the urban flood resilience levels across different regions.
3.2. Analysis of Clustering Degree and Pattern Characteristics
A local spatial autocorrelation analysis was conducted on the urban flood resilience index of the YRD for the years 2000, 2010, and 2020. This analysis effectively monitors the specific locations of clustered areas within the entire region, resulting in the LISA cluster map shown in
Figure 12.
As shown in
Figure 12, the cities in the YRD primarily exhibit H-H and L-L clustering patterns, with no noticeable L-H clustering effect and no H-L clustering effect. This suggests that the resilience levels exhibit spatial spillover effects, where cities with higher resilience levels strongly influence their neighboring cities with lower resilience levels.
In the H-H clustering areas, Suzhou and Jiaxing had a more significant promoting effect on the central cities along the main axis in 2000. By 2010, Nantong and Zhejiang had also become high-value areas, and by 2020, the index of Suzhou, Wuxi, Nantong, Taizhou, Zhenjiang, and the surrounding cities had risen. As a result, the H-H clustering area in the eastern part of the YRD became more distinct, reflecting the close spatial connection of urban flood resilience levels in this region. In the L-L clustering areas, cities like Chizhou, Huangshan, and Huaibei in the Anhui Province were part of the low-resilience cluster in 2000. By 2010, the L-L clustering area had remained mostly unchanged, including cities like Chizhou, Huangshan, and Bozhou, which were still located within the Anhui Province. By 2020, the L-L clustering area included cities such as Bengbu and Quzhou, indicating that these regions formed a low-resilience zone in the western part of the YRD, with a spatially intensified low-resilience characteristic. During the study period, a low-resilience “depression” area emerged in the western part of the city cluster. In 2000, there were no cities with an L-H clustering pattern in the YRD. By 2010, cities like Huzhou and Jiaxing appeared in this category, and by 2020, only Jiaxing remained. This suggests that these cities had lower resilience levels compared to the surrounding areas, creating a “hollow” differentiation pattern where the surrounding cities had higher values, while the center had lower-value levels. Cities like Shanghai and Hangzhou, due to insufficient spillover effects, showed a significant gap between the cities in the cluster.
The indicator data for cities in the YRD region in 2000, 2010, and 2020 were used in a stepwise regression model to calculate and identify the indicators with the greatest impact on spatial clustering. The results are shown in
Table 3, where the entered variables are those that significantly affect spatial clustering. B represents the coefficients of the variables in the fitted equation, with larger values indicating a greater impact on the clustering degree.
In 2000, a total of nine indicators significantly influenced the flood resilience level. The R² of the fitted equation was 0.809, indicating a good fit. Among these, the per capita disposable income, resident population, and the density of drainage pipes in built-up areas had the greatest impact on spatial resilience and its degree. In 2010, there were eight entered variables. The indicators with the greatest impact were the per capita disposable income, the number of social insurance participants, and the density of drainage pipes in built-up areas, while annual precipitation had a negative effect. In 2020, there were 10 entered variables, and the R² of the fitted equation was 0.877, indicating a good fit. The variables with the greatest impact included the per capita disposable income, greening coverage of built-up areas, and the number of social insurance participants. The variable showing a negative impact on spatial clustering was the average annual temperature.
4. Discussion
This study constructs an evaluation system from three aspects: the hazard, disaster-formative environment, and exposure [
51,
52]. With the entropy weight method and GIS natural breakpoint analysis, the urban flood resilience of cities in the YRD from 2000 to 2020 was assessed, and the temporal and spatial patterns, as well as the main influencing factors, were analyzed. Additionally, a quantitative analysis was conducted on the urban flood resilience levels, considering the socioeconomic development level and natural changes. The Local Indicator of Spatial Association (LISA) method was applied to reveal the spatial clustering patterns of urban resilience [
53,
54]. Previous research on urban flood resilience in the YRD is limited, and most studies focus on the mechanisms of flood disasters [
55,
56] and risk assessments [
57,
58], with little emphasis on quantifying urban flood resilience and conducting spatial correlation analysis. Furthermore, most studies on flood resilience tend to emphasize the ecological and environmental aspects, using ecological indicators for evaluation [
59,
60]. Cities are influenced not only by natural environmental factors, but also by human social activities. While environmental factors play a significant role in the occurrence of floods, human activities within cities also have a major impact on disasters and can be improved in the short term through planning and policy measures. Therefore, this study adopts a human-centered urban perspective, focusing on social and economic indicators. Through this innovative approach, it aligns more closely with the actual conditions of cities, highlighting the inter-relationship between human activities and nature, thereby improving the precision of urban flood resilience assessments.
4.1. Spatial–Temporal Distribution Pattern of Urban Flood Resilience
4.1.1. Spatial Pattern of Urban Flood Resilience
The hazard resilience is linked to the urban natural environment. High-value areas benefit from stronger environmental foundations, while low-value areas often suffer from a weaker ecological infrastructure or frequent natural disasters. For example, cities in low-lying coastal regions of Shanghai and Zhejiang face severe flooding due to typhoons and heavy rainfall, exacerbated by urbanization and surface hardening. The resilience of the disaster-formative environment depends on social governance and infrastructure development. Cities in Anhui, with underdeveloped infrastructure, particularly in drainage and transportation, struggle with disaster prevention. Exposure resilience is linked to social development. High-value cities, with better education, welfare, and medical facilities, improve their response and recovery capabilities. Overall, the areas of urban flood resilience tend to have slower economic development and weaker social security systems, with gaps in healthcare, insurance, and education, resulting in an insufficient emergency response capacity. High-value cities, although affected by a higher population density and larger disaster-prone areas, benefit from superior economic conditions, government investment in infrastructure, information and transportation systems, and medical facilities, providing strong response and recovery capabilities.
4.1.2. Temporal Trend of Urban Flood Resilience
Over time, the resilience to hazards has increased, particularly from 2010 to 2020, as urban development and ecological protection efforts have mitigated flood impacts. For instance, during the 13th Five-Year Plan, the Jiangsu Province promoted urban greening and sponge city construction, enhancing water management capabilities. The resilience of the disaster-formative environment has improved, though the growth rate has slowed, indicating that improvements in urban planning and infrastructure are nearing a bottleneck. Exposure resilience has steadily grown, reflecting improvements in urban emergency management and health security systems. Overall, urban flood resilience is undergoing steady advancement. This trend reflects the fact that, despite the increased rainfall due to climate change, the implementation of disaster prevention and reduction plans, sponge city construction, and regional collaborative disaster prevention policies have led to coordinated urban development. Consequently, urban flood resilience has become more balanced, the ability to withstand heavy rainfall and flood disasters has strengthened, prevention systems have gradually improved, and medical and recovery systems after disasters have seen significant enhancement.
4.2. Spatial Clustering Pattern of Urban Flood Resilience
Regarding the spatial clustering pattern, cities mostly show H-H clustering and L-L clustering, indicating that cities are closely linked economically and socially, with strong interactions between economic activities, industrial layout, and labor distribution. L-L clustering is mainly found in the Anhui Province, while H-H clustering is concentrated in the eastern part of the YRD, suggesting regional imbalances in the policy direction and resource allocation. For instance, resource shortages in many cities in the Anhui Province lead to a weak flood response and recovery capacities. The stepwise regression model was applied to identify the factors that significantly influence spatial clustering. Although the indicators that have the greatest impact on flood resilience levels differ across time periods, the influence of indicators such as the per capita disposable income, the number of people covered by social insurance, and the density of drainage pipes in built-up areas remains significant. These indicators improve flood resilience by enhancing residents’ emergency recovery capacity and post-disaster support capacity. There are significant differences in economic development, social security, and infrastructure across cities in the YRD, which results in diverse spatial clustering types. For example, the eastern region, with its superior economic and social development compared to other regions, forms an H-H clustering in the spatial layout of resilience. This indicates that urban flood resilience spatial differences are not only caused by natural factors, but also the economic growth, social welfare, and infrastructure construction.
4.3. Recommendations for Future Urban Planning
The study evaluates the flood resilience in the YRD. To enhance resilience, support urban planning, and aid decision making, the following recommendations are proposed. For lower-resilience cities (e.g., Anhui), weak disaster-formative environment and exposure, along with lower urbanization, necessitate leveraging regional integration, learning from metropolitan areas (e.g., Nanjing), and promoting high-quality development led by Hefei. Enhancing “smart water conservancy” monitoring and adopting grid-based early warning systems can improve the disaster response. With high hazard resilience, Anhui should also strengthen ecological protection, coordinate ecological compensation, and enhance green flood infrastructure. The Zhejiang Province demonstrates a moderate level of ecological resilience. Its disaster-formative environment exhibits strong resilience, indicating significant advantages in urban infrastructure development and the ability to withstand flood disasters. Therefore, future development should ensure a stable upward trajectory in resilience. However, as a coastal province, Zhejiang experiences intense rainfall caused by typhoons, resulting in a relatively low hazard resilience level. It should adopt Shanghai’s early warning and flood management strategies and collaborate with Jiangsu on Taihu Basin flood control. Jiangsu and Shanghai, with high resilience, should sustain balanced development and foster eco-friendly cities. Overall, the YRD should enhance cooperation, leveraging key cities (Shanghai, Nanjing, Hangzhou, and Suzhou) to build ecological corridors and strengthen regional resilience.
4.4. Limitations and Future Directions
In summary, this study constructs a flood resilience assessment framework. But there are still some limitations. This study uses administrative divisions as the research scale, and future studies could adopt a more detailed multi-scale approach to analyze urban flood resilience at different scales. Due to the availability of data and the scope, this research employed a larger time scale to reflect the long-term trend of urban flood resilience. However, it overlooks short-term fluctuations. In future studies, we will consider narrowing the time scale to better reflect the short-term impacts of flood risks, thus enhancing the accuracy of the research results. Additionally, this study primarily selects indicator factors based on socioeconomic levels and lacks the consideration of other natural factors. Future research should further explore these aspects. Furthermore, due to the wide applicability of the research. In the future, the framework can be further optimized by selecting targeted indicators based on regional characteristics and attributes, thereby adapting to areas with different natural conditions and socioeconomic development levels, enhancing the framework’s universality.


