Article

A Geometric Attribute Collaborative Method in Multi-Scale Polygonal Entity Matching Scenario: Integrating Sentence-BERT and Three-Branch Attention Network

Chinese Academy of Surveying and Mapping, Beijing 100036, China
*
Author to whom correspondence should be addressed.
ISPRS Int. J. Geo-Inf. 2025, 14(11), 435; https://doi.org/10.3390/ijgi14110435
Submission received: 29 August 2025 / Revised: 27 October 2025 / Accepted: 1 November 2025 / Published: 3 November 2025

Abstract

The cross-scale fusion and consistent representation of cross-source heterogeneous vector polygon data are fundamental tasks in the field of GIS, and they play an important role in areas such as the refined management of natural resources, territorial spatial planning, and the urban emergency response. However, the existing methods suffer from two key limitations: the insufficient utilization of semantic information, especially non-standardized attributes, and the lack of differentiated modeling for 1:1, 1:M, and M:N matching relationships. To address these issues, this study proposes a geometric–attribute collaborative matching method for multi-scale polygonal entities. First, matching relationships are classified into 1:1, 1:M, and M:N based on the intersection of polygons. Second, geometric similarities including spatial overlap, size, shape, and orientation are computed for each relationship type. Third, semantic similarity is enhanced by fine-tuning the pre-trained Sentence-BERT model, which effectively captures the complex semantic information from non-standardized descriptions. Finally, a three-branch attention network is constructed to specifically handle the three matching relationships, with adaptive feature weighting via attention mechanisms. The experimental results on datasets from Tunxi District, Huangshan City, China show that the proposed method outperforms the existing approaches including geometry–attribute fusion and BPNNs in precision, recall, and F1-score, with improvements of 3.38%, 1.32%, and 2.41% compared to the geometry–attribute method, and 2.91%, 0.27%, and 1.66% compared to BPNNs, respectively. A generalization experiment on Hefei City data further validates its robustness. This method effectively enhances the accuracy and adaptability of multi-scale polygonal entity matching, providing a valuable tool for multi-source GIS database integration.

1. Introduction

In the ongoing digitalization process of smart cities and territorial space governance, multi-source heterogeneous vector data is accumulating at an exponential rate. However, the consistent expression across scales and semantics remains a key bottleneck. To achieve spatiotemporal integrated governance and business collaboration, it is necessary to reliably identify the polygon corresponding relationships of the “same real entity” under different scales and mapping standards, thereby supporting downstream tasks such as data fusion, temporal update, and change detection [1,2,3]. Compared with linear features, polygons exhibit more significant shape generalization, boundary displacement, and variations in the hole and multipart structures during scale changes, resulting in the complex corresponding relationships of homonymous objects, such as 1:1, 1:M, and M:N [4,5,6]. Therefore, constructing a polygon matching method that can characterize geometric–topological–semantic contexts and adapt to scale differences is of great significance for improving the consistency and timeliness of multi-source GIS databases [7,8].
The early research on map merging proposed a matching and registration framework based on heuristic rules, laying the foundation for object-level matching [1,2]. The area overlap index was first used to handle such problems [9]. In terms of the geometric similarity measurement, the calculation indicators of the geometric similarity include position, size, shape, orientation, etc., and matching is achieved by calculating the comprehensive similarity [10,11], but its effect in multi-scale matching is still unsatisfactory [12]. To address the one-to-many and many-to-many matching problems caused by scale differences, recent studies have gradually focused on “multi-scale”-oriented object context modeling and hierarchical/cognitive matching strategies. For example, multi-to-many building-/land-parcel-corresponding relationships are identified through neighborhood context aggregation and iterative optimization [13]; the matching accuracy of building polygons under scale transformation is improved by combining Minimum Bounding Rectangle Combinatorial Optimization (MBRCO) with geometric–topological indicators [14]. The matching problem is transformed into a classification problem, with precision, recall, and F1-score adopted as training metrics. Bayesian optimization is utilized to adjust the model hyperparameters and determine each feature threshold [15]. Reference [16] extracts precise topological relationships from the data for the certification of irregular tessellations. Additionally, other studies have conducted a spatial relationship analysis from both the meso-spatial scale and micro-spatial scale [17]. In the field of road networks and other linear networks, ideas such as Voronoi diagrams, hierarchical clustering, and Summation of Orientation and Distance (SOD) comprehensive indicators have been used for multi-scale network matching, reflecting the comprehensive constraint idea of “geometry + structure + context” [18,19,20], and their multi-scale modeling logic provides important enlightenment for polygon feature matching. Some studies have systematically compared various matching methods to distinguish between “reconstruction” and “replacement” and discussed the impact of different geometric metrics and thresholds on the conclusions [21]. Other studies have proposed a direct “image-vector”-coupled road fusion framework [22], providing a new data and constraint channel for cross-source/cross-scale matching.
However, relying solely on geometric or topological features makes it difficult to distinguish objects with a “similar appearance but different semantics” in heterogeneous data. Therefore, fusing the attribute semantic information (such as name, category, etc.) has become an important direction for improving the accuracy and interpretability of matching [23,24,25]. For example, Reference [26] established a geographic entity semantic similarity measurement model based on multi-feature constraints for road matching. Reference [27] introduced Term Frequency–Inverse Document Frequency (TF-IDF) to calculate the dynamic weights of feature attributes and proposed corresponding similarity algorithms according to different types of feature attributes. In recent years, the application of machine learning and embedded semantic representation has further promoted the development of this field. By learning geometric–semantic joint feature vectors, transferable matching on a larger range of datasets has been realized [28], confirming that the fusion of geometry and semantics can improve the adaptability of methods to cross-scale, multi-source, and cross-modal data, which is an important development direction in the future.
The current research still has limitations in two aspects: First, the utilization of attribute semantics is insufficient. The existing semantic similarity calculations mostly rely on standardized attributes such as names, codes, and categories [29]; however, due to the inconsistent production standards for data, the attribute structures of the data from different sources are inconsistent, making it difficult to calculate the semantic similarity, as shown in Table 1, which makes it difficult to deal with non-standardized descriptions, cross-lingual labels, or differentiated semantic attributes, limiting the mining of the potential of semantic information. The context-pre-trained language models in the field of natural language processing (such as BERT) have strong complex semantic representation capabilities. The Sentence-BERT model, especially, optimized by contrastive learning can achieve better semantic matching through the sentence vector cosine similarity calculation [30,31]. Introducing it into multi-source object matching in GIS is expected to break through the limitations of traditional methods and improve the modeling ability of complex attribute semantics.
Second, although the existing studies have conducted differentiated processing for 1:1, 1:M, and M:N matching relationships, such research still remains as the collation and optimization of traditional methods [28]. For machine-learning approaches, due to the varying complexity of features across different matching relationships, the corresponding feature thresholds and weights ought to differ. However, no model has yet achieved differentiated modeling for these matching relationships. Other studies offer methods that can be drawn upon. For instance, Reference [32] employs a three-branch structure with top-down and lateral connections, fusing features from different layers of the backbone network, which effectively enhances the detection accuracy for objects of varying scales in object detection. Reference [33] dynamically selects “expert” sub-networks via a gating network to process inputs, adaptively allocating computing resources based on data characteristics, thereby reducing redundant computations and improving the model capacity. These studies validate multi-branch structures for multi-dimensional tasks, inspiring the design of a three-branch network to adapt to complex matching scenarios.
To address the above problems, this paper proposes a multi-scale polygonal entity geometric–attribute collaborative matching method based on Sentence-BERT and the three-branch attention network. To solve the problem of insufficient attribute utilization, the pre-trained Sentence-BERT model is fine-tuned to deeply mine the semantic information of complex attributes such as non-standardized descriptions, accurately calculate the semantic similarity of polygonal entities, and break through the limitations of traditional methods that rely on standardized attributes and simple comparison indicators. To solve the problem of no differentiated modeling for matching relationships such as 1:1, 1:M, and M:N, first, the matching types are divided based on polygon intersection relationships, and then the shape, size, orientation similarity, spatial overlap, and semantic similarity under different types are calculated in a targeted manner, and, finally, a three-branch network based on the attention mechanism is constructed to realize the specialized classification processing of various matching relationships, adapting to the differences in the feature complexity of different relationships. The structure of this paper is arranged as follows: Section 2 introduces the dataset and elaborates on the proposed method, Section 3 shows the experimental design and results, Section 4 discusses the method, and, finally, Section 5 summarizes the full text.

2. Multi-Scale Polygonal Matching Method

2.1. Overall Framework of the Method

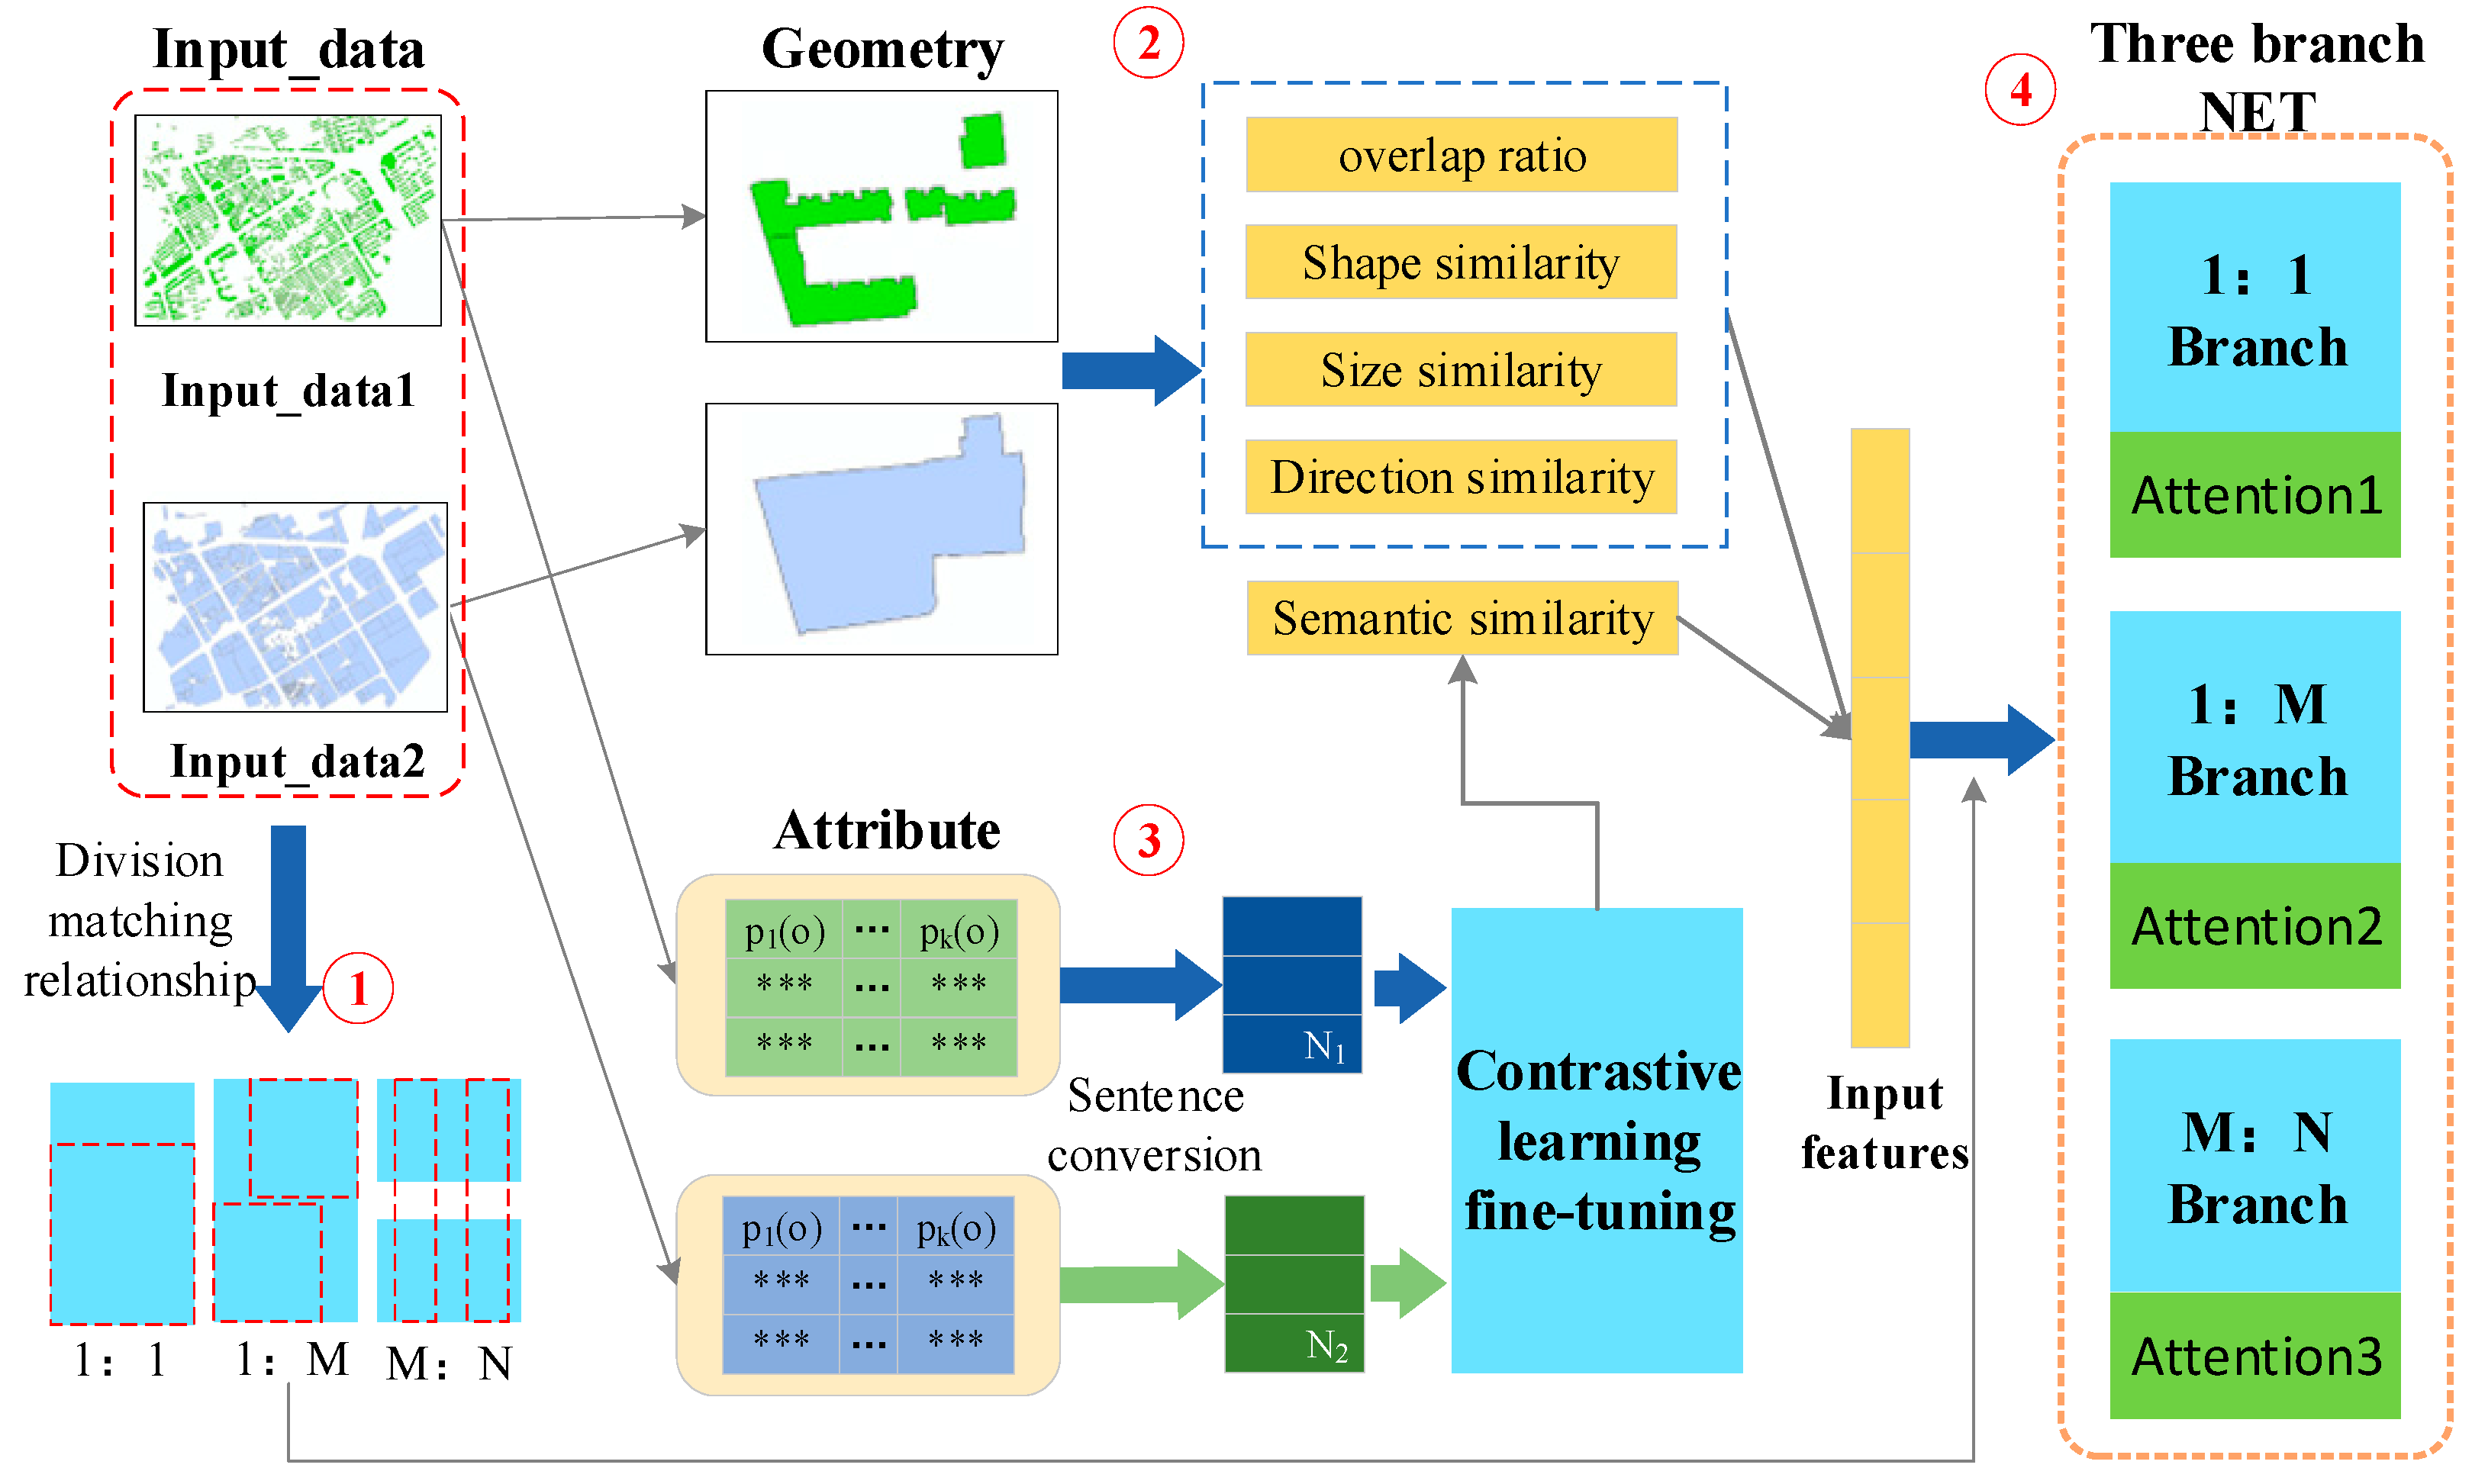
This paper proposes a geometric–attribute collaborative matching method for multi-scale polygonal entities based on Sentence-BERT and a three-branch attention network, which can calculate the semantic similarity of attributes with complex structures and adapt to various matching relationships. The method consists of four core steps, as shown in Figure 1. First, based on the intersection relationships between polygons, the matching relationships are classified into three categories: 1:1, 1:M, and M:N. Second, for different types of matching relationships, the spatial overlap and similarities in the shape, size, and orientation of polygons are calculated, respectively. Third, the pre-trained Sentence-BERT model is fine-tuned through contrastive learning to compute the semantic similarity of polygonal entities. Finally, an attention-mechanism-based three-branch matching network is constructed to perform targeted classification processing on various matching relationships.

2.2. Subsection

The key to polygonal entity matching is to accurately identify candidate sets. The matching relationships of corresponding entities in different datasets include 1:1, 1:M, and M:N. The Minimum Bounding Rectangle (MBR) [34], as an efficient spatial index structure, can be used for quickly filtering non-matching candidates in entity matching. When there is a position deviation in the dataset, the real spatial position of the entity may deviate from the nominal value, and matching directly based on the original coordinates is prone to misjudgment. At this time, using MBR to approximate the entity’s bounding box can effectively narrow the range of candidate sets and reduce invalid matching calculations by calculating the spatial relationship between MBRs. When there is no position deviation in the dataset, the spatial position of the entity can directly reflect its real association, and the matching logic can be constructed through the intersection relationship between polygonal entities. In this paper, entities and intersection relationships are abstracted into a graph model, and clusters are divided through the connectivity of the graph to identify matching types: Node definition: Let the set of polygonal entities in dataset A be V A = a 1 , a 2 , , a m , and the set of polygonal entities in dataset B be V B = a 1 , a 2 , , a n . Then, the node set of the graph is the union of the two types of entities, V = V A V B . Edge definition: If there is a spatial intersection relationship between entity a V A and b V B , an edge is established between the corresponding nodes. The edge set E is defined as the following formula:
E = a , b | a V A , b V B , a b 0
Graph model construction: An undirected graph G = V , E is composed of node set V and edge set E, where the existence of edges directly reflects the spatial intersection association between entities. The connected component [35] of graph G refers to the largest subgraph where any two nodes are connected by edges, and nodes outside the subgraph have no connection with nodes inside the subgraph. Each connected component represents a set of entities with direct or indirect intersection relationships. Let the set of connected components of graph G be C = C 1 , C 2 , , C k , where the i-th cluster   C i can be expressed as follows:
C i = V A , i V B , i ,   V A , i   V A ,   V B , i   V B
Based on the number of entities in the cluster, the matching relationships can be divided into three categories, as shown in Table 2:
When using intersection analysis tools to process polygonal entities, such as ArcMap or GeoPandas [36], there are two typical misjudgment problems. First, adjacent entities with only a boundary line contact are misjudged as intersecting, but, in fact, this is only a line intersection with no area intersection, as shown in Figure 2a; and, second, it is too sensitive to small area intersections, thus incorrectly including them in effective intersection relationships, as shown in Figure 2b. These misjudgments will have a negative impact on the determination of candidate sets.
To this end, the model-training method adopted in this paper is as follows: by adjusting the overlap threshold, the accuracy of the candidate set under different threshold conditions is calculated. Only when the overlap of two intersecting polygonal entities reaches the set threshold will they be recorded as intersecting. Then, the threshold corresponding to the highest accuracy is determined as the input parameter of the model, so as to improve the accuracy of the model in judging the intersection relationship of polygonal entities.

2.3. Similarity of Geometric Features

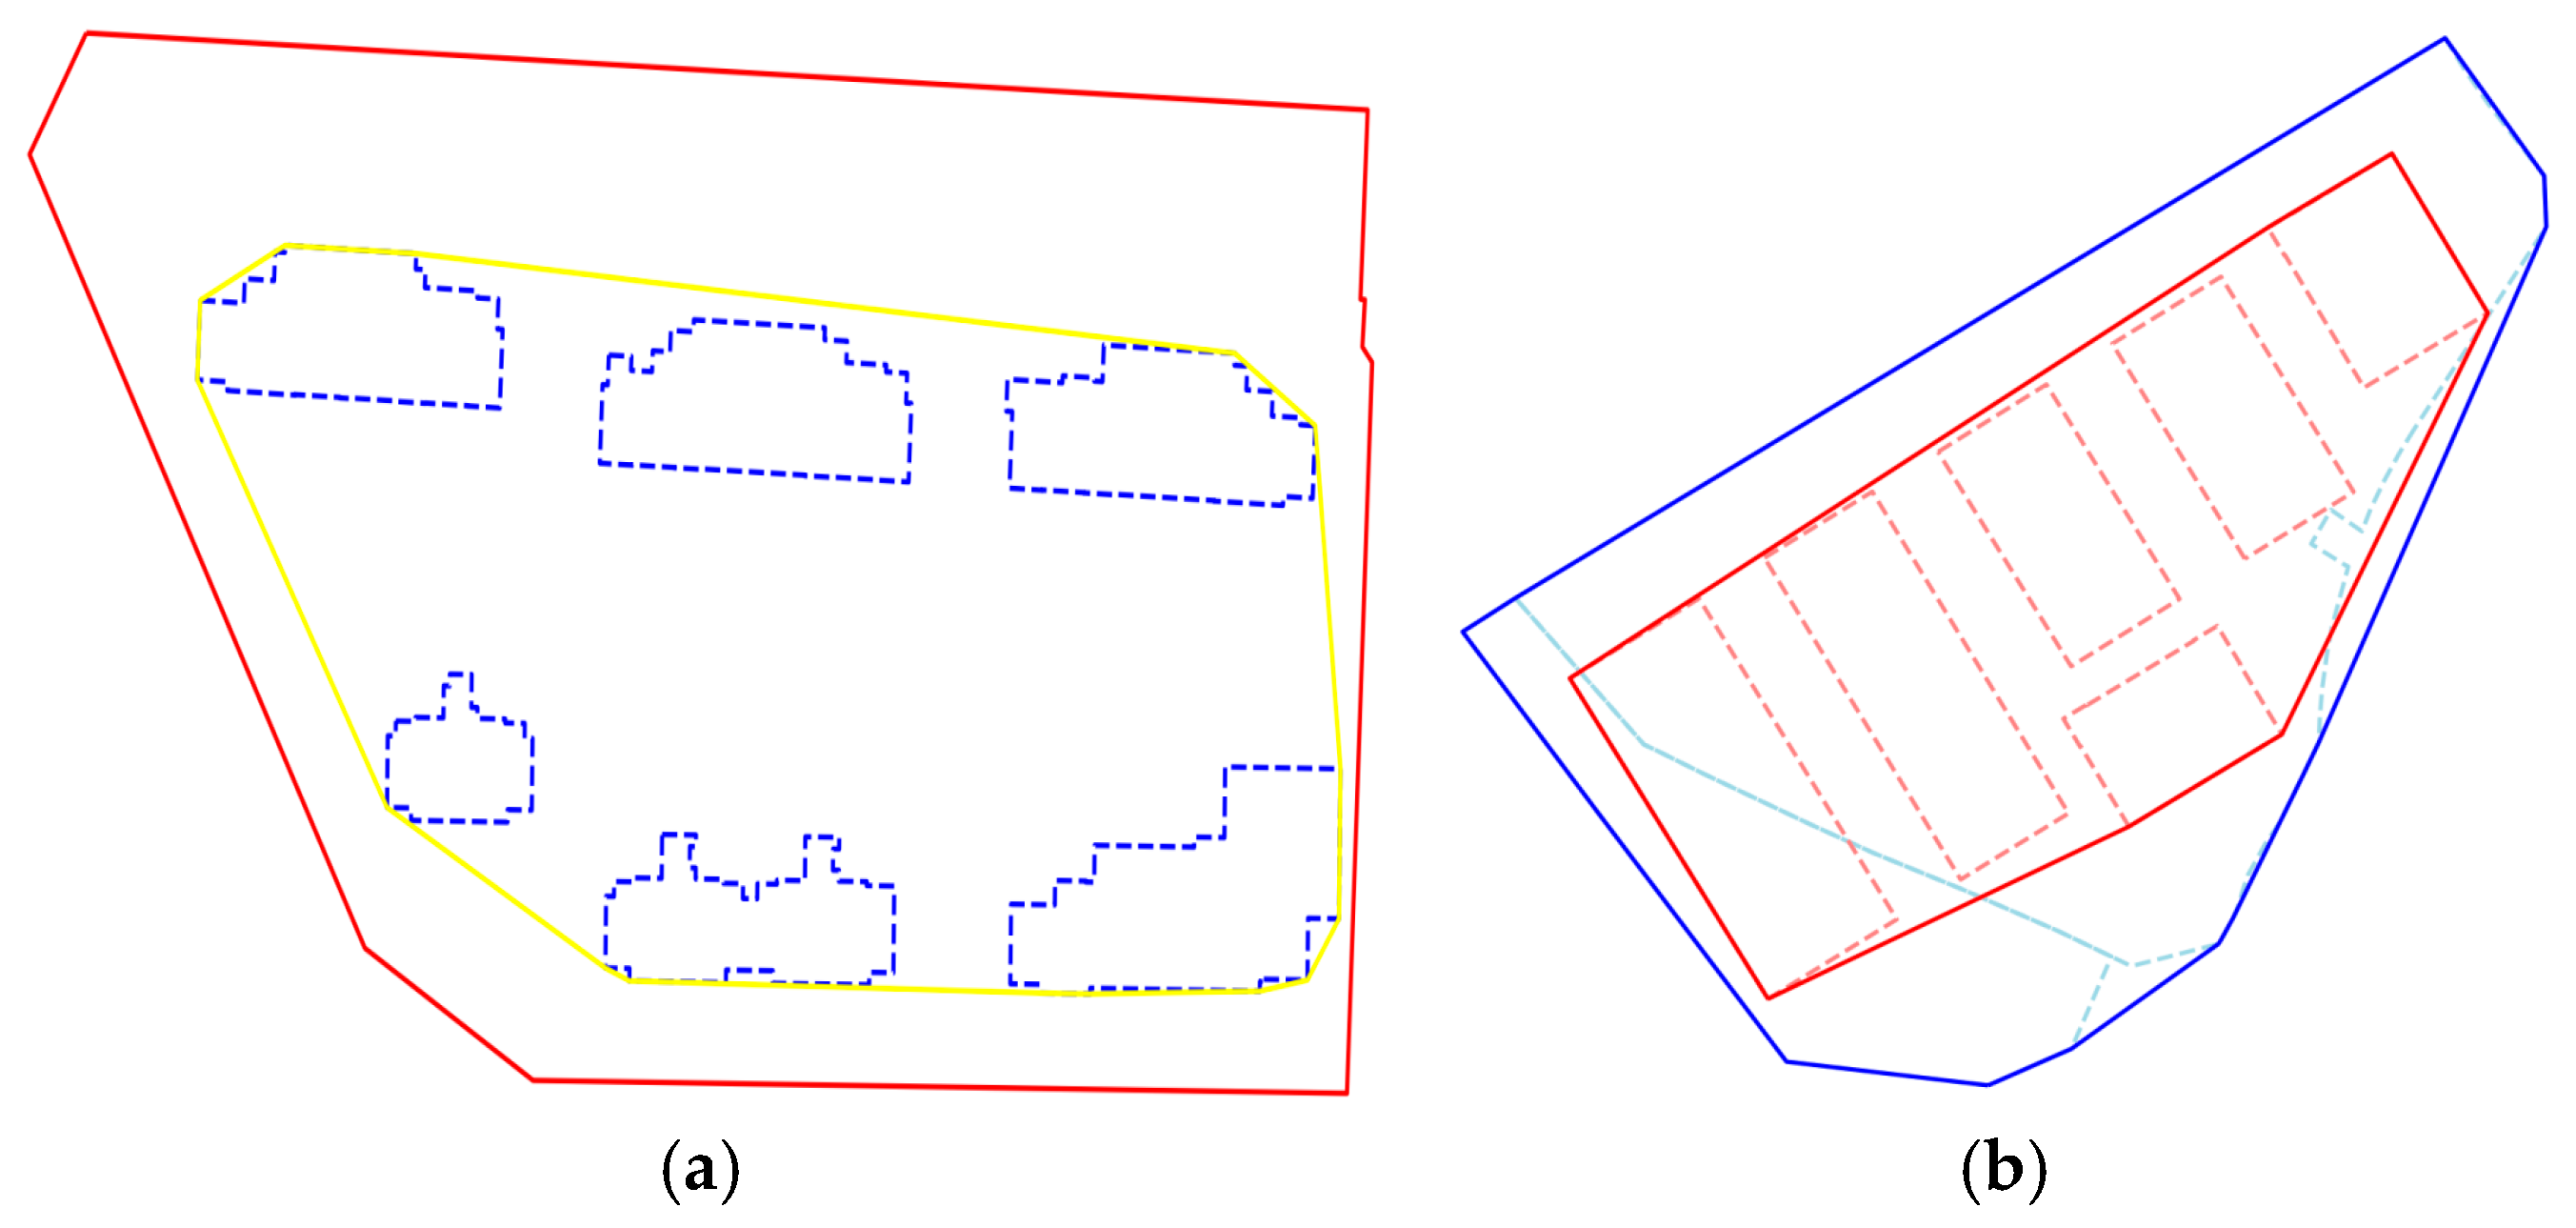
The similarity indicators of geometric features include spatial overlap, size similarity, shape similarity, and orientation similarity. The calculation methods of various indicators are very mature and have been introduced in many works of literatures. Convex hulls are used to combine multiple aggregated entities into independent surface entities to calculate the similarity, as shown in Figure 3.
The methods adopted in this paper are as follows:
The calculation method of spatial overlap is as follows:
O = S cross max S 1 , S 2
where S cross is the overlapping area, and S 1 , S 2 are the areas of the two entities, respectively.
The calculation method of the size similarity is shown in Formula (4):
M = 1 S 1 S 2 max S 1 , S 2
where S 1 , S 2 are the areas of the two entities, respectively.
The shape similarity is calculated based on the difference in Fourier descriptors. Let C 1 and C 2 be the Fourier descriptors of two shapes, as shown in Formula (5):
I = 1 n i = 1 n 1 C 1 i 1 C 2 i
where n is the length of the Fourier descriptor, and C 1 i and C 2 i are the i-th elements of C 1 and C 2 , respectively. The smaller the similarity value is, the more similar the two shapes are.
The calculation method of the orientation similarity is shown in Formula (6):
D = θ a θ b θ τ
where θ a and θ b are the directions of polygonal entities a and b, respectively. Generally, the diagonal direction of the minimum bounding rectangle is used instead. θ a   [0, 2π], θ b   [0, 2π]; θ τ is the direction threshold, which is generally set to θ τ = π 2 .

2.4. Semantic Similarity

The calculation of semantic similarity adopts the framework based on Sentence-BERT [31], and the semantic matching ability is optimized by fine-tuning the pre-trained model through contrastive learning [37]. The overall process is shown in Figure 4.
For entities with multi-dimensional attributes, attribute values are embedded into a natural language framework through a preset template to generate text representations that can be processed by semantic models. Let the entity set be O. For any entity o O , its attribute set is expressed as P o = p 1 o , p 2 o , , p k o , where p i o represents the i-th attribute of entity o (such as number, name, category, location, etc.), and k is the attribute dimension.
Define the attribute-to-sentence conversion function · , which takes the entity attribute set as input and outputs the corresponding natural language sentence:
s o = P o = p 1 o , p 2 o , , p k o
where s o is the semantic sentence representation of entity o. For example, if the attributes of a dataset include name, category, and location, one of the polygons can be expressed as a sentence, as follows: “The name of Polygon 1 is China Surveying and Mapping Building, its category is ‘building’, and its location is in Beijing City.”
The pre-trained model is used to convert sentences into vector representations of fixed dimensions. For the input sentence s o , the embedding vector generation process is defined as follows:
e o = ε s o d
where ε · represents the encoding function of Sentence-BERT, and d is the embedding vector dimension (768 dimensions are used in this paper). The cosine similarity [38] is used to calculate the semantic similarity of two sentences. For two individual entity pairs o 1 , o 2 , their similarity is defined as follows:
sim o 1 , o 2 = e o 1 · e o 2 e o 1 · e o 2
where e o 1 = ε s o 1 , e o 2 = ε s o 2 , · represents the vector dot product, and · represents the L2 norm.
To optimize the model’s semantic matching performance on geographic data, we select data with 1:1 matching relationships from the training data and use it to fine-tune the model, and this data contains positive and negative samples. The training data format is o 1 , o 2 , y , where y 0 , 1 represents the similarity label of the sentence pair (1 for similar, 0 for dissimilar). The loss function adopts the cosine similarity loss, defined as follows:
L = 1 N i = 1 N   y ^ i y i 2
The trained model is used to calculate the semantic similarity. The 1:1 matching relationship is directly calculated using the formula; for the 1:M matching relationship, let the source entity be o src O , and the target entity set be O t g t = o 1 , o 2 , , o n O ( n > 1 ) . The similarity calculation follows a “entity-to-sentence-to-fused-sentence” logic: convert the source entity o src into a single structured sentence S src ; integrate all entities in the target set O t g t into one fused sentence S f u s e d ; and input the sentence pair S src , S f u s e d into the BERT model to compute semantic similarity, as shown in Formula (11).
The 1:M similarity calculation needs to, first, find the similarity between the source entity and each target entity, and then obtain the overall result by averaging, as shown in the following formula:
sim o src , O t g t = e S src · e S f u s e d e S src · e S f u s e d
For the M:N matching relationship, let the two entity sets be O A = a 1 , a 2 , , a m and O B = b 1 , b 2 , , b n , ( m , n > 1 ) . The similarity calculation process is as follows: convert all entities in O A into a fused sentence S A ; convert all entities in O B into a fused sentence S B ; and input the fused sentence pair ( S A , S B ) into the BERT model to obtain the set-level semantic similarity. The specific computation is shown in Formula (12):
sim O A , O B = e S A · e S B e S A · e S B

2.5. Three-Branch Matching Network

This paper constructs a three-branch structure to classify and process 1:1, 1:M, and M:N relationships in entity matching, and integrates the attention mechanism [39] to realize the weight allocation. The main process is shown in Figure 5. The three-branch network conducts differentiated learning on feature weights of different matching types through a parallel branch structure. It shares input features and common fully connected layers, thereby reducing parameter redundancy and avoiding the waste of training costs associated with independent networks.
In this paper, geometric and semantic similarity indicators are used as the input of the three-branch network, and each similarity has different contributions to the matching decision. With the advantage of the attention mechanism in processing multi-dimensional data with correlation, this paper captures the correlation between indicators through adaptive weight allocation.
The attention model realizes selective attention to input features by constructing an adaptive weight matrix. The model structure includes two layers of the linear transformation and activation function.
The first layer of linear transformation maps the input features to the hidden layer space: z = W 1 x + b 1 , where x 5 is the input feature vector, W 1 16 × 5 is the weight matrix, and b 1 16 is the bias vector. The hyperbolic tangent function tanh is used as the activation function to introduce non-linear transformation: a = tanh(z). The second layer of linear transformation maps the hidden layer representation back to the input feature dimension, u = W 2 a + b 2 , where W 2 5 × 16 , b 2 16 . The softmax function is used to normalize the output to obtain the attention weight vector, α i = e u i j = 1 d e u j , where α i represents the attention weight of the i-th feature.
The feature weighting process can be expressed as x w e i g h = x α , where ⊙ represents element-wise multiplication. The model is trained by minimizing the mean square error loss function, and the optimization target is Formula (14):
L = 1 N k = 1 N f x k y k 2
where f( · ) is the model prediction function, x k is the k-th sample feature, y k is the target value, and N is the number of samples. After training, the final feature attention weight α = [ α 1 , α 2 ,…, α d ] is obtained by averaging the attention weights of all training samples.
Each branch is equipped with an independent fully connected layer and a weight allocation module. As shown in the 1:1 branch in Figure 5, the weight allocation module is applied to the feature x i of the i-th sample to obtain α i , and linear transformation is performed through the fully connected layer W 1 , as shown in Formula (15):
h i = W 1 · α i   +   b 1
where ω i = W e i g h t x i , and b 1 is the bias term. The processing methods of branches 1:M and M:N are similar.
The ReLU activation function is applied to the output of each branch: h i 1 = ReLU h i 1 . The output of each branch after the activation function is passed into the common fully connected layer W c for linear transformation, h i = W c · h i 1   +   b c , where b c is the bias term of the common fully connected layer. The ReLU activation function is applied again to the output of the common fully connected layer: h i c = ReLU h i c . The output after re-activation is passed into the output fully connected layer W o for linear transformation, and then the Sigmoid activation function is applied to obtain the final predicted value y ^ i , as shown in Formula (16):
y ^ i = Sigmoid W o · h i c   +   b o
where b o is the bias term of the output fully connected layer.
Binary Cross-Entropy Loss (BCELoss) is used for model optimization, as shown in formula (17):
L = 1 N i = 1 N y i l o g y ^ i + 1 y i l o g 1 y ^ i
where N is the total number of samples, y i { 0, 1} is the true label, y ^ i 0 ,   1 is the predicted value, and the Adam optimizer is used to update parameters.

3. Results and Analysis

3.1. Study Area

This study takes Tunxi District, Huangshan City, Anhui Province as the research area. Tunxi District is the central urban area of Huangshan City with rich data types and no position offset problem. In this paper, natural building data and construction land data are selected for experimental analysis, and the statistical description of the experimental data is shown in Table 3.
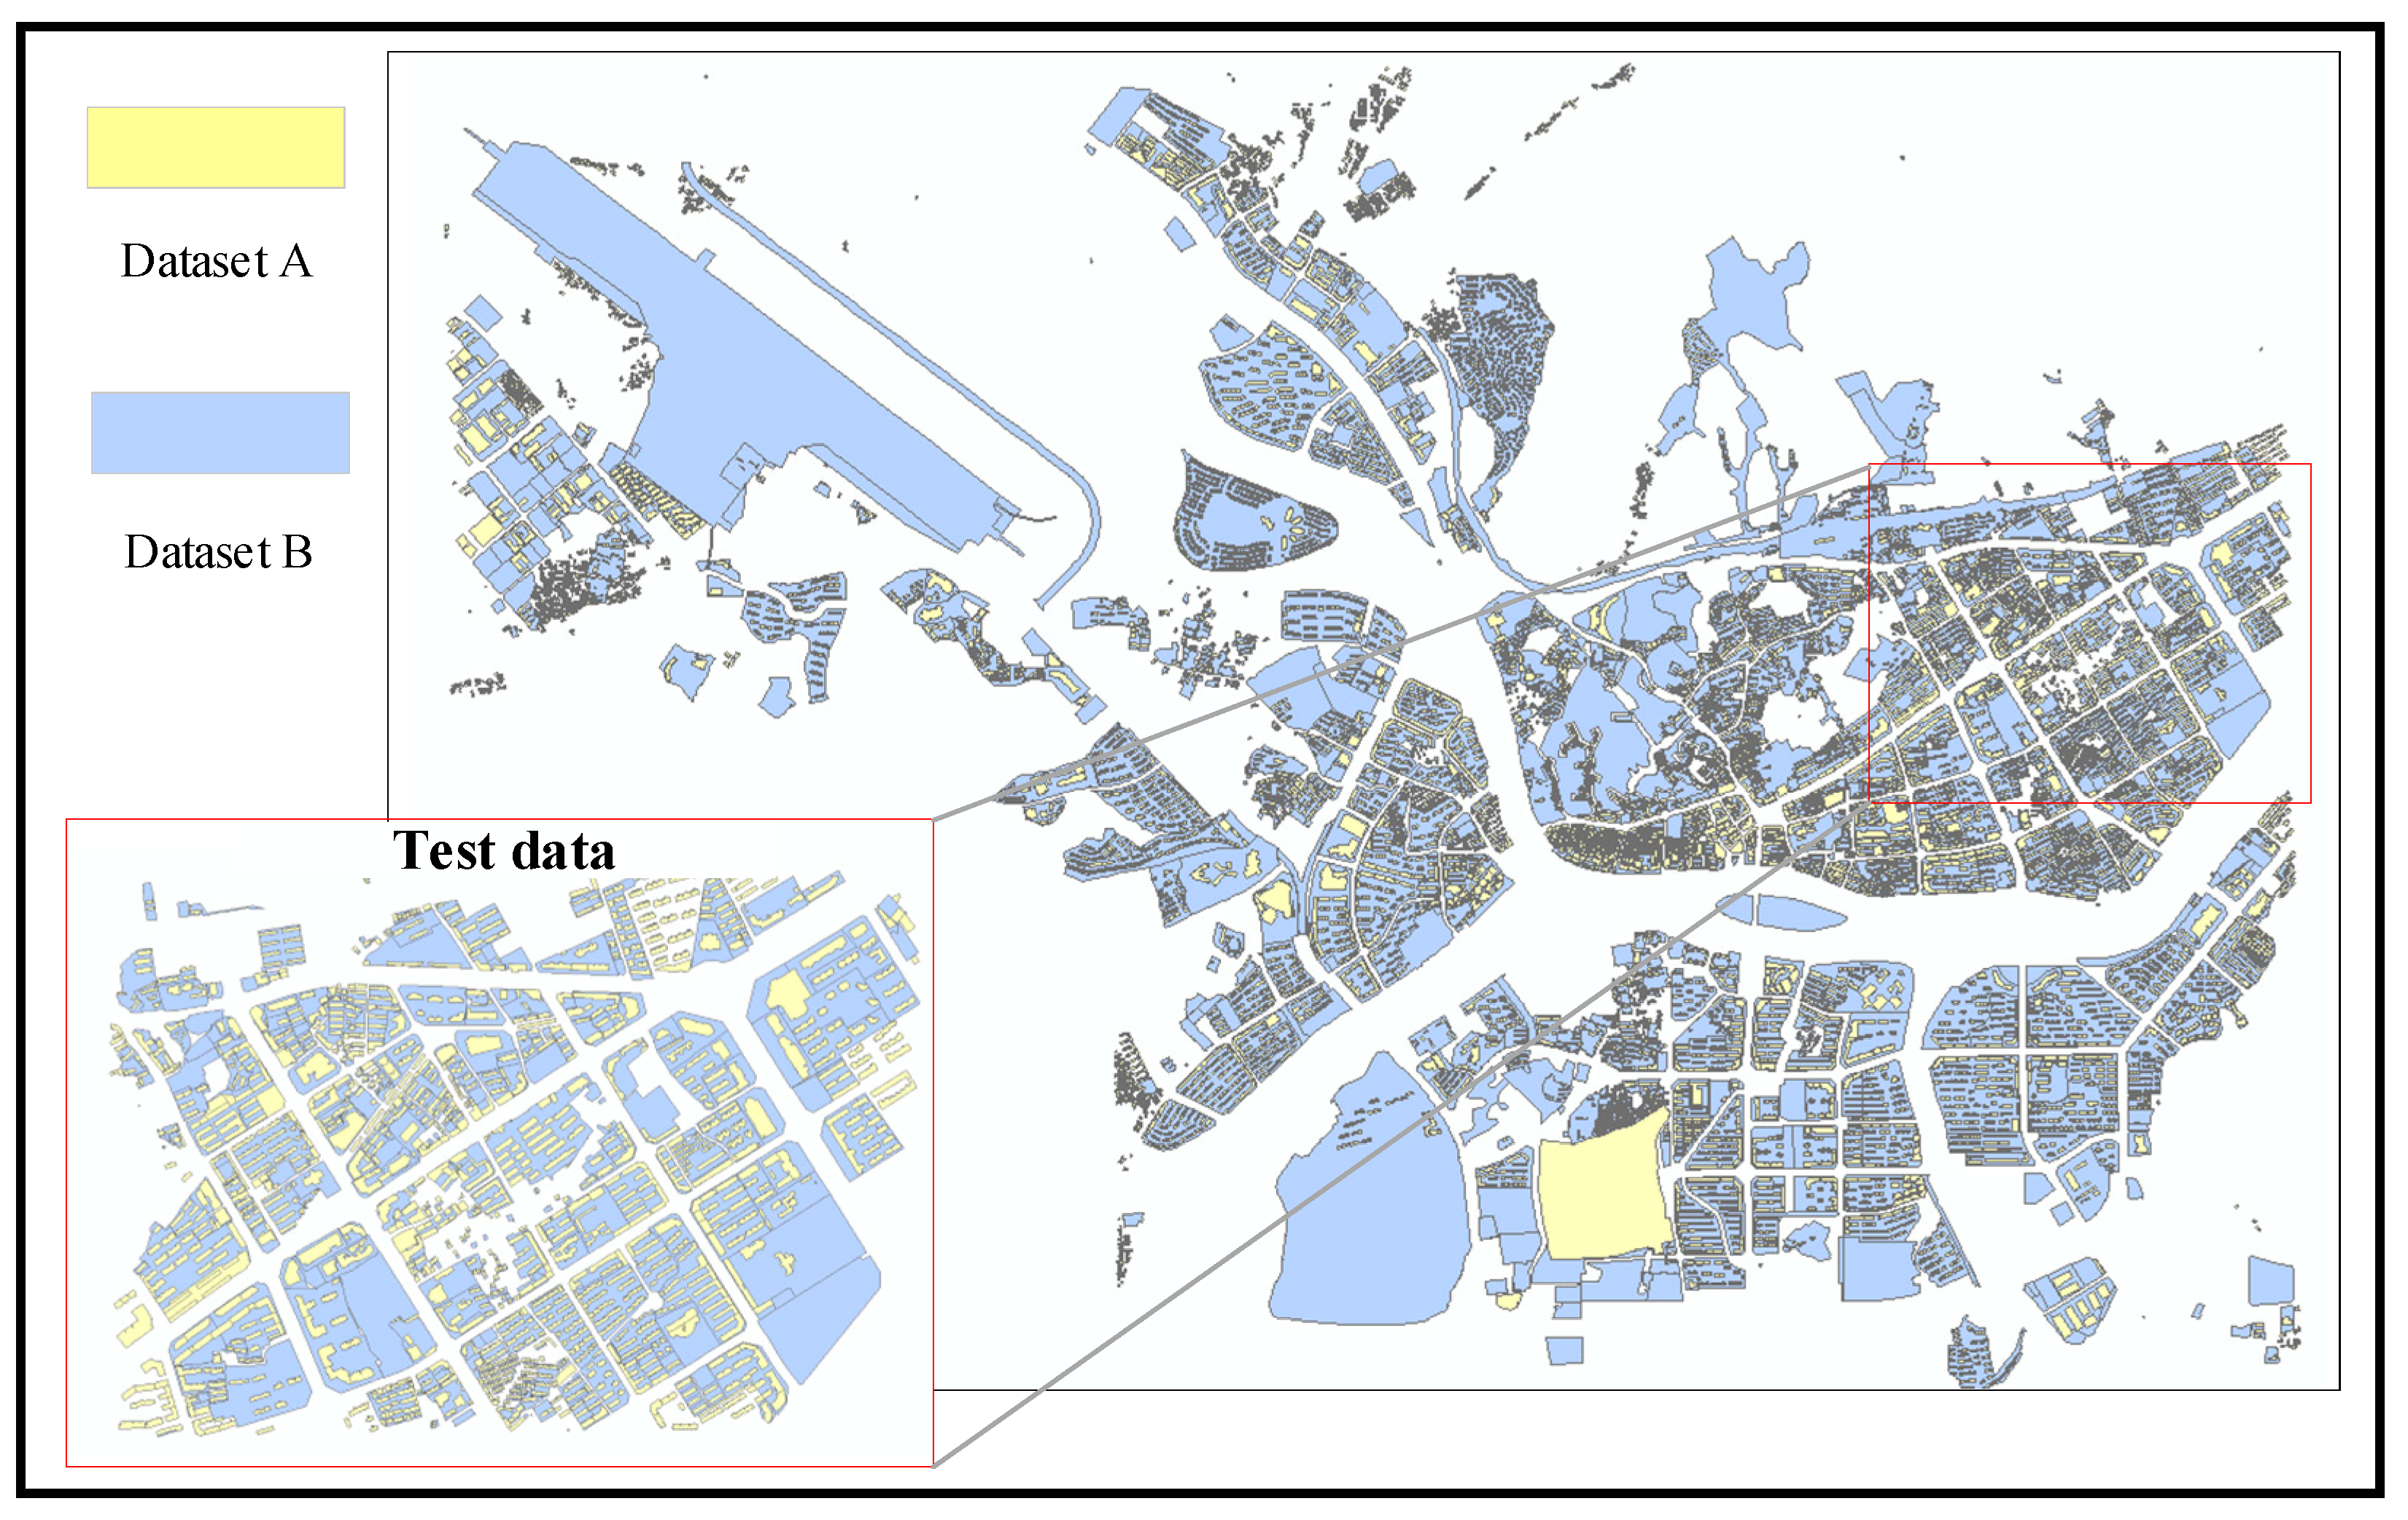
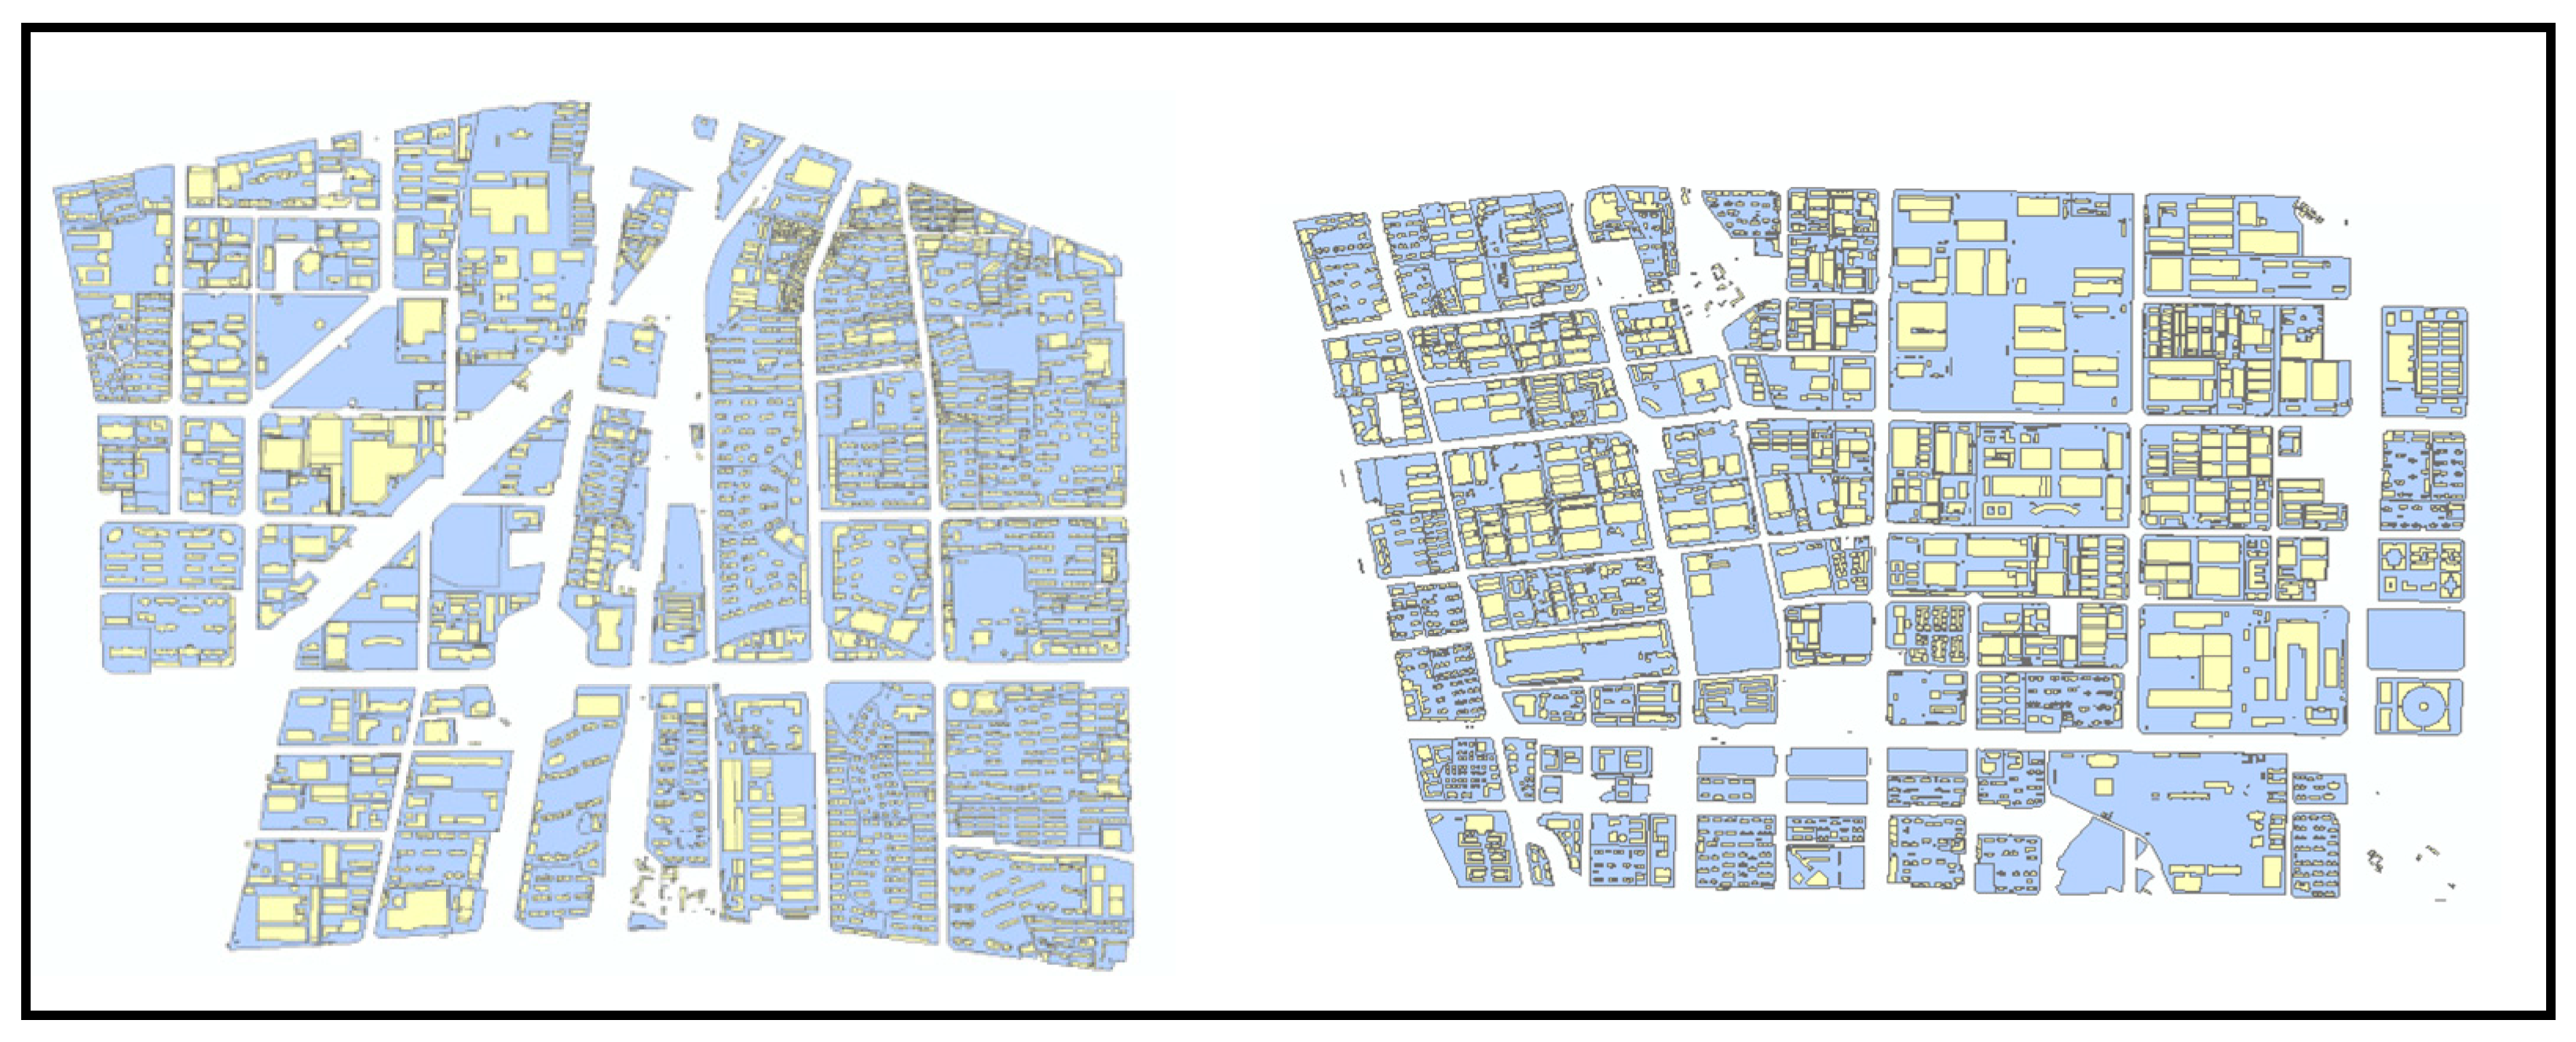
As shown in Figure 6, the data exhibit significant differences in terms of representation granularity and geometric shapes. A portion of the area was cropped to serve as test data, which includes 1377 natural building entities (accounting for 13.15%) and 612 construction land entities (accounting for 20.71%). The remaining part serves as training data, with details provided in Table 4.

3.2. Model Training and Evaluation

In this experiment, the proposed method is compared with the BPNN model [12] and the matching method fusing geometry and attributes [26]. Among them, the BPNN model takes size similarity, area overlap rate, orientation similarity, and shape similarity as input factors; the matching model fusing geometry and attributes and the model in this paper add semantic similarity as input on this basis, forming five feature factors. The matching model fusing geometry and attributes adopts empirical weight allocation, and the weights of the five factors are set as 0.3:0.2:0.1:0.3:0.1 in turn, and the total similarity is set to 0.6, while both the BPNN model and the model in this paper automatically obtain feature weights through sample learning. In terms of specific parameters, the BPNN model adopts a “4-9-1” network structure (four nodes in the input layer, nine nodes in the hidden layer, and one node in the output layer), the entire network uses the sigmoid activation function, the learning rate is 0.001, and it is trained for 1000 epochs; the model in this paper adopts a “5-32-16-1” network structure (5 nodes in the input layer, 32 nodes in the hidden layer, 16 nodes in the common fully connected layer, and 1 node in the output layer), the activation functions are all sigmoid, the learning rate is 0.001, and the total training is 200 epochs, among which the hidden layer of the attention mechanism module is set to 16 nodes, independently trained for 100 epochs, and the Sentence-BERT model is text2vec-base-chinese, the learning rate is 0.0001, and it is trained for 100 epochs.
We define the training process for identifying the highest accuracy threshold in Section 2.2 as follows: the threshold range spans from 0 to 0.5 with increments of 0.05. The threshold corresponding to the minimum number of missed matches is designated as the highest accuracy threshold. This study determines that threshold to be 0.1.
In this paper, precision P, recall R, and the comprehensive evaluation index F1-score are used to evaluate the matching results of the model. The calculation formulae are as follows:
P = TP TP + FP R = TP TP + FN F 1 = 2 P · R P + R
where TP is the number of correctly matched entity pairs, FP is the number of incorrectly matched ones, and FN is the number of missed matches.

3.3. Quantitative Analysis

Table 5 presents the performance comparison of each method on the dataset. The method in this paper has improvements in all indicators compared with the above two methods. Compared with the matching method fusing geometry and attributes, the method in this paper achieves improvements of 3.38%, 1.32%, and 2.41% in the P, R, and F1 indicators, respectively. Compared with the BPNN model, the method in this paper achieves improvements of 2.91%, 0.27%, and 1.66% in the P, R, and F1 indicators, respectively.
An analysis of each matching relationship (1:1, 1:M, and M:N) reveals that, as presented in Figure 7, the F1-score of the proposed method in this study for every type of matching relationship is higher than those of the other two comparison methods. Additionally, for each of the three methods, the matching performance of the 1:1 relationship is better than that of the 1:M and M:N relationships.

3.4. Qualitative Analysis

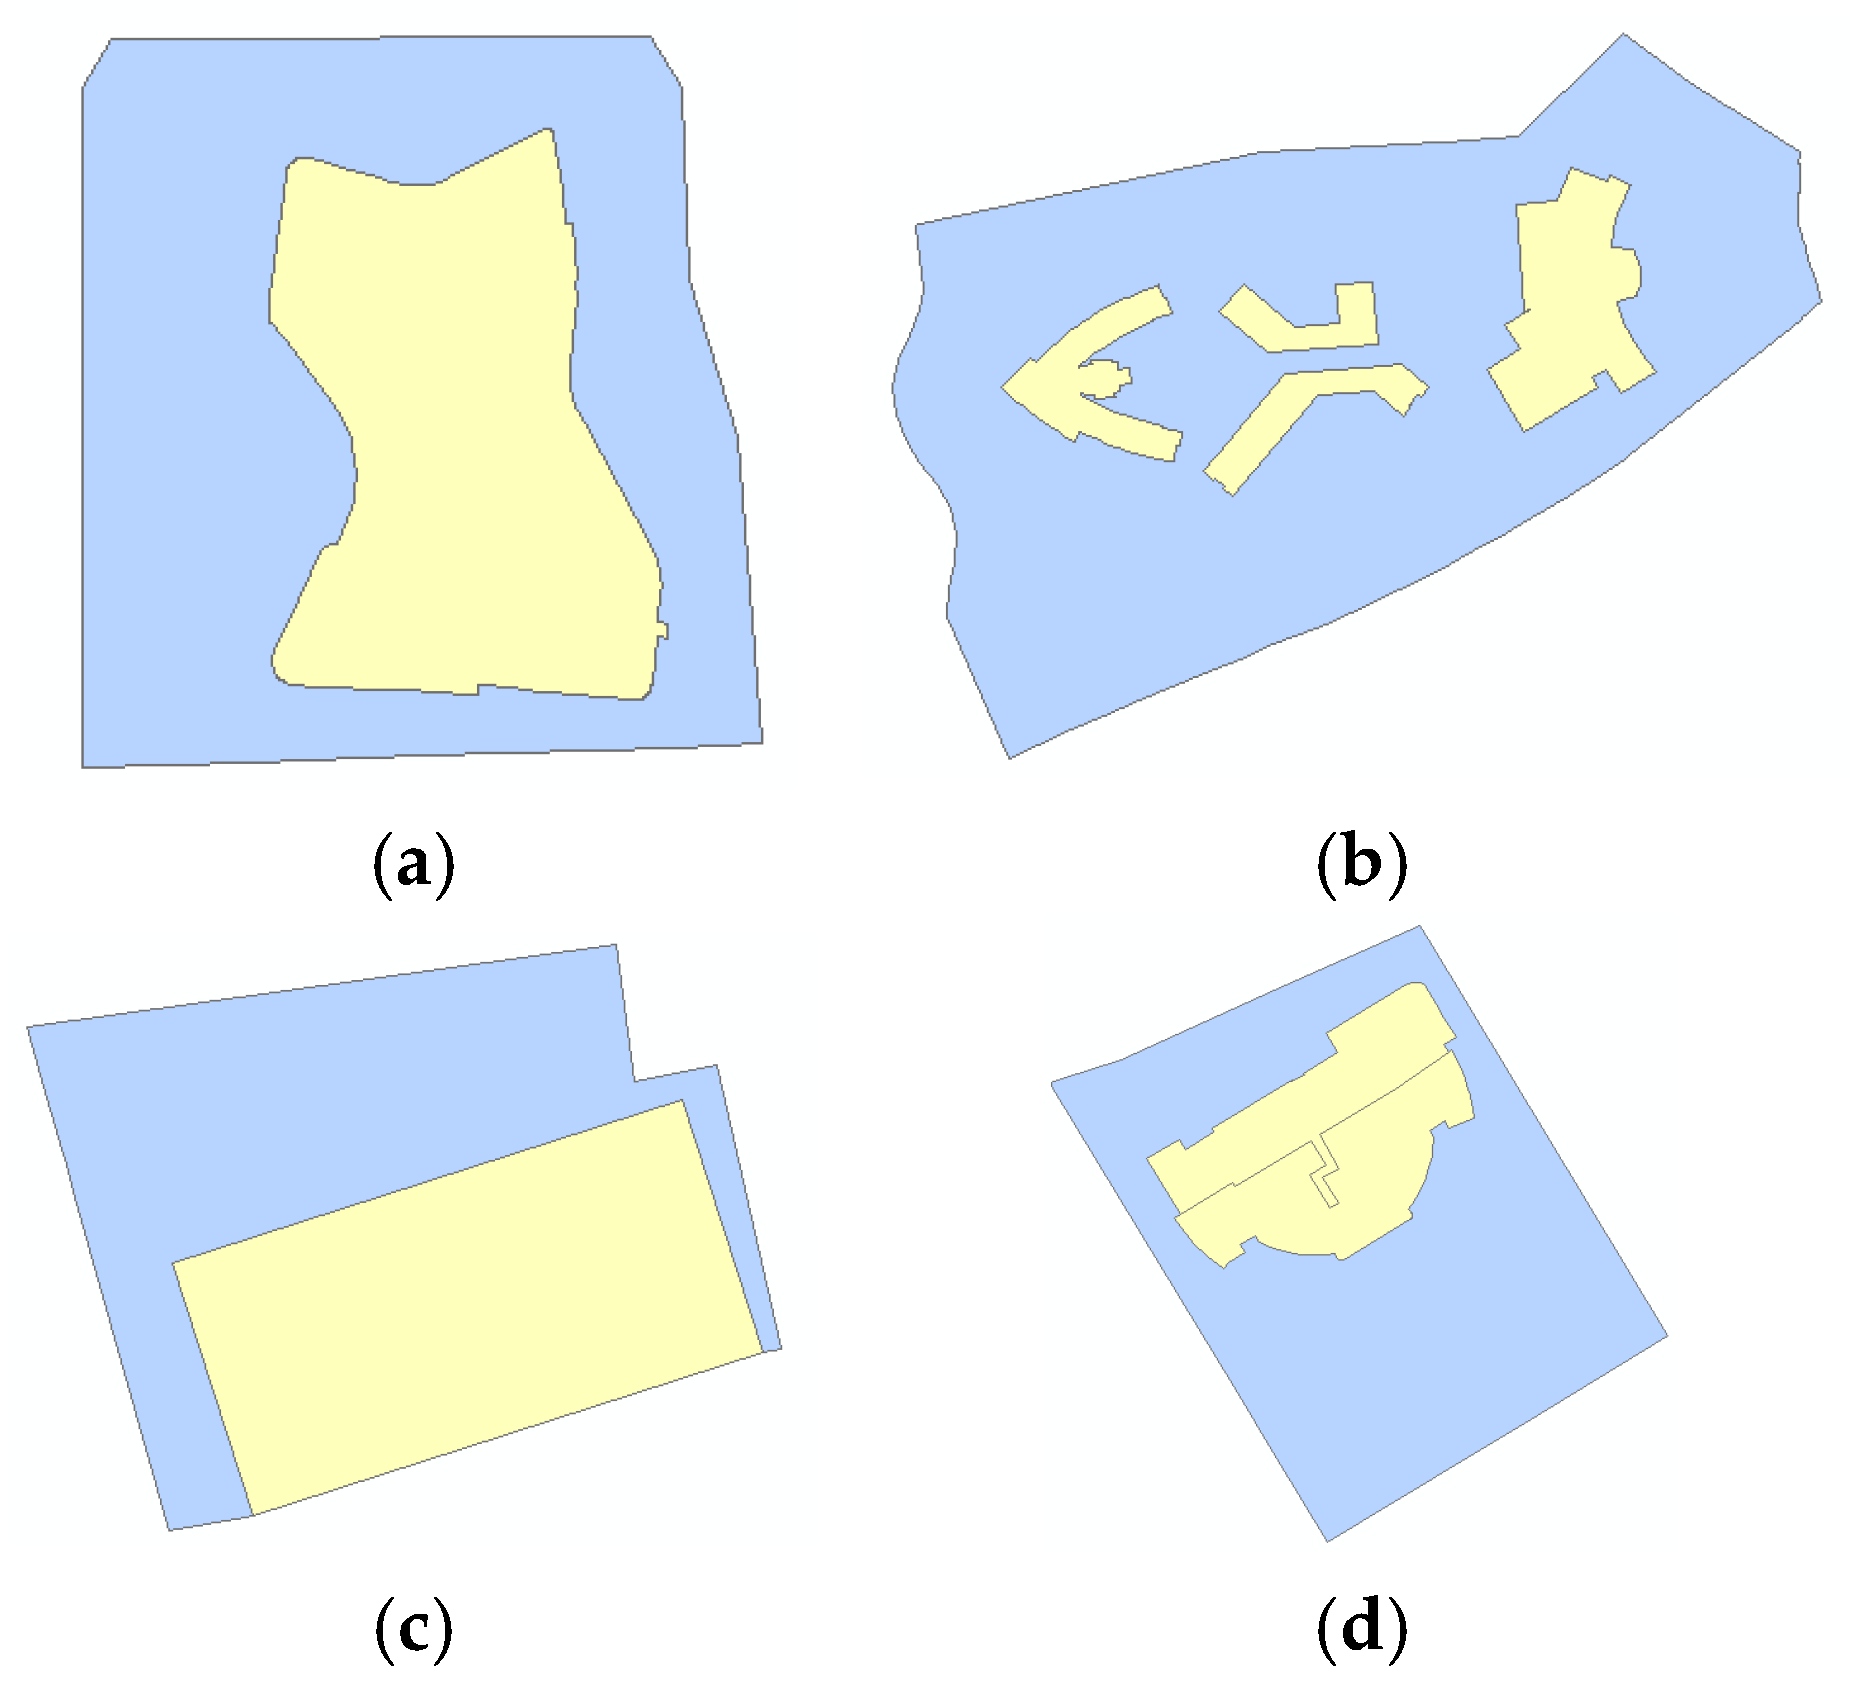
As shown in Figure 8a, the method fusing geometry and attributes cannot match because the overall similarity does not reach the threshold, while the BPNN model and the method in this paper can successfully match. As shown in Figure 8b, both methods cannot match because neither method refines 1:1, 1:M, and M:N matching. The similarity of 1:1 matching in the dataset is relatively high, which leads to an increase in the precision requirement of the model for 1:M matching, but the method in this paper can avoid this problem.
The method described in this paper may fail to achieve correct matching under certain conditions. Take Figure 8c as an example: this sample is actually a correct match; yet, the method identifies it as a mismatch. This occurs because, in 1:1 matching, the semantic similarity weight carries a relatively small proportion, while the geometric features of the polygons in the image exhibit significant differences, leading to matching errors. Similarly, in Figure 8d, this sample is actually a mismatch; yet, the proposed method identifies it as a match. This occurs because, after aggregation into a convex hull, the shape and orientation similarity between the two polygons increases, leading to a false match.
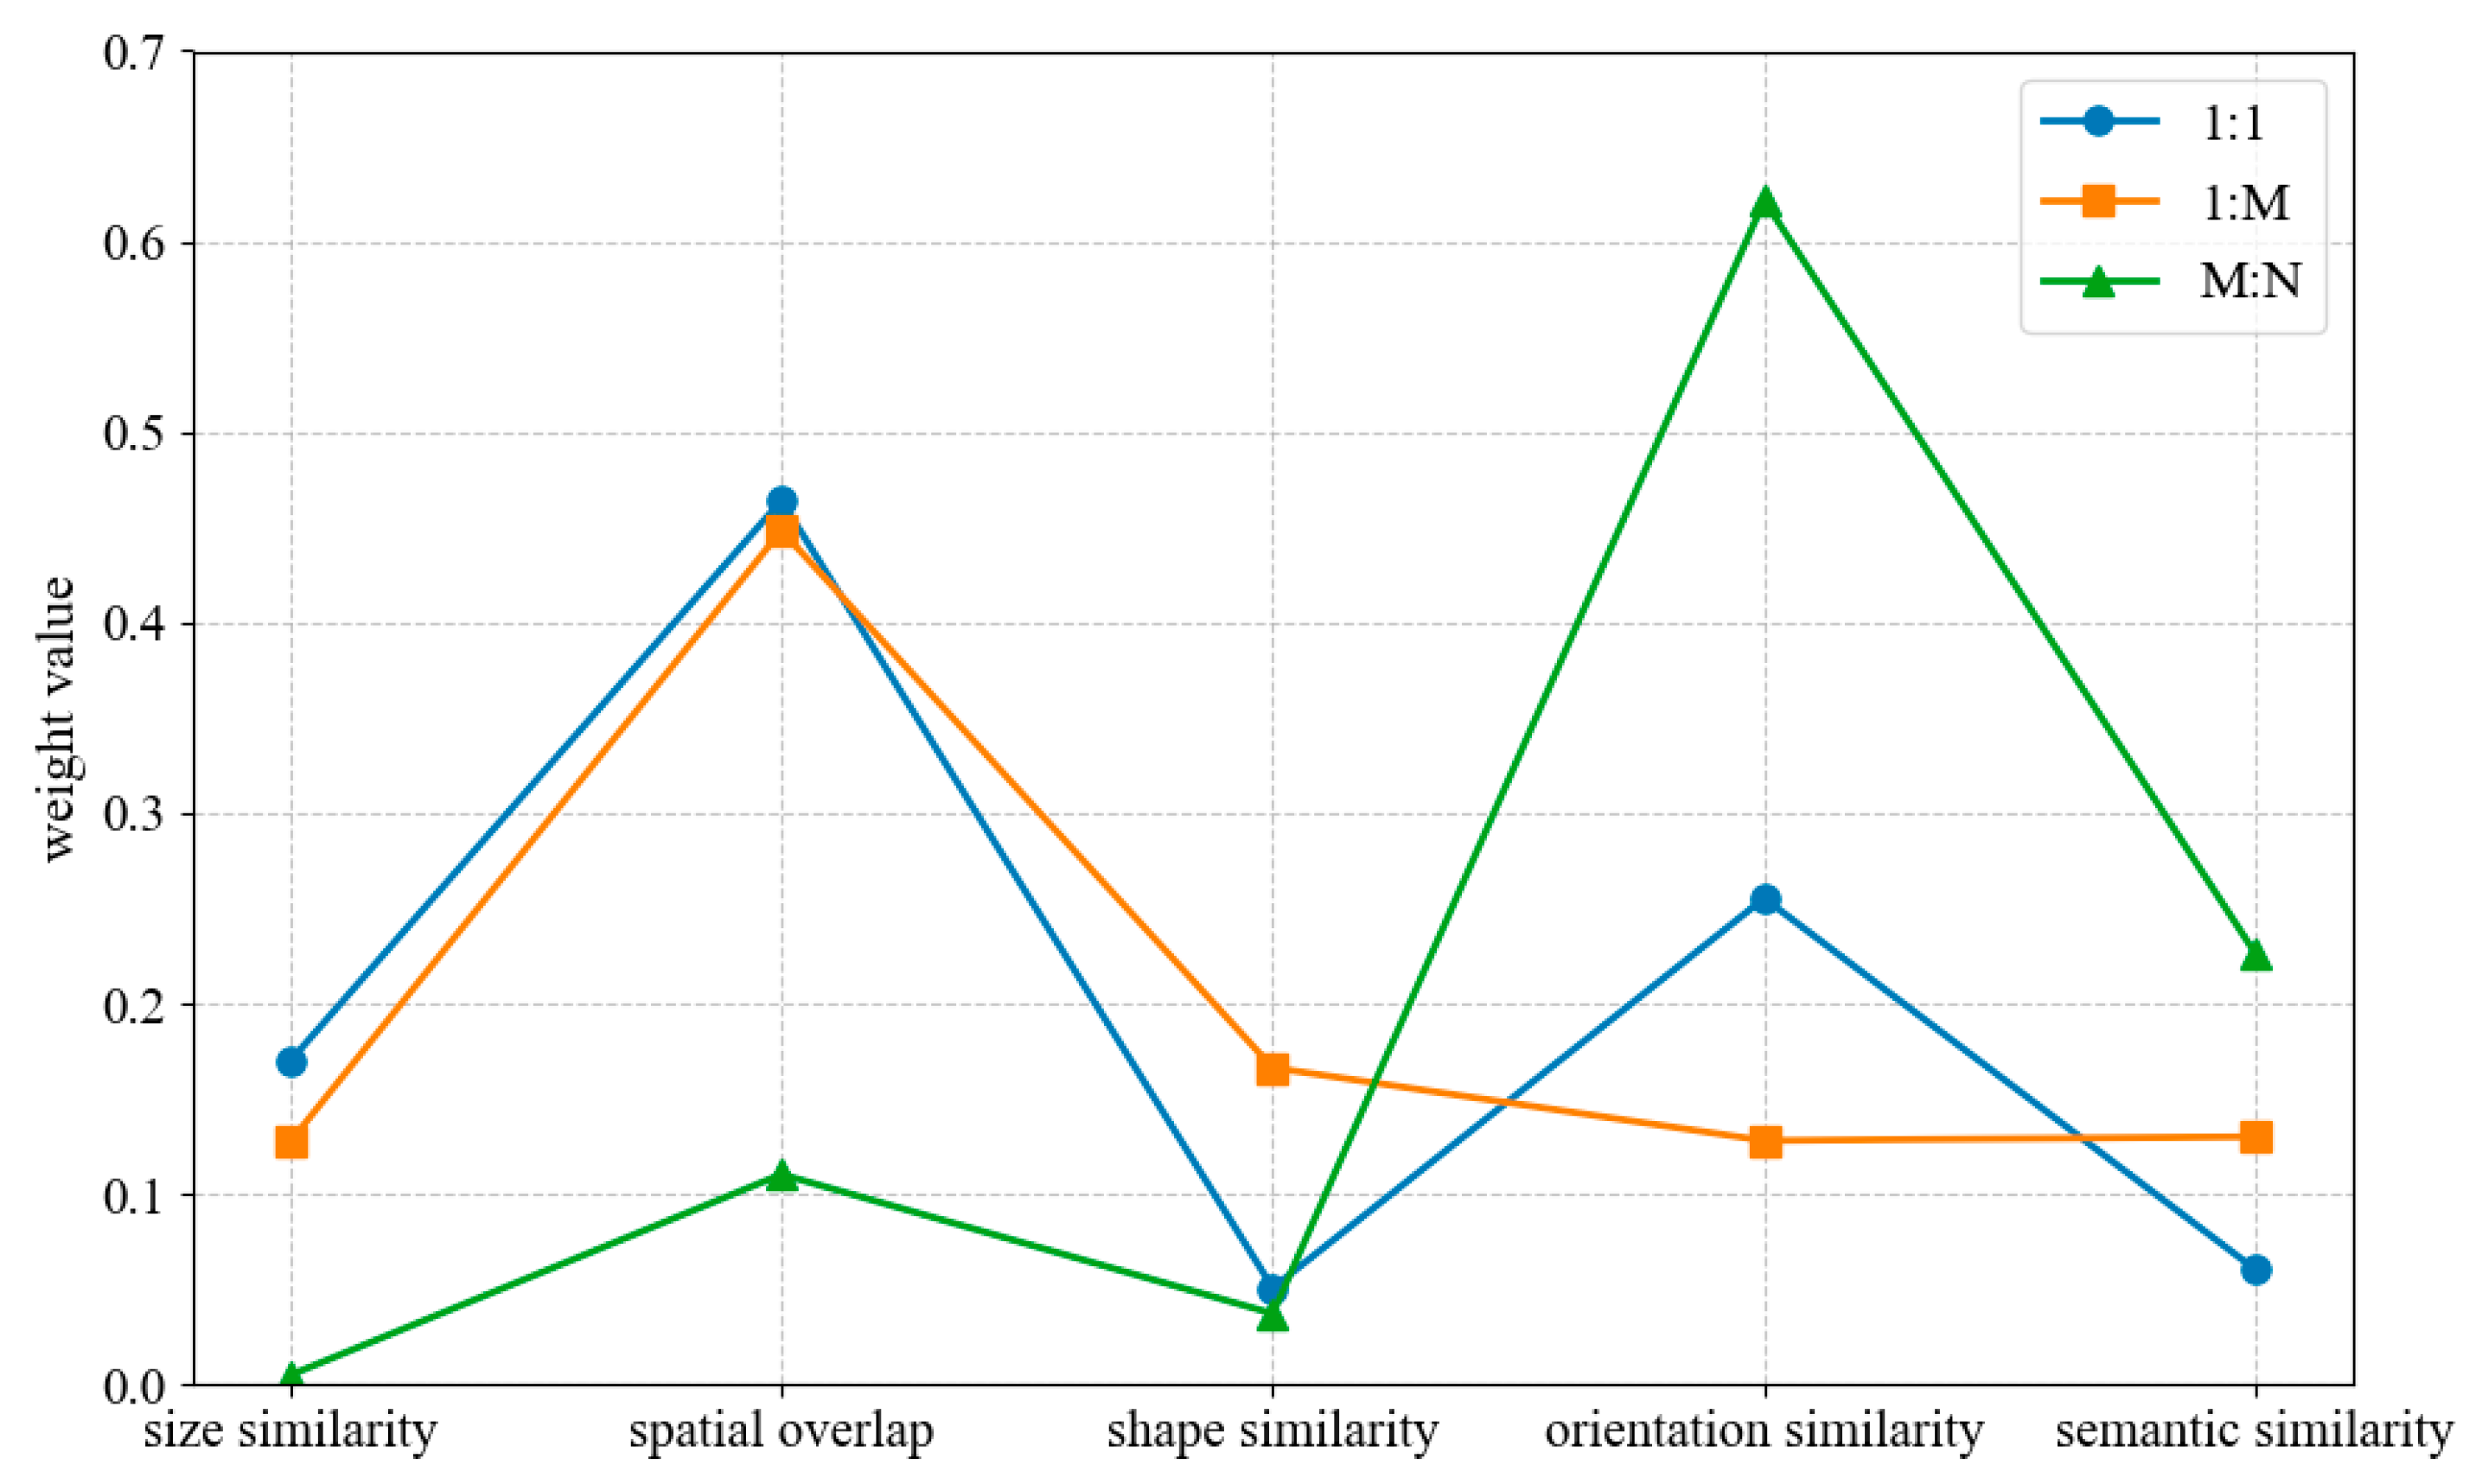
Figure 9 shows the weights obtained by the method in this paper. In 1:1 matching, the spatial overlap, size similarity, and orientation similarity account for a large proportion, indicating that, in single-object matching, the consistency of the spatial position, size, and orientation is the core basis for judgment. In contrast, the weights of shape and semantic similarity are low, because the stability of the shape in simple matching is high, and there is no need to rely on semantic assistance. In 1:M matching, the spatial overlap is still the highest, but the shape similarity and semantic similarity are significantly higher than those in 1:1 matching. This is because, when an object is split into multiple ones, the spatial range still needs to be overlapped as a whole, while the split sub-objects need to confirm their ownership through shape correlation and semantic labels. In M:N matching, the semantic similarity has significantly improved. Since M:N matching involves complex merging and splitting, the spatial positions may be confusing, but the consistency of the overall orientation and semantic categories becomes the key to judging the associations. Based on the analysis of Figure 7, the F1-scores of the BPNN model under the 1:1 and 1:M matching relationships are both higher than those of the Geometry and Properties method. However, under the M:N matching relationship, the F1-score of the Geometry and Properties method is higher than that of the BPNN model. This phenomenon indicates that the semantic similarity can indeed improve the accuracy in complex matching scenarios.

4. Discussion

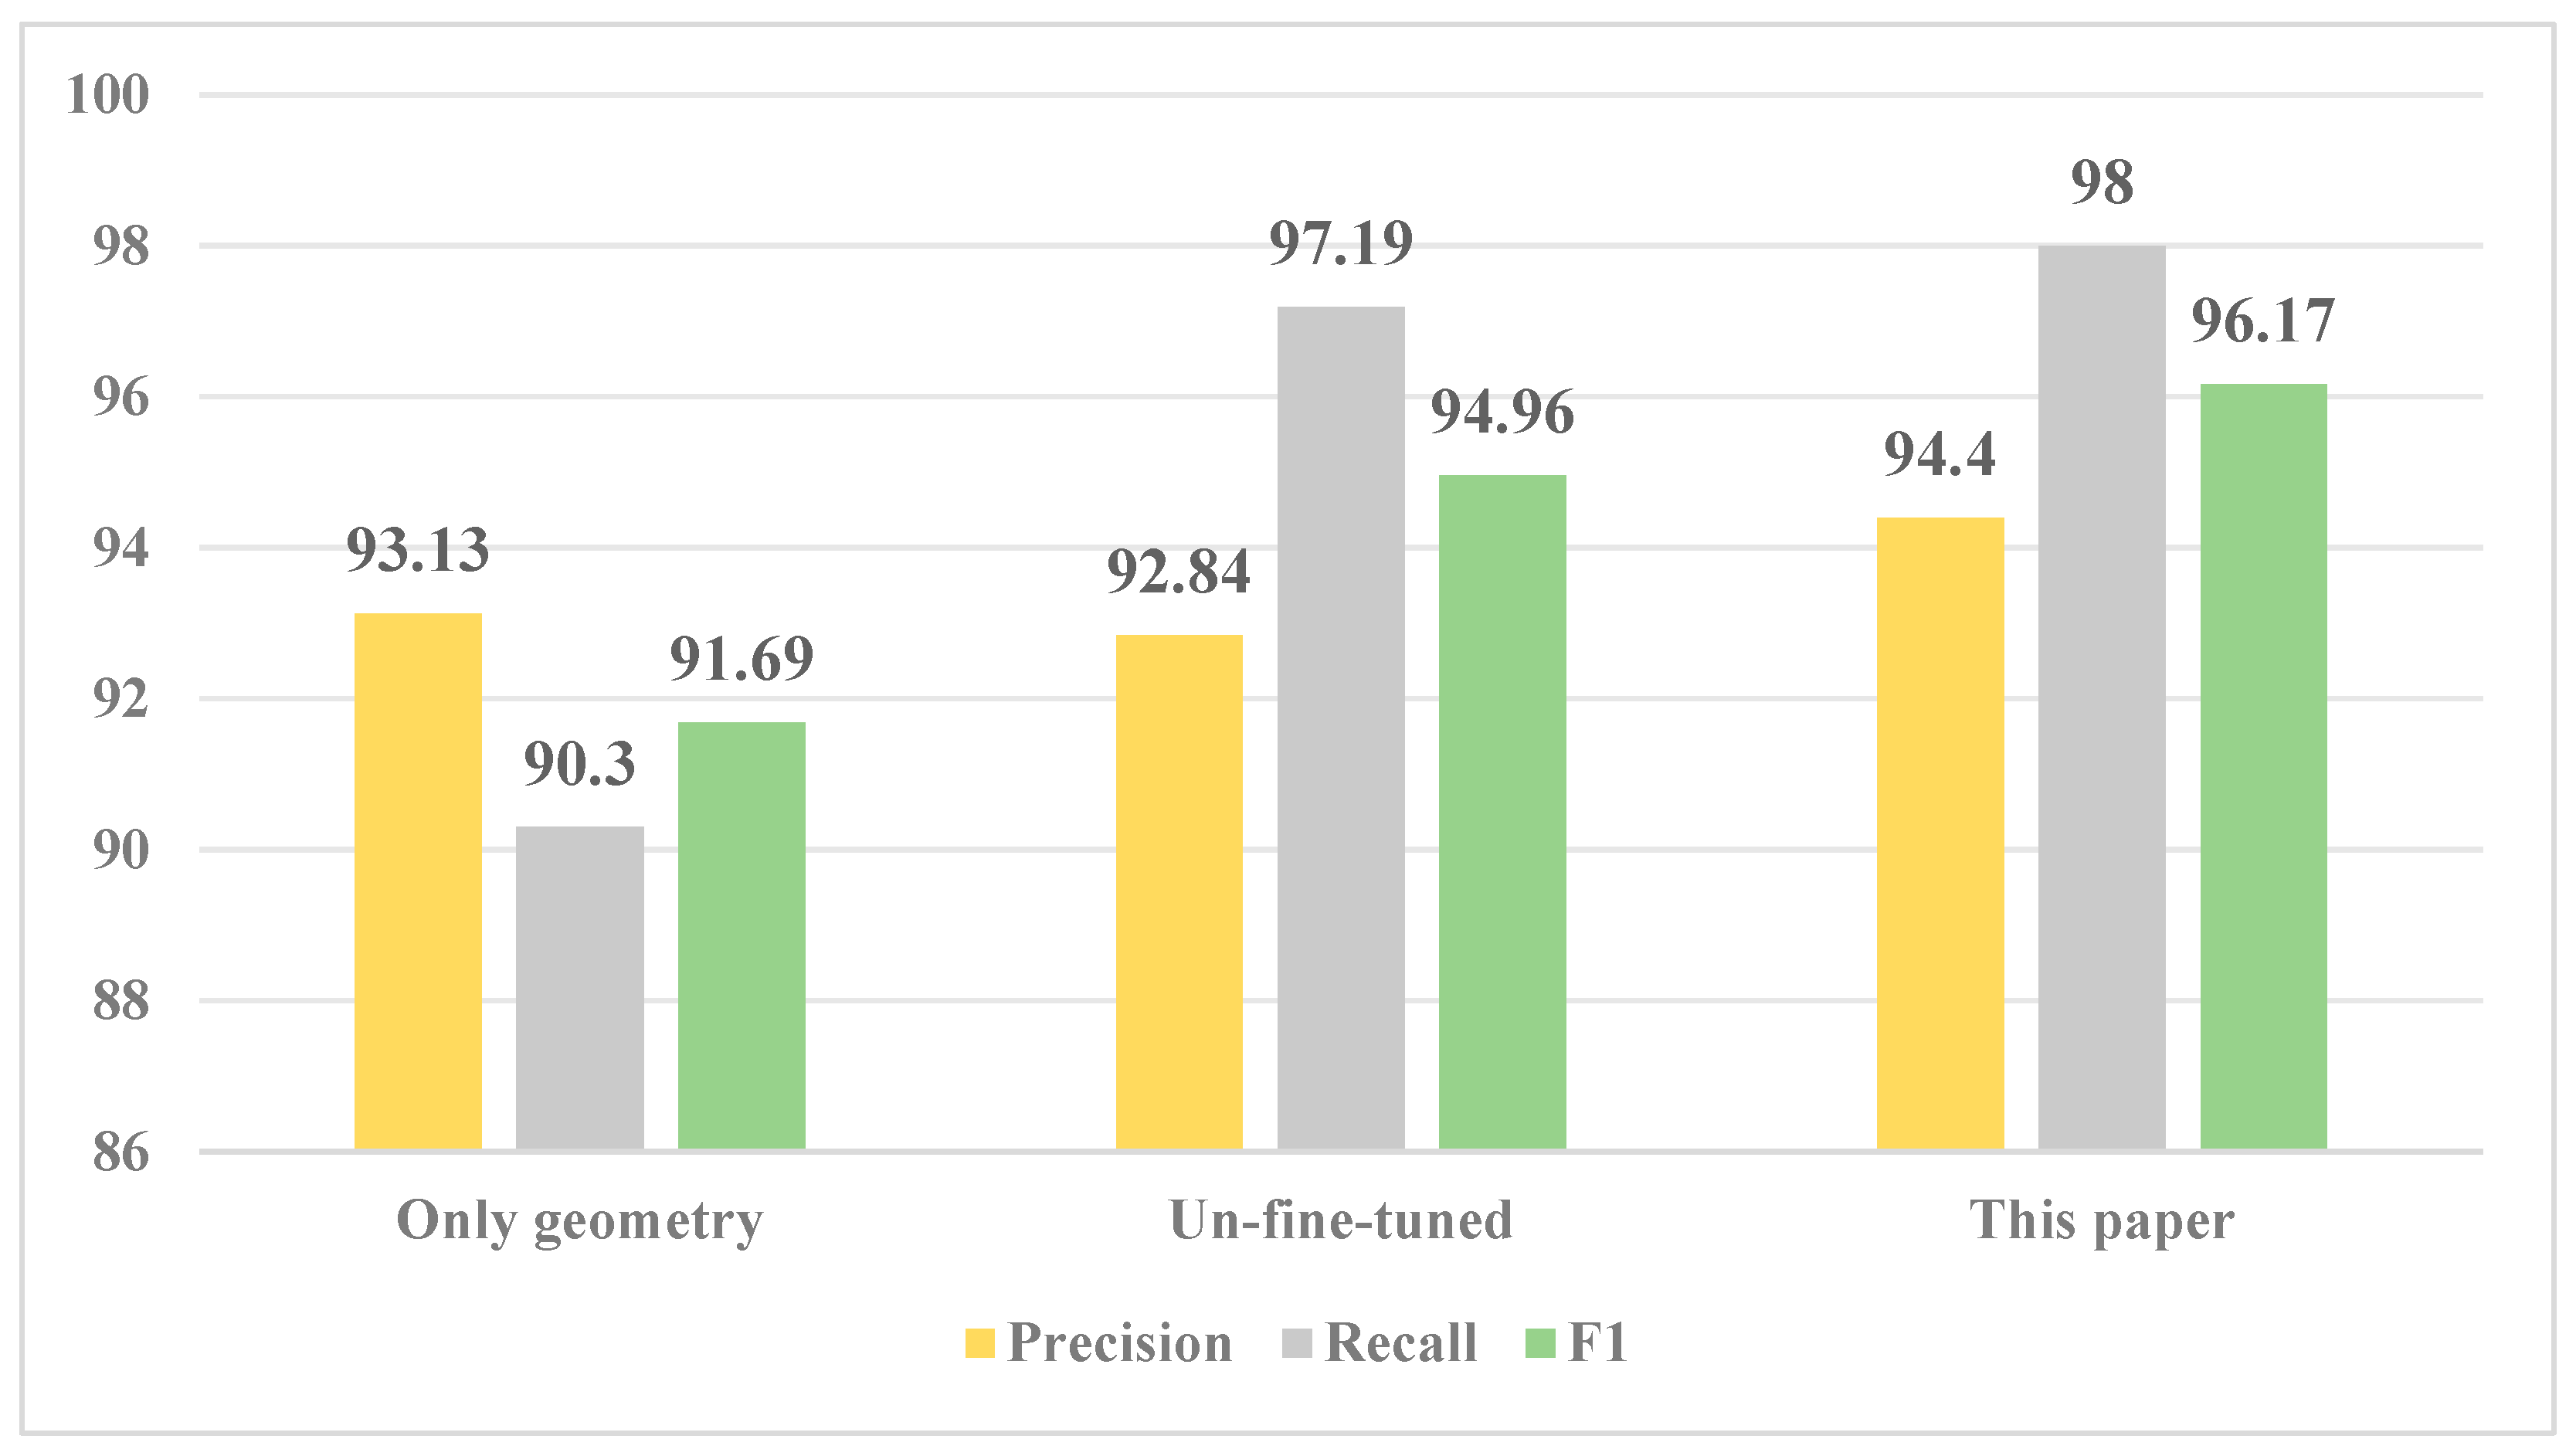
To explore the performance of the method itself, this paper analyzes the effects of fusing the semantic similarity, attention mechanism, and three-branch network. The experiment only adjusts specific parts of the method, and other parameter settings remain unchanged. In addition, a generalization experiment is conducted to verify the generalization ability of the model.

4.1. Feature Fusion

In this paper, the geometric features and semantic similarity are used as joint features for model training. The experimental results are shown in Figure 10. Compared with the case of using only geometric features, the model has improvements in precision, recall, and F1. Compared to the un-fine-tuned BERT model, the model demonstrates improvements across all metrics.

4.2. Feature Weight Allocation

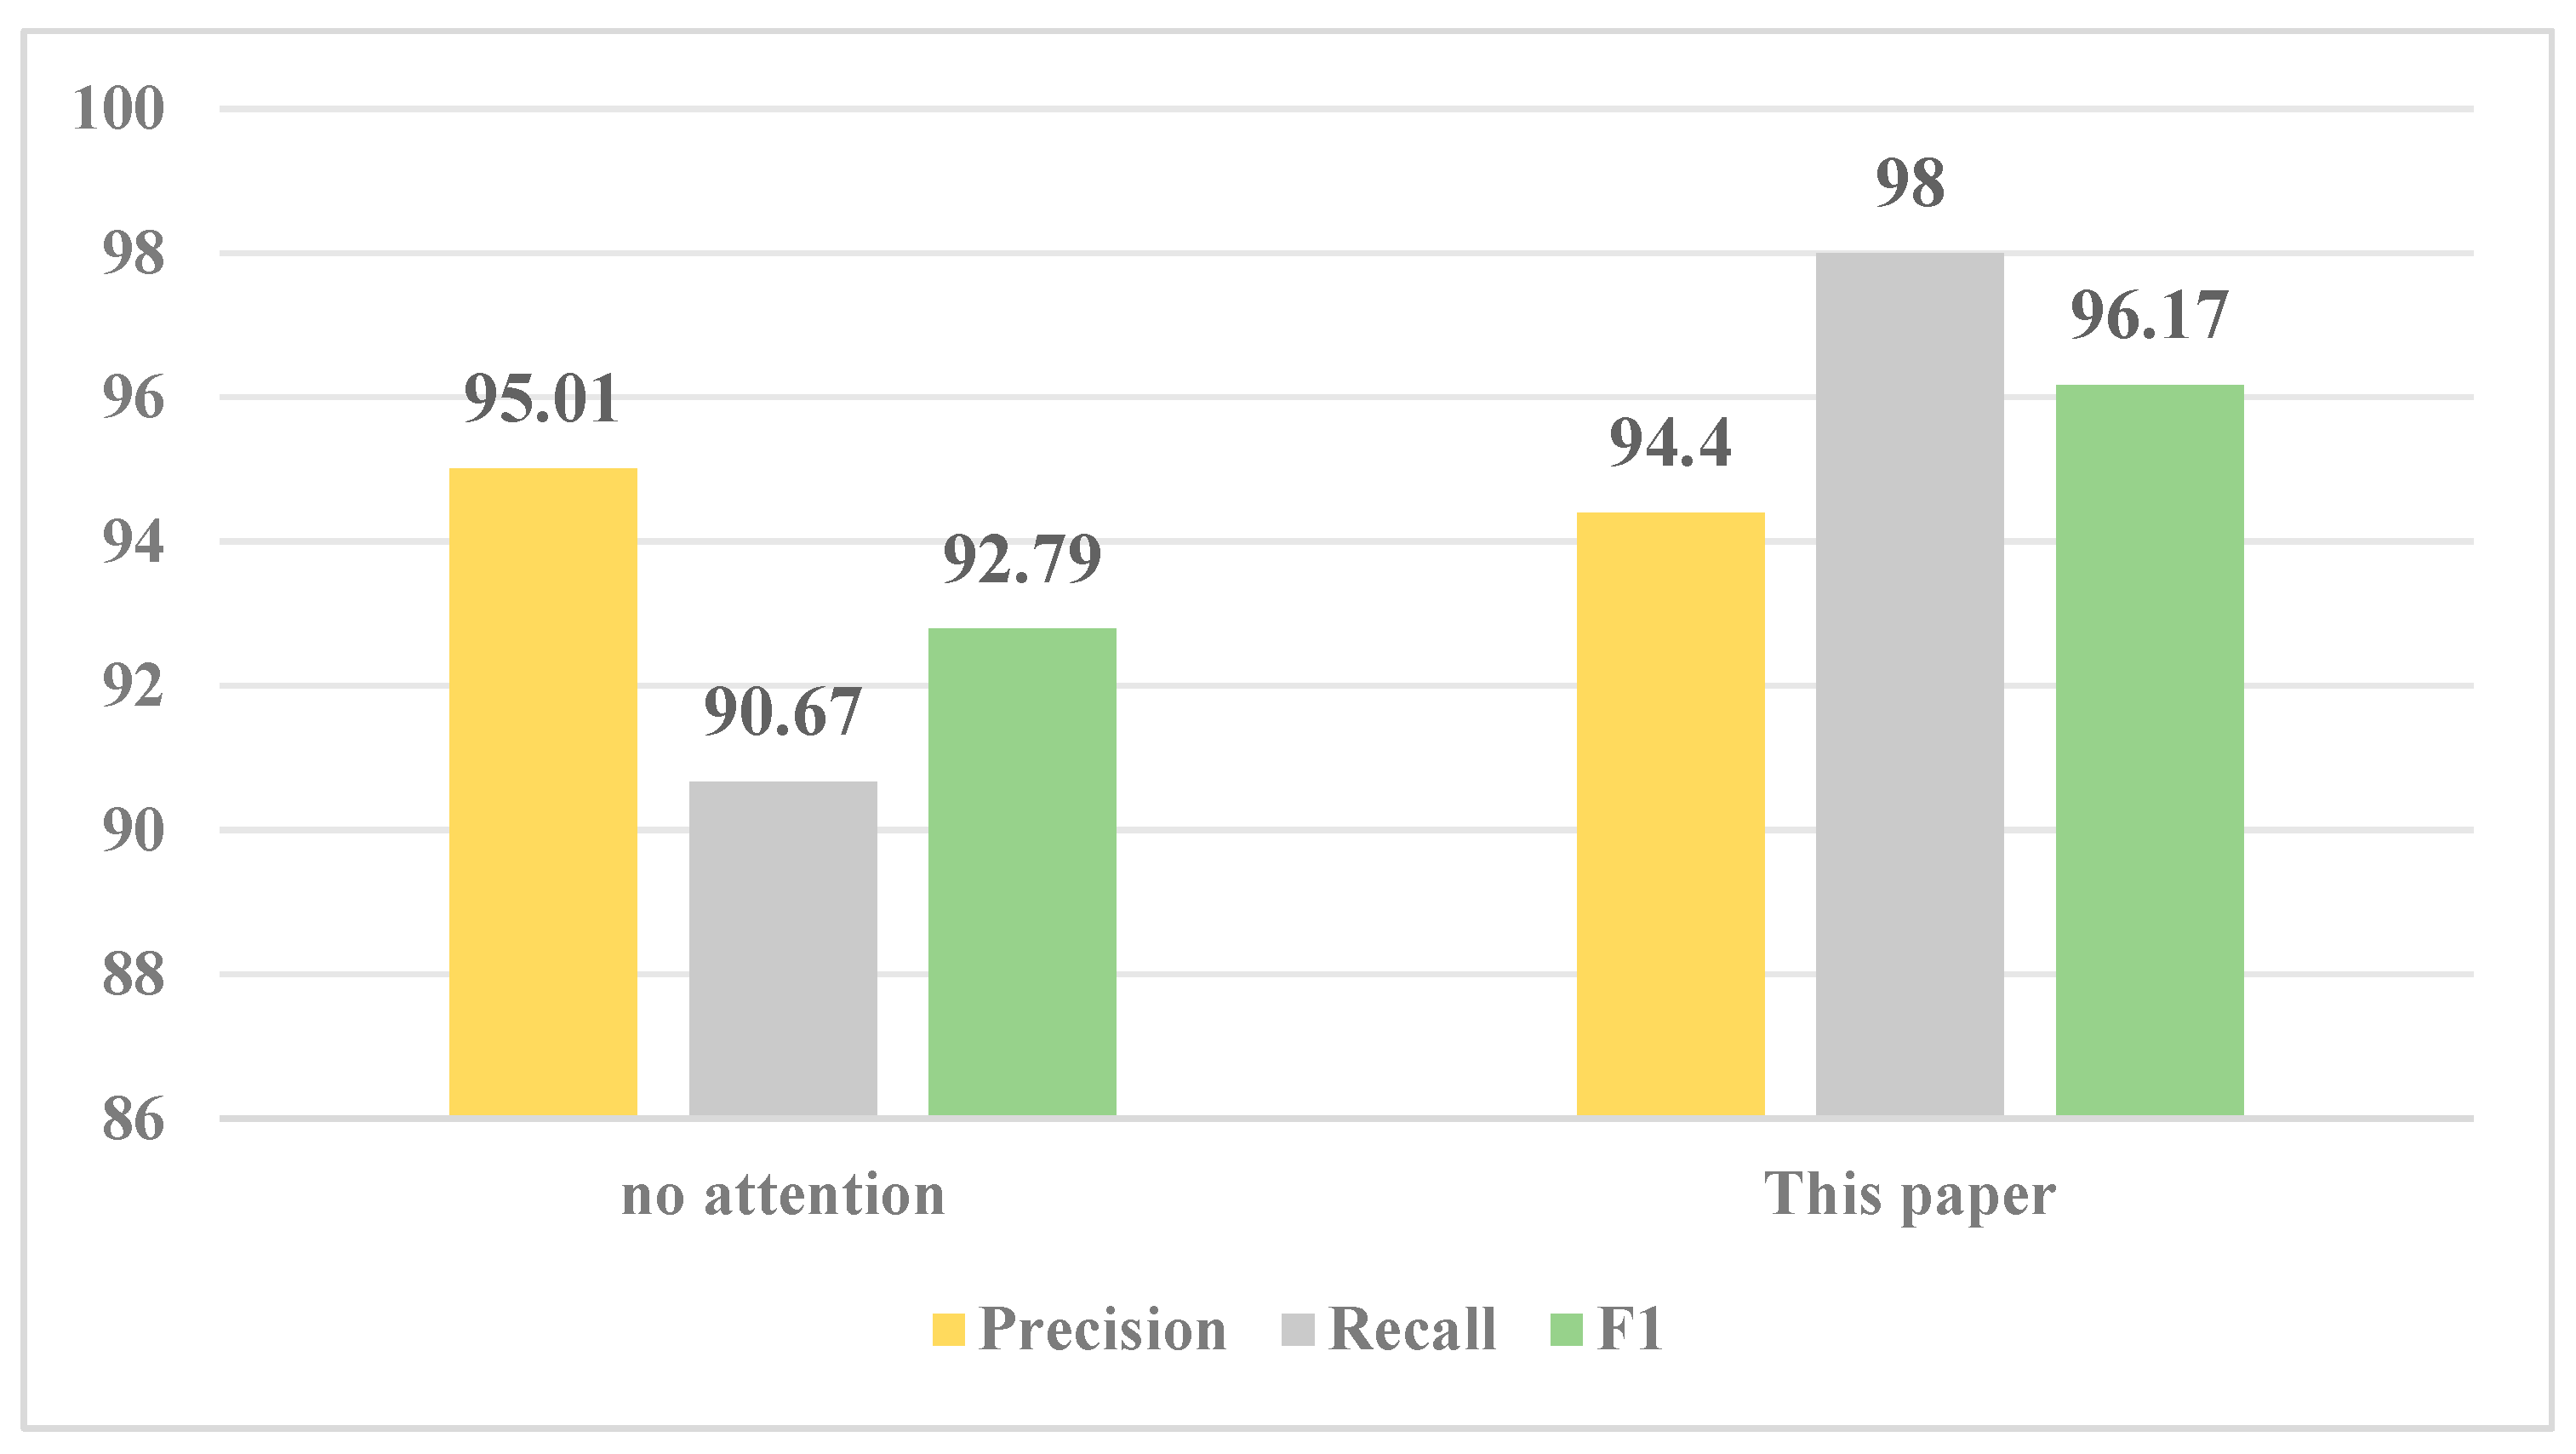
This paper uses the attention mechanism to allocate feature weights and compares it with the method without using the attention mechanism, as shown in Figure 11. The experimental results show that all indicators without using the attention mechanism are lower than those using it, which verifies the important role of feature weight allocation in model optimization; combined with the analysis in Figure 9, the weight allocation strategies for different matching relationships are inconsistent. These results indicate that a reasonable feature weight allocation mechanism can significantly improve the model performance.

4.3. Three-Branch Network

On the basis of retaining the feature weight calculation mechanism, this paper conducts a comparative verification on the effectiveness of the three-branch network. By canceling the three-branch structure and using a single neural network to process the input data, the experimental results show that the model’s precision is 93.01%, recall is 97.36%, and F1-score is 95.13%. These indicators are all lower than the corresponding performance of the three-branch network architecture, verifying the effectiveness advantage of the three-branch structure in feature clustering processing and complex pattern recognition. The experimental data show that, for this type of dataset with significant feature distribution differences, the branch structure can more accurately capture the internal correlation of different feature subsets, thereby improving the overall generalization ability of the model.

4.4. Generalization Experiment

To verify the generalization ability of the model, this paper selects house entities and courtyard entities in Hefei City, Anhui Province for a generalization experiment, as shown in Figure 12, including 6607 house entities and 466 courtyard entities, with an experimental area of about 23 km2. The pre-trained model is used for testing, and the experimental results are shown in Table 6. The method in this paper has improvements in P, R, and F1. The experimental results demonstrate that this method achieves strong generalization capabilities across diverse datasets by modeling multiple matching relationships differentially and assigning tailored weights to each metric.

5. Conclusions

This paper presents a geometric–attribute collaborative method for multi-scale polygonal entity matching, aiming to address the limitations of insufficient semantic utilization and the undifferentiated modeling of complex matching relationships in existing approaches. The key contributions are summarized as follows:
Enhanced semantic similarity computation: By fine-tuning the Sentence-BERT model, the method effectively captures semantic information from non-standardized attributes and multi-dimensional descriptions, overcoming the constraints of traditional string-based or dictionary-based semantic comparison. This significantly improves the ability to distinguish entities with similar a geometry but different semantics.
Differentiated modeling for matching relationships: Based on a polygon intersection analysis, matching relationships are classified into 1:1, 1:M, and M:N. A three-branch attention network is designed to handle each relationship type specifically, with adaptive feature weighting via attention mechanisms. This tailored approach adapts to the varying feature complexities of different relationships, improving the matching accuracy for both simple and complex scenarios.
Superior performance and generalization: The experimental results on the Huangshan and Hefei datasets demonstrate that the proposed method outperforms existing geometric–attribute fusion and BPNN methods in precision, recall, and F1-score. The consistent effectiveness across different study areas confirms its strong generalization ability.
Author Contributions

Zhuang Sun performed the research, analyzed the data, and wrote the paper. Liang Zhai supervised the study. Po Liu offered helpful suggestions. Zutao Zhang participated in discussion. All authors have read and agreed to the published version of the manuscript.

Funding

This research study was funded by the Technical Service for the Construction of the New Basic Surveying and Mapping System [grant number: 2023BFAFN02034].

Data Availability Statement

Restrictions apply to the availability of these data. The data are not publicly available due to privacy concerns.

Conflicts of Interest

The authors declare no conflicts of interest.

Abbreviations

The following abbreviations are used in this manuscript:
GISGeographic Information System
BPNNBack-Propagation Neural Network

References

  1. Xu, Y.; Li, J.; Xie, X.; Xie, Z. Matching the Building Footprints of Different Vector Spatial Datasets at a Similar Scale Based on One-Class Support Vector Machines. Int. J. Geogr. Inf. Sci. 2024, 38, 1555–1582. [Google Scholar] [CrossRef]
  2. Niu, X.; Qian, H. Cognitive Hierarchical Matching Approach for Multi-Scale Buildings Based on Dynamic Simulated Generalization Algorithm and Iterative Position Adjustment. Cartogr. Geogr. Inf. Sci. 2025, 1–22. [Google Scholar] [CrossRef]
  3. Naumann, A.; Bonerath, A.; Haunert, J.H. Scalable Many-to-Many Building Footprint Matching. Inf. Fusion 2025, 124, 103360. [Google Scholar] [CrossRef]
  4. Egenhofer, M.J.; Sharma, J.; Mark, D.M. A Critical Comparison of the 4-Intersection and 9-Intersection Models for Spatial Relations: Formal Analysis. In Proceedings of the AUTOCARTO Conference; ASPRS American Society for Photogrammetry and Remote Sensing: Bethesda, MD, USA, 1993; p. 1. [Google Scholar]
  5. Atallah, M.J.; Ribeiro, C.C.; Lifschitz, S. Computing Some Distance Functions Between Polygons. Pattern Recognit. 1991, 24, 775–781. [Google Scholar] [CrossRef]
  6. Arkin, E.M.; Chew, L.P.; Huttenlocher, D.P.; Kedem, K.; Mitchell, J.S.B. An Efficiently Computable Metric for Comparing Polygonal Shapes. IEEE Trans. Pattern Anal. Mach. Intell. 1991, 13, 209–216. [Google Scholar] [CrossRef]
  7. Lei, T.; Lei, Z. Optimal Spatial Data Matching for Conflation: A Network Flow-Based Approach. Trans. GIS 2019, 23, 1152–1176. [Google Scholar] [CrossRef]
  8. Lei, T.L. Large Scale Geospatial Data Conflation: A Feature Matching Framework Based on Optimization and Divide-and-Conquer. Comput. Environ. Urban Syst. 2021, 87, 101618. [Google Scholar] [CrossRef]
  9. Fu, Z.; Sun, Y.; Fan, L.; Han, Y. Multiscale and Multifeature Segmentation of High-Spatial Resolution Remote Sensing Images Using Superpixels with Mutual Optimal Strategy. Remote Sens. 2018, 10, 1289. [Google Scholar] [CrossRef]
  10. Hao, Y.-L.; Tang, W.-J.; Zhao, Y.-X.; Li, N. Areal Feature Matching Algorithm Based on Spatial Similarity. Acta Geod. Cartogr. Sin. 2008, 37, 501–506. [Google Scholar]
  11. Liu, L.; Zhu, D.; Zhu, X.; Ding, X.; Guo, W. A Multi-Scale Polygonal Object Matching Method Based on MBR Combinatorial Optimization Algorithm. Acta Geod. Cartogr. Sin. 2018, 47, 652–662. [Google Scholar] [CrossRef]
  12. Zhu, D.; Cheng, C.; Zhai, W.; Li, Y.; Li, S.; Chen, B. Multiscale Spatial Polygonal Object Granularity Factor Matching Method Based on BPNN. ISPRS Int. J. Geo-Inf. 2021, 10, 75. [Google Scholar] [CrossRef]
  13. Liu, L.; Ding, X.; Zhu, X.; Fan, L.; Gong, J. An Iterative Approach Based on Contextual Information for Matching Multi-Scale Polygonal Object Datasets. Trans. GIS 2020, 24, 1047–1072. [Google Scholar] [CrossRef]
  14. Liu, L.; Fu, Z.; Xia, Y.; Lin, H.; Ding, X.; Liao, K. A Building Polygonal Object Matching Method Based on Minimum Bounding Rectangle Combinatorial Optimization and Relaxation Labeling. Trans. GIS 2023, 27, 541–563. [Google Scholar] [CrossRef]
  15. Liu, H.; Guo, L.; Li, H.; Zhang, W.; Bai, X. Matching areal entities with CatBoost ensemble method. Geogr. Inf. Sci. 2022, 24, 2198–2211. [Google Scholar] [CrossRef]
  16. Clementini, E.; Lejdel, B.; Mazzagufo, S.; Laurini, R. Homological relations: A methodology for the certification of irregular tessellations. Trans. GIS 2021, 25, 491–515. [Google Scholar] [CrossRef]
  17. Zhang, C.; Tang, M.; Sheng, Y. Spatial Relationship Analysis of Geographic Elements in Sketch Maps at the Meso and Micro Spatial Scales. ISPRS Int. J. Geo-Inf. 2024, 13, 32. [Google Scholar] [CrossRef]
  18. Wu, J.; Zhao, Y.; Yu, M.; Zou, X.; Xiong, J.; Hu, X. A New Voronoi Diagram-Based Approach for Matching Multi-Scale Road Networks. J. Geogr. Syst. 2023, 25, 265–289. [Google Scholar] [CrossRef]
  19. Sun, Y.; Lu, Y.; Ding, Z.; Wen, Q.; Li, J.; Liu, Y.; Yao, K. Multi-Scale Road Matching Based on the Summation Product of Orientation and Distance and Shape Descriptors. ISPRS Int. J. Geo-Inf. 2023, 12, 457. [Google Scholar] [CrossRef]
  20. Huh, Y.; Kim, J.; Lee, J.; Yu, K.; Shi, W. Identification of Multi-Scale Corresponding Object-Set Pairs Between Two Polygon Datasets with Hierarchical Co-Clustering. ISPRS J. Photogramm. Remote Sens. 2014, 88, 60–68. [Google Scholar] [CrossRef]
  21. Schorcht, M.; Hecht, R.; Meinel, G. Comparative Study on Matching Methods for the Distinction of Building Modifications and Replacements Based on Multi-Temporal Building Footprint Data. ISPRS Int. J. Geo-Inf. 2022, 11, 91. [Google Scholar] [CrossRef]
  22. Lei, Z.; Lei, T.L. Large-Scale Integration of Remotely Sensed and GIS Road Networks: A Full Image-Vector Conflation Approach Based on Optimization and Deep Learning. Comput. Environ. Urban Syst. 2024, 113, 102174. [Google Scholar] [CrossRef]
  23. Renteria-Agualimpia, W.; Levashkin, S. Multi-Criteria Geographic Information Retrieval Model Based on Geospatial Semantic Integration. In Proceedings of the International Conference on GeoSpatial Semantics; Springer: Berlin/Heidelberg, Germany, 2011; pp. 166–181. [Google Scholar]
  24. Zhong, Y.; Su, Y.; Wu, S.; Zheng, Z.; Zhao, J.; Ma, A.; Zhu, Q.; Ye, R.; Li, X.; Pellikka, P.; et al. Open-Source Data-Driven Urban Land-Use Mapping Integrating Point-Line-Polygon Semantic Objects: A Case Study of Chinese Cities. Remote Sens. Environ. 2020, 247, 111838. [Google Scholar] [CrossRef]
  25. Liu, J.; Liu, H.; Chen, X.; Guo, X.; Zhao, Q.; Li, J.; Kang, L.; Liu, J. A Heterogeneous Geospatial Data Retrieval Method Using Knowledge Graph. Sustainability 2021, 13, 2005. [Google Scholar] [CrossRef]
  26. Zhao, Y.; Sun, Q.; Liu, X.; Cheng, M.; Yu, T.; Li, Y. Geographical Entity-Oriented Semantic Similarity Measurement Method and Its Application in Road Matching. Geomat. Inf. Sci. Wuhan Univ. 2020, 45, 728–735. [Google Scholar] [CrossRef]
  27. Tang, Y.; Gao, L.; Li, L.; Cheng, P.; Wang, H.; Li, X.; Chen, C. A Dynamic Weighted Model for Semantic Similarity Measurement Between Geographic Feature Categories. Acta Geod. Cartogr. Sin. 2023, 52, 843. [Google Scholar]
  28. Yan, Y.; Wu, P.; Yin, Y.; Guo, P. Robust Multi-Source Geographic Entities Matching by Maximizing Geometric and Semantic Similarity. Sci. Rep. 2024, 14, 31616. [Google Scholar] [CrossRef]
  29. Shi, S. A Geographic Data Fusion and Update Method Based on Geometric and Attribute Matching. Sens. Nat. Resour. 2023, 35, 1. [Google Scholar]
  30. Devlin, J.; Chang, M.W.; Lee, K.; Toutanova, K. BERT: Pre-Training of Deep Bidirectional Transformers for Language Understanding. In Proceedings of the 2019 Conference of the North American Chapter of the Association for Computational Linguistics: Human Language Technologies, Volume 1 (Long and Short Papers); Association for Computational Linguistics: Minneapolis, MN, USA, 2019; pp. 4171–4186. [Google Scholar]
  31. Reimers, N.; Gurevych, I. Sentence-BERT: Sentence Embeddings Using Siamese BERT-Networks. arXiv 2019, arXiv:1908.10084. [Google Scholar] [CrossRef]
  32. Lin, T.Y.; Dollár, P.; Girshick, R.; He, K.; Hariharan, B.; Belongie, S. Feature Pyramid Networks for Object Detection. In Proceedings of the IEEE Conference on Computer Vision and Pattern Recognition, Honolulu, HI, USA, 21–26 July 2017; pp. 2117–2125. [Google Scholar] [CrossRef]
  33. Wu, J.; Poloczek, M.; Wilson, A.G.; Frazier, P. Bayesian Optimization with Gradients. Adv. Neural Inf. Process. Syst. 2017, 30. [Google Scholar]
  34. Papadias, D.; Theodoridis, Y. Spatial Relations, Minimum Bounding Rectangles, and Spatial Data Structures. Int. J. Geogr. Inf. Sci. 1997, 11, 111–138. [Google Scholar] [CrossRef]
  35. Chen, J.; Li, J.; Lin, Y. Computing Connected Components of Simple Undirected Graphs Based on Generalized Rough Sets. Knowl.-Based Syst. 2013, 37, 80–85. [Google Scholar] [CrossRef]
  36. Rojas, C.; Linfati, R.; Scherer, R.F.; Pradenas, L. Using Geopandas for Locating Virtual Stations in a Free-Floating Bike Sharing System. Heliyon 2023, 9, e12749. [Google Scholar] [CrossRef]
  37. Zhang, R.; Ji, Y.; Zhang, Y.; Passonneau, R.J. Contrastive Data and Learning for Natural Language Processing. In Proceedings of the 2022 Conference of the North American Chapter of the Association for Computational Linguistics: Human Language Technologies: Tutorial Abstracts, Seattle, WA, USA, 10–15 July 2022; pp. 39–47. [Google Scholar]
  38. Bhattacharjee, S.; Das, A.; Bhattacharya, U.; Parui, S.K.; Roy, S. Sentiment Analysis Using Cosine Similarity Measure. In Proceedings of the 2015 IEEE 2nd International Conference on Recent Trends in Information Systems (ReTIS); IEEE: New York, NY, USA, 2015; pp. 27–32. [Google Scholar]
  39. Vaswani, A.; Shazeer, N.; Parmar, N.; Uszkoreit, J.; Jones, L.; Gomez, A.N.; Polosukhin, I. Attention Is All You Need. Adv. Neural Inf. Process. Syst. 2017, 30, 5998–6008. [Google Scholar]
Figure 1. Overall framework. ①②③④ are the four main processes, and *** represents the attribute.
Ijgi 14 00435 g001
Figure 2. Cases of misjudgment as intersection. Two colors represent the polygonal entities of two datasets. (a) shows a case where only the boundary lines touch during intersection analysis, which is mistakenly judged as an intersection; and (b) shows a case where the intersection analysis is overly sensitive to tiny area intersections, thereby incorrectly classifying them as valid intersection relationships.
Ijgi 14 00435 g002
Figure 3. Convex hull schematic diagram for 1:M and M:N matching relationships. (a) represents the 1:M matching type, where multiple entities (blue dashed lines) are aggregated into a single convex hull (yellow solid line); and (b) represents the M:N matching type, where M entities (light blue dashed lines) and N entities (light red dashed lines) are aggregated into two convex hulls (blue solid line and red solid line), respectively.
Ijgi 14 00435 g003
Figure 4. Flowchart of semantic similarity calculation. *** represents the attribute.
Ijgi 14 00435 g004
Figure 5. Structure of three-branch attention network.
Ijgi 14 00435 g005
Figure 6. Experimental data.
Ijgi 14 00435 g006
Figure 7. F1-scores for three methods with different matching relationships.
Ijgi 14 00435 g007
Figure 8. Qualitative comparison of experimental results. Two colors represent the polygonal entities of two datasets. (a) shows that the method integrating geometry and attributes fails to achieve matching, while the BPNN model and the method proposed in this paper can successfully achieve matching; and (b) shows that the method proposed in this paper can successfully achieve matching, whereas the other two methods cannot. (c,d) show cases where the method proposed in this paper fails in matching.
Ijgi 14 00435 g008
Figure 9. Weights of different features.
Ijgi 14 00435 g009
Figure 10. Comparison results of feature fusion.
Ijgi 14 00435 g010
Figure 11. Comparison of different weight allocation methods.
Ijgi 14 00435 g011
Figure 12. Generalized experimental data. Two colors represent the polygonal entities of two datasets.
Ijgi 14 00435 g012
Table 1. The impact of inconsistent attribute structure on calculating semantic similarity.
TypeSpecific CaseImpact
Non-Standardized DescriptionDataset A contains “Zhongyi Building”, while Dataset B contains “Huangshan Zhongyi Real Estate Co., Ltd.” (both refer to the same building entity but use non-uniform naming conventions).Traditional string-matching methods (e.g., edit distance, and TF-IDF) fail to correctly identify synonymous non-standard expressions, resulting in low calculated semantic similarity between matching pairs.
Differentiated AttributesDataset A includes attributes of “Project Name” and “Land Use”, while Dataset B only contains the “Building Name” attribute. There are no completely identical attributes between the two datasets, so “Building Name” in Dataset B must be used as a vague substitute for “Project Name” in Dataset A during matching.Two key issues arise: (1) attribute dimension mismatch (Dataset A has more attribute dimensions than Dataset B) causes traditional weighted fusion methods to lose critical feature information; and (2) the need for vague substitution (using “Building Name” to approximate “Project Name”) reduces feature reliability, collectively decreasing the robustness of matching.
Table 2. Definition of matching relationships.
Matching RelationshipDefinitionFormula
1:1The cluster contains only one entity from each of dataset A and B V A , i = 1   a n d   V B , i = 1
1:MOne dataset in the cluster contains only 1 entity, and the other dataset contains multiple entities   M 2 V A , i = 1 V B , i   2       V A , i 2 V B , i = 1  
M:NBoth datasets in the cluster contain multiple entities   M , N 2 V A , i 2   a n d   V B , i   2
Table 3. Statistical description of experimental area data.
Dataset ADataset B
PlaceHuangshan, China
Area64
NameNatural pavilionBuilding site
No. of polygons10,4712955
Table 4. Details of training and test data.
Training DataTest Data
Dataset A number90941377
Dataset B number2343612
1:1 number482345
1:M number1325166
M:N number2417
Table 5. Comparison of experimental results.
MethodRelationshipsTPFPFNPRF1
Geometry and PropertiesTotal466461691.0296.6893.76
1:1316161395.1896.0595.61
1:M13628282.9398.5590.07
M:N142187.5093.3390.32
BPNNTotal473441191.4997.7394.51
1:132215895.5597.5896.55
1:M13827183.6399.2890.79
M:N132286.6786.6786.67
This paperTotal489291094.4098.0096.17
1:132710897.0397.6197.32
1:M14718189.0999.3293.93
M:N151193.7593.7593.75
Table 6. Comparison of generalization experiment results.
MethodTPFPFNPRF1
Geometry and Properties379541787.5395.7191.44
BPNN403242394.3894.6094.49
This paper420181295.8997.2296.55
Disclaimer/Publisher’s Note: The statements, opinions and data contained in all publications are solely those of the individual author(s) and contributor(s) and not of MDPI and/or the editor(s). MDPI and/or the editor(s) disclaim responsibility for any injury to people or property resulting from any ideas, methods, instructions or products referred to in the content.