Article

Capturing the Footsteps of Mobility: A Machine Learning-Based Study on the Relationship Between Streetscape and Consumption Vitality

College of Geography and Environment, Shandong Normal University, Jinan 250358, China
*
Author to whom correspondence should be addressed.
ISPRS Int. J. Geo-Inf. 2025, 14(11), 422; https://doi.org/10.3390/ijgi14110422
Submission received: 5 September 2025 / Revised: 9 October 2025 / Accepted: 28 October 2025 / Published: 29 October 2025

Abstract

Urban streets serve as essential spaces for commercial activities and social interaction, yet the mechanisms through which their landscape elements influence consumption vitality remain insufficiently explored. Focusing on Lixia District, Jinan, China, this study integrates street-view image semantic segmentation with machine learning techniques to capture the nonlinear interactions between streetscape features and consumption vitality, thereby establishing an analytical framework for examining their associations. The results show that: (1) pedestrian-friendly facilities are significantly associated with higher street-level consumption vitality, with benches and streetlights showing marked effects once their visual proportions exceed 10% and 12%, respectively; (2) the visual proportion of parking space becomes positively associated with consumption vitality when exceeding 0.15, whereas carriageway proportion shows an overall negative association; (3) the marginal effect of advertising density gradually diminishes, with billboard visibility ratios above 25% exhibiting saturated impacts; (4) when green-view visibility exceeds 30%, consumption vitality increases substantially, peaking within the 35–40% range; (5) potential synergies or trade-offs exist among streetscape elements—compared with individual factors, the combinations of benches and parking spaces, benches and billboards, as well as parking spaces and billboards, are associated with higher street-level consumption vitality. In contrast, combinations involving a larger sky view ratio are often linked to lower consumption vitality, suggesting that overly open spaces may weaken consumer attractiveness. This study not only extends the methodological toolkit for analyzing consumption vitality but also provides theoretical and practical guidance for the refined design and experiential construction of urban street environments.

1. Introduction

Against the backdrop of rapid global urbanization, urban streets are not only fundamental units of transportation flow but also vital spaces for resident consumption activities and social interactions [1,2]. However, in many cities, street space renovations often prioritize traffic function optimization while neglecting the impact of streetscapes on consumption vitality, resulting in unattractive walking environments and insufficient commercial vibrancy during urban renewal processes [3]. Moreover, with the rise of the digital economy and the experience economy, consumer behavior has gradually shifted from a traditional material-oriented approach to a more scene-based, immersive, and socially interactive model. Nevertheless, offline consumption continues to dominate daily activities in many sectors, such as dining, retail, and cultural entertainment, where physical presence and social interaction remain indispensable. For example, restaurants, neighborhood markets, and leisure venues in Chinese cities still rely heavily on on-site visits, particularly for elderly consumers and family-oriented activities. These examples demonstrate that offline consumption vitality is not only a major driver of urban commercial vibrancy but also a critical component for understanding spatial differences in consumer behavior [4,5]. Therefore, optimizing streetscapes to enhance consumption vitality has become a pressing issue in urban planning and commercial space management.
Existing research on the relationship between streetscapes and consumption vitality has formed three main theoretical perspectives: First, from the perspective of space syntax theory, Hillier argues that spatial structure plays a crucial role in shaping human behavior patterns [6,7,8]. In practice, this theory has been applied in various cities to analyze how the layout of streets and urban networks influences foot traffic and consumer activity. For example, subsequent research has found that factors such as street accessibility and network connectivity influence the distribution of pedestrian flow, thereby impacting commercial activities [9,10,11,12]. However, existing research still lacks sufficient attention to micro-level streetscape elements such as the quality of the walking environment and the configuration of public facilities. The second perspective is from the scene theory viewpoint. Florida proposed the creative class clustering theory [13,14], which has been extended to the field of consumption. This theory emphasizes the importance of personalization, experience, and cultural atmosphere in influencing consumer behavior [15,16,17,18]. This theory has been applied in various urban settings to explain how factors like esthetic qualities and experiential elements contribute to a vibrant consumer culture. In places like cultural districts or creative hubs, the environment’s ambiance directly impacts spending behavior. For example, Xu Zhifen found that visual congestion affects consumers’ perceptual fluency, which in turn influences their purchase intentions [19]. However, the interaction mechanism between physical space and virtual symbols remains unclear, and there is a lack of refined quantitative analysis. The third perspective is from environmental psychology, where Kaplan proposed the restorative attention theory, suggesting that street greening and visual diversity help alleviate fatigue, thereby increasing consumers’ dwell time and enhancing their consumption experience [20,21,22]. However, the optimal threshold for variables such as green view index has not yet reached a consensus, and the mechanisms of their effects in different environments remain to be further explored.
At the methodological level, in recent years, machine learning techniques have gradually been applied to urban vitality research, particularly for capturing complex spatial heterogeneity patterns [23,24,25,26]. Compared to traditional regression models, machine learning methods can handle high-dimensional data and reveal the nonlinear relationships between variables [27,28,29]. For example, deep learning and random forest (RF) algorithms have been used in urban geography research to analyze the complex interactive mechanisms between street vitality and the built environment [23,30,31]. Among them, the RF model has become an ideal choice for studying the factors influencing street vitality due to its stability, strong resistance to overfitting, and high interpretability [32,33,34]. In addition, advancements in streetscape image semantic segmentation technology have made the quantitative analysis of street environments more refined [35,36]. The deep learning-based semantic segmentation method can automatically extract key elements from streetscape images, such as vegetation, roads, building facades, billboards, etc., thereby providing high-precision data support for studying the impact of streetscapes on street vitality [37,38,39,40]. However, most studies primarily focus on the independent effects of a single or a few streetscape elements, and research on how streetscape factors from different dimensions interact and jointly influence consumption vitality is still relatively scarce.
In summary, cross-national research has linked walkable street design, perceived comfort, and visual interest with retail performance and pedestrian spending; related work in transport geography and urban design highlights how micro-scale features shape dwell time and commercial flows, while computer-vision studies use street-view imagery to quantify such attributes. To address this gap, existing literature typically adopts either a spatial configuration (space syntax) or a perception/scene (scene theory) perspective, but lacks an operational framework that can simultaneously quantify visual/perceptual attributes (e.g., vegetation visibility, billboard visibility, sky visibility) and configurational attributes (e.g., accessibility, street connectivity) at the street-segment scale and examine their joint nonlinear effects and interaction thresholds. Our study fills this gap by integrating the perceptual indicators derived from semantic segmentation with the accessibility indicators calculated from the road network into a single interpretable machine learning pipeline, thereby identifying joint patterns such as “when A (e.g., vegetation visibility) exceeds a certain threshold and B (e.g., bench visibility) is within a certain range, consumption vitality significantly increases.” This type of “joint threshold” and interaction pattern is difficult to identify and visualize using simple linear regression or methods relying solely on space syntax or scene theory. To situate our Chinese case in a broader context, we integrate insights from this research and extend them with an interpretable ML pipeline at the street-segment scale. Guided by this background, this study asks: How do micro-scale streetscape elements—individually and jointly—associate with street-level consumption vitality? To address this, our objectives are threefold: (1) to identify the relative importance of different streetscape attributes, (2) to examine their nonlinear association patterns, and (3) to explore potential interactions among key features.
To achieve these objectives, we employ an RF model combined with semantic segmentation of street-view imagery to extract fine-grained streetscape features, which are then integrated with consumption vitality data at the street-segment scale.
The innovations of this study can be summarized in two key areas. Theoretically, it develops an operational synthesis of scene theory and space syntax theory: scene theory is applied to quantify perceptual attributes of the street environment from street-view images, while space syntax provides configurational measures of accessibility. Methodologically, it applies machine learning techniques to capture nonlinear relationships and interaction effects, thereby overcoming the linear assumptions inherent in traditional regression models.
The structure of the remaining sections of the paper is as follows: First, it introduces the case study area, the methods used for streetscape data acquisition, semantic segmentation, and RF modeling. Next, based on empirical data from Lixia District, Jinan, it analyzes the spatial differentiation characteristics of street consumption vitality. Then, it reveals the nonlinear effects and interactions of streetscape elements. Finally, it proposes corresponding optimization strategies and policy implications. Through a research cycle of “phenomenon analysis—mechanism exploration—strategy output”, the study provides dual support for the contemporary transformation of space syntax theory and the resilient governance of consumption spaces. While the case study focuses on Jinan’s Lixia District, the analytical framework and findings offer transferable insights for other urban contexts facing similar challenges in balancing pedestrian experience and commercial revitalization.

2. Materials and Methods

2.1. Study Area and Research Objects

Jinan, the capital of Shandong Province, an economically and culturally significant region in eastern China, serves as the political, economic, cultural, technological, educational, and financial center of the province. The case study area is Lixia District, Jinan (Figure 1), which spans an area of approximately 100.89 km2. As of the end of 2020, the district had a permanent population of 819,100. It is a key central urban area in Jinan for development and construction, and thus provides a representative snapshot of the current status of the city’s street landscapes. Moreover, as a focus area for urban renewal and refined governance in Jinan, Lixia District serves as an important model for street landscape optimization, commercial layout adjustments, and transportation planning improvements. The research results could provide scientific evidence for these urban processes and offer insights for enhancing vitality in core urban districts of other large and medium-sized cities. The study takes streets as the basic unit of analysis. Using OpenStreetMap “www.openstreetmap.org (accessed on 1 April 2024)”, the road network of Lixia District is obtained, which is then processed topologically with intersections broken down. Based on the centerline of the roads, buffer zones are created according to road hierarchy: 55 m for main roads, 50 m for secondary roads, and 30 m for side streets. This range effectively encompasses the three-dimensional space enclosed by street buildings and the shops and open spaces that impact street vitality, from both a functional and spatial perspective.

2.2. Variable Selection and Measurement

2.2.1. Dependent Variable: Street Consumption Vitality

Street consumption vitality refers to the frequency of consumption activities occurring within a street space, reflecting the level of commercial activity on the street. This study measures street consumption vitality using data from Meituan. Meituan is a leading local lifestyle service platform in China, covering industries such as dining, takeout, hotels, tourism, and entertainment. Its user-generated review data is widely used in urban studies to analyze consumption vitality and consumption patterns [41,42]. The specific representation method for street consumption vitality is as follows: First, merchant data within the study area were collected through the Meituan API, including merchant type, coordinates, number of reviews, ratings, and other information. Next, the streets are classified based on the number of commercial facilities within the buffer zone’s map points of interest (POIs). Streets with more than zero commercial facilities are classified as comprehensive streets, while streets with zero commercial facilities are classified as traffic-oriented streets. For comprehensive streets, street consumption vitality C ¯ is calculated as the sum of reviews for all merchants within the street buffer zone, normalized by the buffer area:
C ¯ = i = 1 n C i S
In the equation, C i represents the number of reviews for the i -th merchant on the street, S is the street buffer zone area, and n is the number of merchants within the street buffer zone. This calculation assigns equal weight to each merchant while accounting for differences in street size. In this study, we measure street consumption vitality using the weekly increment in review counts between 9 and 15 September 2024 (a period without major holidays, significant events, or extreme weather), calculated as the difference in cumulative reviews for each merchant during this period. This dynamic indicator avoids bias from legacy reviews. To ensure consistency, Baidu Street View imagery was collected in the same week, minimizing temporal mismatches and enhancing comparability between consumption vitality and streetscape characteristics.

2.2.2. Independent Variable: Streetscape

(1) Streetscape Image Collection. The streetscape image data used in this study is sourced from Baidu Maps. Baidu Maps is a leading map service platform in China, and its streetscape image data can visually present the street spatial environment. It has been widely applied in urban planning, environmental perception, commercial analysis, and other areas [43]. By using the Baidu Maps API, streetscape services can be accessed, and the relevant parameters can be set according to the API requirements to download streetscape images. The parameter settings are shown in Table 1. Among these, ak represents the user’s access key, which can be obtained by applying on the Baidu Maps Developer website; location represents the coordinates of the location for which the streetscape image is to be retrieved, and coordtype refers to the coordinate system used for the coordinates; heading represents the horizontal angle of the streetscape image, pitch is the vertical angle, fovy refers to the range of the visual field in the streetscape image, and width and height indicate the dimensions of the retrieved streetscape image.
In this study, sampling points are generated every 50 m along the road network data of the study area. The latitude and longitude coordinates of each sampling point are obtained and converted to Baidu coordinates through the Baidu Maps API. Based on the coordinates and the input parameters such as horizontal angle, vertical angle, field of view angle, and image resolution, Python 3.0 scripts are used to connect to the Baidu Maps Streetscape API to retrieve streetscape images at each sampling point. The horizontal angles are set to four directions, 0°, 90°, 180°, and 270°, while the vertical angle is set to 0°. For each sampling point, four streetscape images are retrieved from the front, back, left, and right directions. A total of 11,491 sampling points are set in this study, and 45,964 streetscape photos are collected.
(2) Semantic Segmentation of Streetscape Images. Traditional segmentation methods typically rely on different models to handle instance segmentation, semantic segmentation, and panoramic segmentation, which results in complexity and inefficiency. Mask2Former, as a solution, leverages the powerful capabilities of Transformer models to create a single, efficient model capable of adapting to various segmentation paradigms by learning mask representations [44]. This study uses the Mask2Former model for semantic segmentation of streetscape images, trained using the Mapillary Vistas dataset. We evaluate the model using both mean Intersection-over-Union (mIoU) and pixel accuracy. On our validation subset of 270 manually labeled Jinan street-view images, the model achieved a pixel accuracy of 0.89 and an mIoU of 0.55 across 16 aggregated categories. The relatively high pixel accuracy is mainly due to class imbalance, whereas mIoU provides a more balanced assessment of performance across all categories. For reference, Mask2Former achieves an mIoU of approximately 63~65 on the official Mapillary Vistas benchmark [44]. The slightly lower mIoU on our dataset reflects distributional differences between Mapillary Vistas and Jinan street scenes, indicating a domain shift when applying a model trained in one context to another. These metrics suggest that the model can reliably capture major streetscape elements for subsequent analyses. The semantic segmentation model provides classification results for 66 different features, such as sky, buildings, roads, and vegetation. A comparative analysis between the original image and the segmentation results (Figure 2) shows that the classification results obtained through the semantic segmentation model accurately reflect the actual conditions of the streetscape.
To improve model accuracy and reduce computational complexity while comprehensively reflecting streetscape features, we selected 16 factors as independent variables. These factors cover multiple dimensions of streetscapes, including the walking space and comfort dimension (sidewalk, fence, streetlight, trash bin, bench), traffic efficiency and mobility dimension (carriageway, parking space, traffic light, traffic sign), business and consumption attraction dimension (billboard, banner, building), and environmental esthetics and spatial perception dimension (vegetation, sky, utility pole, fire hydrants).

2.2.3. Control Variables

(1) Street mobility vitality. This study uses Baidu heatmap data to represent the intensity of street pedestrian mobility vitality. The data is generated by Baidu Maps based on massive location-based service (LBS) data and visualizes real-time crowd density. It calculates user movement trajectories, check-in information, Wi-Fi connections, GPS positioning, and other multi-source data to reflect the crowd distribution and dynamic changes in different urban areas. Compared with traditional manual surveys or mobile signaling data, Baidu heatmap data has the advantages of high timeliness, high spatial resolution, and wide coverage, making it an important data source for studying street mobility vitality [45]. The specific calculation process of street mobility vitality is as follows: First, register and obtain the Baidu Maps mobile development key (AK) from the Baidu Maps website “https://lbsyun.baidu.com (accessed on 24 December 2024)” and configure the integrated development environment. Using an Android emulator, call the city heatmap interface through the Baidu Android Map SDK to retrieve real-time heatmap data for Lixia District from 9 to 15 September 2024. The data was scraped at hourly intervals, and a total of 168 heatmap images were collected. Second, after coordinate transformation and projection correction, each heatmap raster is reclassified according to the official legend, where color values and brightness jointly indicate the population density level. The reclassified raster is then vectorized so that each polygon carries an integer density attribute. Third, the vectorized heatmap is intersected with the road buffer zones, generating multiple sub-polygons (i = 1…n) for each road segment. Here, i units explicitly refer to these sub-polygons created by the intersection, each with an associated density level and area. A weighted average is then calculated using polygon area as the weight to obtain the continuous street mobility vitality for each road segment:
M ¯ = i = 1 n S i M i i = 1 n S i
In the formula, M ¯ represents the street mobility vitality, M i is the movement intensity level of the i -th unit within the street, S i is the area of unit i , and n is the number of level data units within the road buffer zone.
(2) Street accessibility. Data on educational facilities, medical facilities, park green spaces, government agencies, and public transportation facilities were obtained from Baidu Maps. First, using the Route Analysis tool in the Network Analyst module of ArcGIS 10.2, the nearest road network distance from the centroids of streets to educational facilities, medical facilities, park green spaces, government agencies, and public transportation facilities was calculated in bulk, in order to represent the convenience of accessing basic life services. Second, to reduce the confounding effects between streetscape factors and consumption vitality and to avoid attributing higher vitality merely to areas with dense commercial clustering, the number of commercial facilities was selected as a control variable. In practice, streets with a high concentration of shops and restaurants often invest more in benches, lighting, and signage, which can make streetscape features appear stronger. Without controlling for the density of commercial facilities, one might mistakenly interpret these enhanced features as independent effects of the streetscape, rather than outcomes of commercial agglomeration. By including the number of commercial facilities as a control, we more accurately isolate the true impact of streetscape factors on consumption vitality. In addition, to partially account for the spatial distribution and density of facilities, the Shannon diversity index of POIs within the street buffer zone was used to capture both the functional diversity and spatial heterogeneity of services. The Shannon diversity index, rooted in information theory, quantifies the uncertainty in the distribution of facility types. Higher values indicate a more even distribution across categories, reflecting a greater variety of services and a more balanced provision of amenities for residents. POI data was obtained from Baidu Maps, covering 11 categories: companies and enterprises, residential areas, dining services, accommodation services, tourism and sightseeing, cultural and recreational activities, shopping, transportation facilities, scientific research and education, government institutions, and public services, with 30 subcategories in total.

2.3. Regression Model and Testing

The Random Forest (RF) model offers several advantages for studying the factors influencing street vitality in this research. First, RF naturally adapts to high-dimensional, nonlinear data, which is crucial when analyzing complex urban environments where the relationships between street elements (such as vegetation, benches, and billboard visibility) and consumer vitality are not linear. Additionally, RF is robust to outliers and noise, which are common in real-world urban data, ensuring that the model remains stable even in the presence of irregularities or missing data. Another strength of RF is its ability to capture interactions between variables, which is essential when considering how different streetscape elements (e.g., green space and commercial density) jointly affect street vitality. Moreover, using SHAP and Partial Dependence Plots (PDP), RF can help identify the most important influencing factors, interaction effects, and key thresholds, such as when certain variables exceed a threshold and significantly boost consumer activity. Although other machine learning models, such as Support Vector Machines or Neural Networks, could also be applied, RF strikes a balance between predictive accuracy and interpretability, making it particularly suitable for our research context.
When constructing the multiple linear regression model, the variance inflation factor (VIF) was used to test the correlation among the independent variables. A higher VIF indicates severe multicollinearity between the independent variables, which may lead to insignificant model results. In such cases, the model should be rebuilt to address the multicollinearity issue and improve the reliability of the results [46]. The formula for multiple linear regression is as follows [47]:
Y = α 0 + β 1 X 1 + β 2 X 2 +   β n X n + ε ,
where Y is the street consumption vitality, α 0 is the constant term, β 1 β n are the regression coefficients, X 1 X n are the influencing factors, and ε is the residual term.
We implemented the RF regression model in Python within the Jupyter Notebook 7.3.2 environment, including model training, parameter tuning, and result visualization. Jupyter Notebook is a web-based interactive computing environment widely used in data science, machine learning, scientific computing, and other fields [48]. The implementation relied on scikit-learn for RF modeling, GridSearchCV for hyperparameter tuning, with 10-fold cross-validation used to evaluate model performance and prevent overfitting, and matplotlib for visualization. After multiple rounds of tuning, the selected parameters for the RF regression are: n_estimators = 200, max_depth = 8, min_samples_split = 10, min_samples_leaf = 5, and random_state = 42.
In this study, the evaluation metrics for the regression model’s accuracy are the coefficient of determination (R2), the root mean squared error (RMSE), and the mean absolute error (MAE). The R2 measures the degree of fit between the predicted and observed values, with a range of [0, 1]. The closer R2 is to 1, the better the fit of the regression model. RMSE is the square root of the mean squared error, reflecting the average magnitude of residuals, while MAE is the mean of the absolute residuals. Smaller values of RMSE and MAE indicate better predictive performance [49].

3. Results

3.1. The Spatial Distribution Pattern of Street Consumption Vitality

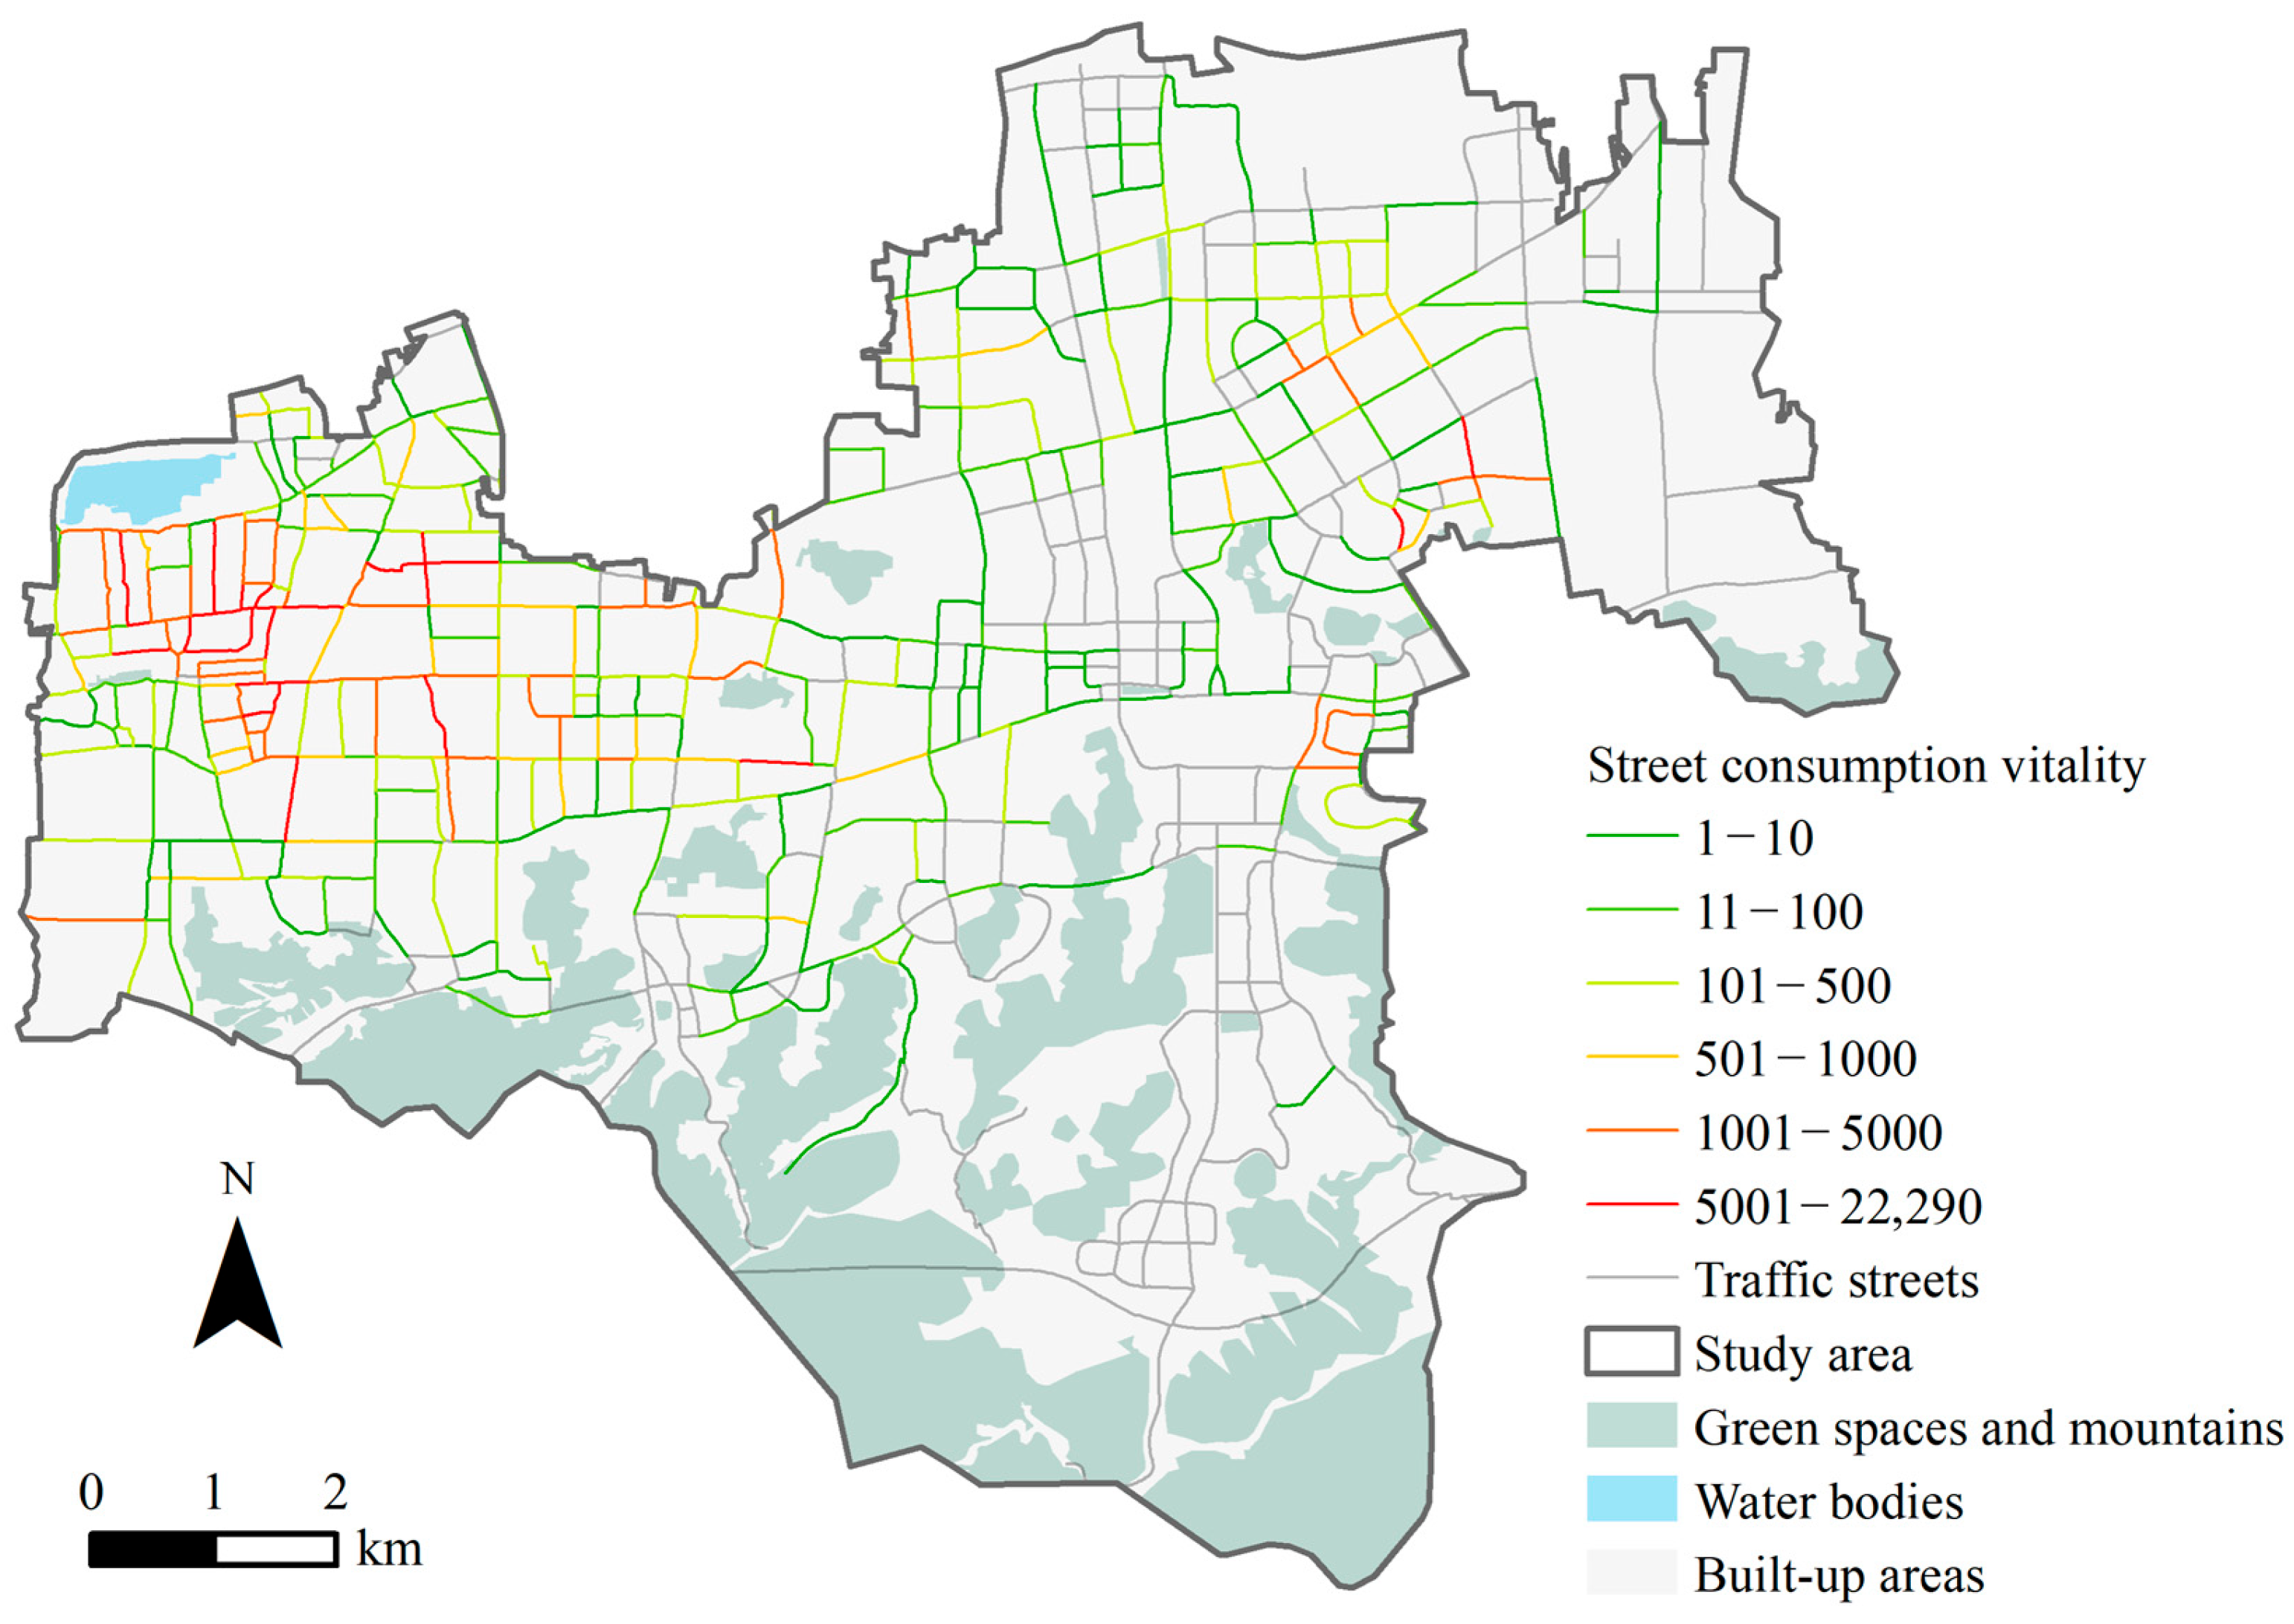
The measurement results of street consumption vitality are visualized, and they correspond closely to the observed commercial landscape of Lixia District (Figure 3). In particular, high-vitality areas identified by the model overlap with well-known prosperous commercial districts and major traffic corridors, while low-vitality areas coincide with ecological green spaces and low-density residential zones. This consistency demonstrates that the measurement results reflect the objective spatial distribution of commercial activity in Jinan. Overall, the street consumption vitality in Lixia District shows a “core-periphery” structure, decreasing from the center to the outskirts, consistent with the general pattern of urban commercial layout. This pattern can also be observed in similar studies in other cities, such as in Chongqing, where urban vitality similarly decreases from the central business district to the suburbs or less developed areas [1]. Specifically, streets with higher vitality are mainly concentrated in dense commercial streets with abundant facilities and pedestrian flows. Streets with moderate vitality are found along secondary commercial and residential streets, where consumption activity is relatively balanced. Streets with low vitality are generally located near green spaces or low-density residential streets with fewer commercial facilities. While some of these low-vitality streets may coincide with broader city zones (e.g., eastern and southern areas or mountainous regions), these references serve only as contextual background and do not affect the street-level quantitative analysis. In addition, streets with higher consumption vitality are often located along major traffic arteries, indicating that traffic accessibility positively influences street-level consumption vitality, which is consistent with similar research findings [9]. In the context of Jinan, many large shopping malls, retail clusters, and catering businesses are concentrated along major arterials, which not only serve as transportation corridors but also attract significant pedestrian flows. As a result, these roads combine mobility and consumption functions, thereby reinforcing their vitality. In summary, street consumption vitality in Lixia District exhibits a clear spatial pattern of concentration along commercial streets and main roads, with lower vitality observed on streets adjacent to green spaces or low-density residential areas.

3.2. Relationship Between Street Landscape and Consumption Vitality

3.2.1. Model Fit and Importance Analysis of Influencing Factors

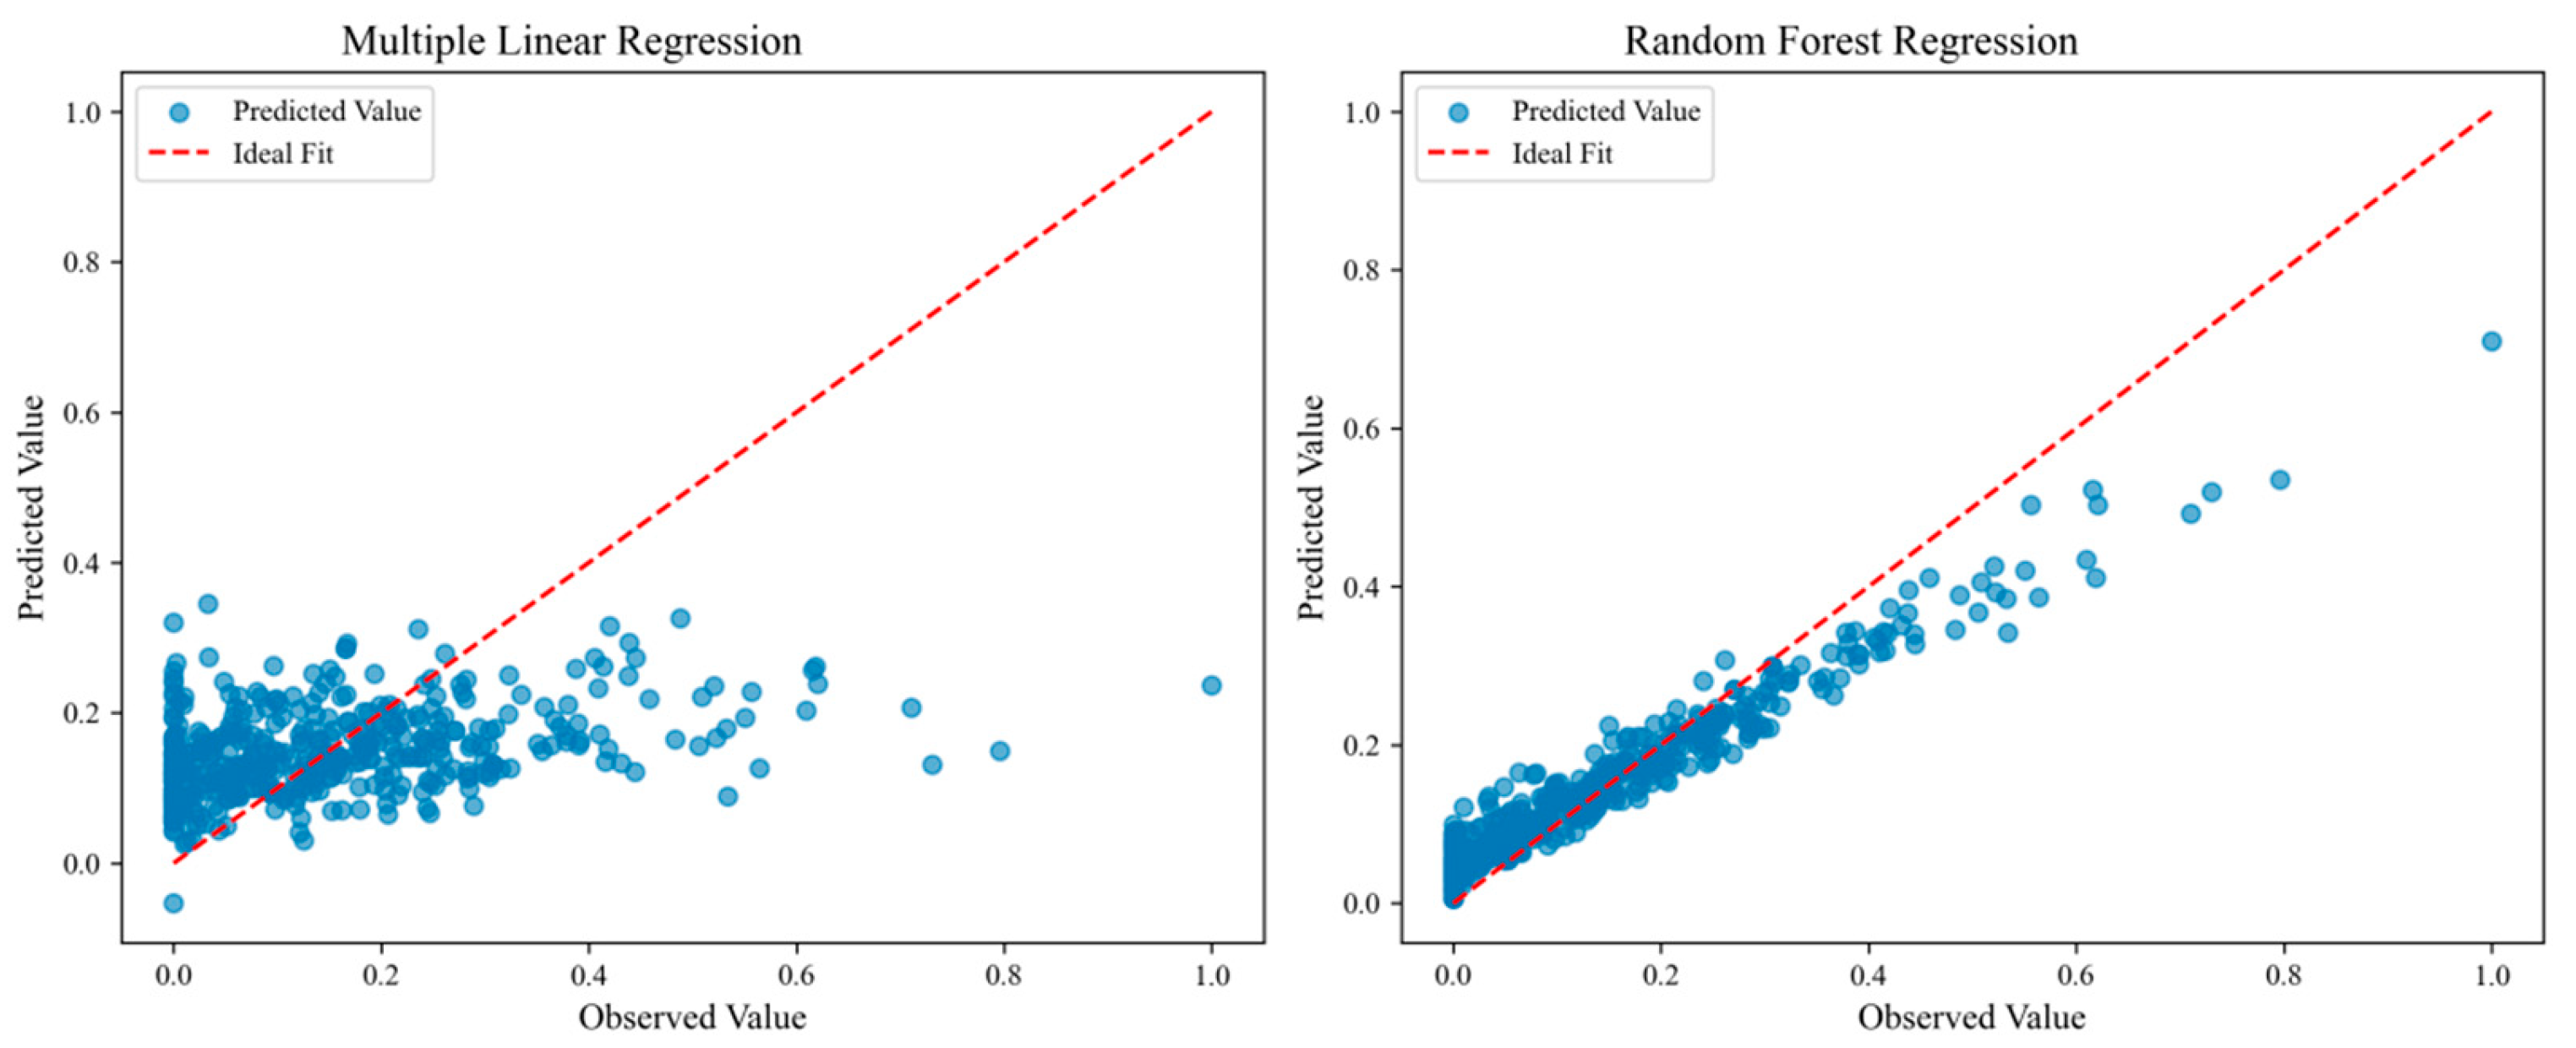
A RF model was established with 24 potential influencing factors and street consumption vitality to explore the impact of street landscape on consumption vitality. Ten-fold cross-validation was used to assess the model’s accuracy, and the accuracy was compared with that of the multiple linear regression model (Figure 4). Considering the correlation between independent variables, a collinearity test was conducted before performing multiple linear regression. The results showed that the VIF of all factors was less than 10, indicating no significant multicollinearity. The results indicated that the adjusted R2 of the multiple linear regression model was 0.179, while the adjusted R2 of the RF model reached 0.877, improving by 0.698 compared to the multiple linear regression model. Moreover, the RF model achieved an RMSE of 0.08 and MAE of 0.05, both substantially lower than those of the multiple linear regression model (RMSE = 0.21, MAE = 0.15). Therefore, the RF model has better fit and was selected for analyzing the relationship between street landscape and consumption vitality.
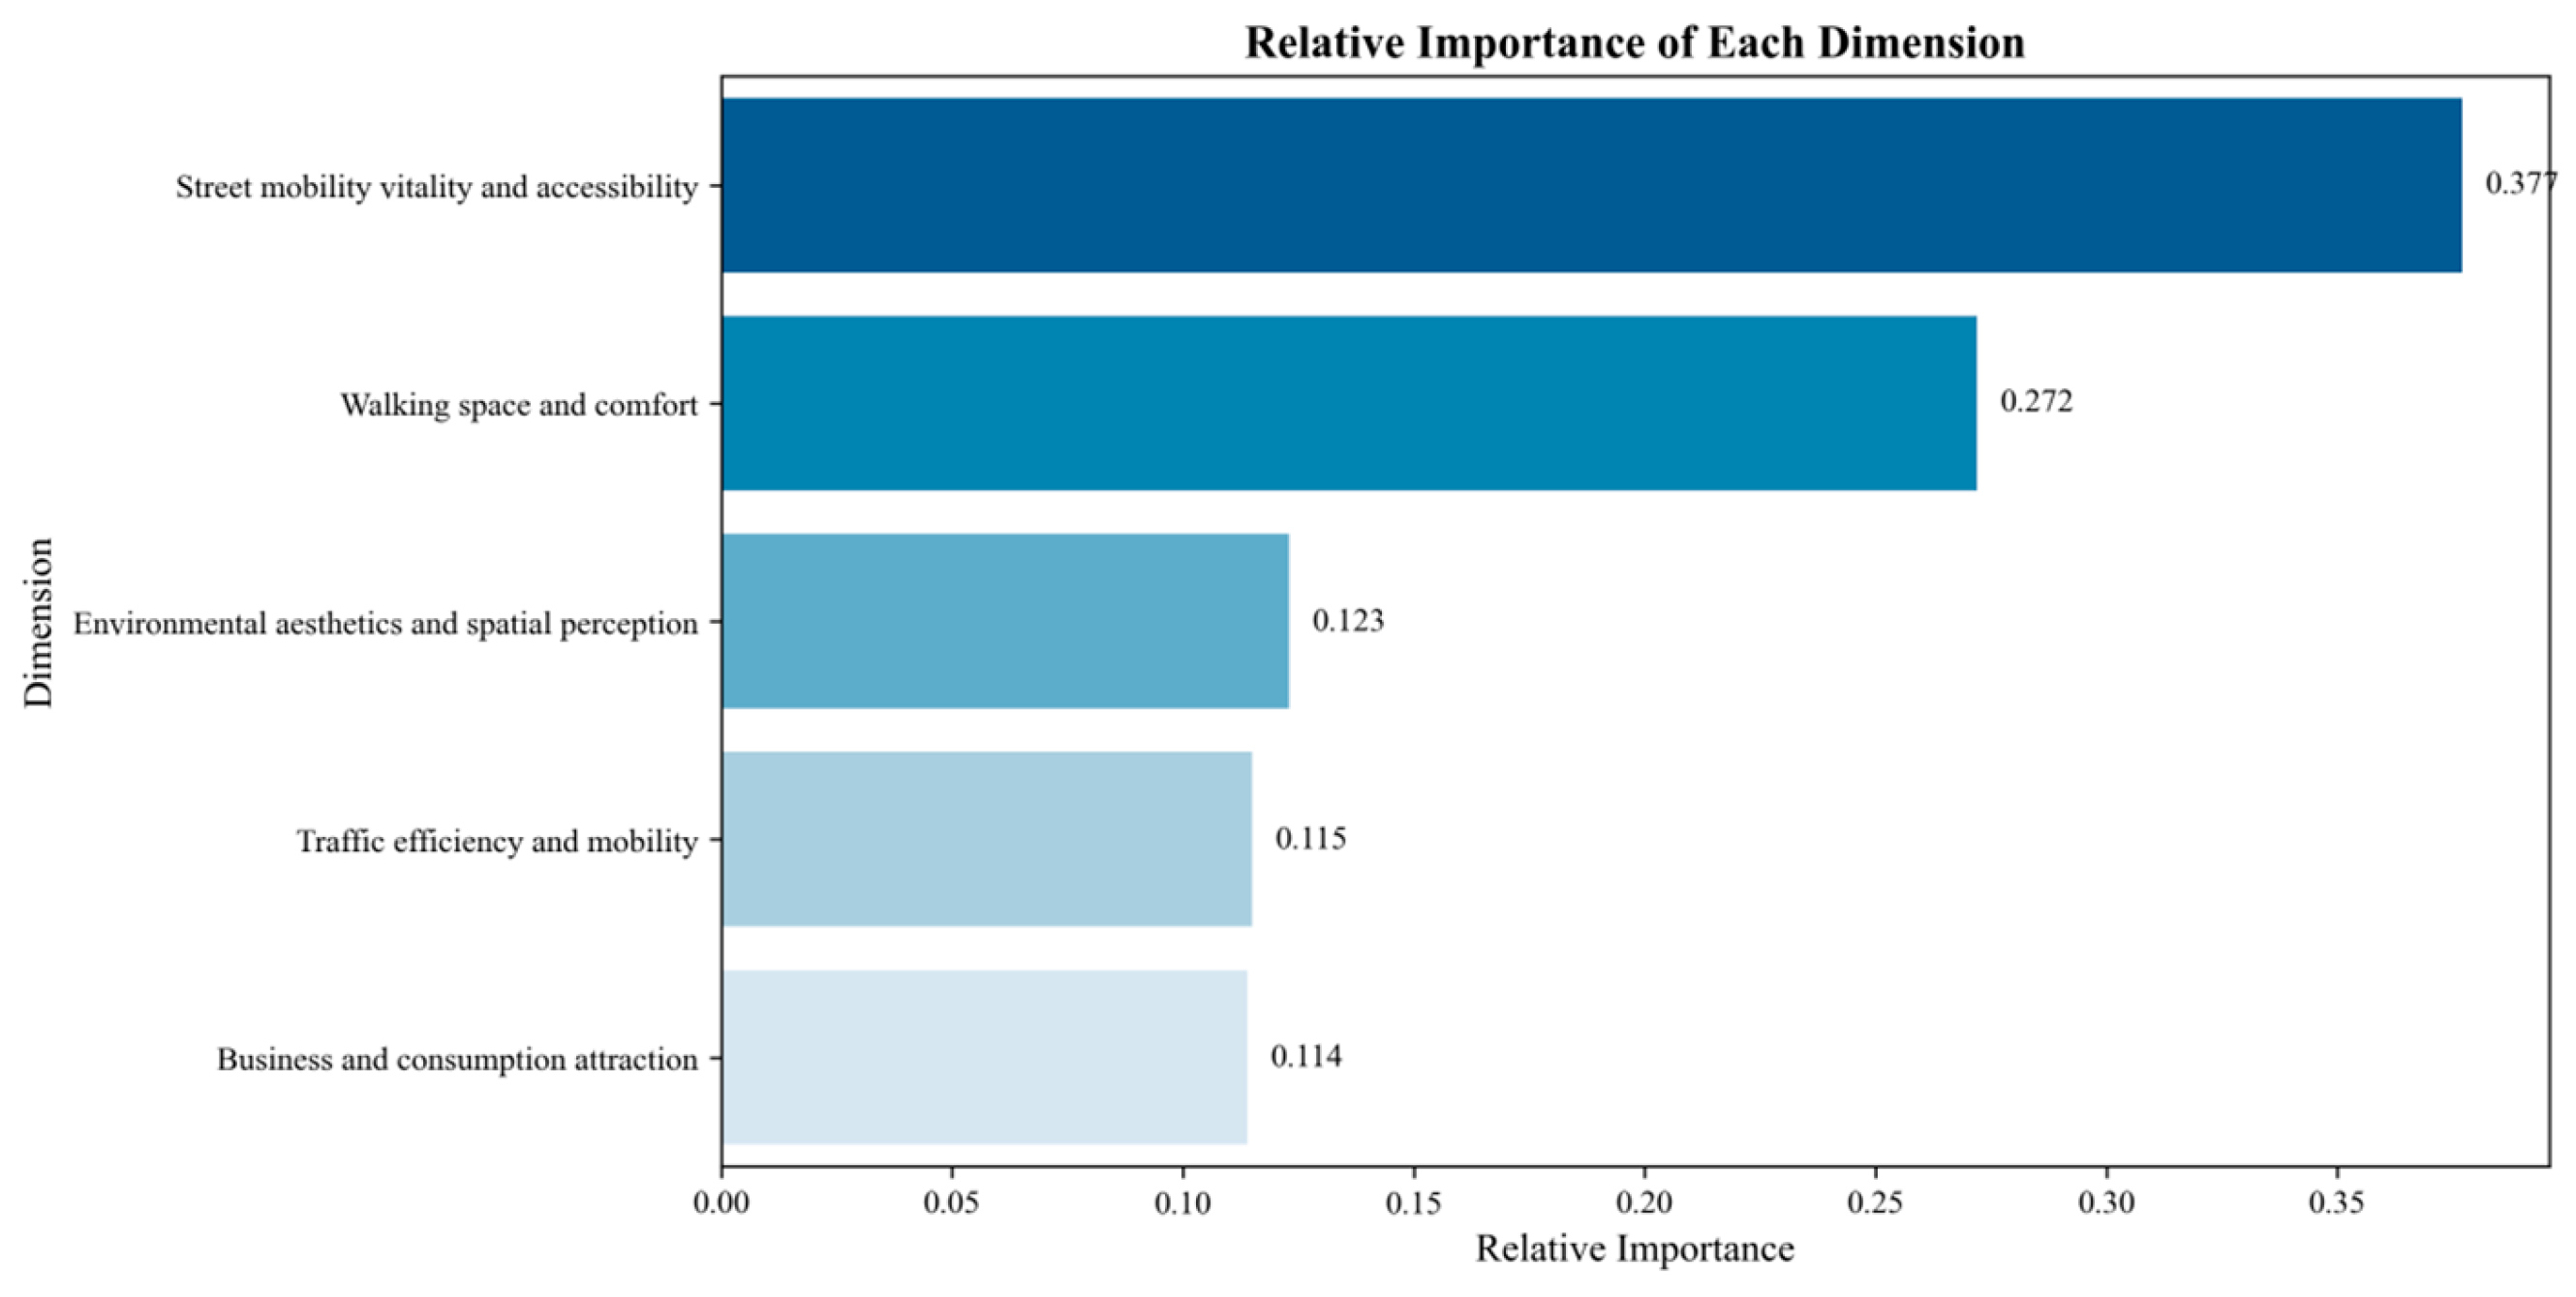
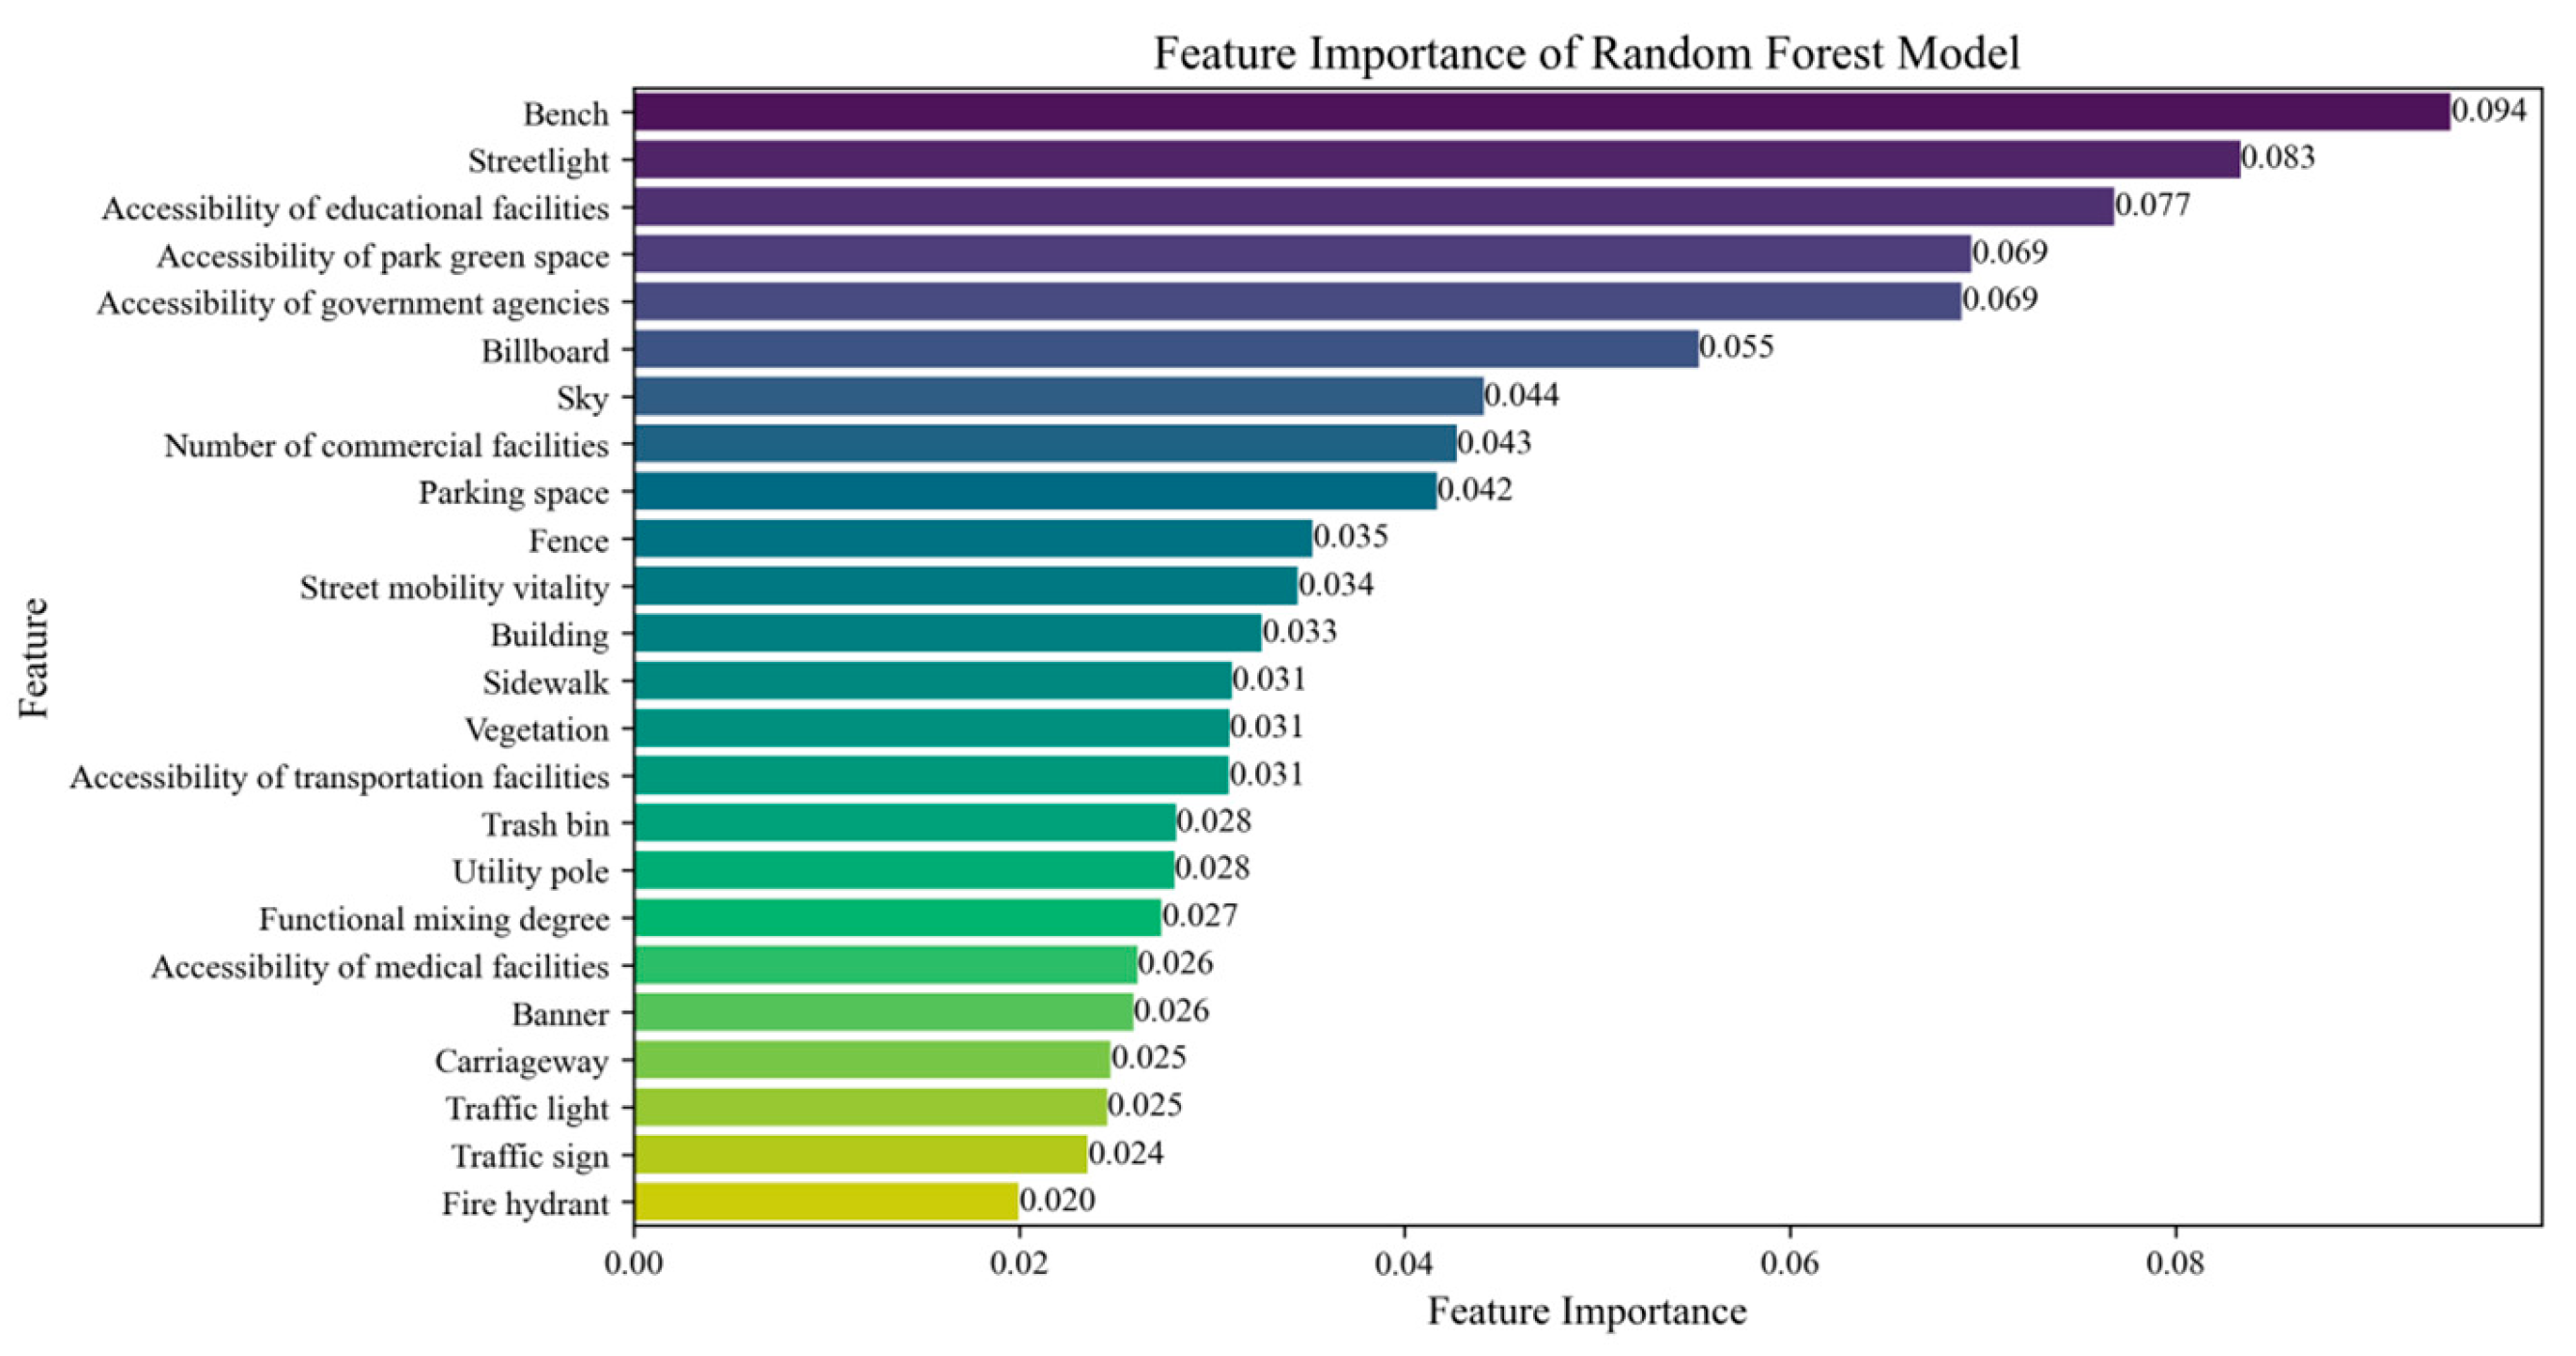
The relative importance of street landscape factors on consumption vitality was determined by calculating IncMSE, that is, the increase in mean squared error when the values of a variable are randomly permuted while all others are left unchanged. A larger IncMSE indicates that the variable contributes more strongly to the predictive accuracy of the RF model. It should be noted that, in addition to four dimensions derived from streetscape features segmented from Baidu Street View images, we also included a fifth dimension—“street mobility vitality and accessibility”—which represents control variables rather than direct streetscape factors. Specifically, the dimensions of street mobility vitality and accessibility had the greatest impact on consumption vitality, accounting for 37.7% (Figure 5). Among them (Figure 6), the contributions of accessibility to educational facilities (7.7%), accessibility to park green space (6.9%), and accessibility to government agencies (6.9%) were relatively high, suggesting an association between proximity to basic public services and higher levels of street consumption vitality. The relative importance of the number of commercial facilities (4.3%) and street mobility vitality (3.4%) ranked 8th and 11th, respectively, suggesting that although the number of commercial facilities and pedestrian flow are important supports for consumption activities, factors such as street landscape and accessibility may have a greater impact on consumption vitality. Nevertheless, these findings highlight statistical associations captured by the RF model rather than unidirectional causal effects. If the street landscape is poorly designed or lacks attractiveness, even with a high pedestrian flow, the conversion rate of consumption may still be low. The impact of accessibility to public transportation facilities (3.1%), functional mixing degree (2.7%), and accessibility to medical facilities (2.6%) on consumption vitality is relatively limited.
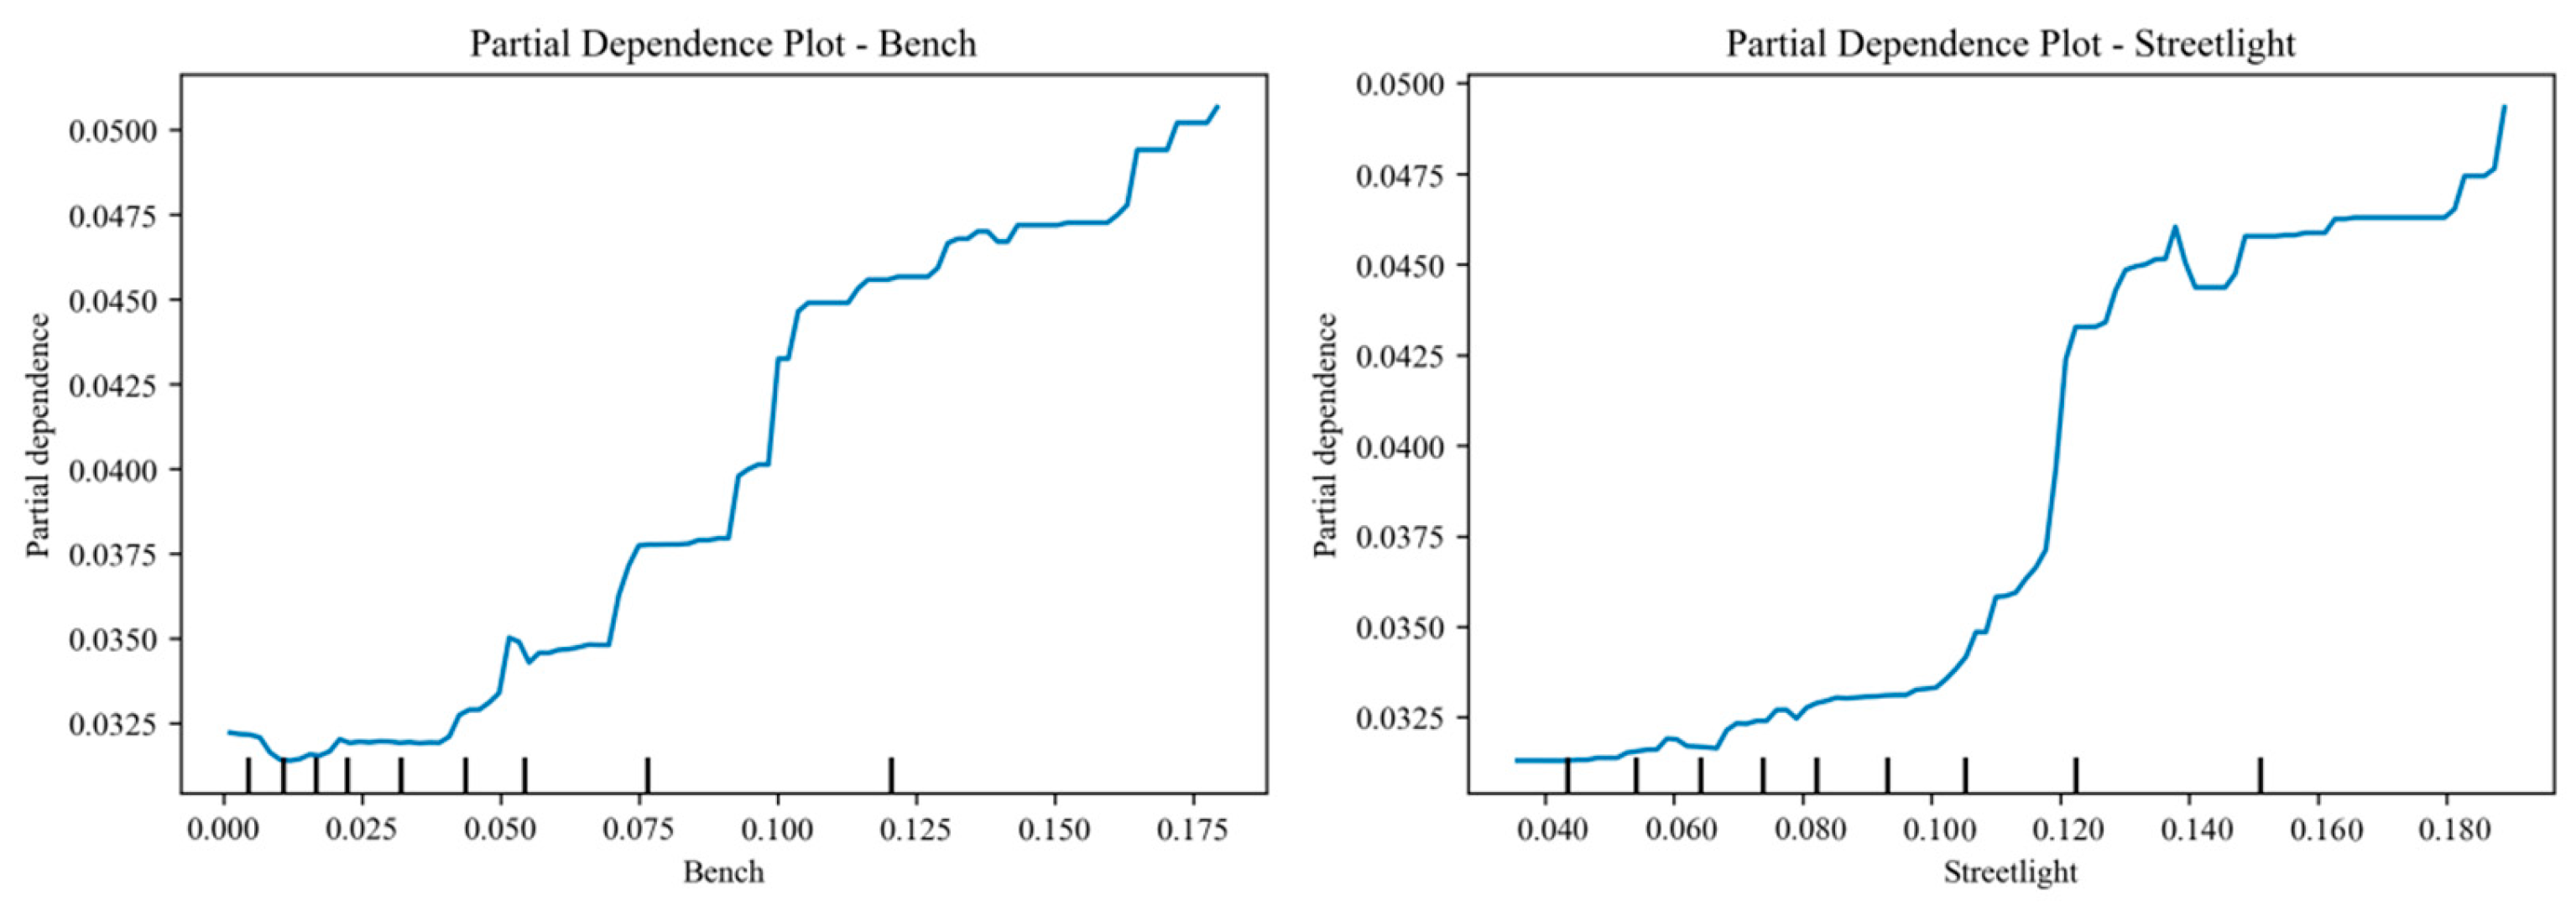
Among the street landscape factors, the dimension of walking space and comfort (27.2%) had a much greater association with consumption vitality compared to other dimensions. This finding highlights a strong correlation between high-quality walking environments and areas of greater commercial activity. Among them, the factor with the highest contribution was Bench (9.4%), followed by Streetlight (8.3%). Benches were correlated with higher consumption vitality, possibly because they provide resting spaces that may relate to longer staying time and more frequent social interactions. Similarly, streetlighting showed a notable association, which could be explained by its role in enhancing perceived safety and comfort for walking at night, thereby supporting evening commercial activity. Additionally, the combined contribution of Fence, Sidewalk, and Trash Bin to street consumption vitality was 9.4% in total. The dimension of environmental esthetics and spatial perception had an observed contribution of 12.3% to predicted consumption vitality. Among them, the contributions of Sky (4.4%) and Vegetation (3.1%) were relatively high, suggesting that open views and greenery tend to be linked with stronger street consumption vitality. Utility pole (2.8%) and Fire hydrant (2.0%) also had some influence, but their importance was relatively small. The dimension of traffic efficiency and mobility had an estimated contribution of 11.5%. Among them, the factor with the highest contribution was Parking space (4.2%), indicating that better parking availability is often found in streets with higher consumption vitality. This may reflect the role of car-dependent mobility patterns in shaping where consumption occurs. The impacts of Carriageway (2.5%), Traffic light (2.5%), and Traffic sign (2.4%) were relatively small, showing that heavy traffic or traffic management facilities are not necessarily aligned with higher street consumption vitality. The dimension of business and consumption attraction had an importance of 11.4%. The factor with the largest contribution was Billboard (5.5%), which appears to be positively associated with street consumption vitality, consistent with the idea that commercial advertisements can draw consumer attention. Additionally, the contribution of Building was 3.3%, and the contribution of Banner was 2.6%, implying that building density and small-scale advertising are also correlated with stronger commercial activity.

3.2.2. Non-Linear Relationship Between Key Streetscape Factors and Street Consumption Vitality

By selecting key factors that significantly correlate with street consumption vitality, the accumulated local effect (ALE) plots were drawn to visualize the non-linear relationship between them, using bootstrap resampling (n = 500). For each sample, RF was trained, and the corresponding ALE values for each variable were calculated at grid points, with the 2.5% and 97.5% percentiles of each grid point taken as the confidence band. As shown in Figure 7, walking space and comfort exhibit a notable non-linear positive association with street consumption vitality. The study found that as the proportion of benches increased from 0.00 to 0.175 and the proportion of streetlights increased from 0.04 to 0.18, the partial dependence values of consumption vitality increased from 0.0325 to 0.0500, with an increase of 53.8%. When the proportions of benches and streetlights were below 0.05 and 0.10, respectively, the partial dependence values increased slowly, suggesting that lower levels of basic infrastructure are associated with smaller increases in predicted consumption vitality. However, when the proportion of benches exceeded 0.10 and the proportion of streetlights exceeded 0.12, there was a noticeable increase in consumption vitality. These patterns indicate that moderate amounts of resting facilities and night-time lighting are linked to longer pedestrian staying times and higher levels of consumption vitality.
In the dimension of traffic efficiency and mobility, both parking space and carriageway show notable associations with predicted street consumption vitality, as illustrated in Figure 8. The study found that when the proportion of parking space ranged from 0.00 to 0.15, the partial dependence value of street consumption vitality fluctuated and decreased. When the proportion of parking space exceeded 0.15, predicted consumption vitality tended to stabilize and increased further once the proportion exceeded 0.30, indicating a positive association between higher parking availability and predicted consumption vitality in commercial areas. In contrast, the relationship between carriageway width and predicted consumption vitality shows a generally negative pattern. When the proportion of carriageway width increased from 0.10 to 0.35, the partial dependence value of consumption vitality dropped from 0.039 to 0.034, a decrease of more than 12.8%. This trend is consistent with the observation that wider carriageways are associated with reduced pedestrian-friendly environments, which are linked to lower predicted consumption vitality. When the proportion of carriageway width exceeded 0.40, consumption vitality slightly rebounded, likely due to the presence of high-end commercial properties on some wide roads. Overall, the results suggest that the configuration of parking space and carriageway width is associated with predicted consumption vitality, highlighting the need to balance mobility and walkability. Wider carriageways are generally linked with lower predicted consumption vitality, whereas moderate allocation of parking space is associated with higher predicted consumption vitality, provided walking space is maintained.
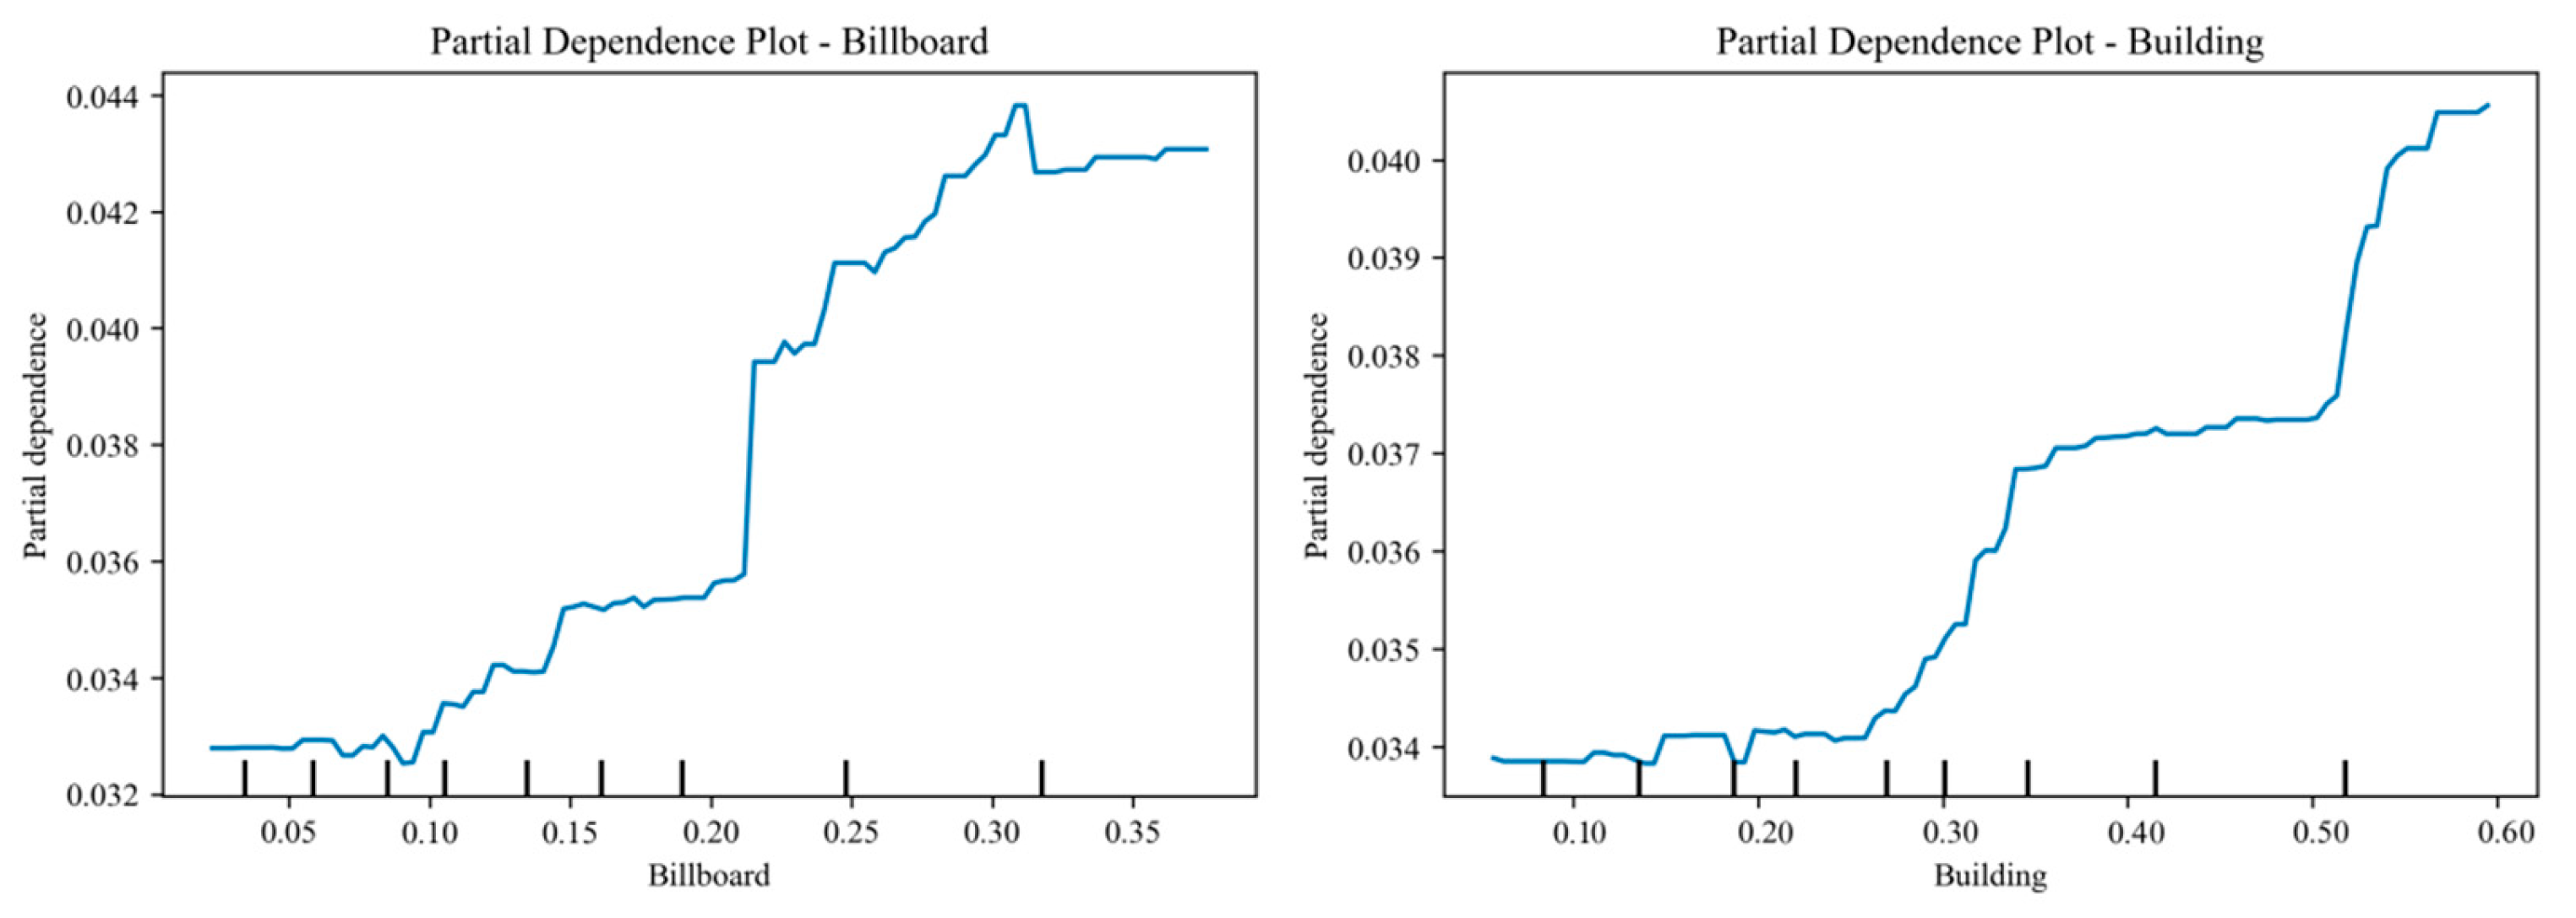
Business and consumption attraction are observed to be important factors associated with street consumption vitality. As shown in Figure 9, higher visual proportions of commercial advertising and greater building density are linked with higher predicted levels of street consumption vitality. The study found that when the visual proportion of billboards increased from 0.00 to 0.35, the partial dependence value of street consumption vitality increased from 0.033 to 0.043, an increase of approximately 30.0%. When the proportion of billboards was below 0.20, the association with consumption vitality was relatively weak. As the proportion exceeded 0.20, predicted consumption vitality increased more sharply, indicating that a moderate density of commercial advertising is associated with higher observed street-level activity. However, a marginal increase in predicted consumption vitality slowed when the billboard proportion exceeded 0.25, which may reflect saturation effects or visual clutter. Similarly, building density showed a notable association with street consumption vitality. When the visual proportion of buildings increased from 0.10 to 0.60, the partial dependence value of consumption vitality increased from 0.034 to 0.040, an increase of about 17.6%. Predicted consumption vitality tended to increase more clearly once the building proportion exceeded 0.26, suggesting that higher building density is associated with more concentrated commercial space. However, when the building density exceeds 0.50, consumption vitality experiences rapid growth again, indicating that streets with highly concentrated commercial space are generally associated with higher levels of consumption vitality.
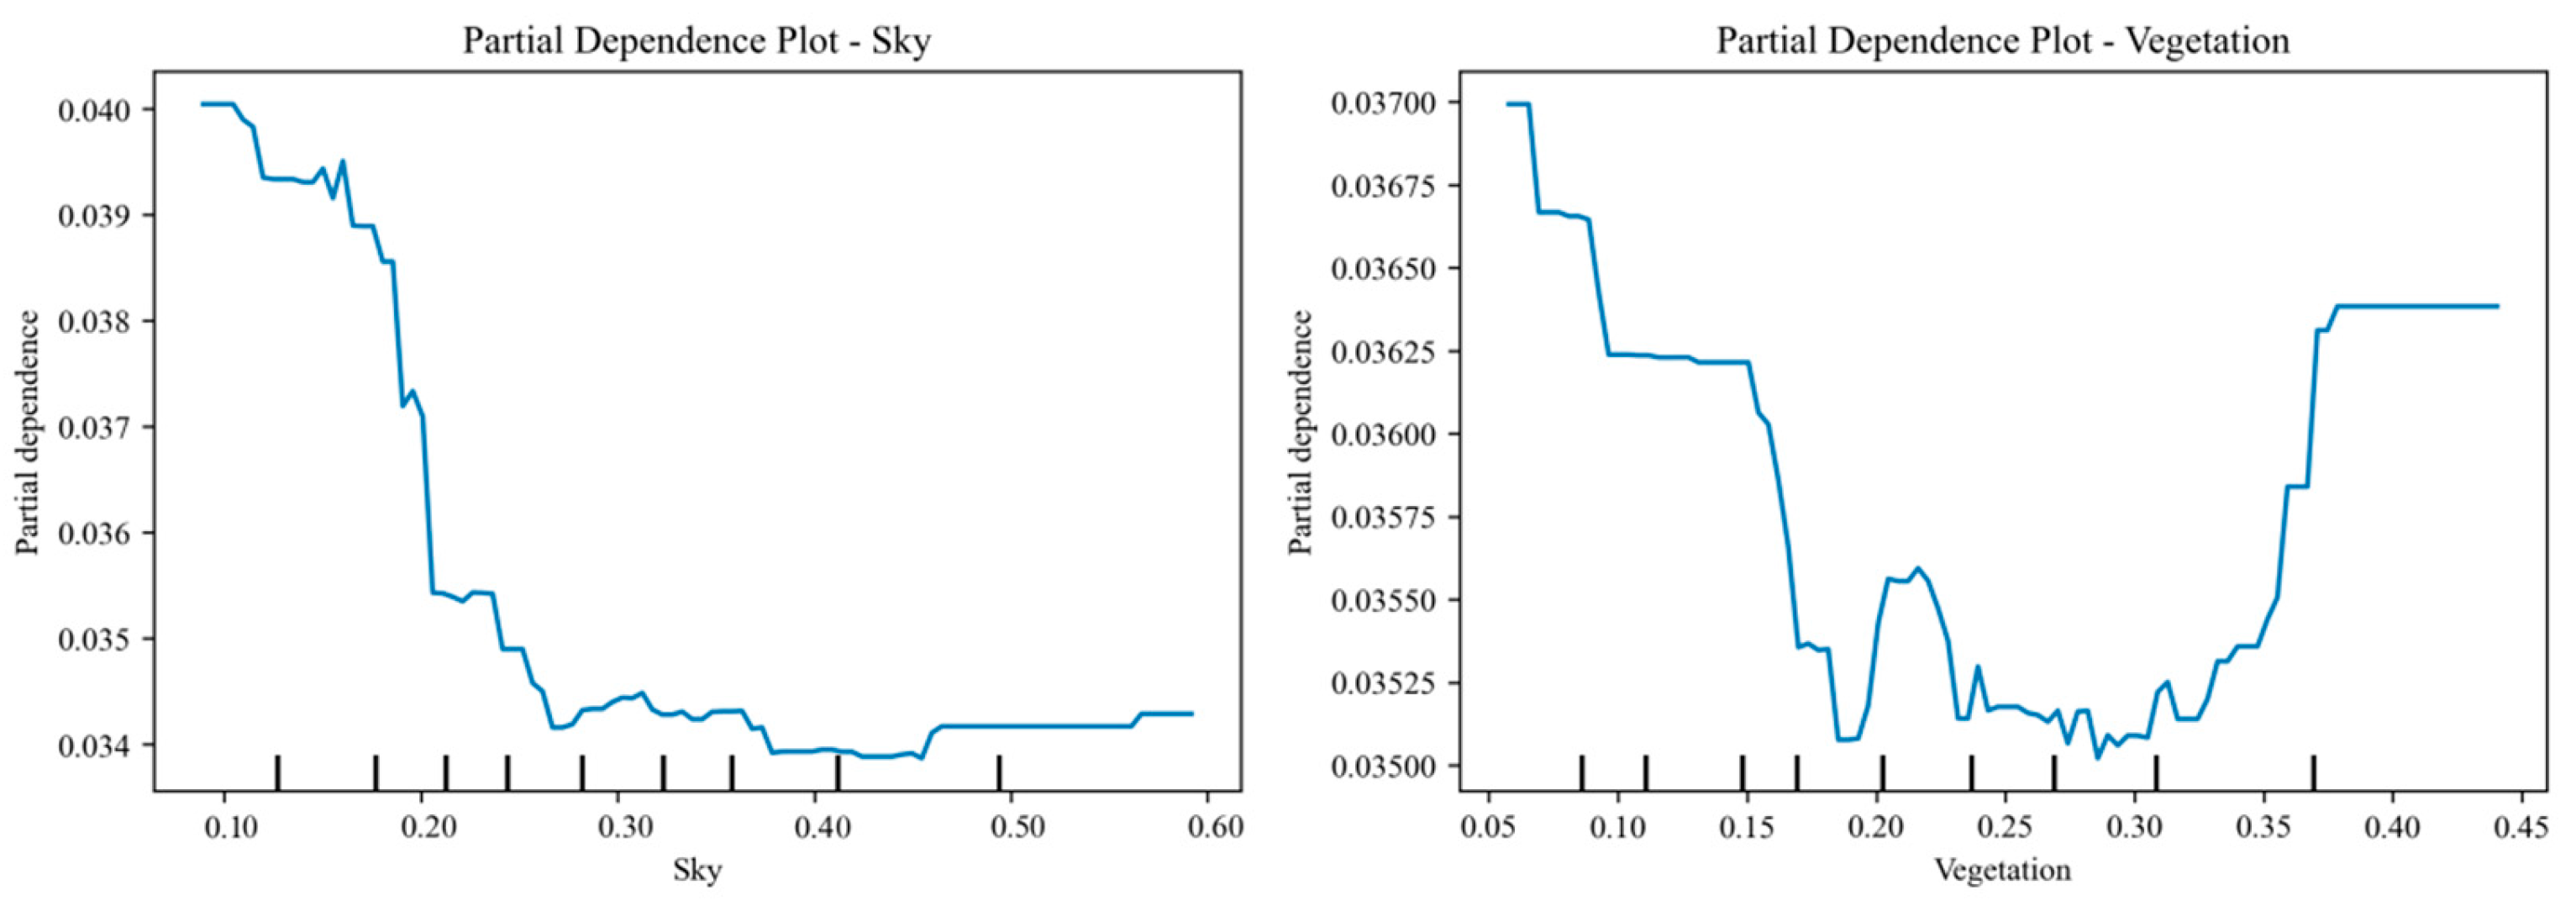
In the dimension of environmental esthetics and spatial perception, the effects of sky and vegetation on street consumption vitality show distinct non-linear associations (Figure 10). The relationship between the sky and consumption vitality exhibits a generally decreasing pattern. When the sky proportion increases from 0.10 to 0.20, the partial dependence value of consumption vitality decreases from 0.040 to 0.037, a decrease of about 7.5%. As the sky proportion further increases beyond 0.30, consumption vitality continues to decrease and stabilize, reaching a minimum of around 0.034. This pattern is consistent with the observation that higher sky proportions are associated with lower building density, fewer commercial facilities, and reduced spatial enclosure, which correspond to lower predicted street-level activity. Therefore, in the spatial planning of commercial districts, a moderate sense of enclosure (controlling the sky proportion between 0.10 and 0.25) is linked with higher predicted consumption vitality. The relationship between vegetation and consumption vitality exhibits a typical U-shaped trend. When the vegetation coverage increases from 0.05 to 0.20, the partial dependence value of consumption vitality decreases from 0.037 to 0.035, indicating that lower levels of greenery are associated with minimal changes in predicted consumption vitality. However, when vegetation coverage exceeds 0.30, consumption vitality tends to rebound, particularly in the range of 0.35–0.40, where higher values of consumption vitality are observed. This suggests that a certain level of street vegetation is linked with an enhanced environmental experience and higher predicted pedestrian activity.

3.2.3. Analysis of Interactions Between Key Streetscape Factors

The Bivariate Partial Dependence Plot (Bivariate PDP) illustrates how the predicted street consumption vitality is associated with the joint values of two streetscape factors while holding other variables constant. The X and Y axes represent the value ranges of the independent variables, while the color gradient in the plot reflects the trend of changes in the target variable. Using the Bivariate PDP (Figure 11), we analyzed the patterns of association key streetscape factors on street consumption vitality. The interaction between Bench and Parking space shows a notable association with predicted consumption vitality. When both factors are at low values (Bench < 0.05; Parking space < 0.1), predicted street consumption vitality is low (Street consumption vitality ≈ 0.03). When Bench increases to 0.1 and Parking space rises to about 0.2, predicted vitality increases to the range of 0.04–0.05. This highlights the possibility of a non-linear relationship, where the interaction between walking facilities and parking availability triggers a significant increase in vitality once certain thresholds are met. Similarly, the interaction between Bench and Billboard exhibits a positive association. When Bench is about 0.1 and Billboard is around 0.3, consumption vitality reaches a high level (Street consumption vitality ≈ 0.06), suggesting that a comfortable walking environment combined with commercial presence tends to correspond with higher consumption activity. This interaction shows that at certain critical thresholds of these two factors, consumption vitality increases exponentially, suggesting a non-linear, threshold-based relationship between street features and pedestrian activity. Furthermore, when the proportion of Billboard is high (Billboard > 0.2) and Parking space is at a moderate level (Parking space ≈ 0.2), street consumption vitality reaches 0.05. Compared to univariate associations, the combined patterns of Bench & Parking space, Bench & Billboard, and Parking space & Billboard indicate stronger predicted vitality values, suggesting that certain combinations of walking facilities, commercial advertising, and parking availability are linked with higher street-level activity. These interactions highlight that specific combinations of these factors can produce significantly higher levels of vitality than when considered individually, reinforcing the importance of a multi-dimensional approach to urban planning. However, interactions involving sky proportion tend to be associated with lower predicted consumption vitality. In the interaction plots of Bench & Sky, Parking space & Sky, and Billboard & Sky, when the sky visibility exceeds 0.3, consumption vitality drops to 0.03–0.04. This trend aligns with the observation that higher sky proportion often corresponds to lower building density and reduced enclosure, which are linked to lower pedestrian activity. These results suggest that while open spaces might have some benefits, their excessive visibility can diminish the sense of enclosure, which in turn reduces pedestrian comfort and activity. This non-linear relationship points to the critical balance between openness and enclosure in streetscape design. In conclusion, the Bivariate PDP analysis highlights that the association between street consumption vitality and streetscape factors depends on their joint configuration. Streets with moderate walking facilities, commercial elements, and parking availability tend to be associated with higher predicted vitality, whereas excessively open street spaces are generally associated with lower predicted vitality. The analysis of these non-linear interactions underlines the importance of considering the complex interdependencies of streetscape elements in urban design.

4. Discussion

This study reveals the differentiated patterns of association between streetscape elements and street consumption vitality. The research finds that streetscape elements are strongly linked to consumption vitality, and their relative influence appears to surpass that of traditional commercial elements in certain contexts. This observation supplements and extends the understanding of classical commercial location theory, particularly regarding the impact of commercial center size and transportation costs on consumption vitality [50,51], and aligns with the widely discussed “place theory,” which emphasizes the importance of a place’s social attributes and esthetic experiences in shaping its consumption appeal [52,53,54].
The RF model highlights nonlinear associations of streetscape elements with consumption vitality. Specifically, (1) Walkability elements, such as benches and streetlights, are associated with higher levels of street consumption vitality, reflecting a “rest-lighting” system that coincides with the “pedestrian scale priority” design principle [35,55,56]. (2) Perceptual elements (such as sky visibility and vegetation coverage) relate to spatial experiences through visual esthetics. The U-shaped association between vegetation coverage and street consumption vitality indicates a potential threshold effect, consistent with the “restorative attention” theory [20,21,22]. Observations suggest that street spaces with green visibility exceeding approximately 30% tend to correspond to higher vitality levels, which may provide a useful reference for urban ecological considerations. (3) Inflection points in the relationships of parking spaces and carriageway width suggest a complex association between mobility and walkability. (4) The observed saturation effect of advertising density shows that when the advertising ratio exceeds 25%, the association with street consumption vitality plateaus. This pattern aligns with research on “attention dilution” [19,57], where excessive visual complexity may limit positive responses, indicating potential trade-offs in the perceptual environment.
The interaction analysis of key street landscape factors further reveals three notable associative patterns: (1) Walkability-Mobility Co-occurrence. Streets with both walking facilities and parking provision tend to correspond to higher levels of consumption vitality. (2) Walkability-Perceptual Co-occurrence. Streets combining pedestrian comfort and visual stimulation often show relatively elevated consumption vitality. (3) Mobility-Perceptual Threshold Association. High parking provision combined with high sky visibility is associated with comparatively lower consumption vitality, possibly reflecting weaker spatial enclosure. These patterns describe observed associations rather than causal effects, providing insights into how combinations of streetscape elements relate to consumption vitality. Although based on a single Chinese district, these patterns suggest a framework for characterizing street-level vitality using spatial-environmental indicators, which may be informative for urban designers and policy-makers in comparable contexts.
In addition, the observed patterns have practical implications for urban design and policy in Jinan. To prioritize interventions under budget constraints, it is recommended to first improve walkability and perceptual quality, particularly by increasing benches and enhancing street lighting in areas with low consumption vitality. Streets with lower observed consumption vitality may benefit from improvements in walkability, perceptual quality, and balanced mobility. Next, optimizing green space coverage should focus on street segments where green view coverage is below 30%. Managing parking provision should also target streets with high parking occupancy but low pedestrian traffic, while calibrating commercial density should aim to maintain a balance, with billboard visibility not exceeding 25% to avoid negative impacts on visual comfort. The minimum implementation unit should be at the street segment level, allowing for more targeted interventions in specific sections of streets.
This study has several limitations. First, regarding data timeliness, the use of single-period data may underestimate the seasonal effects of vegetation. Second, concerning scale sensitivity, the analysis focused on the street scale and did not examine the moderating effects of neighborhood or larger urban scales. Third, with respect to the measurement of consumption vitality, this study relied on the number of merchants and user reviews from the Meituan API as proxies. While useful, these indicators may underestimate the activity of traditional stores that primarily serve elderly customers or depend on offline foot traffic, due to their limited visibility on online platforms. Moreover, the Meituan data may include delivery-only transactions, which could partially inflate street consumption vitality metrics relative to on-site consumer activity. Although this does not invalidate the observed spatial patterns, it should be acknowledged as a limitation, and future studies could aim to distinguish between in-store and delivery consumption to better isolate on-site activity. Fourth, this study did not include a systematic sensitivity analysis of RF hyperparameters or detailed residual diagnostics, which could provide further insights into model robustness and sources of prediction error. Although these limitations exist, the observed patterns remain informative for understanding street-level associations [58]. Future studies could combine multiple data sources, such as street view imagery or official commercial statistics, to capture consumption vitality more comprehensively. Additionally, integrating street network density, Space Syntax analysis, and multi-source data fusion could help explore spatial configuration effects across scales and over time, supporting more nuanced assessments of urban vitality.

5. Conclusions

This study integrates machine learning techniques with spatial analysis methods to develop a multidimensional framework for evaluating streetscapes, revealing the nonlinear associations between streetscape features and street consumption vitality and providing a novel perspective on the evolution of urban consumption spaces. The results indicate that streetscape dimensions related to walkability and comfort may play an important role in shaping observed consumption vitality, while the coordinated optimization of commercial appeal and traffic efficiency appears to be associated with further enhancement of street-level consumer attraction, highlighting the potential magnifying effects of micro-scale spatial design on consumption environments. In addition, moderate control of sky visibility and adequate vegetation coverage are associated with a balance between spatial enclosure and ecological comfort, which may further correspond to higher levels of consumption vitality. These findings not only offer policy-relevant insights for urban governance but also establish a conceptual framework of “design-enabled consumption,” providing methodological guidance for creating more inclusive and vibrant urban consumption spaces.

Author Contributions

Conceptualization, Xiaoqing Zhang; data curation, Yiming Hou; formal analysis, Yiming Hou; funding acquisition, Xiaoqing Zhang; methodology, Yiming Hou and Jia Jia; project administration, Yiming Hou and Jia Jia; software, Yiming Hou; supervision, Xiaoqing Zhang; writing—original draft, Yiming Hou and Xiaoqing Zhang; writing—review and editing, Xiaoqing Zhang and Yiming Hou. All authors have read and agreed to the published version of the manuscript.

Funding

This research was funded by the Key Projects of Key Research Base of Humanities and Social Sciences of Ministry of Education (22JJDZS790102) and the Shandong Provincial Natural Science Foundation (ZR2025QC371).

Data Availability Statement

The data presented in this study are unavailable due to privacy restrictions.

Conflicts of Interest

The authors declare no conflicts of interest.

References

  1. Yang, F.F.; Lin, G.; Lei, Y.B.; Wang, Y.; Yi, Z. Understanding Urban Vitality from the Economic and Human Activities Perspective: A Case Study of Chongqing, China. Chin. Geogr. Sci. 2024, 34, 52–66. [Google Scholar] [CrossRef]
  2. Li, K.R.; Lin, Y. Exploring the Correlation between Streetscape and Economic Vitality Using Machine Learning: A Case Study in the Old Urban District of Xuzhou, China. ISPRS Int. J. Geo-Inf. 2023, 12, 267. [Google Scholar] [CrossRef]
  3. Lian, H.; Li, X.; Zhou, W.; Zhang, J.; Li, H. Pedestrian vitality characteristics in pedestrianized commercial streets-considering temporal, spatial, and built environment factors. Front. Archit. Res. 2024, 14, 630–653. [Google Scholar] [CrossRef]
  4. Zhang, X.; Du, L.; Song, X. Identification of Urban Renewal Potential Areas and Analysis of Influential Factors from the Perspective of Vitality Enhancement: A Case Study of Harbin City’s Core Area. Land 2024, 13, 1934. [Google Scholar] [CrossRef]
  5. Liu, X.; Tong, D.; Huang, J.; Zheng, W.; Kong, M.; Zhou, G. What matters in the e-commerce era? Modelling and mapping shop rents in Guangzhou, China. Land Use Policy 2022, 123, 106430. [Google Scholar] [CrossRef]
  6. Hillier, B. A theory of the city as object: Or, how spatial laws mediate the social construction of urban space. Urban Des. Int. 2002, 7, 153–179. [Google Scholar] [CrossRef]
  7. Hillier, B. Studying cities to learn about minds: Some possible implications of space syntax for spatial cognition. Environ. Plan. B Plan. Des. 2012, 39, 12–32. [Google Scholar] [CrossRef]
  8. Hillier, B. The Knowledge that Shapes The City: The Human City Beneath the Social City. In Proceedings of the 4th International Space Syntax Symposium, London, UK, 17 June 2003. [Google Scholar]
  9. Peng, C.; Jin, P. Consumer streets: Microscopic evidence of road density and consumption vitality. China Econ. Q. Int. 2023, 3, 60–75. [Google Scholar] [CrossRef]
  10. Kim, S.; Woo, A. Streetscape and business survival: Examining the impact of walkable environments on the survival of restaurant businesses in commercial areas based on street view images. J. Transp. Geogr. 2022, 105, 103480. [Google Scholar] [CrossRef]
  11. Izanloo, A.; Rafsanjani, A.K.; Ebrahimi, S.P. Effect of commercial land use and accessibility factor on traffic flow in Bojnourd. J. Urban Plan. Dev. 2017, 143, 05016016. [Google Scholar] [CrossRef]
  12. Ma, Z.; Li, C.; Zhang, P.; Zhang, J.; Liu, D.; Xie, M. The impact of transportation on commercial activities: The stories of various transport routes in Changchun, China. Cities 2023, 132, 103979. [Google Scholar] [CrossRef]
  13. Florida, R. Cities and the creative class. City Community 2003, 2, 3–19. [Google Scholar] [CrossRef]
  14. Martin, R.; Florida, R.; Pogue, M.; Mellander, C. Creativity, clusters and the competitive advantage of cities. Compet. Rev. 2015, 25, 482–496. [Google Scholar] [CrossRef]
  15. Rachmad, Y.E. The Future of Influencer Marketing: Evolution of Consumer Behavior in the Digital World; PT. Sonpedia Publishing: Jakarta, Indonesia, 2024. [Google Scholar]
  16. Abdel Monem, H. The effectiveness of advertising personalization. J. Des. Sci. Appl. Arts 2021, 2, 114–121. [Google Scholar] [CrossRef]
  17. Srivastava, M.; Kaul, D. Exploring the link between customer experience–loyalty–consumer spend. J. Retail. Consum. Serv. 2016, 31, 277–286. [Google Scholar] [CrossRef]
  18. Xie, Q.; Hu, L.; Wu, J.; Shan, Q.; Li, W.; Shen, K. Investigating the influencing factors of the perception experience of historical commercial streets: A case study of Guangzhou’s Beijing road pedestrian street. Buildings 2024, 14, 138. [Google Scholar] [CrossRef]
  19. Xu, Z. Effect of visual crowding in packaging on consumers’ buying intention. Asia Pac. J. Mark. Logist. 2024, 36, 293–314. [Google Scholar] [CrossRef]
  20. Kaplan, S. The role of natural environment aesthetics in the restorative experience. In Managing Urban and High-Use Recreation Settings; Forest Service, USDA: Washington, DC, USA, 1993; pp. 46–49. [Google Scholar]
  21. Kaplan, R. Impact of urban nature: A theoretical analysis. Urban Ecol. 1984, 8, 189–197. [Google Scholar] [CrossRef]
  22. Kaplan, R. The role of nature in the context of the workplace. Landsc. Urban Plan. 1993, 26, 193–201. [Google Scholar] [CrossRef]
  23. He, S.; Zhang, Z.; Yu, S.; Xia, C.; Tung, C.-L. Investigating the effects of urban morphology on vitality of community life circles using machine learning and geospatial approaches. Appl. Geogr. 2024, 167, 103287. [Google Scholar] [CrossRef]
  24. Wang, Z.; Wang, X.; Liu, Y.; Zhu, L. Identification of 71 factors influencing urban vitality and examination of their spatial dependence: A comprehensive validation applying multiple machine-learning models. Sustain. Cities Soc. 2024, 108, 105491. [Google Scholar] [CrossRef]
  25. Wu, J.; Lu, Y.; Gao, H.; Wang, M. Cultivating historical heritage area vitality using urban morphology approach based on big data and machine learning. Comput. Environ. Urban Syst. 2022, 91, 101716. [Google Scholar] [CrossRef]
  26. Chen, W.; Wu, A.N.; Biljecki, F. Classification of urban morphology with deep learning: Application on urban vitality. Comput. Environ. Urban Syst. 2021, 90, 101706. [Google Scholar] [CrossRef]
  27. Zhang, W.; Pan, S.; Li, Z.; Li, Z.; Dong, Z. The nonlinear relationship between air quality and housing prices by machine learning. Environ. Sci. Pollut. Res. 2023, 30, 114375–114390. [Google Scholar] [CrossRef] [PubMed]
  28. Dhumale, R.; Thombare, N.; Bangare, P. Machine learning: A way of dealing with Artificial Intelligence. In Proceedings of the 2019 1st International Conference on Innovations in Information and Communication Technology (ICIICT), Chennai, India, 25–26 April 2019; pp. 1–6. [Google Scholar]
  29. Kim, S.; Lee, S. Nonlinear relationships and interaction effects of an urban environment on crime incidence: Application of urban big data and an interpretable machine learning method. Sustain. Cities Soc. 2023, 91, 104419. [Google Scholar] [CrossRef]
  30. Xia, C.; Zhang, A.Q.; Yeh, A.G.O. The Varying Relationships between Multidimensional Urban Form and Urban Vitality in Chinese Megacities: Insights from a Comparative Analysis. Ann. Am. Assoc. Geogr. 2022, 112, 141–166. [Google Scholar] [CrossRef]
  31. Hipp, J.R.; Lee, S.; Ki, D.; Kim, J.H. Measuring the built environment with Google Street View and machine learning: Consequences for crime on street segments. J. Quant. Criminol. 2021, 38, 537–565. [Google Scholar] [CrossRef]
  32. Doan, Q.C.; Ma, J.; Chen, S.; Zhang, X. Nonlinear and threshold effects of the built environment, road vehicles and air pollution on urban vitality. Landsc. Urban Plan. 2025, 253, 105204. [Google Scholar] [CrossRef]
  33. Gu, X.; Zhu, L.; Liu, X. Examining the impact of urban environment on healthy vitality of outdoor running based on street view imagery and urban big data. J. Geogr. Sci. 2025, 35, 641–663. [Google Scholar] [CrossRef]
  34. Liu, M.; Yang, C.; Fan, Z.; Yuan, C. Prediction approach on pedestrian outdoor activity preference under factors of public open space integrated microclimate. Build. Environ. 2023, 244, 110761. [Google Scholar] [CrossRef]
  35. Nagata, S.; Nakaya, T.; Hanibuchi, T.; Amagasa, S.; Kikuchi, H.; Inoue, S. Objective scoring of streetscape walkability related to leisure walking: Statistical modeling approach with semantic segmentation of Google Street View images. Health Place 2020, 66, 102428. [Google Scholar] [CrossRef]
  36. Dong, G.; Yan, Y.; Shen, C.; Wang, H. Real-time high-performance semantic image segmentation of urban street scenes. IEEE Trans. Intell. Transp. Syst. 2020, 22, 3258–3274. [Google Scholar] [CrossRef]
  37. Wu, C.; Ye, Y.; Gao, F.Z.; Ye, X.Y. Using street view images to examine the association between human perceptions of locale and urban vitality in Shenzhen, China. Sustain. Cities Soc. 2023, 88, 104291. [Google Scholar] [CrossRef]
  38. Ma, Z. Deep exploration of street view features for identifying urban vitality: A case study of Qingdao city. Int. J. Appl. Earth Obs. Geoinf. 2023, 123, 103476. [Google Scholar] [CrossRef]
  39. Chen, M.; Cai, Y.; Guo, S.; Sun, R.; Song, Y.; Shen, X. Evaluating implied urban nature vitality in San Francisco: An interdisciplinary approach combining census data, street view images, and social media analysis. Urban For. Urban Green. 2024, 95, 128289. [Google Scholar] [CrossRef]
  40. Li, Y.; Yabuki, N.; Fukuda, T. Exploring the association between street built environment and street vitality using deep learning methods. Sustain. Cities Soc. 2022, 79, 103656. [Google Scholar] [CrossRef]
  41. Shi, Y.; Tao, T.; Cao, X.; Pei, X. The association between spatial attributes and neighborhood characteristics based on Meituan take-out data: Evidence from shanghai business circles. J. Retail. Consum. Serv. 2021, 58, 102302. [Google Scholar] [CrossRef]
  42. Wang, Q.; Tang, D. Research on intelligent recommendation business model of tourism enterprise value platform from the perspective of value cocreation. Complexity 2021, 2021, 8441844. [Google Scholar] [CrossRef]
  43. Biljecki, F.; Ito, K. Street view imagery in urban analytics and GIS: A review. Landsc. Urban Plan. 2021, 215, 104217. [Google Scholar] [CrossRef]
  44. Cheng, B.; Misra, I.; Schwing, A.G.; Kirillov, A.; Girdhar, R. Masked-attention mask transformer for universal image segmentation. In Proceedings of the IEEE/CVF conference on computer vision and pattern recognition, Denver, CO, USA, 3–7 June 2022; pp. 1290–1299. [Google Scholar]
  45. Lv, G.; Zheng, S.; Hu, W. Exploring the relationship between the built environment and block vitality based on multi-source big data: An analysis in Shenzhen, China. Geomat. Nat. Hazards Risk 2022, 13, 1593–1613. [Google Scholar] [CrossRef]
  46. Dormann, C.F.; Elith, J.; Bacher, S.; Buchmann, C.; Carl, G.; Carré, G.; Marquéz, J.R.G.; Gruber, B.; Lafourcade, B.; Leitão, P.J. Collinearity: A review of methods to deal with it and a simulation study evaluating their performance. Ecography 2013, 36, 27–46. [Google Scholar] [CrossRef]
  47. Uyanık, G.K.; Güler, N. A study on multiple linear regression analysis. Procedia-Soc. Behav. Sci. 2013, 106, 234–240. [Google Scholar] [CrossRef]
  48. Prathanrat, P.; Polprasert, C. Performance prediction of Jupyter notebook in JupyterHub using machine learning. In Proceedings of the 2018 International Conference on Intelligent Informatics and Biomedical Sciences (ICIIBMS), Bangkok, Thailand, 21–24 October 2018; pp. 157–162. [Google Scholar]
  49. Chicco, D.; Warrens, M.J.; Jurman, G. The coefficient of determination R-squared is more informative than SMAPE, MAE, MAPE, MSE and RMSE in regression analysis evaluation. Peerj Comput. Sci. 2021, 7, e623. [Google Scholar] [CrossRef]
  50. Ji, Y.; Wang, Z.; Zhu, D. Exploring the Impact of Urban Amenities on Business Circle Vitality Using Multi-Source Big Data. Land 2024, 13, 1616. [Google Scholar] [CrossRef]
  51. Öner, Ö. Retail city: The relationship between place attractiveness and accessibility to shops. Spat. Econ. Anal. 2017, 12, 72–91. [Google Scholar] [CrossRef]
  52. Loodin, H.; Thufvesson, O. Which architectural style makes an attractive street scape? Aesthetic preferences among city centre managers. J. Urban Des. 2023, 28, 25–43. [Google Scholar] [CrossRef]
  53. Carmona, M. Public Places Urban Spaces: The Dimensions of Urban Design; Routledge: London, UK, 2021. [Google Scholar]
  54. Xiangmin, G.; Weiqiang, C.; Tiantian, L.; Shumeng, H. Research on dynamic visual attraction evaluation method of commercial street based on eye movement perception. J. Asian Archit. Build. Eng. 2022, 21, 1779–1791. [Google Scholar] [CrossRef]
  55. Li, X.; Li, Y.; Jia, T.; Zhou, L.; Hijazi, I.H. The six dimensions of built environment on urban vitality: Fusion evidence from multi-source data. Cities 2022, 121, 103482. [Google Scholar] [CrossRef]
  56. Markvica, K.; Richter, G.; Lenz, G. Impact of urban street lighting on road users’ perception of public space and mobility behavior. Build. Environ. 2019, 154, 32–43. [Google Scholar] [CrossRef]
  57. Tang, X.; Li, X.; Hao, Z. The impact of live background visual complexity on consumer purchase intention: An eye-tracking study. Asia Pac. J. Mark. Logist. 2024, 36, 2539–2557. [Google Scholar] [CrossRef]
  58. Yue, H.; Zhu, X. Exploring the relationship between urban vitality and street centrality based on social network review data in Wuhan, China. Sustainability 2019, 11, 4356. [Google Scholar] [CrossRef]
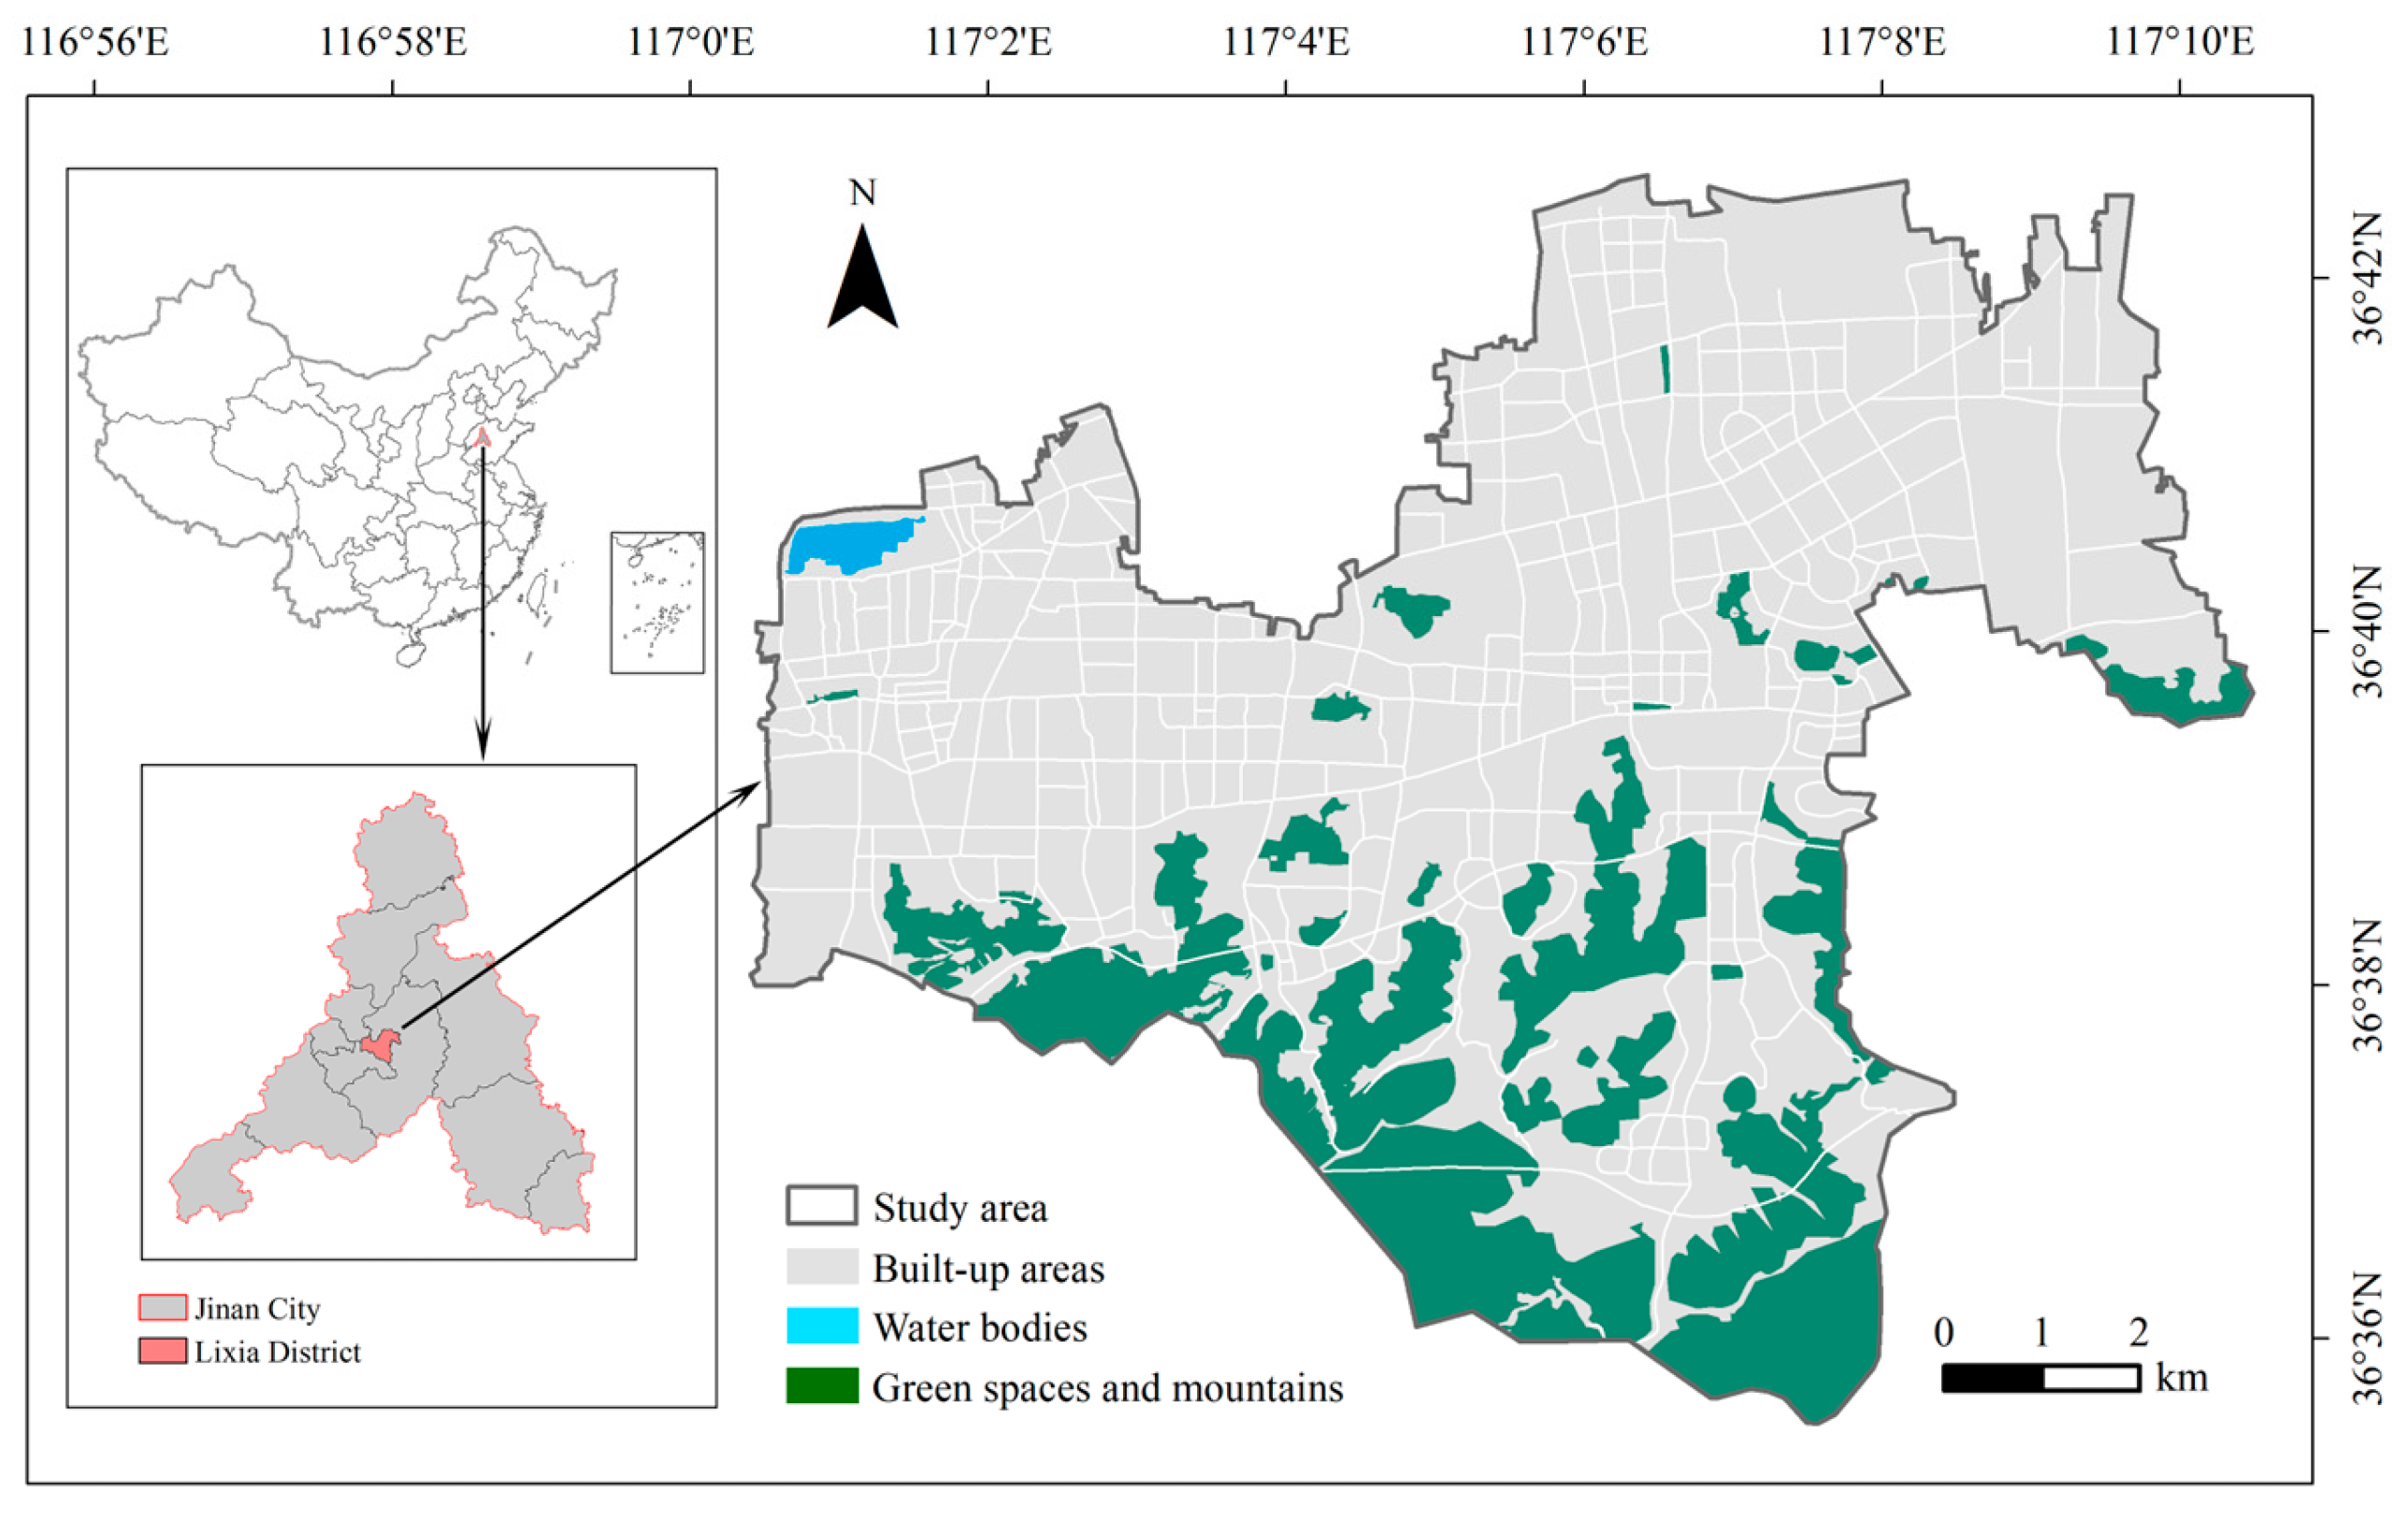
Figure 1. Study area.
Ijgi 14 00422 g001
Figure 2. Street view image (a) and semantic segmentation rendering (b).
Ijgi 14 00422 g002
Figure 3. Distribution of street consumption vitality in Lixia District.
Ijgi 14 00422 g003
Figure 4. Model goodness of fit.
Ijgi 14 00422 g004
Figure 5. Importance of street consumption vitality influencing factors by dimension.
Ijgi 14 00422 g005
Figure 6. Importance ranking of influencing factors on street consumption vitality.
Ijgi 14 00422 g006
Figure 7. The nonlinear relationship between street landscape and consumption vitality in the dimensions of pedestrian space and comfort.
Ijgi 14 00422 g007
Figure 8. The nonlinear relationship between street landscape and consumption vitality in the dimensions of traffic efficiency and mobility.
Ijgi 14 00422 g008
Figure 9. The nonlinear relationship between street landscape and consumption vitality in the dimensions of business and consumption attraction.
Ijgi 14 00422 g009
Figure 10. The nonlinear relationship between street landscape and consumption vitality in the dimensions of environmental esthetics and spatial perception.
Ijgi 14 00422 g010
Figure 11. Bivariate PDP for key streetscape factors.
Ijgi 14 00422 g011
Table 1. Baidu Maps Streetscape API Parameter Settings.
Parameter NameDefault ValueDescriptionSet Value
aknullUser’s access keyObtain personal access key
locationnullCoordinates of the panoramic locationSampling point Baidu coordinates
coordtypebd0911Coordinate system of the panoramic locationBaidu coordinate system bd0911
heading0Horizontal angle, range [0, 360]0, 90, 180, 270
pitch0Vertical angle, range [0, 90]0
fovy90Field of view angle, range [0, 360]90
width400Image width400
height300Image height300
Disclaimer/Publisher’s Note: The statements, opinions and data contained in all publications are solely those of the individual author(s) and contributor(s) and not of MDPI and/or the editor(s). MDPI and/or the editor(s) disclaim responsibility for any injury to people or property resulting from any ideas, methods, instructions or products referred to in the content.