Article

Remote Sensing-Based Spatiotemporal Assessment of Heat Risk in the Guangdong–Hong Kong–Macao Greater Bay Area

1
School of Geography and Planning, Sun Yat-Sen University, Guangzhou 510275, China
2
Carbon-Water Research Station in Karst Regions of Northern, Guangzhou 510275, China
3
College of Surveying and Geo-Informatics, North China University of Water Resources and Electric Power, Zhengzhou 450001, China
*
Author to whom correspondence should be addressed.
ISPRS Int. J. Geo-Inf. 2025, 14(11), 421; https://doi.org/10.3390/ijgi14110421
Submission received: 30 August 2025 / Revised: 16 October 2025 / Accepted: 28 October 2025 / Published: 29 October 2025

Abstract

Under the dual pressures of climate change and rapid urbanization, extreme heat events pose growing risks to densely populated megaregions. The Guangdong–Hong Kong–Macao Greater Bay Area (GBA), a densely populated and economically vital region, serves as a critical hotspot for heat risk aggregation. This study develops a high-resolution multi-dimensional framework to assess the spatiotemporal evolution of its heat risk profile from 2000 to 2020. A Heat Risk Index (HRI) integrating heat hazard and vulnerability components to measure potential heat-related impacts is calculated as the product of the Heat Hazard Index (HHI) and Heat Vulnerability Index (HVI) for 1 km grids in GBA. The HHI integrates the frequency of hot days and hot nights. HVI incorporates population density, GDP, remote-sensing nighttime light data, and MODIS-based landscape indicators (e.g., NDVI, NDWI, and NDBI), with weights determined objectively using the static Entropy Weight Method to ensure spatiotemporal comparability. The findings reveal an escalation of heat risk, expanding at an average rate of 342 km2 per year (p = 0.008), with the proportion of areas classified as high-risk or above increasing from 21.8% in 2000 to 33.3% in 2020. This trend was characterized by (a) a pronounced asymmetric warming pattern, with nighttime temperatures rising more rapidly than daytime temperatures; (b) high vulnerability dominated by the concentration of population and economic assets, as indicated by high EWM-based weights; and (c) isolated high-risk hotspots (Guangzhou and Hong Kong) in 2000, which have expanded into a high-risk belt across the Pearl River Delta’s industrial heartland, like Foshan seeing their high-risk area expand from 3.4% to 27.0%. By combining remote sensing and socioeconomic data, this study provides a transferable framework that moves beyond coarse-scale assessments to identify specific intra-regional risk hotspots. The resulting high-resolution risk maps offer a quantitative foundation for developing spatially explicit climate adaptation strategies in the GBA and other rapidly urbanizing megaregions.

1. Introduction

Extreme heat events have emerged as one of the most significant and pervasive climate risks, driven by the synergistic pressures of global climate change and unprecedented urbanization [1,2]. The Intergovernmental Panel on Climate Change (IPCC) Sixth Assessment Report underscores this trend, noting that the global land surface temperature increased at a rate of 0.32 °C per decade between 1980 and 2020. Additionally, the 2022 provisional State of the Global Climate from the World Meteorological Organization (WMO) reported that the global average temperature in 2022 reached about 1.15 °C above the 1850–1900 pre-industrial baseline [3]. Climatological analyses confirm the escalating threat of thermal extremes, revealing a significant global increase in the annual number of heatwave days, with their average duration also lengthening since the mid-20th century [4]. A multinational study spanning 43 countries estimated that 37% of heat-related deaths are attributable to anthropogenic climate change [5]. In China, the impacts of human activities on extreme heat events have been increasingly recognized and well-documented [6]. Urbanization acts as a potent local amplifier of the background warming signal. The increase in impervious surfaces, anthropogenic heat emissions, and altered urban morphology creates pronounced Urban Heat Island (UHI) effects, which can intensify the severity and duration of heat events far beyond what would be expected from global warming alone. This multiplicative interaction makes dense urban agglomerations uniquely vulnerable to thermal extremes.
The consequences of intensifying urban heat propagate across public health, economic, and ecological domains. In the public health sector, extreme heat acts as a potent mortality and morbidity multiplier, exacerbating cardiovascular and respiratory conditions, with disproportionate impacts on vulnerable cohorts such as the elderly, children, and outdoor laborers [7]. Concurrently, heat stress is shown to impair labor productivity and reduce economic output, particularly in climate-exposed sectors [8]. This places critical infrastructure under duress; notably, energy grids face significant strain from record-high cooling demands [9], increasing the risk of systemic failures during peak heat events. Intensified heat can alter local hydrology by increasing evapotranspiration rates, which may exacerbate water scarcity. Furthermore, heat stress contributes to the degradation of ecosystem services. It impairs vital ecosystem services, such as thermal regulation provided by urban greenery and the maintenance of local biodiversity, placing additional stress on fragmented urban habitats [10].
Recent reviews have documented the rapid growth of research on urban heat islands and heat waves, with a particular focus on the challenges faced by large urban agglomerations [1]. The perceived heat risk at the community level is also affected by social factors like pre-existing health conditions and household registration status [11]. Ref. [12] advanced our understanding of the physical hazard by demonstrating that urbanization can amplify humid heat stress in wet climates, a critical consideration for subtropical regions like the Guangdong–Hong Kong–Macao Greater Bay Area (GBA). Global projections indicate that by mid-century, extreme heat exposure will intensify in thousands of cities, underscoring the need for effective mitigation and adaptation strategies [13]. Nature-Based Solutions (NBS), such as urban greening and blue infrastructure (e.g., street trees, urban parks, wetlands, green roofs, and water bodies), have emerged as key strategies for reducing urban heat and enhancing resilience [14,15]. These approaches not only lower surface and air temperatures, but also provide co-benefits for public health and urban sustainability [15]. By situating GBA within this international context, this study not only addresses a critical regional challenge, but also contributes to the global discourse on urban climate adaptation strategies.
The GBA represents a critical case study for understanding and managing heat risk in a rapidly developing mega-urban region. As one of China’s most economically dynamic and densely populated areas, the GBA is situated in a subtropical monsoon climate zone, and is experiencing warming trends that are more rapid than in other areas in South China [16,17]. This climatic shift is occurring against a backdrop of intense urbanization and economic agglomeration. The GBA is considered a “hotspot for thermal risk aggregation,” where high population density, a large contingent of outdoor laborers, and pronounced urban heat island effects converge to create a high-risk environment [18,19,20,21]. The practical implications are profound, necessitating robust scientific support for policy-making. While foundational studies have provided crucial insights at regional scales (e.g., 0.25° × 0.25°) [17,22,23,24], their broader resolutions are not always sufficient to capture the detailed intra-urban variations critical for local planning. This study builds upon that work by employing a high-resolution framework to reveal neighborhood-level risk patterns. Such granular assessments are essential for identifying specific vulnerabilities, optimizing industrial and land use planning to mitigate heat exposure, and refining public health warning systems to protect the region’s most susceptible communities.
Our study addresses this gap by developing and applying a new framework to map the spatiotemporal dynamics of heat risk across the entire GBA megaregion at a 1 km resolution from 2000 to 2020. This approach offers several contributions. First, it moves beyond single-city or static analyses to provide a holistic, two-decade view of risk evolution. Second, it constructs a multi-dimensional vulnerability index that integrates socio-economic exposure (population and GDP) with land surface sensitivity, captured through a suite of remote sensing indices (NDVI, NDBI, and NDWI). Third, it introduces a robust method for long-term comparative analysis: a static Entropy Weight Method (EWM). The primary objectives of this research are therefore: (a) to construct an integrated heat risk model that couples meteorological hazards with a multi-dimensional socio-ecological vulnerability index, incorporating remote sensing indicators and weighted objectively using EWM-based approach; (b) to analyze the spatiotemporal evolution of heat risk across the GBA at a high spatial resolution over two decades; and (c) to identify the resulting high-risk hotspots and their primary drivers to provide a quantitative foundation for spatially explicit climate adaptation strategies. By taking the GBA as a case study, this research provides a transferable framework and actionable insights for building climate resilience in other complex urban systems worldwide.

2. Materials and Methods

2.1. Study Area

The GBA is a national strategic urban agglomeration on the subtropical coast of Southern China. Spanning approximately 56,000 km2 between 111°20′–115°24′ E and 21°32′–24°26′ N [25]. The GBA comprises nine cities in the Pearl River Delta (Guangzhou, Shenzhen, Zhuhai, Foshan, Huizhou, Dongguan, Zhongshan, Jiangmen, and Zhaoqing) and the two Special Administrative Regions of Hong Kong and Macao (Figure 1). As one of the world’s most densely populated and economically dynamic regions, the GBA’s total population exceeded 86 million, and its Gross Domestic Product (GDP) was RMB 11.4 trillion in 2020, approximately 11.5% of China’s total GDP (https://www.gov.cn/, accessed on 1 February 2025). The region’s climate is dominated by the subtropical monsoon, characterized by hot, humid summers. The topography is primarily composed of the Pearl River Delta plain, with a dense river network. However, two decades of rapid urbanization have led to an expansion of impervious surfaces. The period under investigation, 2000–2020, corresponds to the GBA‘s rapid urban expansion, which has active urban heat island effects [19]. This combination of a hot, humid climate, high population density, and rapid landscape modification makes the GBA a prime case study for geospatial risk assessment and a critical region for environmental and climatic research.

2.2. Data Sources and Processing

This study integrates diverse geospatial and remote-sensing datasets to construct the heat risk assessment framework. Each dataset was selected for its specific contribution to characterizing the components of hazard, vulnerability, and sensitivity. The data sources and their key specifications are summarized in Table 1.
Meteorological data are used to identify heat hazards. Gridded daily data for maximum and minimum temperature from 2000 to 2020, with a spatial resolution of 4 km, were obtained from a dataset developed by Zhang et al. [26]. This dataset was generated by interpolating observations from 699 meteorological stations across China using a combination of thin plate spline and random forest algorithms, incorporating covariates such as geography, topography, and reanalysis data to enhance accuracy. Since high-resolution (1 km) daily temperature datasets are rarely available, the 4 km data were bilinearly downscaled to 1 km in this study. To validate this gridded product for the GBA, daily observational data from 7 in situ meteorological stations within the study area were acquired from the National Meteorological Science Data Center. To ensure the reliability of the foundational meteorological inputs, the gridded temperature dataset was evaluated against daily observations from ground-based meteorological stations within the GBA. This evaluation helps us to understand the potential biases in the input data and to interpret the risk assessment results. The accuracy of the gridded data was assessed using two statistical metrics, i.e., the coefficient of determination (R2) and Mean Bias Error (MBE). R2 measures the proportion of the variance in the observed data that is predictable from the gridded data, and MBE indicates the direction of the systematic error (i.e., overestimation or underestimation).
Socio-economic data were used to quantify exposure and vulnerability. For population distribution, we used the LandScan Global Population dataset, which provides annual estimates of ambient population at a 1 km resolution [27]. This dynamic dataset is generated by the Oak Ridge National Laboratory (ORNL) through spatial interpolation of census data, refined with inputs on land use, transportation networks, and topography. City-level Gross Domestic Product (GDP) data were compiled from the annual statistical yearbooks of Guangdong, Hong Kong, and Macao. To disaggregate these administrative-level economic data into a gridded format, global annual nighttime light data (1 km resolution) were obtained from [28]. These datasets serve as a proxy for the intensity of economic activity.
MODIS-based data were also collected to characterize land covers, which influence thermal conditions. The Normalized Difference Vegetation Index (NDVI), a robust indicator of vegetation health and coverage [30], was derived from the MODIS Terra MOD13A3 monthly product, which provides data at a 1 km spatial resolution [29]. Normalized Difference Built-up Index (NDBI) and Normalized Difference Water Index (NDWI) at 500 m resolution are calculated using MODIS surface reflectance. All datasets were re-projected to a common coordinate system and bilinearly resampled to a 1 km grid to facilitate spatial analysis and integration within the modeling framework.

2.3. Multi-Dimensional Assessment of Heat Risk

To determine a region’s susceptibility to extreme heat, this study constructs a risk assessment framework based on hazard, exposure, and vulnerability. This approach posits that overall heat risk emerges from the multiplicative effect of a meteorological hazard and the socio-ecological susceptibility of the exposed system. This relationship is critical, as a moderate hazard impacting a highly vulnerable area can yield more severe consequences than a hazard in a resilient one. The Heat Hazard Index is spatially synthesized from the number of hot days (SU35, daily maximum) and hot nights (TR25, daily minimum) to characterize the intensity and duration of extreme heat events [17,31,32,33]. The socio-ecological vulnerability index integrates population density to represent human exposure [34], GDP density to measure economic sensitivity, and the MODIS-based data represents the land covers related to heat stress [35,36,37,38,39]. By integrating multi-source heterogeneous data, the model produces high-resolution risk maps intended to provide a quantitative foundation for resilient urban planning, informing policy adjustments in industrial layout, green infrastructure, and public health interventions within the GBA.

2.3.1. Heat Hazard Index

The Heat Hazard Index (HHI, Equation (1)) is formulated to represent the physical characteristics of extreme heat events, incorporating both daytime and nighttime heat hazards. It is calculated as a weighted composite of two core meteorological indicators: SU35 (the number of hot days with a daily maximum temperature ≥35 °C) and TR25 (the number of hot nights with a daily minimum temperature ≥25 °C) [40].
HHI = w SU 35 × N SU 35 + w TR 25 × N TR 25
where the heat hazard index HHI ranges from 0 to 1; N SU 35 and N TR 25 are the corresponding normalized hazard components, and w denotes the weight assigned to each component (SU35 or TR25). For this study, equal weights were applied ( w SU 35 = w TR 25 = 0.5, as suggested by previous studies [17,40,41]) assuming comparable importance of daytime peak heat and sustained nighttime heat stress for public health. However, in future research, these weights could be refined based on empirical evidence from health impact studies to better represent the differential effects of daytime and nighttime heat exposure.
To ensure comparability across indicators, their values are normalized to a scale of 0 to 1 using the following min-max normalization equations (Equations (2) and (3)):
N SU 35 = SU 35 SU 35 m i n SU 35 m a x SU 35 m i n
N TR 25 = TR 25 TR 25 m i n TR 25 m a x TR 25 m i n
where SU35min (SU35max) and TR25min (TR25max) are the minimum (maximum) values of SU35 and TR25, respectively, observed across the study period.

2.3.2. Heat Vulnerability Index

The Heat Vulnerability Index (HVI) is a composite indicator designed to quantify the exposure and sensitivity of the socio-ecological system to heat hazards [42]. It integrates three key aspects: Population Density (POP), economic density, and sensitivity, which are derived from land cover characteristics. The exposure components, population, and economic density quantify the concentration of people and economic activity in areas susceptible to heat. The sensitivity component reflects how different land cover types respond to and influence thermal conditions [42].
Indicators Used in HVI Assessment
To derive gridded GDP data for the GBA, a key step is to spatialize city-level GDP data to a 1 km grid. This downscaling approach is based on the correlation between the intensity of human activity and economic output. Nighttime light (NTL) intensity serves as a proxy for the concentration of industrial, commercial, and residential infrastructure, while population density represents the distribution of labor and consumption. Equation (4) allocates the city-level total GDP proportionally based on each pixel’s composite value relative to the city’s total composite value [43,44]. This method allows for a more granular representation of economic exposure, which is critical for high-resolution vulnerability assessment (Equation (4)).
GDP pixel = GDP total SLP × DN
where GDP pixel is the estimated GDP for a given pixel, GDP total is the total GDP of the administrative city, DN is the pixel’s light-population value (i.e., nighttime light DN value × population density), and SLP is the sum of all DN values within the city. Note that population and GDP are treated as positive indicators in the vulnerability assessment, meaning that higher values tend to increase the Heat Vulnerability Index (HVI).
To represent sensitivity, we propose to use three well-established spectral indices derived from remote sensing data: the Normalized Difference Vegetation Index (NDVI), the Normalized Difference Built-up Index (NDBI), and the Normalized Difference Water Index (NDWI).
The NDVI is a widely used metric for quantifying the density and health of green vegetation. It is calculated as a ratio between the near-infrared (NIR) and red (Red) spectral bands (Equation (5)):
NDVI = N I R R e d N I R + R e d
NDVI values range from −1 to +1, where higher positive values indicate denser and healthier vegetation. Because vegetation provides significant cooling effects through evapotranspiration and shading, NDVI is strongly negatively correlated with Land Surface Temperature (LST) [45], and is therefore considered a negative indicator in the heat vulnerability assessment. Higher NDVI values indicate lower heat vulnerability.
The NDBI (Equation (6)) proposed by [46] is used to map urban built-up areas. It leverages the unique spectral response of man-made structures, which have higher reflectance in the short-wave infrared (SWIR) region compared to the NIR region.
N D B I = S W I R N I R S W I R + N I R
Built-up surfaces absorb and retain more solar radiation, contributing to the urban heat island effect. Consequently, NDBI shows a positive correlation with land surface temperature and is regarded as a positive indicator in the heat vulnerability assessment, as higher NDBI values are associated with increased heat vulnerability.
The NDWI is used to map water bodies, such as lakes and rivers, by using the SWIR and Green band from remote sensing data (Equation (7)), which effectively suppresses noise from built-up land and soil:
N D W I = G r e e n S W I R G r e e n + S W I R
Water bodies provide a significant cooling effect on their surrounding environment. Therefore, the NDWI has a negative correlation with LST and is regarded as a negative indicator in the heat vulnerability assessment.
Static Weighting Within the Entropy Weight Method
HVI is the weighted sum of the normalized values of POP, GDP, NDVI, NDBI, and NDWI (Equation (8)). To objectively determine the weights of the vulnerability indicators and avoid the subjectivity of expert-based methods, this study employs the Entropy Weight Method (EWM). In comparison to other subjective weighting methods, such as expert-grading-based weights [17,31,40], the core principle of EWM is that an indicator’s weight is determined by its inherent variability; indicators with greater dispersion (lower information entropy) provide more information and are thus assigned a larger weight in the composite index [47].
H V I = W P O P N P O P + W G D P N G D P + W N D V I N N D V I + W N D B I N N D B I + W N D W I N N D W I
where Wi represents the weight of each indicator (e.g., POP) and Ni represents its normalized value.
Given that this study analyzes data from 2000 to 2020, a static weighting approach was proposed to ensure consistent and comparable results across all years. This method assumes that the relative importance of each indicator remains stable over the entire study period, thereby facilitating large-scale and long-term spatiotemporal analyses. The specific calculation steps are as follows:
First, we aligned all raster data for the five indicators (POP, GDP, NDVI, NDBI, NDWI) from all 21 years (2000–2020) to common m×n pixels (grid cells) at 1 km resolution. The data were stacked into a single matrix. If each year contains m × n pixels, the final matrix has a dimension of (21 × m × n) rows and five columns, where the total number of samples for each indicator is S = 21 × m × n. The EWM was applied once to this entire spatiotemporal data matrix. This process yields a single, fixed set of weights. This static set of weights is then used to calculate the HVI for each year, ensuring that any observed changes in vulnerability are due to variations in the indicator values themselves, not fluctuations in their assigned importance.
Let x i j represent the raw value of the i-th indicator for the j-th sample (where j ranges from 1 to S). The data is normalized to a 0–1 scale to eliminate dimensional differences. For positive indicators (where higher values increase vulnerability, i.e., POP, GDP, and NDBI, Equation (9)):
Y ij = x i j min ( x i ) max ( x i ) min ( x i )
For negative indicators (where higher values decrease vulnerability, i.e., NDVI and NDWI, Equations (10)):
Y ij = max ( x i ) x i j max ( x i ) min ( x i )
where max   ( x i ) and m in   ( x i ) are the maximum and minimum values of the i-th indicator across all samples.
The proportion (Pij, Equation (11)) is computed:
P i j = Y i j j = 1 S   Y i j
The information entropy (Ei, Equation (12)) for the i-th indicator is calculated:
E i = k j = 1 S   P i j l n ( P i j )
where k = 1/ln(S). The degree of redundancy or divergence (Di, Equation (13)) for each indicator is calculated from its entropy:
D i = 1 E i
The weight for each indicator (Wi, Equation (14)) is the ratio of its divergence to the sum of all divergences:
W i = D i i = 1 5   D i
With the weights W i determined by static weighting using the EWM, the HVI for each pixel over the study period can be calculated by Equation (8).

2.3.3. Integrated Heat Risk Index

The final Heat Risk Index (HRI) integrates the hazard and vulnerability components to provide a measure of potential heat-related impacts. It is calculated as the product of the HHI and the HVI (Equation (15)), a formulation that captures the critical interaction between the physical event and the system’s susceptibility. The model posits that the overall heat risk is not merely the presence of a hazard, but the product of that hazard’s interaction with the underlying vulnerability of the exposed system. For example, a medium hazard in a highly vulnerable area can produce a more severe outcome than an extremely high hazard in a resilient area.
HRI = HHI × HVI
This approach ensures that the highest risk values are assigned to areas where high hazard and high vulnerability co-occur, reflecting the real-world amplification of risk in such locations [17,31,40].
For the assessments in this study, the HHI, HVI, and overall HVI indices, which were scaled from 0 to 1, were categorized into five distinct levels using the natural breaks classification method [48]: extremely low (Level I), low (Level II), medium (Level III), high (Level IV), and extremely high (Level V).

3. Results

3.1. Spatiotemporal Patterns of Heat Hazard in GBA

We first evaluated the gridded meteorological dataset against ground station observations, revealing a general agreement in overall trends (Figure 2). The gridded data for both SU35 and TR25 were found to be consistent with the temporal patterns recorded at the stations, indicating their suitability for regional-scale trend analysis. The MBE for SU35 was −6.09 days (Figure 2h), meaning that the gridded dataset underestimated the hot days compared to ground observations. The MBE for TR25 was a more modest −2.69 days. The model’s R2 was higher for TR25 (R2 = 0.758) than for SU35 (R2 = 0.622). This suggests that the gridded dataset captures the variability of nighttime heat stress more effectively than that of daytime peak heat. This systematic underestimation of the primary hazard inputs, which may result from the spatial interpolation methods like thin plate spline and random forest that smooth local peaks to fit a generalized pattern [26], implies that the subsequent calculations of heat hazard and heat risk are likely to be conservative. The actual heat risk experienced at specific, localized hotspots within the GBA may be higher than what this regional-scale analysis indicates. This frames the study’s findings as a lower-bound estimate of the true risk, lending additional urgency to the need for proactive mitigation and adaptation measures.
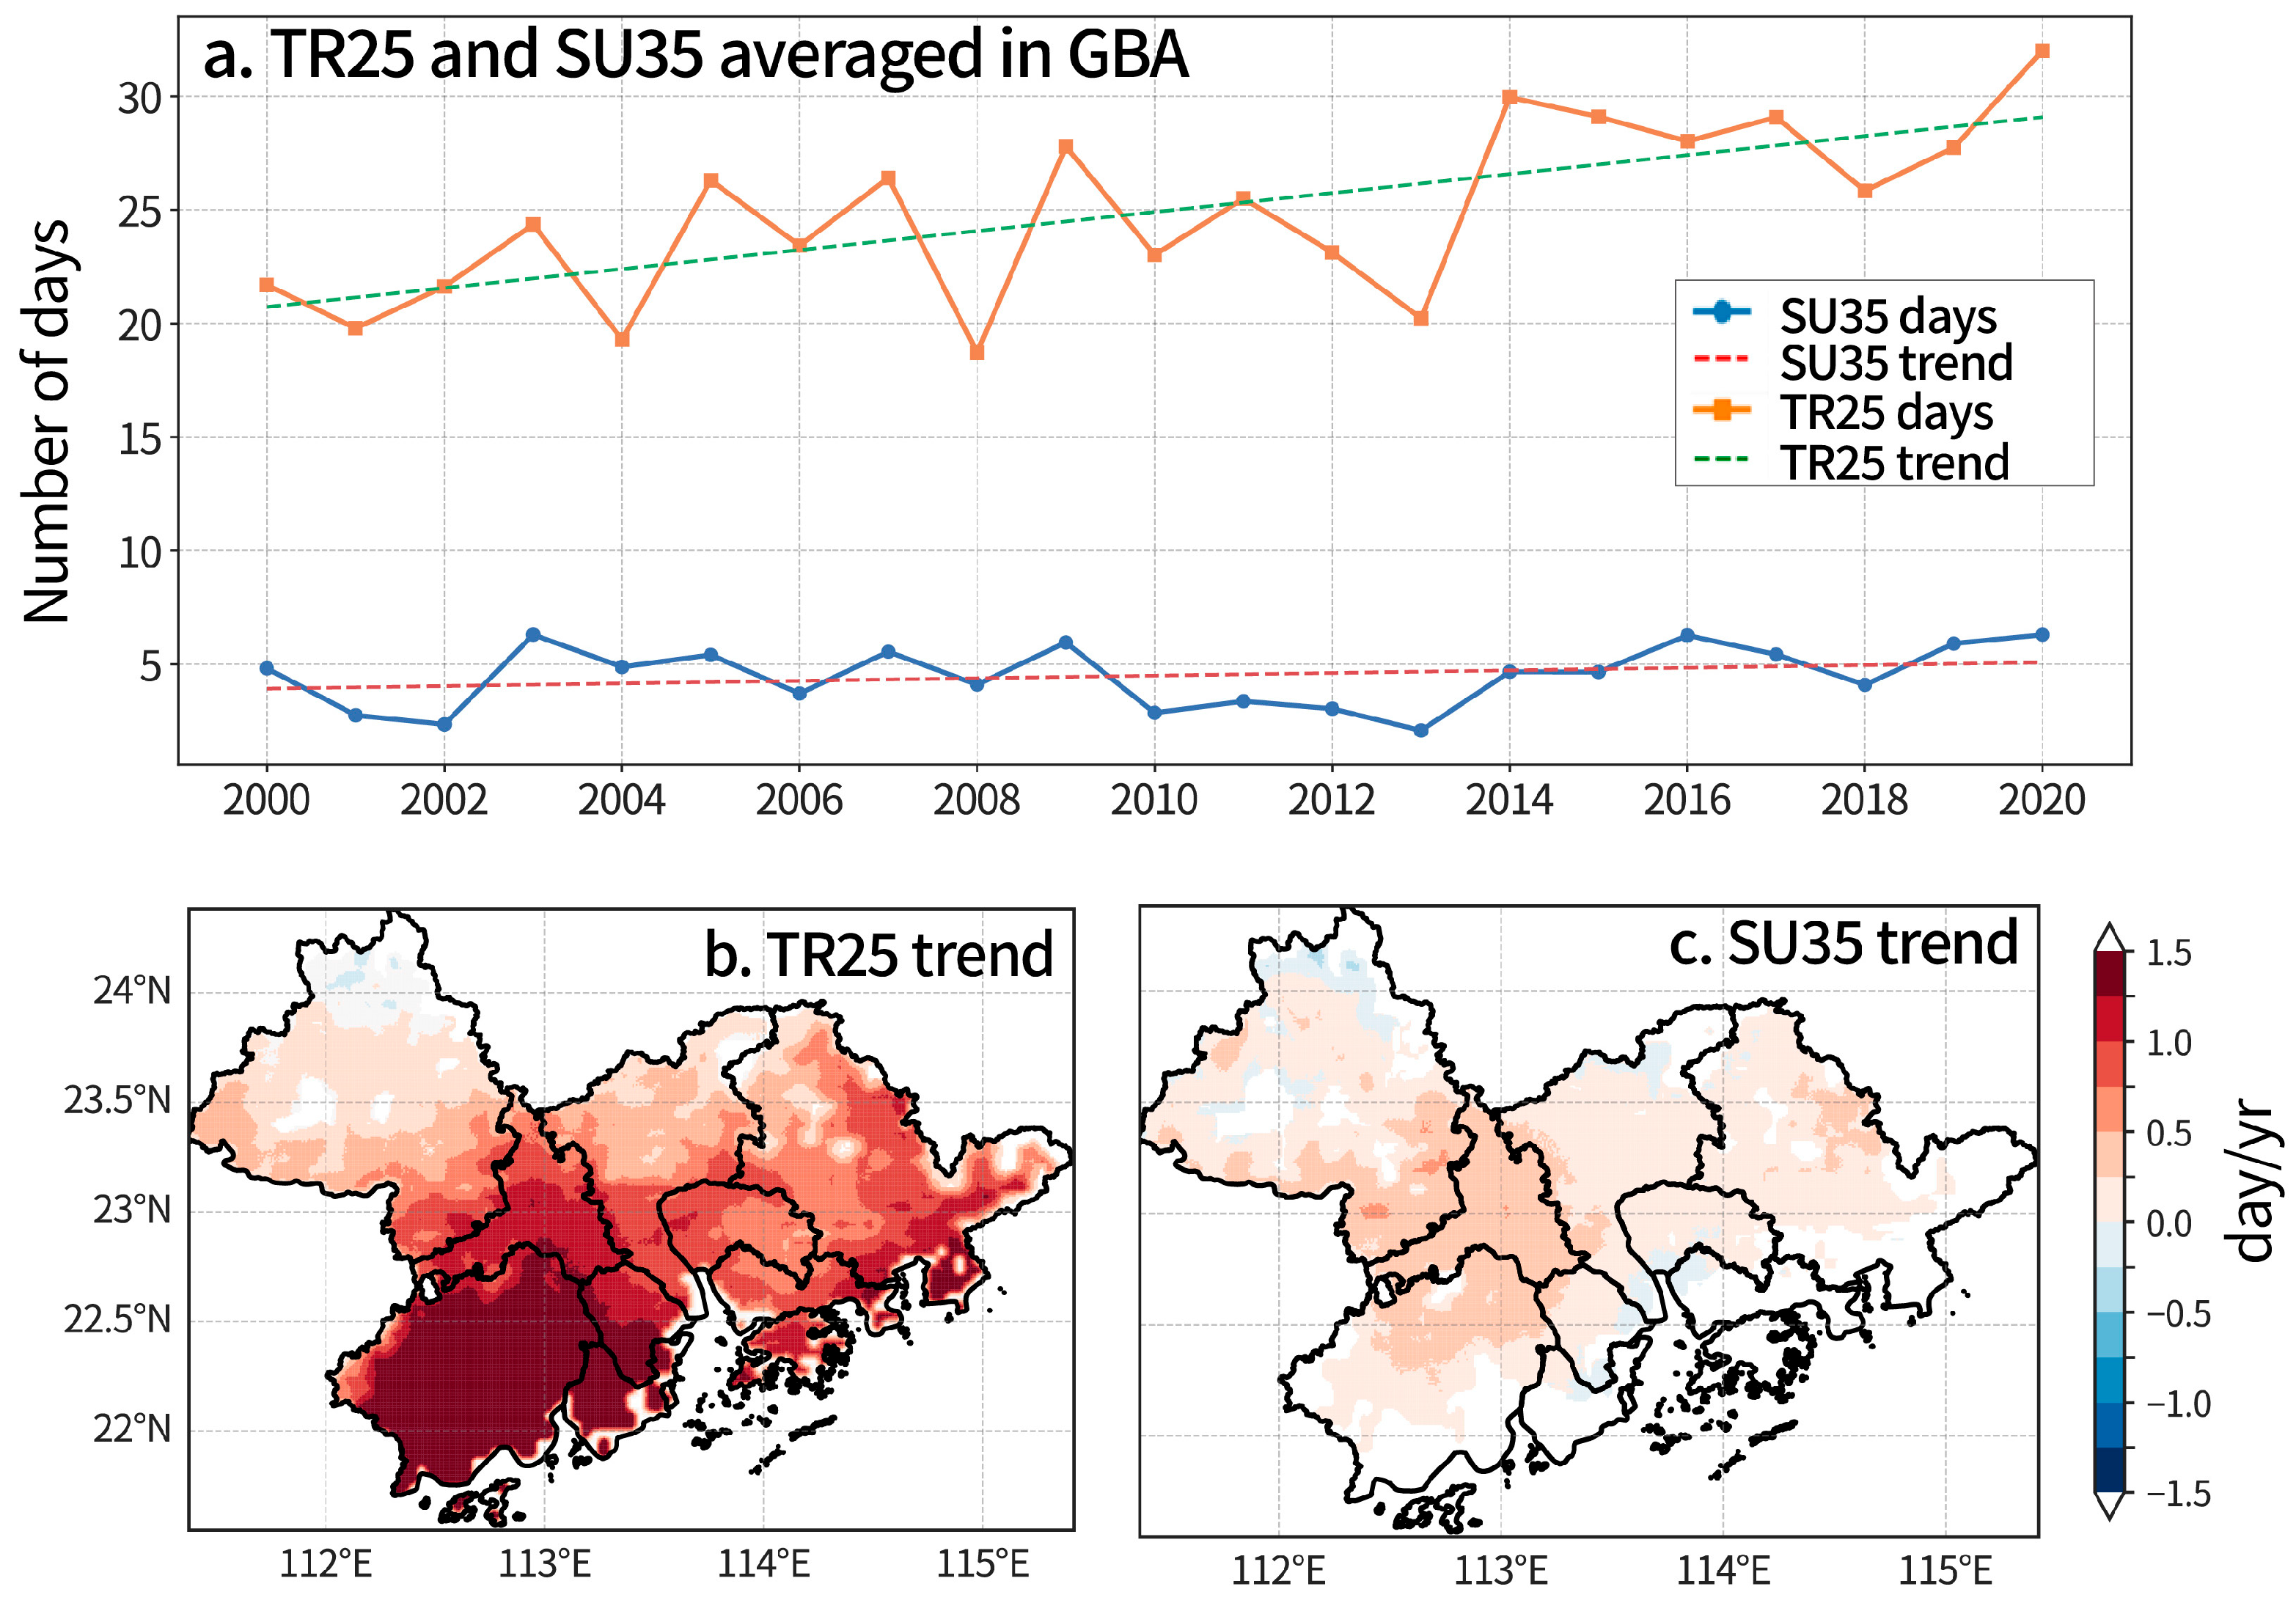
Over the 2000–2020 study period, the GBA exhibited the trend of climatic warming, though this trend was markedly asymmetric between daytime and nighttime heat indicators. The annual mean of hot nights (TR25) was 24.9 days and showed a pronounced upward trend (p value = 0.0007), whereas the mean for hot days (SU35) was 4.5 days and increased only slightly (Figure 3a).
Spatially, the increase in TR25 was most pronounced in the southern coastal municipalities, including Jiangmen, southern Zhongshan, and Huizhou (Figure 3b). This pattern may be attributed to oceanic thermal inertia; the high specific heat capacity of seawater leads to a delayed release of stored heat, elevating nighttime minimum temperatures. Furthermore, the relatively low increase in SU35 (Figure 3c) is likely influenced by both this maritime moderation of peak temperatures and significant intra-urban mitigating factors. The GBA’s green spaces and water bodies appear to partially counteract the effects of regional warming on extreme daytime heat.
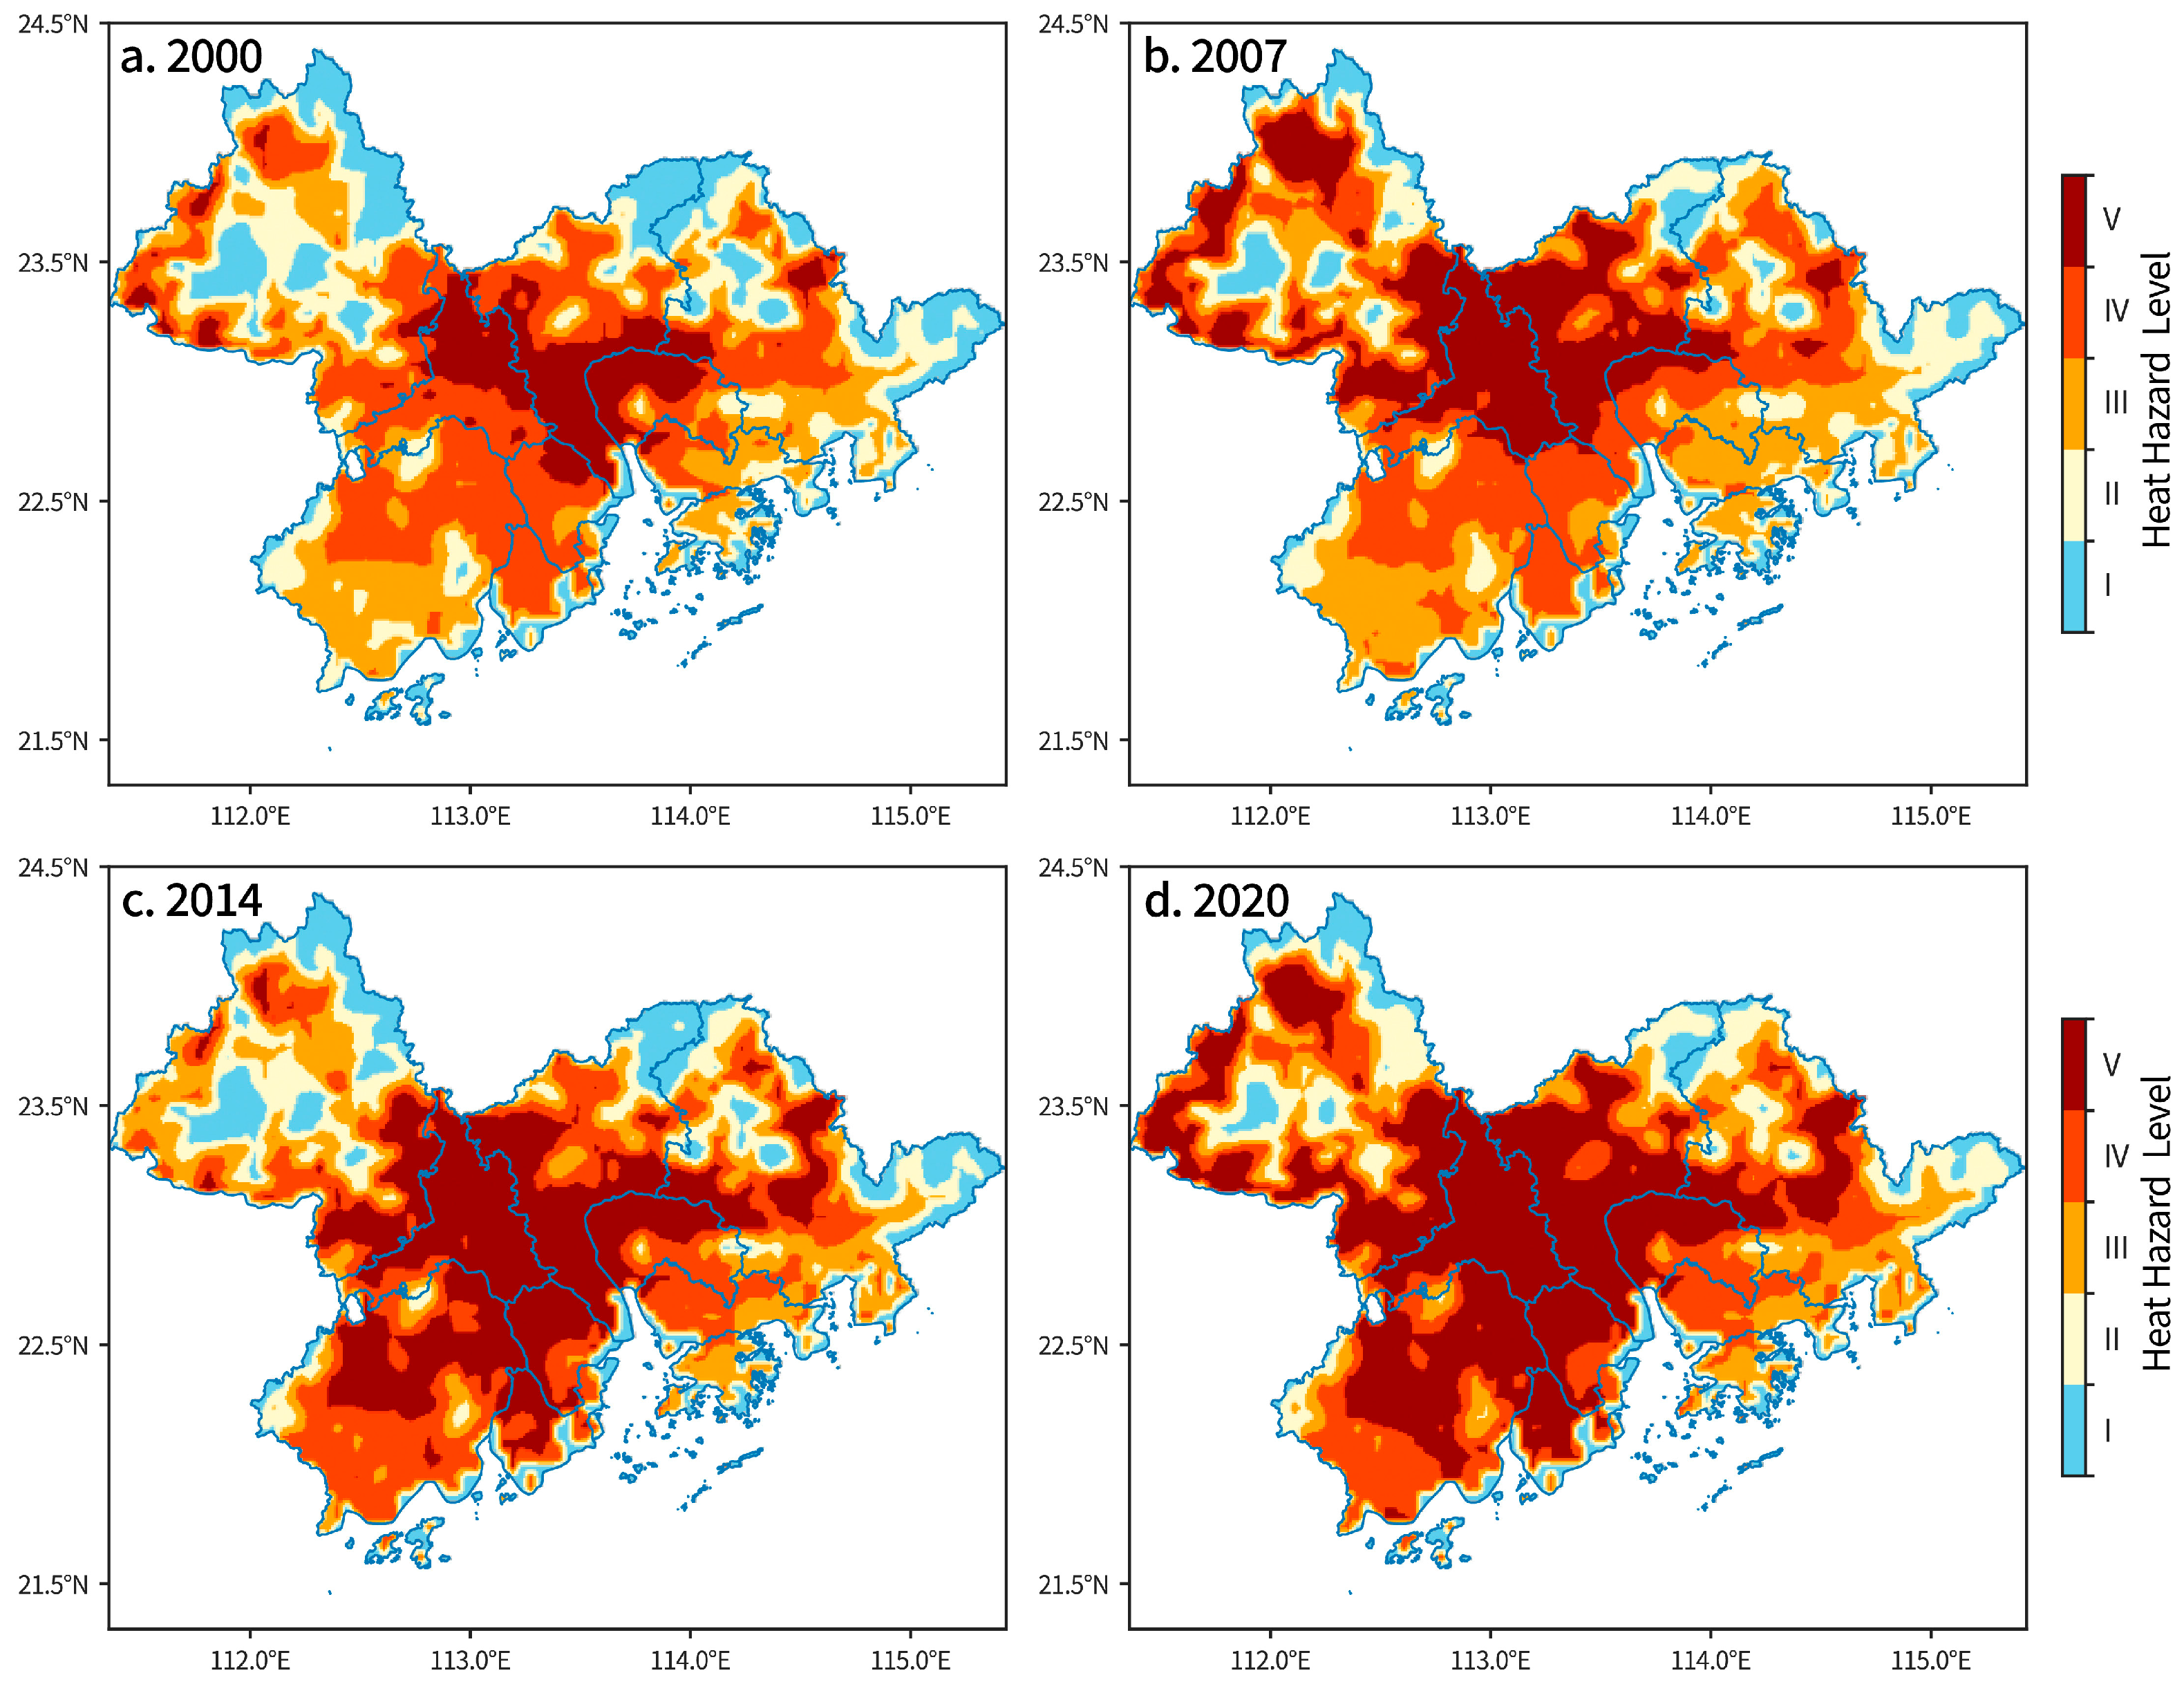
In terms of heat hazard level, the HHI exhibited changes between 2000 and 2020 (Figure 4). In 2000, the hazard landscape was dominated by extremely low to medium levels (Levels I-III), with high-hazard areas (Level IV) confined to relatively small, distinct pockets over the core urban districts of Guangzhou and Foshan. By 2020, the hazard profile of the GBA had transformed entirely. The previously isolated high-hazard pockets coalesced and expanded into a large, contiguous high-hazard belt stretching across the region’s industrial heartland, particularly encompassing Foshan, Dongguan, and Zhongshan. The concentration of the highest risk levels in the industrial heartlands (e.g., Foshan and Dongguan) is spatially associated with land use characterized by extensive manufacturing facilities and high impervious surface cover. This pattern aligns with the expected influence of localized Urban Heat Island effects.
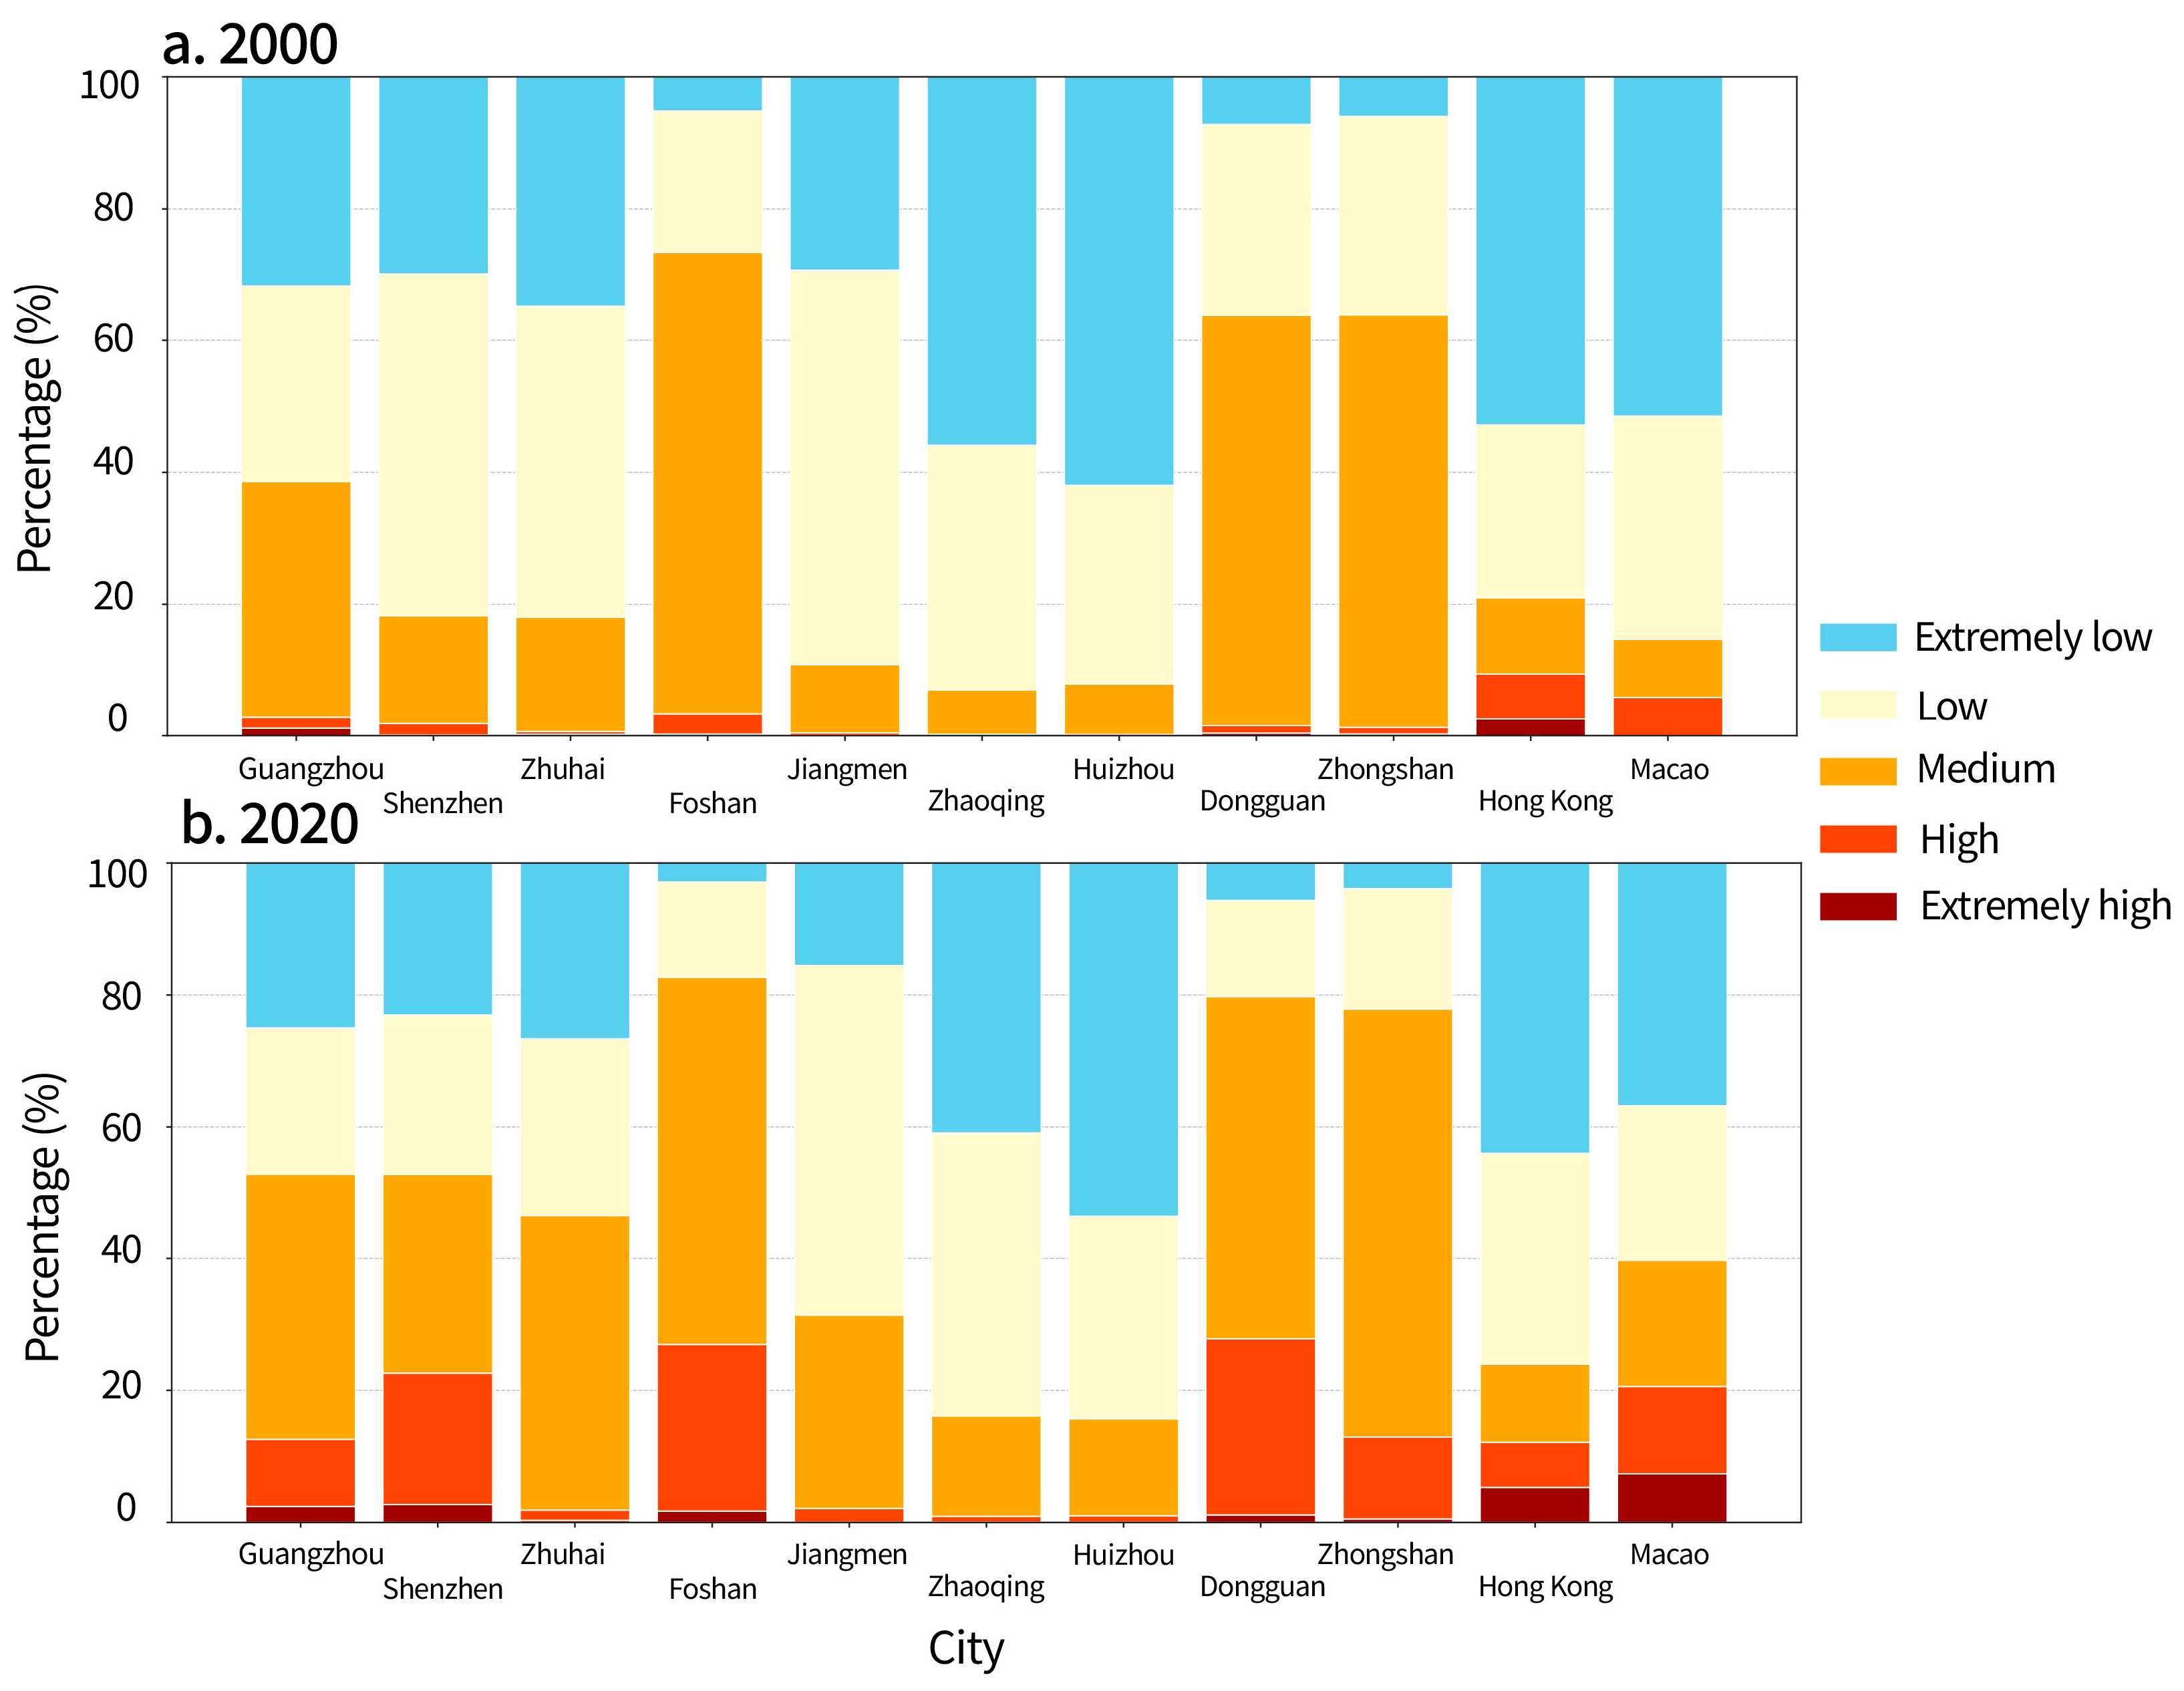
A city-level comparative assessment (Figure 5) demonstrates a marked intensification of heat hazard conditions across the GBA from 2000 to 2020. The most prominent change is the clear emergence and rapid expansion of the “Extremely high” hazard level, which by 2020 constituted a substantial portion of the hazard classification in major economic centers such as Foshan, Dongguan, and Zhongshan. For example, in Guangzhou, the proportion of “Extremely high” (Level V) hazard areas rose dramatically from 30.9% in 2000 to 57.4% in 2020. Similarly, Foshan experienced an even more striking increase in this category, from 46.5% to 90.8%. In Dongguan, the “Extremely high” category expanded from 49.7% to 57.7%, and in Zhongshan it increased from 21.26% to 69.9%. Notably, this shift occurred alongside a reduction in the prevalence of “Low” and “Medium” hazard categories, signifying a broad intensification of extreme heat risk throughout the region’s urban core.

3.2. Characterizing Heat Vulnerability Across the GBA

The objective weights for the five vulnerability indicators were determined using the Entropy Weight Method (EWM) across the entire 2000–2020 data. The results (Table 2) reveal the relative importance of each indicator in shaping the overall heat vulnerability of the GBA. The weight analysis reveals that socio-economic factors overwhelmingly drive heat vulnerability patterns in the GBA. GDP (weight = 0.664) and population (weight = 0.313) together account for approximately 97.7% of the total influence. The high weight of GDP is a result of its low information entropy (0.708), which signifies strong spatial variability across the region. This reflects the intense concentration of economic output in specific urban cores, particularly the high GDP densities found in Hong Kong and Macao, creating a highly uneven economic landscape that dominates the vulnerability assessment. In contrast, the landcover-based sensitivity indicators (NDBI, NDVI, and NDWI) received substantially lower weights due to their high entropy values (all > 0.99), indicating more uniform spatial patterns relative to the dramatic variations in population and GDP. Among these, NDVI (weight = 0.017) emerged as the most significant sensitivity factor, with relative importance more than five times that of NDBI (0.003) and NDWI (0.003). This suggests that while vegetation’s role is secondary to socio-economic exposure, variations in green cover are the most influential land surface characteristic modulating vulnerability at this regional scale. The analysis highlights that the overall regional variability of the HVI is mainly determined by the uneven distribution of where people and economic assets are concentrated.
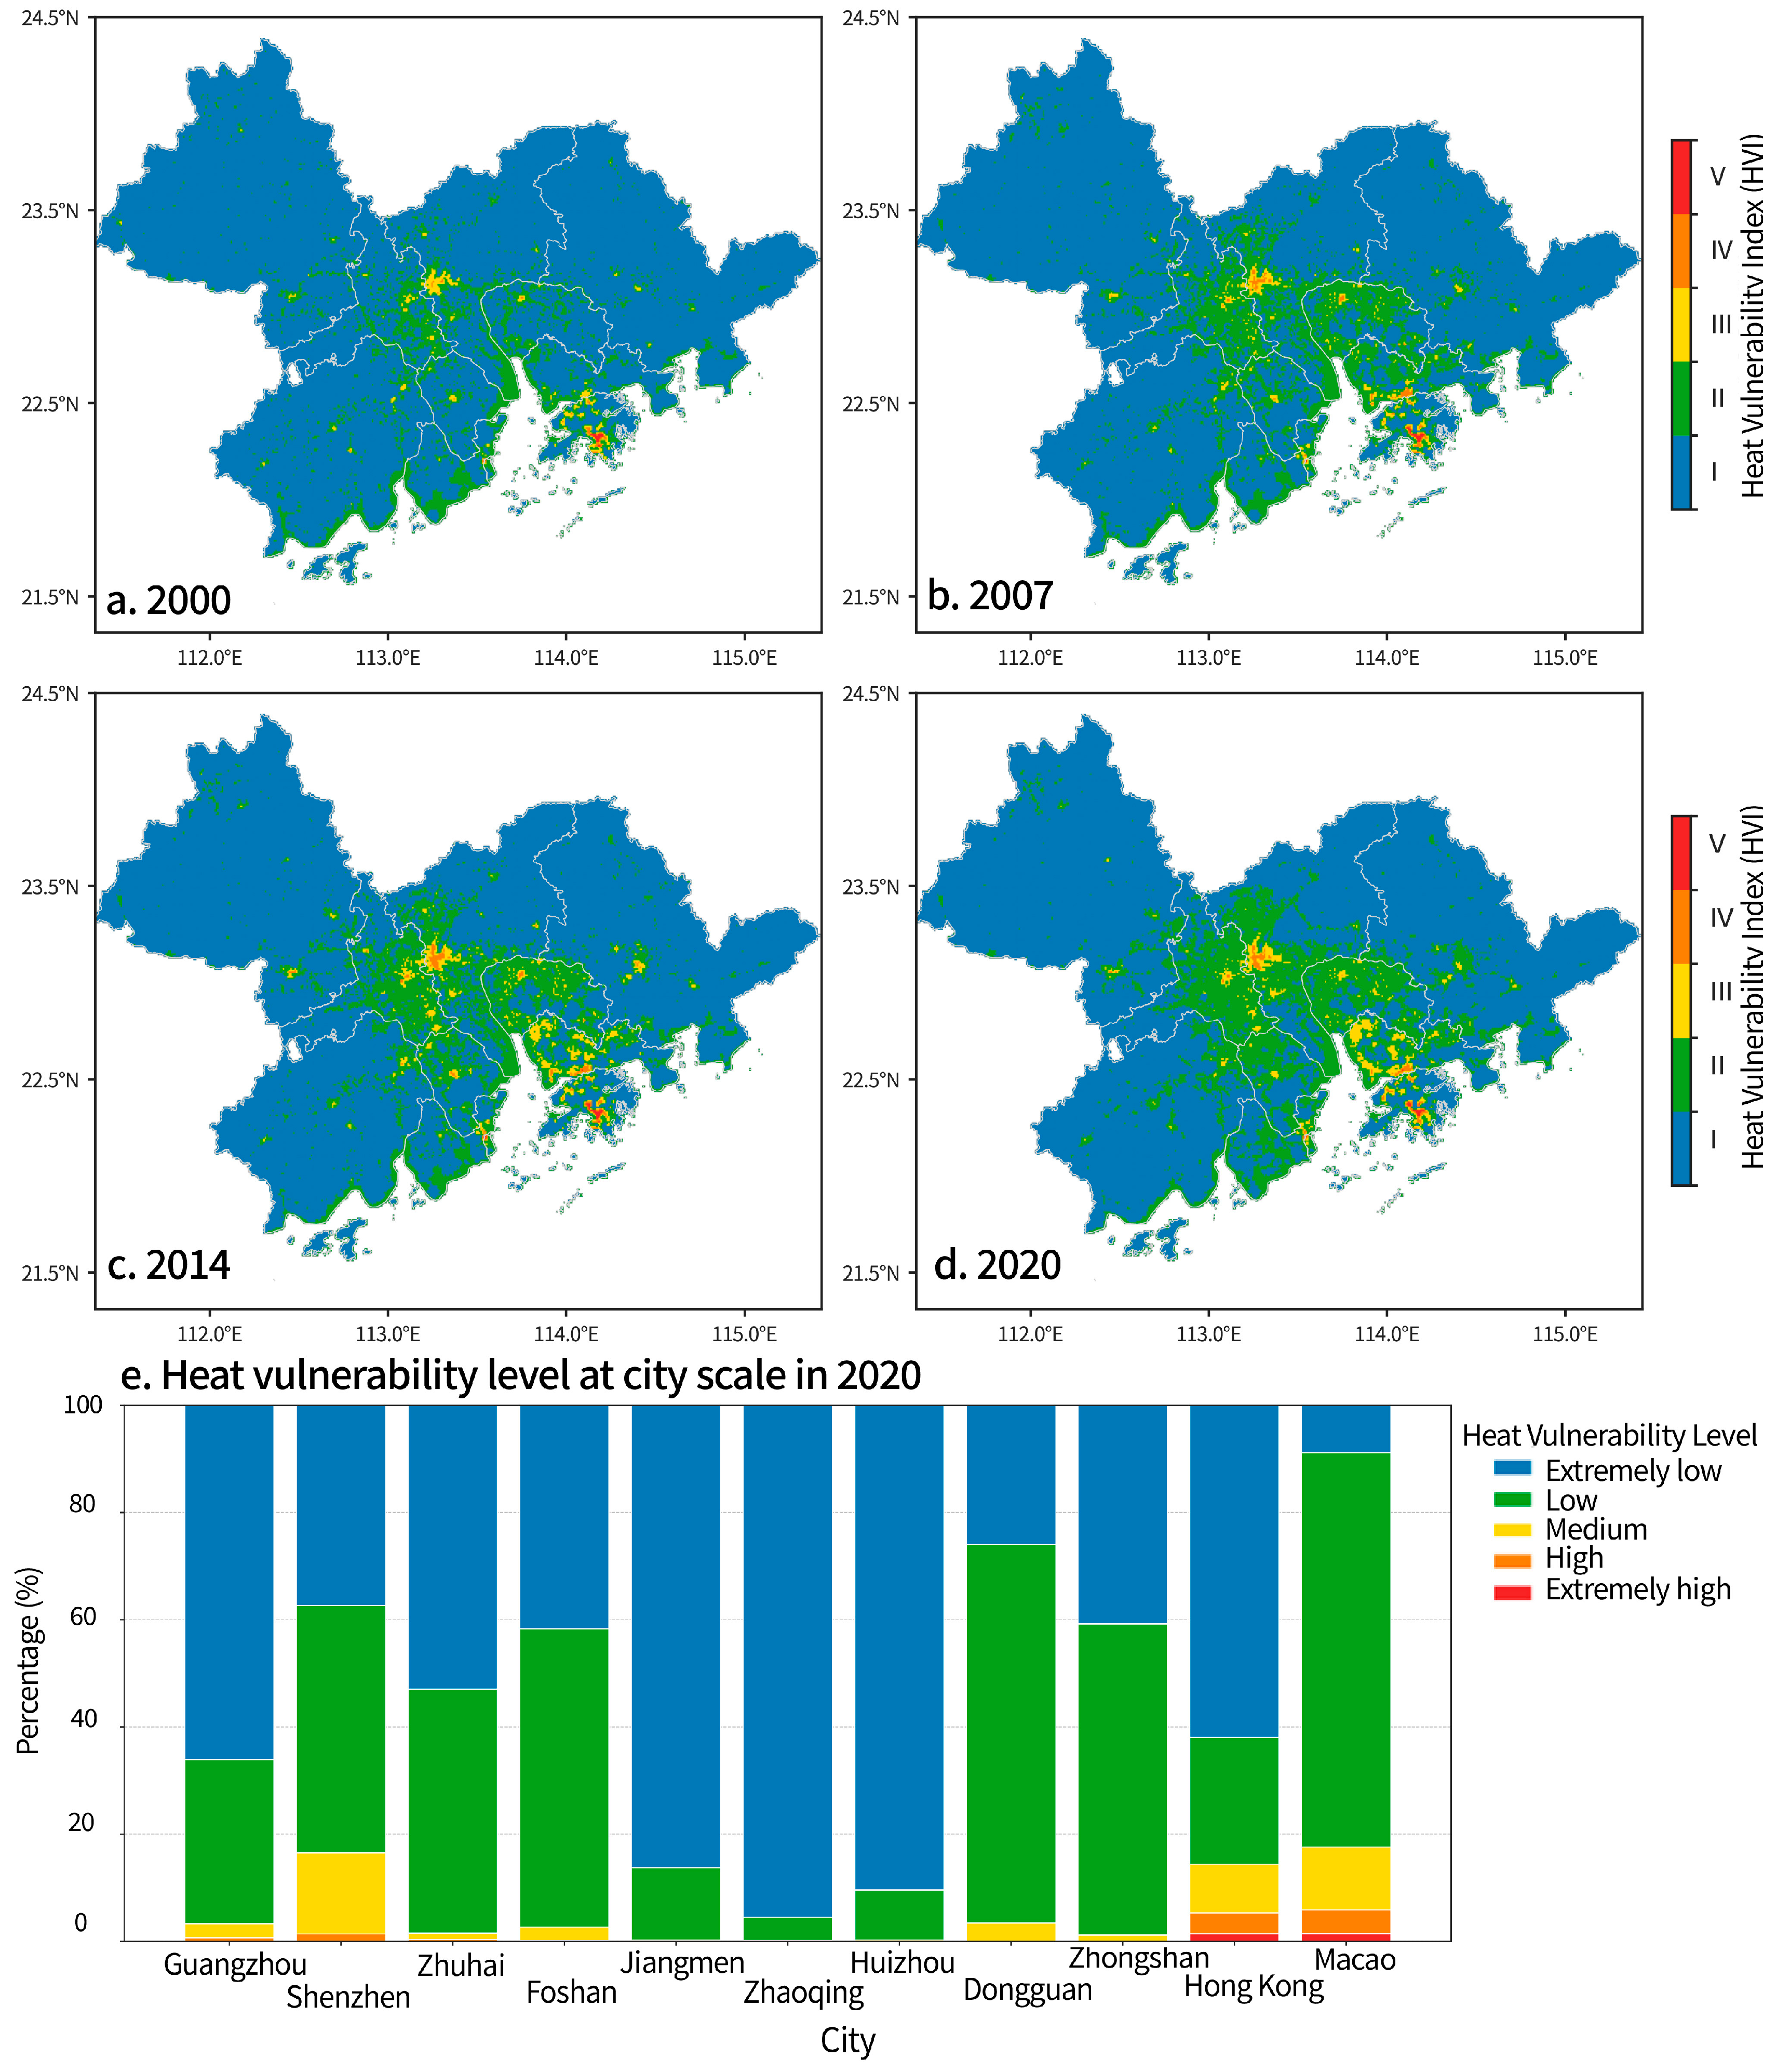
The spatial distribution of the HVI across the GBA concentrates in the region’s hyper-urbanized cores, a pattern that intensified significantly between 2000 and 2020 (Figure 6a–d). This distribution is a direct reflection of the EWM results, which identified GDP and population density as the primary drivers of vulnerability. Consequently, the HVI levels of III, IV, and V are clustered in the central urban districts of Guangzhou, Shenzhen, Foshan, and Dongguan, where the concentration of people and economic assets is greatest. The special administrative regions of Hong Kong and Macao stand out as particularly vulnerable hotspots with over 5% areas being classified as high and extremely high HVI. This is attributable to their leading population and economic densities representing the most critical factors for socio-economic susceptibility to heat. In contrast, the peripheral and extensively vegetated regions, such as Zhaoqing and Huizhou, consistently show the lowest levels of heat vulnerability, dominated by the extremely low HVI (Figure 6e), reflecting their low levels of human and economic exposure.

3.3. Assessment of Heat Risk

The integrated heat risk analysis reveals an escalation and spatial reorganization of heat risk across the GBA from 2000 to 2020. As shown in Figure 7, the risk landscape has fundamentally transformed. In 2000, areas with high risk were largely confined to the urban cores of Guangzhou, Foshan, Hong Kong, and Macao. By 2020, these isolated hotspots had intensified and expanded, coalescing into a large, contiguous high-risk zone spanning the heart of the Pearl River Delta. This growth represents the co-location of a rapidly intensifying heat hazard and persistently high socio-economic vulnerability, creating compounding risk hotspots.
A city-level analysis (Figure 8) quantifies this profound shift. The most significant transformations occurred in the industrial municipalities. In 2000, Foshan and Dongguan were dominated by medium risk, which covered 70.0% and 62.3% of their respective areas. Over two decades, this profile changed dramatically. In Foshan, the combined proportion of “High” and “Extremely High” risk surged from just 3.4% in 2000 to 27.0% in 2020, approximately an 895-km2 increase in high-risk area. Dongguan experienced a similar escalation, with its high-risk area expanding from 1.6% to 27.8%, i.e., 645-km2 increase in high-risk area. This dynamic exemplifies a feedback loop driven by rapid industrialization [49]. The expansion of factories and impervious surfaces intensified the local UHI effect (the hazard), while simultaneously attracting a dense concentration of labor and economic assets (the vulnerability), thereby amplifying the overall risk.
The hyper-urbanized centers also experienced significant risk intensification. Shenzhen saw its combined “High” and “Extremely High” risk area grow from 1.9% to 22.6% (an increase of 413 km2). Guangzhou’s high-risk area expanded from 2.3% to 12.6% (an increase of 766 km2). The Special Administrative Regions, with their extreme population and economic densities, also saw marked changes. Macao’s high and extremely high-risk areas grow from 5.9% to 20.6% (an increase of 4.9 km2), with a notable emergence of a significant “Extremely High” risk category (7.35% or 2.4 km2) by 2020. In Hong Kong, its total area under high risk remained relatively stable (9.4% in 2000 vs. 12.1% in 2020). However, the severity within those areas increased, with the proportion of “Extremely High” risk doubling from 2.65% to 5.30%.
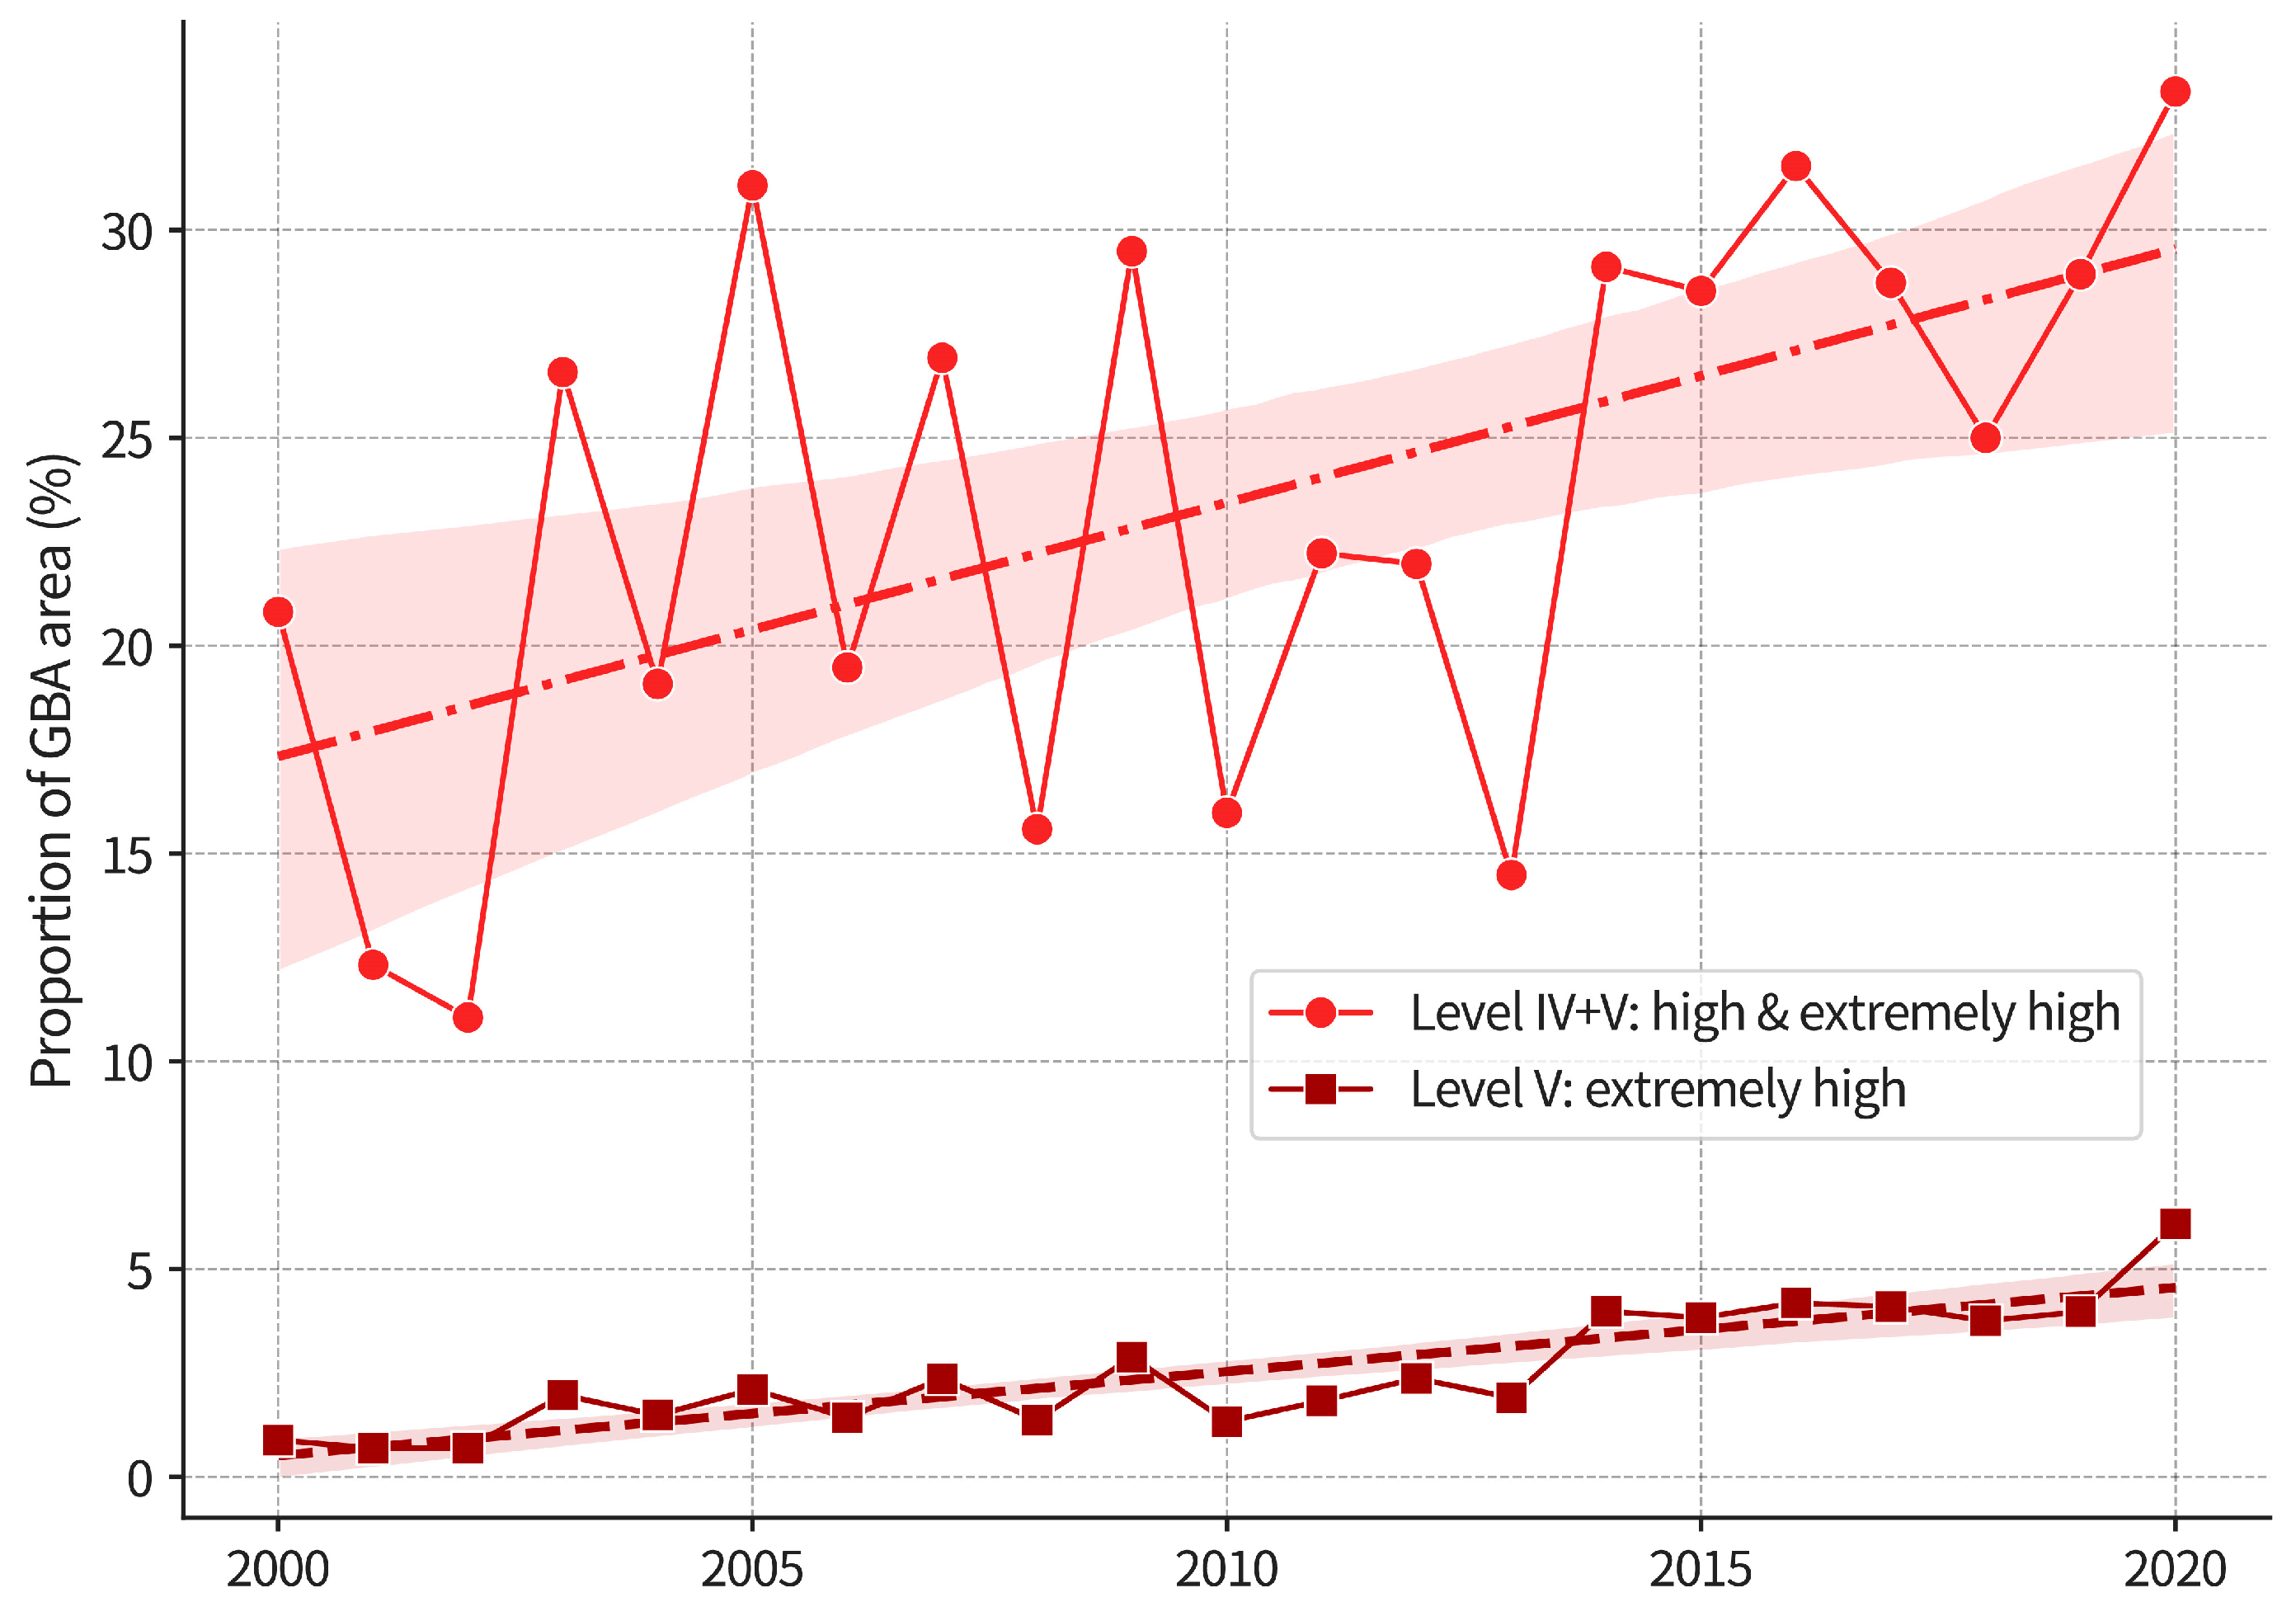
To quantify the overall intensification of heat risk over the 21-year study period, a time-series analysis was conducted on the annual proportion of the GBA’s total area classified as either “High” and “Extremely High” risk (Level IV + V) or “Extremely High” risk alone (Level V). The results (Figure 9) reveal a clear and statistically significant upward trend in heat risk exposure across the GBA. The total area affected by high to extremely high risk (Level IV + V) demonstrates considerable interannual variability, but follows a significant positive trend, increasing at an average rate of 0.611% per year (p = 0.008; an increase of 342 km2/yr). This indicates a consistent, albeit fluctuating, expansion of dangerous heat conditions over the two decades. The most severe risk category (Level V) shows a much stronger and more consistent pattern of intensification. The area classified as “Extremely High” risk expanded at a rate of 0.202% (113 km2) per year. This trend is statistically significant (p < 0.001) and shows a strong linear fit (R2 = 0.760), indicating an increase in the most dangerous heat risk level. This rapid emergence and consistent growth of the Level V risk category, which was non-existent in 2000, underscores the intensification of extreme heat risk in the GBA.

4. Discussion

4.1. The Heat Risk in GBA Urban Agglomeration

The high vulnerability results are primarily driven by the extreme concentration of population and economic assets, representing the massive exposure of sensitive socio-economic systems to heat [50,51]. Our findings should be regarded as a conservative, lower-bound estimate of the true risk in GBA. The policy implication is that urban planners and public health officials should adopt a precautionary principle; adaptation strategies should be designed to be robust enough to handle heat risks that may be even greater than those quantified in this assessment, particularly at the neighborhood scale.
The findings of spatial clustering of risk in GBA align with and build upon a growing body of international research on heat risk in megacities. The spatial hotspots in industrial corridors and dense urban cores mirror findings from other major urban agglomerations. The concentration of extreme risk in the industrial zones of Foshan and Dongguan is therefore consistent with a pattern where the combination of anthropogenic heat emissions from industrial activity, high densities of vulnerable working populations, and specific urban morphologies creates compounding risk hotspots [52].

4.2. The Critical Role of Nighttime Warming and Health Implications

Our observed asymmetric warming, where the increase in nights (TR25) is more pronounced than in days (SU35), likely results from factors that limit nocturnal cooling, such as increased nighttime cloud cover, higher atmospheric water vapor content, and the intensified heat retention and release from urban infrastructure after sunset [53,54]. The phenomenon of nighttime temperatures rising more rapidly than daytime temperatures in the GBA is not unique; it is a critical feature of urban-amplified climate change [48,55]. For instance, a comparative assessment of the coastal megacities Mumbai and Lagos similarly found that both cities warmed significantly over recent decades, with a particular acceleration in nighttime temperatures [56]. Our results confirm that this trend is pronounced in the GBA, likely amplified by the region’s rapid, dense industrialization, highlighting the critical role of nighttime processes in shaping long-term warming patterns and threats from hot nights.
Elevated nighttime temperatures are an increasingly recognized public health threat. They hinder the body’s ability to cool and recover from daytime heat, leading to cumulative physiological stress. This sustained thermal load is linked to higher risks of cardiovascular events, respiratory exacerbations, sleep disruption, cognitive impairment, and increased all-cause mortality, especially among vulnerable groups such as the elderly, women, and those with pre-existing conditions. Recent large-scale studies show that extreme nighttime heat significantly increases the risk of stroke, with older adults and women being particularly vulnerable. The risk has grown in recent years, and nighttime heat exposure is now recognized as a preventable trigger for stroke events, independent of daytime temperatures [57,58]. Nighttime warming disrupts sleep duration and quality, which in turn impairs cognitive function, mental health, and immune response. Poor sleep quality and abnormal sleep duration are associated with increased risk of stroke, cognitive decline, and poor neurological recovery after stroke [59]. The elderly, women, and those with pre-existing health conditions are at heightened risk for adverse outcomes from nighttime heat, including heat exhaustion, heatstroke, and stroke [60,61]. Our finding of asymmetric warming in the GBA, therefore, points to a growing and often underestimated public health crisis that requires targeted adaptation strategies, including thermally light construction materials, nighttime ventilation [62,63], and focused support for elderly, low-income, and health-compromised groups.

4.3. Mitigation Strategies for Building Climate Resilience in the GBA

The high-resolution risk patterns identified in this study provide the crucial evidence base for tailoring mitigation strategies. A one-size-fits-all approach is insufficient for a region as heterogeneous as the GBA. Instead, interventions must be tailored to specific drivers of risk in different areas. For the hyper-urbanized cores (e.g., Hong Kong and Guangzhou), strategies should focus on reducing heat absorption and enhancing cooling. NBS offers a multi-functional and highly effective approach to urban heat mitigation, providing a suite of co-benefits that enhance urban resilience, public health, and ecological value. The primary mechanisms for heat mitigation are shading and evapotranspiration. This includes large-scale implementation of cool infrastructure, such as reflective roofs and pavements, to reduce energy use [64], the strategic design of urban ventilation corridors to facilitate sea breeze penetration and improve thermal comfort, and the expansion of blue–green infrastructure, which provides multi-scale climate mitigation and adaptation benefits [65,66].
The industrial belt, centered on Foshan and Dongguan, is the GBA’s heat risk hotspot. The identification of high-risk industrial zones has direct implications for urban planning and policy. International experience demonstrates that targeted interventions, such as the implementation of cool pavements, reflective materials, and green infrastructure, can significantly reduce urban heat exposure [67,68]. For instance, the City of Phoenix, Arizona, piloted a large-scale cool pavement program that achieved measurable reductions in surface and air temperatures in residential neighborhoods [68]. Similarly, green infrastructure treatments have been shown to provide localized cooling benefits, though their effectiveness varies by land use and urban form [69]. These case studies highlight the need for spatially explicit, context-sensitive interventions in the GBA, prioritizing high-risk industrial corridors for the deployment of both engineered and nature-based solutions. Policymakers should also consider integrating these strategies into broader urban development and climate adaptation plans [70].

4.4. Limitations and Future Research

Despite the strengths of applying a high-resolution multi-dimensional heat risk assessment framework to the GBA, several limitations should be acknowledged. The meteorological inputs derived from gridded datasets may underestimate localized extremes due to the smoothing inherent in interpolation methods [26]. As a result, the estimated hazard and subsequent risk values should be interpreted as conservative lower-bound estimates, and future studies should integrate finer-scale observational networks, satellite-derived land surface temperature, and urban canopy models to better capture intra-urban thermal heterogeneity. In addition, this study lacks spatially explicit historical data on heat-related morbidity and mortality for the GBA at a 1 km resolution, which hinders statistical validation of the HRI. Such validation would require correlating the calculated risk index with actual adverse health outcomes, a process that is rarely possible for historical analyses at this scale due to data privacy and availability constraints. We recommend that future research aim to incorporate health outcome data for direct validation. Finally, this study focused exclusively on temperature-based heat risks, whereas urban populations are simultaneously exposed to compound hazards including extreme precipitation, flooding, and air pollution. Future research should therefore adopt a multi-hazard and systems-based perspective at a longer-term study period to capture cascading risks and feedback that may amplify the socio-ecological impacts of extreme heat. Expanding the framework in this direction will be critical for supporting holistic climate resilience strategies in the GBA and other mega-urban regions worldwide.

5. Conclusions

This study applies a high-resolution (1 km) spatiotemporal assessment of heat risk across the GBA from 2000 to 2020, revealing an intensification and spatial reorganization of this critical climate threat. Our integrated risk framework, which combines meteorological hazards with a multi-dimensional socio-ecological vulnerability index, identifies two primary drivers for this trend. First, the heat hazard has significantly escalated, characterized by a pronounced asymmetric warming pattern where the frequency of hot nights (TR25) has increased far more rapidly than that of hot days (SU35). Second, socio-economic vulnerability, overwhelmingly driven by the high concentration of population and GDP, remains persistently high in the region’s urban cores.
The synergistic interaction of these factors has transformed the GBA’s risk landscape. Isolated high-risk hotspots in 2000, primarily located in the urban centers of Guangzhou and Hong Kong, have expanded and coalesced into a contiguous high-risk belt across the Pearl River Delta’s industrial heartland, with Foshan and Dongguan emerging as critical epicenters. The total area exposed to high and extremely high risk (Levels IV + V) exhibit-ed a statistically significant increase, expanding at an average rate of 342 km2 per year.
The findings underscore an escalating public health crisis, particularly related to the loss of nighttime cooling, which impedes physiological recovery from daytime heat stress. The detailed, high-resolution risk maps produced in this study serve as a critical evidence base for policymakers, moving beyond one-size-fits-all solutions toward spatially explicit adaptation strategies. For industrial hotspots, interventions should prioritize engineered solutions like cool infrastructure and greening industrial parks, while hyper-urbanized centers require a focus on enhancing ventilation and expanding blue–green networks. By providing a quantitative foundation for targeted interventions, this research offers actionable insights for building climate resilience in the GBA and a transferable framework for other rapidly urbanizing mega-regions worldwide.

Author Contributions

Conceptualization, Zhoutong Yuan and Guotao Cui; Methodology, Zhoutong Yuan; Software, Zhoutong Yuan; Validation, Zhoutong Yuan; Formal analysis, Zhoutong Yuan; Investigation, Zhoutong Yuan and Guotao Cui; Data curation, Zhoutong Yuan and Guotao Cui; Writing—original draft, Zhoutong Yuan, Guotao Cui and Zhiqiang Zhang; Writing—review & editing, Zhoutong Yuan, Guotao Cui and Zhiqiang Zhang; Visualization, Zhoutong Yuan; Supervision, Guotao Cui; Project administration, Guotao Cui; Funding acquisition, Guotao Cui. All authors have read and agreed to the published version of the manuscript.

Funding

This research was supported by the National Natural Science Foundation of China (Grant No. 42301012), the National Key R&D Program of China (2024YFD1700801-04), and the Guangzhou Science and Technology Plan Project (2024A04J3814).

Data Availability Statement

Data will be available on request from the authors.

Acknowledgments

The authors are grateful to the four reviewers for their insightful comments and suggestions, which have greatly strengthened our work.

Conflicts of Interest

The Authors Declare No Conflicts Of Interest.

Abbreviations

The following abbreviations are used in this manuscript:
GBAGuangdong–Hong Kong–Macao Greater Bay Area
EWMEntropy Weight Method
UHIUrban Heat Island
GDPGross Domestic Product
NDVINormalized Difference Vegetation Index
NDBI Normalized Difference Built-up Index
NDWINormalized Difference Water Index
HHIHeat Hazard Index
SU35Number of hot days with daily maximum temperature ≥35 °C
TR25Number of hot nights with daily minimum temperature ≥25 °C
HVIHeat Vulnerability Index
HRIHeat Risk Index

References

  1. Cheval, S.; Amihăesei, V.-A.; Chitu, Z.; Dumitrescu, A.; Falcescu, V.; Irașoc, A.; Micu, D.M.; Mihulet, E.; Ontel, I.; Paraschiv, M.-G.; et al. A Systematic Review of Urban Heat Island and Heat Waves Research (1991–2022). Clim. Risk Manag. 2024, 44, 100603. [Google Scholar] [CrossRef]
  2. Fan, G.; Yu, Y.; Gao, M.; Sharifi, A.; Pathak, M.; Zhang, K.; de Arróyabe Hernáez, P.F.; Deng, Q. Editorial: One Climate, One Urban, One Health. Sustain. Cities Soc. 2025, 130, 106619. [Google Scholar] [CrossRef]
  3. Eight Warmest Years on Record Witness Upsurge in Climate Change Impacts. Available online: https://wmo.int/news/media-centre/eight-warmest-years-record-witness-upsurge-climate-change-impacts (accessed on 25 August 2025).
  4. Perkins-Kirkpatrick, S.E.; Lewis, S.C. Increasing Trends in Regional Heatwaves. Nat. Commun. 2020, 11, 3357. [Google Scholar] [CrossRef]
  5. Vicedo-Cabrera, A.M.; Scovronick, N.; Sera, F.; Royé, D.; Schneider, R.; Tobias, A.; Astrom, C.; Guo, Y.; Honda, Y.; Hondula, D.M.; et al. The Burden of Heat-Related Mortality Attributable to Recent Human-Induced Climate Change. Nat. Clim. Change 2021, 11, 492–500. [Google Scholar] [CrossRef]
  6. Sun, Y.; Zhang, X.; Zwiers, F.W.; Song, L.; Wan, H.; Hu, T.; Yin, H.; Ren, G. Rapid Increase in the Risk of Extreme Summer Heat in Eastern China. Nat. Clim. Change 2014, 4, 1082–1085. [Google Scholar] [CrossRef]
  7. Palmeiro-Silva, Y.; Chandler, R.E.; Kelman, I. Estimating the Regional Effects of Temperature on Mortality and Hospitalisations in Chile: A Population-Based, Modelling Study Using Four Different Climate Change Scenarios. Lancet Reg. Health Am. 2025, 48, 101151. [Google Scholar] [CrossRef]
  8. Zhang, P.; Deschenes, O.; Meng, K.; Zhang, J. Temperature Effects on Productivity and Factor Reallocation: Evidence from a Half Million Chinese Manufacturing Plants. J. Environ. Econ. Manag. 2018, 88, 1–17. [Google Scholar] [CrossRef]
  9. Fant, C.; Boehlert, B.; Strzepek, K.; Larsen, P.; White, A.; Gulati, S.; Li, Y.; Martinich, J. Climate Change Impacts and Costs to U.S. Electricity Transmission and Distribution Infrastructure. Energy 2020, 195, 116899. [Google Scholar] [CrossRef]
  10. Pataki, D.E.; Carreiro, M.M.; Cherrier, J.; Grulke, N.E.; Jennings, V.; Pincetl, S.; Pouyat, R.V.; Whitlow, T.H.; Zipperer, W.C. Coupling Biogeochemical Cycles in Urban Environments: Ecosystem Services, Green Solutions, and Misconceptions. Front. Ecol. Environ. 2011, 9, 27–36. [Google Scholar] [CrossRef]
  11. Chen, B.; Xie, M.; Feng, Q.; Li, Z.; Chu, L.; Liu, Q. Heat Risk of Residents in Different Types of Communities from Urban Heat-Exposed Areas. Sci. Total Environ. 2021, 768, 145052. [Google Scholar] [CrossRef] [PubMed]
  12. Zhang, K.; Cao, C.; Chu, H.; Zhao, L.; Zhao, J.; Lee, X. Increased Heat Risk in Wet Climate Induced by Urban Humid Heat. Nature 2023, 617, 738–742. [Google Scholar] [CrossRef]
  13. Esperon-Rodriguez, M.; Gallagher, R.V.; Lenoir, J.; Barradas, V.L.; Beaumont, L.J.; Calfapietra, C.; Cariñanos, P.; Livesley, S.J.; Iungma, T.; Manoli, G.; et al. Urban Heat in Global Cities and the Role of Nature-Based Solutions in Mitigating Future Climate Risks. Environ. Res. Clim. 2025, 4, 023001. [Google Scholar] [CrossRef]
  14. Augusto, B.; Roebeling, P.; Rafael, S.; Ferreira, J.; Ascenso, A.; Bodilis, C. Short and Medium- to Long-Term Impacts of Nature-Based Solutions on Urban Heat. Sustain. Cities Soc. 2020, 57, 102122. [Google Scholar] [CrossRef]
  15. Sahani, J.; Kumar, P.; Debele, S.E. Efficacy Assessment of Green-Blue Nature-Based Solutions against Environmental Heat Mitigation. Environ. Int. 2023, 179, 108187. [Google Scholar] [CrossRef] [PubMed]
  16. Luo, M.; Lau, N.-C. Heat Waves in Southern China: Synoptic Behavior, Long-Term Change, and Urbanization Effects. J. Clim. 2017, 30, 703–720. [Google Scholar] [CrossRef]
  17. Wang, Y.; Han, Z.; Gao, R. Changes of Extreme High Temperature and Heavy Precipitation in the Guangdong-Hong Kong-Macao Greater Bay Area. Geomat. Nat. Hazards Risk 2021, 12, 1101–1126. [Google Scholar] [CrossRef]
  18. Zhang, J.; Lin, T.; Sun, C.; Lin, M.; Zhan, Y.; Chen, Y.; Ye, H.; Yao, X.; Huang, Y.; Zhang, G.; et al. Long-Term Spatiotemporal Characteristics and Impact Factors of Land Surface Temperature of Inhabited Islands with Different Urbanization Levels. Remote Sens. 2022, 14, 4997. [Google Scholar] [CrossRef]
  19. Deng, X.; Gao, F.; Liao, S.; Liu, Y.; Chen, W. Spatiotemporal Evolution Patterns of Urban Heat Island and Its Relationship with Urbanization in Guangdong-Hong Kong-Macao Greater Bay Area of China from 2000 to 2020. Ecol. Indic. 2023, 146, 109817. [Google Scholar] [CrossRef]
  20. Huang, S.; Su, Z.; Cui, G.; Huang, Y.; Deng, Z.; Lin, S. The Greater Bay Area as a Hotspot: Interacting Impacts of Urbanization and Extreme Events on Wet-Bulb Temperatures in Guangdong Province. Front. Clim. 2025, 7, 1653561. [Google Scholar] [CrossRef]
  21. Cui, G.; Deng, Z.; Tian, H.; Shi, S. Spatiotemporal Evolution and Future Projections of Compound Heat–Drought and Heat–Heavy Precipitation Extremes in the Pearl River Basin. Pearl River 2025, 1–18. Available online: https://link.cnki.net/urlid/44.1037.tv.20250911.1524.002 (accessed on 1 October 2025).
  22. Li, K.; Wang, M.; Liu, K. The Study on Compound Drought and Heatwave Events in China Using Complex Networks. Sustainability 2021, 13, 12774. [Google Scholar] [CrossRef]
  23. Sun, S.; Zhang, Q.; Singh, V.P.; Shi, C.; Wang, G.; Wu, W.; Shen, Z. Increased Moist Heat Stress Risk across China under Warming Climate. Sci. Rep. 2022, 12, 22548. [Google Scholar] [CrossRef]
  24. Wang, J.; Yan, Z. Rapid Rises in the Magnitude and Risk of Extreme Regional Heat Wave Events in China. Weather Clim. Extrem. 2021, 34, 100379. [Google Scholar] [CrossRef]
  25. Wang, H.; Xue, H.; He, W.; Han, Q.; Xu, T.; Gao, X.; Liu, S.; Jiang, R.; Huang, M. Spatial-Temporal Evolution Mechanism and Dynamic Simulation of the Urban Resilience System of the Guangdong-Hong Kong-Macao Greater Bay Area in China. Environ. Impact Assess. Rev. 2024, 104, 107333. [Google Scholar] [CrossRef]
  26. Zhang, J.; Liu, B.; Ren, S.; Han, W.; Ding, Y.; Peng, S. A 4 Km Daily Gridded Meteorological Dataset for China from 2000 to 2020. Sci. Data 2024, 11, 1230. [Google Scholar] [CrossRef]
  27. Lebakula, V.; Sims, K.; Reith, A.; Rose, A.; McKee, J.; Coleman, P.; Kaufman, J.; Urban, M.; Jochem, C.; Whitlock, C.; et al. LandScan Global 30 Arcsecond Annual Global Gridded Population Datasets from 2000 to 2022. Sci. Data 2025, 12, 495. [Google Scholar] [CrossRef]
  28. Chen, Z.; Yu, B.; Yang, C.; Zhou, Y.; Yao, S.; Qian, X.; Wang, C.; Wu, B.; Wu, J. An extended time series (2000–2018) of global NPP-VIIRS-like nighttime light data from a cross-sensor calibration. Earth Syst. Sci. Data 2021, 13, 889–906. [Google Scholar] [CrossRef]
  29. Didan, K. MOD13A3 MODIS/Terra Vegetation Indices Monthly L3 Global 1km SIN Grid V006; Nasa Earth Data: Greenbelt, MD, USA, 2023. [Google Scholar]
  30. Pettorelli, N. The Normalized Difference Vegetation Index; Oxford University Press: Cary, NC, USA, 2013. [Google Scholar]
  31. Wu, S.; Dai, E.; Ge, Q. The Comprehensive Risk Prevention: Chinese Comprehensive Climate Change Risks; Beijing Science Press: Beijing China, 2011. [Google Scholar]
  32. Siyan, D.; Ying, X.; Botao, Z.; Meiting, H.; Rouke, L.; Li, Y.; Yongxiang, Z. Projected Risk of Extreme Heat in China Based on CMIP5 Models. Adv. Clim. Change Res. 2014, 10, 365. [Google Scholar]
  33. Yin, X.; Dong, S.; Han, Z.; Wang, R. Projected Risk of Drought and Flood at Yangtze River Delta for the next 50 Years. J. Meteorol. Environ. 2018, 34, 66–75. [Google Scholar]
  34. Wei, C.; Wan, Y.; Huang, G.; Zhou, L.; Chang, Y. Spatial and Temporal Characteristics and Population Exposure of Heat Waves in China’s Coastal Regions. Remote Sens. Technol. Appl. 2024, 39, 679–689. [Google Scholar] [CrossRef]
  35. Feng, X.; Zeng, Z.; Jing, M.; Gao, K.; Xiao, Y. Influence of Driving Factors under Different Vegetation Indices of NDVI and EVI in Guangdong-Hong Kong-Macao Greater Bay Area. J. Huazhong Agric. Univ. 2023, 42, 116–124. [Google Scholar] [CrossRef]
  36. Margalef-Marrase, J.; Pérez-Navarro, M.Á.; Lloret, F. Relationship between Heatwave-induced Forest Die-off and Climatic Suitability in Multiple Tree Species. Glob. Change Biol. 2020, 26, 3134–3146. [Google Scholar] [CrossRef]
  37. Cardone, B.; Di Martino, F.; Mauriello, C.; Miraglia, V. A GIS-Based Framework to Analyze the Behavior of Urban Greenery During Heatwaves Using Satellite Data. ISPRS Int. J. Geo-Inf. 2024, 13, 377. [Google Scholar] [CrossRef]
  38. Xian, C.; He, L.; He, Z.; Xue, D.; Li, Z. Assessing the Response of Satellite Solar-Induced Chlorophyll Fluorescence and NDVI to Impacts of Heat Waves on Winter Wheat in the North China Plain. Adv. Meteorol. 2020, 2020, 8873534. [Google Scholar] [CrossRef]
  39. Yan, W.; Zhou, J.; Wang, X.; Luo, J.; Yang, F.; Wu, R. Vegetation Resistance to Compound Drought and Heatwave Events Buffers the Spatial Shift Velocities of Vegetation Vulnerability. Commun. Earth Environ. 2025, 6, 320. [Google Scholar] [CrossRef]
  40. Wang, Y.; Ren, Y.; Song, L.; Xiang, Y. Responses of Extreme High Temperatures to Urbanization in the Beijing–Tianjin–Hebei Urban Agglomeration in the Context of a Changing Climate. Meteorol. Appl. 2021, 28, e2024. [Google Scholar] [CrossRef]
  41. Shao-Hong, W.; Tao, P.; Shan-Feng, H. Primary Study on the Theories and Methods of Research on Climate Change Risk. Adv. Clim. Change Res. 2011, 7, 363. [Google Scholar]
  42. Szagri, D.; Nagy, B.; Szalay, Z. How Can We Predict Where Heatwaves Will Have an Impact?—A Literature Review on Heat Vulnerability Indexes. Urban Clim. 2023, 52, 101711. [Google Scholar] [CrossRef]
  43. Zhao, N.; Liu, Y.; Cao, G.; Samson, E.L.; Zhang, J. Forecasting China’s GDP at the Pixel Level Using Nighttime Lights Time Series and Population Images. GIScience Remote Sens. 2017, 54, 407–425. [Google Scholar] [CrossRef]
  44. Wang, T.; Sun, F. Global Gridded GDP Data Set Consistent with the Shared Socioeconomic Pathways. Sci. Data 2022, 9, 221. [Google Scholar] [CrossRef]
  45. Guha, S.; Govil, H. An Assessment on the Relationship between Land Surface Temperature and Normalized Difference Vegetation Index. Environ. Dev. Sustain. 2021, 23, 1944–1963. [Google Scholar] [CrossRef]
  46. Zha, Y.; Gao, J.; Ni, S. Use of Normalized Difference Built-up Index in Automatically Mapping Urban Areas from TM Imagery. Int. J. Remote Sens. 2003, 24, 583–594. [Google Scholar] [CrossRef]
  47. Zhu, Y.; Tian, D.; Yan, F. Effectiveness of Entropy Weight Method in Decision-Making. Math. Probl. Eng. 2020, 2020, 3564835. [Google Scholar] [CrossRef]
  48. Nie, Z.; Wang, L.; Cheshmehzangi, A.; Wu, H.; Lu, D.; Zhao, L. Subdistrict-Scale Day–Night Assessment of Urban Heat Vulnerability: A Multi-Dimensional Framework and Mitigation Strategies for Megacities—Case of Guangzhou, China. Build. Environ. 2025, 287, 113803. [Google Scholar] [CrossRef]
  49. Yao, L.; Gao, C.; Zhuang, Y.; Yang, H.; Wang, X. Exploring the Spatiotemporal Dynamics and Simulating Heritage Corridors for Sustainable Development of Industrial Heritage in Foshan City, China. Sustainability 2024, 16, 5605. [Google Scholar] [CrossRef]
  50. Cutter, S.L. The Origin and Diffusion of the Social Vulnerability Index (SoVI). Int. J. Disaster Risk Reduct. 2024, 109, 104576. [Google Scholar] [CrossRef]
  51. Cutter, S.L.; Boruff, B.J.; Shirley, W.L. Social Vulnerability to Environmental Hazards. In Hazards Vulnerability and Environmental Justice; Routledge: Oxfordshire, UK, 2012; pp. 115–132. [Google Scholar]
  52. Balakrishnan, K.; Ramalingam, A.; Dasu, V.; Chinnadurai Stephen, J.; Raj Sivaperumal, M.; Kumarasamy, D.; Mukhopadhyay, K.; Ghosh, S.; Sambandam, S. Case Studies on Heat Stress Related Perceptions in Different Industrial Sectors in Southern India. Glob. Health Action 2010, 3, 5635. [Google Scholar] [CrossRef] [PubMed]
  53. Davy, R.; Esau, I.; Chernokulsky, A.; Outten, S.; Zilitinkevich, S. Diurnal Asymmetry to the Observed Global Warming. Int. J. Climatol. 2017, 37, 79–93. [Google Scholar] [CrossRef]
  54. Dai, A.; Trenberth, K.E.; Karl, T.R. Effects of Clouds, Soil Moisture, Precipitation, and Water Vapor on Diurnal Temperature Range. J. Clim. 1999, 12, 2451–2473. [Google Scholar] [CrossRef]
  55. Jiang, S.; Wang, K.; Mao, Y. Rapid Local Urbanization around Most Meteorological Stations Explains the Observed Daily Asymmetric Warming Rates across China from 1985 to 2017. J. Clim. 2020, 33, 9045–9061. [Google Scholar] [CrossRef]
  56. Musa, A.A.; Mourad, K.A. Asymmetric Climate Extremes and Urban Flood Risk in Coastal Megacities: Diverging Hydroclimatic Trajectories of Mumbai and Lagos (1981–2023). Preprint 2025, 2025080723. [Google Scholar] [CrossRef]
  57. Tao, J.; Zhang, Y.; Li, Z.; Yang, M.; Huang, C.; Hossain, M.Z.; Xu, Y.; Wei, X.; Su, H.; Cheng, J.; et al. Daytime and Nighttime High Temperatures Differentially Increased the Risk of Cardiovascular Disease: A Nationwide Hospital-Based Study in China. Environ. Res. 2023, 236, 116740. [Google Scholar] [CrossRef]
  58. He, C.; Breitner, S.; Zhang, S.; Huber, V.; Naumann, M.; Traidl-Hoffmann, C.; Hammel, G.; Peters, A.; Ertl, M.; Schneider, A. Nocturnal Heat Exposure and Stroke Risk. Eur. Heart J. 2024, 45, 2158–2166. [Google Scholar] [CrossRef]
  59. Zhou, W.; Li, X.; Wang, Q.; Ling, L.; Zhang, H. The Combined Effects of Sleep and Extreme Heat Exposure on Cognitive Function among Older Adults. Ecotoxicol. Environ. Saf. 2025, 289, 117683. [Google Scholar] [CrossRef]
  60. Murage, P.; Hajat, S.; Kovats, R.S. Effect of Night-Time Temperatures on Cause and Age-Specific Mortality in London. Environ. Epidemiol. 2017, 1, e005. [Google Scholar] [CrossRef]
  61. Obradovich, N.; Migliorini, R.; Mednick, S.C.; Fowler, J.H. Nighttime Temperature and Human Sleep Loss in a Changing Climate. Sci. Adv. 2017, 3, e1601555. [Google Scholar] [CrossRef]
  62. Li, M.; Shen, X.; Wu, W.; Cetin, K.; Mcintyre, F.; Wang, L.; Ding, L.; Bishop, D.; Bellamy, L.; Liu, M. Cooling Demand Reduction with Nighttime Natural Ventilation to Cool Internal Thermal Mass under Harmonic Design-Day Weather Conditions. Appl. Energy 2025, 379, 124947. [Google Scholar] [CrossRef]
  63. Anand, J.; Sailor, D.J. How Can We Combine Urban Cooling Strategies to Effectively Cool Cities over the Entire Diurnal Cycle? Build. Environ. 2023, 242, 110524. [Google Scholar] [CrossRef]
  64. Akbari, H.; Pomerantz, M.; Taha, H. Cool Surfaces and Shade Trees to Reduce Energy Use and Improve Air Quality in Urban Areas. Sol. Energy 2001, 70, 295–310. [Google Scholar] [CrossRef]
  65. Demuzere, M.; Orru, K.; Heidrich, O.; Olazabal, E.; Geneletti, D.; Orru, H.; Bhave, A.G.; Mittal, N.; Feliu, E.; Faehnle, M. Mitigating and Adapting to Climate Change: Multi-Functional and Multi-Scale Assessment of Green Urban Infrastructure. J. Environ. Manag. 2014, 146, 107–115. [Google Scholar] [CrossRef]
  66. Cui, Y.; Yin, M.; Cheng, X.; Tang, J.; He, B.-J. Towards Cool Cities and Communities: Preparing for an Increasingly Hot Future by the Development of Heat-Resilient Infrastructure and Urban Heat Management Plan. Environ. Technol. Innov. 2024, 34, 103568. [Google Scholar] [CrossRef]
  67. Krayenhoff, E.S.; Broadbent, A.M.; Zhao, L.; Georgescu, M.; Middel, A.; Voogt, J.A.; Martilli, A.; Sailor, D.J.; Erell, E. Cooling Hot Cities: A Systematic and Critical Review of the Numerical Modelling Literature. Environ. Res. Lett. 2021, 16, 053007. [Google Scholar] [CrossRef]
  68. Schneider, F.A.; Ortiz, J.C.; Vanos, J.K.; Sailor, D.J.; Middel, A. Evidence-Based Guidance on Reflective Pavement for Urban Heat Mitigation in Arizona. Nat. Commun. 2023, 14, 1467. [Google Scholar] [CrossRef] [PubMed]
  69. Makido, Y.; Hellman, D.; Shandas, V. Nature-Based Designs to Mitigate Urban Heat: The Efficacy of Green Infrastructure Treatments in Portland, Oregon. Atmosphere 2019, 10, 282. [Google Scholar] [CrossRef]
  70. Degirmenci, K.; Desouza, K.C.; Fieuw, W.; Watson, R.T.; Yigitcanlar, T. Understanding Policy and Technology Responses in Mitigating Urban Heat Islands: A Literature Review and Directions for Future Research. Sustain. Cities Soc. 2021, 70, 102873. [Google Scholar] [CrossRef]
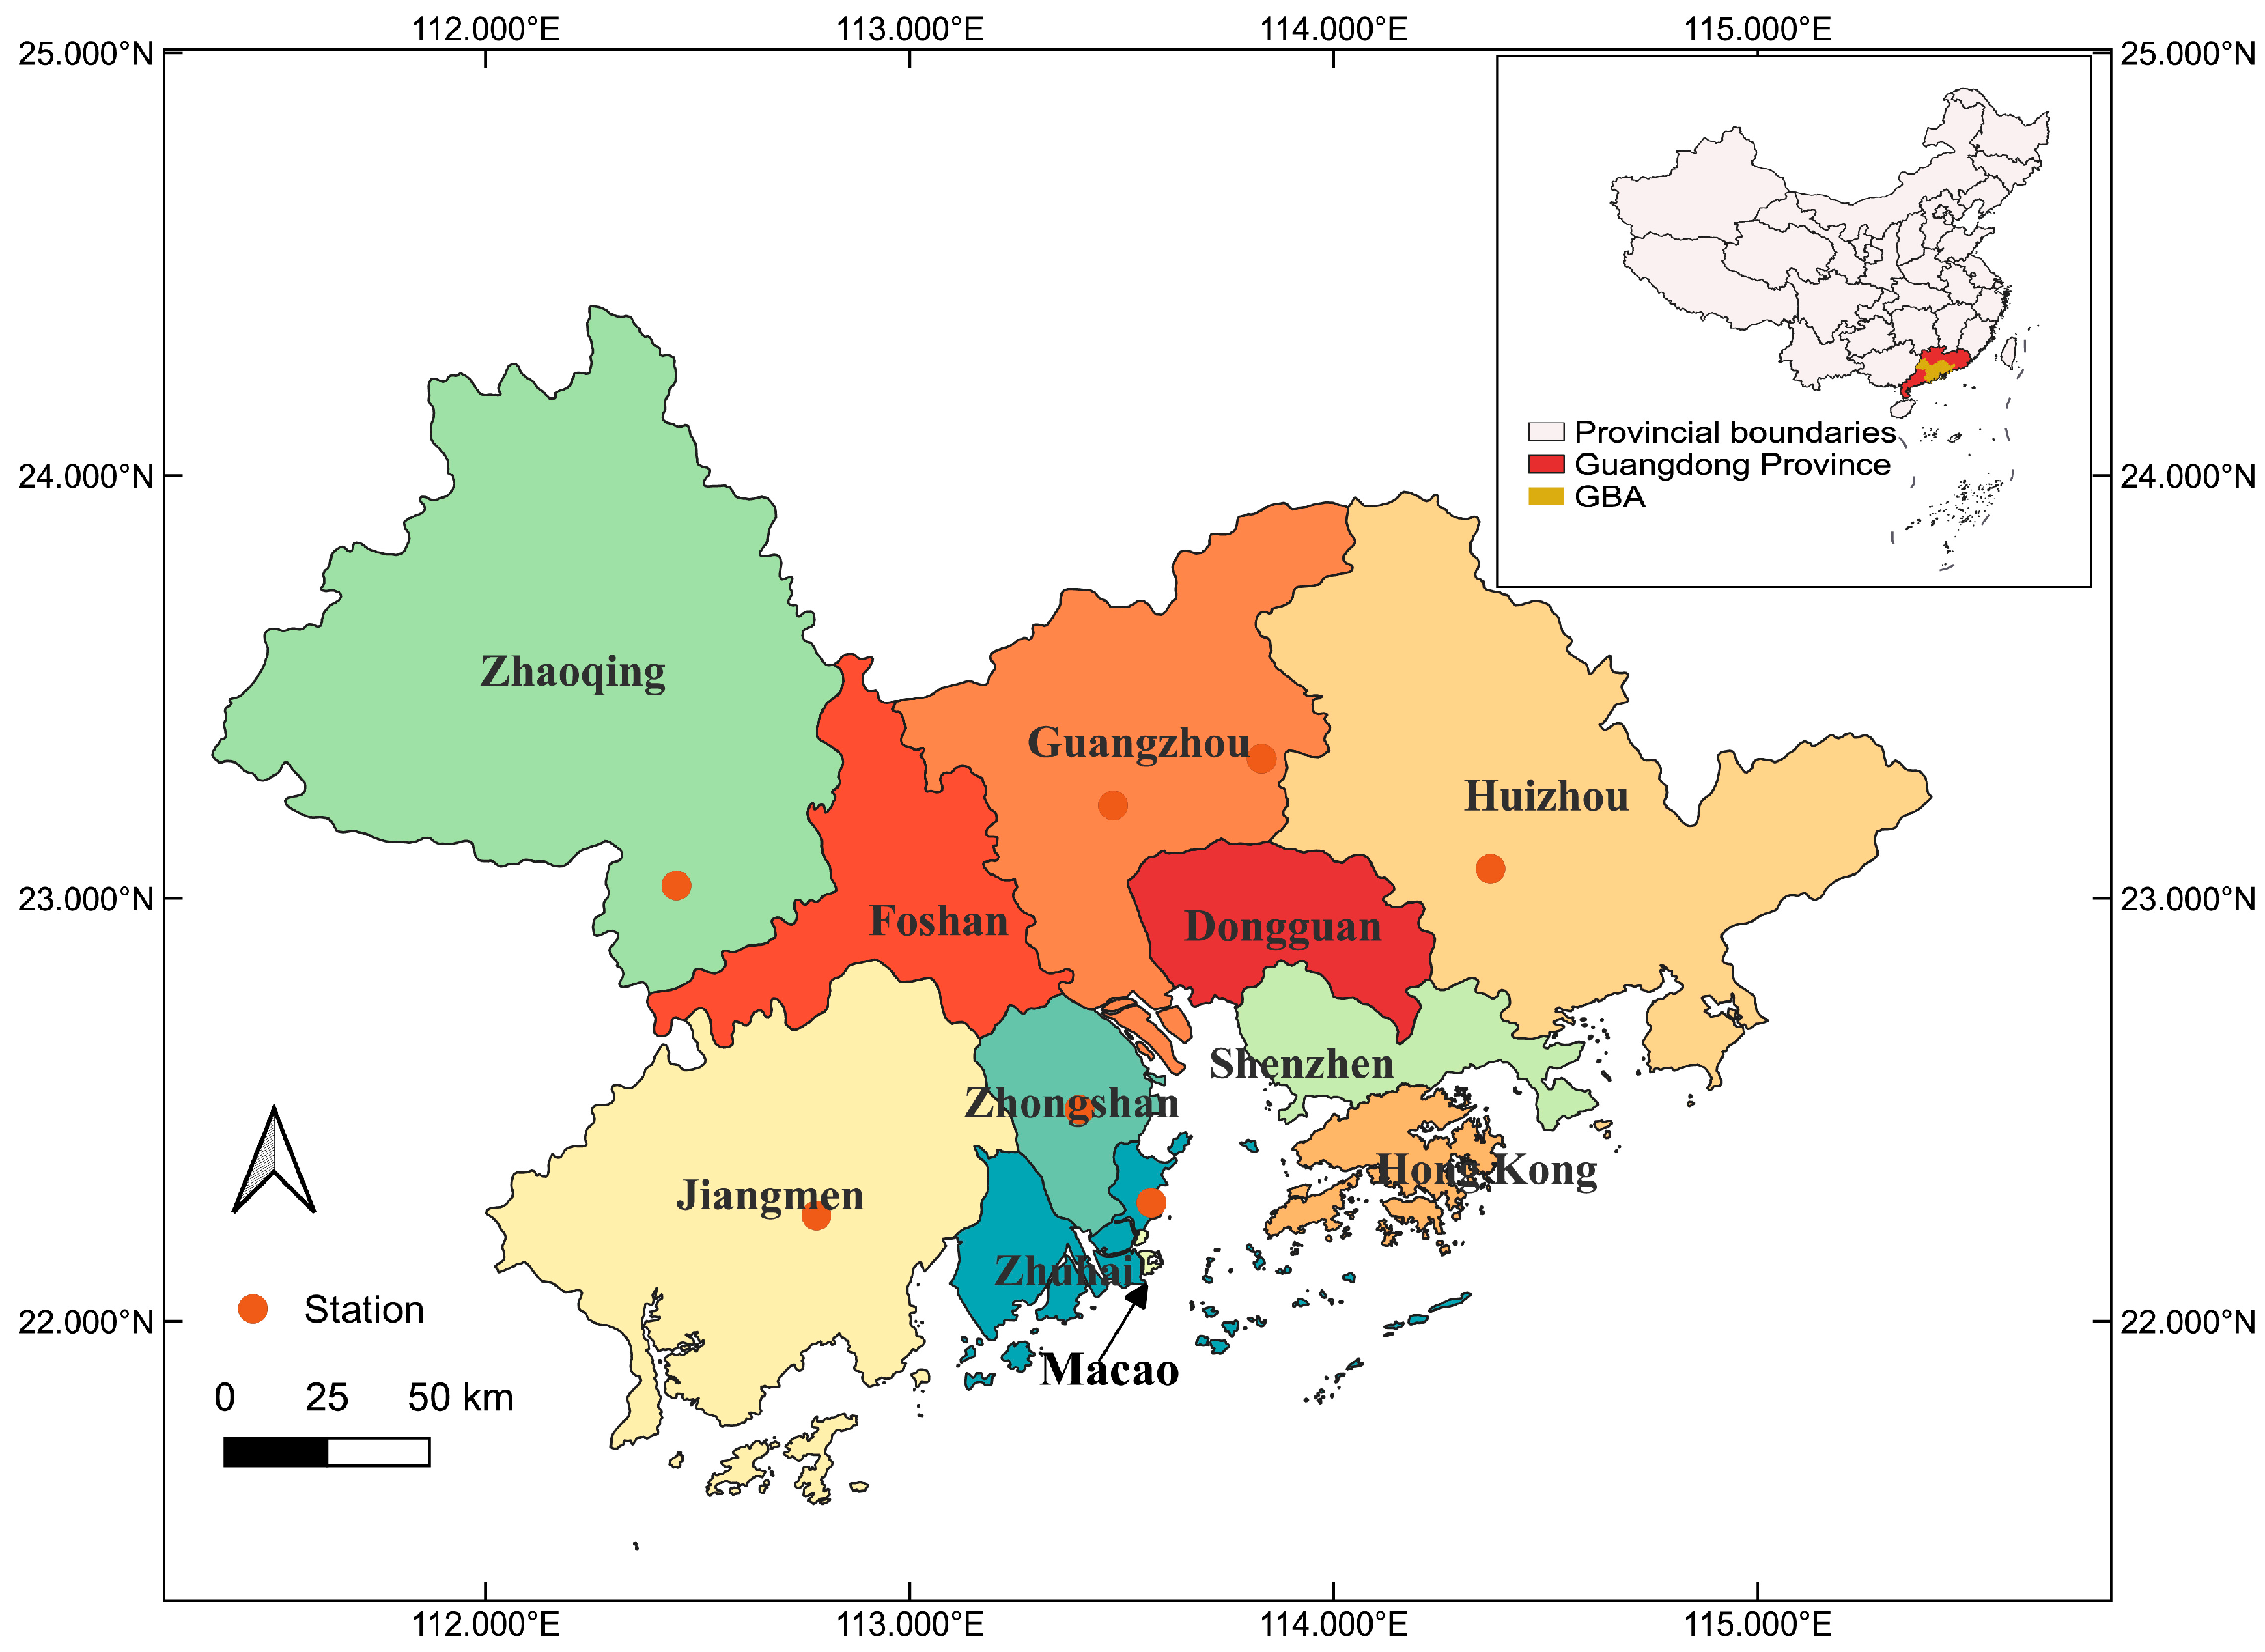
Figure 1. The location and administrative divisions of the Guangdong–Hong Kong–Macao Greater Bay Area (GBA), a national strategic urban agglomeration on China’s southern coast. The map displays the boundaries of the nine cities, Hong Kong, and Macao that constitute the GBA. The inset shows the location of the GBA within China. The in situ meteorological stations used in this study are also shown as red filled circles.
Ijgi 14 00421 g001
Figure 2. Time-series comparison of station-observed and gridded annual counts of hot days (SU35) and hot nights (TR25) for selected cities in the GBA (2000–2020). Panels (ag) correspond to the cities of Zhaoqing, Guangzhou (#1), Zhuhai, Huizhou, Guangzhou (#2), Jiangmen, and Zhongshan. Panel (h) illustrates the mean trend by averaging the values from all stations.
Ijgi 14 00421 g002
Figure 3. Spatiotemporal trends of heat indices in the GBA from 2000 to 2020 using the gridded dataset. (a) Interannual variability and linear trends of the GBA-averaged annual number of hot days (SU35) and hot nights (TR25). (b) Spatial distribution of the linear trend for TR25, and (c) SU35, with the rate of change shown in days per year.
Ijgi 14 00421 g003
Figure 4. Spatiotemporal evolution of the Heat Hazard Index (HHI) in the Greater Bay Area. The maps illustrate the spatial distribution of heat hazard levels for four representative years: (a) 2000, (b) 2007, (c) 2014, and (d) 2020. The HHI is classified into five levels, from extremely low (Level I) to extremely high (Level V).
Ijgi 14 00421 g004
Figure 5. Proportional distribution of heat hazard levels for each city in the GBA for the years 2000 and 2020. The stacked bar charts illustrate the percentage of each city’s total area that falls into the five classified hazard levels for (a) 2000 and (b) 2020.
Ijgi 14 00421 g005
Figure 6. Spatiotemporal dynamics of heat vulnerability in the GBA from 2000 to 2020. Panels (ad) illustrate the spatial distribution of the Heat Vulnerability Index (HVI) for the years 2000, 2007, 2014, and 2020. The HVI is classified into five levels, from extremely low (Level I) to extremely high (Level V). Panel (e) shows the proportional distribution of the five classified heat vulnerability levels for each GBA city in 2020.
Ijgi 14 00421 g006
Figure 7. Spatiotemporal evolution of the Heat Risk Index (HRI) in the GBA. The maps illustrate the spatial distribution of the heat risk for four representative years: (a) 2000, (b) 2007, (c) 2014, and (d) 2020. The HRI is classified into five levels, from extremely low (Level I) to extremely high (Level V).
Ijgi 14 00421 g007
Figure 8. Proportional distribution of heat risk levels for each city in the GBA for the years 2000 and 2020. The stacked bar charts illustrate the percentage of each city’s total area that falls into the five classified heat risk levels for (a) 2000 and (b) 2020.
Ijgi 14 00421 g008
Figure 9. Time series of the annual area proportion (%) of the Greater Bay Area (GBA) affected by high to extremely high heat risk from 2000 to 2020. The annual area percentages for combined high and extremely high risk (Level IV + V) and extremely high risk only (Level V) are shown. Both series exhibit a statistically significant positive trend, with the shaded areas representing the 95% confidence intervals of the linear regression.
Ijgi 14 00421 g009
Table 1. Data types and sources used in this study.
Data TypeSource and Note
Meteorological data from in situ observation stationsNational Meteorological Science Data Center (https://data.cma.cn/)
Meteorological grid dataCDMet: A 4 km daily gridded meteorological dataset for China (2000–2020) generated using Thin Plate Spline (TPS) and Random Forest algorithms (https://zenodo.org/records/10963932, accessed on 1 February 2025) [26]
Population density dataLandScan Global Population Dynamic Distribution dataset at 30 arc-second resolution from Oak Ridge National Laboratory (ORNL, https://landscan.ornl.gov/, accessed on 1 February 2025) [27]
Socioeconomic dataAnnual Statistical Yearbooks of Guangdong, Hong Kong, and Macao
Nighttime light dataGlobal NPP-VIIRS-like (1 km) nighttime light datasets from Harvard Dataverse (https://gee-community-catalog.org/projects/npp_viirs_ntl/#earth-engine-snippet, accessed on 1 February 2025), available from 2000 onward [28]
Normalized Difference Vegetation Index (NDVI)MODIS Terra Vegetation Index Monthly Product (MOD13A3) at 1 km resolution from NASA EOSDIS Land Processes DAAC (https://ladsweb.modaps.eosdis.nasa.gov/missions-and-measurements/products/MOD13A3, accessed on 1 October 2025) [29]
Normalized Difference Built-up Index (NDBI)Urban built-up areas (500 m) calculated using generated from the MODIS/061/MOD09A1 surface reflectance using Google Earth Engine (https://earthengine.google.com, accessed on 1 October 2025)
Normalized Difference Water Index (NDWI)Water body map (500 m) generated from the MODIS/006/MOD09GA surface reflectance composites (https://developers.google.com/earth-engine/datasets/catalog/MODIS_MOD09GA_006_NDWI, accessed on 1 October 2025)
Table 2. EWM-based static weights of the five indicators for heat vulnerability assessment.
HVI IndicatorEntropy (E)Redundancy (D)Weight (W)
POP0.8620.1380.313
GDP0.7080.2920.664
NDBI0.9990.0010.003
NDVI0.9930.0080.017
NDWI0.9990.0010.003
Disclaimer/Publisher’s Note: The statements, opinions and data contained in all publications are solely those of the individual author(s) and contributor(s) and not of MDPI and/or the editor(s). MDPI and/or the editor(s) disclaim responsibility for any injury to people or property resulting from any ideas, methods, instructions or products referred to in the content.