Article

Are Sport Clubs Mediating Urban Expressive Crimes?—London as the Case Study

1
Department of Informatics, King’s College London, London WC2B 4BG, UK
2
Haringey City Council, London N22 8HQ, UK
3
London Sport, London SE1 4YB, UK
*
Author to whom correspondence should be addressed.
ISPRS Int. J. Geo-Inf. 2025, 14(11), 409; https://doi.org/10.3390/ijgi14110409
Submission received: 23 August 2025 / Revised: 14 October 2025 / Accepted: 20 October 2025 / Published: 22 October 2025

Abstract

The study is referenced by interdisciplinary theories, i.e., routine activity, and social cohesion, to investigate the impacts of sport clubs and events on London’s expressive crimes at varied geographical scales, by utilizing Geographical-temporally weighted regression model. It has identified the spatial patterns of effects from sport clubs’ onto local expressive crimes among London wards, with several boroughs standing out for their being significantly affected. The case study in the home borough of the Hotspur Football Club has further been conducted, by proving the seasonal influences of sports clubs on reducing youth violence within school terms. It was also found disproportional increases in expressive crimes on Premier League match days, especially when receiving the results of draw. The data-driven evidence has generated insights on localized policies and strategies on developing tailored sports to support local young people’s development; pinpointing the optimisation of police forces resources on stop and search practices during sports events in hot spot stadiums. The methodology and workflow had also been proved with high replicability into other UK cities.

1. Introduction

The effects of sports on local crimes have been subjected to ongoing debates in recent decades, with divergent findings. Well-designed sport programs have long been expected to prevent crime [1] in particular juvenile delinquency [2], by developing protective factors in youth violence to reduce reoffending [3], antisocial behaviors, and improve psychological well-being [4]. These findings are normally informed by classic criminological theories, for example Routine Activity Theory [5] had highlighted the effects of reliable guardianship on crime prevention, where structured supervision received from sport programs [6] for young children and adults, or a routine social network maintained through footfall clubs [7] activities, occupies their time (e.g., during after-school hours) to reduce exposure to potential negative influences or crime opportunities [3], hence contributing significantly to the reduction and prevention of youth crimes in urban areas. Social cohesion theories [8] pinpointed the important sense of belonging promoted by coaches or mentors in sports programs, to disrupt downward trajectories into delinquency and amplify their pro-social behaviors, through improved self-efficacy [9] like self-esteem, resilience, anger control, and mental well-being. However, a significant limitation for current bulk of research is that, majority of them rely on literature reviews, resulting in a scarcity of empirical, data-driven findings that incorporate the massive potential of urban big data and advanced computing techniques.
On the other hand, major sporting events, such as Premier League football matches, are instead more related to increased volatile interactions in the immediate area surrounding the stadium [10] due to the concentration of the crowd and a measurable increase in reports of domestic violence [11]. According to Routine Activity Theory [5], stadium during spectator sport events becomes a crime attractor by attracting an overwhelming influx of people, motivated offenders and suitable targets, to the place, hence increasing the crime opportunities. It also elevated the chance of violent crimes in the vicinity of a stadium on such event days [12] when large crowds gathered, especially between fans from rival teams. Besides, on-field violence such as fan assaults on players and post-game riots, as well as athlete misconducts [13], reveals further interplay between sport norms [14] and the often intense passions associated with sports, making it a significant area of study and concern. However, to date, there has been limited quantitative research that directly maps the association between sports events and violent crimes, thereby restricting the disclosure of direct evidence for future even safety management planing.
The double sided effects of sports on crimes from empirical literature had led to this research impetus on exploring the real-life date in London, hence to better suggest policing strategies and practices based on the generated evidence.

2. Background

Sports have long been taken as a long-term deterrent measure to prevent crime, since it being the vehicle to develop crucial skills and traits that act as deterrent factors against youth violence, such as self-control, teamwork and cooperation, prosocial behavior and skills to solve conflict [15]; providing mentorship and sense of belonging to improve social bonds [16] as protective element against violence; and expressing stress with positive psychological outcomes upon improved self-esteem and mental wellbeing [3]. The Mayor of London announced in 2025 that the England-first Violence Reduction Unit, VRU, is investing a further £1 million to provide sports and physical activities to young people at the highest risk of being affected by violence in London [17]. This initiative, as one of the actions in response to the deterioration of knife crime and violence problems in England over the past decade [18], especially the over 21% increase in knife or sharp instrument incidents in London between 2022 and 2023 [19], has been informed of the violence-deterrent effects of regular sports programs in urban context. College of Policing published a review report in 2023 [3] on the positive influences of sports on crime prevention and reduction of reoffending, which showed improved individual attitudes towards offending and anger control. Community based sport activities such as sport clubs had been increasingly recognised as crime reduction and prevention tools. Based on the theory of social cohesion [8], team sports can strengthen social bonds [16] through better self-regulation, therefore reducing potential aggressions [20], and improving aspirational goals for marginalised young people [21]. Sport clubs can also provide job skills, scholarships, and legitimate economic alternatives to crime. The state-of-the-art research focused on critical discussions on theoretical reasons linking sports and crimes, reviewed massive international empirical studies against various social contexts, with quantitative evidence presented to evaluate the positive effects of sport programs as interventions for at-risk adolescents [2], but rare work has been done yet to vividly map such associations between sports and crime over space and against social context.
Major sporting events and large public gatherings (Figure 1) have complex and multifaceted effects on urban crime; especially with the highlight increases in disorderly conduct, theft, and violence [22]. The debates centred around the potential volatile environment sparked by heated emotions and alcohol, as well as the spikes of domestic violence after unexpected loss results [23]; as well as the potential displacement of crime incurred by major events, either spatially or temporally. For example, the short-term sparks of anti-social behaviors and crimes around football stadiums in England cities [24]. But displacement intensity may vary by crime types, for example, increased property crimes near stadiums hosting matches at 7% per additional 10,000 supporters left under-protected [25]. Although decades-long discussions on the diverse two-sided effects of sports on violence and crimes had been well testified by criminological and sociological research, there is a lack of systematic validation to map the holistic associations between crime levels, possible reduction effects and sports infrastructures or sports-related events, in presentation of solid data-driven evidence towards the policing practitioners. Hence, sporting arenas and surrounding areas are referred as “crime attractor” [26], when experiencing the convergence of large crowds would attract more crime opportunities, which highlights the need for knowledge on spatial relations influence crimes driven by emotional release and social conflict. Such types of crimes were normally categorised as expressive crimes, including violent offences, public disorder, and certain forms of drug-related crime [27].
Expressive crimes tend to exhibit apparent spatial temporal patterns referenced to Crime Pattern Theory [26]. Empirical studies methods explored the spatial influence of urban environment on serious outdoor violence [28] through advanced modelling and composite indicators [29], investigated the trajectory changes of expressive crime patterns around global emergency such as pandemic [30] or local holidays [31], to better inform policing strategies and practices tackling crimes [32]. In light of such, this research is designed to explore the influences of sports on London’s expressive crimes with multi-sourced data and cutting-edge methods, in the aim of providing data-driven evidence for local city councils and domain organisations on sports infrastructure development, as well as for future predictive policing strategies around periodic sports events. To fulfill the aim, the following objectives are expected to be achieved: (1) Map out the regional associations between London’s sport clubs and expressive crimes in the observation period; (2) Explore crime changes pre- and para- major football events held in selected case study stadiums both spatially and temporally; (3) Investigate the driving mechanism for such changes with a case study. Finally, a replicable methodological pipeline will be developed for future follow-up work and shared with stakeholders.

3. Materials and Methods

3.1. Data Source

Our data sources are summarised in Table 1.
First, the study area is London, which is administratively divided into 633 wards. These wards are adopted as the units of analysis. To further examine the short-term influence of major sports events (specifically football matches) on crime, we focus on a case study of the London Borough of Haringey. Haringey is a densely populated and socio-economically diverse borough in North London, comprising both affluent neighbourhoods and deprived areas. Crucially, it is home to the Tottenham Hotspur Stadium, the ground of one of the most prominent Premier League teams. This makes Haringey a suitable setting for investigating the potential impact of football events on crime.
As presented in Table 1, our crime data come from two sources. The first is the UK Police Open Data Portal, which provides point-level crime records across London, including their geographic location, type, and month of occurrence. These records are aggregated to the ward level in order to analyse the spatial relationship between crime and the distribution of sports clubs across the city. The second dataset is provided by Haringey Council and contains daily ward-level crime counts for 2023. This dataset addresses a key limitation of the open police data—namely, that it only records the month of occurrence—thus allowing us to capture short-term variations in crime and their association with football matches.
Because different crime types reflect fundamentally different motivations and opportunities, we categorise criminal records in London accordingly and conduct separate analyses for each category. Following a well-established typology in criminological literature [33,34], we divide crime into two broad types: acquisitive crime and expressive crime. This classification, which is widely applied in criminology, is based on contrasting motivational structures. Acquisitive crimes are primarily committed for material gain, with common examples including theft, robbery, and burglary. Such crimes are typically characterised by instrumental and rational behaviour, where the central aim is economic profit [35]. By contrast, expressive crimes are not driven by economic motives, but instead by emotional release, social conflict, or identity expression. Examples include violent offences, public disorder, and certain forms of drug-related crime [27].
Drug-related offences require particular consideration. While some activities, such as large-scale drug trafficking, are clearly acquisitive in nature, a substantial body of research suggests that drug use and possession—particularly within street culture, subcultural groups, or marginalised communities—often serve expressive purposes. Such behaviours may act as markers of identity, as acts of resistance against social norms and institutions, or as mechanisms of emotional release [36]. Moreover, some studies frame drug use as a form of “victimless crime”, highlighting its symbolic rather than instrumental role [37]. Based on this motivational framework, we classify drug-related offences as expressive crimes in our analysis.
To establish regression models estimating the influence of sports clubs on crime, we incorporate a set of socio-demographic covariates as control variables. These variables, obtained from the UK Census 2021 and the Index of Multiple Deprivation (IMD), capture the demographic composition and socio-economic conditions of each Lower Super Output Area. To ensure consistency with the geographical units of our crime and sports club data, we calculated the average values of census and IMD variables across all LSOAs within each ward, and used these averages to represent the corresponding ward-level values.
In addition, because mobility is widely recognised as a key driver of crime patterns, we include daily passenger flow data from Transport for London (TfL). These data are measured by tap-in and tap-out counts at Underground stations and serve as a proxy for ward-level human movement. The raw data report the daily number of entries and exits at each station. We first sum the daily entries and exits to calculate the total tap count at the station level. However, given that Underground stations are sparsely distributed within Haringey (with only 7 stations located inside its boundary) and that passenger flows are likely to extend into neighbouring wards, we apply the Inverse Distance Weighting (IDW) method to interpolate station-level data to the ward level.
The IDW method, originally proposed by Shepard [38], assumes that the influence of an observation decreases with distance. For the centroid of ward j, the interpolated passenger flow value (denoted as TapIDW) is calculated as:
TapIDW j = i = 1 n w i j T i i = 1 n w i j ,   where   w i j = 1 d i j p
Here, T i represents the total tap count at station i on a given day, d i j is the Euclidean distance between station i and the centroid of ward j, and p is the power parameter controlling the rate of distance decay (set to 2 in this study). This weighting scheme ensures that stations closer to a ward exert stronger influence on its interpolated value, while distant stations contribute less. The resulting TapIDW variable is thus constructed at a daily temporal scale and an administrative ward spatial scale.

3.2. Methods

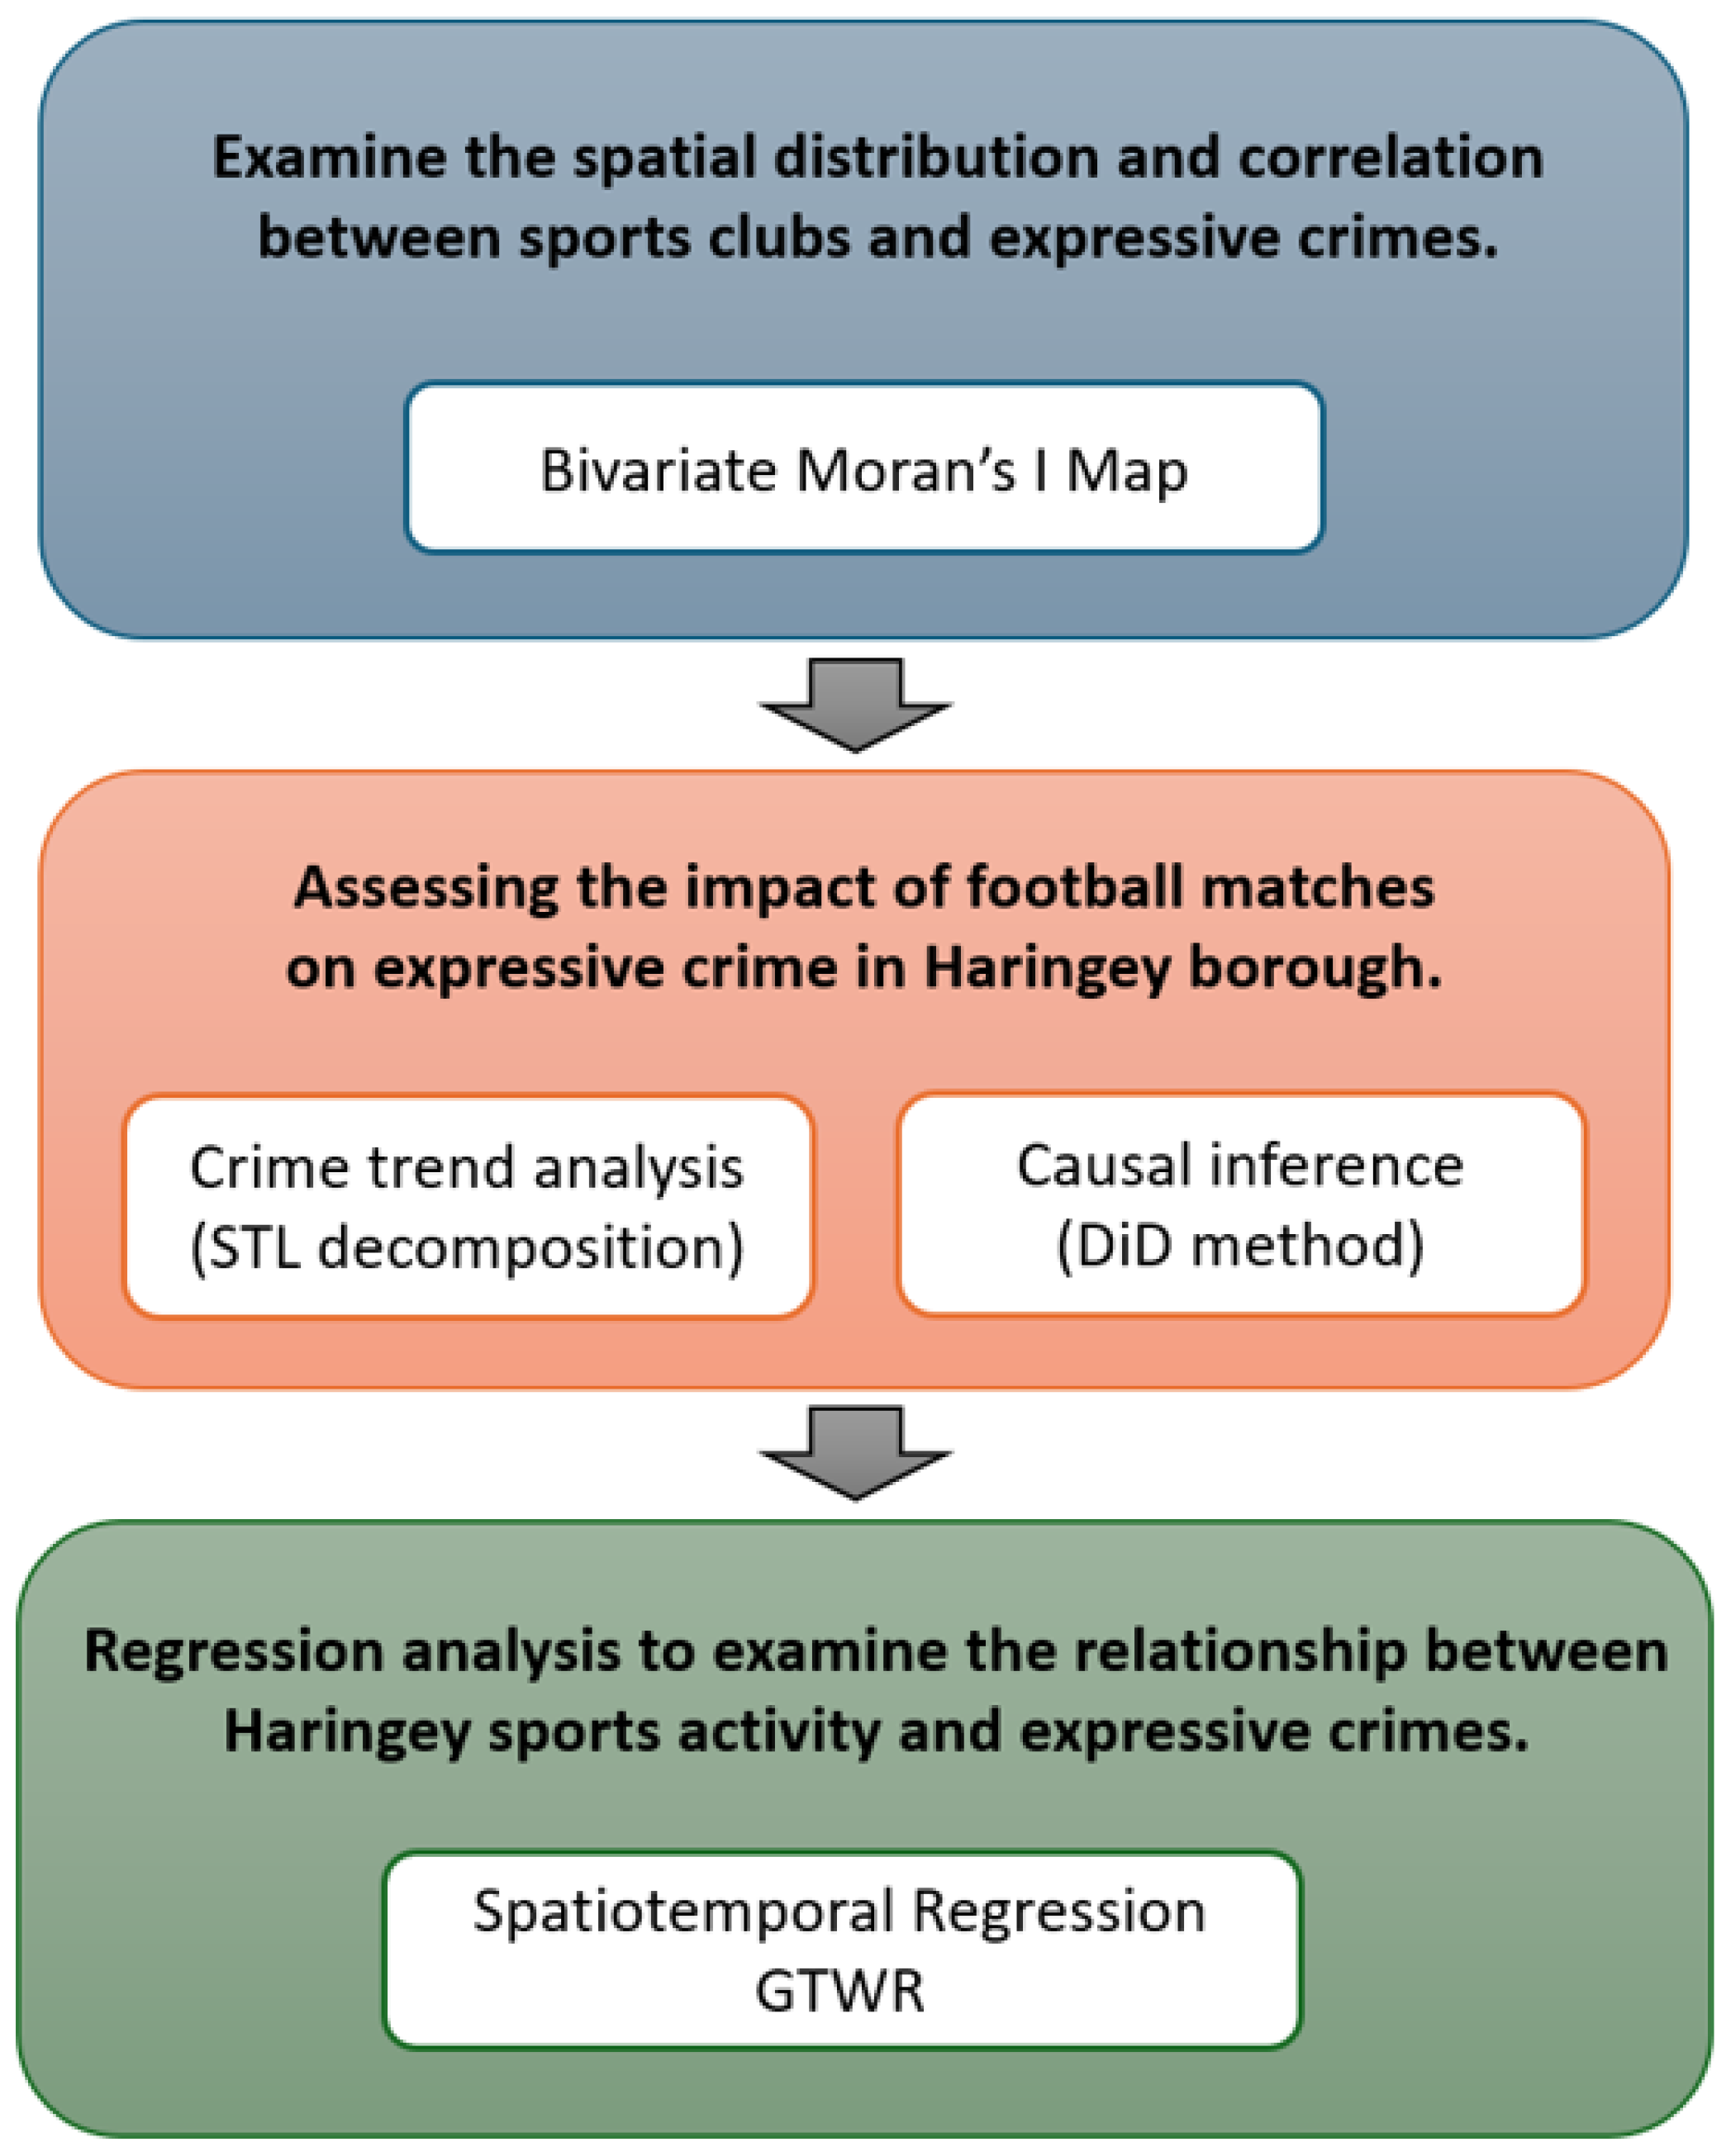
This study adopted a multistage analytical framework to explore the relationship between sports-related activities and expressive crime in London, in order to realise research objectives, respectively. Our research Flow chart is shown on Figure 2.

3.2.1. Bivariate Moran’s I Map

Firstly, local bivariate Moran’s I mapping was adopted to visualise the spatial associations between expressive crime rates and sports clubs among London wards, identifying spatial hotspots where they co-occur at high intensities. Moran’s I [39] is one of the most widely used spatial statistics for detecting spatial autocorrelation, which reveals whether a variable exhibits clustering or dispersion in geographic space. However, univariate Moran’s I only captures the spatial dependence of a single variable and cannot measure the spatial relationship between different variables. To address this limitation, Bivariate Moran’s I was proposed [40,41] to quantify the correlation between one variable in a given area and another variable in neighboring areas. In this study, we further employ Local Bivariate Moran’s I [40,41,42] to identify the local spatial dependence between the number of sports clubs and the expressive crime rate across London wards. Unlike global statistics, the local bivariate Moran’s I not only reflects overall spatial dependence patterns but also locates specific clusters and outliers. By visualizing these results through mapping, we can reveal spatial heterogeneity across wards, providing detailed spatial insights into the relationship between sports resources and crime risk.
The Local Bivariate Moran’s I statistic can be expressed as:
I i X Y = ( x i x ¯ ) m x 2 j w i j ( y j y ¯ )
where:
  • x i : the value of variable X (number of sports clubs) at location i;
  • y j : the value of variable Y (sexual offence rate) at neighboring location j;
  • w i j : spatial weights matrix (defined by contiguity or distance from location i to location j);
  • m x 2 : variance of variable X.
In this study, we first construct a spatial weights matrix to define the spatial neighborhood relationships among London wards, using either the Queen contiguity. Based on this matrix, we compute the Local Bivariate Moran’s I statistic to examine the local spatial dependence between the number of sports clubs in a given ward and the expressive crime rates in neighboring wards. Statistical significance is assessed using a Monte Carlo randomization test with 999 permutations. Finally, the results are visualized on maps and classified into four quadrants—high–high, low–low, high–low, and low–high—to illustrate the patterns of spatial clustering and outliers across different areas. We calculated the Moran’s I statistic using the Moran_Local_BV function from the Python library esda (Python Spatial Analysis Library).

3.2.2. Seasonal Trend Decomposition Using Loess

Secondly, a case study on sport events’ influences of expressive crimes had been conducted around Tottenham Hotspur Stadium, with its nearest rail station Northumberland Park as the observing point. Sankey diagrams and seasonal trend decomposition using Loess (STL) were deployed, to visually compare crime patterns between match days and non-match days, so can validate the temporal association between football events and expressive crime surges.
Seasonal-Trend decomposition based on Loess (STL) is a non-parametric method that decomposes a time series into three components: trend ( T t ), seasonal ( S t ), and remainder ( R t ), where t denotes time at the daily level. It was first proposed by Cleveland et al. [43]. STL provides greater flexibility and robustness when dealing with nonlinear trends and seasonal variations.
Given a time series y t , STL decomposes it as follows:
y t = T t + S t + R t
Here, T t denotes the trend component, S t the seasonal component, and R t the remainder. The key step in trend extraction is to apply Locally Estimated Scatterplot Smoothing (LOESS) technique to the deseasonalised series.
First, the seasonal component is removed from the original series to obtain the deseasonalised sequence:
y t = y t S t
Then, LOESS smoothing is applied to y t to estimate the trend T t , which can be expressed as:
T ^ t = i N t w i ( t ) · y i
where N t is the set of observations within a moving window centred at t, and w i ( t ) is the LOESS kernel weight satisfying the normalisation condition w i ( t ) = 1 . The weights are commonly defined by a tricube kernel:
w i ( t ) = 1 i t d 3 3 ,   for   | i t | < d
Here, d represents the half-width of the smoothing window, which controls the level of trend smoothness. A larger window produces a smoother trend but is less sensitive to local variations. STL iteratively updates both S t and T t until a stable decomposition is achieved.
The advantages of STL trend extraction can be summarised as follows. First, the trend component does not rely on specific parametric assumptions, allowing the method to adapt to nonlinear structures. Second, LOESS smoothing is robust and effectively reduces the influence of outliers [44]. Third, STL offers high interpretability, making it suitable for modelling time series with complex and dynamic patterns. For these reasons, this study adopts STL as a core tool for time series decomposition in empirical analysis. Our Seasonal-trend decomposition was performed using the STL method from the Python package statsmodels.tsa.seasonal, specifically STL.

3.2.3. Difference-in-Differences Approach

The Difference-in-Differences (DiD) framework is a widely used quasi-experimental strategy for causal inference. It identifies treatment effects by comparing changes in outcomes between treated and control units before and after an intervention. The central assumption is that, absent the intervention, treated and control groups would have followed parallel trends in the outcome variable. By exploiting both temporal and cross-sectional variation, the DiD design effectively removes time-invariant unobserved heterogeneity across units and common shocks that affect all units simultaneously.
This framework is particularly well suited to the present research setting. Football match days can be viewed as a short-lived, plausibly exogenous intervention affecting local crime dynamics. The ward containing Northumberland Park rail station, which hosts the football stadium, was defined as the treated unit, while other wards within the H district served as natural controls. By contrasting crime trajectories in the treated ward with those in control wards, the DiD design enables us to isolate the causal effect of match days from broader temporal fluctuations in crime and from persistent spatial heterogeneity across wards.
Formally, the following DiD regression specification was estimated:
Crime i t = α + β ( MatchDay t × Treated i ) + γ X i t + δ i + λ t + ϵ i t
where Crime i t denotes the number of expressive crimes in ward i at time t (daily level); MatchDay t is a binary indicator equal to one on football match days; Treated i equals one for the treated ward and zero otherwise; X i t represents time-varying covariates; δ i and λ t capture ward and time fixed effects, thereby controlling for unobserved spatial and temporal heterogeneity; and ϵ i t is the error term.
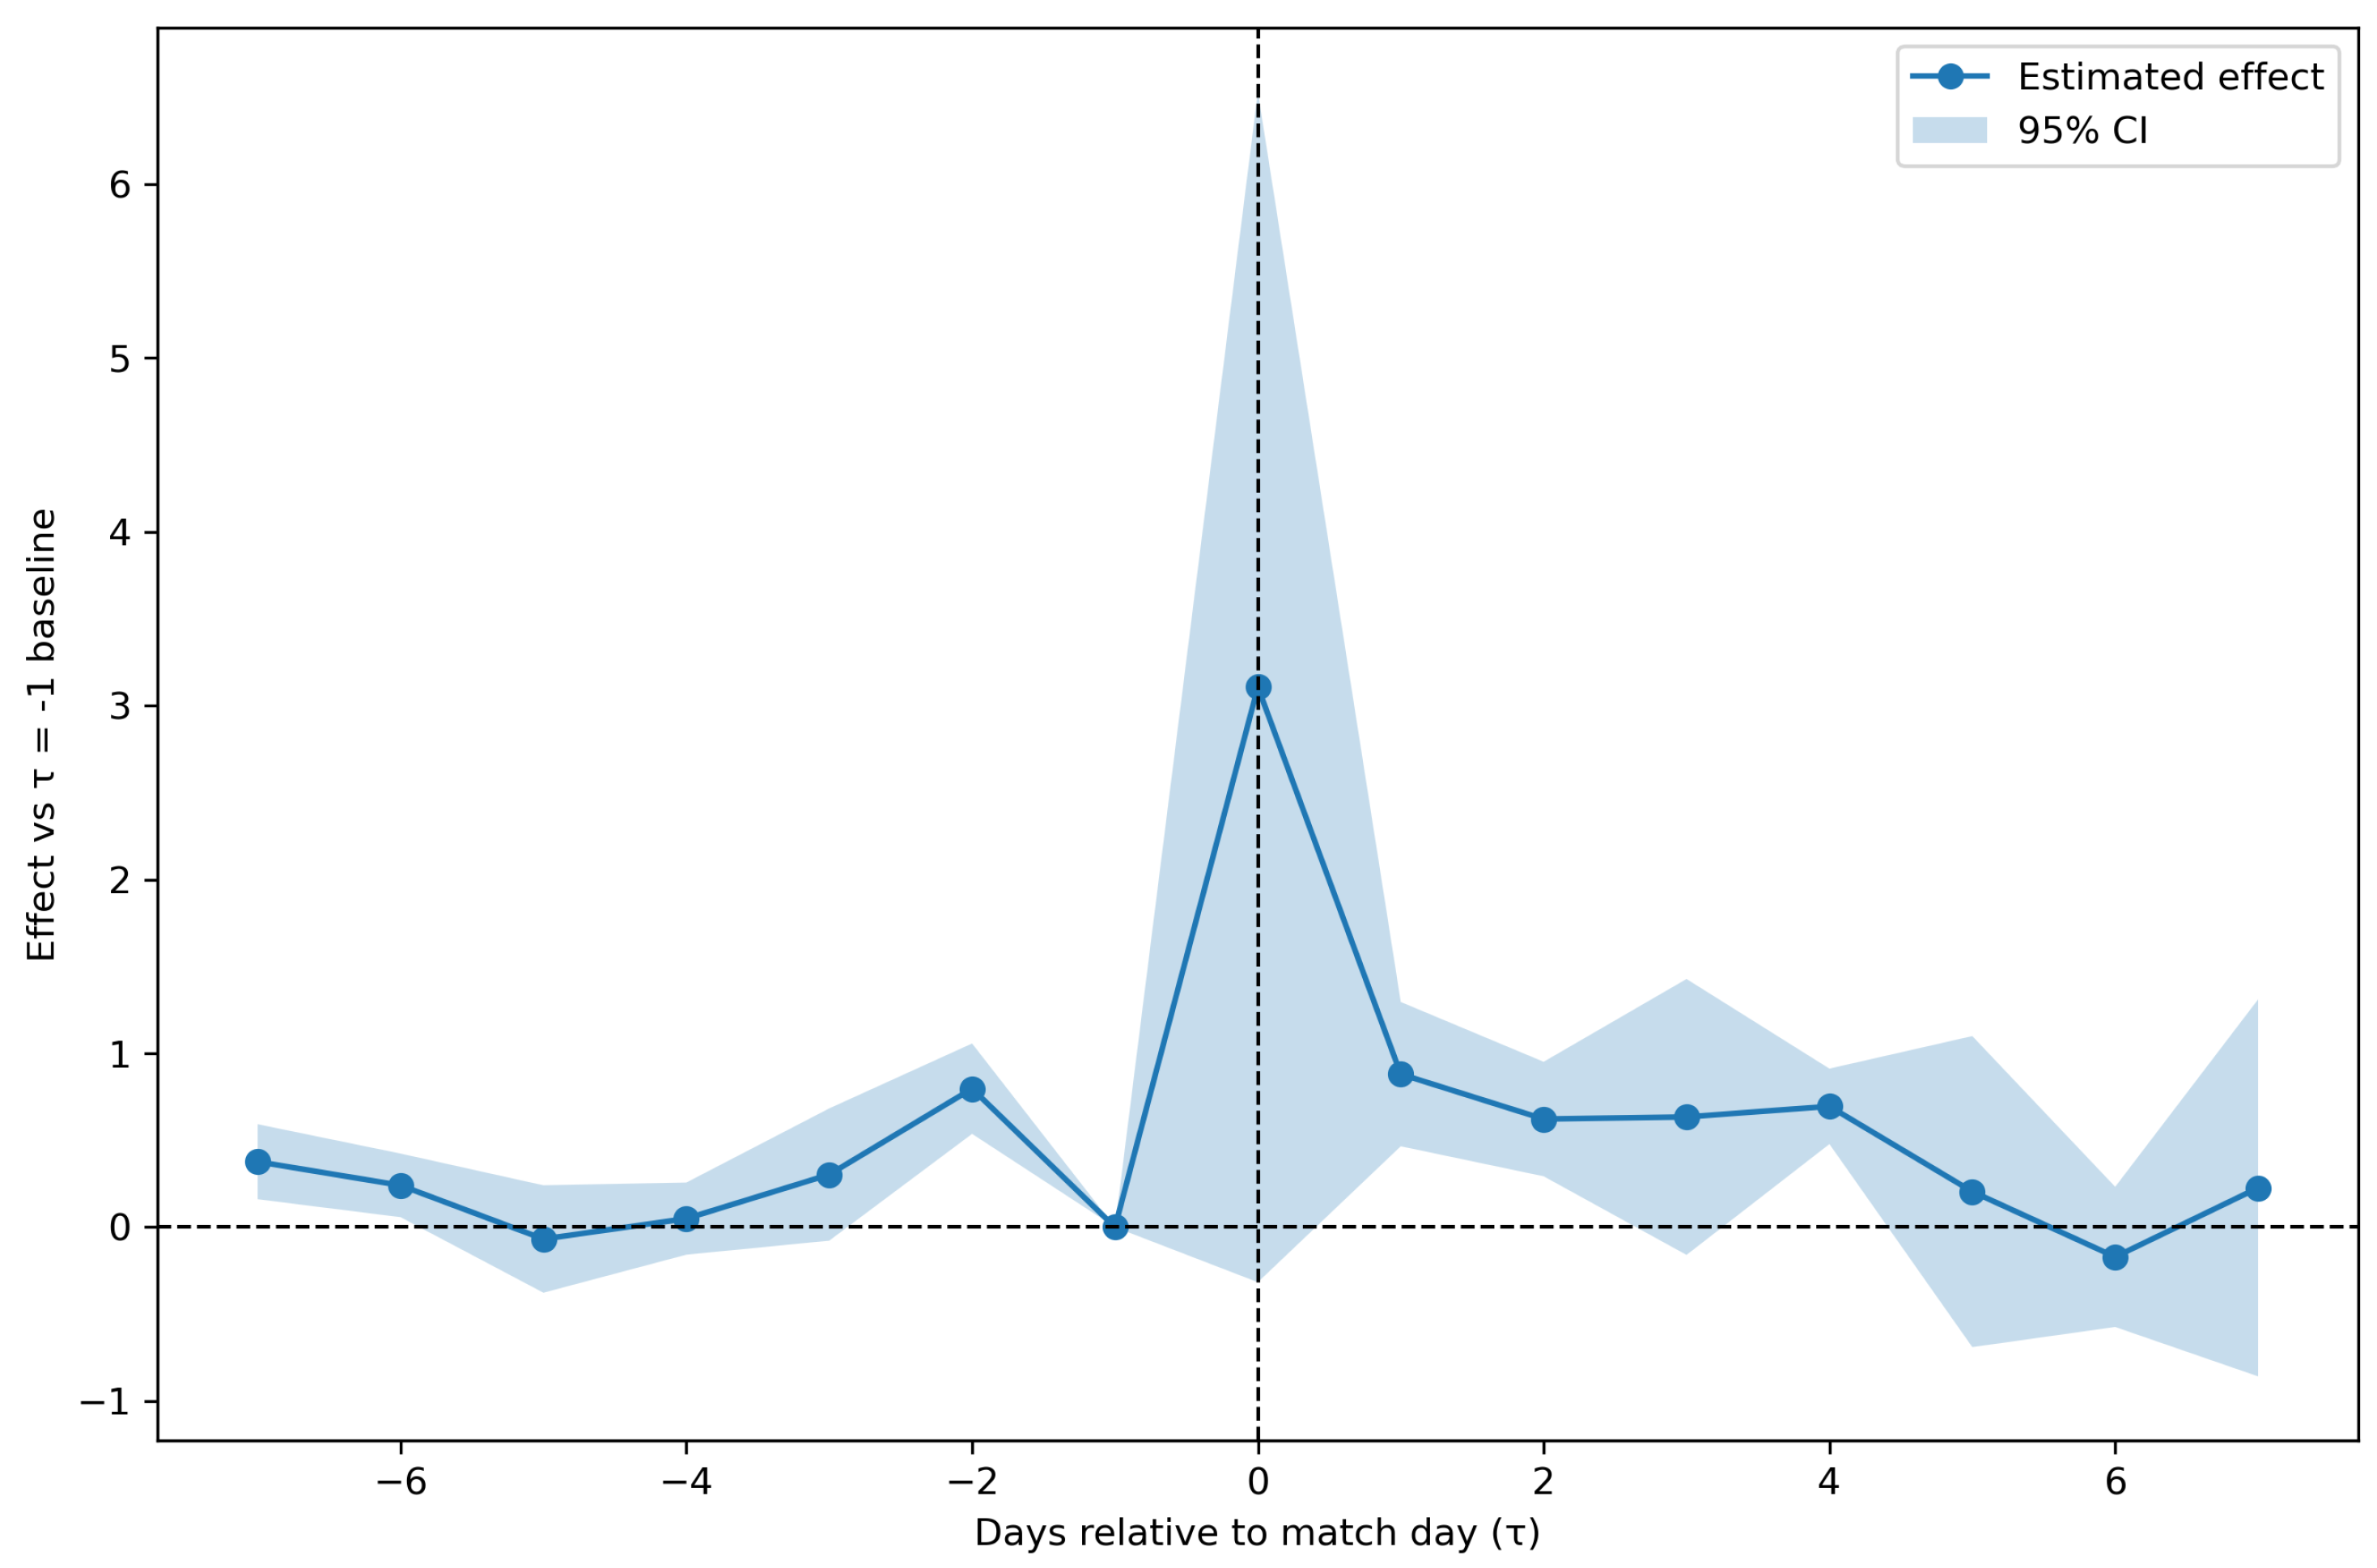
A critical assumption underlying the validity of the DiD design is that of parallel trends. To assess this, we employed an event-study framework, which is particularly appropriate in this context given that football matches represent one-day shocks rather than sustained interventions. For each match date, we constructed a symmetric window spanning seven days before and seven days after the event ( τ [ 7 , 7 ] ). Event-time indicators were interacted with the treatment assignment, with τ = 1 designated as the reference period. The specification included ward fixed effects and event fixed effects, thereby controlling for unobserved ward-specific factors and event-specific shocks.
The event-study regression was estimated via OLS with standard errors clustered at the ward level. The estimated dynamic treatment effects β ^ ( τ ) were then plotted across event time, accompanied by 95% confidence intervals. Pre-treatment coefficients ( τ < 0 ) that were close to zero and statistically insignificant provided support for the parallel trends assumption. A sharp and statistically significant deviation at τ = 0 reflected the immediate causal impact of match days on crime, while post-treatment coefficients ( τ > 0 ) allowed us to explore whether any lagged or persistent effects were present.
All DiD and event-study estimations were implemented in Python, primarily using the statsmodels, patsy, and matplotlib libraries.

3.2.4. Geographically and Temporally Weighted Regression (GTWR)

To further investigate the mechanisms behind the space–time variation of expressive crimes, we employ a Geographically and Temporally Weighted Regression (GTWR) model. GTWR extends GWR by allowing regression coefficients to vary not only over space but also over time, so that observations closer to a target location and date receive larger weights in the local estimation. In this way, GTWR captures dynamic and localised effects that may be masked by global models, such as short-lived changes in population mobility around the target venue.
Formally, the GTWR model is written as:
Crime i t   =   β 0 ( u i , v i , t i )   +   k = 1 p β k ( u i , v i , t i )   x i k   +   ε i t ,
where ( u i , v i , t i ) are the spatial and temporal coordinates of observation i, x i k are covariates, and β k ( u i , v i , t i ) are location- and time-specific coefficients. Here, t i refers to time measured at the monthly level. While our crime dataset is originally available at the daily level, we aggregated it to monthly intervals for GTWR modeling. This decision was made for several practical and methodological reasons. First, daily crime counts at the ward level are often extremely low, resulting in a sparse and unstable input matrix that leads to numerical errors during model fitting. Second, daily data is highly volatile and prone to outliers, which can cause poor model convergence and low explanatory power (e.g., low R 2 values). By contrast, monthly aggregation smooths out short-term noise and allows for the capture of more stable, long-term spatial patterns. Therefore, to improve model robustness and interpretability, we use monthly-level crime data in the GTWR analysis.
Each coefficient vector at location i ( u i , v i , t i ) is estimated by locally weighted least squares:
β ^ ( u i , v i , t i )   =   X W i X 1   X W i y ,
with W i = diag { w i j } a diagonal weight matrix. The weights combine spatial and temporal kernels so that nearer observations in space and time contribute more:
w i j   =   K s   d i j ( s ) ;   b s   ×   K t   d i j ( t ) ;   b t ,
where d i j ( s ) is the spatial distance between location i and j, d i j ( t ) is the temporal distance (e.g., absolute days), K s ( · ) and K t ( · ) are spatial and temporal kernel functions, and b s , b t are the corresponding bandwidths. We adopt adaptive spatial bandwidths (i.e., k-nearest neighbours) to accommodate uneven spatial data density, and a temporal span for b t to capture historic crime trends.
Bandwidths (and kernel forms) are chosen by minimising an information criterion or cross-validation score to balance bias and variance. In practice, we use the Python package mgtwr: SearchMGTWRParameter selects the spatial nearest-neighbour size and the temporal span (and kernel options) via AICc/CV search, and MGTWR fits the final model and returns local coefficients, standard errors, and local goodness-of-fit. This data-driven selection ensures that the degree of smoothing adapts to both spatial clustering and temporal volatility in the outcome.
With regard to the explanatory variables, we focused on two core factors: (i) population mobility, measured by the TapIDW indicator based on metro smart-card data using inverse distance weighting; (ii) sports-related activities, represented by the number of sports clubs (Clubs). In addition, to reduce potential confounding effects arising from long-term structural differences, we included a set of control variables to reduce bias from long-term structural differences. These controls cover three key dimensions:
First, socioeconomic deprivation was measured using selected subdomains of the 2019 Index of Multiple Deprivation (IMD), such as health and living environment. These variables reflect community vulnerability and the extent of social disorganization. A large body of empirical research and theoretical work has demonstrated a strong association between deprivation and various forms of criminal risk. For instance, relative deprivation theory argues that individuals’ perceptions of being disadvantaged relative to others can increase the likelihood of both property and violent crimes [45]. Moreover, spatial studies have revealed that urban areas with higher levels of deprivation tend to exhibit higher crime rates, often concentrated in city centers where population density and social monitoring are more challenging [46]. Additional studies focusing on youth violence further confirm that children living in highly deprived neighborhoods are significantly more likely to be victims of serious crimes such as knife attacks [47].
Second, demographic structure was captured by including the proportion of different age groups and the sex ratio. Age structure is directly related to the distribution of potential offenders and the availability of informal social controls, reflecting the classic age–crime curve. Recent research finds that cities with a larger share of disengaged youth aged 15–29—those not in school, employment, or the military—tend to have significantly higher homicide rates [48]. In addition, imbalances in the sex ratio, particularly among marriage-age populations, have been found to increase crime rates, as higher proportions of unmarried men are linked to elevated levels of social instability and violence.
Third, the built environment and social activity conditions were represented using population density, the share of land used for transportation, and employment rate. Population density and transportation access influence how often residents interact and how opportunities for crime are structured. According to opportunity theory, higher density areas may have more potential targets and weaker surveillance, increasing the probability of crime [49]. Meanwhile, the employment rate serves as a proxy for social integration and access to legitimate economic opportunities, which are considered protective factors against criminal behavior.
By weighting observations in both space and time and allowing coefficients to vary accordingly, GTWR provides a flexible lens to assess how mobility and sports-related factors relate to expressive crimes locally and dynamically. Mapping the local coefficients and their uncertainty further reveals where and when these relationships strengthen, weaken, or reverse, offering policy-relevant evidence that global averages cannot provide.

4. Results

4.1. Sport Clubs & Expressive Crimes in London

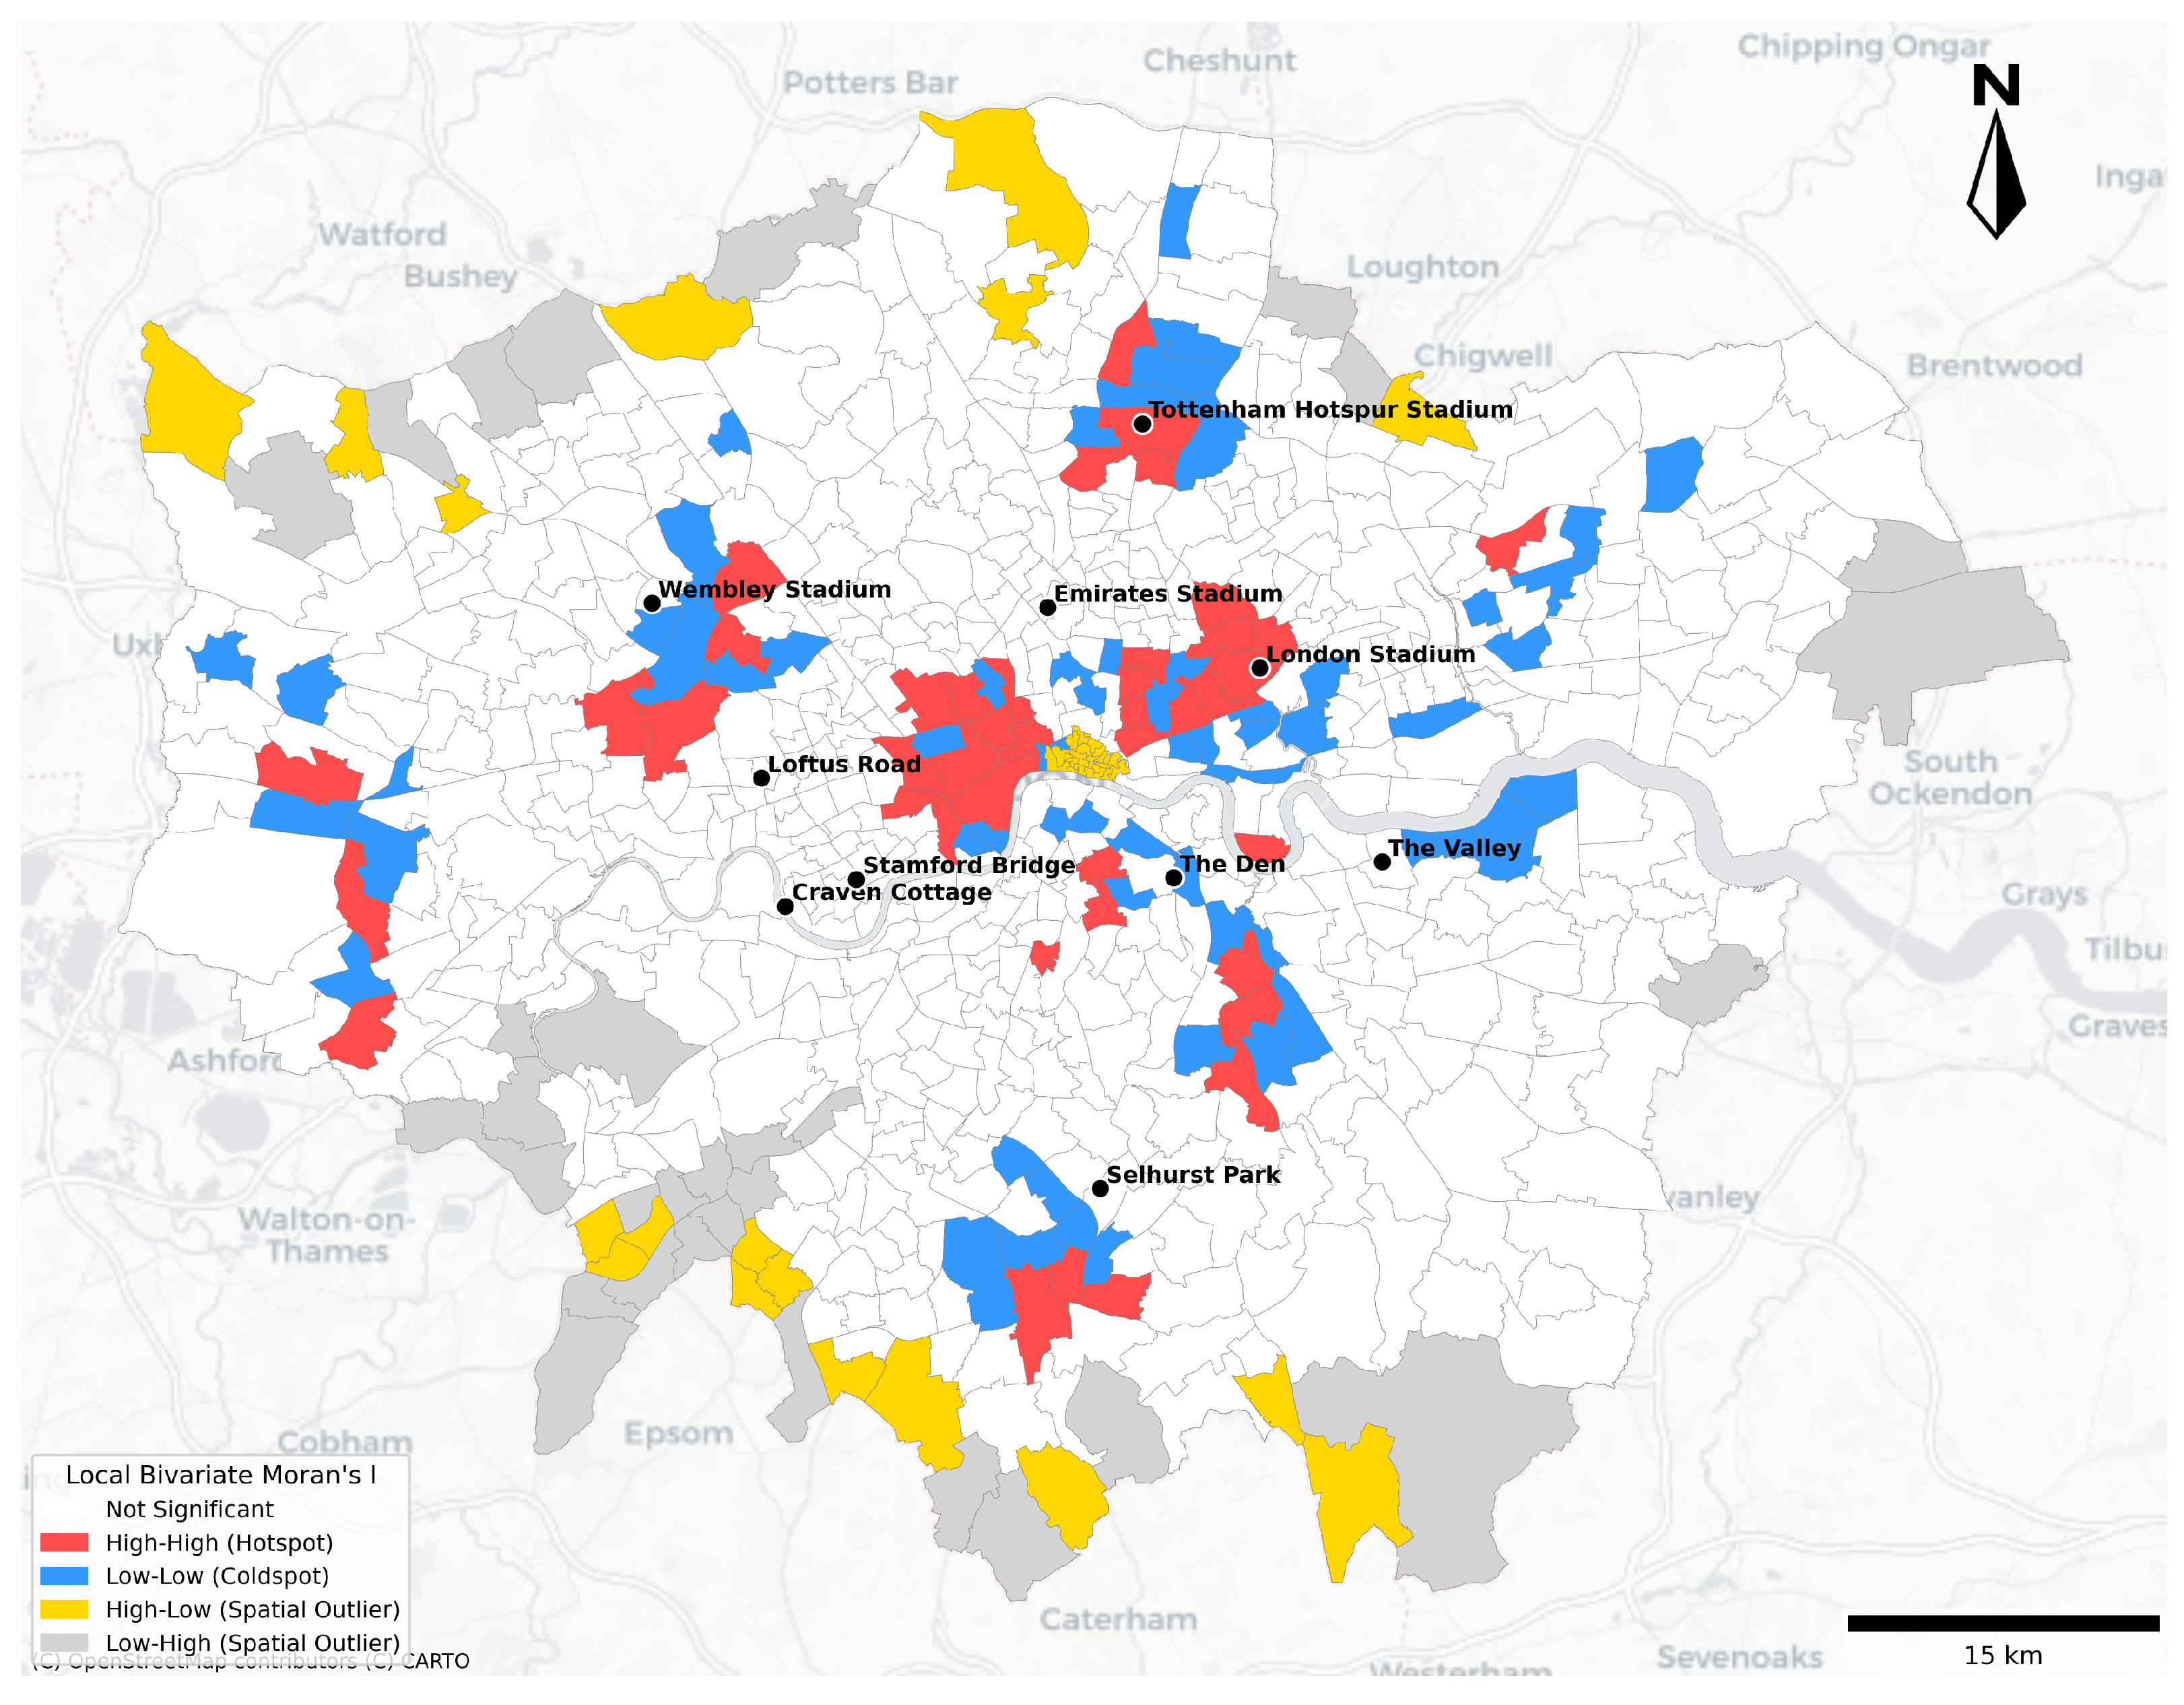
The bivariate Moran’s I map was utilized to illustrate spatial relations of expressive crime and sports clubs (Figure 3), where the red areas were hotspots experiencing high levels of expressive crime and a denser distribution of sport clubs. Most of these hotspots were clustered in central London and in the areas surrounding major sports stadiums (Figure 1).
The hotspot clusters in central London encompassed areas in the south of Westminster and Camden Town, while both districts are major tourist destinations and host to a rich variety of community sports facilities. Apparently, these hotspots were likely to be the result of multiple factors, such as the home of London landmarks and cultural infrastructure, attractions for high tourists mobility, and clusters of social gathering places and restaurants. Other hotspots observed in Figure 3 mainly surround major sports stadiums, for example, the London Stadium (home ground of West Ham United FC), and Queen Elizabeth Olympic Park, which further extended into neighbouring towns such as Bow, Homerton and Bethnal Green. Such a pattern indicates a higher exposure of the denser residential population to the presence of extensive sports facilities, which can pose increased risks of interpersonal frictions or street-level conflicts.
Another eye-catching hotspot cluster is around the Tottenham Hotspur Football Club Stadium in North London. Instead of diffusing into neighbouring towns, this group clearly bordered the areas surrounding Tottenham Central in Haringey borough, hence it is featured as an “event-driven space”. It is assumed that during major sporting events, crowd mobility spikes together with heightened emotional behaviors, which then are thought to trigger the increases of expressive crimes. In addition, such crimes were not limited within the event venues, but spread to surrounding areas. Therefore, the observed cluster in Haringey borough has served as an ideal case study, to examine the impact of match-day activities onto expressive crimes, especially violence.

4.2. Case Study: Stadium Events & Disproportionate Crime Changes

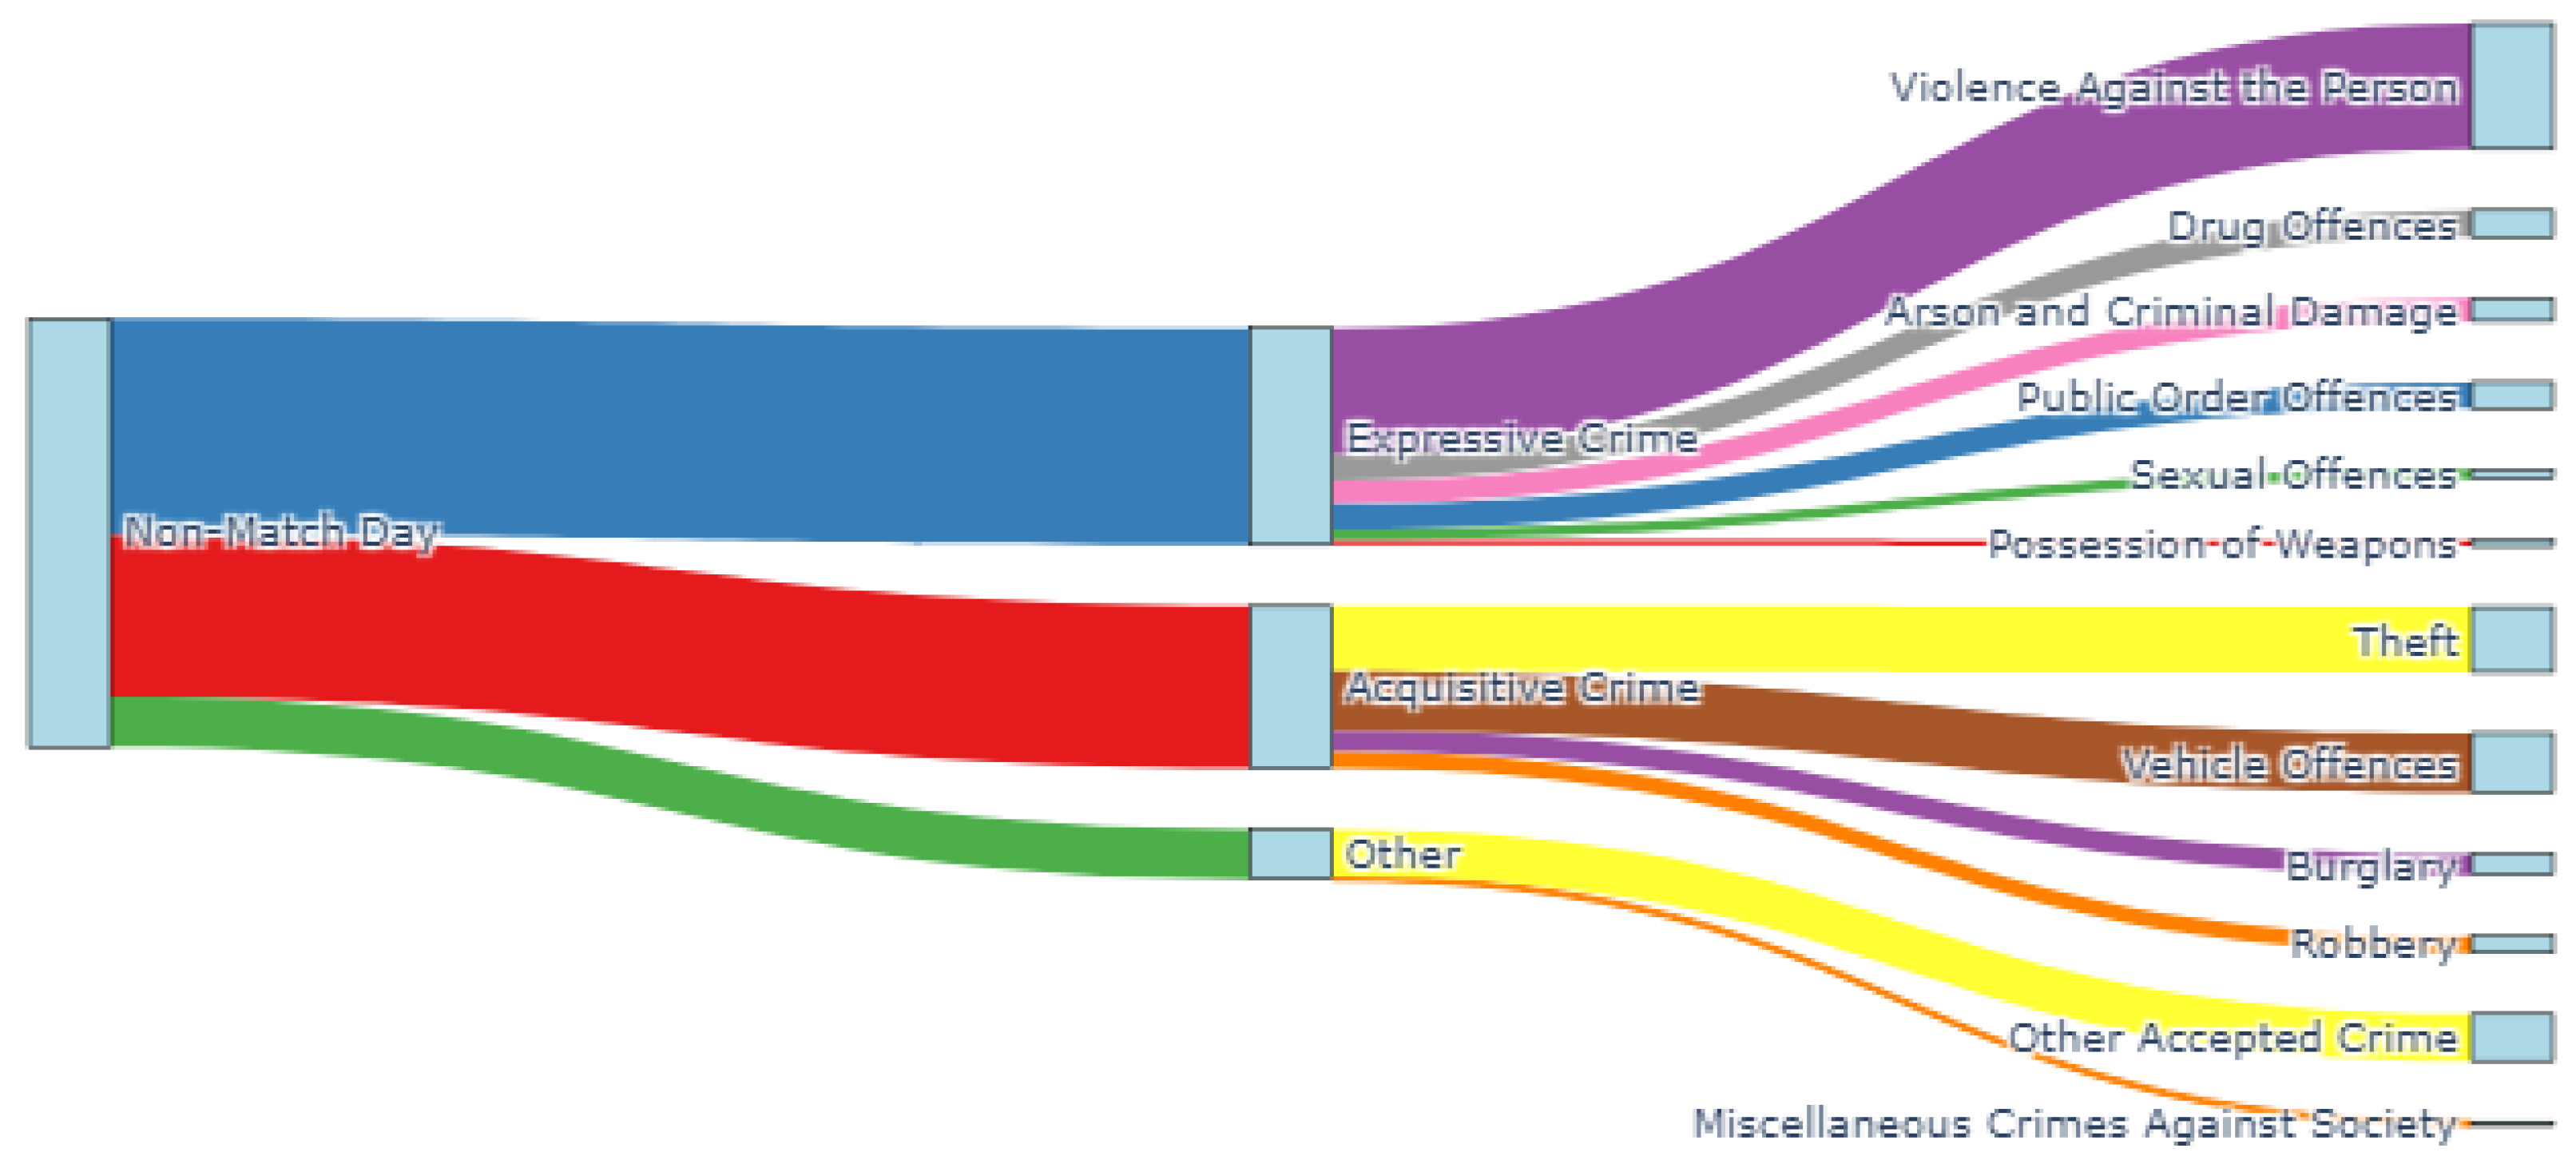
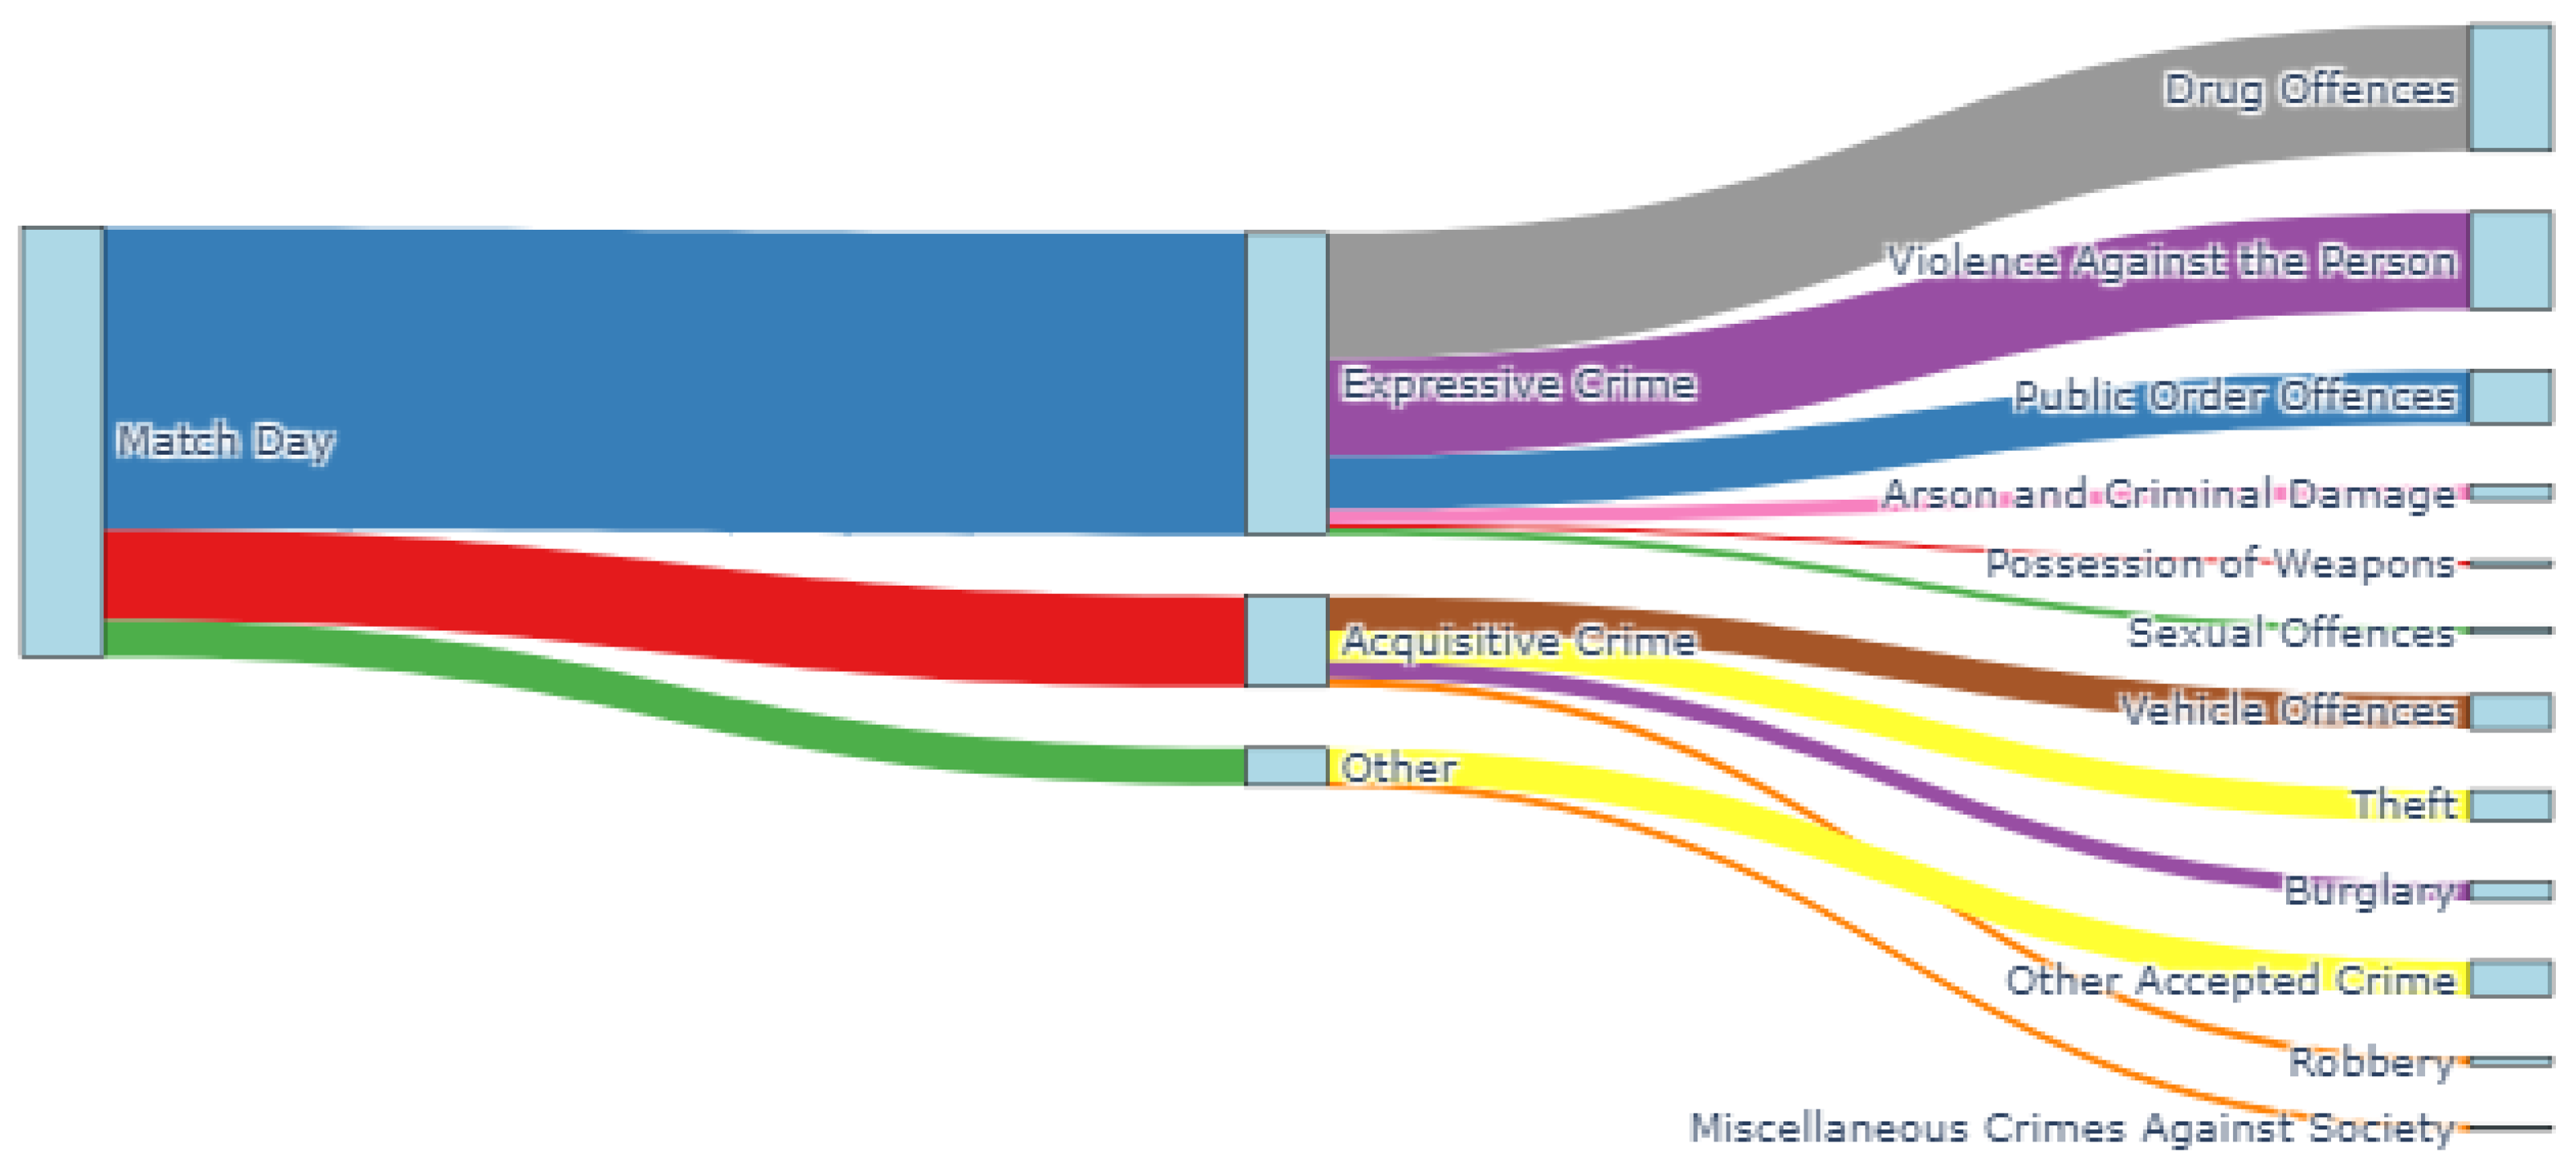
In light of above exploration, Haringey borough had been selected as a case study to investigate the potential impacts of football matches on local crimes. The exploratory analysis that compared types and volumes of recorded crimes between match days and non-match days was visualized using Sankey plot (Figure 4 and Figure 5), taking the home town of Tottenham Hotspur FC Stadium, Northumberland Park, as the research target area.
The Sankey diagrams in Figure 4 and Figure 5 illustrated crime compositions by type in the town of Northumberland Park, on non-match days and match days, respectively. In non-match days (Figure 4), acquisitive and expressive crimes took relatively equal proportions, whilst violent crimes accounted for the vast majority of expressive crimes, at 29.3% for all crimes, and other expressive crime types contributed only marginally; it then followed by theft and vehicle crimes from acquisitive crimes, accounting for 15.1% and 13.8% respectively. In match days (Figure 5), expressive crimes increased to about 70.3% of all crimes, where the top three types are: drug offences increased dramatically to 29.3%, followed by violent crime (22.6%) and public order offences (12.4%). In contrast, the pattern of acquisitive crimes remained comparatively stable regardless of the match days.
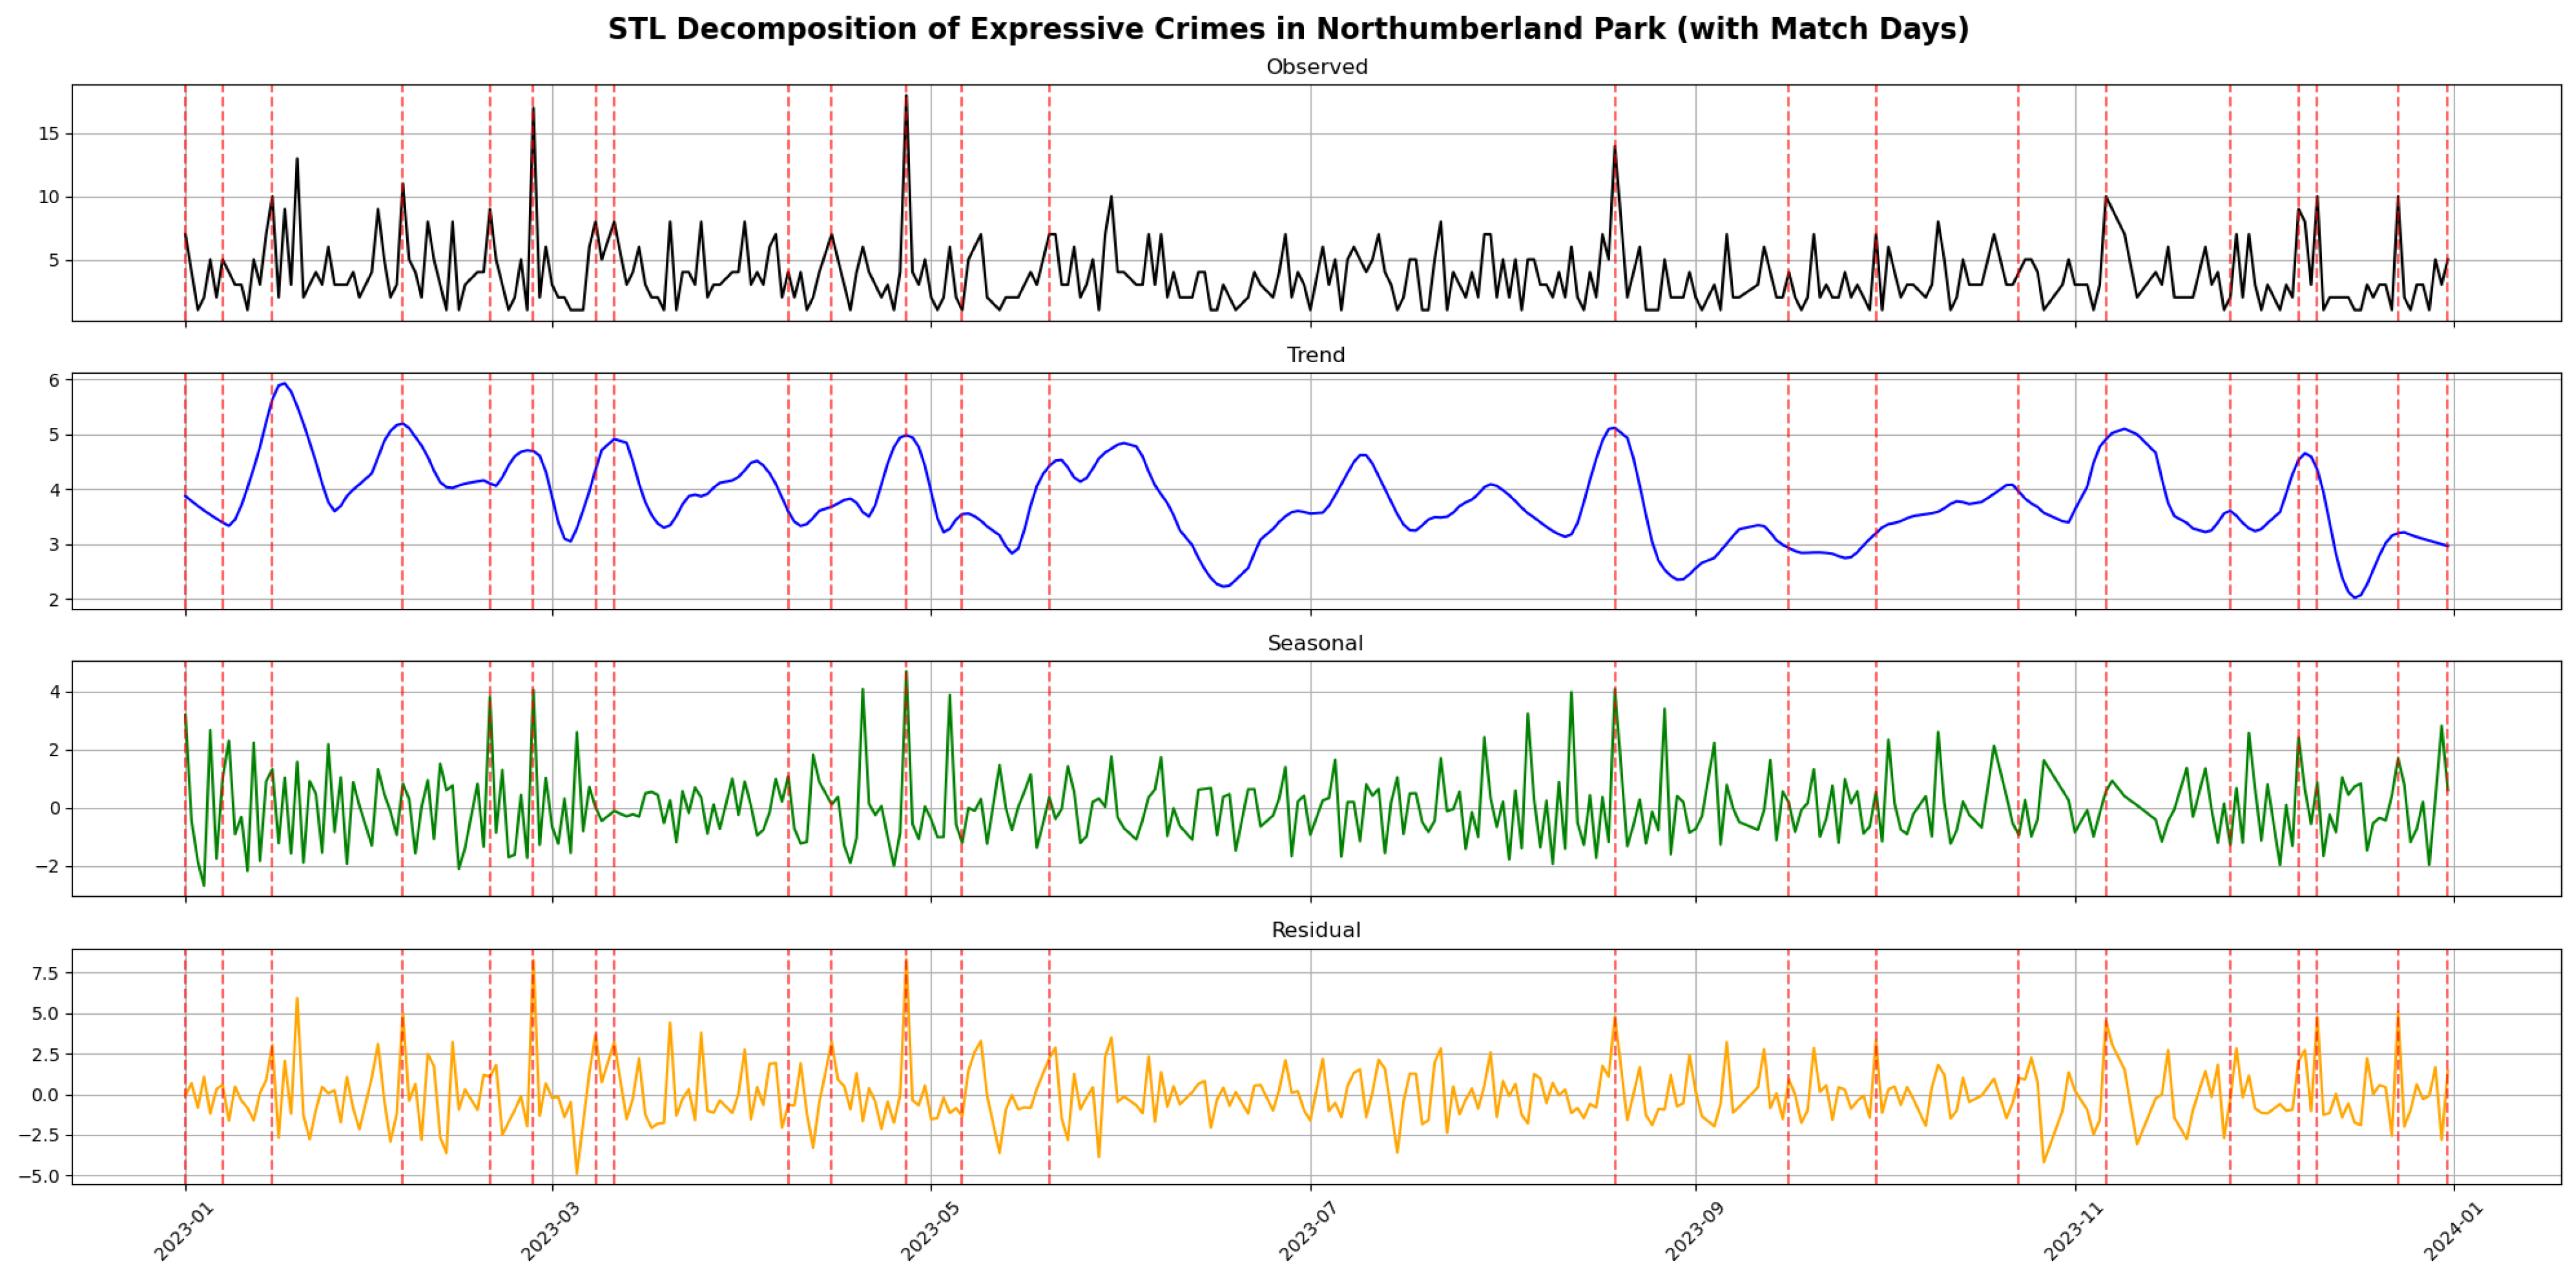
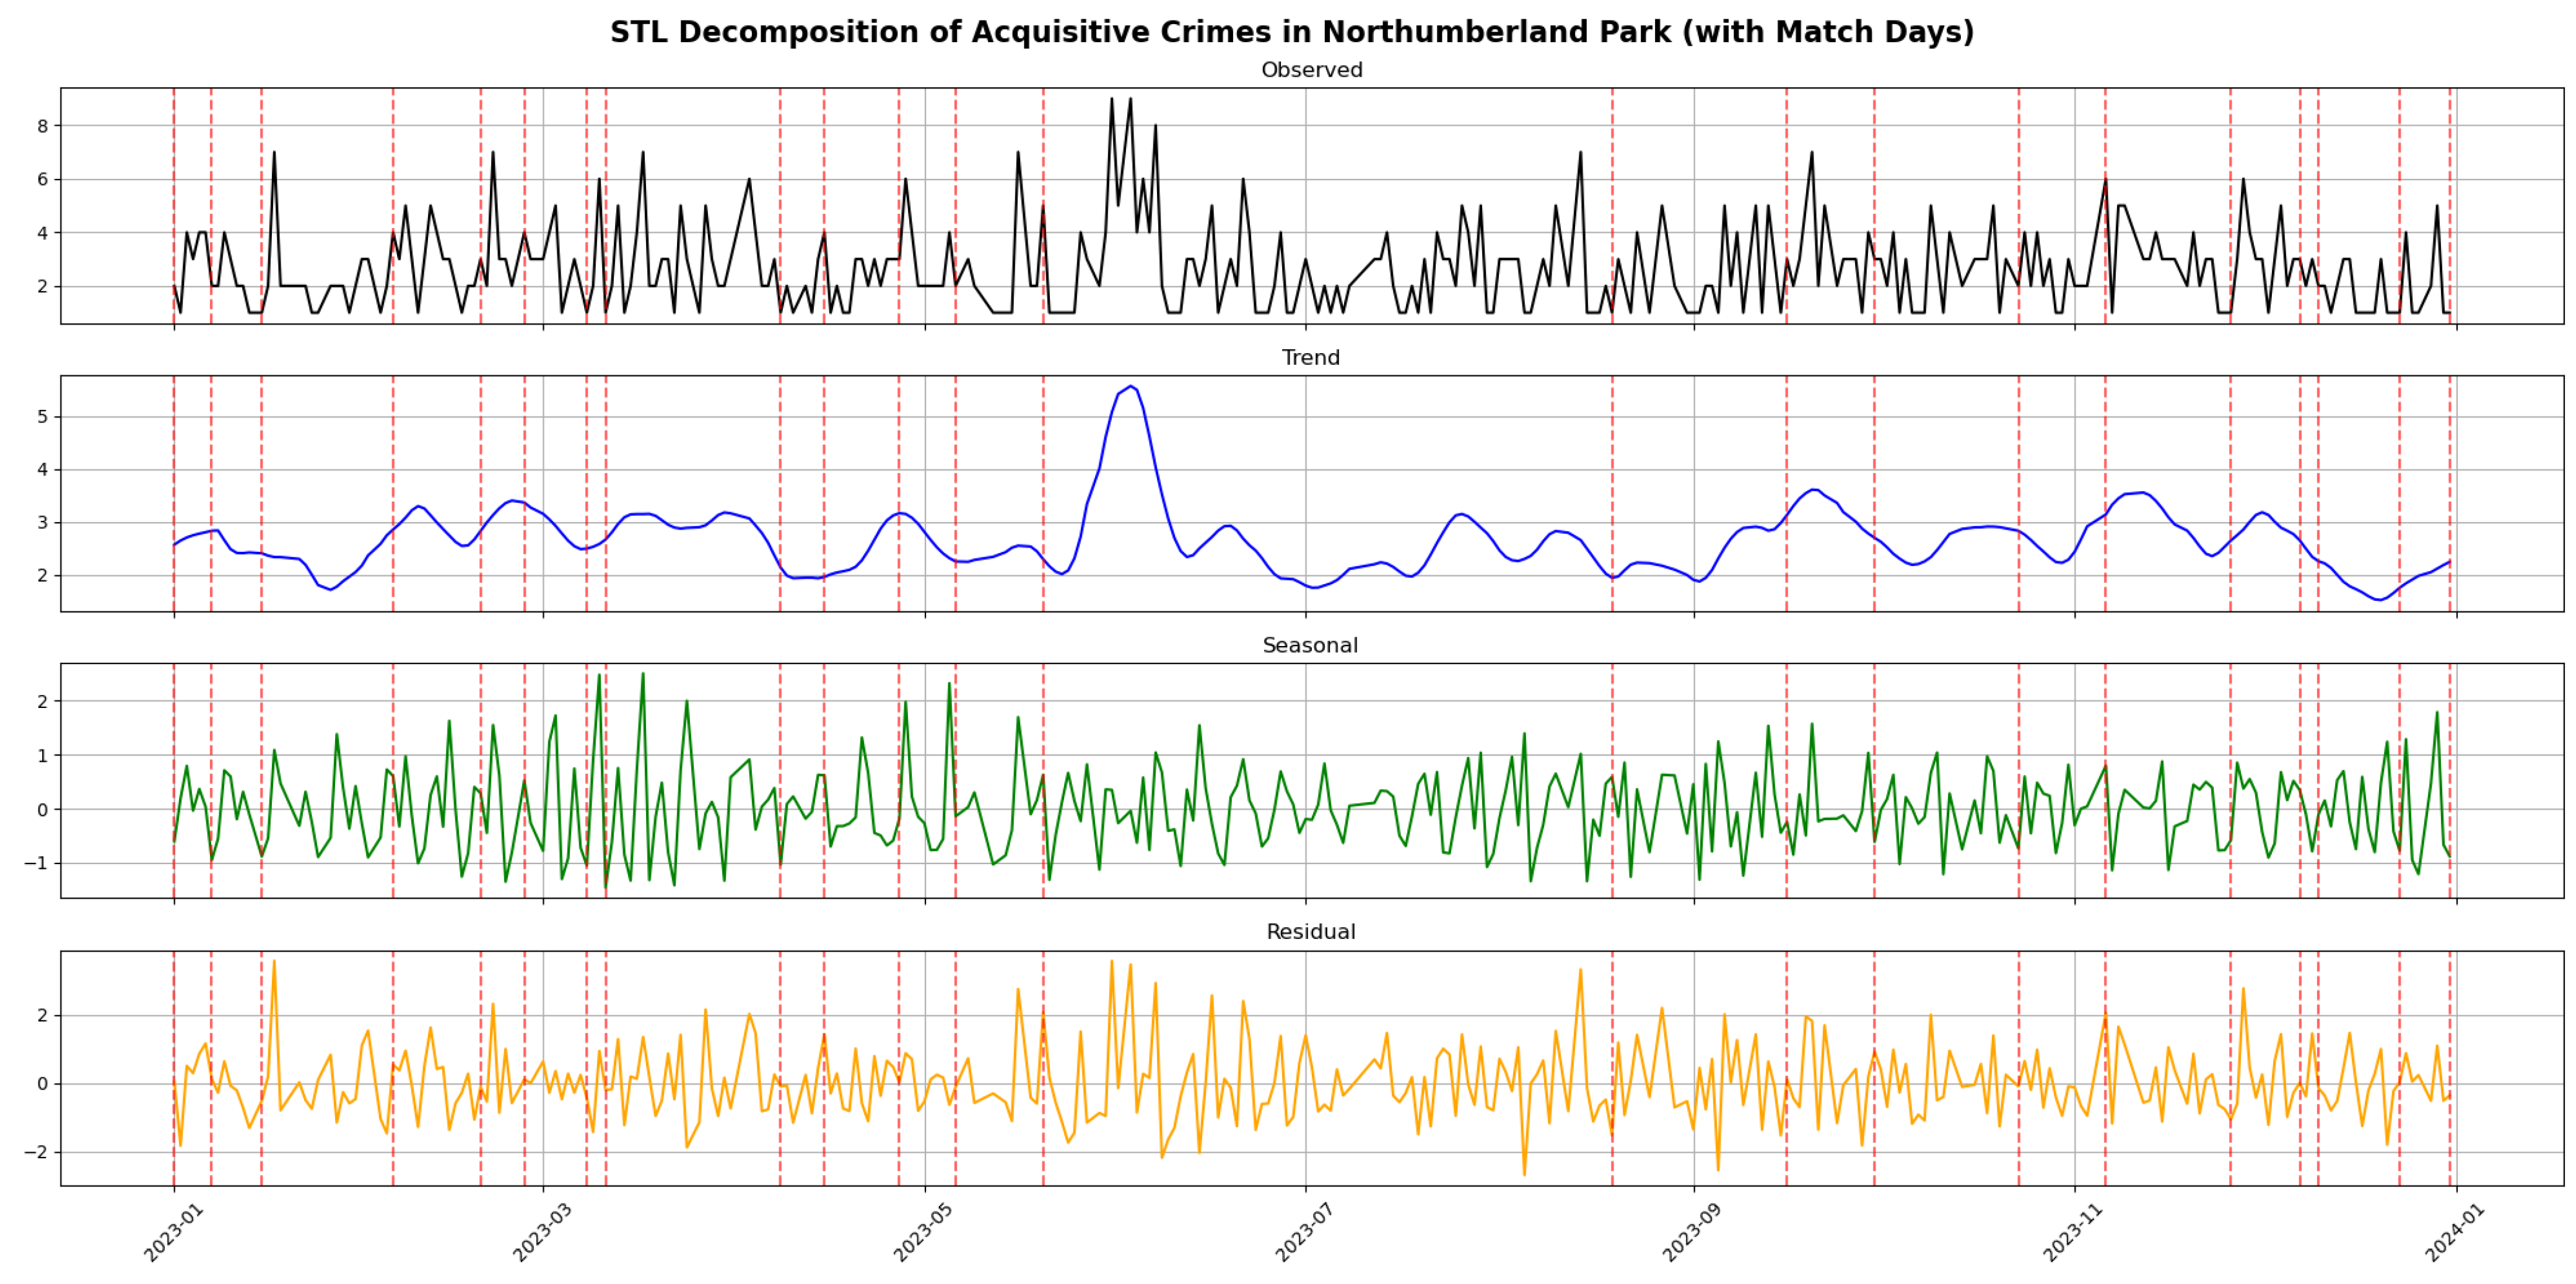
The temporal patterns for the impacts of match days had been validated through STL decomposition, with red dashed lines indicating match days (Figure 6, Figure 7 and Figure 8). The trend for expressive crimes in Northumberland Park (Figure 6) obviously presented positive outliers on match days, that is, there was a strong association between match days and the surges of expressive crimes around the stadium. For example, on 26 February (home match day for Tottenham Hotspur vs. Arsenal) and 27 April (home match day for Tottenham Hotspur vs Manchester United), when the historical rivalry teams are having matches. In contrast, acquisitive crimes (Figure 7) did not exhibit abnormal changes on the days of matches, further confirming the pattern observed in Figure 7 that the days of matches did not significantly affect acquisitive crimes.
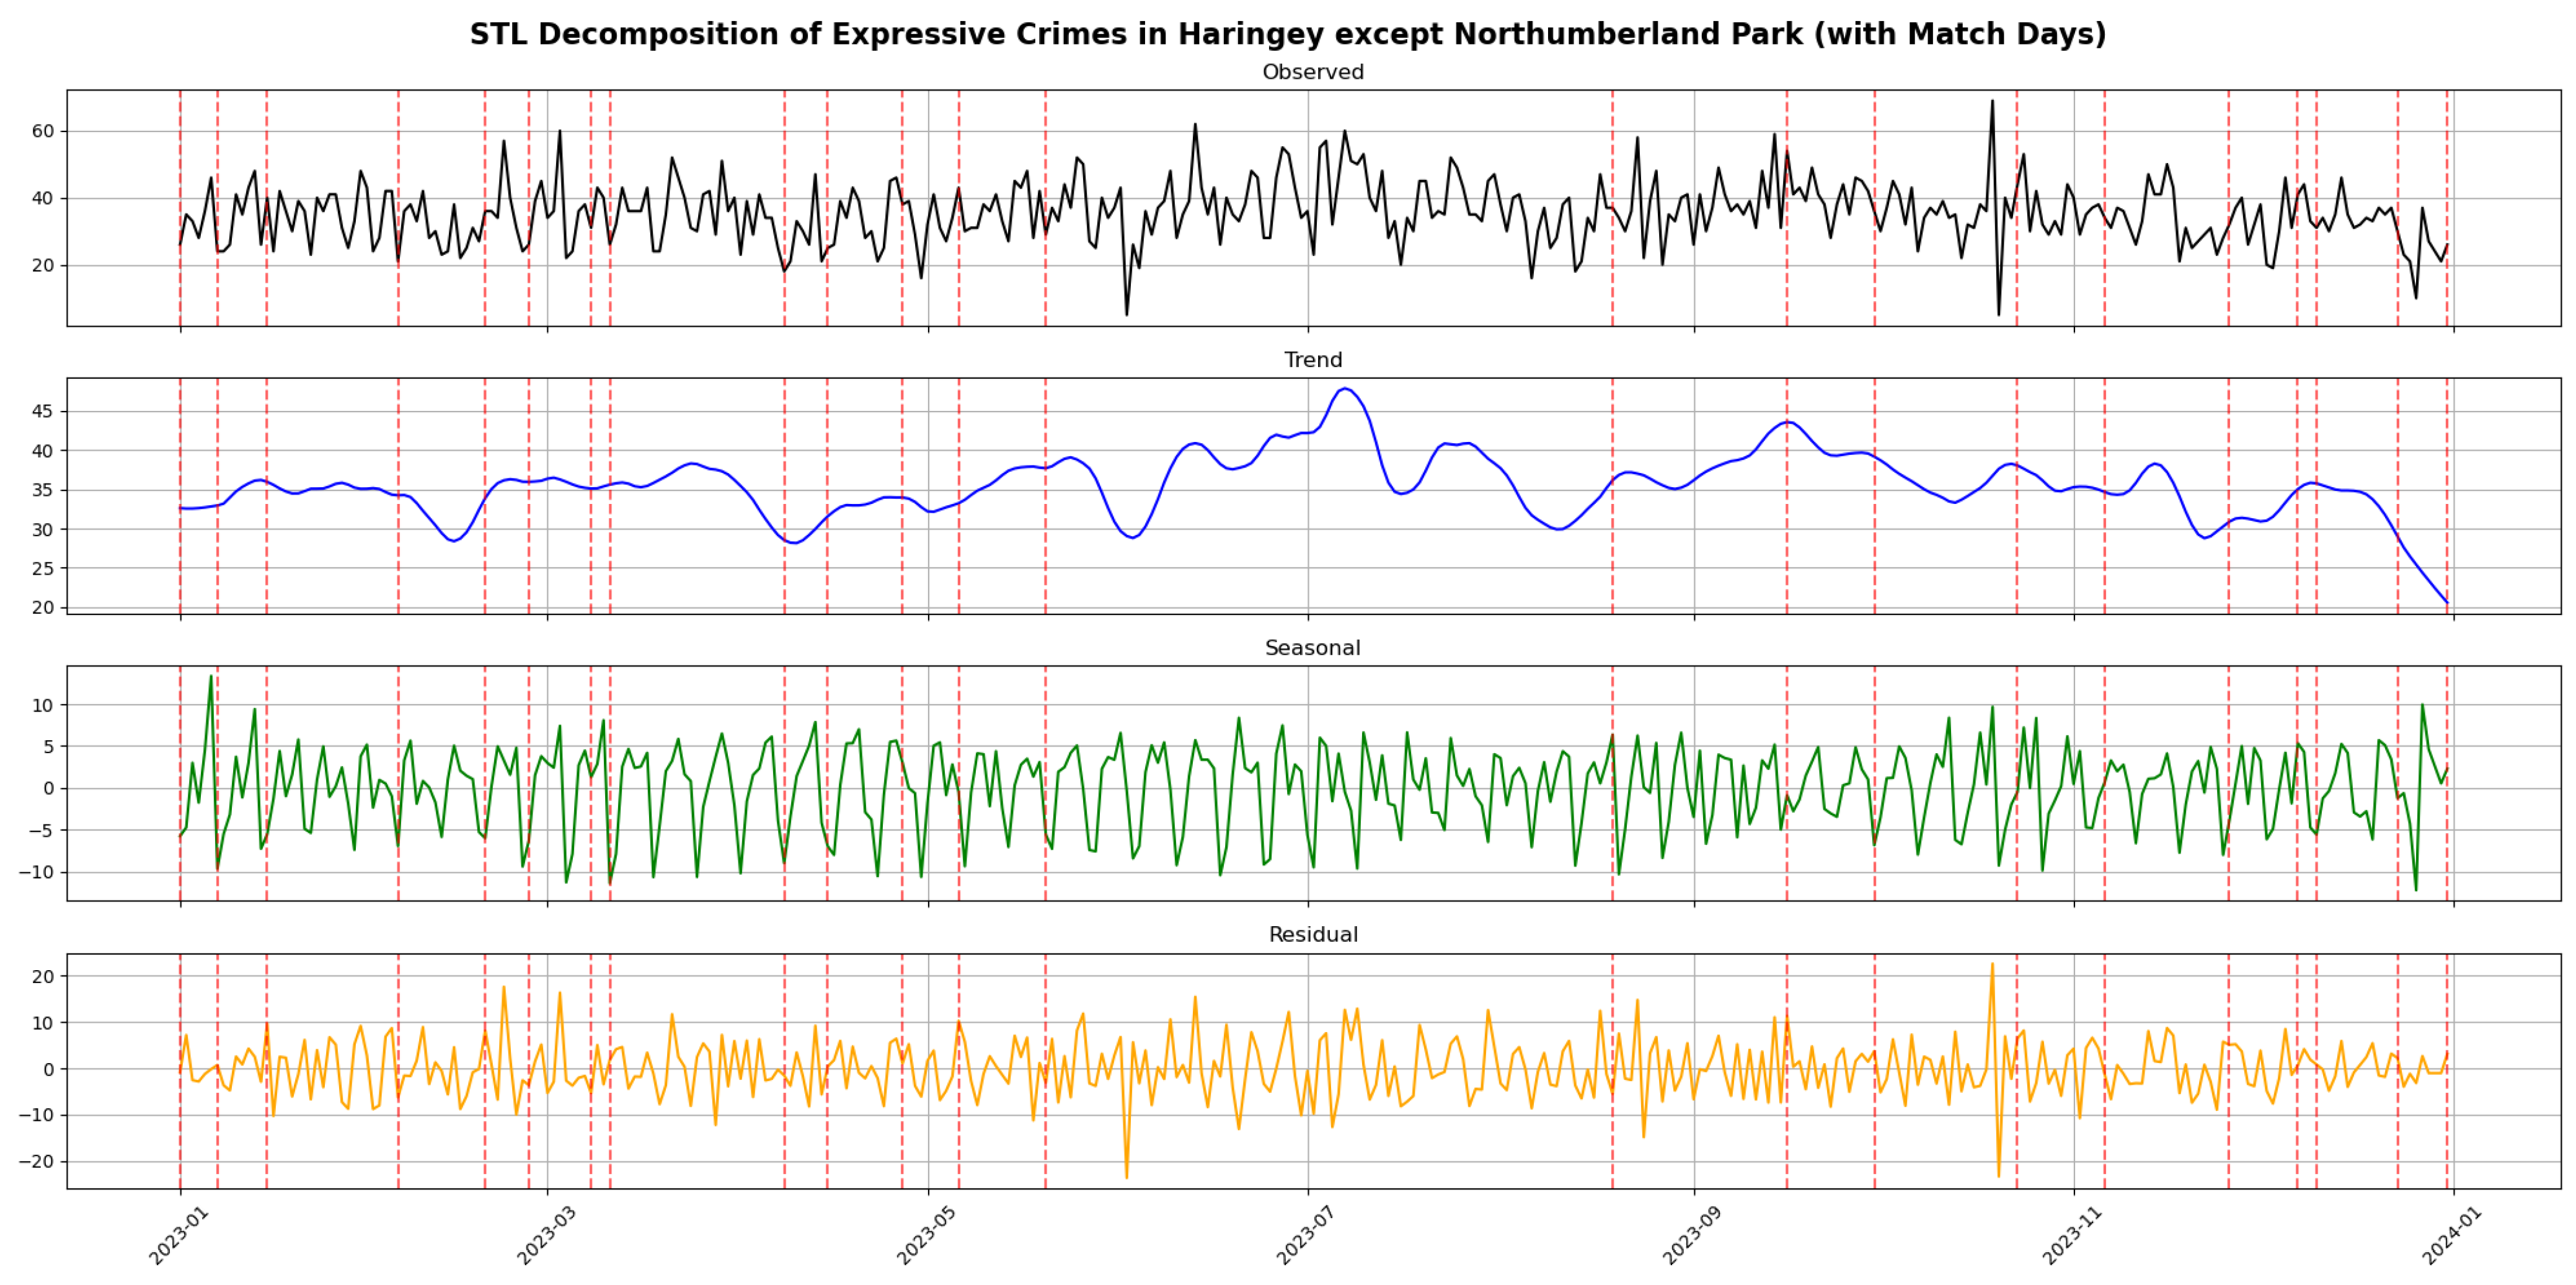
To better understand the changes of crime in the whole Haringey borough, similar STL composition had been conducted for other wards in the borough excluding our target town Northumberland Park. It highlighted (Figure 8) rare significant association between expressive crimes and match days for other “far-away” towns, instead it kept apparent seasonal trends as non-match days, with the indication that the influence of football matches on expressive crimes did not spill over into neighbouring areas beyond Northumberland Park.
To highlight the aforementioned time series observations, a difference-in-differences (DiD) regression analysis was applied to compare such associations among wards in Haringey borough. To assess the assumption of parallel trends, we conducted a check using an event study framework. Since the analysis employs a short, single-day treatment scattered across the year in a dynamic DID setting, the event study approach allows us to examine whether the pre-treatment trends in the treated wards (Northumberland Park, Bruce Castle and Tottenham Hale) are similar to those in the control wards. As shown in the Figure 9, apart from match day ( τ = 0 ), most pre- and post-event coefficients fluctuate around zero, with 95% confidence intervals covering zero. These results provide support for the parallel trends assumption.
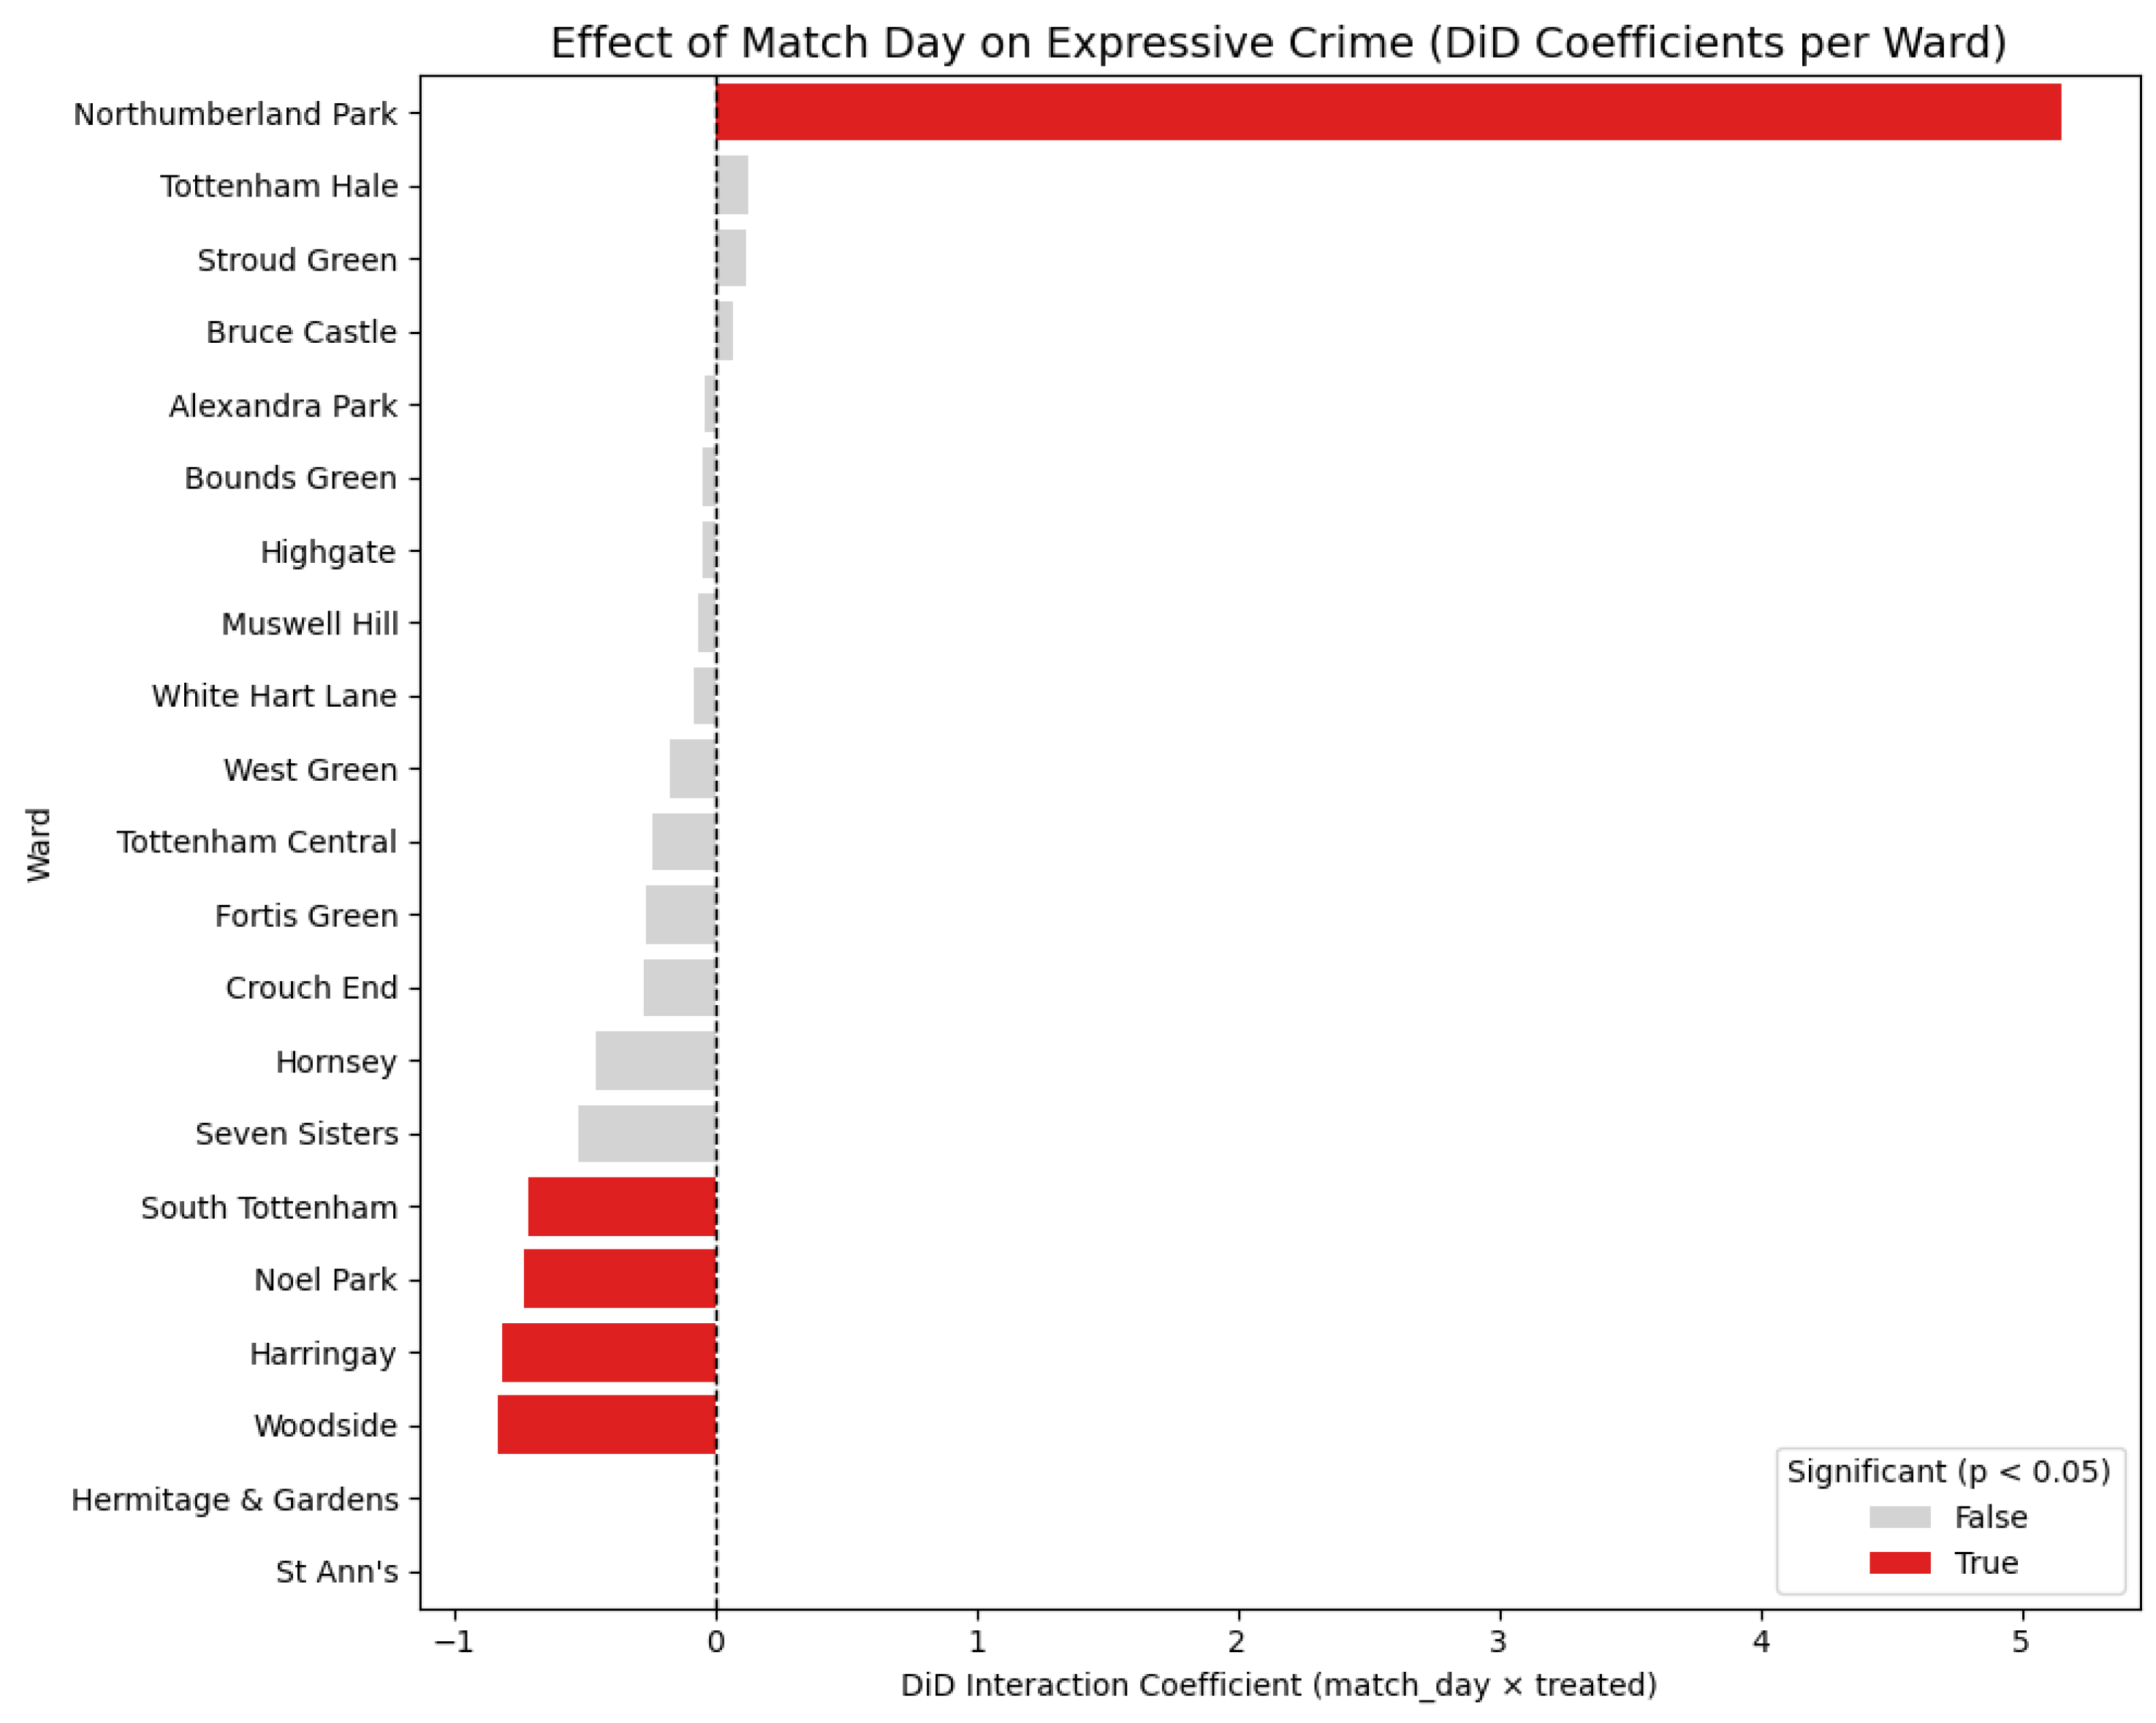
The results of DiD Regression are presented in Figure 10. In the bar chart, each bar represents an interaction coefficient between a specific town and the observational match days. Notably, the coefficient for Northumberland Park was positive and substantially higher than other areas, hence it is proved to solidate the argument that match days were driving expressive crimes high dramatically in the vicinity of study area. There were also several towns far from the target area, Northumberland Park, such as South Tottenham and Harringay, that exhibited significantly negative interaction coefficients. This indicated potential crime displacement effects, or alternatively reflected the deterrent impacts of increased police presence around the stadium on match days with further influences on other areas’ crime reductions.

4.3. Driving Mechanism

To better address the research objective of investigating the driving mechanism of the association between match days and expressive crime changes, a Geographically Temporal Weighted Regression (GTWR) model was utilised, achieving a high R 2 value of 0.83. Prior to model fitting, all explanatory variables were examined for multicollinearity using the Variance Inflation Factor (VIF), and all remaining variables passed the VIF threshold, indicating no severe multicollinearity. Table 2 reports the VIF values for the final set of variables included in the model.
Figure 11 maps the spatial pattern of the average coefficients, calculated by the GTWR model, for the intensity of mobility in the underground tube station (tap-in activity, TapIDW) and sports clubs (Clubs) against expressive crimes among towns. To provide clearer spatial reference, the location of the Tottenham Hotspur Stadium has been marked with an star.
The left panel of Figure 11 illustrates the relationship between underground passenger mobility and expressive crimes. The results indicate that four northern wards—Bounds Green, Woodside, White Hart Lane, and Bruce Castle—experience a significant increase in expressive crime risk when mobility rises. Among them, Bruce Castle is adjacent to White Hart Lane Station, the closest tube station to the Tottenham Hotspur Stadium (approximately a five-minute walk), and is also near Bruce Grove Station. Many match attendees choose to use these two stations via the London Overground Service to arrive at and depart from the stadium. Additionally, although Bounds Green, Woodside, and White Hart Lane do not have direct tube stations to the stadium, according to official recommendations from Tottenham Hotspur Football Club, to avoid overcrowding, many fans opt to take the tube to Bounds Green and Wood Green stations and then transfer to shuttle buses at the corresponding bus stops to reach Tottenham Hotspur Stadium [50]. Therefore, these areas serve as important pedestrian catchment zones on match days, which explains the significantly high TapIDW coefficients observed (1.98, 1.93, and 1.62, respectively). This finding supports our hypothesis that areas surrounding the stadium are highly sensitive to mobility changes, and surges in crowds during match events are key drivers of local expressive crime increases.
The right-hand figure illustrates the relationship between local sports clubs and expressive crimes throughout the observation period. The results indicate that in certain wards of Haringey, sports clubs exert a significant deterrent effect on expressive crimes. In particular, the number of sports clubs in White Hart Lane and Hermitage & Gardens is strongly negatively correlated with expressive crimes. Overall, these two wards are considered hotspots for expressive crimes in Haringey, especially Hermitage & Gardens. According to the Metropolitan Police, this area experiences high rates of violent crimes against women and drug-related offenses, both of which are typical expressive crimes [51]. Therefore, even though the number of sports clubs in the area is limited, the activities they organize may effectively reduce expressive crimes. Furthermore, the proportion of adolescents and population density are significant risk factors for expressive crimes in these wards. Organized sports activities can occupy adolescents’ leisure time and, by increasing social supervision and strengthening community cohesion, can help mitigate the risk of local expressive crimes.
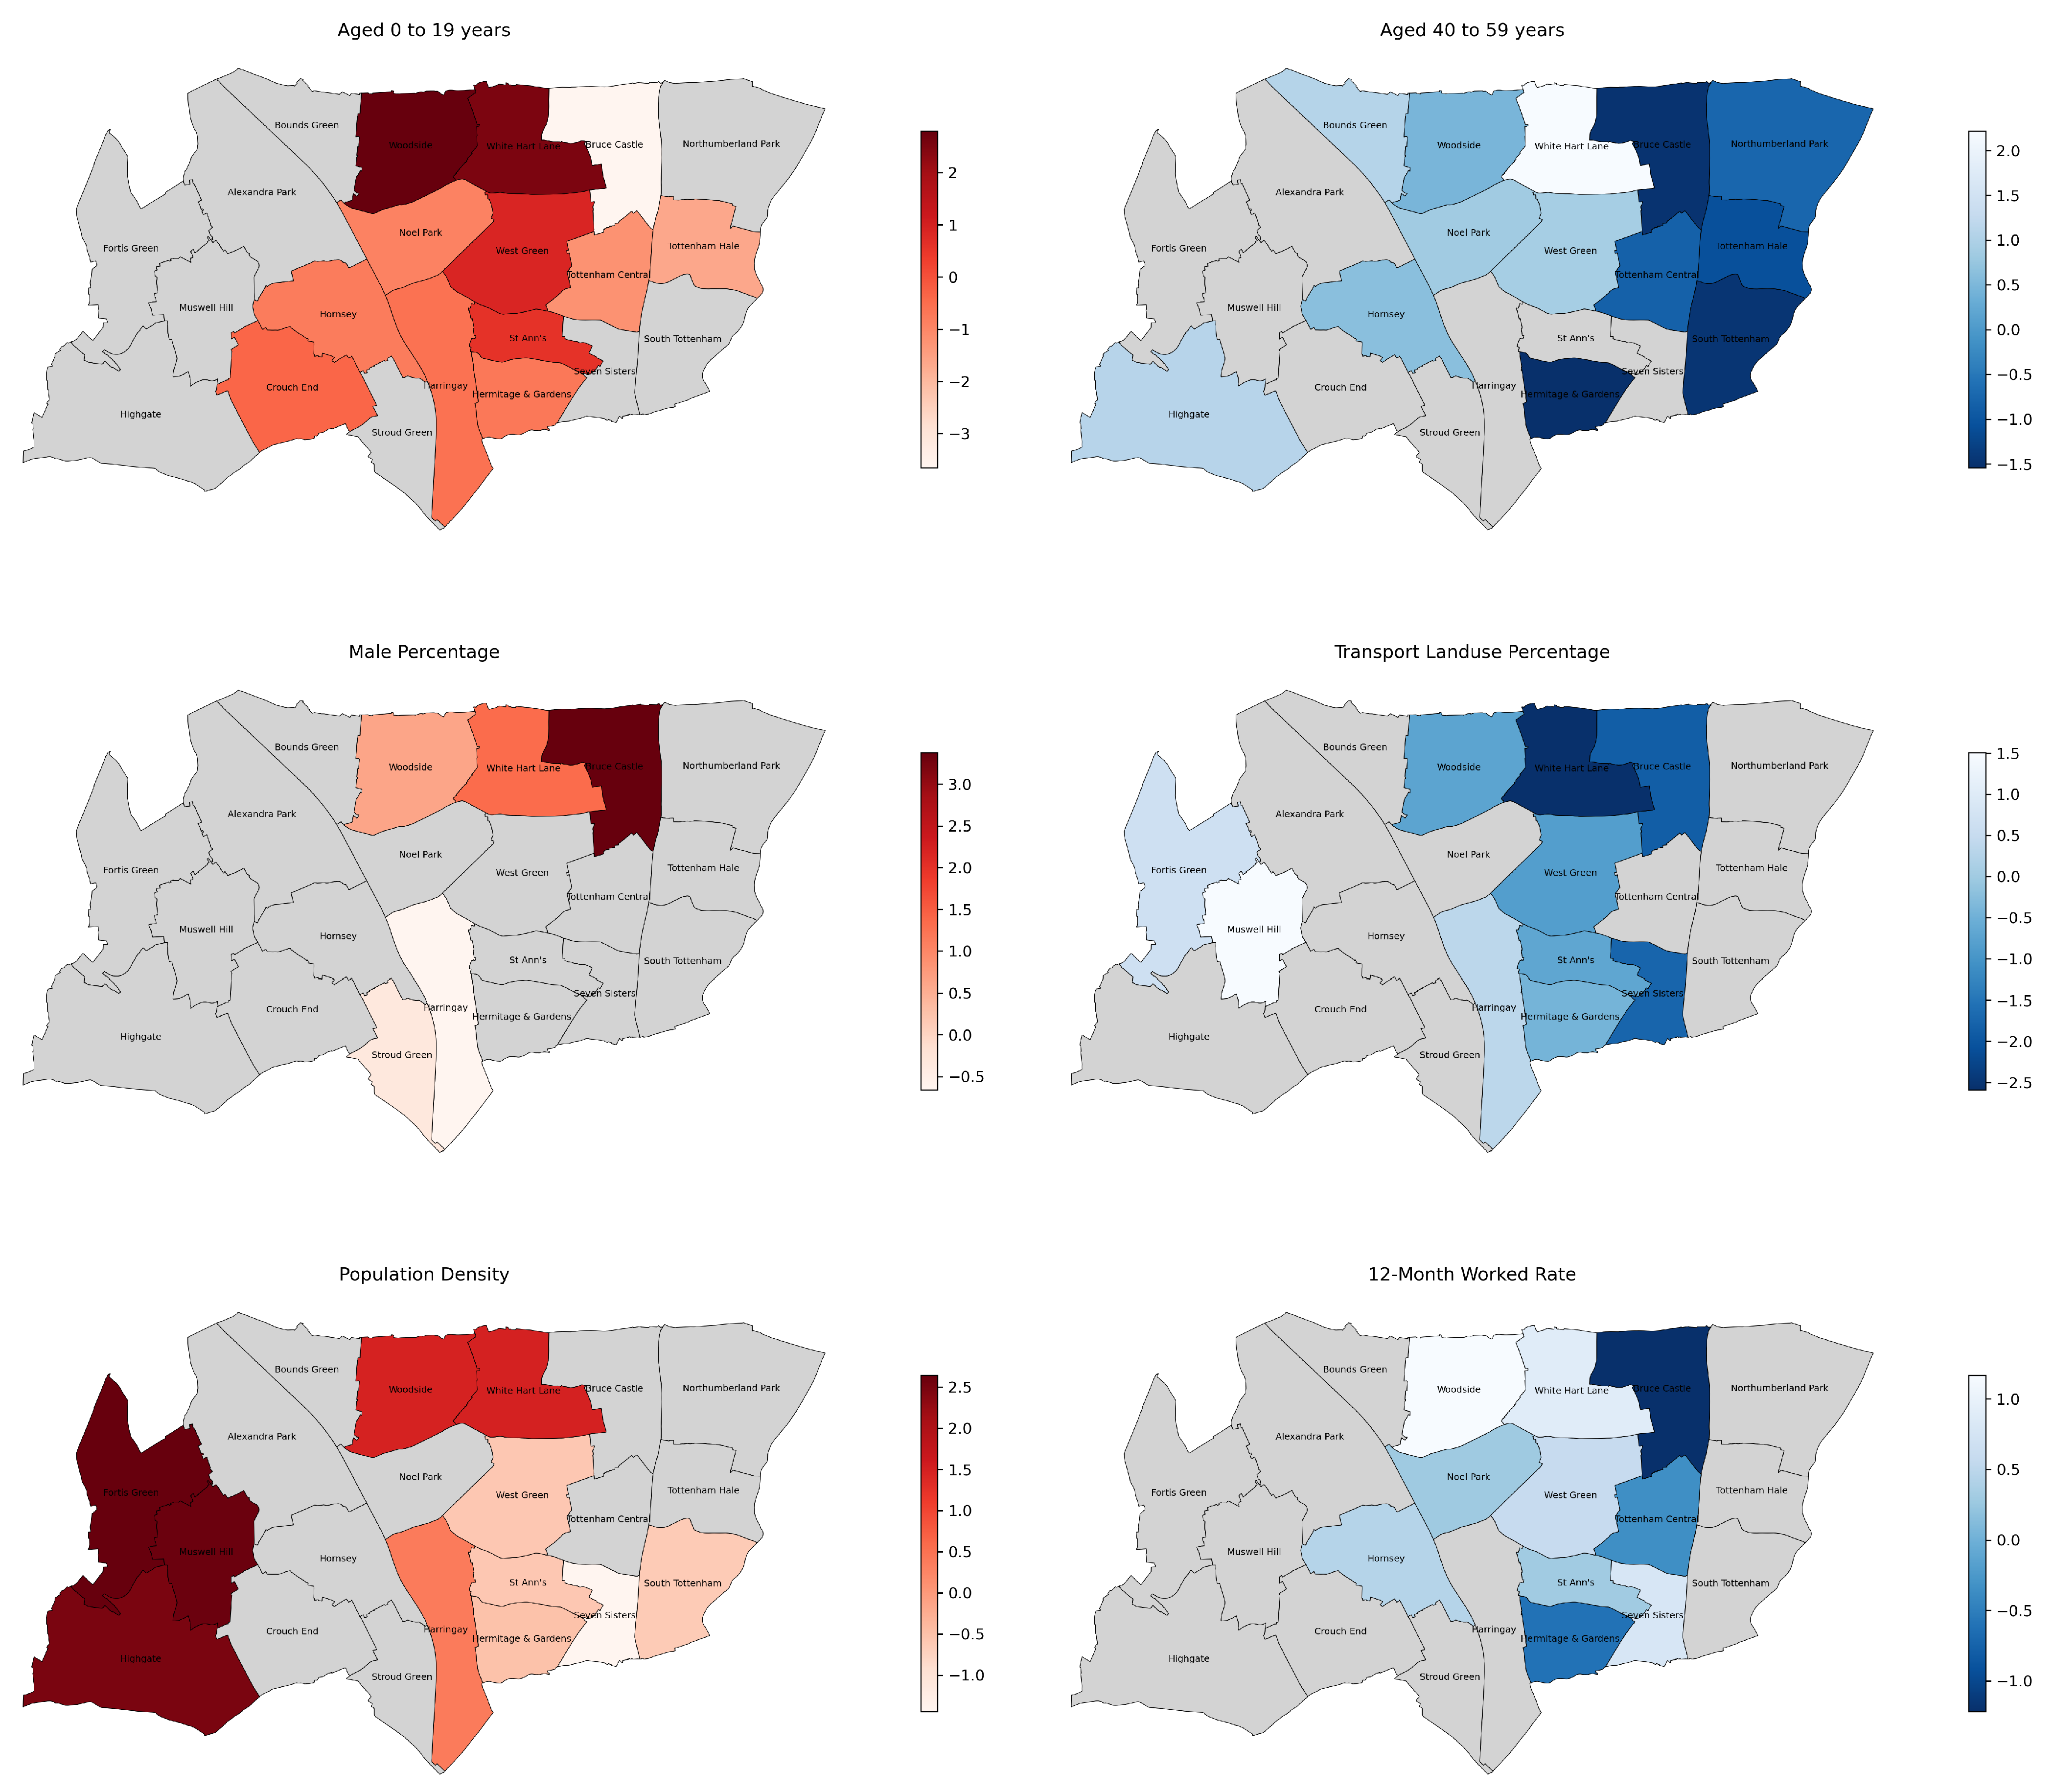
It should be noted that in Muswell Hill and Fortis Green, the number of sports clubs is positively associated with expressive crimes, with coefficients of 1.0 and 0.62, respectively. These wards are relatively quiet residential areas with comparatively low population density. As shown in Figure 12, both population density and TapIDW are strongly positively correlated with expressive crimes in these areas. This suggests that in quieter, low-density residential neighborhoods such as Muswell Hill and Fortis Green, even moderate inflows of people—such as underground passengers or visitors to sports clubs—can noticeably affect daily social interactions. Consequently, relatively small increases in local human activity can generate more social encounters and potential conflicts, thereby contributing to an increase in expressive crimes.
Figure 13 presents the temporal dynamics of the GTWR coefficients for the two variables using boxplots. In general, the GTWR coefficients of TapIDW remain within the range of 1.5–2.0, indicating a consistent positive effect of subway passenger flows on expressive crimes. Monthly variations are relatively stable, with the medians (white diamonds inside the boxes) showing almost no significant fluctuation. Only in January and February do the medians slightly decrease, whereas in November and December they slightly increase. This suggests that the influence of subway flows on crime is relatively stable and not substantially affected by seasonal variations. The whiskers of the boxes (maximum and minimum values) reveal some spatial heterogeneity among wards, but overall differences are minor, indicating that most wards are affected by subway flows to a similar degree.
In contrast, the coefficients for sports clubs are smaller, ranging approximately from −1.5 to 1.0, indicating a weaker and less consistent effect on expressive crimes. The median coefficients for most months are negative, suggesting that sports clubs have a certain crime-reducing effect in many wards. The coefficients of sports clubs are also relatively stable over time; however, the mean coefficient slightly decreases in January, while in December nearly all wards show a weak positive correlation between sports clubs and expressive crimes. This pattern may be due to reduced outdoor sports activities during the winter and the Christmas holidays, which increases residents’ unstructured leisure time and slightly diminishes the crime-suppressing effect of sports clubs.

5. Discussion

The spatial hotspots of expressive crimes and sports clubs in London exhibit multiple profiles: they are home to London landmarks and cultural infrastructure, attract high levels of tourist mobility, and cluster social gathering places and restaurants, including major sports stadiums and parks. This pattern indicates that denser populations are more frequently exposed to large sports facilities, thereby increasing the risks of interpersonal friction or street-level conflicts. In particular, “event-driven spaces”, such as the area surrounding Tottenham Central in Haringey borough, experience spikes in crowd mobility during major sporting events, accompanied by heightened emotional behaviors that can trigger increases in expressive crimes.
This conclusion is consistent with classical criminological theories. First, Routine Activity Theory [5] argues that when potential offenders, suitable targets, and the absence of capable guardians converge in space and time, opportunities for crime increase. Major sporting events act as “event-driven spaces,” gathering large numbers of spectators and potential victims in a short time while diverting policing and guardianship resources, thereby creating a favorable opportunity structure for crime [52]. Second, Crime Pattern Theory [26] emphasizes that stadiums, bars, and restaurants are typical “crime generators” and “crime attractors”, with crowd concentration during events amplifying this effect [53]. Finally, strain and emotional cue theories offer complementary explanations: fans’ strong emotional responses to match outcomes, particularly unexpected defeats, can directly fuel aggression and conflict [54].
The temporal analysis using STL decomposition further validates the hypothesis of match-day influences on expressive crime around major stadiums, such as Tottenham Hotspur Stadium in Haringey borough, as demonstrated by DID regression analysis. Existing studies similarly highlight the relationship between sporting events and crime. For example, in Cleveland, violent and property crime around stadium neighborhoods rise significantly on game days [52]. In Barcelona, home matches lead to a notable increase in thefts and violent incidents within a one-kilometer radius of the stadium, while away matches are associated with decreases in local crime, underscoring the critical role of crowd congregation [55,56]. However, in contrast to these findings, our study shows that during Tottenham Hotspur match-days, property crime does not exhibit significant changes, while violent crime, drug-related offenses, and public order violations show strong positive anomalies. This divergence may reflect the composition of Spurs’ fan base, which is primarily local and regional; their activities during match-days center on spectating, drinking, traveling, and crowd gatherings. These behaviors are less conducive to property crimes (e.g., theft or burglary) but more likely to generate expressive crimes (e.g., violence, disputes, assaults) or incidents linked to drugs and public order.
The GTWR analysis further reveals the spatial heterogeneity of the impacts of mobility flows and sports clubs on expressive crime in London. First, in northern wards, particularly White Hart Lane and Bruce Castle, TapIDW coefficients remain consistently high, indicating that surges in subway passenger flows are stable and significant drivers of expressive crime. This finding resonates with Routine Activity Theory [5] and Crime Pattern Theory [26], which posit that mobility intensifies the convergence of offenders, targets, and weak guardianship, especially around transport hubs and stadiums as crime generators [57,58]. It also aligns with empirical studies showing that large-scale events generate anomalous subway ridership spikes and heightened safety risks in nearby neighborhoods [59,60].
Second, in wards such as White Hart Lane and Hermitage & Gardens, the number of sports clubs is negatively associated with expressive crime, suggesting that organized sports play a suppressive role. This finding supports Social Control Theory, whereby structured activities occupy residents’ (particularly youths’) leisure time, enhance informal guardianship, and foster community cohesion [61]. However, boxplot analysis of GTWR coefficients shows that this suppressive effect weakens during the winter months and the Christmas holiday period. Seasonal factors likely contribute: outdoor sporting activities decrease in colder months, while unstructured leisure time increases during holiday periods. Prior studies similarly observe that crime exhibits seasonal variation, with colder weather and holiday contexts reducing the efficacy of social control mechanisms [31].
By contrast, in low-density residential wards such as Muswell Hill and Fortis Green, sports clubs are positively associated with expressive crime. This “anomalous pattern” suggests that sports and leisure facilities do not always reduce crime and may, in quiet residential areas, trigger additional risks. Although few studies explicitly examine the negative impacts of sports clubs, related evidence provides important support for this mechanism. Roncek and Maier show that the presence of bars and leisure facilities within residential blocks significantly increases crime, especially in neighborhoods with weak guardianship, as visitor inflows and alcohol consumption generate violence and conflict [62]. Similarly, Asselineau finds that cinemas, restaurants, and clubs embedded in European residential areas often lead to noise and social tensions, which can escalate into crime problems [63]. Furthermore, Bae highlights the “double-edged” nature of sports clubs: while they can promote cohesion, intense social interaction and overlapping cultural pressures may also foster disputes and conflict [64]. Therefore, in residential areas characterized by low crime rates and low population density, it is necessary to strengthen the regulation and oversight of sports clubs to mitigate potential security risks arising from visitor inflows.

6. Conclusions

This study examined the spatial and temporal patterns of expressive crimes in relation to sports clubs and stadium venues in London, with a particular focus on the Tottenham Hotspur Stadium in Haringey. The findings revealed that hotspots of expressive crime were concentrated in central London and around major stadiums, shaped not only by the availability of sports facilities but also by the intensity of population mobility associated with multifunctional land use.
The case study of Haringey and Tottenham Hotspur Stadium highlighted a disproportionate increase in expressive crimes—particularly violent offenses—on football match-days. Time series decomposition and difference-in-differences analysis confirmed the strong localized impact of match-day crowds around the stadium, supporting criminological theories such as Routine Activity Theory and Crime Pattern Theory, which emphasize the convergence of offenders, targets, and weakened guardianship in “event-driven spaces”. Unlike some previous studies that found increases in property crime near stadiums, our results showed limited changes in theft or burglary, but significant rises in violent, drug-related, and public order offenses, reflecting the dominance of emotionally charged behaviors linked to spectating, traveling, and crowd gatherings.
The GTWR model further revealed the dynamic mechanisms underlying expressive crime. Population mobility, measured through subway passenger flows, consistently acted as a stable crime-driving factor across wards and over time. In contrast, the presence of sports clubs demonstrated more context-dependent and seasonal effects: overall suppressing expressive crime through social control mechanisms, but weakening during winter and holiday periods when outdoor activities decline and unstructured leisure time increases. Moreover, in some low-density residential wards, sports clubs were positively associated with expressive crimes, echoing studies on leisure facilities in residential areas that highlight risks linked to visitor inflows and social frictions. These findings underscore that while sports participation generally reduces crime, its effects are not universal and can vary depending on local socio-spatial conditions.
In sum, this research provides empirical evidence that expressive crimes in London are shaped by the interplay of population mobility, event-driven gatherings, and the social functions of sports clubs. Methodologically, our application of GTWR, together with STL decomposition and DID analysis, demonstrates the potential of integrating spatial-temporal models with criminological theory to uncover nuanced urban crime dynamics. Due to data availability constraints, the analysis focused on Haringey borough as a case study, specifically examining Tottenham Hotspur Stadium. While the findings provide valuable insights, future research should extend these efforts to other stadiums across London to validate the generalizability of the results and to better understand how major sporting events influence crime patterns in diverse urban contexts. Additionally, employing advanced machine learning and explainable AI methods could capture nonlinear interactions between urban crimes and environmental variables, while enhancing interpretability to inform evidence-based crime prevention and policing strategies.

Author Contributions

Conceptualization, Yijing Li, Sandeep Broca and Zakir Patel; methodology, Rui Wang and Yijing Li; software, Rui Wang; validation, Rui Wang, Yijing Li, Zakir Patel and Inderpal Sahota; formal analysis, Rui Wang and Yijing Li; investigation, Rui Wang, Yijing Li and Sandeep Broca; resources, Yijing Li and Sandeep Broca; data curation, Zakir Patel and Inderpal Sahota; writing—original draft preparation, Yijing Li and Rui Wang; writing—review and editing, Yijing Li and Sandeep Broca; visualization, Rui Wang and Yijing Li; supervision, Yijing Li; project administration, Yijing Li. All authors have read and agreed to the published version of the manuscript.

Funding

This research received no external funding.

Institutional Review Board Statement

Not applicable.

Informed Consent Statement

Not applicable.

Data Availability Statement

The data is available upon requests.

Acknowledgments

The study acknowledge support of data from Haringey City Council and London Sport.

Conflicts of Interest

The authors declare no conflicts of interest.

Abbreviations

The following abbreviations are used in this manuscript:
STLSeasonal Trend decomposition using Losse
GTWRGeographically Temporal Weighted Regression
DIDDifference-in-difference

References

  1. Jugl, I.; Bender, D.; Lösel, F. Do Sports Programs Prevent Crime and Reduce Reoffending? A Systematic Review and Meta-Analysis on the Effectiveness of Sports Programs. J. Quant. Criminol. 2023, 39, 333–384. [Google Scholar] [CrossRef]
  2. Spruit, A.; van der Put, C.; van Vugt, E.; Stams, G.J. Predictors of intervention success in a sports based program for adolescents at risk of juvenile Delinquency. Int. J. Offender Ther. Comp. Criminol. 2018, 62, 1535–1555. [Google Scholar] [CrossRef]
  3. College of Policing. Sports Programmes Designed to Prevent Crime and Reduce Reoffending. 2023. Available online: https://www.college.police.uk/research/crime-reduction-toolkit/sports-programmes-designed-prevent-crime-and-reduce-reoffending (accessed on 15 October 2025).
  4. Lösel, F.; Farrington, D.P. Direct protective and buffering protective factors in the development of youth violence. Am. J. Prev. Med. 2012, 43, 8–23. [Google Scholar] [CrossRef] [PubMed]
  5. Cohen, L.E.; Felson, M. Social Change and Crime Rate Trends: A Routine Activity Approach. Am. Sociol. Rev. 1979, 44, 588–608. [Google Scholar] [CrossRef]
  6. Shields, D.L.; Funk, C.D.; Bredemeier, B.L. Relationships among moral and contesting variables and prosocial and antisocial behavior in sport. J. Moral Educ. 2018, 47, 17–33. [Google Scholar] [CrossRef]
  7. Haudenhuyse, R.; Hayton, J.; Parnell, D.; Verkooijen, K.; Delheye, P. Boundary Spanning in Sport for Development: Opening Transdisciplinary and Intersectoral Perspectives. Soc. Incl. 2020, 8, 123–128. [Google Scholar] [CrossRef]
  8. Durkheim, D. The Division of Labor in Society; Simpson, F., Translator; The MacMillan Company: New York, NY, USA, 1933. [Google Scholar]
  9. Bandura, A. Self-efficacy: Toward a unifying theory of behavioral change. Psychol. Rev. 1977, 84, 191–215. [Google Scholar] [CrossRef]
  10. Andres, L.; Fabel, M.; Rainer, H. How much violence does football hooliganism cause? J. Public Econ. 2023, 225, 104970. [Google Scholar] [CrossRef]
  11. NPCC. Over 300 Domestic Abuse Offences Linked to Euros. 2024. Available online: https://news.npcc.police.uk/releases/police-record-over-three-hundred-domestic-abuse-offences-linked-to-euros-tournament (accessed on 15 October 2025).
  12. Kurland, J.; Johnson, S.D.; Tilley, N. Offenses around Stadiums: A Natural Experiment on Crime Attraction and Generation. J. Res. Crime Delinq. 2013, 51, 5–28. [Google Scholar] [CrossRef]
  13. Williams, R.K. Sports and Crime. EBSCO Knowledge Advantage. 2024. Available online: https://www.ebsco.com/research-starters/sports-and-leisure/sports-and-crime#full-article (accessed on 15 October 2025).
  14. Crozier, A.J.; Carmichael, M.A.; Townsend, J.R.; Bingham, J.M.; Stenner, B.J. Norms in sport: A scoping review. Int. Rev. Sport Exerc. Psychol. 2024, 17, 645–667. [Google Scholar] [CrossRef]
  15. Uszaki, D.W. Beyond the Scoreboard: Using Athletics to Build Life Skills; National Federation of State High School Associations: Indianapolis, IN, USA, 2025. [Google Scholar]
  16. Hirschi, T. Causes of Delinquency; University of California Press: Berkeley, CA, USA, 1969. [Google Scholar]
  17. Mayor of London. Mayor Announces New £1 m Sports Investment Featuring Holiday Activities for Young People at Greatest Risk of Violence; Mayor of London: London, UK, 2025. [Google Scholar]
  18. Allen, G.; Wong, H. Knife Crime Statistics: England and Wales. UK Parliament Research Briefing. 2025. Available online: https://commonslibrary.parliament.uk/research-briefings/sn04304/ (accessed on 15 October 2025).
  19. Office for National Statistics. Crime in England and Wales: Year Ending June 2023; Office for National Statistics: Newport, UK, 2023.
  20. Bruner, M.W.; McLaren, C.D.; Sutcliffe, J.T.; Gardner, L.A.; Lubans, D.R.; Smith, J.J.; Vella, S.A. The effect of sport-based interventions on positive youth development: A systematic review and meta-analysis. Int. Rev. Sport Exerc. Psychol. 2021, 16, 368–395. [Google Scholar] [CrossRef]
  21. Morgan, H.; Parker, A.; Marturano, N. Evoking hope in marginalised youth populations through non-formal education: Critical pedagogy in sports-based interventions. Br. J. Sociol. Educ. 2021, 42, 307–332. [Google Scholar] [CrossRef]
  22. Rees, D.I.; Schnepel, K.T. College Football Games and Crime. J. Sport. Econ. 2009, 10, 68–87. [Google Scholar] [CrossRef]
  23. Card, D.; Dahl, G.B. Family Violence and Football: The Effect of Unexpected Emotional Cues on Violent Behavior. Q. J. Econ. 2011, 126, 103–143. [Google Scholar] [CrossRef] [PubMed]
  24. Kurland, J.; Tilley, N.; Johnson, S. Football pollution: An investigation of spatial and temporal patterns of crime in and around stadia in England. Secur. J. 2017, 31, 665–684. [Google Scholar] [CrossRef]
  25. Marie, O. Police and thieves in the stadium: Measuring the (multiple) effects of football matches on crime. J. R. Stat. Soc. Ser. A (Stat. Soc.) 2016, 179, 273–292. [Google Scholar] [CrossRef]
  26. Brantingham, P.L.; Brantingham, P.J. Nodes, paths and edges: Considerations on the complexity of crime and the physical environment. J. Environ. Psychol. 1993, 13, 3–28. [Google Scholar] [CrossRef]
  27. Leroch, M.A. Punishment as Defiance: Deterrence and Perverse Effects in the Case of Expressive Crime. CESifo Econ. Stud. 2014, 60, 581–598. [Google Scholar] [CrossRef]
  28. Summers, L.; Johnson, S.D. Does the Configuration of the Street Network Influence Where Outdoor Serious Violence Takes Place? Using Space Syntax to Test Crime Pattern Theory. J. Quant. Criminol. 2017, 33, 397–420. [Google Scholar] [CrossRef]
  29. Jiang, C.; Liu, L.; Qin, X.; Zhou, S.; Liu, K. Discovering Spatial-Temporal Indication of Crime Association (STICA). ISPRS Int. J. Geo-Inf. 2021, 10, 67. [Google Scholar] [CrossRef]
  30. Wang, R.; Li, Y. Bayesian Structural Time Series and Geographically Weighted Logistic Regression Modelling Impacts of COVID-19 Lockdowns on the Spatiotemporal Patterns of London’s Crimes. ISPRS Int. J. Geo-Inf. 2024, 13, 18. [Google Scholar] [CrossRef]
  31. Cohn, E.G.; Rotton, J. Even criminals take a holiday: Instrumental and expressive crimes on major and minor holidays. J. Crim. Justice 2003, 31, 351–360. [Google Scholar] [CrossRef]
  32. College of Policing. Hot Spots Policing. 2022. Available online: https://www.college.police.uk/guidance/hot-spots-policing (accessed on 15 October 2025).
  33. Block, C.R.; Block, R. Street Gang Crime in Chicago; U.S. Department of Justice: Washington, DC, USA, 1993. [Google Scholar]
  34. Felson, M. Crime and Nature; SAGE Publications: Thousand Oaks, CA, USA, 2006. [Google Scholar]
  35. Leroch, M.A. Crime: Expressive Crime and the Law. In Encyclopedia of Law and Economics; Springer: Berlin/Heidelberg, Germany, 2019. [Google Scholar] [CrossRef]
  36. Sampsell-Jones, T. Culture and Contempt: The Limitations of Expressive Criminal Law. Seattle Univ. Law Rev. 2005, 27, 133. [Google Scholar]
  37. Bean, P.; Billingsley, R. Drugs, Crime and Informers. In Informers; Willan: New York, NY, USA, 2001; pp. 37–49. [Google Scholar]
  38. Shepard, D. A two-dimensional interpolation function for irregularly-spaced data. In Proceedings of the 23rd ACM National Conference, New York, NY, USA, 27–29 August 1968; pp. 517–524. [Google Scholar]
  39. Moran, P.A.P. Notes on continuous stochastic phenomena. Biometrika 1950, 37, 17–23. [Google Scholar] [CrossRef]
  40. Lee, S.I. Developing a bivariate spatial association measure: An integration of Pearson’s r and Moran’s I. J. Geogr. Syst. 2001, 3, 369–385. [Google Scholar] [CrossRef]
  41. Anselin, L. Spatial externalities, spatial multipliers, and spatial econometrics. Int. Reg. Sci. Rev. 2003, 26, 153–166. [Google Scholar] [CrossRef]
  42. Anselin, L. Local Indicators of Spatial Association—LISA. Geogr. Anal. 1995, 27, 93–115. [Google Scholar] [CrossRef]
  43. Cleveland, R.B.; Cleveland, W.S.; McRae, J.E.; Terpenning, I. STL: A seasonal-trend decomposition procedure based on loess. J. Off. Stat. 1990, 6, 3–73. [Google Scholar]
  44. Krake, P.; Kugler, P.; Sachs, S.; Schmitt, S. Uncertainty-aware robust trend extraction for time series decomposition. Inf. Sci. 2024, 660, 119685. [Google Scholar] [CrossRef]
  45. Itskovich, Y. Economic Inequality, Relative Deprivation, and Crime: An Individual-Level Examination. Justice Q. 2024, 42, 637–658. [Google Scholar] [CrossRef]
  46. Ciacci, A.; Tagliafico, G. Measuring the Existence of a Link between Crime and Social Deprivation within a Metropolitan Area. Rev. Estud. Andal. 2020, 40, 192–194. [Google Scholar] [CrossRef]
  47. Reilly, J.; Naumann, D.; Morris, L.; Blackburn, L.; Brooks, A. Injury by knife crime amongst children is associated with socioeconomic deprivation: An observational study. Pediatr. Surg. Int. 2022, 39, 8. [Google Scholar] [CrossRef] [PubMed]
  48. McCall, P.L.; Land, K.C.; Dollar, C.B.; Parker, K.F. The Age Structure–Crime Rate Relationship: Solving a Long-Standing Puzzle. J. Quant. Criminol. 2013, 29, 167–190. [Google Scholar] [CrossRef]
  49. Marvell, T.B.; Moody, C.E. Age Structure and Crime Rates: The Conflicting Evidence. J. Quant. Criminol. 1991, 7, 237–273. [Google Scholar] [CrossRef]
  50. Tottenham Hotspur Football Club. Getting Here–Travel Advice; Tottenham Hotspur Football Club: London, UK, 2025; Available online: https://www.tottenhamhotspur.com/the-stadium/attending-matches/getting-here/ (accessed on 15 October 2025).
  51. Metropolitan Police. Hermitage and Gardens: Our Priorities; Metropolitan Police: London, UK, 2025. [Google Scholar]
  52. Menaker, B.; McGranahan, D. Game-day alters crime pattern in the vicinity of sport stadiums. J. Sport Manag. 2019, 4. Available online: https://www.researchgate.net/publication/361880450_Game_Day_Alters_Crime_Pattern_in_the_Vicinity_of_Sport_Venues_in_Cleveland_OH (accessed on 15 October 2025).
  53. Ristea, A.; Kurland, J.; Resch, B.; Leitner, M.; Langford, C. Estimating the spatial distribution of crime events in urban environments. Environ. Plan. B Urban Anal. City Sci. 2018, 45, 1109–1130. [Google Scholar] [CrossRef]
  54. Ge, Q.; Sarmiento-Barbieri, I.; McMillen, D. Sporting events, emotional cues, and crime: Spatial and temporal evidence from Chicago. J. Econ. Behav. Organ. 2018, 146, 236–257. [Google Scholar] [CrossRef]
  55. Planells Struse, S.; Montolio, D. The effect of football matches on crime patterns in Barcelona. Reg. Sci. Urban Econ. 2014, 44, 1–7. [Google Scholar] [CrossRef]
  56. Montolio, D.; Planells, S. Measuring the negative externalities of a private leisure activity: Hooliganism in football matches. J. Sport. Econ. 2015, 16, 496–522. [Google Scholar] [CrossRef]
  57. Zhang, D. On the subway safety and crime prevention in city. J. Urban Manag. 2013, 2, 33–46. [Google Scholar]
  58. Kadar, C.; Feuerriegel, S. Leveraging mobility flows from location technology for crime prediction. Comput. Environ. Urban Syst. 2020, 83, 101514. [Google Scholar] [CrossRef]
  59. Chen, X.; Ye, Z. Subway passenger flow prediction for special events using Bi-LSTM neural networks. Transp. Res. Part C Emerg. Technol. 2020, 111, 1–16. [Google Scholar] [CrossRef]
  60. Huang, J.; Zhang, M. Identifying subway passenger flow under large-scale events. J. Transp. Geogr. 2021, 92, 103034. [Google Scholar] [CrossRef]
  61. Deelen, I.; Jansen, W. Do objective neighbourhood characteristics relate to adolescents’ leisure activities and crime involvement? J. Youth Stud. 2017, 20, 997–1016. [Google Scholar] [CrossRef]
  62. Roncek, D.; Maier, P. Bars, blocks, and crimes revisited: Linking the theory of routine activities to the empiricism of “hot spots”. Criminology 1991, 29, 725–753. [Google Scholar] [CrossRef]
  63. Asselineau, M. Leisure places downstairs: A pleasure or a failure? Urban Stud. 1998, 35, 1589–1606. [Google Scholar] [CrossRef]
  64. Bae, J. “Hobby or work extension?” Exploring the characteristics of corporate sports clubs. Int. J. Hum. Resour. Manag. 2025, 36, 1123–1147. [Google Scholar] [CrossRef]
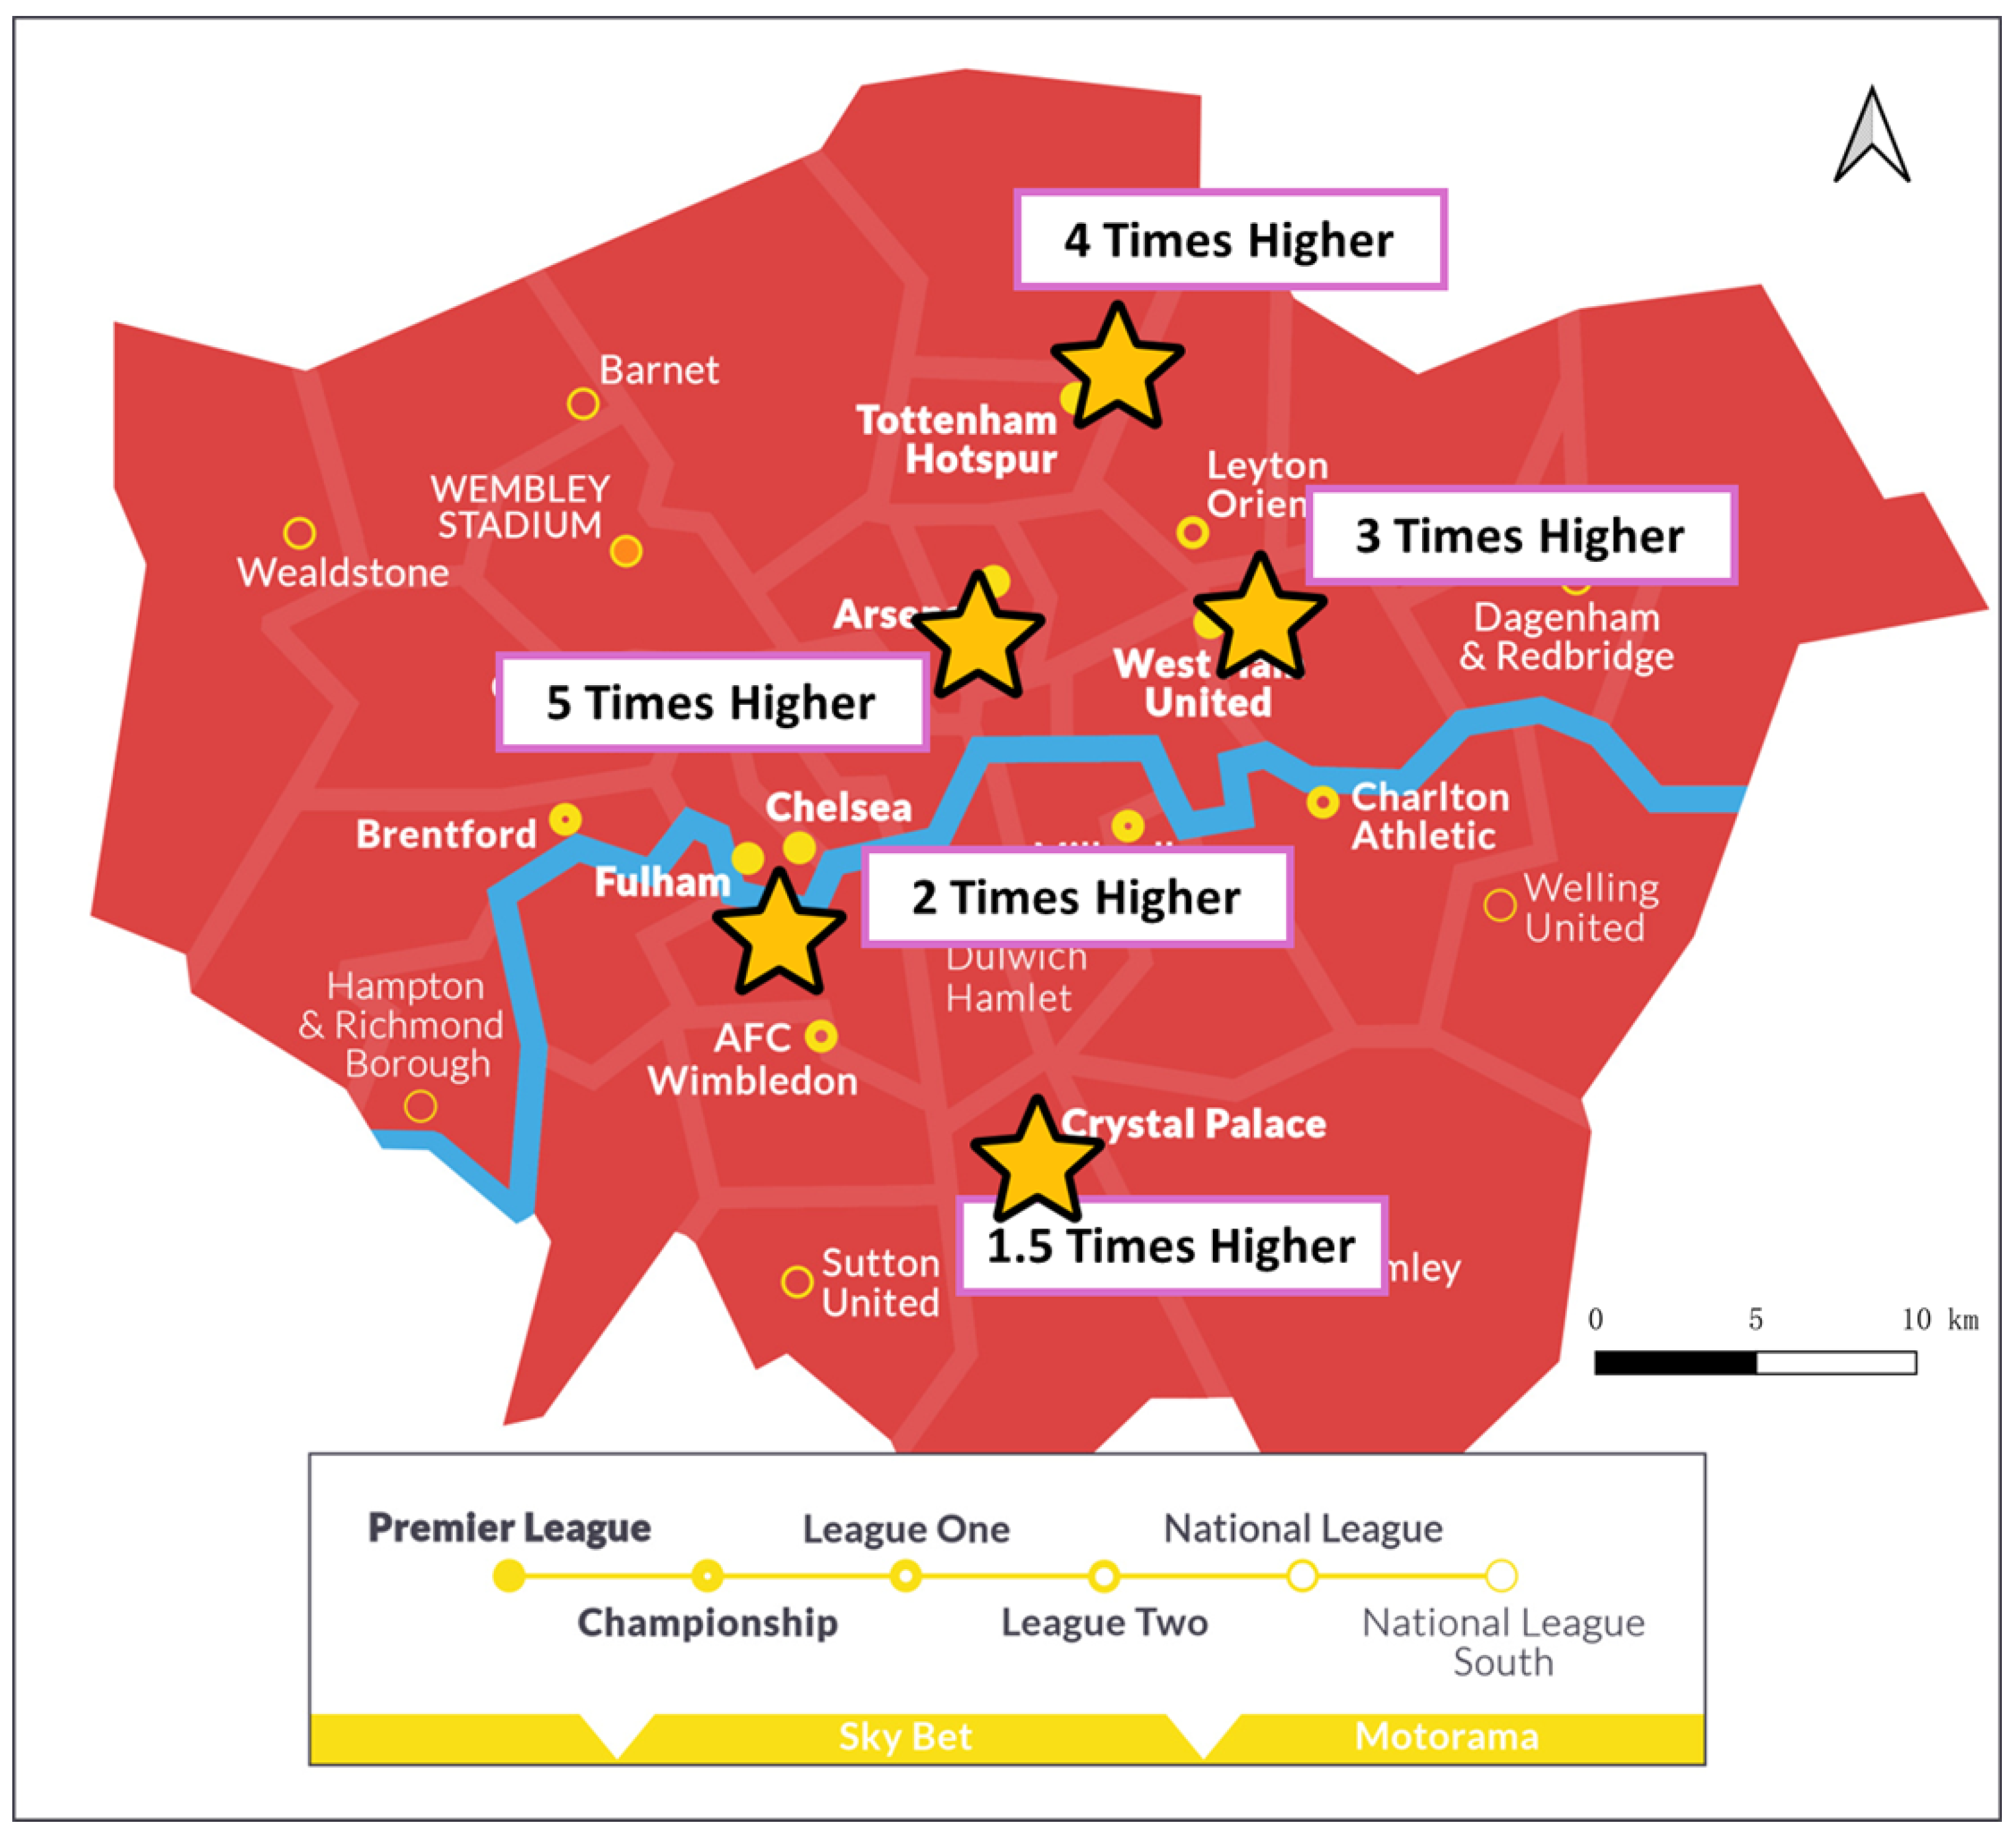
Figure 1. Entry and exit passenger flow at nearby tube stations on match days versus non-match days. The star symbol indicates the location of main stadiums in London. Match days experienced 2–5 times higher active passenger volumes compared to non-match days.
Ijgi 14 00409 g001
Figure 2. Research Flow Chart.
Ijgi 14 00409 g002
Figure 3. Local Bivariate Moran’s I: Expressive Crime vs. Sport Clubs in London.
Ijgi 14 00409 g003
Figure 4. Crime Type Distribution on Non-Match Days in Northumberland Park.
Ijgi 14 00409 g004
Figure 5. Crime Type Distribution on Match Days in Northumberland Park.
Ijgi 14 00409 g005
Figure 6. STL Decomposition of Expressive Crimes in Northumberland Park (with Match Days).
Ijgi 14 00409 g006
Figure 7. STL Decomposition of Acquisitive Crimes in Northumberland Park (with Match Days).
Ijgi 14 00409 g007
Figure 8. STL Decomposition of Expressive Crimes in Haringey except Northumberland Park (with Match Days).
Ijgi 14 00409 g008
Figure 9. Event Study: Dynamic Effects of Match Days on Expressive Offences.
Ijgi 14 00409 g009
Figure 10. Effect of Match Day on Expressive Crime (DiD Coefficients per Ward).
Ijgi 14 00409 g010
Figure 11. Spatial Distribution of GTWR Mean Coefficients for Subway Tap-in Activity and Sports Clubs in Haringey.
Ijgi 14 00409 g011
Figure 12. The GTWR coefficient of demographic control variables.
Ijgi 14 00409 g012
Figure 13. Temporal Dynamics of GTWR Coefficients for Subway Tap-in Activity and Sports Clubs.
Ijgi 14 00409 g013
Table 1. Data sources used in this study.
CategoryData Type & SizeSourceYearDescription
CrimeCrime Records in London & 1,115,706 recordsUK Police Open Data Portal (data.police.uk)2023Point-level crime records across London, including location, crime type, and month of occurrence.
Crime Counts in Haringey & 37,391 recordsLondon Borough of Haringey Council2023Daily ward-level crime counts in Haringey.
SportsSports Clubs & 7134 clubsLondon Sport2023Number of sports clubs per ward in London.
Football Matches & 121 matchesPremier League (official website)2023Match schedule including date, teams, and results for Tottenham Hotspur Stadium.
Socio-
demographic
Covariates
Census Data & 8 × 4994 entriesUK Census 2021 (ONS)2021Demographic and socioeconomic indicators: age structure, sex, economic activity, health, education, unemployment.
Index of Multiple Deprivation (IMD) & 7 × 4994 entriesUK Ministry of Housing, Communities & Local Government (MHCLG)2019Composite deprivation score at LSOA level, combining seven weighted domains (income, employment, education, health, crime, housing, environment); aggregated to the ward level in this study.
Underground Passenger Flow & 312,191 entries and exitsTransport for London (TfL)2023Daily tap-in and tap-out counts at each Underground station.
Table 2. Variance Inflation Factor (VIF) for GTWR variables.
FeatureVIF
TapIDW1.661
Clubs1.983
Income Deprivation8.491
Health Deprivation8.719
Living Environment Deprivation2.227
Crime Deprivation7.060
Aged 0 to 19 years1.594
Aged 40 to 59 years3.976
Male Percentage2.310
Transport Landuse Percentage3.690
Population Density5.462
12-Month Worked Rate2.116
Disclaimer/Publisher’s Note: The statements, opinions and data contained in all publications are solely those of the individual author(s) and contributor(s) and not of MDPI and/or the editor(s). MDPI and/or the editor(s) disclaim responsibility for any injury to people or property resulting from any ideas, methods, instructions or products referred to in the content.