Article

Characterization and Modelling of Environmental Crime: A Case Study Applied to the Canary Islands (Spain)

by
Lorenzo Carlos Quesada-Ruiz
1,*,
Nicolás Ferrer-Valero
2 and
Leví García-Romero
1
1
Grupo de Geografía Física, Medio Ambiente y Tecnologías de la Información Geográfica, Instituto de Oceanografía y Cambio Global (IOCAG), Universidad de Las Palmas de Gran Canaria (ULPGC), 35003 Las Palmas de Gran Canaria, Spain
2
Departamento de Geografía, Universidad Complutense de Madrid, 28040 Madrid, Spain
*
Author to whom correspondence should be addressed.
ISPRS Int. J. Geo-Inf. 2025, 14(11), 410; https://doi.org/10.3390/ijgi14110410
Submission received: 2 September 2025 / Revised: 15 October 2025 / Accepted: 20 October 2025 / Published: 22 October 2025

Abstract

The escalating environmental crisis and the threat posed by environmental crime demand more effective prevention strategies. The predictive mapping of environmental crimes can address this challenge by improving monitoring and response. This study proposes an analysis and modelling of the occurrence of environmental crimes in the Canary Islands, a territory of exceptional ecological value and strong tourism and urban sprawl pressures. Four types of illegal activity were examined: buildings and constructions, mining and tilling, solid waste dumping, and liquid waste discharging. A predictive modelling framework based on Random Forest (RF) machine learning algorithms was applied to identify spatial patterns and environmental crime potential. A colour-based environmental crime potential map was generated for each island, showing the likelihood of 0, 1, 2, 3, or all 4 types of environmental crime. Findings reveal that 43.2% of the surface area of the islands could potentially be affected by at least one crime type. Potential occurrences are lower in protected natural areas, in islands with lower population densities and in inland areas compared to coastal regions. The methodology provides a foundation for future research which could assist policymakers and environmental protectors in combating and preventing environmental crimes more effectively and contribute to the preservation of their ecosystems.

Graphical Abstract

1. Introduction

The environmental crisis facing the planet has emerged as one of humanity’s most significant challenges. As the population and economic activity increase, pressure on natural ecosystems and resources intensifies and more pollutant emissions are generated. In this context, environmental crime poses a critical threat to environmental protection and the planet’s sustainability. Environmental crime is defined as behaviour that violates ecological and physical environmental protection norms [1,2]. The conceptualization of environmental offenses arose from concerns about the state of the environment in the last decades of the 20th century. Global alarms regarding various environmental issues related to air and soil pollution, water, deforestation, declining biodiversity, landscape destruction, etc., have prompted a significant number of countries to generate legislative frameworks and regulations to prevent environmental crimes [3]. These legislative advancements are largely driven by the immense and indeterminate environmental, human and financial costs of such crimes [4]. In legislative terms, there is general consensus in identifying environmental crimes as actions that cause damage to the quality of air (e.g., [5]), soil or subsoil (e.g., [6]), surface or groundwater (e.g., [7]), the habitability of human living spaces (e.g., [8]), flora (e.g., [9]), and fauna (e.g., [10]). Such damage is mainly caused by illegal constructions and buildings [11], extraction and tilling of terrestrial soil or subsoil [12], dumping of solid terrestrial waste [11,13], discharge of liquid waste [14], trafficking, trading and mutilation of protected species [15], greenhouse gas emissions [16], forest fires [17], and poor agroforestry practices [18].
Research into environmental crimes can be tackled from different perspectives, as noted by [19]. One approach focuses on the perpetrators of the crime and the victims of the damage, entailing consideration of environmental justice for humans and ecological justice for the biosphere. Another perspective centres on the geographical level at which the environmental crime/damage affects, including international, national, regional or local levels. A third approach concentrates on time factors, including short- or long-term effects, manifest or latent impacts, and immediate or enduring social consequences. In line with current trends in criminology studies, recent studies emphasize the importance of the characteristics of the location where crimes occur [20,21]. Both ecology and criminology theorists, along with related academic thinkers, share the idea that the place is a criminal event’s unit of analysis and that the dynamic nature and characteristics of that place constitute an opportunity for crime [21]. Thus, as with common crimes [22], predictive mapping of the distribution of environmental crimes could prove useful information for their management and prevention. In this sense, the tracking of environmental crime through data mapping can provide the opportunity to study, analyse and pursue environmental offenses [23]. The identification of potentially affected areas, along with those prone to future environmental crimes, enhances the development of environmental crime atlases. Such comprehensive mapping can significantly improve monitoring policies, increase public awareness, and strengthen regulatory frameworks to prevent landscape and environmental degradation [3]. Additionally, for areas already impacted, the implementation of targeted mitigation measures can further safeguard these vulnerable environments.
Mapping potential criminality is a complex process that requires suitable models. Depending on the nature of the inference, we can distinguish between models driven by expert knowledge (knowledge-driven) and by data (data-driven). Models guided by expert knowledge utilize subjective experience conditioned by, for example, an understanding of criminal processes through multicriteria analyses (e.g., [24]). For their part, databased models employ objective evidence rooted in the association of independent features to explain criminality. These models are also referred to as supervised or predictive models, requiring differentiation from future simulation models. Unlike simulation models, predictive models do not necessarily aim to infer into the future but can also be used to characterize a phenomenon and understand its spatial distribution either currently or retrospectively [22]. In parallel, evidence from urban and environmental criminology shows that the spatial configuration of places can mitigate crime risks (Crime Prevention Through Environmental Design, CPTED) [25], and that environmental context (e.g., greenspace distribution) helps explain crime patterns [26]. Traditional hot-spot and regression-based approaches are informative but may struggle to capture non-linear interactions among spatial, social and environmental variables [27]. Against this backdrop, ensemble methods such as Random Forest (RF) are advantageous because they handle high-dimensional predictors, are relatively robust to overfitting, and provide variable-importance measures that aid interpretation [28,29,30]. While RF has been applied to specific environmental offenses such as illegal dumping [31], broader applications to multiple environmental crime types remain limited, particularly in island contexts where tourism and urban expansion intensify pressures [32]. The cartographic representation of environmental crime potential is facilitated through the use of Geographic Information Systems (GIS). This technology is instrumental in visualizing, analysing, and interpreting data to understand and communicate relationships, patterns, and trends in the spatial context. By integrating predictive models with GIS, we aim to identify areas within the Canary Archipelago that are at heightened risk for environmental crimes. This synthesis of predictive modelling and spatial analysis empowers us to generate detailed maps that highlight potential environmental crime hotspots, thereby providing a foundational tool for targeted interventions and resource allocation by authorities and environmental agencies. While predictive models have been extensively applied to the analysis of prevalent crimes such as theft and homicide, as demonstrated in studies by Refs. [27,33], their application to environmental crime has been limited. Exceptions are certain studies which analysed the potentiality of crimes related to illegal dumping [31,34]. Additionally, evidence from other island systems underscores the close coupling between environmental pressures and economic development, reinforcing the relevance of an insular case such as the Canary Islands [32].
This study also builds on classic frameworks in environmental criminology. Routine Activity Theory [35] emphasizes that crime emerges from the convergence of motivated offenders, suitable targets, and the absence of capable guardianship, which resonates with the role of socio-economic and demographic pressures in shaping environmental crime risks. Likewise, Crime Pattern Theory [36] highlights how routine activities and spatial opportunities influence the distribution of offenses, directly relating to variables such as accessibility, land use intensity, and proximity to urban and touristic centers. The more than thirty features incorporated in our modelling, including population density, urban expansion, road networks, environmental protections, and land classifications, were selected to reflect these theoretical dimensions. These perspectives remain central in contemporary criminology, as shown by recent contributions that reaffirm the relevance of environmental criminology theories for crime prevention practice [37] and that synthesize the conceptual and methodological landscape of environmental crime studies [38]. In this context, the general aim of the present study is to generate environmental crime potential maps based on the analysis and modelling of a spatial database of environmental crimes that occurred in a recent period. For this purpose, the Canary Archipelago (Spain) was chosen as a case study. Building on this framework, the central research question guiding this study is: can predictive modelling, applied simultaneously to different types of environmental crimes, provide a new perspective for defining potential risk areas by generating an aggregated indicator of environmental crime potential? This guiding question frames the specific objectives of the research, which are: (i) to identify possible features related to the occurrence of environmental crimes; (ii) to create predictive models for the occurrence of each type of environmental crime and for each of the seven major islands in the archipelago; and (iii) to produce a global indicator of environmental crime potential. To achieve these objectives, we employ predictive modelling methodologies integrated with GIS, applying Random Forest algorithms to multiple types of environmental crimes. The ultimate goal is to provide a practical tool for use by administrations and entities involved in environmental management and protection to help prevent environmental crimes.

2. Study Area

This section aims to show the main physical, natural and social features of the study area, being the text ordered in the following sequence: (i) location and extension; (ii) main physical and natural features; (iii) main socio-economic features.
The Canary Islands are one of Spain’s sixteen autonomous regions and an Outermost Region of the European Union (EU). Located to the northwest of Africa, they lie 97 km off its coast and approximately 1400 km from the Iberian Peninsula and the rest of Europe (Figure 1). The archipelago comprises eight major (although La Graciosa Island has been excluded in this research) and four minor volcanic islands, totalling an area of 7447 km2. Of the islands considered in the present study, Tenerife is the largest with 2034 km2 and El Hierro the smallest with 268.7 km2.
The islands of highest altitude are Tenerife and La Palma (with respective peaks of 3718 m and 2426 m), and of lowest altitude Fuerteventura and Lanzarote (813 m and 670 m, respectively) (Figure 1). The islands originate from volcanic activity and boast diverse geomorphologies both inter-island and intra-island [39]. Renowned for hosting one of the world’s highest concentrations of endemic species, the terrestrial vascular flora of the islands encompasses 1995 species, 511 of which are endemic [40]. The islands have a total of 146 protected natural areas, which account for 40% of their total surface area, and are home to 4 of Spain’s 16 National Parks [41]. All the islands have been wholly or partially designated as UNESCO World Biosphere Reserves.
In 2022, the Canary Islands welcomed over 14 million national and international visitors [42]. Mass tourism mainly revolves around beach activities in Tenerife, Gran Canaria, Fuerteventura and Lanzarote. Conversely, a more minority rural, nature and health tourism predominates in less populated islands like El Hierro, La Gomera and La Palma. Although agriculture remains integral in certain rural regions, its economic impact has diminished over recent decades. The persistence of the sector can be largely attributed to support provided by the Common Agricultural Policy (CAP) of the EU [43]. In agriculture, the greenhouse-based irrigation-intensive cultivation of bananas and tomatoes, mainly for export, stands out in Gran Canaria, while in Tenerife and La Palma intensive banana and grapevine cultivation is the most important activity.
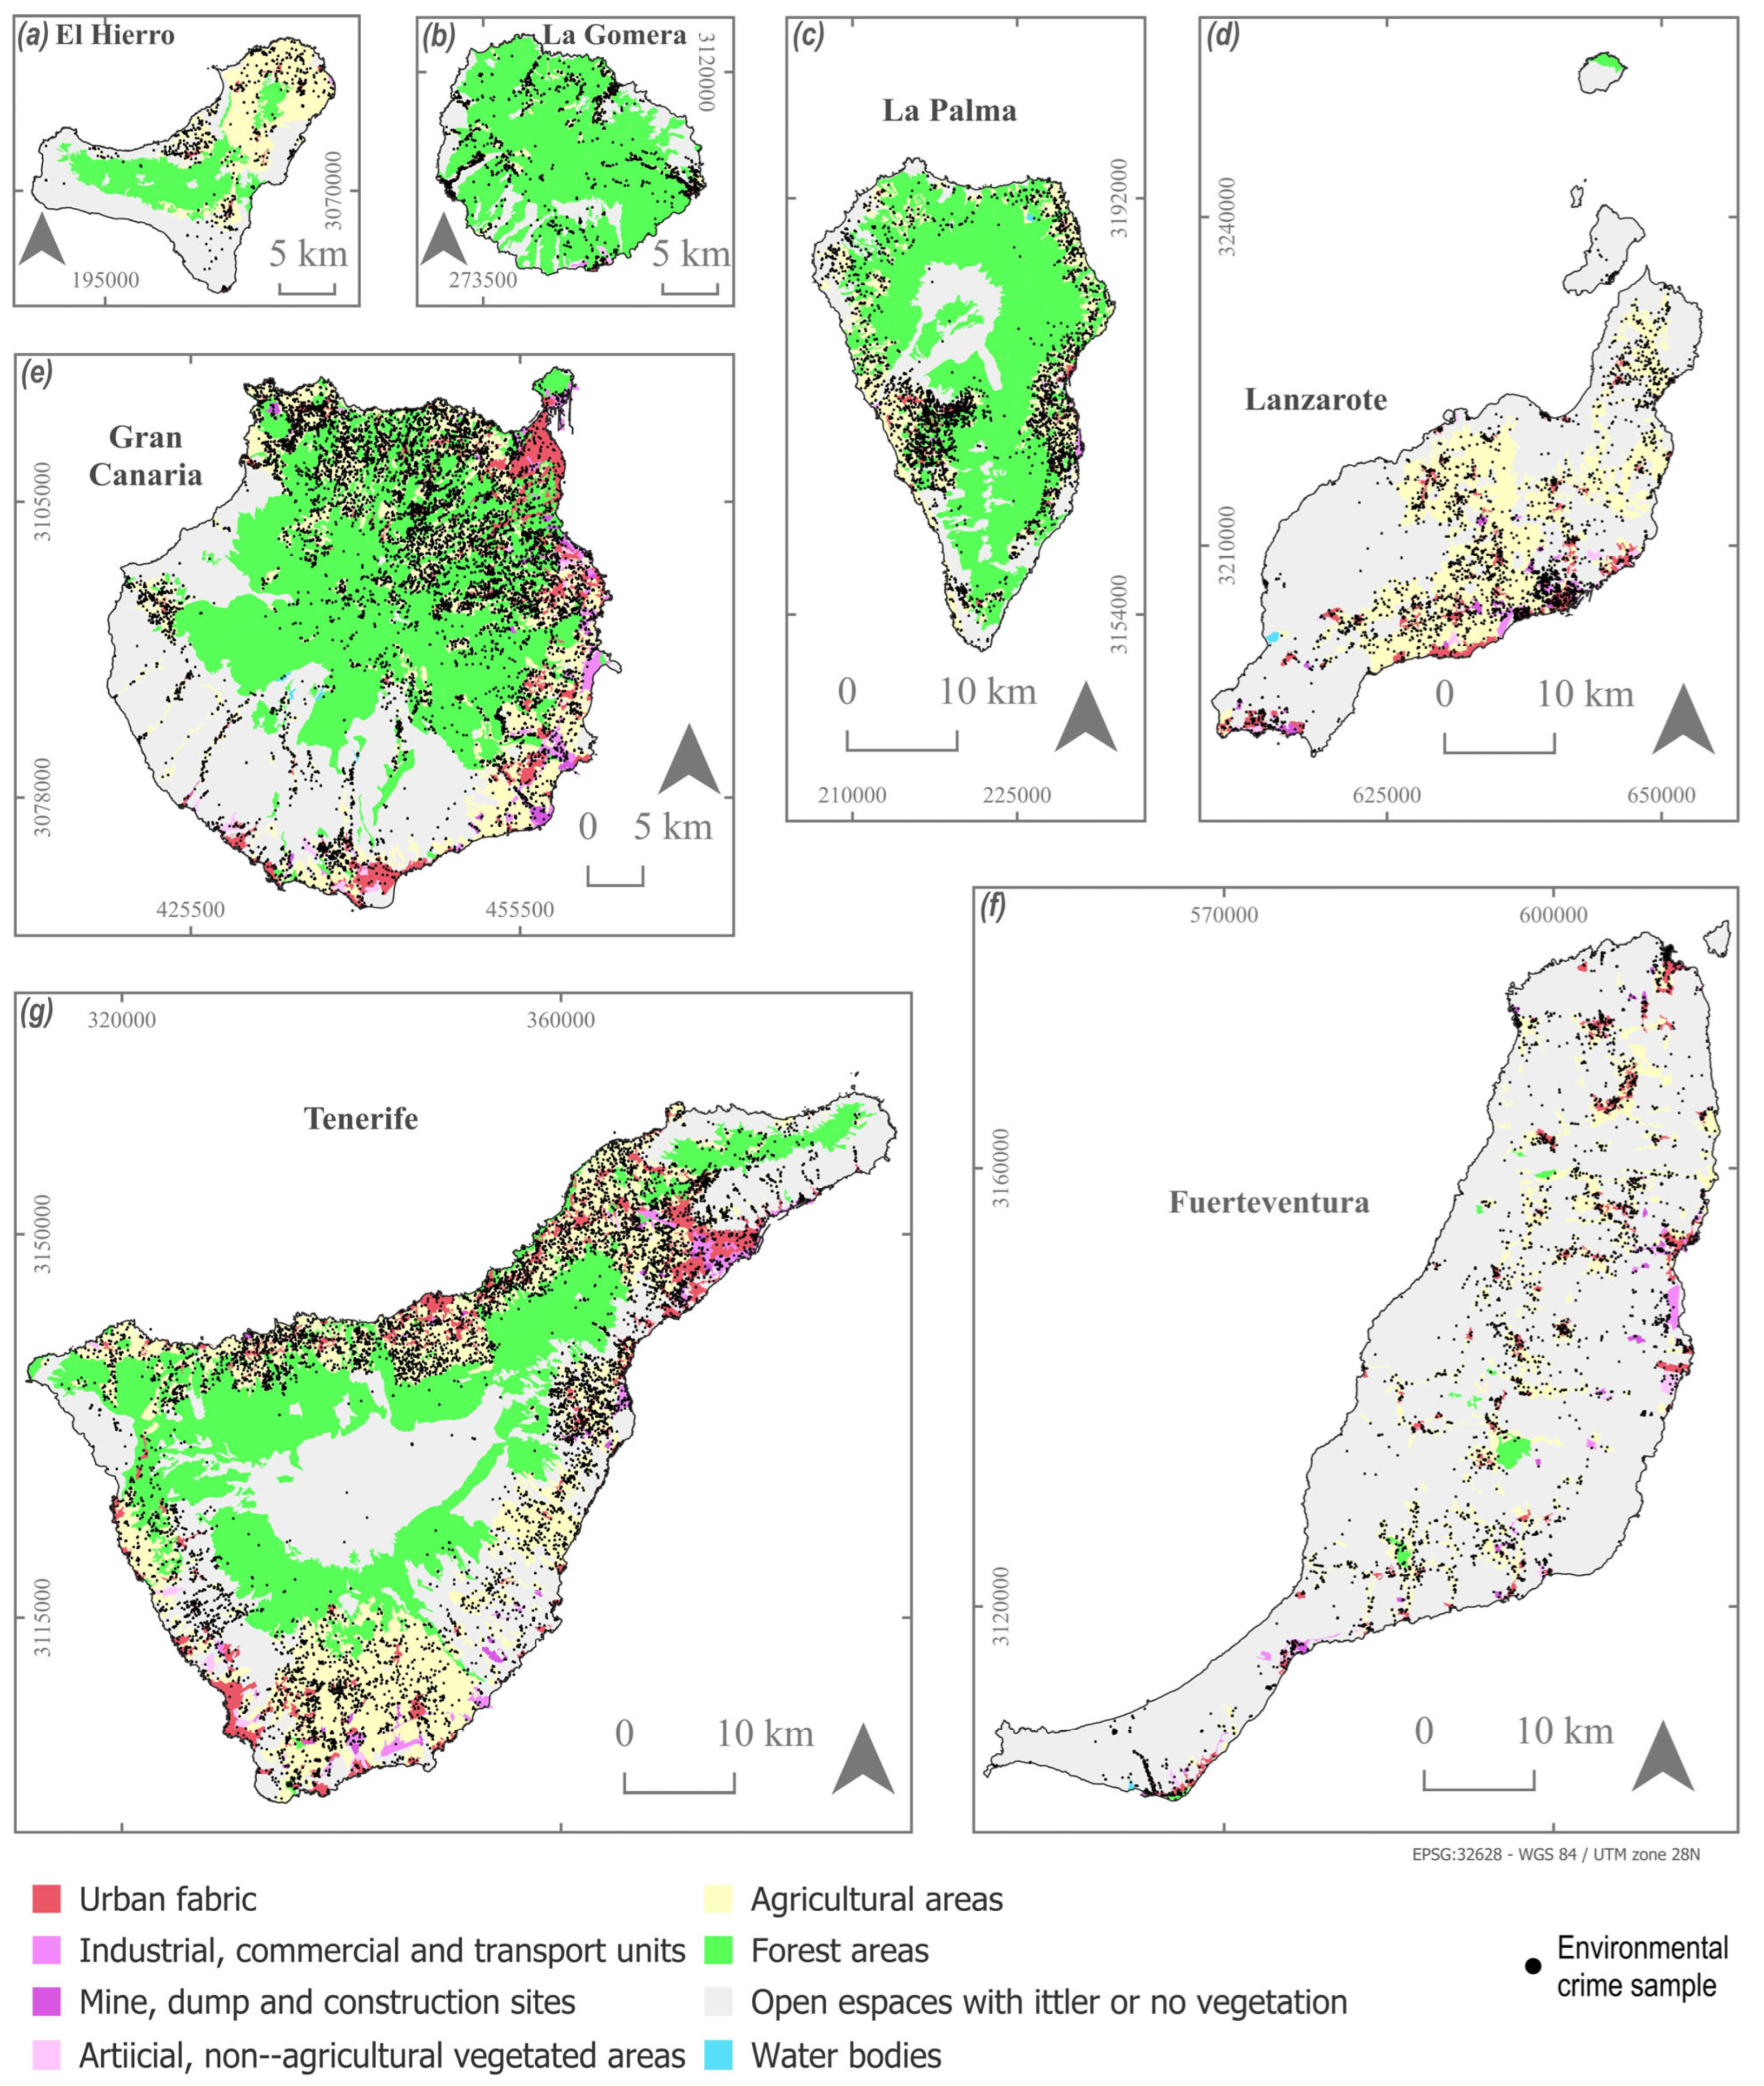
Tenerife and Gran Canaria are the most populated islands with 970,000 and 876,200 inhabitants, respectively [44], while La Gomera and El Hierro are the least populated with just 21,798 and 11,423 inhabitants, respectively [44]. The population density of the archipelago, averaging 292.19 inhabitants/km2, markedly exceeds the Spanish national average of 93.55 inhabitants/km2. Nonetheless, population density varies significantly across islands, with Gran Canaria and Tenerife leading at 548.41 and 456.54 inhabitants/km2, respectively. Furthermore, all the islands exhibit a predominant pattern of settlement and concentration of activities and especially urban fabric near the coast, according to the information provided by the Corine Land Cover 2018 shown in Figure 2 together with the environmental crime sampling. Economically, the archipelago ranks as the eighth largest autonomous region in terms of gross domestic product but has one of the nation’s highest unemployment rates at 15% [42] and is penultimate in per capita income, averaging 18,990 € [42]. Tourism, the primary economic driver of the region [45], has significantly fuelled the construction sector. Commercial activity is important and considerable, especially in the port areas of Gran Canaria and Tenerife, two of the Atlantic’s busiest cargo ports.

3. Methodology

3.1. Geographical Database

The information regarding environmental crimes in the Canary Islands was sourced from the Environmental Protection Agency of the Canary Government (ACPMN for its initials in Spanish). This dataset encompasses a total of 38,711 geolocated environmental crime cases recorded between 2001 and 2020. These crimes fall under categories such as illegal solid waste dumping (S), liquid waste discharging (L), constructions and buildings (B), and mining and tilling (M). Based on all these records, 28 databases were created, one for each island and environmental crime type. To elucidate potential reasons behind the occurrence of these environmental infractions, various physical, environmental and socio-economic features of the territory were integrated into each database. A summary of these features and their main sources is presented in Table 1, while the Supplementary Materials (Table S1) provide the specific sources and download links to ensure transparency and reproducibility. The physical features were both biotic (mainly the distribution of forested areas, protected natural spaces and vegetation greenness) and abiotic (mainly terrain elevation and slope using a digital elevation model used in Figure 1). The normalized difference vegetation index (NDVI), a measure of vegetation greenness, was calculated from Sentinel-2 images taken in the summer of 2019. NDVI is used to assess whether areas contain live green vegetation based on light absorption and reflection. The socio-economic data analysed included factors such as income level, employability, population structure, the Gini coefficient (a statistical measure of income distribution used to gauge economic inequality), and the average age of the population. This data was extracted from Spain’s National Institute of Statistics (INE for its initials in Spanish) at the census section level. The features related to land use (distribution of agricultural, industrial, service and residential uses) primarily originate from the PIMA Adapta Costas Canarias project [46].
Each feature was standardized, rasterized and resampled to a spatial resolution of 100 m. For the analysis, density values and Euclidean distances to agricultural, industrial, service, and residential uses were utilized. For the ensuing predictive analysis, values of all the aforementioned features were extracted for each environmental crime location. A random sample of 0 values was introduced for each database. This random sample was individually obtained for each island and environmental crime type following the conditions laid out by [47,48]: (i) multivariate information dissimilar to the locations of the recorded environmental crimes; (ii) distances exceeding the distance correlating to a 90% probability that a particular type of environmental crime would not occur; (iii) an equal number of positive and negative occurrence zones.

3.2. Predictive Modelling

After creating the various databases and filtering the data by typologies and islands, three Random Forest classification models were generated (Figure 3) to evaluate the effectiveness of models with and without feature selection, allowing a comprehensive assessment of how variable selection influences the predictive accuracy of environmental crime modelling. Afterwards, the classification of each type of environmental crime, feature selection, and model generation was performed using three different Random Forest (RF) models: (1) the standard Random Forest (RF) as a benchmark; (2) leveraging the Regularised Random Forest (RRF), applied to enhance robustness through regularised feature selection; and (3) a feature selection model (FS10) based on the ten most significant features selected by the RRF model [31]. The Random Forest algorithm, developed by [28], is a robust ensemble method capable of performing both classification and regression tasks [49]. This algorithm constructs multiple decision trees, each generated from a random subset of the data and a specific number of randomly selected features. The final prediction of the RF model is obtained by averaging the outputs of individual trees for regression tasks or by selecting the most frequent outcome (mode) for classification tasks. Feature selection is crucial to enhance both the accuracy and interpretability of the model. In this study, feature selection was performed based on the importance of each variable to the model’s predictive accuracy. Two main approaches were employed: (i) embedded methods: In the context of Random Forest, features are internally ranked based on their importance, usually measured by the mean decrease in accuracy or the increase in node impurity [50]. This approach is useful for identifying the most relevant features, although it does not necessarily define the optimal number of features; (ii) wrapper methods: To further refine the feature selection, we applied the Regularised Random Forest (RRF), an advanced approach that integrates regularization techniques to enhance the accuracy of feature selection [51]. The RRF method helps control the inclusion of less relevant variables by applying penalties to redundant or less important features, thereby reducing the risk of overfitting [29,52]. On the other hand, a separate model was developed by selecting the ten most significant features identified by the RRF model, which we refer to as the FS10 feature selection model. This selection was based on the ability of each feature to improve the model’s predictive accuracy, using a predefined number of relevant features.
Feature selection, particularly through Random Forest methods, was used for: (i) dimensionality reduction, by reducing the feature space, the model avoids the “curse of dimensionality,” which enhances the model’s capacity to learn from the data without being overwhelmed by an excess of variables [53]; (ii) improved interpretability, models with fewer but more relevant features are easier to interpret and replicate. They also reduce computational costs and avoid overfitting by focusing on the most significant predictors [54,55,56]; (iii) enhanced model generalization, selecting a meaningful subset of features improves the model’s generalization capability, enabling it to perform better on unseen data and reducing the likelihood of capturing noise rather than genuine patterns [50].
The RF algorithm was implemented using the R ‘mlr’ package [57]. By employing these feature selection strategies, our study effectively identifies the key land use features that significantly influence the occurrence of various types of environmental crimes, thus providing a more interpretable and robust predictive model.
For our study, the period of 2020 was selected as the timeframe for analysis. We used a training sample that constituted 75% of the cases and a test sample that comprised the remaining 25%. Validation of the models was conducted using overall accuracy (OA) and area under the curve (AUC) metrics. The performance of each model—Random Forest (RF), Regularized Random Forest (RRF), and FS10—was evaluated on both samples to determine the best performing model for each crime typology and island. Subsequently, these models were used to generate classification maps that illustrate the likelihood of crime occurrence on a binary scale: score 0 indicating no potential occurrence and score 1 indicating potential occurrence. To assess the overall potential for environmental crimes across the region, we aggregated the scores from the best-performing models for each of the four crime types. Each model’s output was simply summed to formulate a cumulative score. These combined scores were then classified on a scale from 0 to 4, where 0 indicates no or very low potential for environmental crime; 1 denotes low potential; 2 signifies medium potential; 3 represents high potential; and 4 indicates very high potential.

4. Results

4.1. Predictive Models Validation

The random forest models showed a high global accuracy. The overall accuracy (OA) values were above 80% in 83 of the 84 run models and higher than 90% in 53 (Table 2). In turn, the area under the curve (AUC) metric were above 0.8 in 71 of the 84 run models and higher than 0.9 in 17 (Table 2).
With respect to illegal constructions, most of the classification models reported OA values exceeding 90%, with the sole exception of the model from Gran Canaria, which reached an accuracy of 89.1% in RRF model. The AUC values reached 0.8 in almost all cases, with FS10 being the best performing model, with most values above 0.9. Classification models for Mining and tilling (M) crimes reported OA values surpassing 85% across all islands in one of the models (RF, RRF or FS10). Similarly, AUC values ranged between 0.8 and 0.9 across all islands in one of them (RF, RRF or FS10). The best performance was reached in the islands of La Gomera and Tenerife, with AUC values above 0.9 in almost all run models. For Solid waste (S) crimes, classification models gave OA values exceeding 90%, except for the Tenerife models, which showed a maximum of 89.3% in RRF. The AUC values were greater than 0.8 in almost all model runs. Finally, classification models for liquid waste (L) crimes also showed robust performance, with AO values above or very close to 90% and AUC values greater than 0.8 on all islands in one of the three models run.
The RRF and FS10 models gave the best results in terms of overall accuracy and were selected for aggregation. The aggregation of results incorporates all areas identified by the models with a value of 1, indicating potential occurrence of a specific environmental crime. Subsequently, these values were summed, and the total percentage was calculated relative to the areas designated with a value of 0.

4.2. Areas Potentially Affected by Environmental Crimes

According to the models RF, RRF and FS10, 21.2%, 15.7%, and 12.6% the Canary Islands territory, respectively, could be the potential scene of an environmental crime (Table 3). This can largely be attributed to the robust tourism and building activity, and in the case of El Hierro Lanzarote to the stringent restrictions on housing construction.
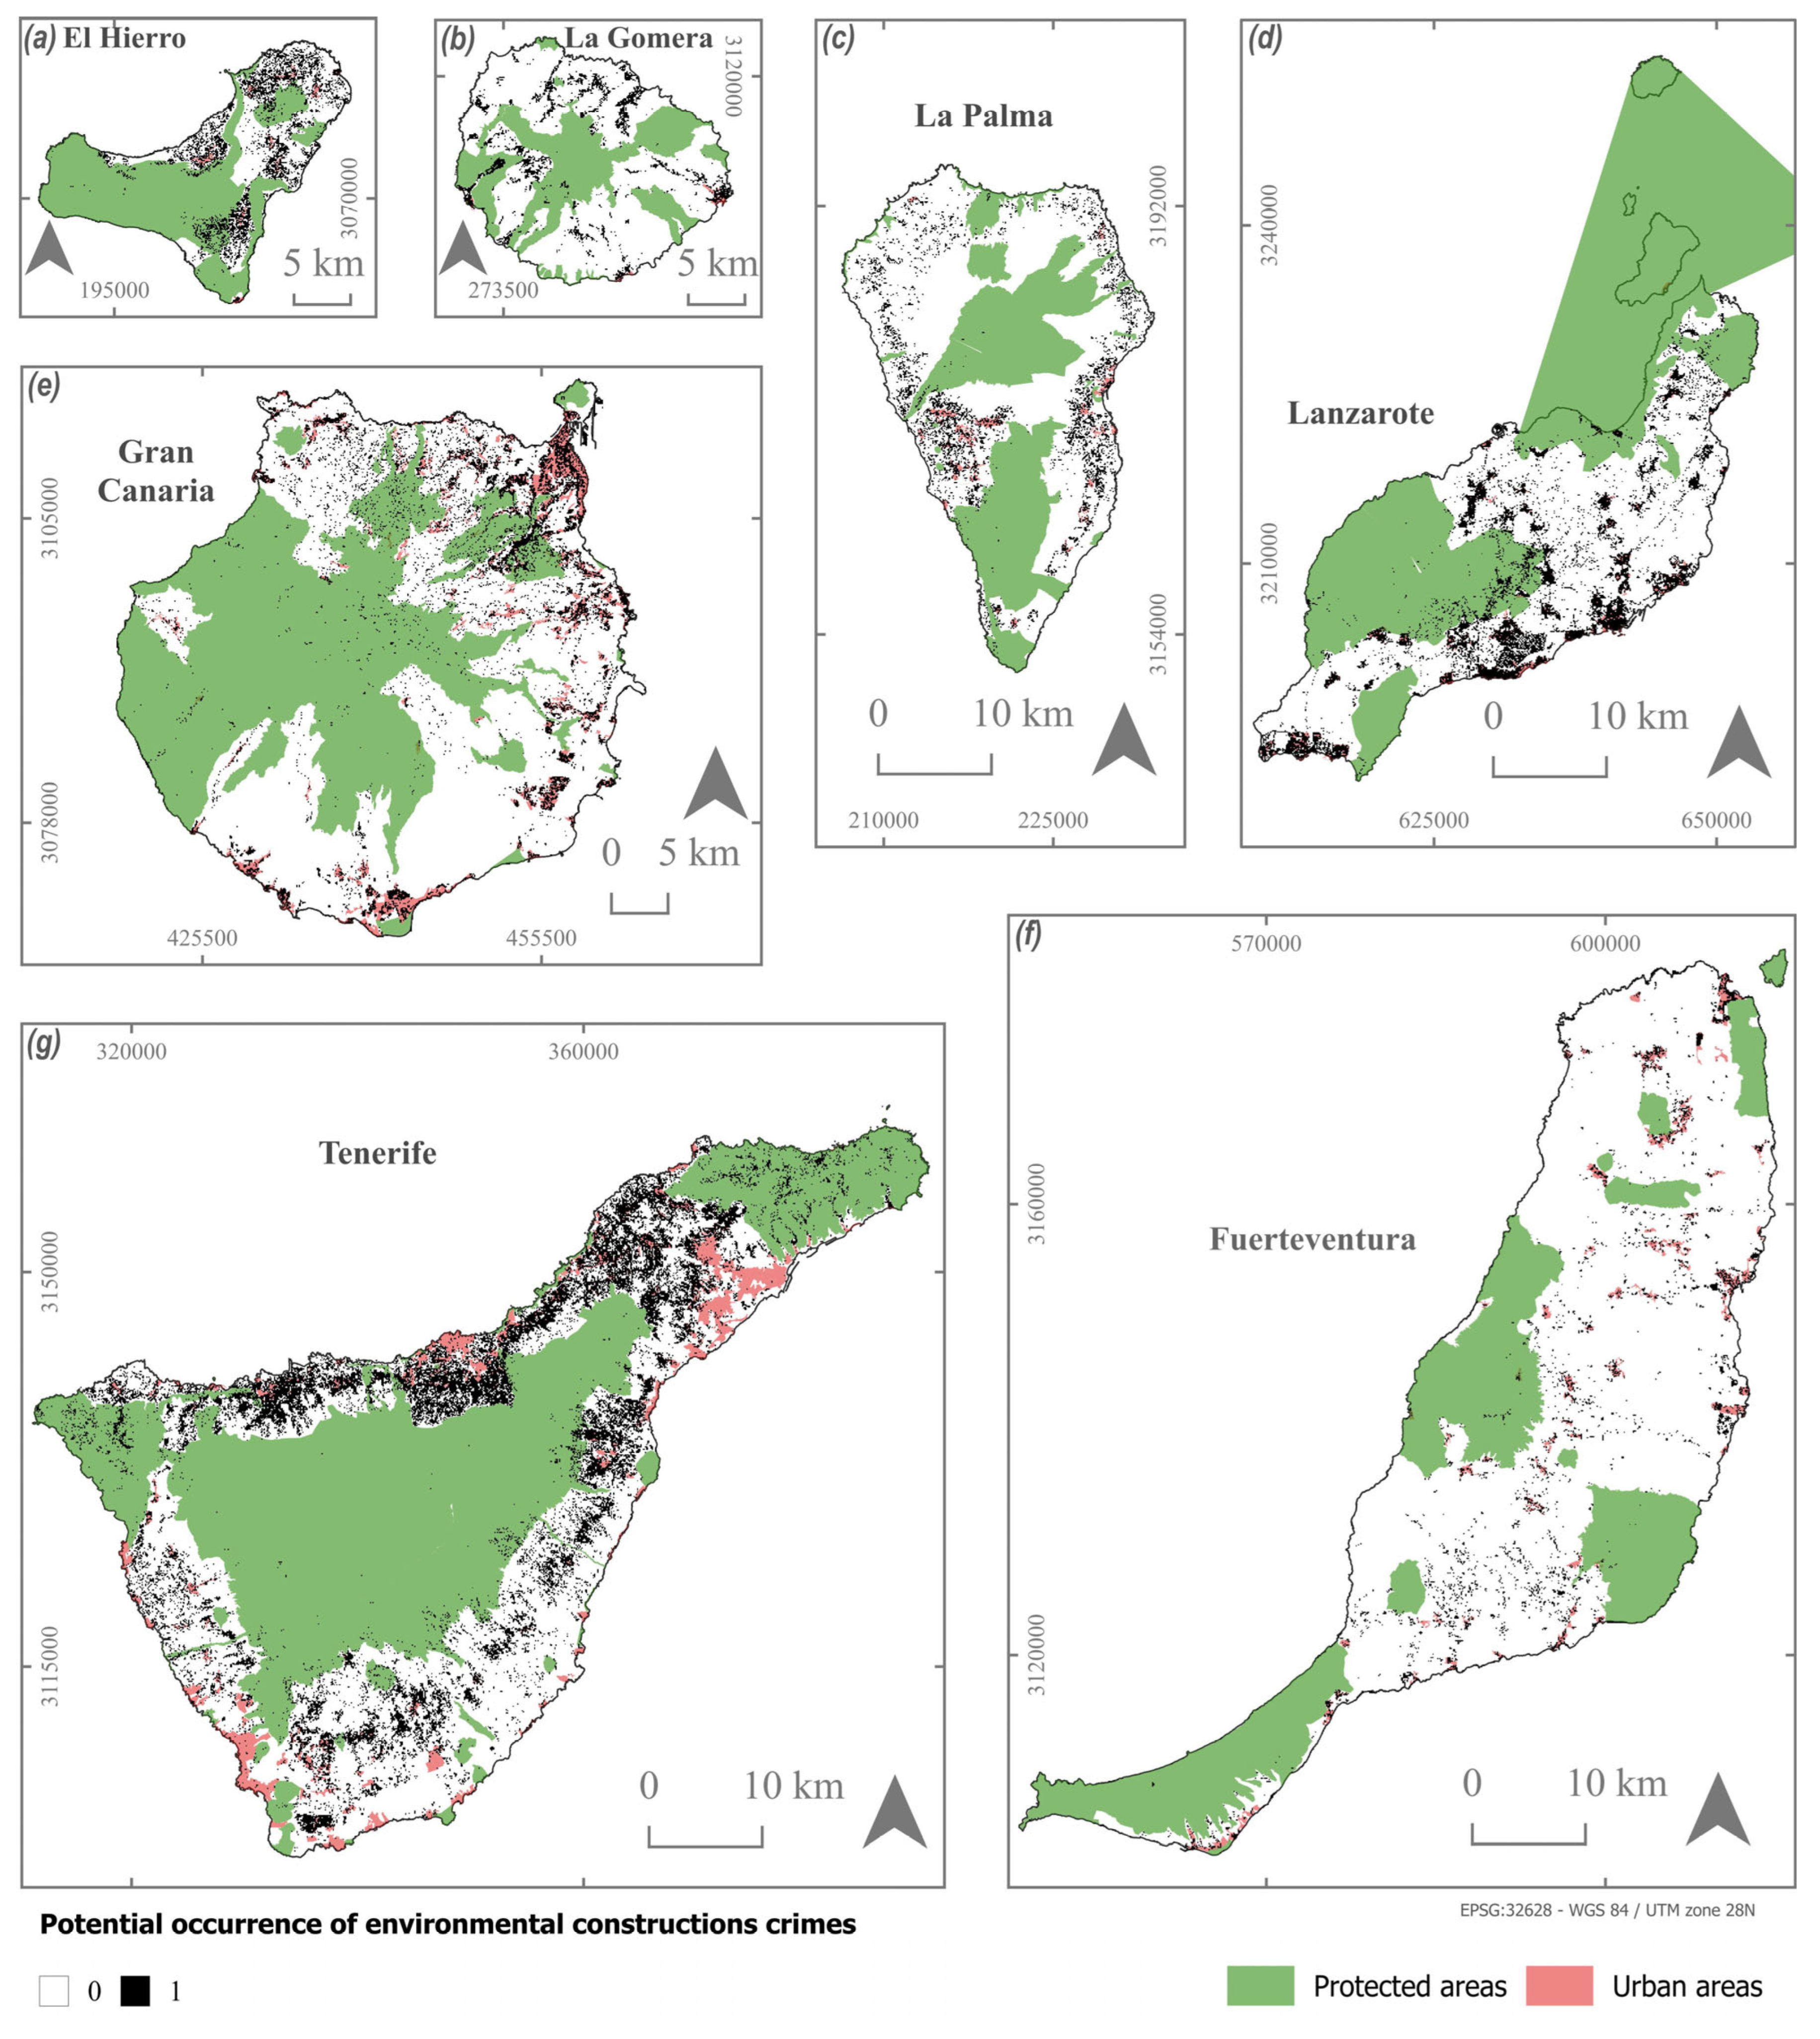
The most influential territorial features identified by the models in the geographical distribution of illegal constructions were proximity to residential accommodations, cultivated lands and industrial zones (see Table S1). Therefore, the derived predictive binary maps (Figure 4) indicate the highest potential incidence of new illegal constructions in the peripheries surrounding populated cores and in rural areas, as well as diminished potential in protected natural areas under greater surveillance. Tenerife may exhibit the highest potential due to its sustained demographic growth and urban sprawl, El Hierro reflects relatively high values linked to its small size and limited monitoring capacity, and Lanzarote displays strong pressures associated with intensive tourism activity [58].
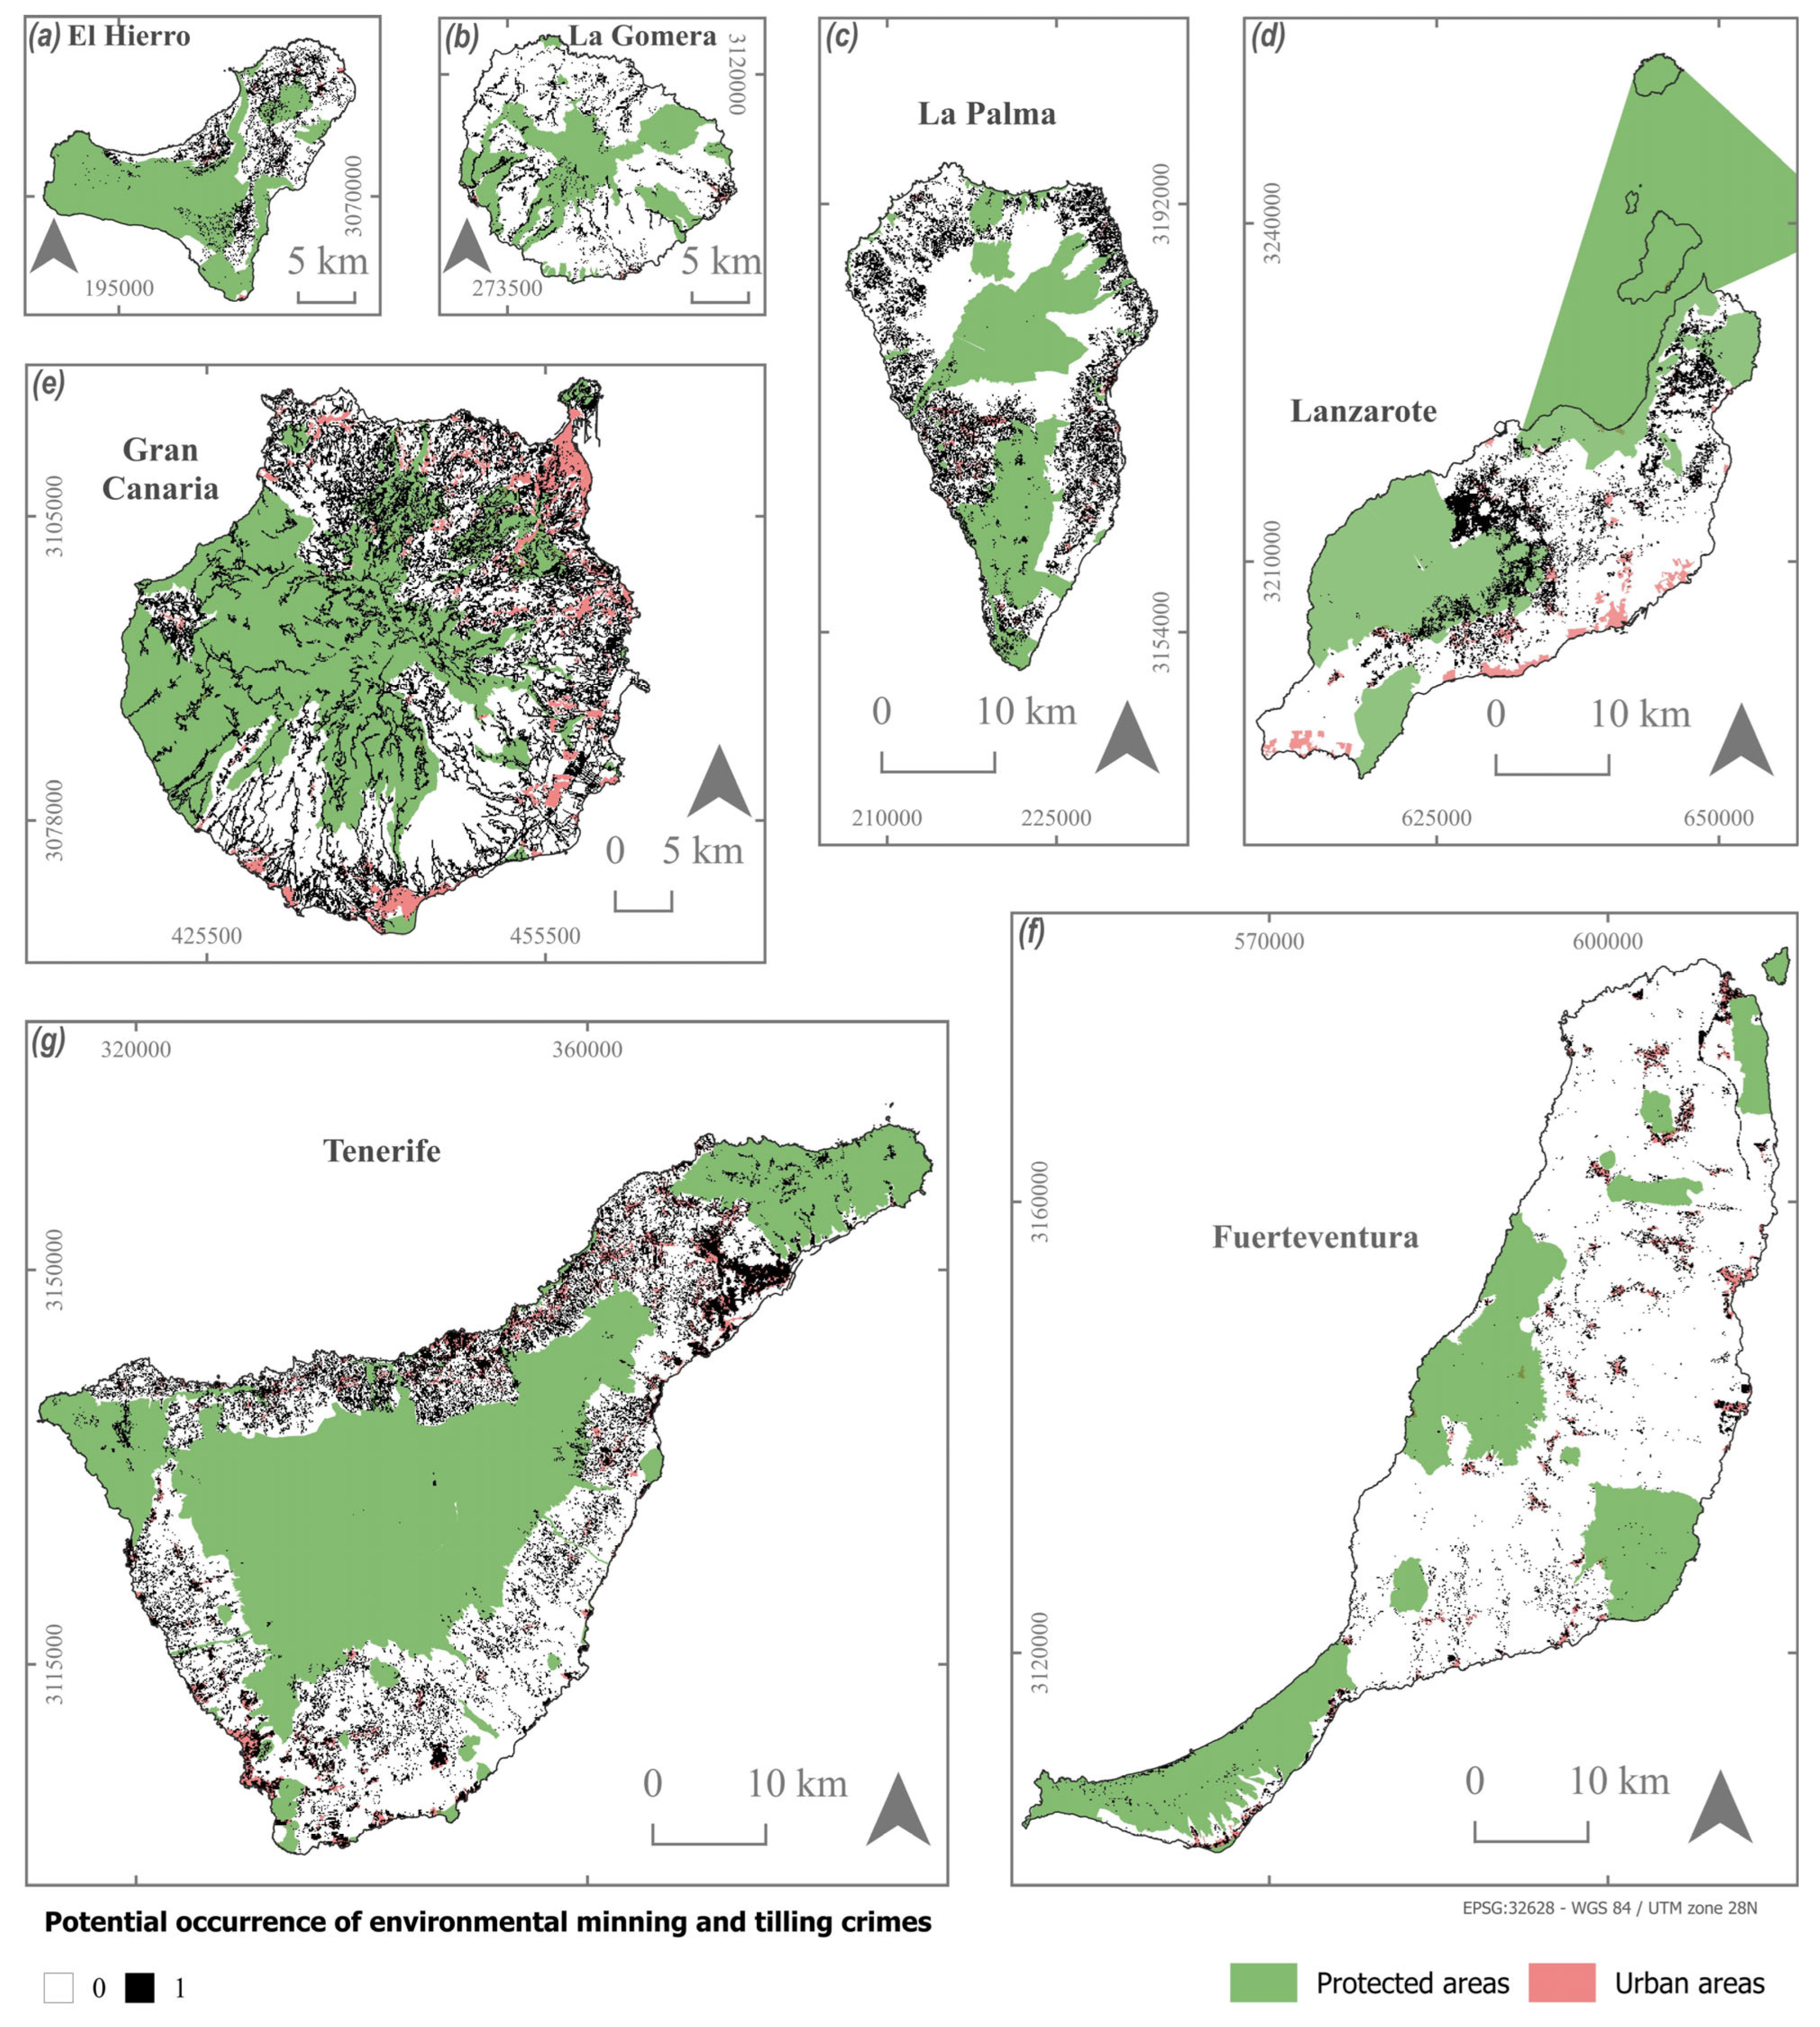
Regarding mining and tilling crimes, the most relevant territorial features pinpointed by the models for their geographical distribution were, once again, proximity to agricultural zones, residential areas and industrial zones (see Table S3). Consequently, the later predictive binary maps (Figure 5) reflect the high potential incidence of further mining and tilling offences in the proximity of agricultural, industrial, and urban areas, and their absence of such crimes in protected natural areas. This can be attributed to the close relationship between these types of offenses with land preparation for agricultural activities and construction work, whether residential or industrial. The models indicated that Gran Canaria, Tenerife and La Gomera are the islands with the highest potential for the occurrence of environmental crimes related to mining and tilling, as 26.4%, 21.0%, and 15.0% of their territories, respectively, could be the scene of a criminal act of this nature (see Table 3). The physical configuration of these islands, characterized by steep slopes, has historically necessitated the addressing of development issues via land modifications. Furthermore, these are the islands where quarries for the extraction of aggregates for construction activities are most prevalent.
The most relevant territorial features identified by models to explain the geographical distribution of solid waste (S) crimes were proximity to residential areas, industrial zones and service areas (see Table S3). Accordingly, the resulting predictive binary maps (Figure 6) show high potential for solid waste crimes across extensive areas, manly in the uninhabited spaces close to population centres, with high accessibility, which are areas of high potential impact from dumping across the insular territories. The absence of this type of crime is again observed in protected natural areas. The modelling maps indicate that Lanzarote, Tenerife and Gran Canaria, with higher construction and population densities, have the highest potential for crimes related to solid waste dumping, affecting 53.0%, 38.9%, and 21.6% of their territories, respectively (see Table 3). Collectively, of the four types of environmental crimes considered, those involving solid waste potentially affect the largest percentage of surface area on the Canary Islands.
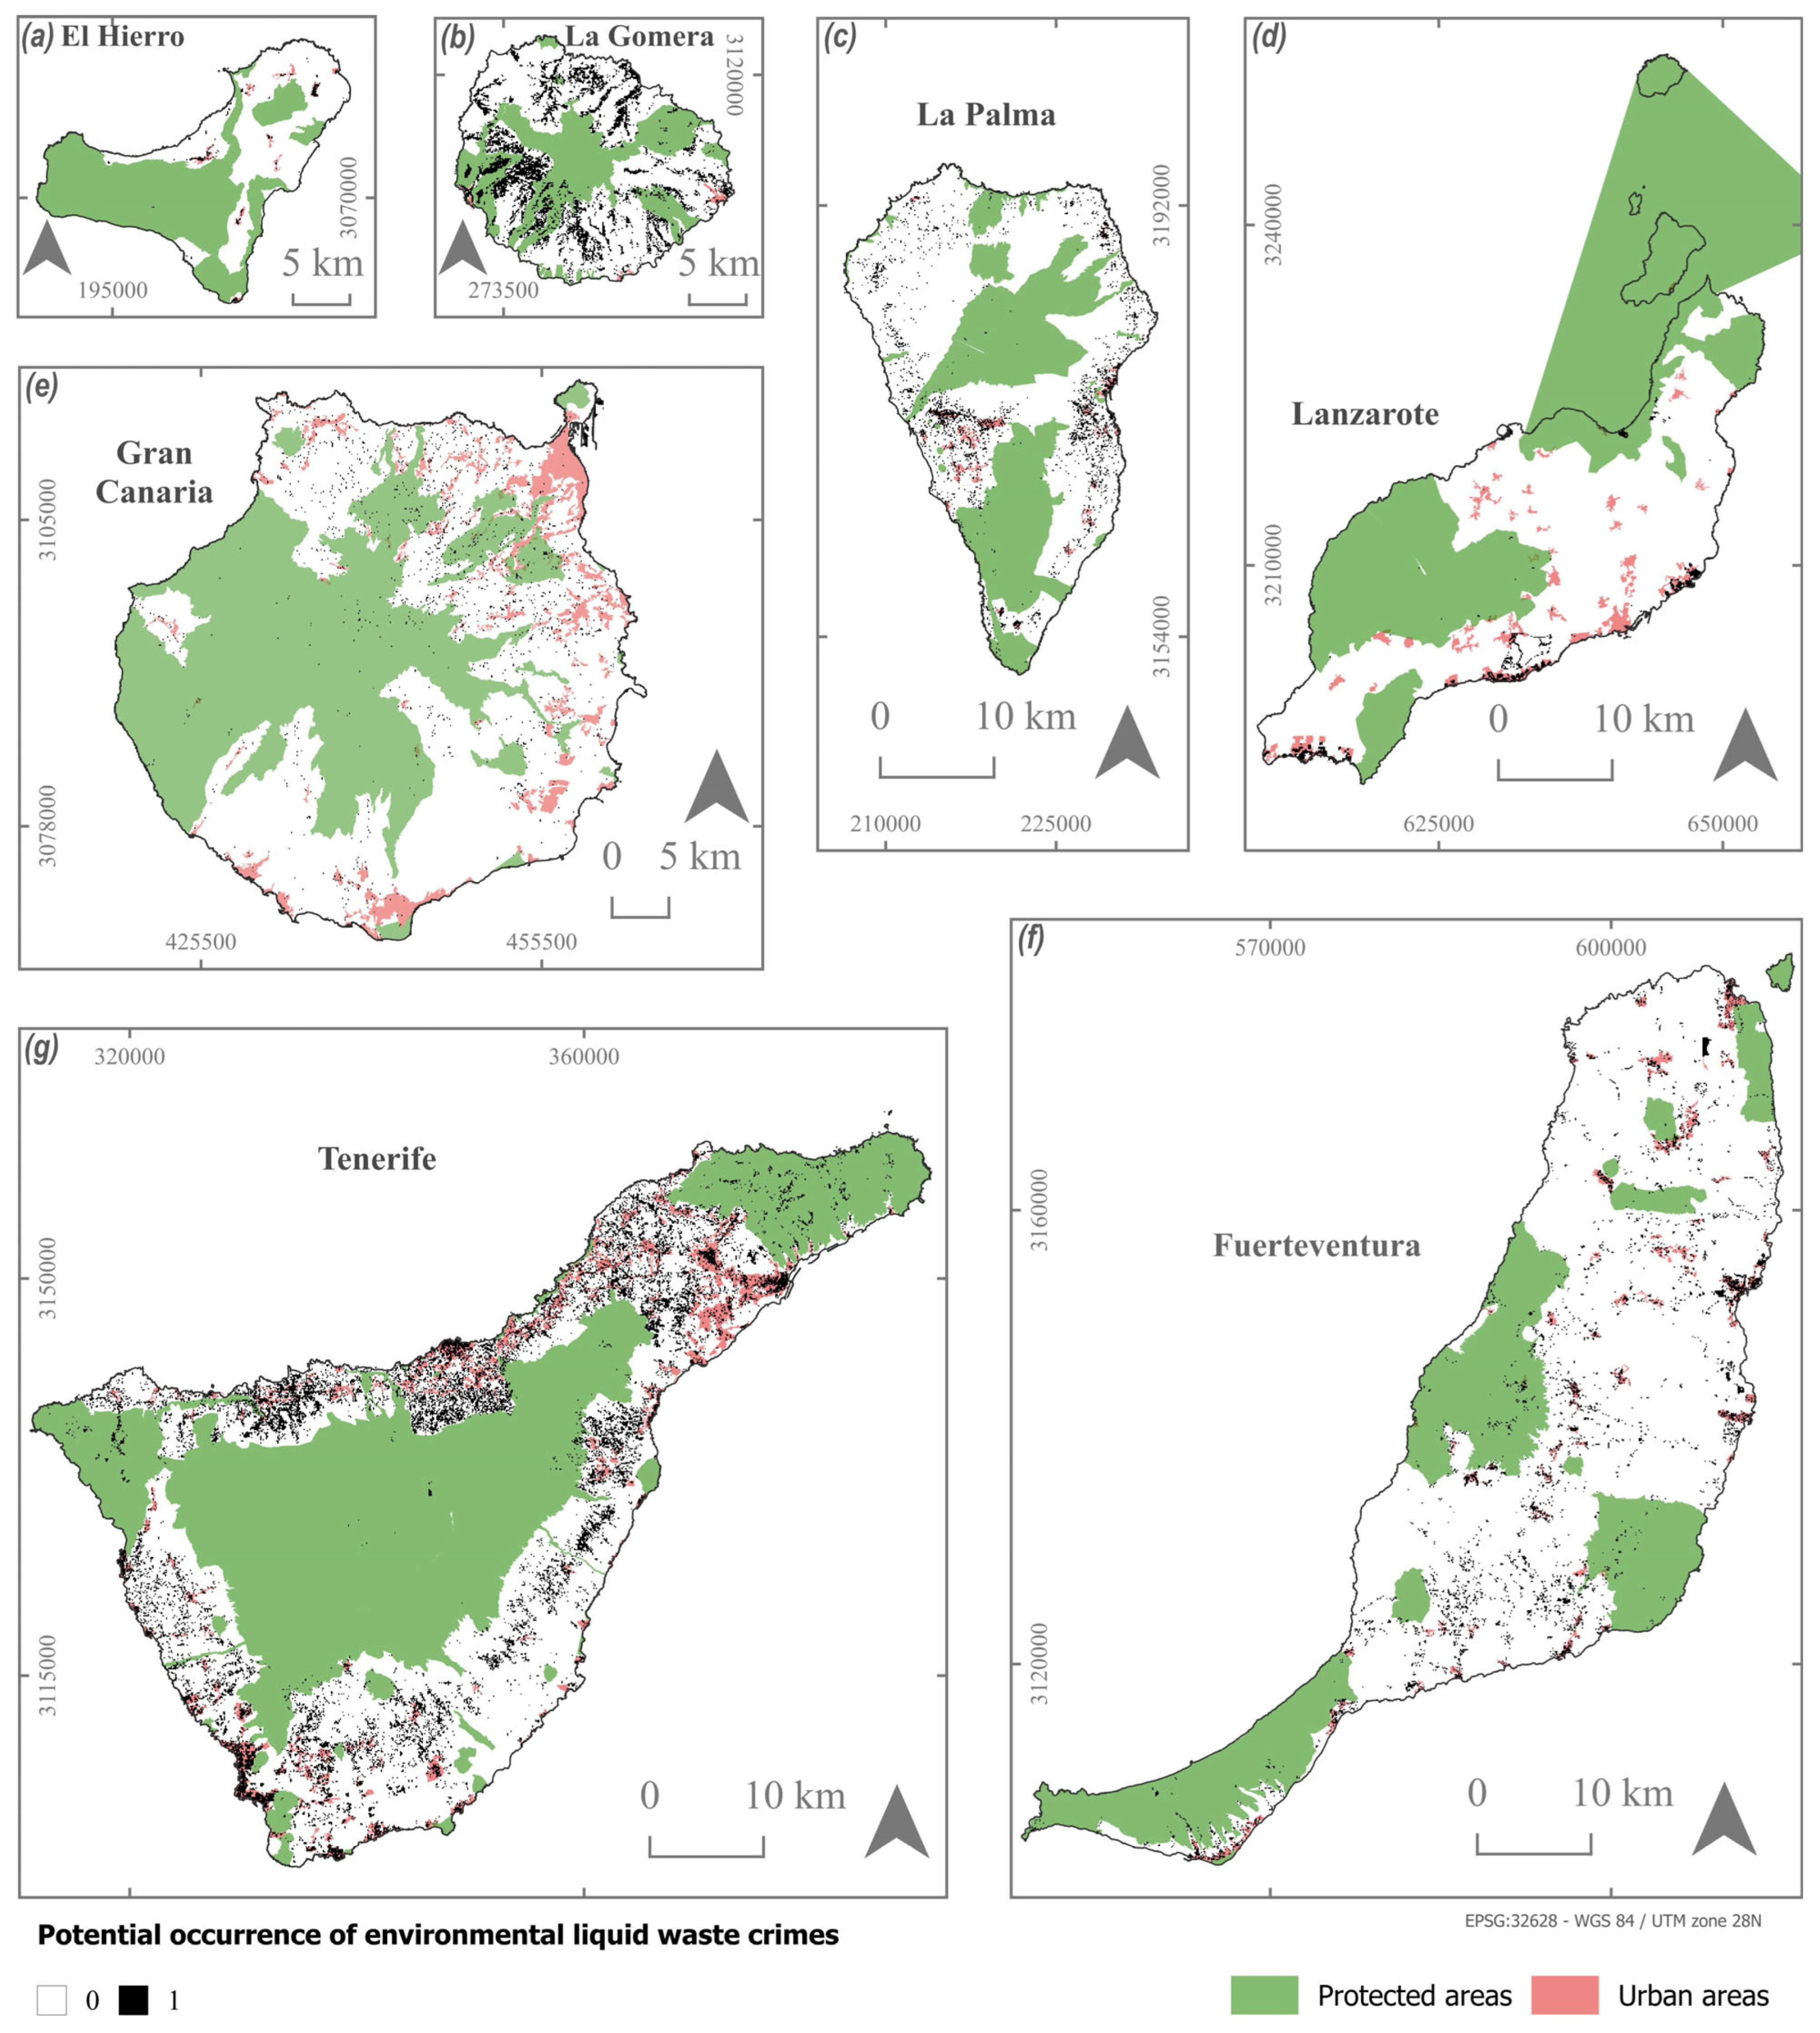
In the case of liquid waste crimes, the most determinant territorial features identified by models regarding their geographical occurrence were proximity to the coast and residential areas, and distance from protected natural areas (see Table S4). On this basis, the binary predictive maps (Figure 7) show a highly concentrated probability of liquid waste crimes in coastal areas and, in the case of islands with more significant relief, also in interior ravines. In La Gomera, liquid waste discharge points are strongly associated with the ravines lacking sanitation systems, resulting in potential impacts over a large portion of the interior area. The models showed that La Gomera and Tenerife are the islands with the highest potential occurrence of liquid waste environmental crime, affecting 16.1%, and 13.6% of their territories, respectively (see Table 3). These are islands on which there is often an absence of adequate sanitation networks in areas near the sea or in very remote interior zones. Historically, this has led to the illegal discharge of sewage by the population [59].

4.3. An Integrated Index for the Canary Islands

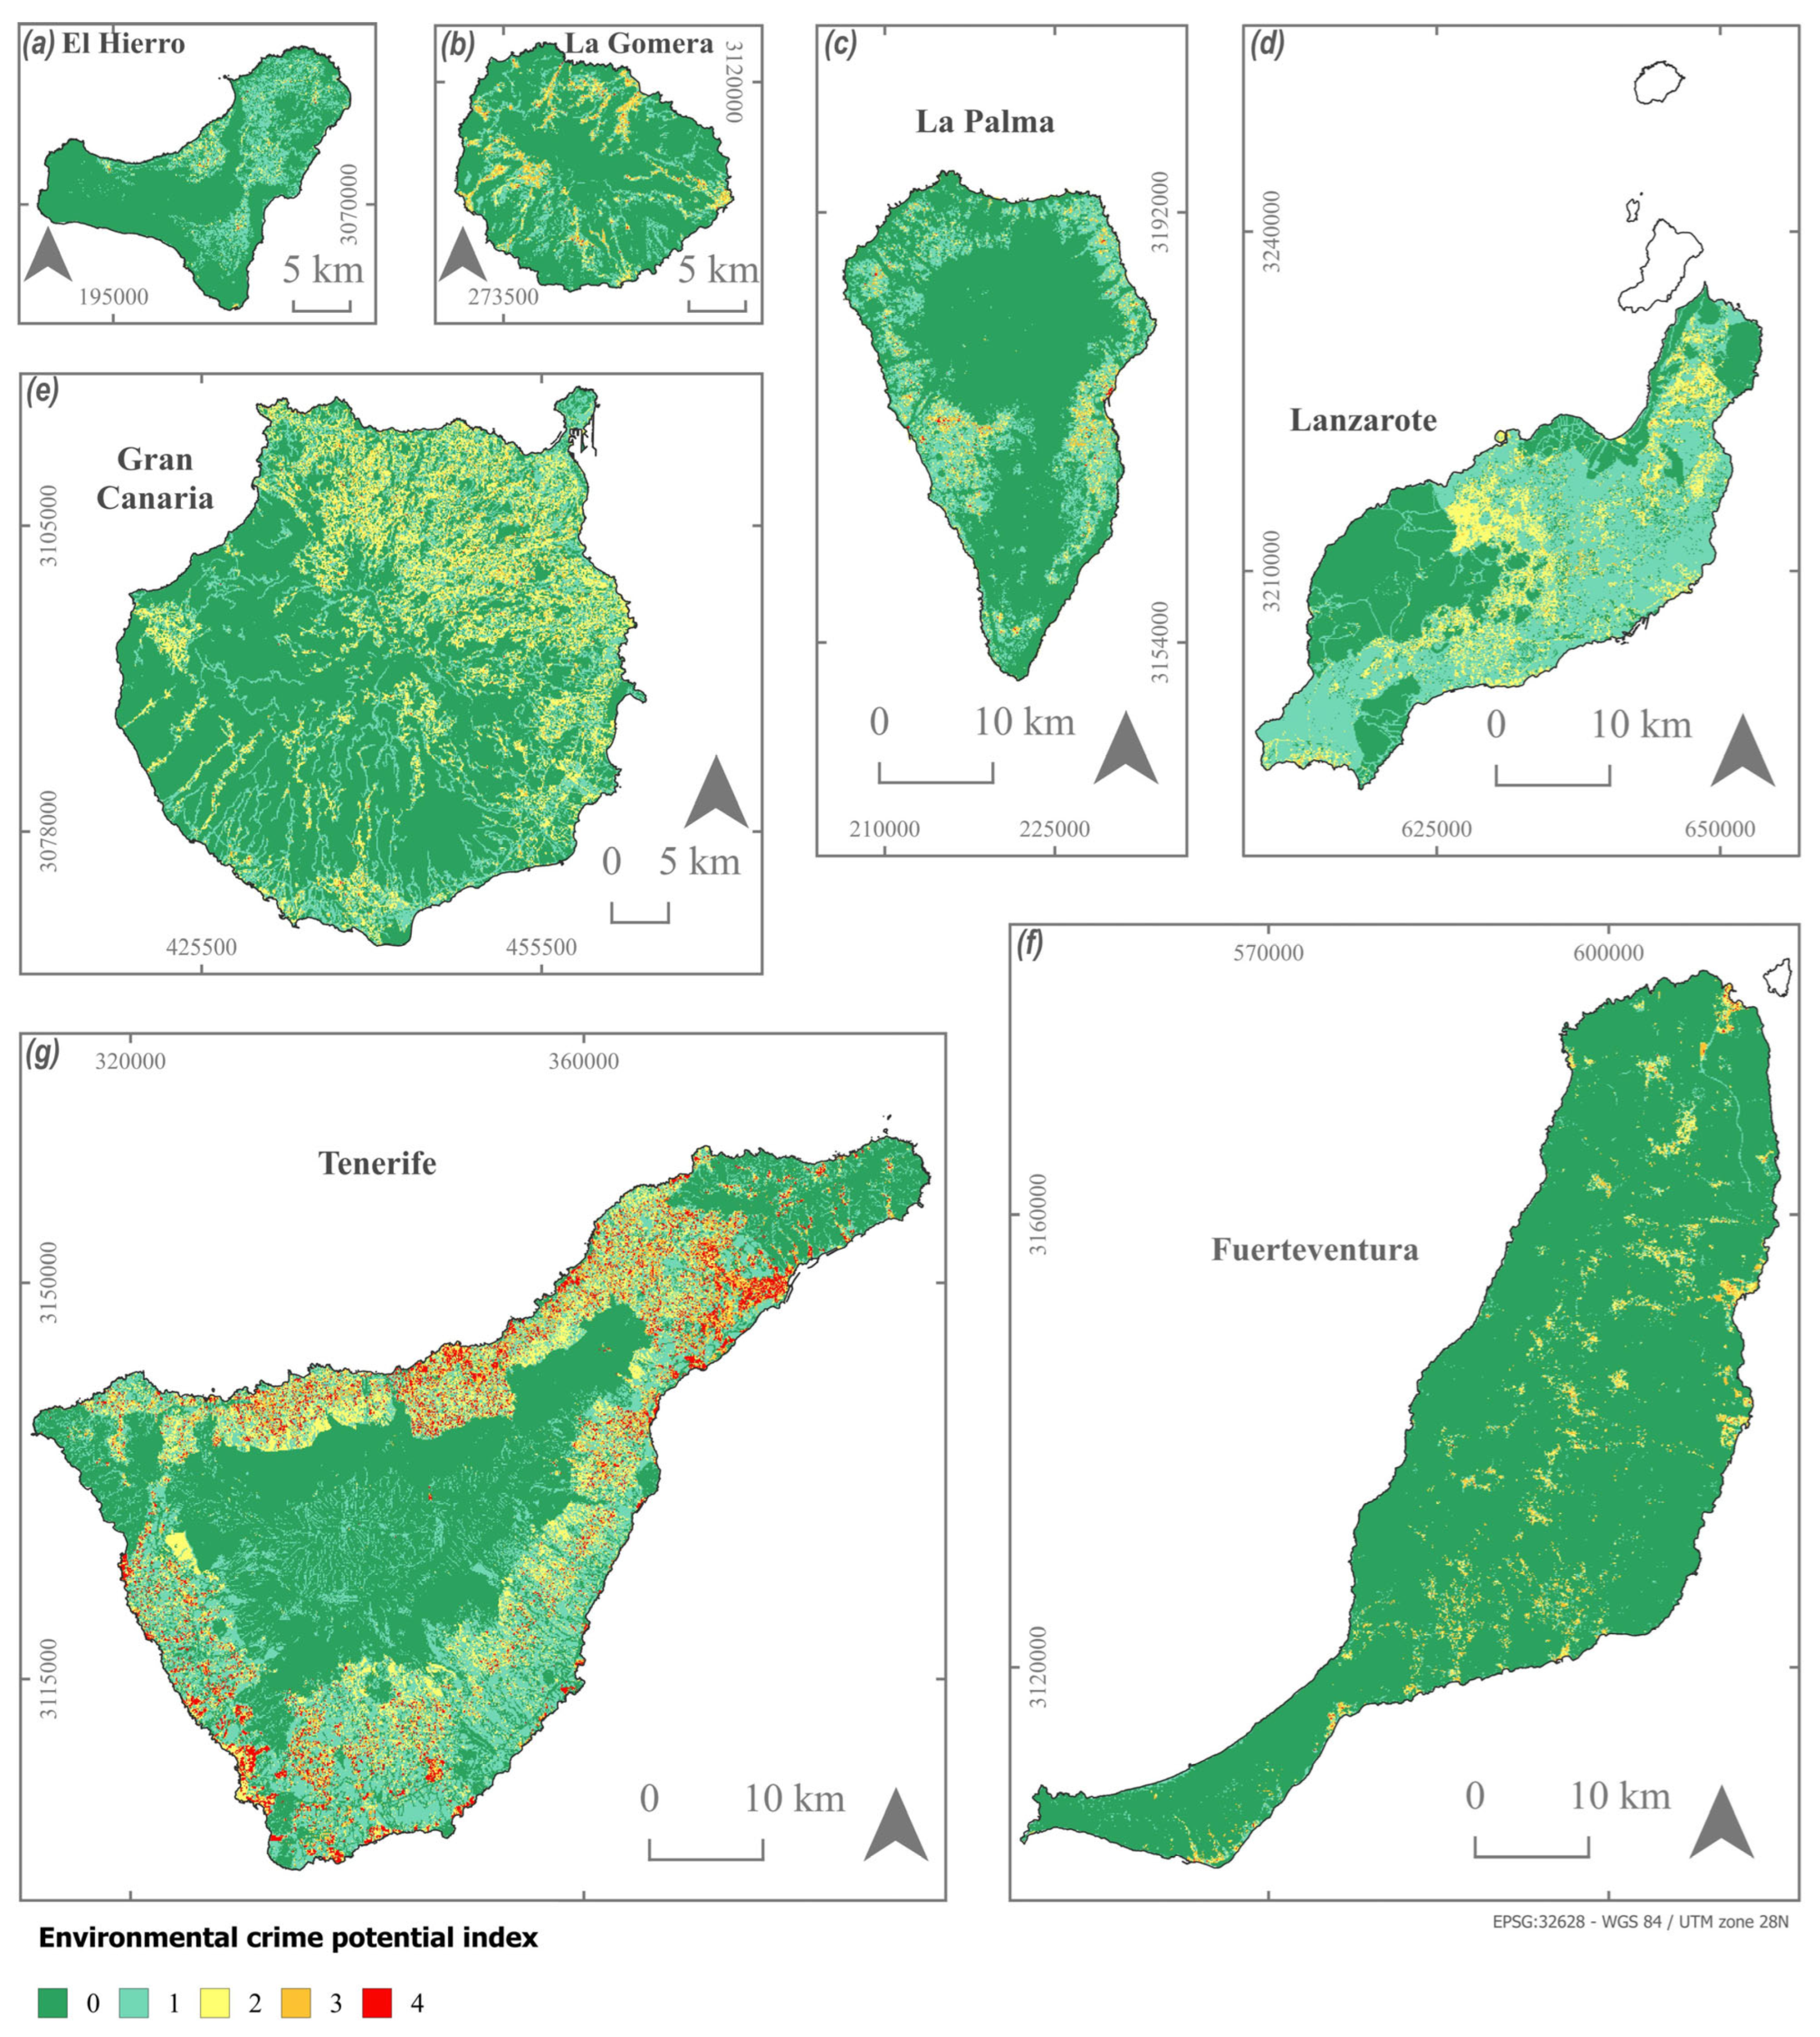
Aggregating all the potential environmental crimes in a RRF-FS10 unified model, we found that 43.2% of the surface area of the Canary Islands could potentially be impacted by at least one of the four types of environmental crime considered (Table 4). According to these global results, 28.1% of the surface area has an environmental crime potential of 1 (Table 4), meaning it could be affected by one of the four types of environmental crime. 9.1% of the territory could be affected by two types, 3.6% by three, and 2.4% by four. This indicates that 15.1% of the territory could potentially be impacted by two or more of the environmental crime types considered in the present study.
A spatial analysis of the combined occurrence of crimes reveals that those of solid waste dumping are closely related to construction and edification crimes, as the former often involve construction and demolition waste from building activities. Furthermore, the results show differing environmental crime potential depending on the island territory. Lanzarote, Gran Canaria and Tenerife are the islands with the highest percentage of territory potentially affected by one or more types of environmental crime (63.4%, 46.3% and 51.5% of their surface area, respectively). More specifically, 5.3% of the surface area of Tenerife (108.6 km2) had a value of 4 in the aggregated model, implying that these areas could simultaneously be impacted by all four of the studied types of environmental crime. In contrast, only 7.6% of the surface area of Fuerteventura is potentially affected by any environmental crime, probably due to its lower population density. Nevertheless, in the main population centres, the environmental crime potential rises to values above 2.
The general mode maps (Figure 8) show three distinct patterns at the regional scale of the Canary Islands. A comparison with the maps of Figure 5, Figure 6, Figure 7 and Figure 8 shows that the protected natural areas exhibit considerably lower environmental crime potential values compared to the rest of the territory. Second, the smaller islands with lower population densities possess have lower values than the most populated islands of Gran Canaria and Tenerife. Thirdly, a marked coastal-to-inland decrease in environmental crime potential can generally be observed, indicating the higher concentration of environmental crimes in coastal areas.

5. Discussion

This section discusses the spatial patterns identified in environmental crimes, the methodological implications of the predictive modelling approach, and its main limitations and policy applications.

5.1. Spatial Distribution and Human Pressures

The findings of this study demonstrate that environmental crimes in the Canary Islands are not evenly distributed but instead follow clear spatial patterns. Coastal areas, densely populated islands such as Tenerife, Gran Canaria and Lanzarote, and zones under greater urban and touristic pressure show higher environmental crime potential, while protected natural areas and smaller, less populated islands such as El Hierro display markedly lower values. These patterns highlight the crucial role of human pressure and land use intensity in shaping environmental crime distribution. In particular, the predominance of a tourism-dependent economy in the archipelago intensifies pressures on coastal zones, where urban expansion, recreational activities and infrastructure development converge, amplifying the likelihood of infractions. Conversely, the relatively lower risk observed in protected natural areas can be explained not only by reduced human pressure but also by the strict regulatory frameworks governing these zones. For instance, more than 40% of the Canary Islands’ surface is designated as protected under national and regional categories, which impose stringent restrictions on land use and environmental monitoring, thereby lowering opportunities for environmental offenses. In addition, within these protected zones, some land classifications such as “rural land with landscape protection” (Suelo Rústico con Protección Paisajística), as defined under the Canary Islands Land and Protected Natural Areas Act [60], enforce stricter controls on permissible activities. These legal restrictions, together with increased surveillance by environmental agents, further reduce the probability of infractions being committed or going unnoticed. This observation resonates with broader discussions on the role of legislation and environmental philosophy in shaping effective responses to environmental crime [61]. These results are consistent with previous studies that highlight the concentration of environmental crimes in areas with higher human pressure [23,31,48], as well as with research on predictive crime mapping for other types of offenses [22,27]. The high overlap between illegal constructions and solid waste dumping also confirms the close relationship between urban development processes and the proliferation of environmental infractions, as previously noted in studies on construction-related waste [11]. At the same time, links between crime and wider social outcomes, such as youth marginalization and NEET rates in European regions [62], suggest that environmental infractions should not be examined in isolation but rather understood within broader socioeconomic contexts.

5.2. Predictive Modelling as a Methodological Approach

The effective transfer of scientific information is pivotal when crafting protective measures for the environment and introducing new legislative frameworks. However, the exploitation and use of relevant data to date may not have been sufficiently robust in combating environmental crime. This is particularly evident in supranational entities such as the EU and the US, where diverse regulatory frameworks exist [4]. Within this context, a fundamental axiom emerges: the most potent predictor of future incidence patterns hinges upon historical insights [63]. As with traditional crimes [22], forecasting the spread of environmental offenses must be rooted in the analysis of past occurrences. Logging the spatial coordinates of environmental offenses enables a holistic comprehension of their physical and socio-economic drivers. Hence, this study advocates for predictive modelling as an alternative to hot spot mapping techniques traditionally used to pinpoint criminogenic areas [63]. The methodology employed not only reveals existing environmental crime potential but their extension throughout a territory, thereby facilitating the strategic allocation of resources for police surveillance, public information dissemination and awareness campaigns. Complementary approaches such as Crime Prevention Through Environmental Design (CPTED) have also shown that spatial configuration can influence crime incidence [25], reinforcing the potential of integrating predictive modelling with situational prevention strategies.
Although alternative approaches such as Support Vector Machines (SVM) or Bayesian models are also commonly used in environmental and crime prediction, we deliberately chose Random Forest-based methods. This decision was guided not only by the robustness of RF in handling large and heterogeneous spatial datasets, but also by its ability to provide interpretable measures of variable importance and to test alternative feature selection strategies (RRF, FS10). These strengths made RF particularly suitable for the dual objective of this study: achieving accurate predictive performance while identifying the explanatory drivers of environmental crime.
From a methodological point of view, this work introduces innovation by applying Random Forest (RF) and its variants (RRF, FS10) to environmental crime. While RF has been utilized in the scrutiny of crimes linked to illegal dumping [31], its use in modelling a broad spectrum of environmental crimes (such as unauthorized constructions, mining and tilling, solid waste dumping and liquid waste discharging) remains novel. Hence, the combination of predictive modelling with GIS at the scale of an oceanic archipelago represents an original contribution, offering detailed cartography of environmental crime potential that can be replicated in other fragile territories. The proffered predictive models do not aim to simulate past or future (forecasting) scenarios but to portray a territory in light of known values. These models leverage high-performance algorithms such as Random Forest (RF), a supervised machine learning technique that has been applied in land use classification [28,50,64,65] and to address challenges in environmental sectors, including water, mineral resources and public health [6,29,66,67]. Extensions of RF, such as the Regularised Random Forest (RRF), have also been deployed in genetic research [51], land use classification [68] and the retrieval of biophysical parameters [30]. However, its application to a wide spectrum of environmental crimes is still rare. Thus, as endorsed by the “Handbook of Quantitative Criminology” [69], deploying RF for dissecting environmental crime is pioneering. Although RF has been utilized in the scrutiny of crimes linked to illegal dumping [31], its use in modelling a broad spectrum of environmental crimes (such as unauthorized constructions, mining and tilling, solid waste dumping and liquid waste discharging) remains novel. Hence, the combination of predictive modelling with GIS at the scale of an oceanic archipelago represents an original contribution, offering detailed cartography of environmental crime potential that can be replicated in other fragile territories.

5.3. Limitations and Future Directions

The presented cartography encompasses a wide range of environmental crimes, particularly those with historical prevalence. Its computational approach allows for the inclusion and analysis of a myriad of environmental crimes, facilitating a study of potential interrelationships. However, mapping environmental crimes using rudimentary density metrics like crime density per km2 or crime rates per 1000 inhabitants only provides a static snapshot of the crimes during a specified timeframe [48]. It does not correlate the crimes with explanatory characteristics, thereby falling short of predicting potential occurrences in previously unaffected zones. However, this methodology does have certain drawbacks: (i) its efficacy relies heavily on the availability of official data; (ii) it treats the severity of all environmental offenses as homogenous, assigning them equal weighting; (iii) it strictly considers the most prevalent and statistically significant environmental crimes for spatial modelling. In particular, reliance on official judicial and administrative sources introduces potential biases, as many minor or hidden infractions remain unreported or are not systematically recorded. This underreporting is especially significant in crimes such as poaching, wildlife trafficking, or deforestation, where the clandestine nature of the offenses and the lack of systematic monitoring make reliable data scarce. Some crimes, like deforestation or wildlife trafficking, remain elusive due to data paucity, requiring at least 100 instances to achieve acceptable confidence levels [19]. The absence of these categories from the models may lead to a partial underestimation of environmental crime potential in rural and natural areas, since these are precisely the contexts where such hidden crimes are most likely to occur. To further refine the methodologies, the inclusion of other dimensions of environmental crime may need to be considered, such as the magnitude of damage or the victims. These dimensions often remain underrepresented [19,70]. Furthermore, the extent and temporal dynamics of any damage or harm, considering cumulative physical and economic impacts on the victims, are essential, as the risk associated with the recurrence of a crime often increases notably after an initial event (e.g., [22,71]). Finally, insights from other island territories, such as the Zhoushan Islands in China, show how environmental pressures are closely tied to economic development [32]. This comparison highlights that the Canary Islands share common vulnerabilities with other insular systems, reinforcing the relevance and transferability of the predictive modelling approach presented here.
These considerations point to both the strengths and the limitations of the proposed methodology. While data constraints and the homogenization of offenses remain important challenges, the results demonstrate that predictive environmental crime mapping can provide actionable insights for governance. The practical relevance of these findings lies in the potential use of predictive maps to support environmental management and policy-making. Authorities can employ them to identify high-risk areas, design targeted awareness campaigns, and prioritize monitoring in peri-urban and coastal zones. Beyond the Canary Islands, this methodology could be adapted to other island or coastal territories experiencing similar pressures from tourism and urban expansion.

6. Conclusions

In the face of the escalating environmental crisis, there is an urgent need for a more strategic approach to environmental crime prevention and management. Integrating predictive modelling and spatial analysis can significantly enhance societal awareness, regulatory frameworks and legislative architectures. By developing predictive measures and models that characterize the environmental crime potential within a region, we can more adeptly address its prevention and management. This study developed predictive models and environmental crime potential maps to anticipate four types of environmental crimes: illegal constructions, mining and tilling, solid waste dumping, and liquid waste discharging. Three Random Forest-based classification models (RF, RRF, and FS10) were applied, yielding classification models for each environmental crime type and for each of the seven major islands in the Canary Archipelago. The RRF and FS10 approaches demonstrated the highest accuracy, confirming the robustness of the methodology.
Spatial patterns revealed a higher environmental crime potential in densely populated or touristic islands, particularly Tenerife, Gran Canaria, and Lanzarote, while protected natural areas showed notably lower values. The generated environmental crime potential map assigned scores from 0 to 4 to each island’s surface area, where higher values indicate an increased likelihood of one or more environmental crime types. Results show that 43.2% of the surface area of the islands could potentially be impacted by environmental crimes associated with illegal constructions, mining and tilling, solid waste dumping, or liquid waste discharging. Protected natural areas exhibited lower values. Conversely, islands with lower population densities recorded lower values, as did interior regions compared to coastal areas.
This methodology constitutes a promising avenue to address the challenges posed by environmental crimes and bolster their prevention and tracking. Despite inherent limitations, it furnishes a robust foundation for future research endeavours and enhancements. The integration of more diverse environmental crime typologies and analyses of impacts and victim profiles could help to refine the methodology. Ultimately, this framework can support policymakers and environmental agencies in more effectively combating and preventing environmental crimes while safeguarding fragile ecosystems.
In summary, this study contributes to:
  • Identifying the spatial patterns of environmental crimes across the Canary Islands, highlighting their concentration in coastal and touristic areas.
  • Demonstrating the effectiveness of Random Forest-based models (RF, RRF, FS10) for spatial prediction and explanatory analysis of environmental crime potential.
  • Quantifying the territorial extent of environmental crime risk, with around 43% of the archipelago potentially affected by one or more crime types.
  • Providing a transferable methodological framework to strengthen environmental governance, surveillance, and preventive planning in island and coastal regions.

Supplementary Materials

The following supporting information can be downloaded at: https://www.mdpi.com/article/10.3390/ijgi14110410/s1. Figure S1: Density of environmental crimes related to illegal buildings for the period between 2001 and 2020; Figure S2: Density of environmental crimes related to minning for the period between 2001 and 2020; Figure S3: Density of environmental crimes related to solid waste dumping for the period between 2001 and 2020; Figure S4: Density of environmental crimes related to liquid littering for the period between 2001 and 2020; Table S1: List of features and data sources. Sources: APMUN (Agencia de Protección del Medio Urbano y Natural, Government of the Canary Islands); GRAFCAN (Cartographic Company of the Canary Islands); INE (National Statistics Institute of Spain); ESA (European Space Agency); Table S2: Mainly 10 features selected by the building environmental crime models for each island; Table S3: Mainly 10 features selected by mining environmental crime models for each island; Table S4: Mainly 10 features selected by solid littering environmental crime models for each island; Table S5: Mainly 10 features selected by Liquid littering environmental crime models for each island.

Author Contributions

Conceptualization, Lorenzo Carlos Quesada-Ruiz; methodology, Lorenzo Carlos Quesada-Ruiz; software, Lorenzo Carlos Quesada-Ruiz; validation, Lorenzo Carlos Quesada-Ruiz, and Nicolás Ferrer-Valero.; formal analysis, Lorenzo Carlos Quesada-Ruiz.; investigation, Lorenzo Carlos Quesada-Ruiz, Leví García-Romero and Nicolás Ferrer-Valero; resources, Lorenzo Carlos Quesada-Ruiz; data curation, Lorenzo Carlos Quesada-Ruiz; writing—original draft preparation, Lorenzo Carlos Quesada-Ruiz, Nicolás Ferrer-Valero and Leví García-Romero; writing—review and editing, Lorenzo Carlos Quesada-Ruiz, Nicolás Ferrer-Valero and Leví García-Romero; visualization, Lorenzo Carlos Quesada-Ruiz and Nicolás Ferrer-Valero; supervision, Lorenzo Carlos Quesada-Ruiz and Leví García-Romero; project administration, Lorenzo Carlos Quesada-Ruiz and Leví García-Romero; funding acquisition, Lorenzo Carlos Quesada-Ruiz. All authors have read and agreed to the published version of the manuscript.

Funding

This publication is a contribution of R+D+i project PID2021-124888OB-I00, funded by MCIN (Spanish Ministry of Science and Innovation)/AEI (Spanish State Research Agency) and by “ERDF A way of making Europe”, from PRECOMP01 SD-24/03 research project funded by Las Palmas de Gran Canaria University and from the project IMPLACOST 1/MAC/2/2.4/0009: 85 % by the In-terreg VI Madeira-Azores-Canarias (MAC) 2021–2027 Territorial Cooperation Program of the European Regional Development Fund (ERDF), and the remaining 15 % from regional and national funds of the participating territories. This includes contributions from the regional governments of Madeira (Portugal), the Azores (Portugal), and the Canary Islands (Spain). Leví García-Romero is beneficiary of the ‘Catalina Ruiz 2022’ postdoctoral contract program funded by the Canary Island Government and the European Social Fund (APCR2022010005).

Data Availability Statement

Data will be made availability on request authors.

Conflicts of Interest

The authors declare no conflicts of interest. The funders had no role in design of the study; in the collection, analysis, or interpretation of data; in the writing of the manuscript; or in the decision to publish the results.

References

  1. Clifford, M.; Edwards, T.D. Defining ‘Environmental Crime’. In Environmental Crime: Enforcement, Policy, and Social; Clifford, M., Ed.; Jones & Bartlett Learning: Burlington, MA, USA, 1998. [Google Scholar]
  2. Connealy, N.T. The influence, saliency, and consistency of environmental crime predictors: A probability score matching approach to test what makes a hot spot hot. Justice Q. 2023, 40, 670–693. [Google Scholar] [CrossRef]
  3. Winter, N.L. Mapping environmental crime. In Proceedings of the 20th International Cartographic Conference, Mapping the 21st Century, Beijing, China, 6–10 August 2001; Volume 1, pp. 392–395. [Google Scholar]
  4. Shover, N.; Routhe, A.S. Environmental crime. Crime Justice 2005, 32, 321–371. [Google Scholar] [CrossRef]
  5. Fuller, R.; Landrigan, P.J.; Balakrishnan, K.; Bathan, G.; Bose-O′Reilly, S.; Brauer, M.; Caravanos, J.; Chiles, T.; Cohen, A.; Corra, L.; et al. Pollution and health: A progress update. Lancet Planet Health 2022, 6, e535–e547. [Google Scholar] [CrossRef] [PubMed]
  6. Guo, Q.F.; Hu, M.; Guo, S.; Wu, Z.J.; Hu, W.W.; Peng, J.F.; Hu, W.; Wu, Y.S.; Yuan, B.; Zhang, Q.; et al. The identification of source regions of black carbon at a receptor site off the eastern coast of China. Atmos. Environ. 2015, 100, 78–84. [Google Scholar] [CrossRef]
  7. Hoogesteger, J.; Wester, P. Intensive groundwater use and (in)equity: Processes and governance challenges. Environ. Sci. Policy 2015, 51, 117–124. [Google Scholar] [CrossRef]
  8. Cardinale, B.J.; Duffy, J.E.; Gonzalez, A.; Hooper, D.U.; Perrings, C.; Venail, P.; Narwani, A.; Mace, G.M.; Tilman, D.; Wardle, D.A.; et al. Biodiversity loss and its impact on humanity. Nature 2012, 486, 59–67. [Google Scholar] [CrossRef]
  9. Watson, J.E.M.; Evans, T.; Venter, O.; Williams, B.; Tulloch, A.; Stewart, C.; Thompson, I.; Ray, J.C.; Murray, K.; Salazar, A.; et al. The exceptional value of intact forest ecosystems. Nat. Ecol. Evol. 2018, 2, 599–610. [Google Scholar] [CrossRef]
  10. McKinney, M.L. Urbanization as a major cause of biotic homogenization. Biol. Conserv. 2006, 127, 247–260. [Google Scholar] [CrossRef]
  11. Marzouk, M.; Azab, S. Environmental and economic impact assessment of construction and demolition waste disposal using system dynamics. Resour. Conserv. Recycl. 2014, 82, 41–49. [Google Scholar] [CrossRef]
  12. Bueno, M.V.; Campos, A.D.S.; Silva, J.T.; Massey, J.; Timm, L.C.; Faria, L.C.; Roel, A.; Parfitt, J.M.B. Improving the drainage and irrigation efficiency of lowland soils: Land-forming options for southern Brazil. J. Irrig. Drain. Eng. 2020, 146, 04020019. [Google Scholar] [CrossRef]
  13. Quesada-Ruiz, L.C.; Rodriguez-Galiano, V.; Jordá-Borrell, R. Characterization and mapping of illegal landfill potential occurrence in the Canary Islands. Waste Manag. 2019, 85, 506–518. [Google Scholar] [CrossRef] [PubMed]
  14. Reinold, S.; Herrera, A.; Saliu, F.; Hernández-González, C.; Martinez, I.; Lasagni, M.; Gómez, M. Evidence of microplastic ingestion by cultured European sea bass (Dicentrarchus labrax). Mar. Pollut. Bull. 2021, 168, 112450. [Google Scholar] [CrossRef] [PubMed]
  15. Cunha, I.; Freitas, L.; Alves, F.; Dinis, A.; Ribeiro, C.; Nicolau, C.; Ferreira, R.; Gonçalves, J.A.; Formigo, N. Marine traffic and potential impacts towards cetaceans within the Madeira EEZ. J. Cetacean Res. Manag. 2017, 16, 17–28. [Google Scholar] [CrossRef]
  16. Shen, M.; Huang, W.; Chen, M.; Song, B.; Zeng, G.; Zhang, Y. (Micro) plastic crisis: Un-ignorable contribution to global greenhouse gas emissions and climate change. J. Clean. Prod. 2020, 254, 120138. [Google Scholar] [CrossRef]
  17. Verma, S.; Jayakumar, S. Impact of forest fire on physical, chemical and biological properties of soil: A review. Proc. Int. Acad. Ecol. Environ. Sci. 2012, 2, 168. [Google Scholar]
  18. Mukhlis, I.; Rizaludin, M.S.; Hidayah, I. Understanding socio-economic and environmental impacts of agroforestry on rural communities. Forests 2022, 13, 556. [Google Scholar] [CrossRef]
  19. White, R. Environmental Crime in Global Context: Exploring the Theoretical and Empirical Complexities. Curr. Issues Crim. Justice 2005, 16, 271–285. [Google Scholar] [CrossRef]
  20. Goodchild, M.F.; Anselin, L.; Appelbaum, R.P.; Harthorn, B.H. Toward spatially integrated social science. Int. Reg. Sci. Rev. 2000, 23, 139–159. [Google Scholar] [CrossRef]
  21. Eck, J.E. Policing & Crime Event Concentration. In The Process and Structure of Crime: Criminal Events and Crime Analysis (Chapter 11); Meier, R., Kennedy, L., Sacco, V.F., Eds.; Transaction Publisher: Piscataway, NJ, USA, 2001. [Google Scholar]
  22. Johnson, S.D.; Bowers, K.J.; Birks, D.J.; Pease, K. Predictive Mapping of Crime by ProMap: Accuracy, Units of Analysis, and the Environmental Backcloth. In Putting Crime in Its Place; Weisburd, D., Ed.; Springer Science+Business Media, LLC: Berlin/Heidelberg, Germany, 2009; p. 171. [Google Scholar] [CrossRef]
  23. Quesada-Ruiz, L.C.; Perez, L.; Rodriguez-Galiano, V. Spatiotemporal analysis of the housing bubble’s contribution to the proliferation of illegal landfills—The case of Gran Canaria. Sci. Total Environ. 2019, 687, 104–117. [Google Scholar] [CrossRef]
  24. Fereira Rosa, A.G.; Miranda Mota, C.M.; Jardim de Figuereido, C.J. A spatial multi-criteria decision analysis framework to reveal vulnerabilities of areas to incidences of street robberies. Appl. Geogr. 2023, 151, 102840. [Google Scholar] [CrossRef]
  25. Kubalova, K.; Loveček, T. Crime prevention through environmental design of railway stations as a specific soft target. Sustainability 2023, 15, 5627. [Google Scholar] [CrossRef]
  26. Saraiva, M.; Teixeira, B. Exploring the spatial relationship between street crime events and the distribution of urban greenspace: The case of Porto, Portugal. ISPRS Int. J. Geo-Inf. 2023, 12, 492. [Google Scholar] [CrossRef]
  27. Rosser, G.; Davies, T.; Bowers, K.J.; Johnson, S.D.; Cheng, T. Predictive Crime Mapping: Arbitrary Grids or Street Networks? J. Quant. Criminol. 2017, 33, 569–594. [Google Scholar] [CrossRef]
  28. Breiman, L. Random forests. Mach. Learn. 2001, 45, 5–32. [Google Scholar] [CrossRef]
  29. Rodriguez-Galiano, V.F.; Chica-Rivas, M. Evaluation of different machine learning methods for land cover mapping of a Mediterranean area using multi-seasonal Landsat images and Digital Terrain Models. Int. J. Digit. Earth 2012, 7, 492–509. [Google Scholar] [CrossRef]
  30. Izquierdo-Verdiguier, E.; Zurita-Milla, R. Use of guided regularized random forest for biophysical parameter retrieval. In Proceedings of the IGARSS 2018—2018 IEEE International Geoscience and Remote Sensing Symposium, Valencia, Spain, 22–27 July 2018; pp. 5776–5779. [Google Scholar]
  31. Quesada-Ruiz, L.C.; Rodriguez-Galiano, V.F.; Zurita-Milla, R.; Izquierdo-Verdiguier, E. Area and Feature Guided Regularised Random Forest: A novel method for predictive modelling of binary phenomena. The case of illegal landfill in Canary Island. Int. J. Geogr. Inf. Sci. 2022, 36, 2473–2495. [Google Scholar] [CrossRef]
  32. Li, F.; Qi, D.; He, Y. Analysis of the decoupling relationship between environmental pollution and economic development in island areas: A case study of Zhoushan Islands, China. Sustainability 2024, 16, 5567. [Google Scholar] [CrossRef]
  33. Joshi, N.; Shaikh, S.; Tripathy, A.; Sen, S.; Janson, J.; Karnik, S.; Varghese, B. Crime anatomization using QGIS. In Proceedings of the 2019 5th International Conference for Convergence in Technology (I2CT), Pune, India, 29–31 March 2019. [Google Scholar] [CrossRef]
  34. Tasaki, T.; Matsui, Y.; Kawahata, T.; Osako, M.; Takagishi, S.; Morita, A. Analysis of geographic attributes and probabilities related to illegal dumping. J. Jpn. Soc. Waste Manag. Experts 2004, 15, 1–10. [Google Scholar] [CrossRef]
  35. Cohen, L.E.; Felson, M. Social change and crime rate trends: A routine activity approach. Am. Sociol. Rev. 1979, 44, 588–608. [Google Scholar] [CrossRef]
  36. Brantingham, P.L.; Brantingham, P.J. Environment, routine, and situation: Toward a pattern theory of crime. In Routine Activity and Rational Choice: Advances in Criminological Theory; Clarke, R.V., Felson, M., Eds.; Transaction Publishers: Piscataway, NJ, USA, 1993; Volume 5, pp. 259–294. [Google Scholar]
  37. Ceccato, V. Environmental criminology in crime prevention: Theories for practice. Secur. J. 2024, 37, 425–431. [Google Scholar] [CrossRef]
  38. Suprayogi, B.S.; Nugroho, S.; Fitriana, A.S.; Pratiwi, F.I. Mapping the landscape of environmental crime: A literature review. Environ. Adv. 2025, 12, 100246. [Google Scholar] [CrossRef]
  39. Troll, V.; Carracedo, J.C. The Canary Islands: An Introduction. In The Geology of the Canary Islands; Elsevier: Amsterdam, The Netherlands, 2016. [Google Scholar] [CrossRef]
  40. Government of the Canary Islands (n.d.). Canary Islands Natural Inventory Bank (BIOCAN). Available online: https://www.biodiversidadcanarias.es/ (accessed on 20 July 2025).
  41. MAPAMA. Memoria de la Red de Parques Nacionales; Ministerio de Agricultura, Pesca, Alimentación y Medio Ambiente del Gobierno de España: Madrid, Spain, 2015.
  42. INE. Movimientos Turísticos en Fronteras. Frontur; Instituto Nacional de Estadística: Madrid, Spain, 2020. Available online: https://www.ine.es/dyngs/Prensa/FRONTUR0725.htm (accessed on 7 January 2025).
  43. Domínguez Mújica, J.; Moreno Medina, C.; Ginés de la Nuez, C. Agricultura y paisaje en Canarias. In La Perspectiva de Francisco María de León y Falcón; Anroart Ediciones, Las Palmas de Gran Canaria: Las Palmas, Spain, 2005; ISBN 978-84934211-0-6. [Google Scholar]
  44. INE. Estadística del Padron Continuo; Instituto Nacional de Estadística: Madrid, Spain, 2020a. Available online: http://www.ine.es/dyngs/INEbase/es/categoria.htm?c=Estadistica_P&cid=1254734710990 (accessed on 7 January 2025).
  45. Hernández Martín, R.; Santana Talavera, A. Destinos turísticos maduros ante el cambio. In Reflexiones Desde Canarias; Universidad de La Laguna: Santa Cruz de Tenerife, Spain, 2010; ISBN 978-84-614-3386-5. [Google Scholar]
  46. Ferrer, N.; Herrera, G. High-resolution modelling of island exposure to natural hazards tested with real disasters. Appl. Geogr. 2024, 165, 103239. [Google Scholar] [CrossRef]
  47. Carranza, E.J.M.; Hale, M.; Faassen, C. Selection of coherent deposit-type locations and their application in data-driven mineral prospectivity mapping. Ore Geol. Rev. 2008, 33, 536–558. [Google Scholar] [CrossRef]
  48. Quesada-Ruiz, L.C.; García-Romero, L.; Ferrer-Valero, N. Mapping environmental crime to characterize human impacts on islands: An applied and methodological research in Canary Islands. J. Environ. Manag. 2023, 346, 118959. [Google Scholar] [CrossRef]
  49. Tuv, E. Feature selection with ensembles. Artif. Var. Redundancy Elimin. 2009, 10, 1341–1366. [Google Scholar]
  50. Rodriguez-Galiano, V.F.; Luque-Espinar, J.A.; Chica-Olmo, M.; Mendes, M.P. Feature selection approaches for predictive modelling of groundwater nitrate pollution: An evaluation of filters, embedded and wrapper methods. Sci. Total Environ. 2018, 624, 661–672. [Google Scholar] [CrossRef]
  51. Deng, H.; Runger, G. Gene selection with guided regularized random forest. Pattern Recognit. 2013, 46, 3483–3489. [Google Scholar] [CrossRef]
  52. Rodriguez-Galiano, V.; Mendes, M.P.; Garcia-Soldado, M.J.; Chica-Olmo, M.; Ribeiro, L. Predictive modeling of groundwater nitrate pollution using Random Forest and multisource variables related to intrinsic and specific vulnerability: A case study in an agricultural setting (Southern Spain). Sci. Total Environ. 2014, 476, 189–206. [Google Scholar] [CrossRef]
  53. Chen, L. Curse of dimensionality. In Encyclopedia of Database Systems; Liu, E.L., Özsu, M.T., Eds.; Springer: New York, NY, USA, 2009. [Google Scholar]
  54. Blum, A.L.; Langley, P. Selection of relevant features and examples in machine learning. Artif. Intell. 1997, 97, 245–271. [Google Scholar] [CrossRef]
  55. Dash, M.; Liu, H. Feature selection for classification. Intell. Data Anal. 1997, 1, 131–156. [Google Scholar] [CrossRef]
  56. Guyon, I.; Elisseeff, A. An introduction to variable and feature selection. J. Mach. Learn. Res. 2003, 3, 1157–1182. [Google Scholar]
  57. Amat, S. MLR: Machine Learning in R. R Package Version 1.0. 2010. Available online: https://cran.r-project.org/web/packages/mlr/index.html (accessed on 7 January 2025).
  58. Observatorio Turístico de Canarias. Sostenibilidad del Turismo en Canarias. Informe 2023; Observatorio Turístico de Canarias: Las Palmas de Gran Canaria, Spain, 2023.
  59. Monterroso Hoyos, O.; Rodríguez, M.; Ramos, E.; Álvarez, O. Estudios ambientales en relación con los vertidos de tierra al mar en Canarias. In Agua: Reflexiones para Una Gestión Eficaz; Instituto de Estudios Hispánicos de Canarias: Santa Cruz de Tenerife, Spain, 2019; pp. 109–118. [Google Scholar]
  60. Gobierno de España. Ley 4/2017, de 13 de Julio, del Suelo y de los Espacios Naturales Protegidos de Canarias. Boletín Oficial del Estado, nº 138, 71167–71331. Available online: https://www.boe.es/buscar/act.php?id=BOE-A-2017-10295 (accessed on 13 July 2017).
  61. An, R.; Liu, P. Research on the environmental philosophy of China’s environmental crime legislation from the perspective of ecological civilization construction. Int. J. Environ. Res. Public Health 2023, 20, 1517. [Google Scholar] [CrossRef]
  62. Odoardi, I.; D’Ingiullo, D.; Di Nucci, A.; Quaglione, D. Exploring the influence of crime on NEET rates: A regional analysis of Italy. Merits 2024, 4, 132–145. [Google Scholar] [CrossRef]
  63. Caplan, J.M.; Kennedy, L.W.; Drawve, G.; Baughman, J.H. Data-Informed and Place-Based Violent Crime Prevention: The Kansas City, Missouri Risk-Based Policing Initiative. Police Q. 2021, 24, 438–464. [Google Scholar] [CrossRef]
  64. Pal, M.; Foody, G.M. Feature selection for classification of hyperspectral data by SVM. IEEE Trans. Geosci. Remote Sens. 2010, 48, 2297–2307. [Google Scholar] [CrossRef]
  65. Sesnie, S.E.; Gessler, P.E.; Finegan, B.; Thessler, S. Integrating Landsat TM and SRTM-DEM derived variables with decision trees for habitat classification and change detection in complex neotropical environments. Remote Sens. Environ. 2008, 112, 2145–2159. [Google Scholar] [CrossRef]
  66. Arabameri, A.; Rezaei, K.; Cerda, A.; Lombardo, L.; Rodrigo-Comino, J. Science of the total environment GIS-based groundwater potential mapping in Shahroud plain, Iran. A comparison among statistical (bivariate and multivariate), data mining and MCDM approaches. Sci. Total Environ. 2019, 658, 160–177. [Google Scholar] [CrossRef]
  67. Rahmati, O.; Reza Hy Melesse, A.M. Catena Application of GIS-based data driven random forest and maximum entropy models for groundwater potential mapping: A case study at Mehran Region, Iran. Catena 2016, 137, 360–372. [Google Scholar] [CrossRef]
  68. Izquierdo-Verdiguier, E.; Zurita-Milla, R. An evaluation of Guided Regularized Random Forest for classification and regression tasks in remote sensing. Int. J. Appl. Earth Obs. Geoinf. 2020, 88, 102051. [Google Scholar] [CrossRef]
  69. Piquero, A.R.; Weisburd, D. Handbook of Quantitative Criminology; Piquero, A.R., Weisburd, D., Eds.; Springer Science+Business Media, LLC: New York, NY, USA, 2010. [Google Scholar] [CrossRef]
  70. Hall, P.A.; McKirdy, D.M.; Grice, K.; Edwards, D.S. Australasian asphaltite strandings: Their origin reviewed in light of the effects of weathering and biodegradation on their biomarker and isotopic profiles. Mar. Pet. Geol. 2014, 57, 572–593. [Google Scholar] [CrossRef]
  71. Polvi, N.; Looman, T.; Humphries, C.; Pease, K. The time course of repeat burglary victimisation. Br. J. Criminol. 1991, 31, 411–414. [Google Scholar] [CrossRef]
Figure 1. (a) Study area. Location of the Canary Islands in the context between Europe and Africa and name of each island. (b) Elevation (meters) in the Canary Islands The geo-referencing system for data in this research is EPSG:32628, UTM (“28+N”) with the WGS84 datum.
Ijgi 14 00410 g001
Figure 2. Location of environmental crimes from Environmental Protection Agency of the Canary Government overlaid on Corine Land Cover 2022 in the Canary Islands: (a) El Hierro; (b)La Gomera; (c) La Palma; (d) Lanzarote; (e) Gran Canaria; (f) Fuerteventura; and (g) Tenerife.
Ijgi 14 00410 g002
Figure 3. Flowchart illustrating the methodology followed in the present study.
Ijgi 14 00410 g003
Figure 4. Mapping of the potential occurrence of environmental crimes related to the Constructions and buildings, also showing protected and urban areas distribution for the Canary Islands: (a) El Hierro; (b)La Gomera; (c) La Palma; (d) Lanzarote; (e) Gran Canaria; (f) Fuerteventura; and (g) Tenerife. The highest potential is mainly found in rural areas, as well as in consolidated urban zones or areas affected by urban sprawl.
Ijgi 14 00410 g004
Figure 5. Mapping of the potential for the occurrence of environmental crimes related to the Mining and tilling (M), also showing protected and urban areas distribution for the Canary Islands: (a) El Hierro; (b)La Gomera; (c) La Palma; (d) Lanzarote; (e) Gran Canaria; (f) Fuerteventura; and (g) Tenerife. The highest potential is mainly concentrated in inland areas slightly away from the coast or in agricultural zones, being more evident in the most populated islands with higher construction activity, such as Gran Canaria and Tenerife, and in those undergoing greater agricultural reconversion processes, such as La Palma and Lanzarote.
Ijgi 14 00410 g005
Figure 6. Mapping of the potential occurrence of environmental crimes related to the Solid waste (S), also showing protected and urban areas distribution for the Canary Islands: (a) El Hierro; (b) La Gomera; (c) La Palma; (d) Lanzarote; (e) Gran Canaria; (f) Fuerteventura; and (g) Tenerife. The highest potential is observed in areas located near urban or densely populated zones.
Ijgi 14 00410 g006
Figure 7. Mapping of the potential occurrence of environmental crimes related to the Liquid waste (L), also showing protected and urban areas distribution for the Canary Islands: (a) El Hierro; (b) La Gomera; (c) La Palma; (d) Lanzarote; (e) Gran Canaria; (f) Fuerteventura; and (g) Tenerife. High-potential areas are mainly concentrated in ravine zones and in the islands of La Palma, La Gomera, and Tenerife, where groundwater abstraction areas are notably present, as well as along the coasts of urbanized zones with potential discharge risk.
Ijgi 14 00410 g007
Figure 8. General model of environmental crime potential in the Canary Islands: (a) El Hierro; (b) La Gomera; (c) La Palma; (d) Lanzarote; (e) Gran Canaria; (f) Fuerteventura; and (g) Tenerife. 0 = no or very low environmental crime potential; 1 = low potential; 2 = medium potential; 3 = high potential; and 4 = very high potential. The highest potential areas (red) are mainly concentrated near the most populated urban centers and zones experiencing strong urban growth, such as Santa Cruz de Tenerife, as well as in areas with intense tourism development, including Adeje and Abona in Tenerife, Corralejo in Fuerteventura, the surroundings of Los Llanos in La Palma, and the peripheral areas of the main tourist zones in San Bartolomé de Tirajana, Gran Canaria.
Ijgi 14 00410 g008
Table 1. Summary of the main groups of features used in the analysis (see full list in Supplementary Materials, Table S1). Acronyms: APMUN = Agencia de Protección del Medio Urbano y Natural; GRAFCAN = Cartographic Company of the Canary Islands; INE = National Statistics Institute of Spain; ESA = European Space Agency.
CategoryExamples of FeaturesSource(s)
Environmental crime recordsIllegal constructions, solid and liquid waste dumping, mining and tillingAPMUN
Land use and servicesCrops, residential accommodations, industrial areas, tourist dwellings, services (restaurants, hotels)GRAFCAN
AccessibilityHighways, urban streets, paths, secondary roadsGRAFCAN
Physical featuresDistance to coast, altitude, slope, protected natural spaces, vegetation index (NDVI)GRAFCAN; ESA
Socio-demographyPopulation density, age structure, household size, income distribution, unemploymentINE
Table 2. Models performance with respect to the environmental crime types. Bold numbers indicate the models that maintain the best balance between overall accuracy and area under the curve. Models: RF = Random Forest, RRF = Regularised Random Forest (RRF), and FS10 = Feature Selection 10 (10 best features from RRF). Performance: OA = Overall Accuracy, AUC = Area Under the Curve, and NF = Number of Features selected. Islands: Lanzarote (LZ), Fuerteventura (FTV), Gran Canaria (GC), Tenerife (TNF), La Gomera (LG), La Palma (LP), and El Hierro (EH).
Constructions and Buildings (B) Mining and Tilling (M)
RFRRFFS10RFRRFFS10
OAAUCOANFAUCOANFAUCOAAUCOANFAUCOANFAUC
LZ93.90.993.9600.994.3100.985.40.886.1360.785.4100.7
FTV93.20.893.4490.893.4100.982.40.883.3260.886.1100.8
GC89.00.889.11000.788.4100.888.10.888.5780.889.9100.8
TNF92.90.892.81010.892.2100.990.80.790.8810.889.1100.8
LG96.40.997.3120.996.7100.991.90.992.7180.991.9100.9
LP94.30.794.1640.792.6100.984.60.885.7210.783.5100.8
EH95.20.897.3190.895.2100.889.10.888.9150.892.6100.8
Solid waste (S)Liquid waste (L)
RFRRFFS10RFRRFFS10
OAAUCOANFAUCOANFAUCOAAUCOANFAUCOANFAUC
LZ91.70.892.0820.891.9100.892.90.995.790.997.1100.9
FTV93.70.893.0550.893.2100.987.90.892.450.889.4100.8
GC92.70.892.91010.892.6100.891.90.593.360.892.860.5
TNF89.00.889.31010.889.0100.896.60.897.6220.896.9100.8
LG95.10.895.3340.793.1100.888.90.888.9100.888.9100.8
LP93.70.794.1540.893.7100.883.30.883.370.888.9100.9
EH92.70.894.5220.8393.6100.8100.00.875.010.787.5100.7
Table 3. Surface area potentially affected by environmental crimes on each island, expressed in square kilometers (km2) and as a percentage of each island’s total surface area. Environmental crimes classification: B = Constructions and buildings, M = Mining and tilling, S = Solid waste, L = Liquid waste. Islands: Lanzarote (LZ), Fuerteventura (FTV), Gran Canaria (GC), Tenerife (TNF), La Gomera (LG), La Palma (LP), and El Hierro (EH). The values were derived from the number of pixels classified as positive (value 1) by models, indicating the potential occurrence of an environmental crime.
BMSL
km2%km2%km2%km2%
LZ101.312.6108.813.6424.453.019.62.5
FTV52.83.264.83.958.83.557.43.5
GC109.07.0412.826.4337.721.635.62.3
TNF431.821.2305.615.0792.538.9276.113.6
LG23.96.510.12.750.313.759.5316.1
LP49.77.0149.121.039.25.541.25.8
EH42.115.722.58.310.23.82.20.8
Table 4. Surface area associated with each environmental crime potential score by island. 0 = no or very low environmental crime potential; 1 = low potential; 2 = medium potential; 3 = high potential; and 4 = very high potential. Lanzarote (LZ), Fuerteventura (FTV), Gran Canaria (GC), Tenerife (TNF), La Gomera (LG), La Palma (LP), El Hierro (EH).
01234(1–4 Inclusive)
km2%km2%km2%km2%km2%km2%
LZ337.739.9387.348.4107.213.413.61.70.00.0508.263.4
FTV1533.992.553.63.242.62.627.81.71.10.1125.27.6
GC976.153.7329.4623.0217.8714.136.28.41.360.8584.946.3
TNF986.548.5613.330.1221.510.9104.45.1108.65.31047.951.5
LG272.674.163.1217.117.14.614.273.90.910.2595.4125.9
LP497.470.2160.122.634.94.914.42.01.60.2210.929.8
EH202.875.558.221.66.22.31.30.50.10.065.924.5
Disclaimer/Publisher’s Note: The statements, opinions and data contained in all publications are solely those of the individual author(s) and contributor(s) and not of MDPI and/or the editor(s). MDPI and/or the editor(s) disclaim responsibility for any injury to people or property resulting from any ideas, methods, instructions or products referred to in the content.