Article

Exploring Factors Behind Weekday and Weekend Variations in Public Space Vitality in Traditional Villages, Using Wi-Fi Sensing Method

1
School of Art and Archaeology, Hangzhou City University, Hangzhou 310015, China
2
Zhejiang Provincial Cultural Institute for Grand Canal, Hangzhou 310015, China
3
College of Civil Engineering and Architecture, Zhejiang University, Hangzhou 310058, China
*
Author to whom correspondence should be addressed.
ISPRS Int. J. Geo-Inf. 2025, 14(10), 386; https://doi.org/10.3390/ijgi14100386
Submission received: 12 August 2025 / Revised: 26 September 2025 / Accepted: 30 September 2025 / Published: 2 October 2025
(This article belongs to the Special Issue Spatial Information for Improved Living Spaces)

Abstract

With the rise in rural tourism, public space use has become more complex, causing significant weekday-weekend vitality imbalances. However, the factors shaping these dynamics in traditional villages remain unclear. This study uses Wi-Fi sensing method to analyze vitality variations across weekdays and weekends, and it develops a 13-metric evaluation framework to examine how built environment factors, from both internal and external dimensions, differentially influence the vitality of public spaces in traditional villages across various time periods. Using 17 public spaces in Yantou Village, Lishui, China, as a case, it finds: (1) Historical Element Proximity consistently and significantly drives public space vitality across all periods; (2) Leisure Facility Count and Decorative Element Count demonstrate strong positive effects during weekend morning peaks. (3) Retail Facility Count significantly reduces vitality during weekend morning peak but enhances it during midday off-peak, whereas Street Vendor Count shows the opposite pattern—increasing vitality in morning peak and decreasing it in midday off-peak. Using Wi-Fi sensing’s high-resolution, real-time, and non-invasive capabilities, this study provides a scientific method to accurately assess the variations in public space vitality and their impact factors between weekdays and weekends in traditional villages, offering technical support for enhancing public space vitality and sustainably revitalizing rural heritage.

1. Introduction

Traditional villages, formed in earlier periods and endowed with rich cultural heritage, represent valuable rural heritage assets with significant historical, cultural, architectural, and academic value [1,2]. The public spaces within these villages function as essential platforms for preserving rural historical and cultural heritage, facilitating community interaction and enhancing functional connectivity. The social networks and regional cultural attributes embedded within their spatial fabric serve as spiritual anchors that support the protection and development of these villages while also providing a functional foundation for reordering spatial and social structures amid village transformation. In the context of global rural revitalization efforts, enhancing the vitality of public spaces in traditional villages is considered essential. For example, in Raghurajpur, India, initiatives have been undertaken in collaboration with residents to design public spaces that support rural heritage, cultural performances, and tourism [3]. In Japan, the Echigo-Tsumari Art Triennial features site-specific artworks installed in public spaces of traditional villages, thereby transforming them into cultural venues and fostering social and environmental renewal [4].
In China, the renewal of public spaces in traditional villages has also received high priority from the government. In 2025, the State Council of China issued the “Comprehensive Rural Revitalization Plan (2024–2027)”, which called for the optimization of rural functions and spatial layouts while leveraging rural areas to inherit and develop the nation’s traditional cultural heritage [5]. Earlier, in 2021, the General Office of the State Council released the “Opinions on Strengthening the Protection and Inheritance of Historical and Cultural Heritage in Urban and Rural Construction”, which required micro-regeneration of public spaces in traditional villages and the coordination of rural development with heritage conservation and utilization [6]. Therefore, the scientific revitalization of public spaces in traditional villages in China constitutes a strategic priority for preserving and utilizing these spaces and their historical and cultural heritage.
However, traditional village public space revitalization currently faces entrenched challenges: widespread functional homogeneity and competitive rather than cooperation dynamics, leading to spatial–temporal vitality imbalances. This manifests as significant spatiotemporal disparities between weekdays and weekends, characterized by consistently low vitality during weekdays versus abrupt surges on weekends [7]. In the traditional village cluster of Tonglu County, China, for instance, weekday public space utilisation rates typically remain below 30%, insufficient to sustain conservation needs, while holiday periods experience peak visitor numbers surging 150–300% beyond capacity, resulting in significant service quality deterioration.
This imbalance in vitality between weekdays and weekends exposes the inadequate understanding of vitality dynamics and influencing mechanisms in current approaches, as well as the lack of targeted spatio-temporal integration and multi-factor coordinated governance. With the growth of rural cultural tourism globally, such spatio-temporal disparities in vitality will intensify, rendering coordinated enhancement of public space vitality in traditional villages increasingly urgent. Therefore, there is a critical need to explore the spatio-temporal differentiation of vitality patterns and the variation in impact factors between weekdays and weekends to provide a scientific foundation for optimizing spatial layouts and functional configurations, facilitating more efficient resource utilization and evidence-based enhancement of overall vitality.

2. Literature Review

2.1. Public Space Vitality in Traditional Villages

Vitality is often regarded as a sense of vigor or life force, representing the energy, quality of life, and creativity exhibited by people, places, or communities, arising from the interactions between human and place. In early urban studies, Jacobs identified mixed-use neighborhoods, short blocks, diverse building types, and high density as essential conditions for urban vitality [8]. Lynch defined urban vitality as “the degree to which the form of the settlement supports the vital functions, the biological requirements and capabilities of human beings” [9]. At the micro-scale, Bentley described vitality as the property to influence fixed places and accommodate multiple functions [10], while Gehl demonstrated that well-designed streets and squares produce far more activity than sterile ones [11]. Lavrusheva interpreted it as the capacity for persistence, survival and growth [12]. In rural studies, vitality has historically signified an attribute of rural prosperity [13]. Given that traditional villages prioritize the holistic continuity of agrarian cultural settlements, emphasizing both physical preservation and living transmission of intangible heritage [14], this study defined the public space vitality in traditional villages as the comprehensive ability to maintain their integrity and continuous existence.

2.2. Assessment of Public Space Vitality in Settlements

Methods for evaluating the vitality of public spaces encompass both qualitative analysis and quantitative measurement. Qualitative research commonly employs observation and interview methods to evaluate the vitality of public spaces from multiple dimensions, focusing on the mechanisms and complex factors that influence it. For example, Jalaladdini et al. observed and compared the socio-spatial characteristics of two streets in Cypriot Towns and found that public space vitality is shaped by the combined effects of accessibility, functional diversity, user composition, and the activity time distribution [15]. Hikmah et al. conducted a qualitative study of a park in Indonesia, highlighting that its declining vitality was largely attributable to the unreasonable functional layout, deteriorating facilities, weak spatial connectivity, and inadequate responses to users’ needs, rights, and spatial meaning [16]. Zagraba et al., through a comparative analysis of traditional market squares in three Polish small towns, demonstrated that the vitality of historical public spaces was closely associated with the integrity and authenticity of their historical physical environments, emphasizing that conservation, rather than the mere introduction of new functions, was fundamental to revitalization [17].
Quantitative measurements are based on objective indicators to quantify vitality and currently constitute the predominant approach for evaluating public space vitality. Generally, quantitative indicators are divided into two categories: single-factor measurements and multi-factor integration. Single-factor measurements often involve the use of the people flow per unit of time and space as a metric. For example, Zumelzu et al. employed gate method to assess pedestrian flow during defined periods in five neighborhoods in the city of Valdivia, Chile, to measure neighborhood vitality [18]. Ding et al. assessed the vitality of street networks in three tourist villages in southern Anhui, China, by observing pedestrian volumes [19]. Multi-factor integration involves a comprehensive assessment of public space vitality through the integration of indicators across multiple dimensions. Zhang et al. developed a framework of indicators based on three dimensions—historical value, usage value, and sustainability value—for the quantitative evaluation of public spaces in nine historical and cultural districts in Beijing [20]. Song et al. performed a quantitative analysis of public space vitality by integrating indicators of physical space and crowd behavior across three dimensions: spatial distribution, spatial connectivity, and spatial structure [21].
In recent years, urban studies have increasingly focused on the temporal variations and dynamic characteristics of vitality. As early as the 1970s, Hägerstrand introduced the concept of time geography, which emphasized the underlying regularities governing human activities under spatiotemporal constraints [22]. Subsequently, Stokols’ work in environmental psychology [23] and Goffman’s study on behavior in public places [24] further examined human behavioral patterns within such constraints, establishing a theoretical basis for the study of dynamic vitality. With the growing availability of big data and the advancement of analytical technologies, it has become possible to capture more complex dynamics of human behavior, enabling a more refined analysis of the spatiotemporal characteristics of vitality [25]. For instance, Lou et al. employed high-precision mobile signaling data to capture hourly vitality metrics in urban parks and identified three vitality types based on patterns of vitality fluctuation [26]. Liu et al. examined variations in vitality between weekdays and weekends in the waterfront public spaces along Huangpu River, Shanghai, based on Tencent user density data [27].

2.3. Wi-Fi Sensing Method Used in Related Studies

Due to limitations in coverage and spatio-temporal accuracy, conventional big data remain difficult to obtain in rural areas and heritage sites and are often unsuitable for analyzing small-scale public spaces [28]. Consequently, vitality evaluations have tended to rely primarily on spatial attributes [29,30,31]. To address these shortcomings, recent studies have increasingly employed IoT devices and wearable sensors to capture real-time human behavior [28], such as handheld GPS receivers [32], eye-tracking devices [33], and Bluetooth sensors [34].
Among these technologies, the Wi-Fi probe is a sensing device that scans nearby mobile phones and records each detected device’s timestamp, geographic coordinates, and MAC address [35]. Wi-Fi probes have been demonstrated in multiple studies to be effective for monitoring the spatio-temporal behavioral dynamics of micro-scale spaces. For example, Li et al. developed a Wi-Fi–based framework for mapping spatio-temporal tourist flow patterns in community-based tourism [36]. Hu et al. employed Wi-Fi probes to investigate the spatio-temporal distribution of visitors in an urban park [37], and Zhou et al. used Wi-Fi data to track tourist trajectories in the Higashiyama district of Kyoto, identifying the golden routes [38]. These studies demonstrated that Wi-Fi sensing can capture high-resolution behavioral data, providing a robust and practical approach for refined spatial vitality research in rural areas.
The application of Wi-Fi probes still has certain limitations. First, Wi-Fi signals are highly sensitive to environmental variations and may be affected by factors such as weather conditions or physical obstructions, potentially reducing data accuracy [39]. Second, outdoor deployment requires careful consideration of device protection, power supply, and network backhaul, which collectively increase system complexity and operational costs [40]. Third, the raw data inherently contain device MAC addresses, raising concerns regarding information privacy and data security [41,42]. These limitations present notable challenges for employing Wi-Fi probes in the analysis of people dynamics within public spaces.

2.4. Impact Factors of Public Space Vitality in Settlements

The factors influencing the vitality of public spaces are numerous. Overall, they can be divided into two principal categories: inherent characteristics of the space and surrounding environmental factors, which are typically considered comprehensively. For example, Bačić et al., through case studies of historical towns along the Croatian coast, identified design quality, environmental signage, public facility needs, and comfort levels as impact factors of spatial vitality [43]. Lee et al. conducted an in-depth analysis of streets in three districts of Seoul to examine the effects of built environment elements, such as pedestrian infrastructure, building density, street furniture, green infrastructure, and open spaces, on street vitality [44].
In the context of traditional villages, the natural environment, as well as historical and cultural elements, constitute crucial factors in sustaining the public space vitality. Natural environment plays a foundational role in site selection, spatial layout, and the formation of public space structures in traditional villages [45,46]. A favorable natural and ecological setting can enhance the attractiveness, comfort, and aesthetic value of public spaces [47], encouraging human activity and contributing to the improvement of spatial vitality. Historical and cultural elements form the cultural essence of traditional villages. These elements are expressed in public spaces through both material and immaterial forms, shaping their distinctive cultural atmosphere and functional relevance, and are closely associated with the cultural heritage value and vitality of these spaces [48]. The material elements, such as buildings, courtyards, and alleys, reflect local historical culture and regional characteristics [49], which attract residents and tourists to stay and socialize, boosting vitality. Intangible cultural heritage contributes to unique cultural experiences and fosters community cohesion, which draws significant participation from both residents and visitors. Various studies have confirmed that intangible cultural heritage events, such as local festivals, often result in substantial increases in visitor flow during specific periods at tourist destinations [50,51,52,53], thus stimulating the vitality of public spaces.
Corresponding to the temporal dynamics of vitality, some scholars have noted variations in the factors influencing vitality across temporal dimensions. However, such studies have been conducted primarily within urban contexts. For example, Kang compared neighborhood vitality of communities in Seoul and their built environmental factors across three periods (morning, working hours, and evening) on both weekdays and weekends to examine temporal variations [54]. Mu et al. examined fluctuations in the spatial vitality of three community parks in Zhengzhou, China and analyzed the effects of visitor behavior and park features on vitality [55]. Liu et al. evaluated built environment factors such as the transport system, function features and spatial quality of multiple historic districts and observed differential effects on vitality between daytime and nighttime [56]. Li et al. [57] and Yang et al. [58] investigated the influence of multi-dimensional built environment factors on street vitality at different times of day, using the Baita Temple Historic District in Beijing and the Mong Kok Commercial District in Hong Kong as case studies. In recent years, a limited number of studies have emerged focusing on factors influencing dynamic vitality in rural areas. Chen et al. identified the spatiotemporal characteristics of vitality in 28 public spaces in Xikou Village, China, and analyzed the factors influencing rural public space vitality by examining variations in user density and behavior diversity [59]. However, the number of such studies remains considerably lower than those conducted in urban settings, and research in this area remains in an early stage.

2.5. Research Aims

In summary, current studies reveal several research gaps. First, due to the challenges in obtaining rural data, research on the vitality of traditional village public spaces and their impact factors has predominantly relied on static analyses. Differences in time-specific vitality and their impact factors have not yet been quantitatively assessed. Second, to adequately reflect the unique characteristics of traditional villages, existing research has yet to identify appropriate indicators for factors influencing vitality. Therefore, further research is urgently needed to provide: (1) methods for collecting and measuring time-specific vitality suitable for rural micro-scale public spaces; (2) analytical approaches for examining time-varying impact factors that account for the distinctive vitality characteristics of traditional villages.
This study aims to examine the spatial-temporal variations in the public space vitality across typical weekday and weekend periods in traditional villages and develop a methodological framework for identifying the impact factors and their influencing strength differences, providing a scientific basis for enhancing vitality more effectively. We introduced Wi-Fi probe-based monitoring technique to analyze visitor retention intensity and durability, establishing a method for evaluating weekday-weekend vitality disparities. Furthermore, a comprehensive indicator system comprising 13 metrics was formulated to assess the impact strength of built environment factors on vitality from both internal and external dimensions. Using 17 public spaces in Yantou Village, Lishui City, China, as a case study, this study identified key impact factors and their varying strengths between weekdays and weekends. This approach can offer insights for analyzing the impact factors behind spatial-temporal variations in public space vitality in traditional villages across diverse regions and contribute to the coordinated enhancement of vitality throughout all time periods.

3. Materials and Methods

3.1. Study Area

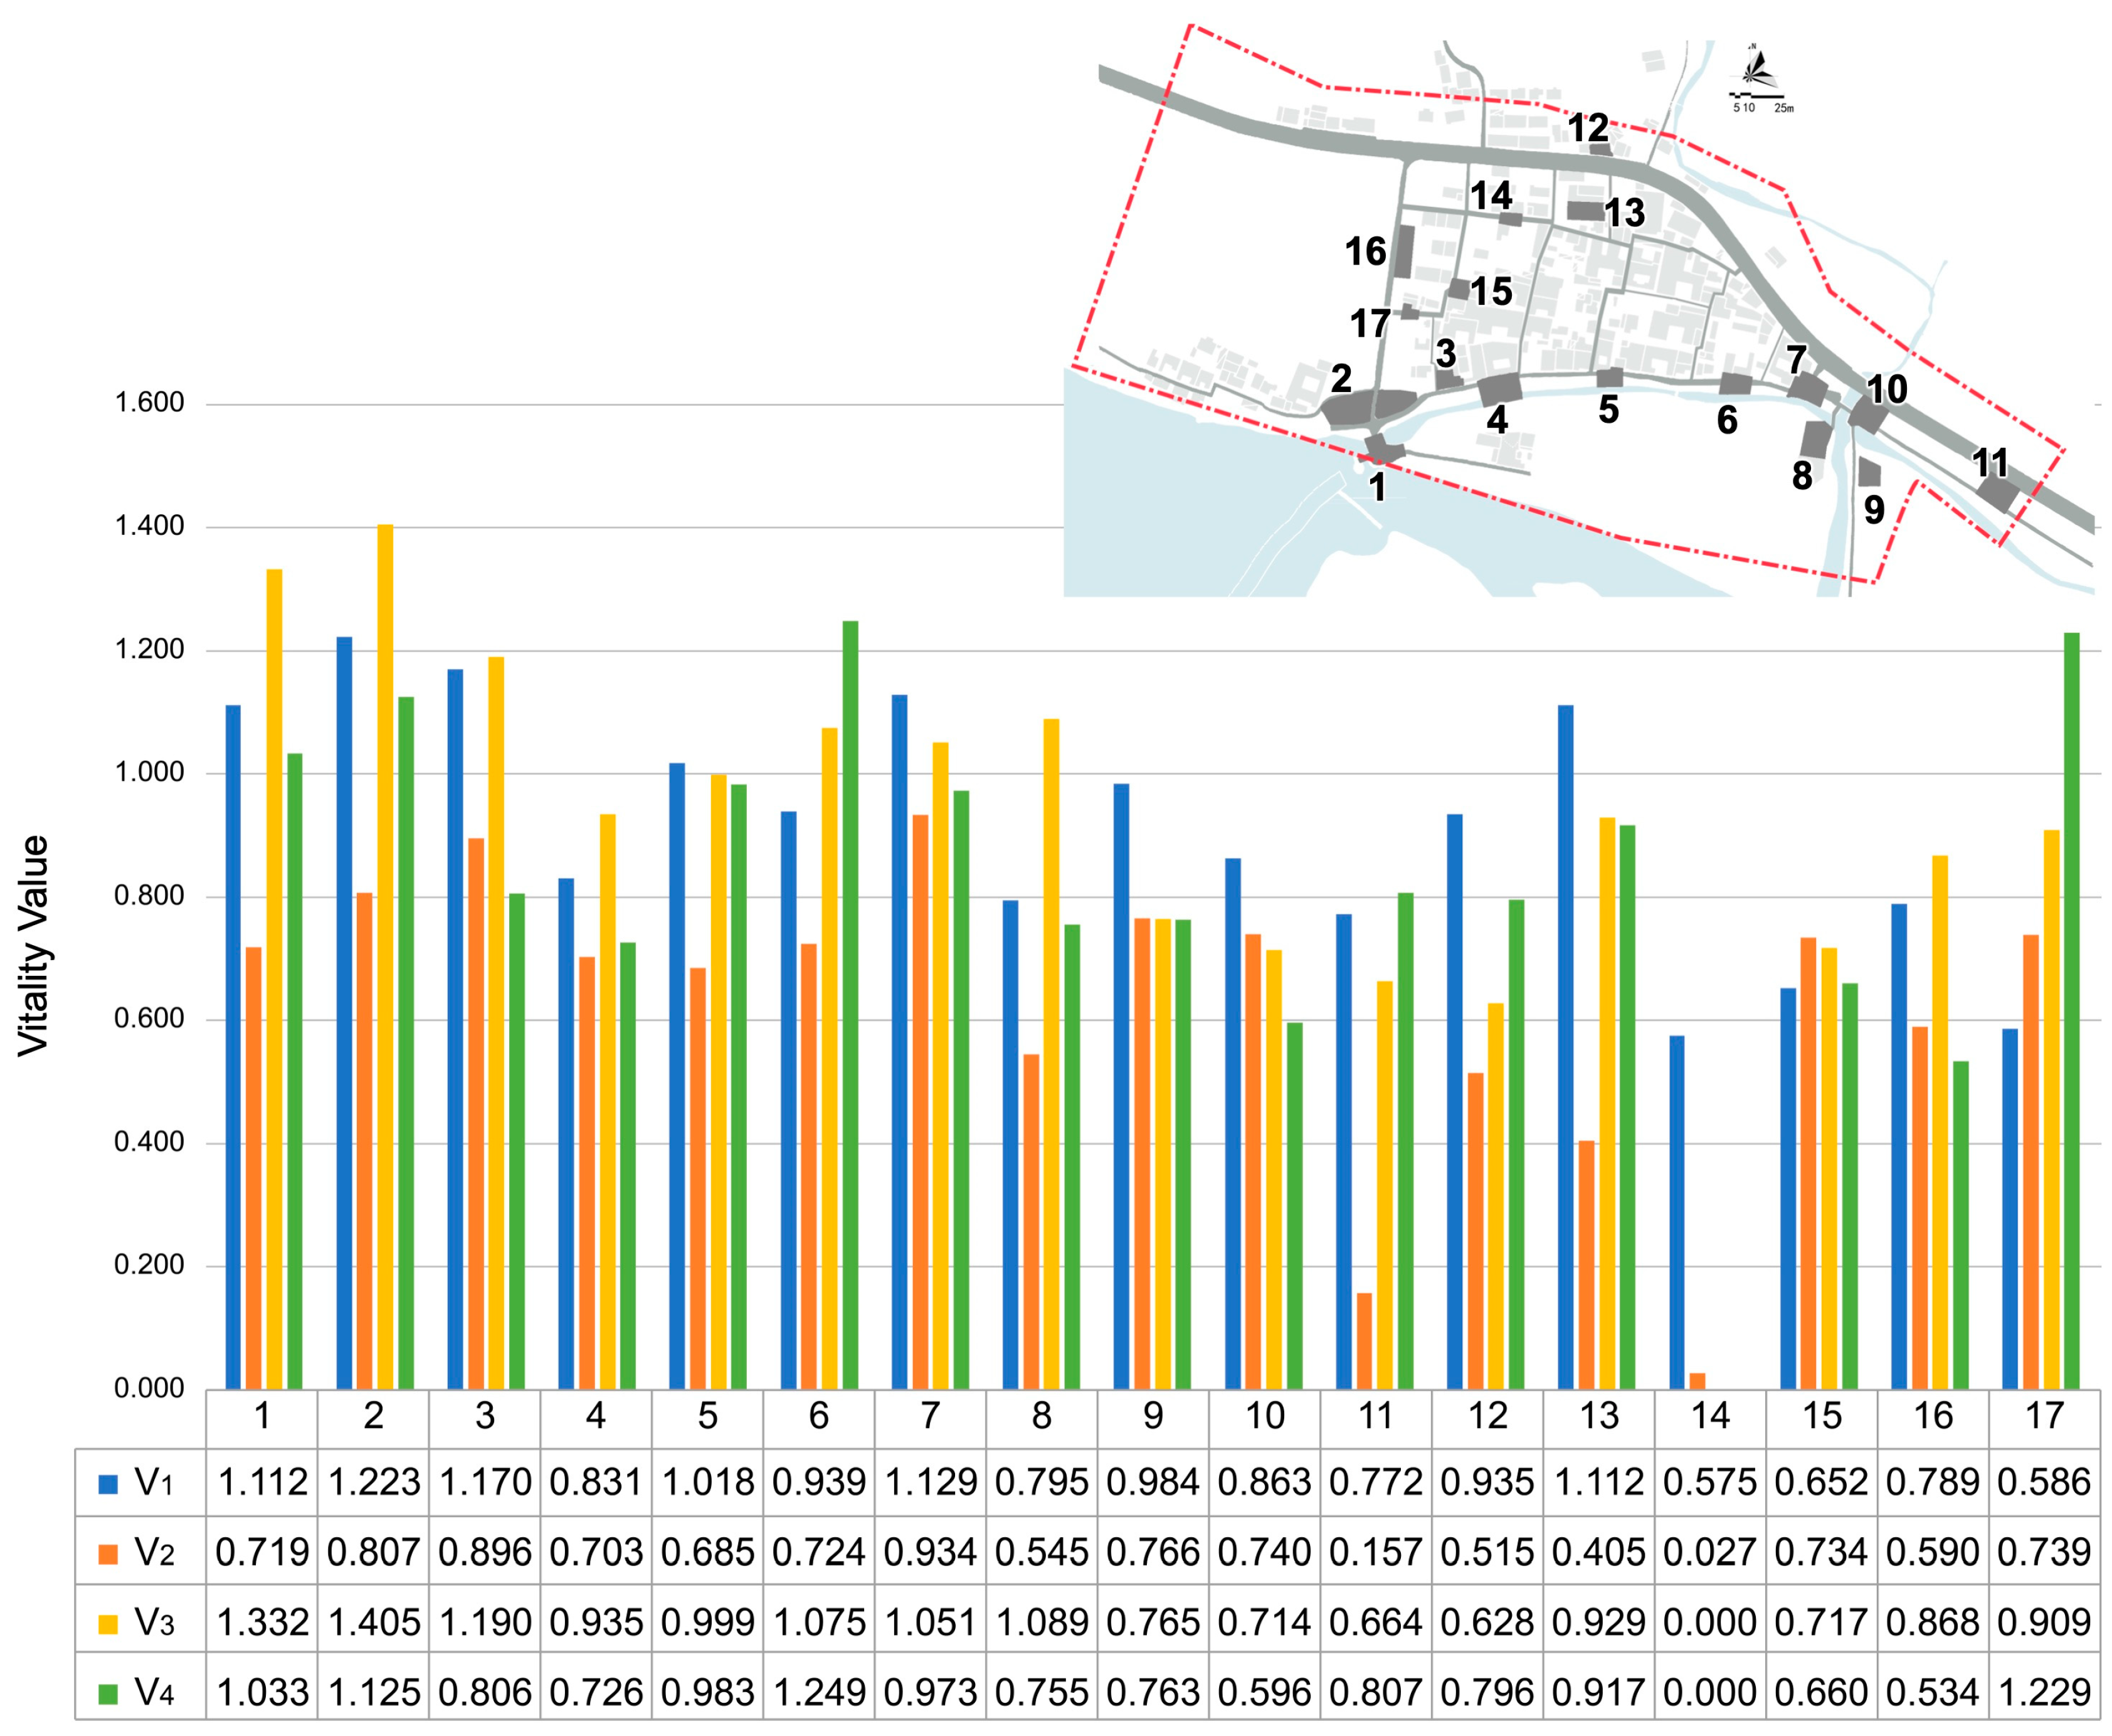
Empirical research was conducted in Yantou Village, Lishui City, China. Yantou Village is a nationally designated traditional village and part of the Guyan Huaxiang Scenic Spot. The village attracts over 300,000 tourists annually. It possesses rich cultural heritage and features various tourism-dependent services, such as home accommodation and agritainment facilities. However, according to existing surveys, there are significant spatial-temporal variations in the vitality of public spaces, as well as an uneven distribution of historical, cultural, and commercial resources across the village. As a result, certain public spaces exhibit low utilization rates and diminished vitality, underscoring a pressing need for improvement. These phenomena indicate that a scientific approach is needed to guide the renewal of public spaces. Therefore, Yantou Village serves as an appropriate case study for this research. In this study, 17 typical public spaces were selected for analysis (Figure 1).

3.2. Research Framework

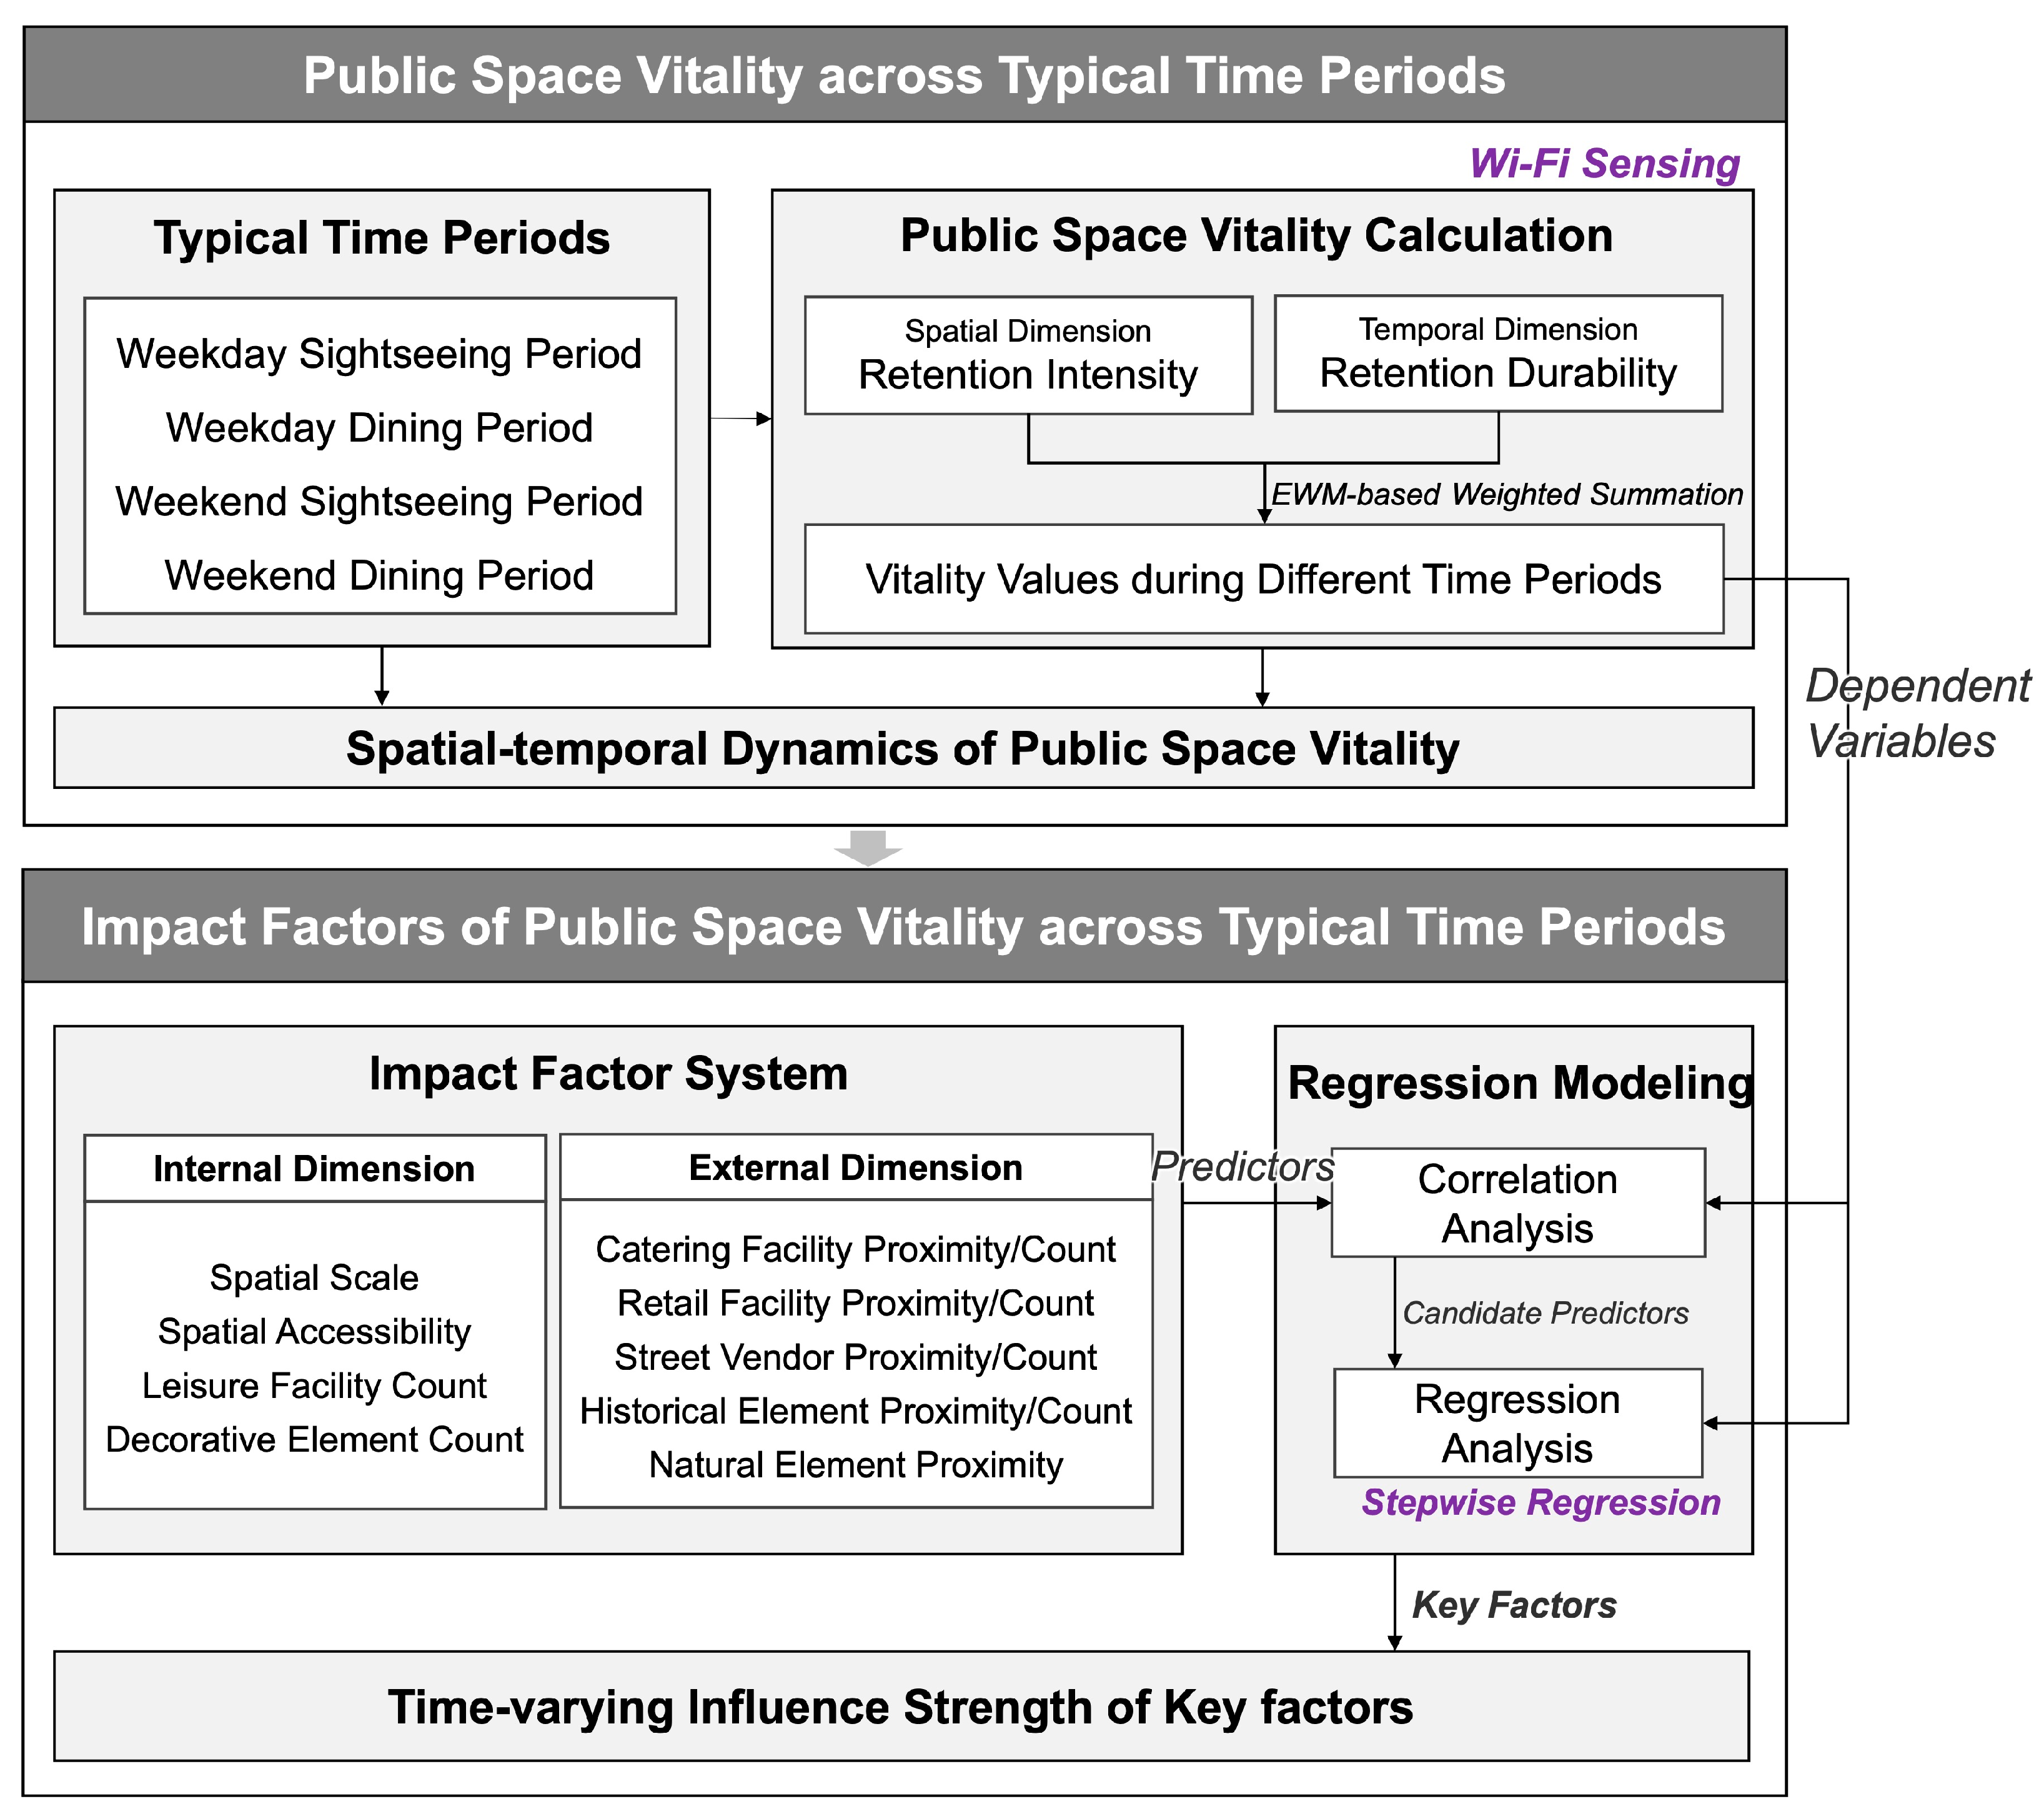
This study consists of two parts: (1) assessment of the public space vitality across typical time periods and (2) analysis of the impact factors of public space vitality across distinct time periods (Figure 2). First, four representative time periods were identified. Spatial and temporal dimensions were applied in constructing vitality indicators, which were used to calculate the vitality in each period and to capture the spatio-temporal dynamics of each public space’s vitality. Second, 13 indicators of built environment factors were developed from internal and external dimensions. A stepwise regression model was employed to determine the key impact factors of vitality during each typical time period and to compare the relative strength of their influence.

3.3. Identification of Typical Time Periods

Previous studies indicate that about 80% of China’s traditional villages are located in suburban or mountainous areas with limited accessibility [60,61,62]. The scarcity of supporting facilities within and around these villages, such as dining and lodging options, constrains their capacity to attract overnight tourists [63]. Our field investigations confirmed that, due to these limitations, most visitors stay in nearby towns. The return journey from villages typically takes more than one hour, prompting many tourists to leave after 4:00 PM. In Yantou Village, the case study site, access is primarily by boat, with services ending at 5:00 PM. This results in a concentrated departure of tourists after 3:00 PM and a sharp decline in visitor numbers thereafter, making it difficult to conduct meaningful statistical analysis for the late afternoon period. Therefore, based on both literature and empirical observations, this study identifies the morning peak and midday off-peak as the most representative time periods for analysis.
Given the significant differences in tourist spatiotemporal behavior between weekdays/weekends and across different time periods, this study selected four typical time periods for vitality calculations: weekday morning peak (V1), weekday midday off-peak (V2), weekend morning peak (V3), and weekend midday off-peak (V4). To reduce behavioral randomness, data from consecutive two-hour intervals were used. Monitoring results showed that the peak period of people flows (9:00–11:00) was defined as the morning peak, while the low period (12:00–14:00) was defined as the midday off-peak. The vitality values for V1–V4 were calculated separately to analyze more refined spatio-temporal vitality differentiation characteristics.

3.4. Calculation and Data Collection Methods for Vitality During Typical Time Periods

This study conceptualizes the vitality of traditional village public spaces as the ability to attract and retain people flow across spatial and temporal dimensions. Based on this definition, a vitality indicator system was developed (Table 1). The spatial dimension is assessed through retention intensity, defined as the people flow per unit time and per unit area during typical time periods, reflecting the ability of a space to attract people to visit. The temporal dimension is assessed through retention duration, referring to the average length of stay during typical time periods, indicating the space’s ability to attract people to stay for a long time. Indicator weights were assigned using the entropy weighting method (EWM) [64]. Following normalization, the indicators were weighted and summated to calculate the vitality value throughout different time periods.
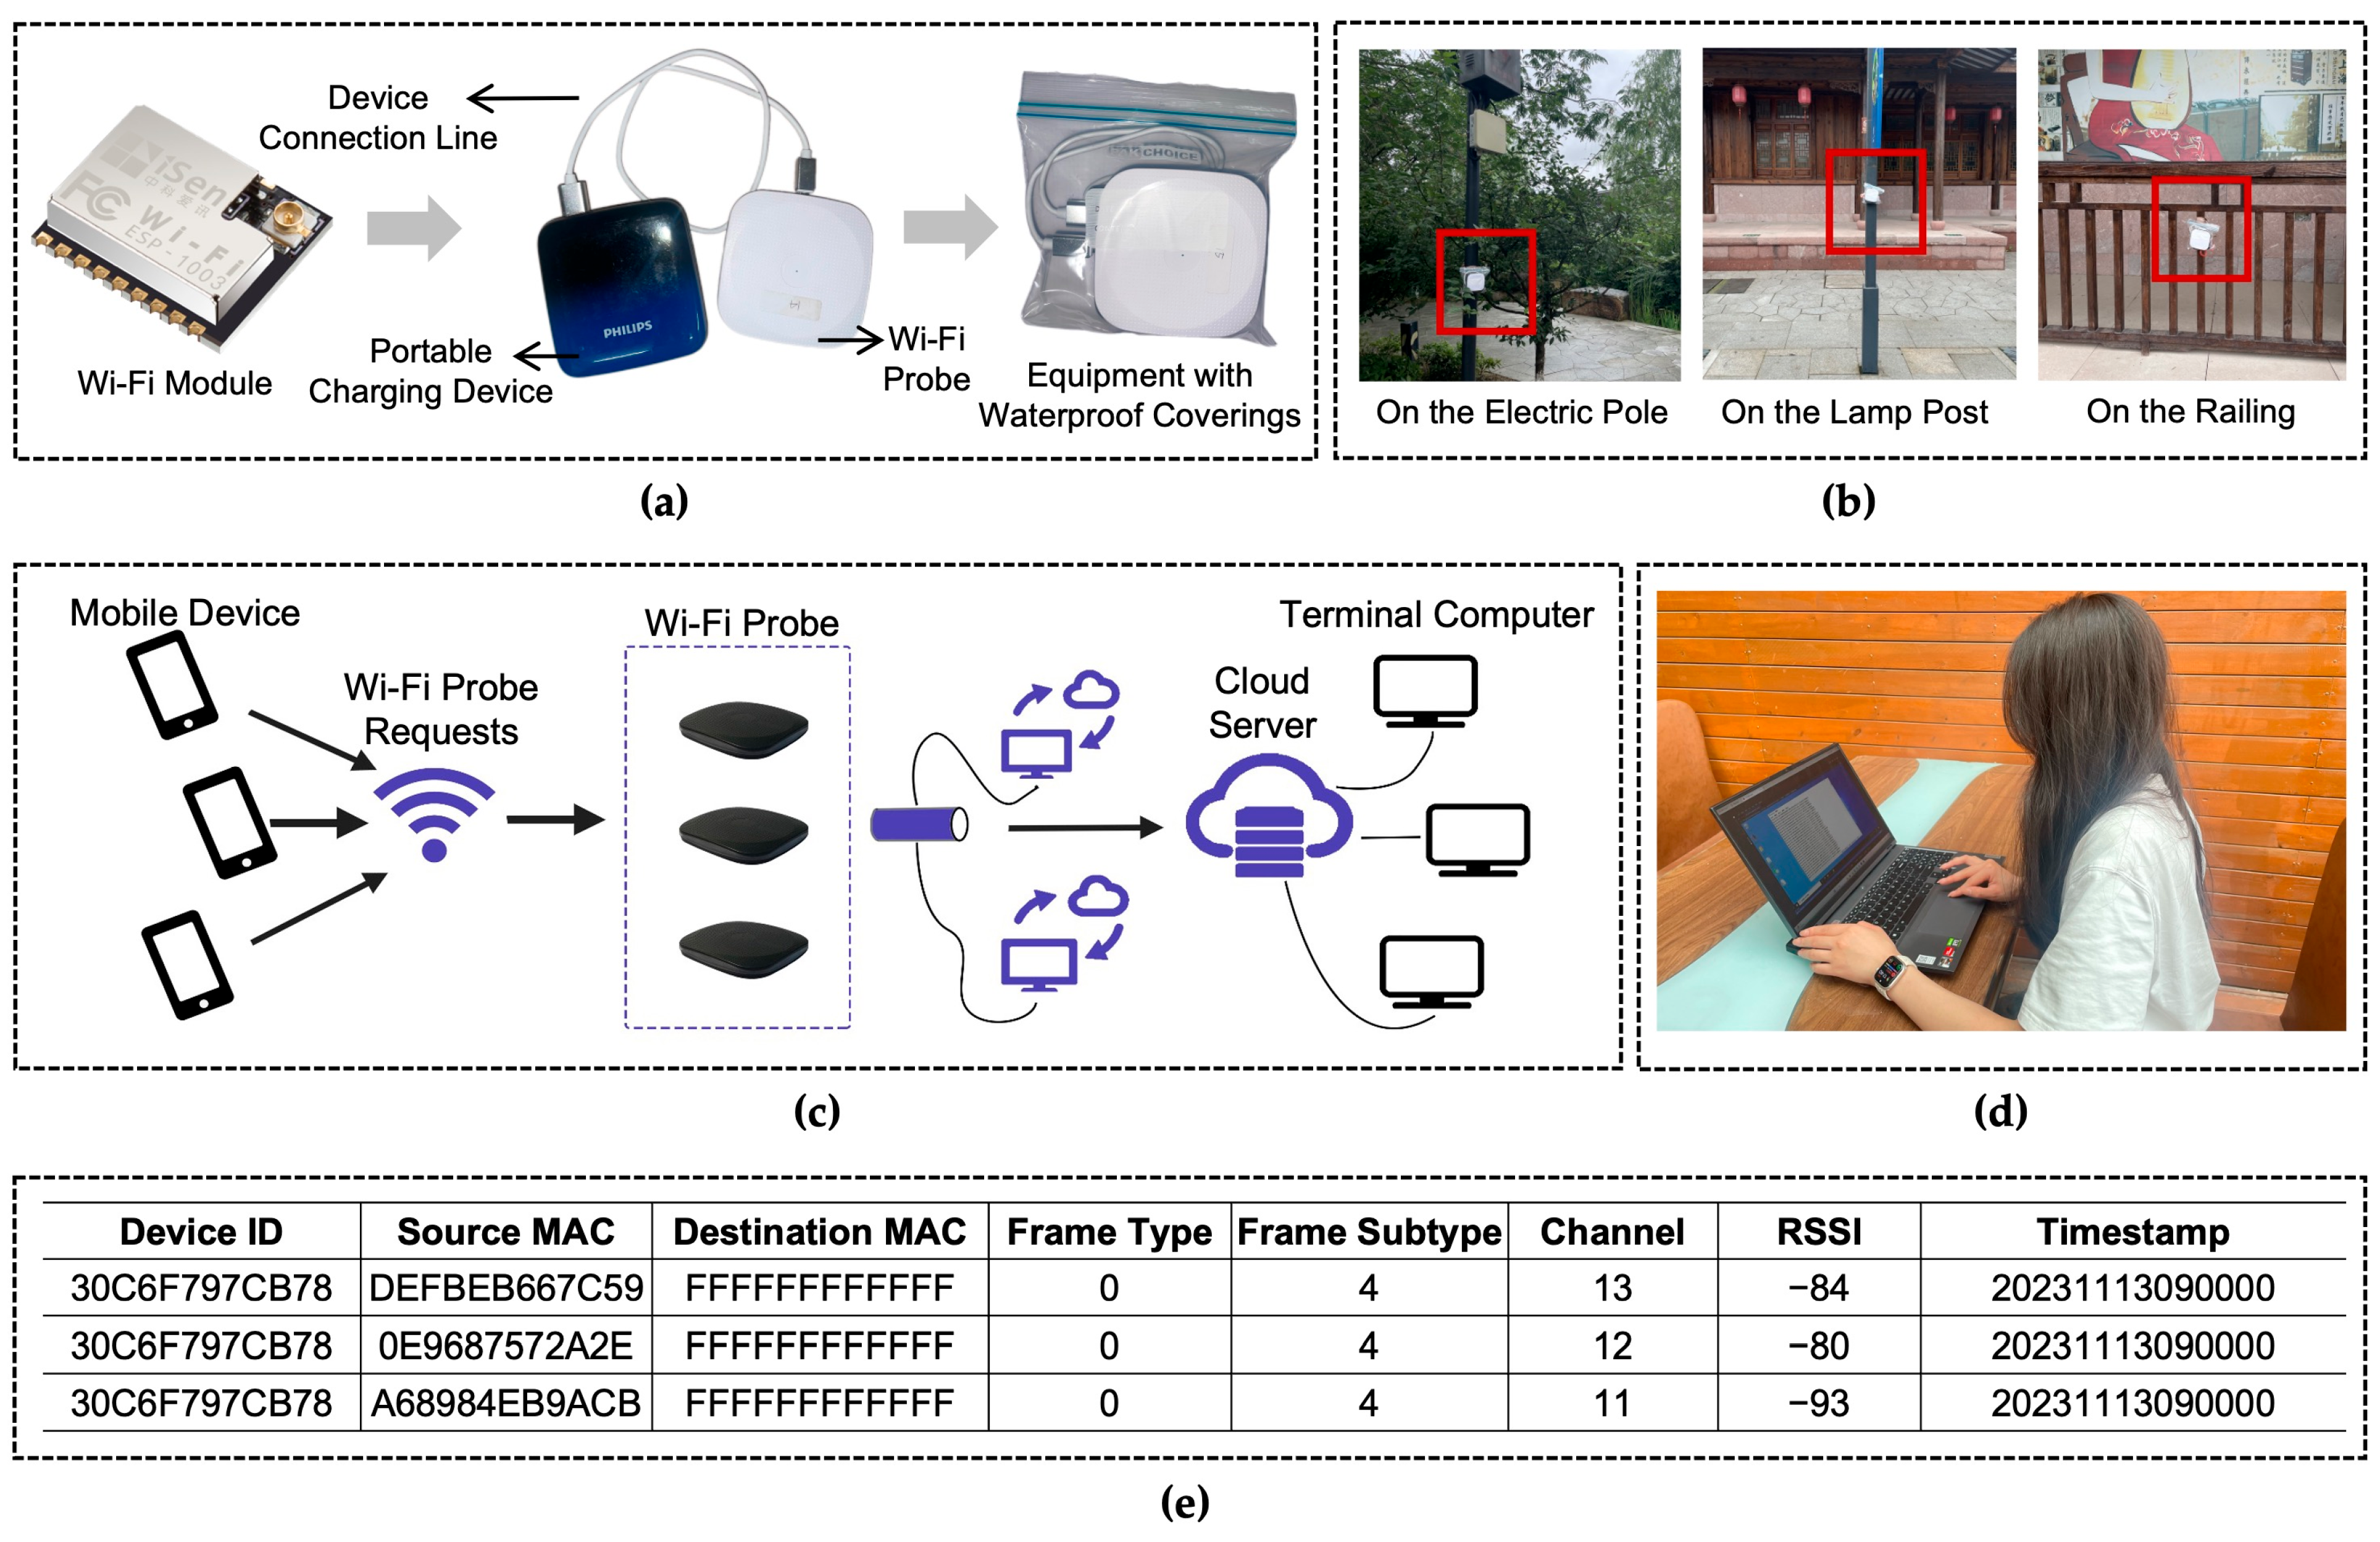
Data for public space vitality assessment were collected using TZ4007Pro Wi-Fi probe devices (iSen, Shenzhen, China). Detailed procedures for device installation, data monitoring, and preprocessing are available in our previous publication [65]; only a brief summary is provided here. Monitoring was conducted over a one-week period from 13 November to 19 November 2023, including five weekdays and two weekend days. During this period, the case study site experienced clear weather, with daytime temperatures ranging from 10 to 20 °C and no rainfall or extreme weather, which minimized their potential impact on people flow and stay length. Data collection was performed daily from 08:00 to 20:00 to capture both weekday and weekend patterns. Real-time data on people flow and stay length were continuously recorded across various public spaces (Figure 3). This observation window (08:00–20:00) was selected because (1) according to existing literature and our preliminary investigation, approximately 80% of Chinese traditional villages are located in suburban or remote mountainous areas, where on-site amenities such as dining and accommodation are scarce, resulting in minimal overnight stays by visitors [60,61,62,63]; (2) many of these villages experience population hollowing, with residents primarily comprising elderly individuals and children [66], whose nocturnal activities typically conclude early; (3) our three-day preliminary survey at the case study site confirmed this pattern, showing almost no nighttime tourists and that most villagers remained at home after 20:00, leading to very low levels of nighttime public space activity. Therefore, post-20:00 data were not included in the scope of this study.
Wi-Fi probes have been demonstrated to be effective for monitoring the spatiotemporal behavioral dynamics of people in confined spaces. Nevertheless, they present challenges related to privacy, data accuracy, and environmental adaptability [67]. To address these issues, firstly, the monitoring radius of each device was configured according to the dimensions of the public spaces, with two devices deployed in larger spaces. Through careful adjustment of device placement, precise coverage of each public space was achieved, enhancing data accuracy. Second, each Wi-Fi probe was connected to a portable power supply and enclosed in a waterproof casing to ensure stable operation under outdoor conditions. Third, raw data were anonymized to mitigate privacy risks. In addition, weather forecasts were consulted to prevent potential interference from factors such as rainfall during the monitoring period.

3.5. Selection of Impact Factor Indicators and Calculation Methods

Drawing on previous research into factors influencing public space vitality and incorporating traditional village built environment characteristics, 13 indicators were selected from internal and external dimensions to develop an impact factor system (Table 2). The internal dimension comprises 4 indicators: Spatial Scale (X1), Spatial Accessibility (X2), Leisure Facility Count (X3), and Decorative Element Count (X4). Spatial scale and accessibility constitute foundational determinants of people flow, with spatial scale reflecting capacity [68,69] and accessibility indicating ease of visitor access [56,70]. Leisure facilities and decorative elements address visitor needs for rest and sightseeing, contributing to spatial vitality and encouraging visitors to stay [69,71,72,73]. In addition, based on our preliminary survey, these indicators exhibited significant variations across public spaces in traditional villages.
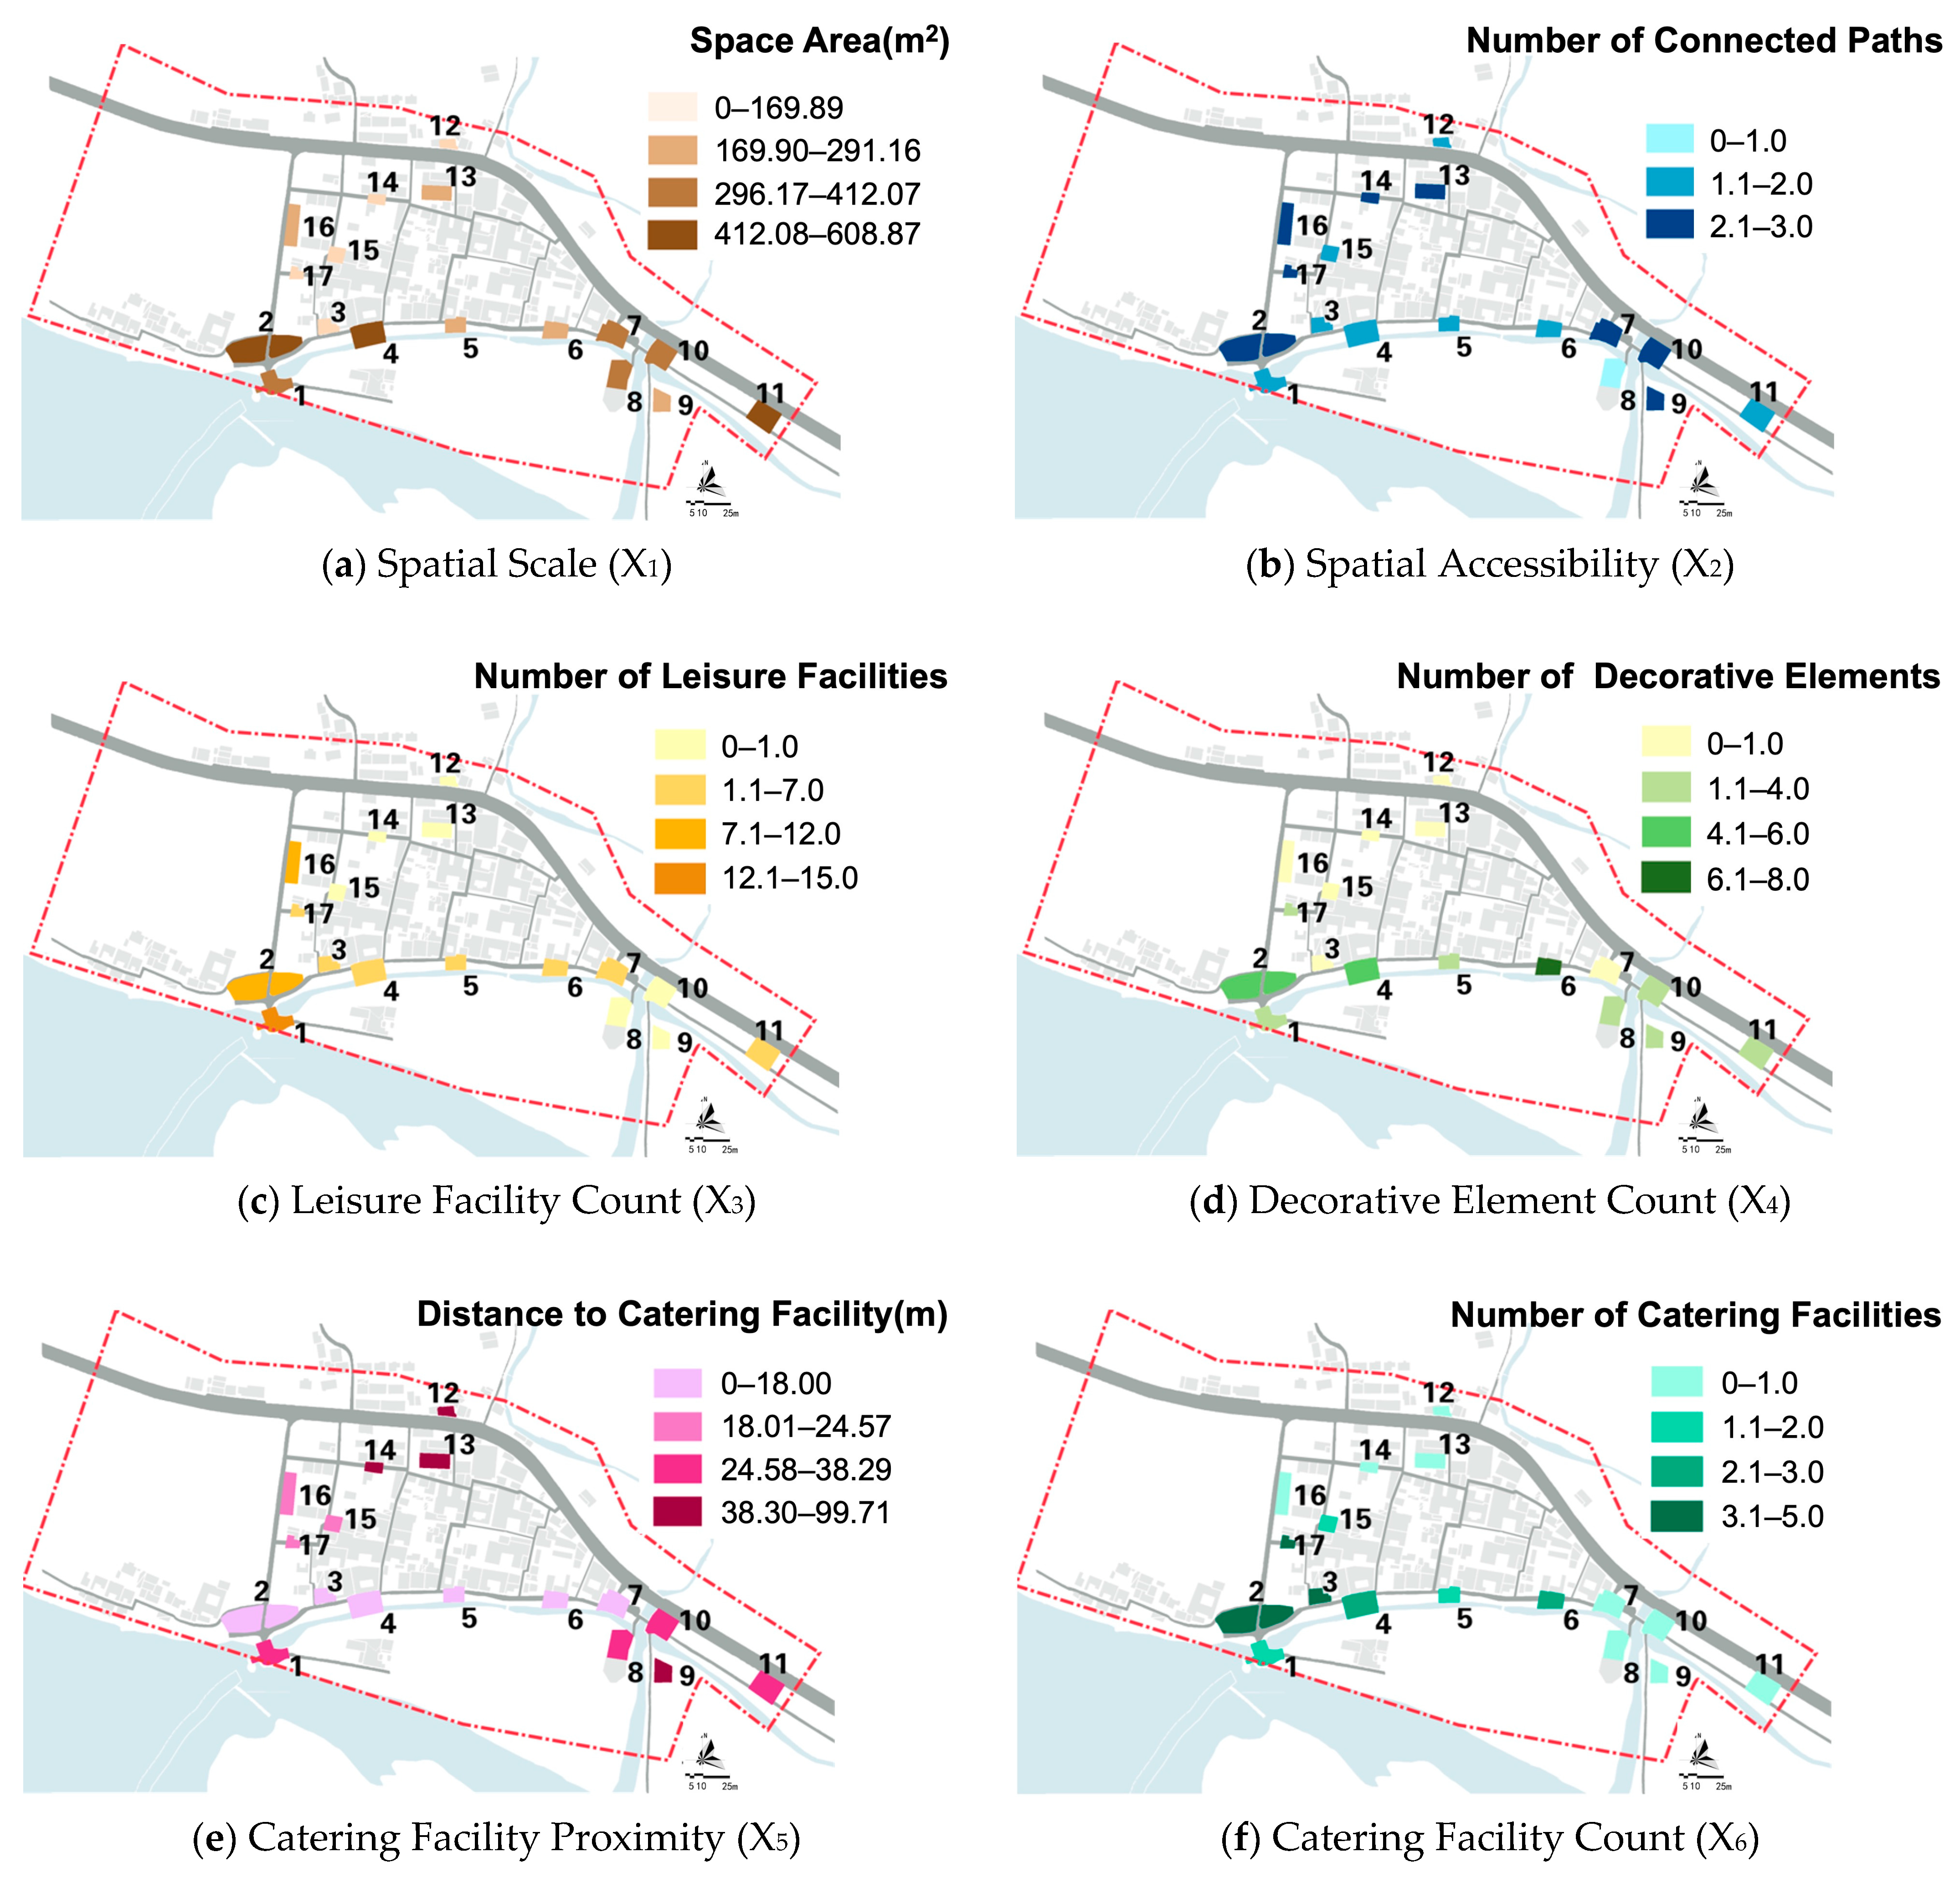
The external dimension comprises two categories: tourism service facilities and historical and natural elements. Tourism service facilities include fixed amenities, such as catering and retail facilities, as well as street vendors. The distance to and number of these facilities can influence visitors’ consumption behavior, affecting spatial vitality in varied degrees [68,74,75,76,77]. Accordingly, 6 variables were selected: Catering Facility Proximity (X5) and Catering Facility Count (X6); Retail Facility Proximity (X7) and Retail Facility Count (X8); Street Vendor Proximity (X9) and Street Vendor Count (X10). Historical and natural elements form the distinctive charm of traditional villages. The presence of these elements within visual range and their abundance often influences visitors’ decisions to enter and explore the space [56,69,75,78]. Because quantifying the number of natural elements poses challenges, only the distance to these features was selected as a quantitative measure. Consequently, 3 indicators were selected: Historical Element Proximity (X11), Historical Element Count (X12), and Natural Elements Proximity (X13). The spatial characteristics of the 13 predictors across public spaces are presented in Appendix A, Figure A1.

3.6. Methods for Analyzing Impact Factors

3.6.1. Model Selection

We chose a stepwise regression model to analyze the impact of built environment factors on the vitality of public spaces across different time periods. Stepwise regression is an iterative multiple linear regression approach that identifies the most significant predictors from a group of candidate independent variables, resulting in a simple and robust model. Given the small sample size and continuous nature of the dependent variable in our study, this approach reduces overfitting by automatically selecting key predictors, minimizing multicollinearity and instability associated with excessive variables in small-sample contexts. This method allows small-sample studies to explore relationships between variables more reliably while preserving model interpretability.

3.6.2. Methods for Regression Modeling and Influence Strength Comparison

To account for differences in measurement scales, all independent variables were first normalized using min–max scaling. Next, Spearman’s rank correlation analysis was performed to identify variables significantly associated (p < 0.05) with vitality values in at least one time period, generating the candidate predictor set. Multiple linear regression models were constructed in SPSS 26.0, with the vitality values in four typical time periods serving as dependent variables. Predictor selection employed backward elimination, removing variables with p > 0.05. The optimal model was selected based on three criteria: (1) maximization of the coefficient of determination (adj R2) for model fit; (2) a significant overall F-test (p < 0.05); and (3) theoretical interpretability of included predictors. Finally, the impact strength of each predictor its variation across time periods were evaluated by comparing its standardized coefficients in the optimal models for each period.

4. Results

4.1. Spatio-Temporal Dynamics of Public Space Vitality

4.1.1. Spatial Dynamics of Public Space Vitality

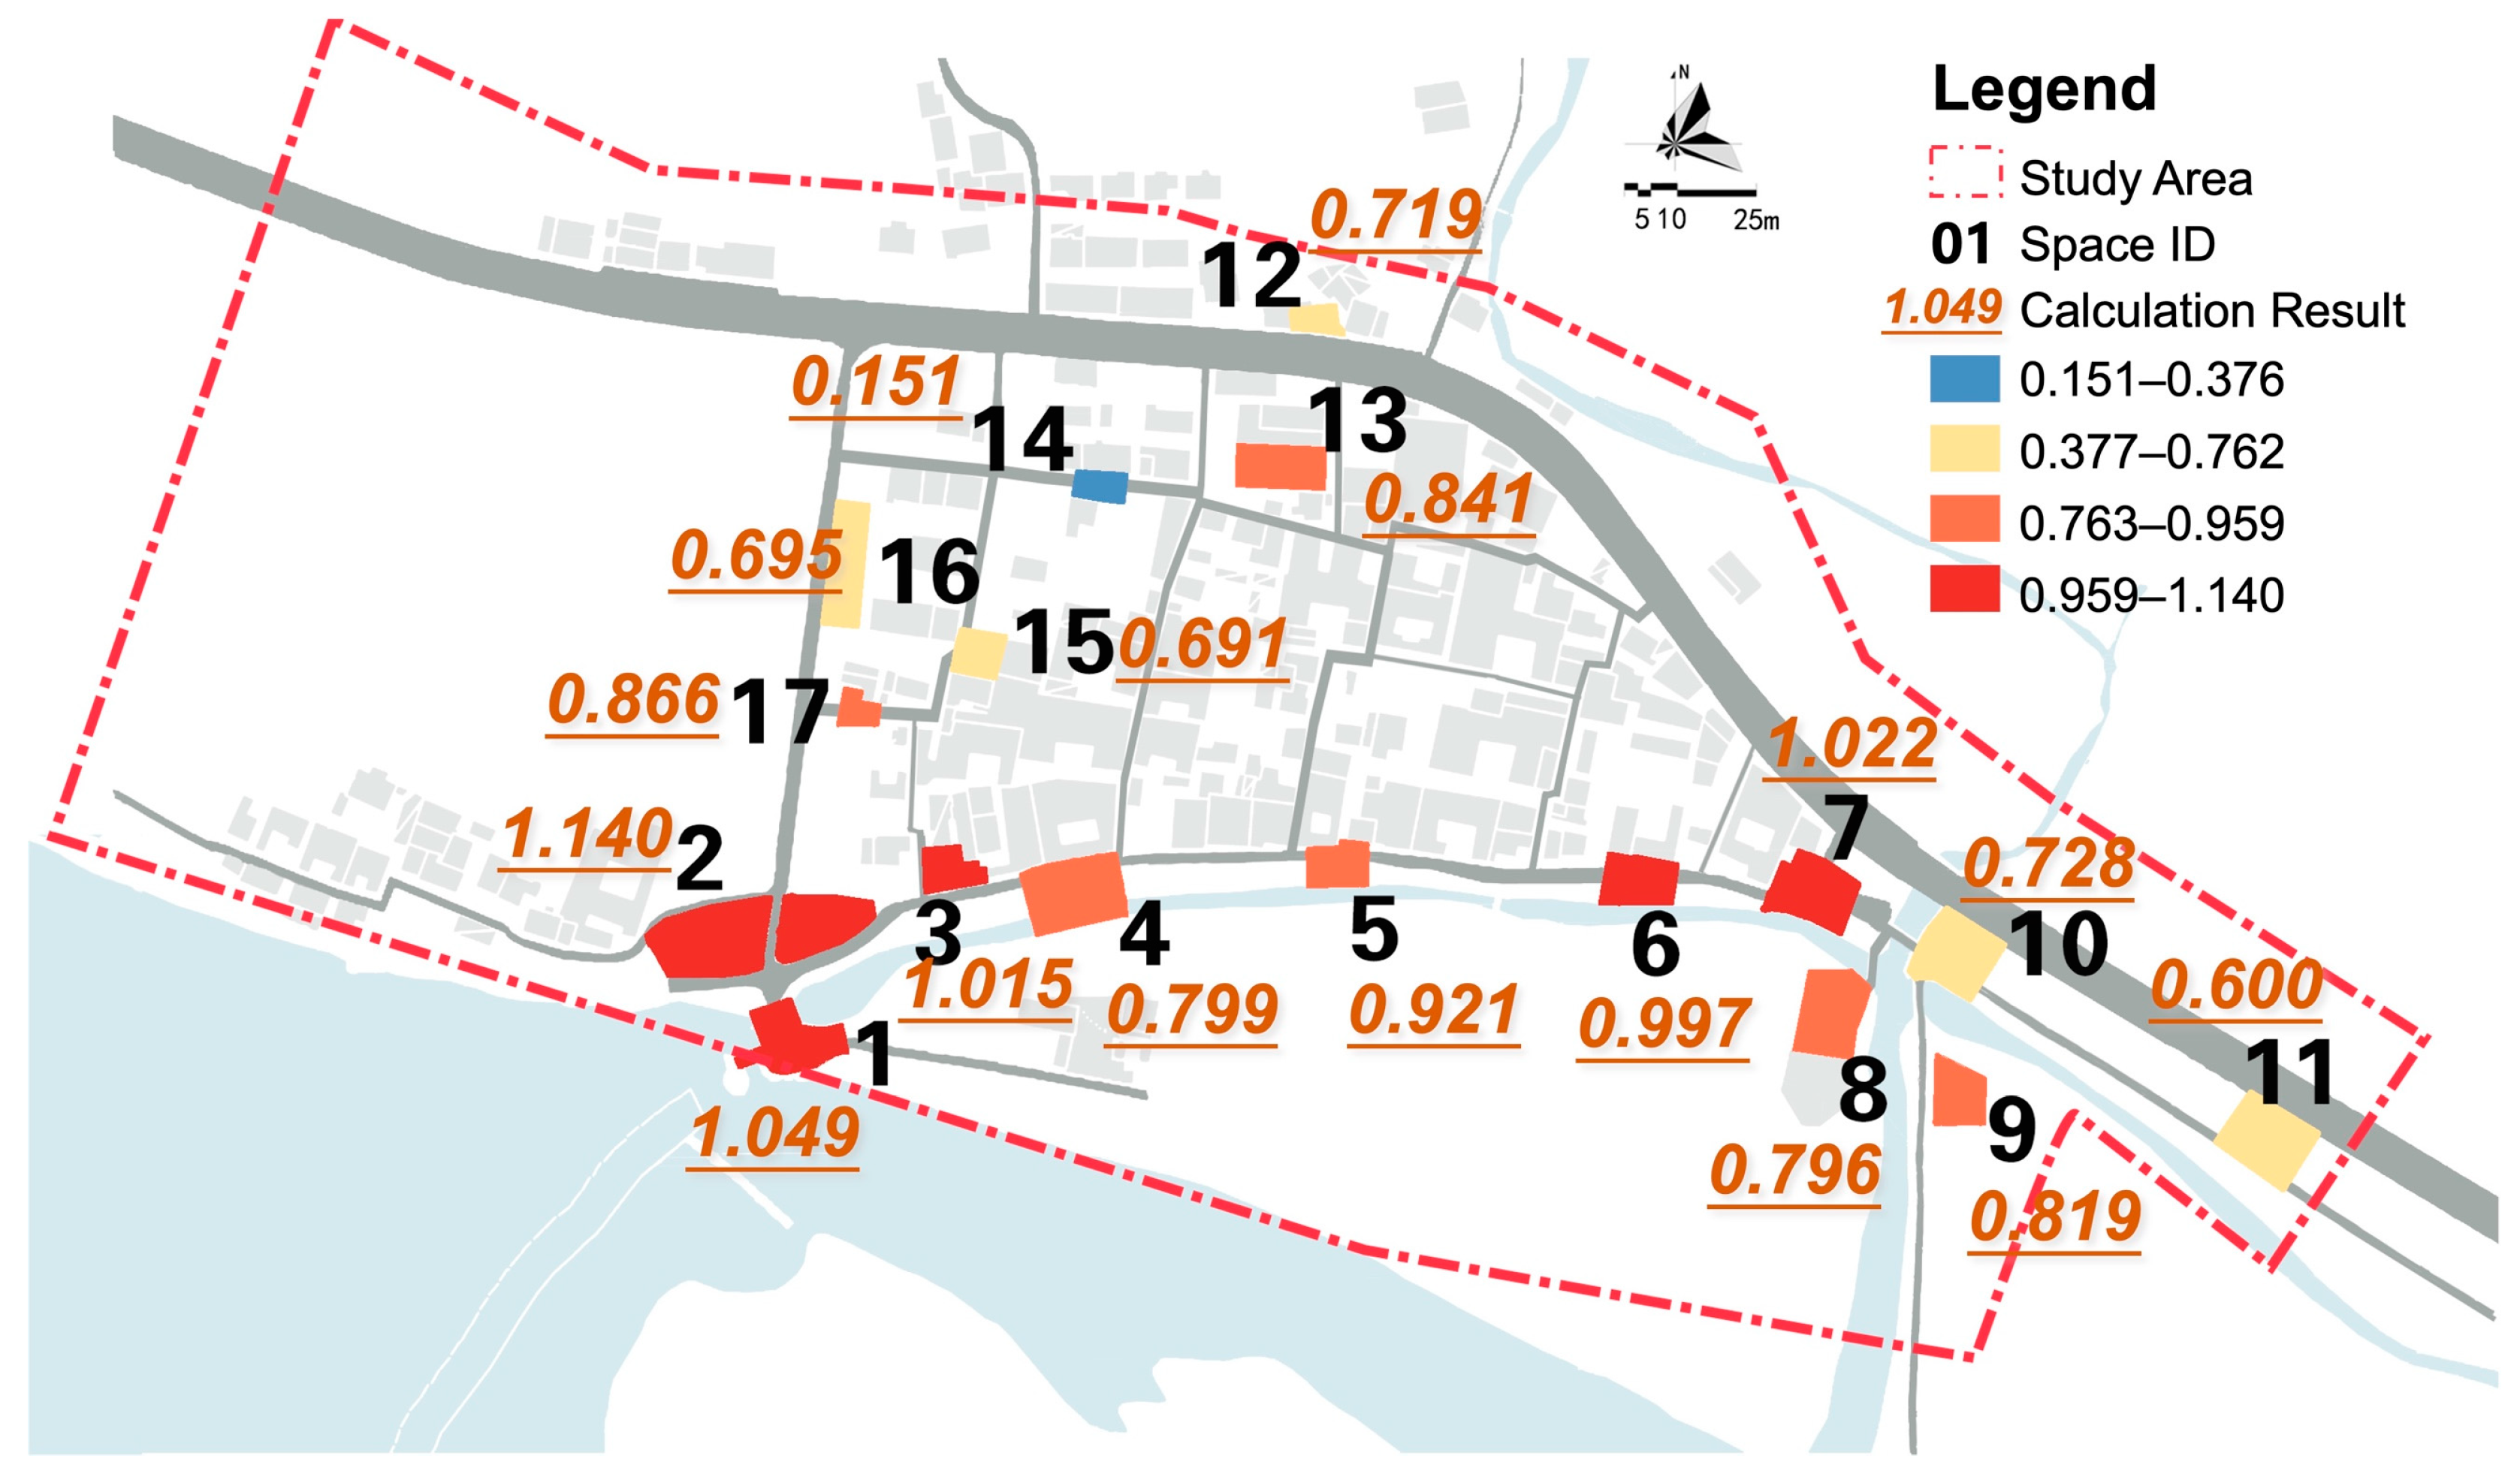
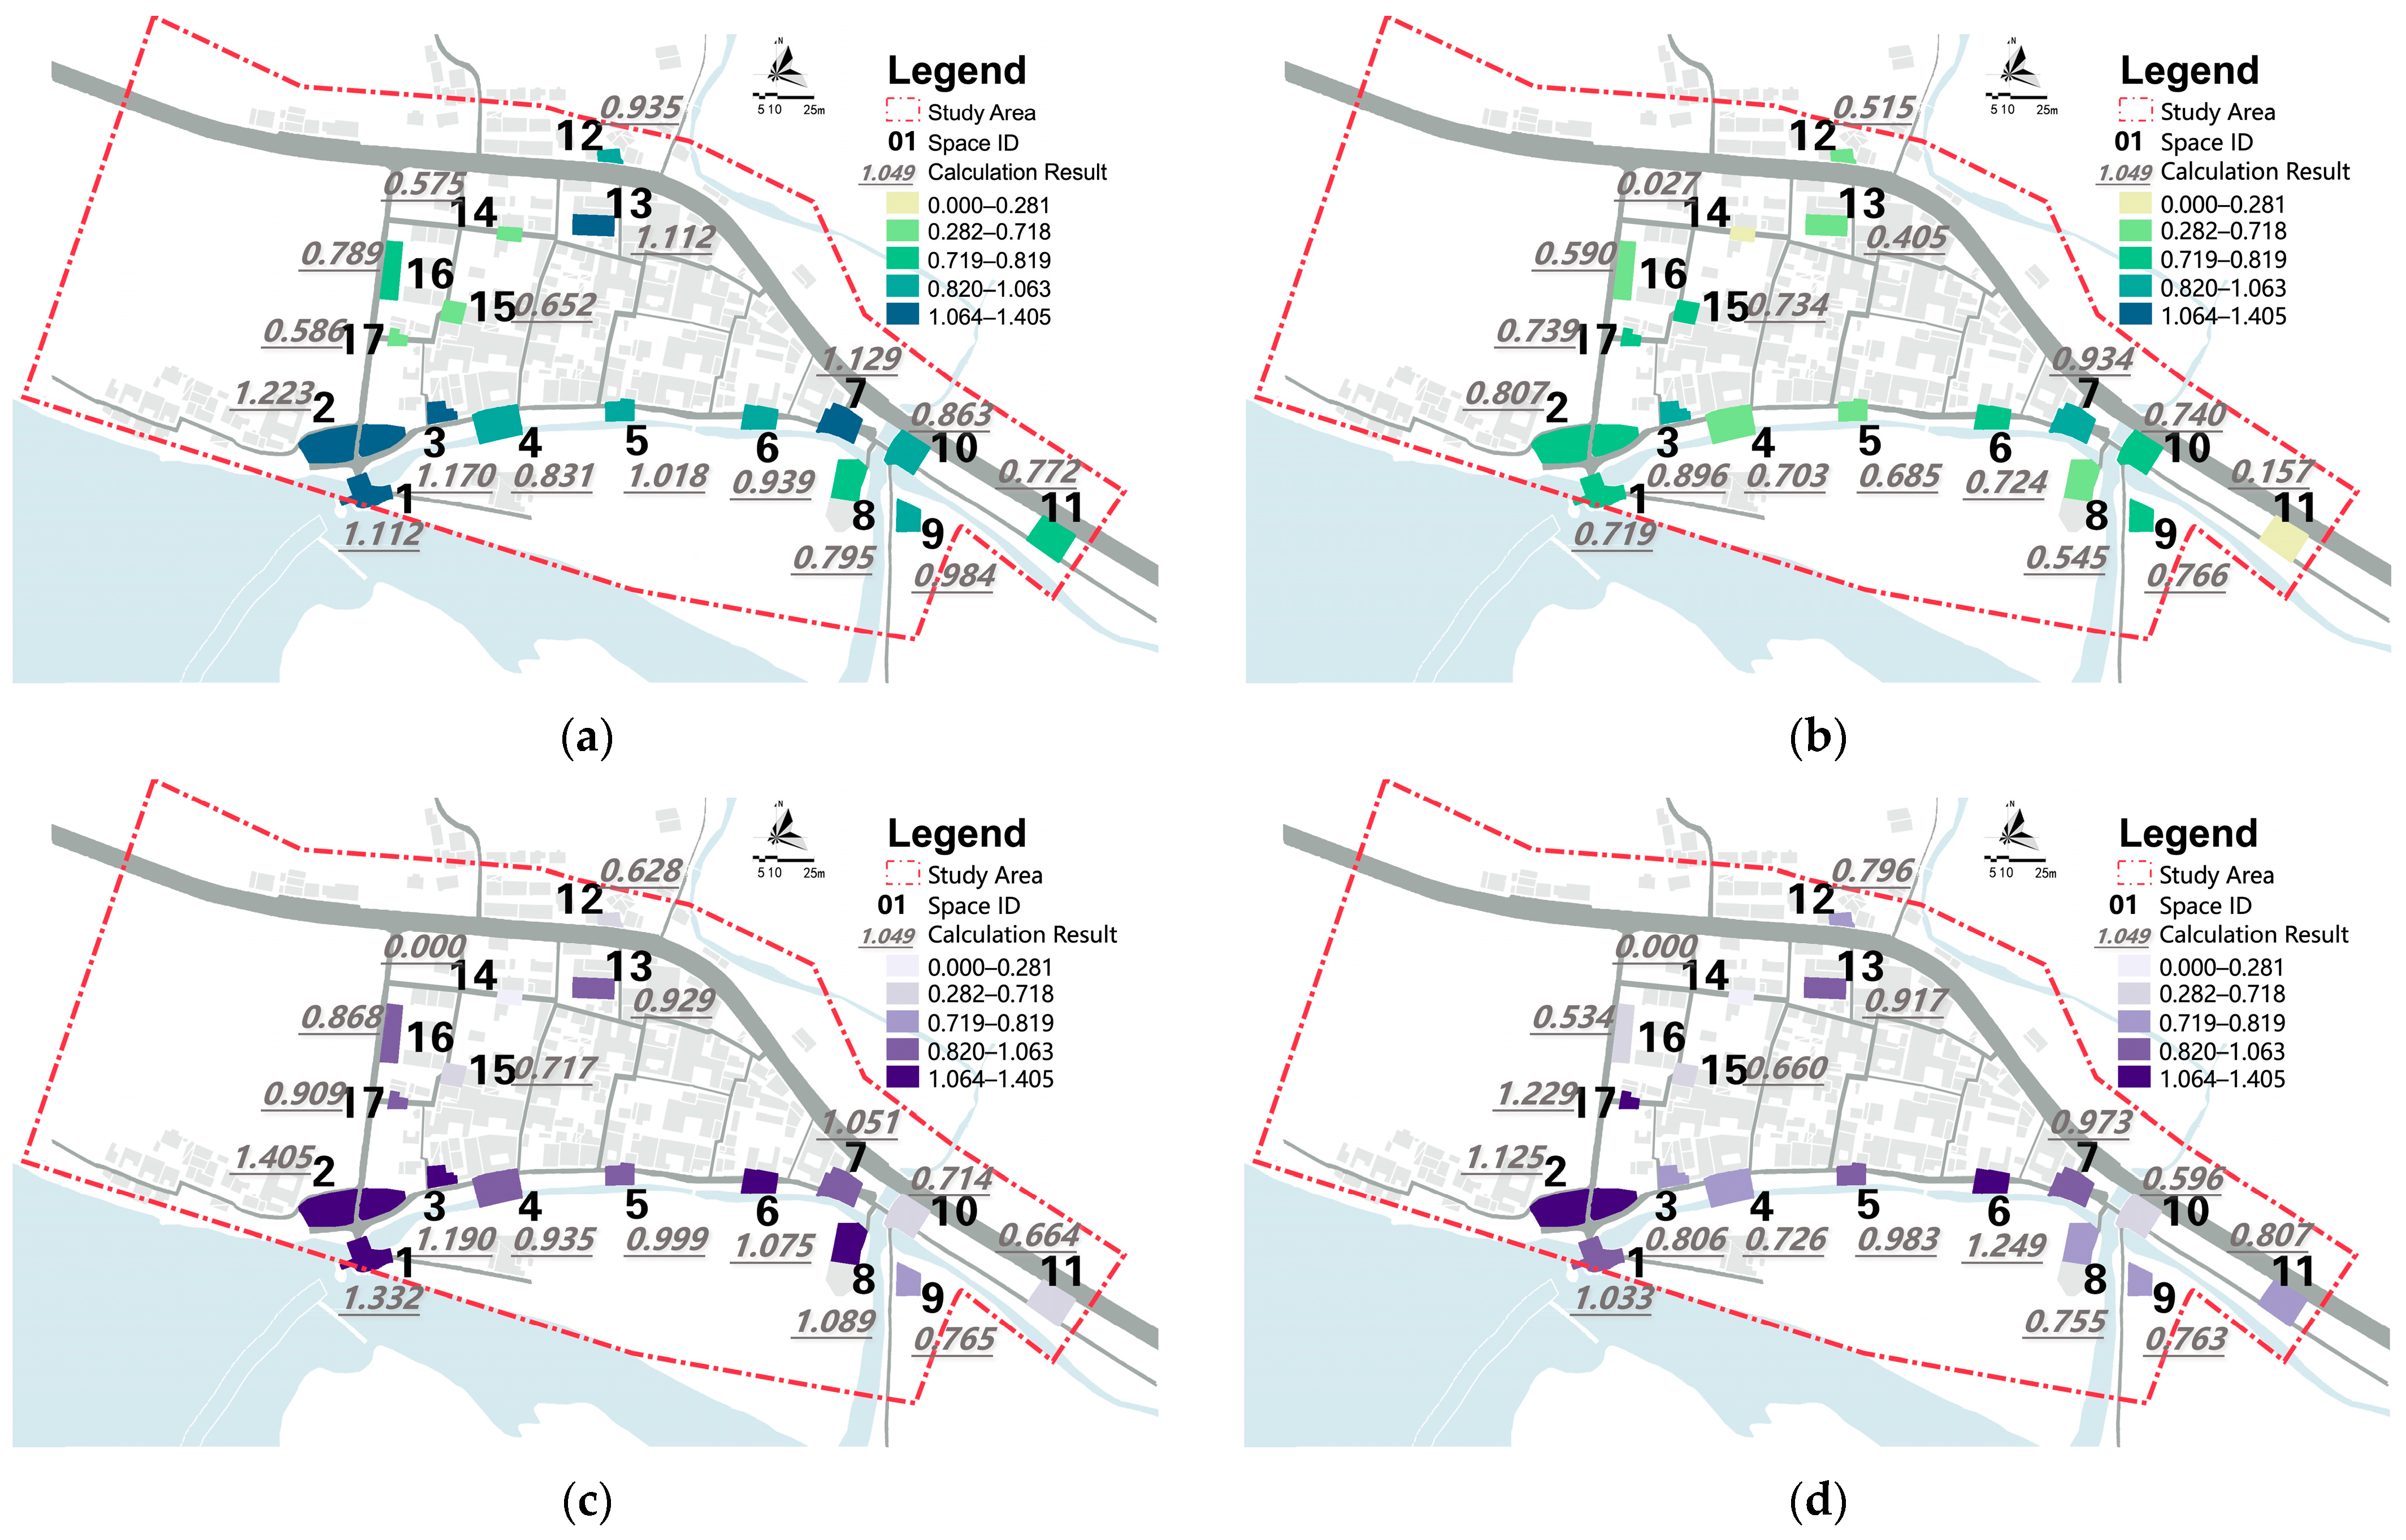
Based on the calculated average hourly vitality values (Figure 4), which represent the overall vitality level of each public space, the southern riverside area (spaces 1–9) exhibited relatively high vitality, corresponding to the main tourist route. Spaces 1 and 2, located close to the Tongji Weir heritage site, serve as primary tourist destinations and thus recorded the highest vitality values in the village. Spaces 6 and 7, located near the main entrance and another heritage site, Wenchang Pavilion, also showed significantly elevated vitality compared to other spaces. Although spaces 13 and 17 lie off the main tourist route within the village, they still exhibited higher vitality than other internal spaces. Space 13’s elevated vitality was due to its role as the courtyard of the community-based elderly care service center—a focal venue for daily village activities, while space 17’s closeness to catering facilities enhanced its vitality through increased visitor consumption activities.

4.1.2. Temporal Dynamics of Public Space Vitality

Based on calculated vitality values for four typical time periods (Figure 5), weekend vitality exceeded weekday vitality by an average of 30%. The vitality during the weekday midday off-peak was the lowest among all segments. Comparing the spatial distribution characteristics of vitality across four time periods (Figure 6), Spaces 1–8 along the primary tourist route showed peak vitality during the weekend morning peak. Near the Tongji Weir heritage site, Spaces 1 and 2 exhibited vitality values during the weekend morning peak that were nearly double those of the lowest weekday midday off-peak. Field surveys indicated that visitor composition differed markedly between weekdays and weekends. Group tourists predominated on weekdays, while individual tourists predominated on weekends. Group tourists typically visited only during the morning peak and rarely dined in the village afterward, while individual tourists often dined there following sightseeing. Increased vitality in Spaces 6 and 17 during midday off-peaks, adjacent to large catering facilities, supported these findings. Weekend midday off-peak had the highest overall vitality, with increases of 15–35% compared to those during weekend morning peak. Space 14 consistently recorded the lowest vitality, except during the weekday morning peak, when the vitality value was relatively higher. This pattern was likely attributable to villagers’ commuting patterns rather than tourist activities.

4.2. Correlation Analysis of Impact Factors

The results of the correlation analysis (Table 3) indicated that 11 of the 13 selected indicators, excluding Spatial Scale (X1) and Natural Element Proximity (X13), were significantly correlated with the vitality of at least one time period. Specifically, weekday morning peak vitality (V1) exhibited significant positive correlations with Retail Facility Count (X8), Street Vendor Count (X10), and Historical Element Count (X12), and a significant negative correlation was found with Retail Facility Proximity (X7) and Street Vendor Proximity (X9). Weekday midday off-peak vitality (V2) exhibited significant positive correlations with Spatial Accessibility (X2), Decorative Element Count (X4), Catering Facility Count (X6), and Historical Element Count (X12), and significant negative correlations with Catering Facility Proximity (X5) and Street Vendor Proximity (X9). Weekend morning peak vitality (V3) exhibited significant positive correlations with Leisure Facility Count (X3), Decorative Element Count (X4), Catering Facility Count (X6), Street Vendor Count (X10), and Historical Element Count (X12), and significant negative correlations with Catering Facility Proximity (X5), Retail Facility Proximity (X7), Street Vendor Proximity (X9), and Historical Element Proximity (X11). Weekend midday off-peak vitality (V4) exhibited significant positive correlations with Leisure Facility Count (X3), Decorative Element Count (X4), and Catering Facility Count (X6), along with a significant negative correlation with Retail Facility Proximity (X7).

4.3. Regression Analysis of Impact Factors

This study examined the influence of built environment factors on the vitality of public spaces in traditional villages across different time periods. 11 relevant predictors were included in the regression models using a stepwise backward elimination method. Four separate models were developed corresponding to four typical time periods: weekday morning peak (V1), weekday midday off-peak (V2), weekend morning peak (V3), and weekend midday off-peak (V4).

4.3.1. Regression Model for Weekday Morning Peak

The results of the weekday morning peak model (Table 4) indicated that Historical Element Proximity (X11) was the only variable that met the significance threshold (p < 0.05). Although its explanatory power was relatively low (adj R2 = 0.248), the model remained statistically significant overall (F = 6.290, p = 0.024). Historical Element Proximity (X11) demonstrated a significant negative effect on vitality, indicating that the vitality of public spaces during this time period increased notably with closer proximity to historical elements. This finding indicated that weekday tourist activities were primarily concentrated in areas adjacent to historical resources, reflecting a spatial preference pattern oriented toward cultural heritage.

4.3.2. Regression Model for Weekday Midday Off-Peak

The weekday midday off-peak regression model (Table 5) demonstrated a strong overall fit (adj R2 = 0.734) and achieved statistical significance (F = 15.714, p < 0.001). Three predictor variables were included in the final model. Significant positive effects were observed for Spatial Accessibility (X2) and Decorative Element Count (X4), underscoring the importance of accessibility and environmental aesthetics in concentrating visitors during mealtimes. Conversely, a significant negative effect was identified for Historical Element Proximity (X11), indicating enhanced vitality in spaces adjacent to historical and cultural landmarks. This finding suggests that the historical and cultural atmosphere enhanced spatial vitality, thereby increasing people visiting during this time period.

4.3.3. Regression Model for Weekend Morning Peak

Table 6 presents the regression model results for factors influencing vitality during the weekend morning peak. A strong explanatory power was demonstrated (adj R2 = 0.958), with statistical significance confirmed (F = 41.824, p < 0.001). A total of seven variables were included in the regression model. Specifically, Spatial Accessibility (X2), Leisure Facility Count (X3), Decorative Element Count (X4), Street Vendor Proximity (X9), and Street Vendor Count (X10) exerted significant positive effects on vitality during this time period. In contrast, Retail Facility Count (X8) and Historical Element Proximity (X11) exerted significant negative effects. Notably counterintuitive results were observed for Retail Facility Count (X8) and Street Vendor Proximity (X9), where higher values were associated with lower vitality—contrary to conventional expectations. Based on field survey, this result can be attributed to weekend visitors, who primarily comprised individual tourists engaged in cultural tourism, whose activities were predominantly concentrated around historical landmarks. Consequently, demand for commercial activities such as shopping during this time period remained relatively low.

4.3.4. Regression Model for Weekend Midday Off-Peak

Table 7 shows the regression model for factors influencing vitality during weekend midday off-peak. The model fitting results revealed an adj R2 value of 0.676, indicating a strong model fit. The F-statistic was 5.180 with a corresponding p-value of 0.016 (<0.05), confirming the model’s overall statistical significance. The model identified six significant influencing factors. Spatial Accessibility (X2), Catering Facility Count (X6), Retail Facility Proximity (X7), and Retail Facility Count (X8) exerted significant positive effects on activity levels. Among these, Catering Facility Count (X6) exerted the strongest positive effect, indicating that visitors prioritized dining consumption during this time period. In contrast, Street Vendor Count (X10) and Historical Element Proximity (X11) showed significant negative effects. Notably, an increase in Street Vendor Count (X10) was associated with reduced vitality. This outcome may be related to the nature of goods provided by the street vendors in Yantou Village, which mainly offer non-food items such as traditional handicrafts that do not meet visitors’ immediate consumption needs during midday off-peak. As a result, visitors rarely engaged in activities within public spaces located near the street vendors during this time period.

4.4. Time-Varying Influence Strength of Key Factors

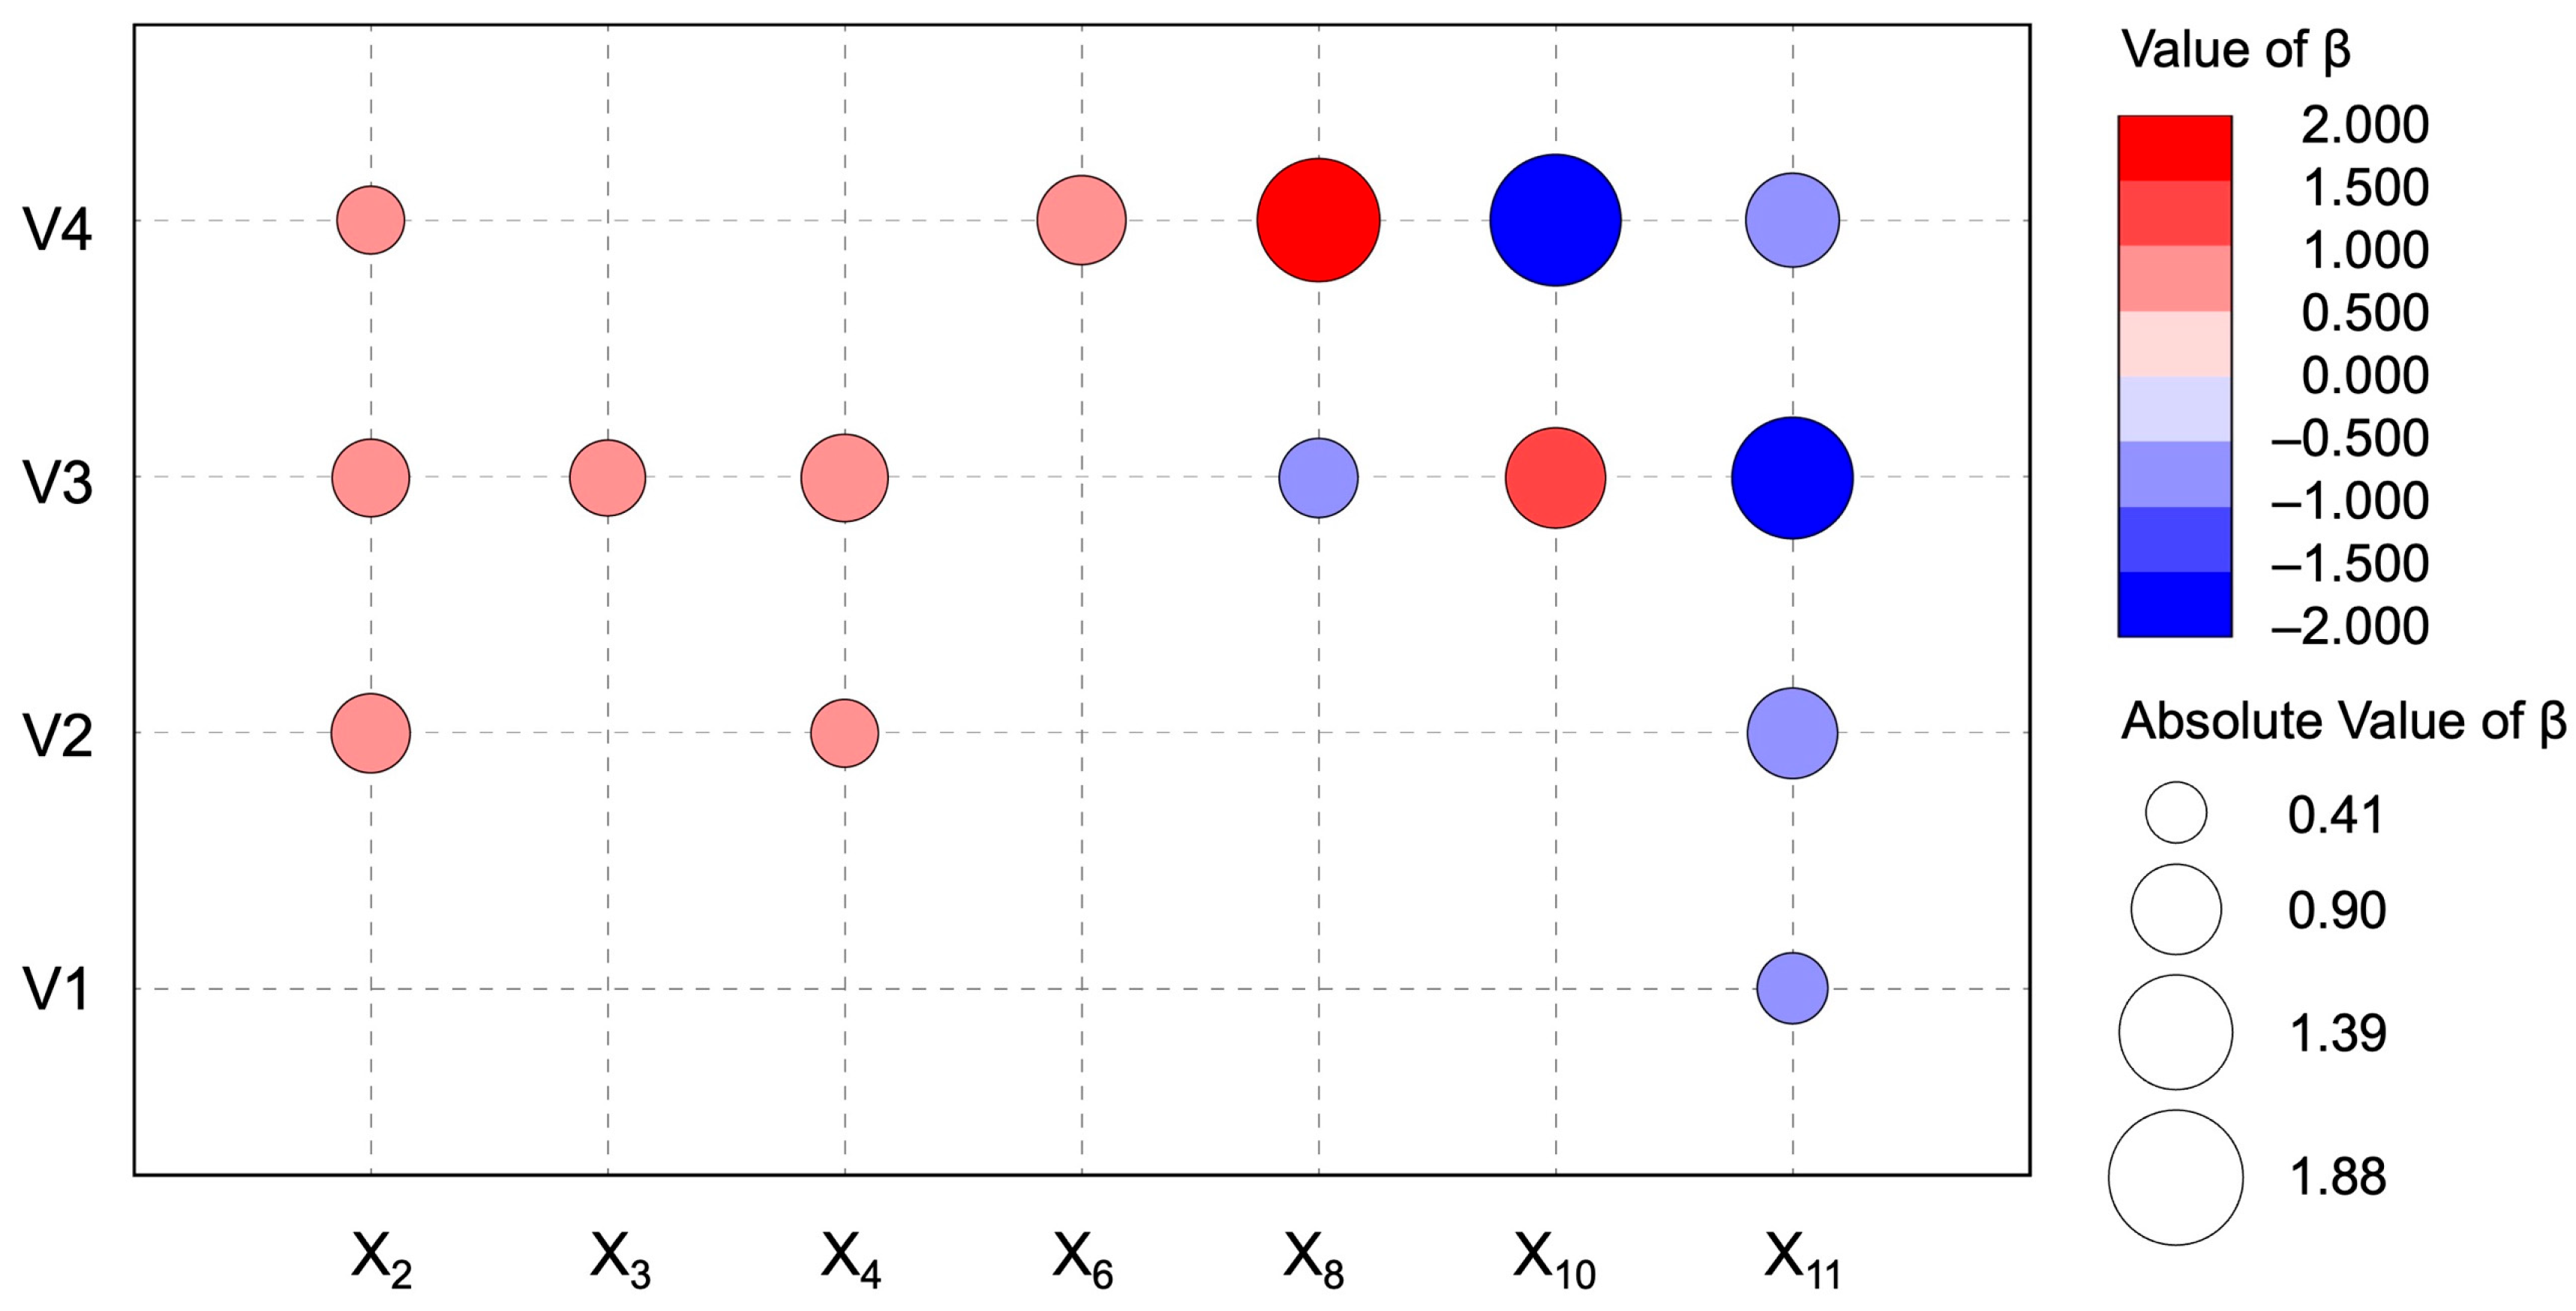
Through regression analysis, we recognized 7 key factors that significantly affect the vitality of public spaces in distinct periods. These included Spatial Accessibility (X2), Leisure Facility Count (X3), and Decorative Element Count (X4) in the internal dimension, along with Catering Facility Count (X6), Retail Facility Count (X8), Street Vendor Count (X10), and Historical Element Proximity (X11) in the external dimension. By comparing the standardized regression coefficients, we were able to clarify differences in the factors and their influence strength on vitality across periods (Figure 7).

4.4.1. Internal Dimension

Spatial Accessibility (X2) showed significant positive effects on vitality in all periods except the weekday morning peak, with comparable influence strength where significant. This result likely arises from variations in visitor composition between weekdays and weekends. Field surveys revealed that weekday visitors were mainly group tourists with fixed itineraries that limited movement, reducing the influence of accessibility. In contrast, weekend visitors included more individual tourists who preferred easily accessible locations, strengthening accessibility’s effect on vitality.
Leisure Facility Count (X3) and Decorative Element Count (X4) had significant positive influences on vitality during weekend morning peak (β = 0.632 and β = 0.817, respectively). Additionally, X4 also significantly affected weekday midday off-peak vitality (β = 0.501). These differential effects may be due to the distinct temporal visitor behavior patterns. Weekday group tourists followed scheduled itineraries focused on core heritage sites, showing minimal engagement with internal amenities. Only a small number of tourists dining in the village may take a brief break at culturally decorated spaces near restaurants for photography after meals. Conversely, weekend individual tourists exhibited greater flexibility, utilizing leisure facilities for extended rest and socialization after sightseeing. However, the village’s remoteness prompted most visitors to depart after lunch, resulting in shortened visitation durations. Field observations confirmed a marked decline in public space utilization during post-lunch periods. Existing leisure facilities and decorative elements within most of the public spaces in the village provided insufficient retention value due to a lack of distinctiveness and quality.

4.4.2. External Dimension

External tourism service facilities, including catering, retail facilities, and street vendors, significantly influenced public space vitality during weekends. Specifically, Catering Facility Count (X6) demonstrated a strong positive effect on vitality during the weekend midday off-peak (β = 0.845) while showing no significant impact during other periods. This may be attributed to the higher proportion of individual tourists on weekends, who typically followed more flexible itineraries and were more likely to dine within the village. During weekend midday off-peak, visitors seeking meals congregated in areas with high catering facility density, enhancing the vitality of surrounding public spaces. In contrast, weekday tourists often participated in tightly scheduled group tours, limiting their opportunities to dine locally and diminishing catering facilities’ influence on weekday vitality.
Retail Facility Count (X8) and Street Vendor Count (X10) exhibited opposing effects on public space vitality across weekend periods. Retail Facility Count (X8) demonstrated a significant negative effect during the weekend morning peak (β = −0.678) but a significant positive effect during the weekend midday off-peak (β = 1.651). Conversely, Street Vendor Count (X10) showed a significant positive impact during weekend morning peak (β = 1.098) yet a significant negative effect during weekend midday off-peak (β = −1.883). These contrasting patterns may be attributable to the differences in goods offered and corresponding tourist behaviors. In Yantou Village, retail facilities operated as hybrid establishments selling both general merchandise and local snacks. During lunch time, visitors frequently purchased snacks from these venues instead of dining at formal restaurants, enhancing the vitality of surrounding public spaces. During morning peaks, however, tourists focused on cultural sites, reducing retail facility visitation. Street vendors in this village were usually located along main tourist routes and mainly offered non-food goods such as traditional handicrafts. While tourists frequented these vendors during morning peak hours, the misalignment between vendor offers and tourist needs during dinner hours lowered public space vitality near these venues.
Historical Element Proximity (X11) consistently demonstrated significant negative effects on vitality across all four time periods, with influence strength exceeding other predictors except during the weekend midday off-peak. This established proximity to historical elements as a key vitality determinant in Yantou Village. The strongest effect occurred during the weekend morning peak (β = −1.619), followed by comparable effects during weekday midday off-peak (β = −0.904) and weekend midday off-peak (β = −0.963). Although weaker during weekday morning peak (β = −0.544), X11 remained the sole significant predictor for that time period. These findings indicated that tourists consistently prefer public spaces near historical landmarks regardless of time periods, including for dining activities. This behavioral pattern aligns with tourists’ primary motivation for visiting Yantou Village, a nationally designated traditional village and a vital component of the Guyan Huaxiang Scenic Spot. The village is well-known for its rich historical and cultural heritage, which serves as the main attraction for tourist activity.

5. Discussion

5.1. Key Findings and Management Implications

This study reveals the spatio-temporal variations in the factors influencing public space vitality in traditional villages. First, in Yantou Village, Historical Element Proximity exhibited a consistently significant negative effect on vitality across all time periods on both weekdays and weekends, indicating that public spaces located closer to historical elements demonstrated higher levels of vitality. This result is consistent with the theoretical understanding that cultural heritage functions as the core driving force attracting visitors to traditional villages [79]. Furthermore, the dominant influence of historical elements among all factors reflects the strong sociocultural significance of Yantou Village as a renowned cultural heritage site.
Second, Leisure Facility Count and Decorative Element Count also exerted a significant positive influence on the vitality of public spaces at the case site during weekend mornings. Decorative elements attracted visitors to linger and take photos by enhancing the aesthetic attractiveness of public spaces and providing interactive experiences with local culture. Leisure facilities encouraged visitors to pause and rest by offering opportunities for relaxation and social interaction. During weekend mornings, when the site received a large number of individual tourists and their sightseeing time was relatively sufficient, these two factors demonstrated a strong positive impact. However, on weekdays, when the site was mainly visited by tour groups, such facilities did not generate a positive effect. The field survey revealed that the limited number of leisure facilities and the relatively small scale of decorative elements made it difficult to accommodate the high demand for resting and group photography associated with tour groups. Therefore, the village needs to increase both the quantity of leisure facilities and the scale of decorative elements in order to enhance its vitality on weekdays.
Third, Catering Facility Count had a significant positive influence on the spatial vitality of the case site during weekend midday periods. Catering facilities provided visitors with opportunities for rest and dining, which helped to extend their stay length and thus exert a significant positive effect on the surrounding public spaces [21]. However, empirical evidence from Yantou Village indicated that this factor only had a positive effect on spatial vitality during weekend midday off-peak, while it did not show a significant impact during weekday midday off-peak. This was primarily because weekday tourists were mainly tour groups, whereas weekend visitors included a large number of individual tourists. The small scale and limited number of catering facilities in the village were sufficient for individual tourists but unable to accommodate the large groups associated with tour groups. Consequently, the effect on weekday vitality was not significant. These findings also suggest that the village could benefit from providing more large-scale catering facilities to meet the dining needs of tour groups on weekdays, thereby enhancing both visitor presence and economic vitality during these periods.
Fourth, the Retail Facility Count had a positive influence on the spatial vitality of the case site during weekend midday but showed a significant negative effect during weekend morning. The retail of local specialty products constitutes an important part of tourists’ cultural experience [80]. In Yantou Village, retail facilities mainly sold local snacks and daily necessities. Interviews revealed that most tourists were interested in the local snacks but showed little preference for the daily necessities, which were often perceived as simple and lacking cultural characteristics. Consequently, during lunch time, visitors tended to stay and purchase local snacks, resulting in a positive effect of retail facilities on spatial vitality. In contrast, during morning visiting periods, the sale of daily necessities failed to attract tourists, who preferred to spend time at historical and natural scenic spots farther from the retail shops, resulting in a negative effect. This temporal difference in impact also highlights the need for the village to diversify, specialize, and modernize its tourism retail products and business types in order to meet new visitor consumption preferences and thereby enhance both economic and cultural-tourism vitality.
These findings offer multiple implications for the planning and management of public spaces in traditional villages. First, the proximity to historical elements serves as a key driver of public space vitality. Planning should prioritize enhancing the accessibility of pedestrian networks connected to natural and cultural heritage, and strengthen the link between public spaces and historical elements through pathway guidance and the integration of cultural features. This approach can facilitate visitors’ movement across multiple spaces and enhance the attractiveness and interest of the village environment. Second, the quantity and scale of leisure facilities and decorative elements should be aligned with visitor numbers to meet the differing needs of tour groups and individual visitors for rest and photography. Third, tourism facilities should be designed in accordance with the spatiotemporal behavior of visitors, optimizing their scale, type, and layout. For example, catering facilities should be located near historical elements to create a synergistic effect between dining and sightseeing, with the scale of facilities matched to visitor demand. Retail facilities should offer diversified, locally distinctive, and contemporary products to better meet modern tourist consumption preferences and thereby enhance their positive impact on public space vitality. Overall, the governance of public spaces in traditional villages should integrate multiple dimensions, including historical and cultural resources, transportation organization, facility scale, and business types, to achieve sustainable use and high-quality development.

5.2. Design-Oriented Application of Research Findings

The study highlighted the spatio-temporal variations in public space vitality and their impact factors in Yantou Village. These variations provided guidance for the design of public spaces that are more attractive, functional, and adaptable. Building on this understanding, two main strategies are proposed to enhance public space vitality: mixed-use design and temporally adaptive functional layouts.
Mixed-use design. Tourism activities inherently involve consumption behaviors. Impact factor analysis revealed differential impacts of tourism service facilities and their functional combinations on public space vitality across periods. By strategically integrating indoor and outdoor functions, it is possible to sustain and enhance vitality across different time periods of the day. For example, considering the contrasting influence mechanisms of Retail Facility Count (X8) and Street Vendor Count (X10), indoor and outdoor spaces can be functionally coordinated through the integration of specialty snack and handicraft operations. Establishing modular outdoor dining areas with temporary seating and rest facilities diversifies visitor staying behaviors and light dining activities, extending stay length and achieving coordinated vitality enhancement across morning peak and midday off-peak.
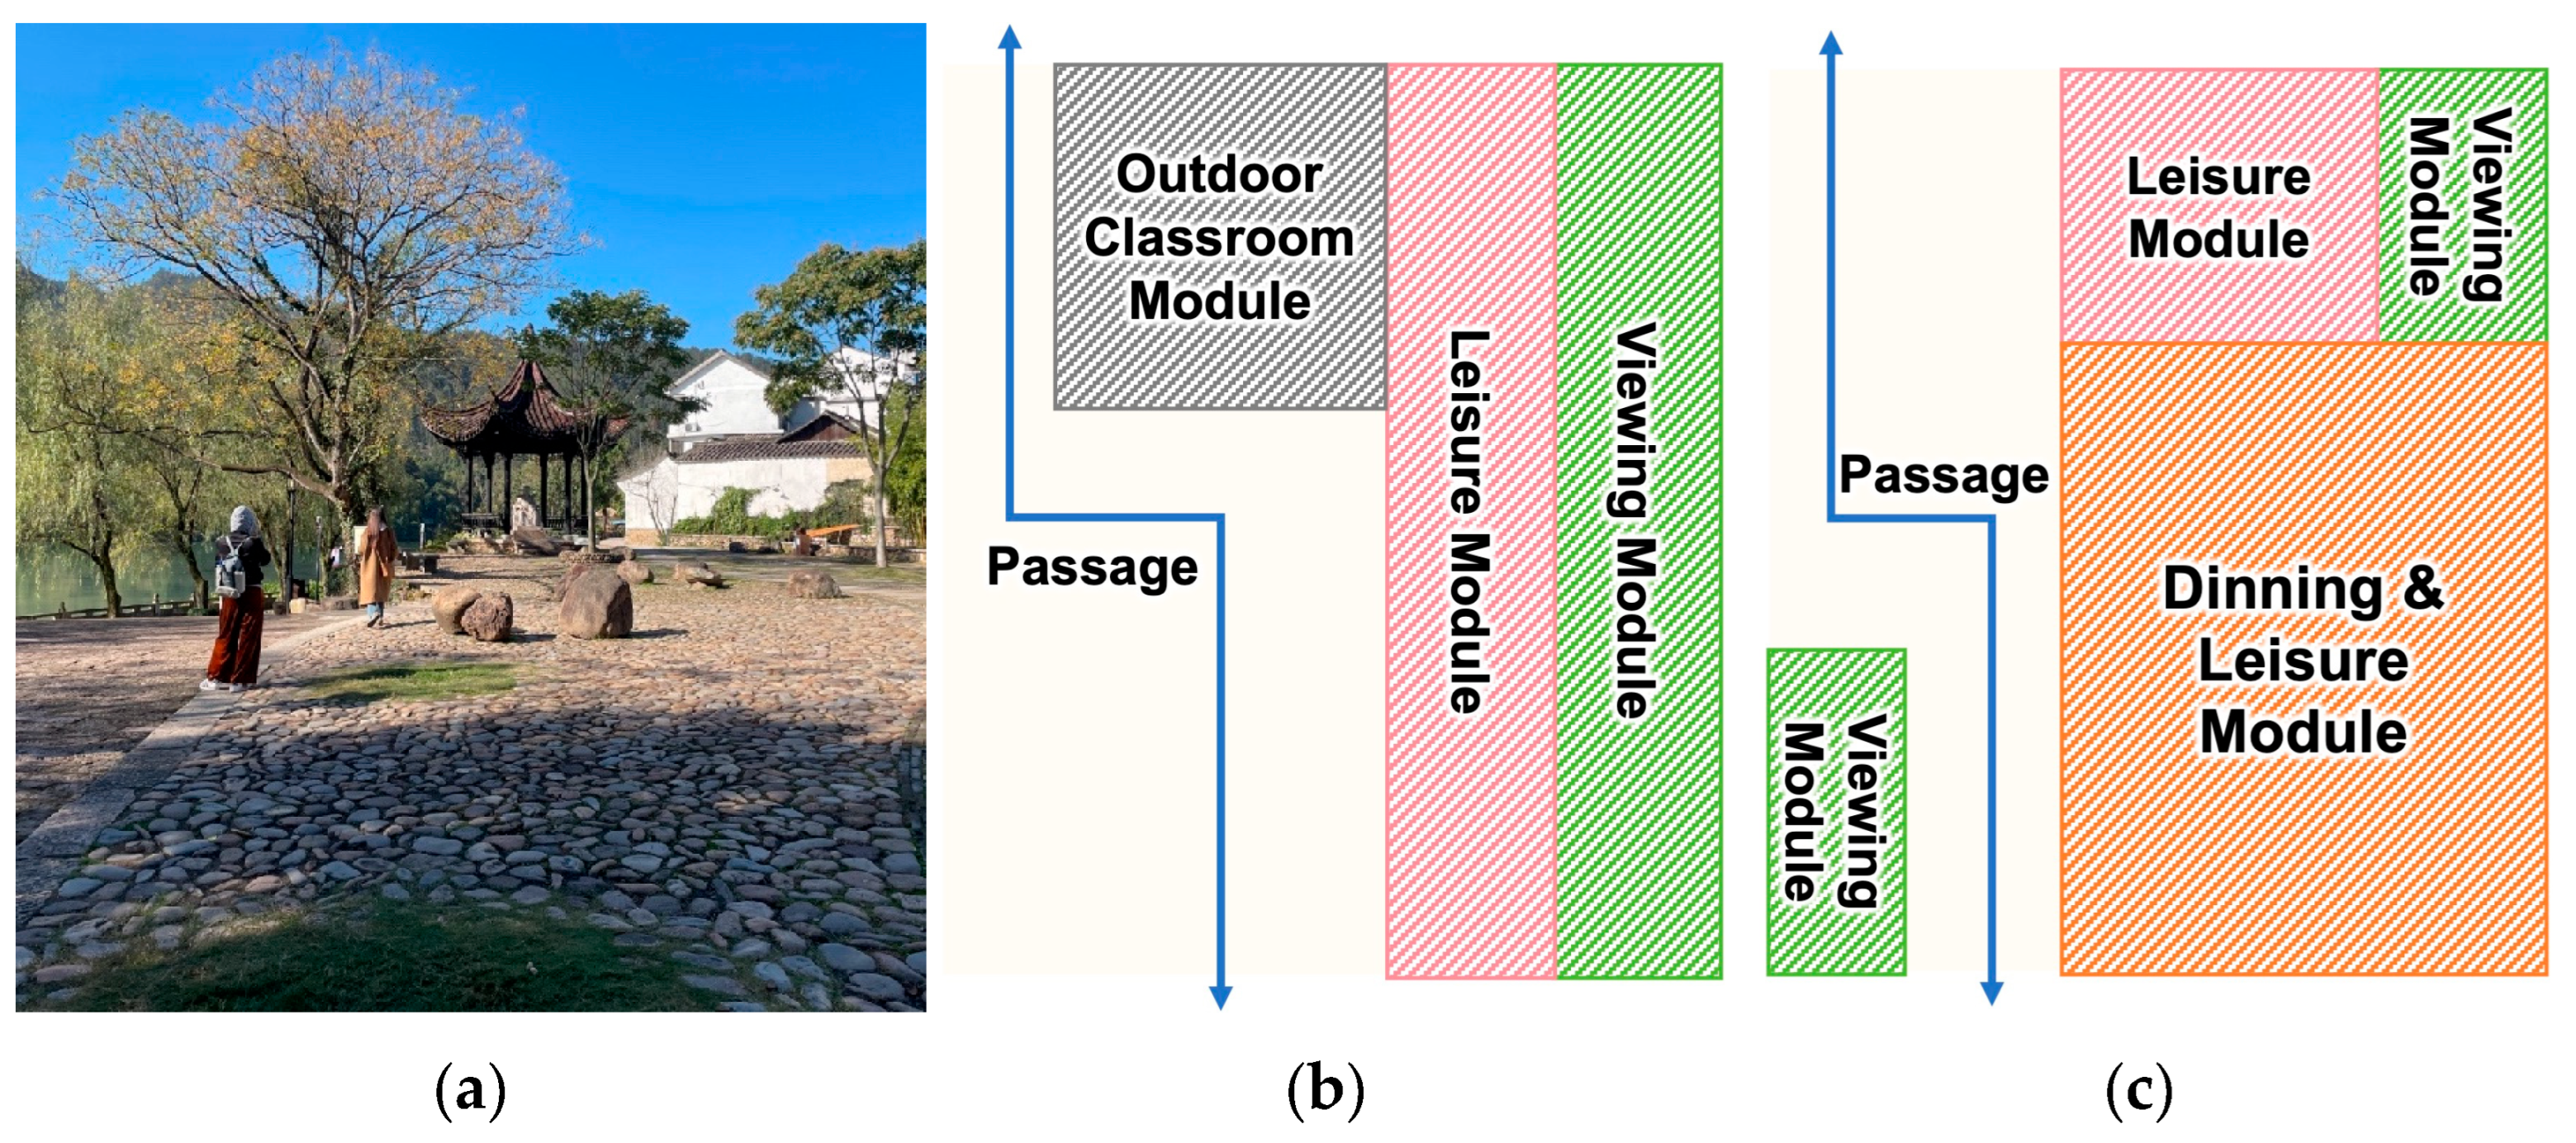
Temporally adaptive functional layouts. In response to the distinct vitality patterns observed between weekdays and weekends and the corresponding differences in visitor behavior, temporally adaptive functional layouts can be implemented using movable devices to flexibly reconfigure spatial modules. This strategy aims to enhance public space vitality at all periods by accommodating diverse temporal demands. For example, Space 2, a large square close to the core cultural heritage site Tongji Weir, featured a favorable visual environment but was currently characterized by hard paving, limited furnishings (only one pavilion), and an absence of cultural elements (Figure 8a). Although people flow in this space was relatively high, the average duration of stay remains short. On weekdays, an “Outdoor Classroom” module can be deployed, leveraging nearby farmland and cultural heritage assets to convert the space into an outdoor educational venue for students and parents from local schools, offering immersive rural cultural experiences (Figure 8b). On weekends, a “Dining and Leisure” module can be introduced, incorporating foldable sunshades, tables, and chairs to support casual dining and leisure activities (Figure 8c). Through this temporally adaptive modular transformation, the spatial configuration can better meet varying visitor needs, maximizing both functional efficiency and vitality throughout different time periods.

5.3. Advantages of Wi-Fi Sensing Method

Public spaces in traditional villages are generally small in scale, typically ranging from 15 to 70 m in length [65]. While big data sources such as mobile phone signaling data have been extensively utilized in urban public space research, their relatively low spatio-temporal resolution in rural contexts, which is characterized by spatial accuracy of approximately 500 m and temporal resolution of around 1 h in rural areas [81], limits their suitability for fine-grained analysis of rural micro-scale spaces [82]. In contrast, Wi-Fi sensing method offers significantly higher spatio-temporal resolution, with spatial accuracy up to 0.01 m and temporal resolution of 1 s, allowing precise adjustment of measurement ranges according to the actual size of each public space [83]. By strategically placing Wi-Fi probes, researchers can maximize coverage and accurately capture dynamic use patterns within these small-scale spaces. Moreover, Wi-Fi probes are cost-effective, easy to deploy and operate, and function independently of device manufacturers or mobile network operators, minimizing implementation barriers and ensuring inclusivity across diverse user demographics. This integration of high-resolution, real-time data acquisition with operational simplicity positions Wi-Fi sensing method as a highly effective methodological approach for monitoring and analyzing the dynamics of public space vitality and its impact factors in traditional village settings.

5.4. The Influence of Residents on Public Space Vitality in Traditional Villages

In traditional villages, the permanent resident population is often small, and public space vitality is predominantly driven by the presence of tourists. Accordingly, at the case site, public spaces situated along the main riverside sightseeing routes in the southern part of the village (Spaces 1–9) were primarily influenced by tourist behavior. Conversely, in internal village spaces with fewer tourists, public space vitality was also shaped by resident activities. For example, Space 13, the courtyard of the village’s home-based elderly care service center, reached its peak vitality during weekday mornings, in contrast to the main sightseeing spaces, which generally exhibited higher vitality on weekends. This pattern was closely associated with its proximity to the elderly care service center. The space functions as a primary venue for daily gatherings and social interactions among the village’s elderly residents. During weekday mornings, elderly residents typically engage in exercise, rest, and social activities within the space, generating a hotspot of community vitality. On weekends, however, some elderly residents participate in family activities, leading to comparatively lower utilization of the space and, consequently, reduced vitality relative to weekdays. These findings indicate that future interventions could enhance the functional diversity of spaces serving residents to accommodate their varied social and activity needs across different temporal periods.

5.5. Limitations and Research Prospects

This study has several limitations. (1) This research focused on 17 public spaces within a single village, resulting in a limited sample size. Although Yantou Village exhibits the typical geographic and industrial characteristics of Chinese traditional villages, it remains difficult to comprehensively capture the features of traditional villages across diverse geographical, cultural, and economic contexts. The findings of this study are insufficient to represent all factors influencing public space vitality in traditional villages. Consequently, the conclusions may not be generalizable to other traditional villages with differing geographical, cultural, or economic contexts. To validate the universality of these impact factors and improve the accuracy of the results, additional sample data are required. Future research should expand its scope to conduct empirical investigations of public spaces in traditional villages representing diverse geographical, cultural, and economic contexts, in order to identify key factors influencing the time-specific vitality of public space. Comparative studies examining variations in impact factors across villages with differing geographical, cultural, and economic contexts could also be pursued. (2) Regarding predictor selection, while this study initially identified 13 impact factors based on existing literature and the specific conditions of the case study site, these factors mainly focus on built environments. They do not include other potential factors such as seasonal variations, local events, or socio-demographic variables. This limitation partially constrains the model’s explanatory power concerning variations in public space vitality. Future research should include these additional factors to improve the comprehensiveness and explanatory capacity of the model. (3) Current analysis may not fully delineate threshold effects of individual factors or interactive effects of multiple variables. Subsequent studies should examine these interactions more comprehensively.

6. Conclusions

Public spaces in traditional villages serve as key venues for showcasing local culture and history. While research on factors influencing their vitality has become more diverse, quantitative, and integrated, studies on their time-specific vitality remain limited. This study aims to investigate the vitality of traditional village public spaces across distinct time periods and their relationship with built environment factors. Using Yantou Village in Lishui City, China, as a case study, the analysis focused on four typical time periods: weekday morning peak, weekday midday off-peak, weekend morning peak, and weekend midday off-peak. To support fine-grained analysis, a Wi-Fi sensing method was employed, enabling real-time, high-resolution monitoring of visitor flows in 17 public spaces. A comprehensive indicator system comprising 13 indicators was developed to examine how built environment factors, from both internal and external dimensions, differentially influence the vitality of public spaces in traditional villages across various time periods.
The findings revealed significant temporal variations in vitality. Most public spaces demonstrated higher vitality on weekends compared to weekdays, with waterfront spaces showing greater vitality during morning peak than midday off-peak. These patterns were primarily shaped by tourists’ spatio-temporal behaviors, tourist route planning, and the spatial distribution of cultural heritage and commercial resources. Moreover, the influence and strength of individual factors varied by time period. First, Historical Element Proximity consistently and significantly drove public space vitality across all periods. Second, Leisure Facility Count demonstrated strong positive effects on vitality during weekend morning peak, while Decorative Element Count positively affected the vitality during both weekend morning peak and weekday midday off-peak. Third, Catering Facility Count positively influenced vitality during weekend midday off-peak. Fourth, Retail Facility Count significantly reduced vitality during weekend morning peaks but enhanced it during midday off-peak, whereas street vendor count showed the opposite pattern—positively influencing vitality during morning peak and negatively during midday off-peak.
This study offers significant theoretical and practical implications for enhancing public space vitality in traditional villages. (1) Theoretically, examining vitality through a time-segment perspective extends understanding of spatio-temporal dynamics in public space vitality. Applying high-resolution Wi-Fi sensing enables quantitative analysis across multiple periods, filling a methodological gap and providing a solid basis for optimizing the flow of elements within villages. (2) Practically, the empirical research identifies the temporal characteristics and drivers of vitality and clarifies the time-specific effects of built environments. It also proposes targeted planning and management strategies to support integrated spatio-temporal revitalization. This approach provides a reference framework for addressing challenges related to temporal-spatial vitality imbalances in traditional villages.

Author Contributions

Conceptualization, Sheng Liu and Yichen Gao; methodology, Sheng Liu; formal analysis, Zhenni Zhu; investigation, Zhenni Zhu and Shanshan Wang; data curation, Zhenni Zhu, Shanshan Wang and Yanchi Zhou; writing—original draft preparation, Sheng Liu and Zhenni Zhu; writing—review and editing, Sheng Liu and Yichen Gao; visualization, Zhenni Zhu and Yichen Gao; supervision, Sheng Liu; project administration, Sheng Liu. All authors have read and agreed to the published version of the manuscript.

Funding

This research was funded by the National Natural Science Foundation of China (Grant number 51908495) and Zhejiang Provincial Philosophy and Social Sciences Planning Project (Grant number 25NDJC158YB).

Data Availability Statement

The original contributions presented in this study are included in the article. Further inquiries can be directed to the corresponding author.

Conflicts of Interest

The authors declare no conflicts of interest.

Appendix A

Figure A1. Spatial Characteristics of Predictors in Public Spaces.
Ijgi 14 00386 g0a1aIjgi 14 00386 g0a1b

References

  1. Zhang, H.; Chen, J.; Zhou, C. Research Review and Prospects of Traditional Villages in China. City Plan. Rev. 2017, 41, 74–80. [Google Scholar]
  2. Li, B.; Luo, Q.; Liu, P.; Zhang, J. Knowledge Maps Analysis of Traditional Villages Research in China Based on the Citespace Method. Econ. Geogr. 2017, 37, 207–214. [Google Scholar]
  3. Menon, A.G.K.; Nigam, N. Smart heritage villages: Lessons from Indian initiatives. J. Cult. Herit. Manag. Sustain. Dev. 2021, 11, 445–460. [Google Scholar] [CrossRef]
  4. Cai, G.; Xu, L.; Gao, W.; Hong, Y.; Ying, X.; Wang, Y.; Qian, F. The Positive Impacts of Exhibition-Driven Tourism on Sustainable Tourism, Economics, and Population: The Case of the Echigo–Tsumari Art Triennale in Japan. Int. J. Environ. Res. Public Health 2020, 17, 1489. [Google Scholar] [CrossRef]
  5. The State Council of the People’s Republic of China. Comprehensive Rural Revitalization Plan (2024–2027). Available online: https://www.gov.cn/zhengce/202501/content_7000493.htm (accessed on 1 July 2025).
  6. General Office of the State Council. Opinions on Strengthening the Protection and Inheritance of Historical and Cultural Heritage in Urban and Rural Construction. Available online: https://www.gov.cn/zhengce/2021-09/03/content_5635308.htm (accessed on 1 July 2025).
  7. Dilixiati, D.; Bell, S. The Use of Public Spaces in Traditional Residential Areas After Tourism-Oriented Renovation: A Case Study of Liu Xing Street in Yining, China. Land 2025, 14, 1041. [Google Scholar] [CrossRef]
  8. Jacobs, J. The Death and Life of Great American Cities; Penguin Random House: New York, NY, USA, 1961. [Google Scholar]
  9. Lynch, K. Good City Form; The MIT Press: Cambridge, MA, USA, 1984. [Google Scholar]
  10. Bentley, I. Responsive Environments: A Manual for Designers; Routledge: London, UK, 1985. [Google Scholar]
  11. Gehl, J. Life Between Buildings; Danish Architectural Press: Copenhagen, Denmark, 2008. [Google Scholar]
  12. Lavrusheva, O. The Concept of Vitality: Review of the Vitality-Related Research Domain. New Ideas Psychol. 2020, 56, 100752. [Google Scholar] [CrossRef]
  13. Etuk, L.; Keen, M.; Wall, C. The Factors Associated with Rural Community Success: A Review of Rural Community Vitality Research; Oregon State University: Corvallis, OR, USA, 2012. [Google Scholar]
  14. Hu, Y.; Chen, S.; Cao, W.; Cao, C. The Concept and Cultural Connotation of Traditional Villages. Urban Dev. Stud. 2014, 21, 10–13. [Google Scholar]
  15. Jalaladdini, S.; Oktay, D. Urban Public Spaces and Vitality: A Socio-Spatial Analysis in the Streets of Cypriot Towns. Procedia Soc. Behav. Sci. 2012, 35, 664–674. [Google Scholar] [CrossRef]
  16. Hikmah; Nday, R.U.; Manu, A.K. Vitality of Public Open Space (Case Study: Taman Nostalgia Kupang). Mediterr. J. Soc. Sci. 2017, 8, 125–132. [Google Scholar] [CrossRef]
  17. Zagroba, M.; Szczepańska, A.; Senetra, A. Analysis and Evaluation of Historical Public Spaces in Small Towns in the Polish Region of Warmia. Sustainability 2020, 12, 8356. [Google Scholar] [CrossRef]
  18. Zumelzu, A.; Barrientos-Trinanes, M. Analysis of the Effects of Urban Form on Neighborhood Vitality: Five Cases in Valdivia, Southern Chile. J. Hous. Built Environ. 2019, 34, 897–925. [Google Scholar] [CrossRef]
  19. Ding, J.; Gao, Z.; Ma, S. Understanding Social Spaces in Tourist Villages through Space Syntax Analysis: Cases of Villages in Huizhou, China. Sustainability 2022, 14, 12376. [Google Scholar] [CrossRef]
  20. Zhang, Y.; Han, Y. Vitality Evaluation of Historical and Cultural Districts Based on the Values Dimension: Districts in Beijing City, China. Herit. Sci. 2022, 10, 137. [Google Scholar] [CrossRef]
  21. Song, J.; Zhu, Y.; Chu, X.; Yang, X. Research on the Vitality of Public Spaces in Tourist Villages through Social Network Analysis: A Case Study of Mochou Village in Hubei, China. Land 2024, 13, 359. [Google Scholar] [CrossRef]
  22. Hägerstrand, T. What about People in Regional Science. Pap. Reg. Sci. 1970, 24, 7–24. [Google Scholar] [CrossRef]
  23. Stokols, D. Environmental Psychology. Annu. Rev. Psychol. 1978, 29, 253–295. [Google Scholar] [CrossRef]
  24. Goffman, E. Behavior in Public Places: Notes on the Social Organization of Gatherings, 4th ed.; Free Press: New York, NY, USA, 1969. [Google Scholar]
  25. Long, Y.; Zhang, E. Insights/Opinion: Promoting Urban Studies and Practice with Emerging Technologies: City Laboratory, New City, and Future City Exploration. Int. J. Smart Sustain. Cities 2024, 2371004. [Google Scholar] [CrossRef]
  26. Lou, G.; Chen, Q.; Chen, W. Strategic Planning for Sustainable Urban Park Vitality: Spatiotemporal Typologies and Land Use Implications in Hangzhou’s Gongshu District via Multi-Source Big Data. Land 2025, 14, 1338. [Google Scholar] [CrossRef]
  27. Liu, S.; Lai, S.Q.; Liu, C.; Jiang, L. What Influenced the Vitality of the Waterfront Open Space? A Case Study of Huangpu River in Shanghai, China. Cities 2021, 114, 103197. [Google Scholar] [CrossRef]
  28. Long, Y.; Zhang, E. City Laboratory: Embracing New Data, New Elements, and New Pathways to Invent New Cities. Environ. Plan. B Urban Anal. City Sci. 2024, 51, 1068–1072. [Google Scholar] [CrossRef]
  29. Saputra, A.A.; Surjono, S.; Meidiana, C. Vitality of Giri Kedaton Site as a Religious Tourism Attraction in Sidomukti Village, Kebomas, Gresik. J. Indones. Tour. Dev. Stud. 2015, 3, 93–104. [Google Scholar] [CrossRef]
  30. Wu, J.; Lu, Y.; Gao, H.; Wang, M. Cultivating Historical Heritage Area Vitality Using Urban Morphology Approach Based on Big Data and Machine Learning. Comput. Environ. Urban Syst. 2022, 91, 101716. [Google Scholar] [CrossRef]
  31. Rastegar, N.; Ahmadi, M.; Malek, M. Factors Affecting the Vitality of Streets in Downtown Johor Bahru City. Indian J. Sci. Res. 2014, 7, 361–374. [Google Scholar]
  32. Zheng, J.; Bai, X.; Na, L.; Wang, H. Tourists’ Spatial–Temporal Behavior Patterns Analysis Based on Multi-Source Data for Smart Scenic Spots: Case Study of Zhongshan Botanical Garden, China. Processes 2022, 10, 181. [Google Scholar] [CrossRef]
  33. Gea-García, G.M.; Fernández-Vicente, C.; Barón-López, F.J.; Miranda-Páez, J. The Recreational Trail of the El Caminito del Rey Natural Tourist Attraction, Spain: Determination of Hikers’ Flow. Int. J. Environ. Res. Public Health 2021, 18, 1809. [Google Scholar] [CrossRef]
  34. Angel, A.; Cohen, A.; Dalyot, S.; Plaut, P. Estimating Pedestrian Traffic with Bluetooth Sensor Technology. Geo-Spat. Inf. Sci. 2023, 27, 1391–1404. [Google Scholar] [CrossRef]
  35. Traunmueller, M.W.; Johnson, N.; Malik, A.; Kontokosta, C.E. Digital Footprints: Using WiFi Probe and Locational Data to Analyze Human Mobility Trajectories in Cities. Comput. Environ. Urban Syst. 2018, 72, 4–12. [Google Scholar] [CrossRef]
  36. Li, L.; Chen, X.; Zhang, L.; Li, Q.; Yang, Y.; Chen, J. Space–time tourist flow patterns in community-based tourism: An application of the empirical orthogonal function to Wi-Fi data. Curr. Issues Tour. 2023, 26, 3004–3022. [Google Scholar] [CrossRef]
  37. Hu, X.; Shen, P.; Shi, Y.; Zhang, Z. Using Wi-Fi Probe and Location Data to Analyze the Human Distribution Characteristics of Green Spaces: A Case Study of the Yanfu Greenland Park, China. Urban For. Urban Green. 2020, 54, 126733. [Google Scholar] [CrossRef]
  38. Zhou, G.; Kurauchi, F.; Ito, S.; Du, R. Identifying Golden Routes in Tourist Areas Based on AMP Collectors. Asian Transp. Stud. 2022, 8, 100052. [Google Scholar] [CrossRef]
  39. Abedi, N.; Bhaskar, A.; Chung, E. Tracking Spatio-Temporal Movement of Human in Terms of Space Utilization Using Media-Access-Control Address Data. Appl. Geogr. 2014, 51, 72–81. [Google Scholar] [CrossRef]
  40. Li, J.; Sharma, A.; Mishra, D.; Davis, J.G.; Seneviratne, A. WiFi Sensing for Outdoor Surveillance. In Proceedings of the 2023 57th Asilomar Conference on Signals, Systems, and Computers, Pacific Grove, CA, USA, 29 October 2023; IEEE: Piscataway, NJ, USA, 2023; pp. 1713–1718. [Google Scholar]
  41. Wu, Z.; Lu, C.; Zhao, Y.; Xie, J.; Zou, D.; Su, X. The Protection of User Preference Privacy in Personalized Information Retrieval: Challenges and Overviews. Libri 2021, 71, 227–237. [Google Scholar] [CrossRef]
  42. Alam, S.S.; Al-Qurishi, M.; Souissi, R. Estimating Indoor Crowd Density and Movement Behavior Using WiFi Sensing. Front. Internet Things 2022, 1, 967034. [Google Scholar] [CrossRef]
  43. Bačić, D.; Braun, A. Public Open Spaces in Historical Context: Croatian Examples in-between Ambition and Restraint. In Proceedings of the Re-Evaluating Contemporary Designs in Historical Context, Istanbul, Turkey, 22–24 July 2015; pp. 65–75. [Google Scholar]
  44. Lee, S.; Cho, N. Nonlinear and Interaction Effects of Multi-Dimensional Street-Level Built Environment Features on Urban Vitality in Seoul. Cities 2025, 165, 106145. [Google Scholar] [CrossRef]
  45. Bi, S.; Du, J.; Tian, Z.; Zhang, Y. Investigating the Spatial Distribution Mechanisms of Traditional Villages from the Human Geography Region: A Case Study of Jiangnan, China. Ecol. Inform. 2024, 81, 102649. [Google Scholar] [CrossRef]
  46. Zhang, W.; Yang, H. Quantitative Research of Traditional Village Morphology Based on Spatial Genes: A Case Study of Shaanxi Province, China. Sustainability 2024, 16, 9003. [Google Scholar] [CrossRef]
  47. Chang, H.; Xiong, K.; Zhu, D.; Zhang, Z.; Zhang, W. Ecosystem Services Value Realization and Ecological Industry Design in Scenic Areas of Karst in South China. Forests 2024, 15, 363. [Google Scholar] [CrossRef]
  48. Nie, Z.; Chen, C.; Pan, W.; Dong, T. Exploring the Dynamic Cultural Driving Factors Underlying the Regional Spatial Pattern of Chinese Traditional Villages. Buildings 2023, 13, 3068. [Google Scholar] [CrossRef]
  49. Wang, K.; Ja`afar, N.H.B.; Mohammad, N.B.; Malek, M.I.B.A. To Evaluate the Value of Traditional Village Landscape Elements in Influencing the Huizhou Character of the UNESCO World Heritage Site: A Case Study of Huizhou, Anhui, China. Int. J. Relig. 2024, 5, 4195–4212. [Google Scholar] [CrossRef]
  50. Dakhiya, C.; Landysh, M.; Lada, R. Event Tourism: The Experience of Involving the Intangible Cultural Heritage of the Republic of Tatarstan in Tourism. Serv. Tour. Curr. Chall. 2016, 10, 79–85. [Google Scholar] [CrossRef]
  51. Liu, C.; Qin, Y.; Wang, Y.; Yu, Y.; Li, G. Spatio-Temporal Distribution of Tourism Flows and Network Analysis of Traditional Villages in Western Hunan. Sustainability 2022, 14, 7943. [Google Scholar] [CrossRef]
  52. Ilieva, L.; Bozhinova, M.; Todorova, L.; Marinov, M.; Ismailov, T.; Spasova, S. Festivals: An Opportunity for Sustainable Development of Tourism Regions. Rev. Gest. Soc. Ambient. 2024, 18, e09356. [Google Scholar] [CrossRef]
  53. Akhundova, A. Role of Festivals in Stimulating the Development of Event Tourism. Theor. Pract. Res. Econ. Fields 2024, 15, 277. [Google Scholar] [CrossRef] [PubMed]
  54. Kang, C.D. Effects of the Human and Built Environment on Neighborhood Vitality: Evidence from Seoul, Korea, Using Mobile Phone Data. J. Urban Plan. Dev. 2020, 146, 05020024. [Google Scholar] [CrossRef]
  55. Mu, B.; Liu, C.; Mu, T.; Xu, X.; Tian, G.; Zhang, Y.; Kim, G. Spatiotemporal Fluctuations in Urban Park Spatial Vitality Determined by On-Site Observation and Behavior Mapping: A Case Study of Three Parks in Zhengzhou City, China. Urban For. Urban Green. 2021, 64, 127246. [Google Scholar] [CrossRef]
  56. Liu, J.; Li, Y.; Xu, Y.; Zhuang, C.C.; Hu, Y.; Yu, Y. Impacts of Built Environment on Urban Vitality in Cultural Districts: A Case Study of Haikou and Suzhou. Land 2024, 13, 840. [Google Scholar] [CrossRef]
  57. Li, M.; Liu, J.; Lin, Y.; Xiao, L.; Zhou, J. Revitalizing Historic Districts: Identifying Built Environment Predictors for Street Vibrancy Based on Urban Sensor Data. Cities 2021, 117, 103305. [Google Scholar] [CrossRef]
  58. Yang, C.; Lo, S.M.; Ma, R.; Fang, H. The Effect of the Perceptible Built Environment on Pedestrians’ Walking Behaviors in Commercial Districts: Evidence from Hong Kong. Environ. Plan. B Urban Anal. City Sci. 2024, 51, 329–346. [Google Scholar] [CrossRef]
  59. Chen, L.; Yan, S. Study on the Vitality of Public Space in Beautiful Villages and the Influencing Factors. Shanxi Archit. 2023, 49, 52–57. [Google Scholar] [CrossRef]
  60. Chen, Y.; Li, R. Spatial Distribution and Type Division of Traditional Villages in Zhejiang Province. Sustainability 2024, 16, 5262. [Google Scholar] [CrossRef]
  61. Gong, J.; Jian, Y.; Chen, W.; Liu, Y.; Hu, Y. Transitions in Rural Settlements and Implications for Rural Revitalization in Guangdong Province. J. Rural Stud. 2022, 93, 359–366. [Google Scholar] [CrossRef]
  62. Bian, J.; Chen, W.; Zeng, J. Spatial Distribution Characteristics and Influencing Factors of Traditional Villages in China. Int. J. Environ. Res. Public Health 2022, 19, 4627. [Google Scholar] [CrossRef] [PubMed]
  63. Wang, F.; Zhao, X.; Qiu, Y.; Luo, J. Adaptability of Traditional Villages as Tourist Destinations in Yellow River Basin, China. Indoor Built Environ. 2022, 32, 574–589. [Google Scholar] [CrossRef]
  64. Zhang, Z.H.; Yi, Y.; Sun, J.N. Entropy Method for Determination of Weight of Evaluating Indicators in Fuzzy Synthetic Evaluation for Water Quality Assessment. J. Environ. Sci. 2006, 18, 4. [Google Scholar] [CrossRef] [PubMed]
  65. Liu, S.; Zhu, Z.; Gao, Y.; Wang, S. Assessing the Dynamic Vitality of Public Spaces in Tourism-Oriented Traditional Villages: A Collaborative Active Perception Method. Herit. Sci. 2024, 12, 346. [Google Scholar] [CrossRef]
  66. Wen, Q.; Li, J.; Ding, J.; Wang, J. Evolutionary Process and Mechanism of Population Hollowing Out in Rural Villages in the Farming-Pastoral Ecotone of Northern China: A Case Study of Yanchi County, Ningxia. Land Use Policy 2023, 125, 106506. [Google Scholar] [CrossRef]
  67. Petre, A.-C.; Chilipirea, C.; Baratchi, M.; Dobre, C.; van Steen, M. WiFi Tracking of Pedestrian Behavior. In Smart Sensors Networks; Academic Press: Cambridge, MA, USA, 2017; pp. 309–337. ISBN 978-0-12-809859-2. [Google Scholar]
  68. Huang, J.; Hu, X.; Wang, J.; Lu, A. How Diversity and Accessibility Affect Street Vitality in Historic Districts? Land 2023, 12, 219. [Google Scholar] [CrossRef]
  69. Zhang, F.; Liu, Q.; Zhou, X. Vitality Evaluation of Public Spaces in Historical and Cultural Blocks Based on Multi-Source Data, a Case Study of Suzhou Changmen. Sustainability 2022, 14, 14040. [Google Scholar] [CrossRef]
  70. Fu, J.-M.; Tang, Y.-F.; Zeng, Y.-K.; Feng, L.-Y.; Wu, Z.-G. Sustainable Historic Districts: Vitality Analysis and Optimization Based on Space Syntax. Buildings 2025, 15, 657. [Google Scholar] [CrossRef]
  71. Vidal, D.G.; Teixeira, C.P.; Fernandes, C.O.; Olszewska-Guizzo, A.; Dias, R.C.; Vilaça, H.; Barros, N.; Maia, R.L. Patterns of Human Behaviour in Public Urban Green Spaces: On the Influence of Users’ Profiles, Surrounding Environment, and Space Design. Urban For. Urban Green. 2022, 74, 127668. [Google Scholar] [CrossRef]
  72. Zhang, J.; Hu, X.; Wang, J. Spatial Vitality Variation in Community Parks and Their Influencing Factors. PLoS ONE 2025, 20, e0312941. [Google Scholar] [CrossRef] [PubMed]
  73. Shao, L.; Ma, P.; Zhou, Z. Research on the Impact of Landscape Planning on Visual and Spatial Perception in Historical District Tourism: A Case Study of Laomendong. Land 2024, 13, 1134. [Google Scholar] [CrossRef]
  74. Zhou, M.; Yang, J. Geospatial Spatiotemporal Analysis of Tourism Facility Attractiveness and Tourism Vitality in Historic Districts: A Case Study of Suzhou Old City. Land 2025, 14, 922. [Google Scholar] [CrossRef]
  75. Zheng, G.; Ding, L.; Zheng, J. A Multi-Dimensional Evaluation of Street Vitality in a Historic Neighborhood Using Multi-Source Geo-Data: A Case Study of Shuitingmen, Quzhou. ISPRS Int. J. Geo-Inf. 2025, 14, 240. [Google Scholar] [CrossRef]
  76. Ye, Y.; Li, D.; Liu, X. How Block Density and Typology Affect Urban Vitality: An Exploratory Analysis in Shenzhen, China. Urban Geogr. 2017, 39, 631–652. [Google Scholar] [CrossRef]
  77. Huang, X.; Gong, P.; Wang, S.; White, M.; Zhang, B. Machine Learning Modeling of Vitality Characteristics in Historical Preservation Zones with Multi-Source Data. Buildings 2022, 12, 1978. [Google Scholar] [CrossRef]
  78. Zheng, J.; He, J.; Tang, H. The Vitality of Public Space and the Effects of Environmental Factors in Chinese Suburban Rural Communities Based on Tourists and Residents. Int. J. Environ. Res. Public Health 2023, 20, 263. [Google Scholar] [CrossRef]
  79. Ren, K.; Xu, J. Formation Process and Spatial Representation of Tourist Destination Personality from the Perspective of Cultural Heritage: Application in Traditional Villages in Ancient Huizhou, China. Land 2024, 13, 423. [Google Scholar] [CrossRef]
  80. Ding, Z.; Han, X. Optimization Design of Public Space in Huizhou Traditional Villages: Taking Qinghua Town as an Example. Front. Humanit. Soc. Sci. 2024, 4, 472–478. [Google Scholar] [CrossRef]
  81. Zhou, J.; Hou, Q.; Dong, W. Spatial Characteristics of Population Activities in Suburban Villages Based on Cellphone Signaling Analysis. Sustainability 2019, 11, 2159. [Google Scholar] [CrossRef]
  82. Ghahramani, M.; Zhou, M.; Wang, G. Urban Sensing Based on Mobile Phone Data: Approaches, Applications, and Challenges. IEEE/CAA J. Autom. Sin. 2020, 7, 627–637. [Google Scholar] [CrossRef]
  83. Svečko, J.; Malajner, M.; Gleich, D. Distance Estimation Using RSSI and Particle Filter. ISA Trans. 2015, 55, 275–285. [Google Scholar] [CrossRef]
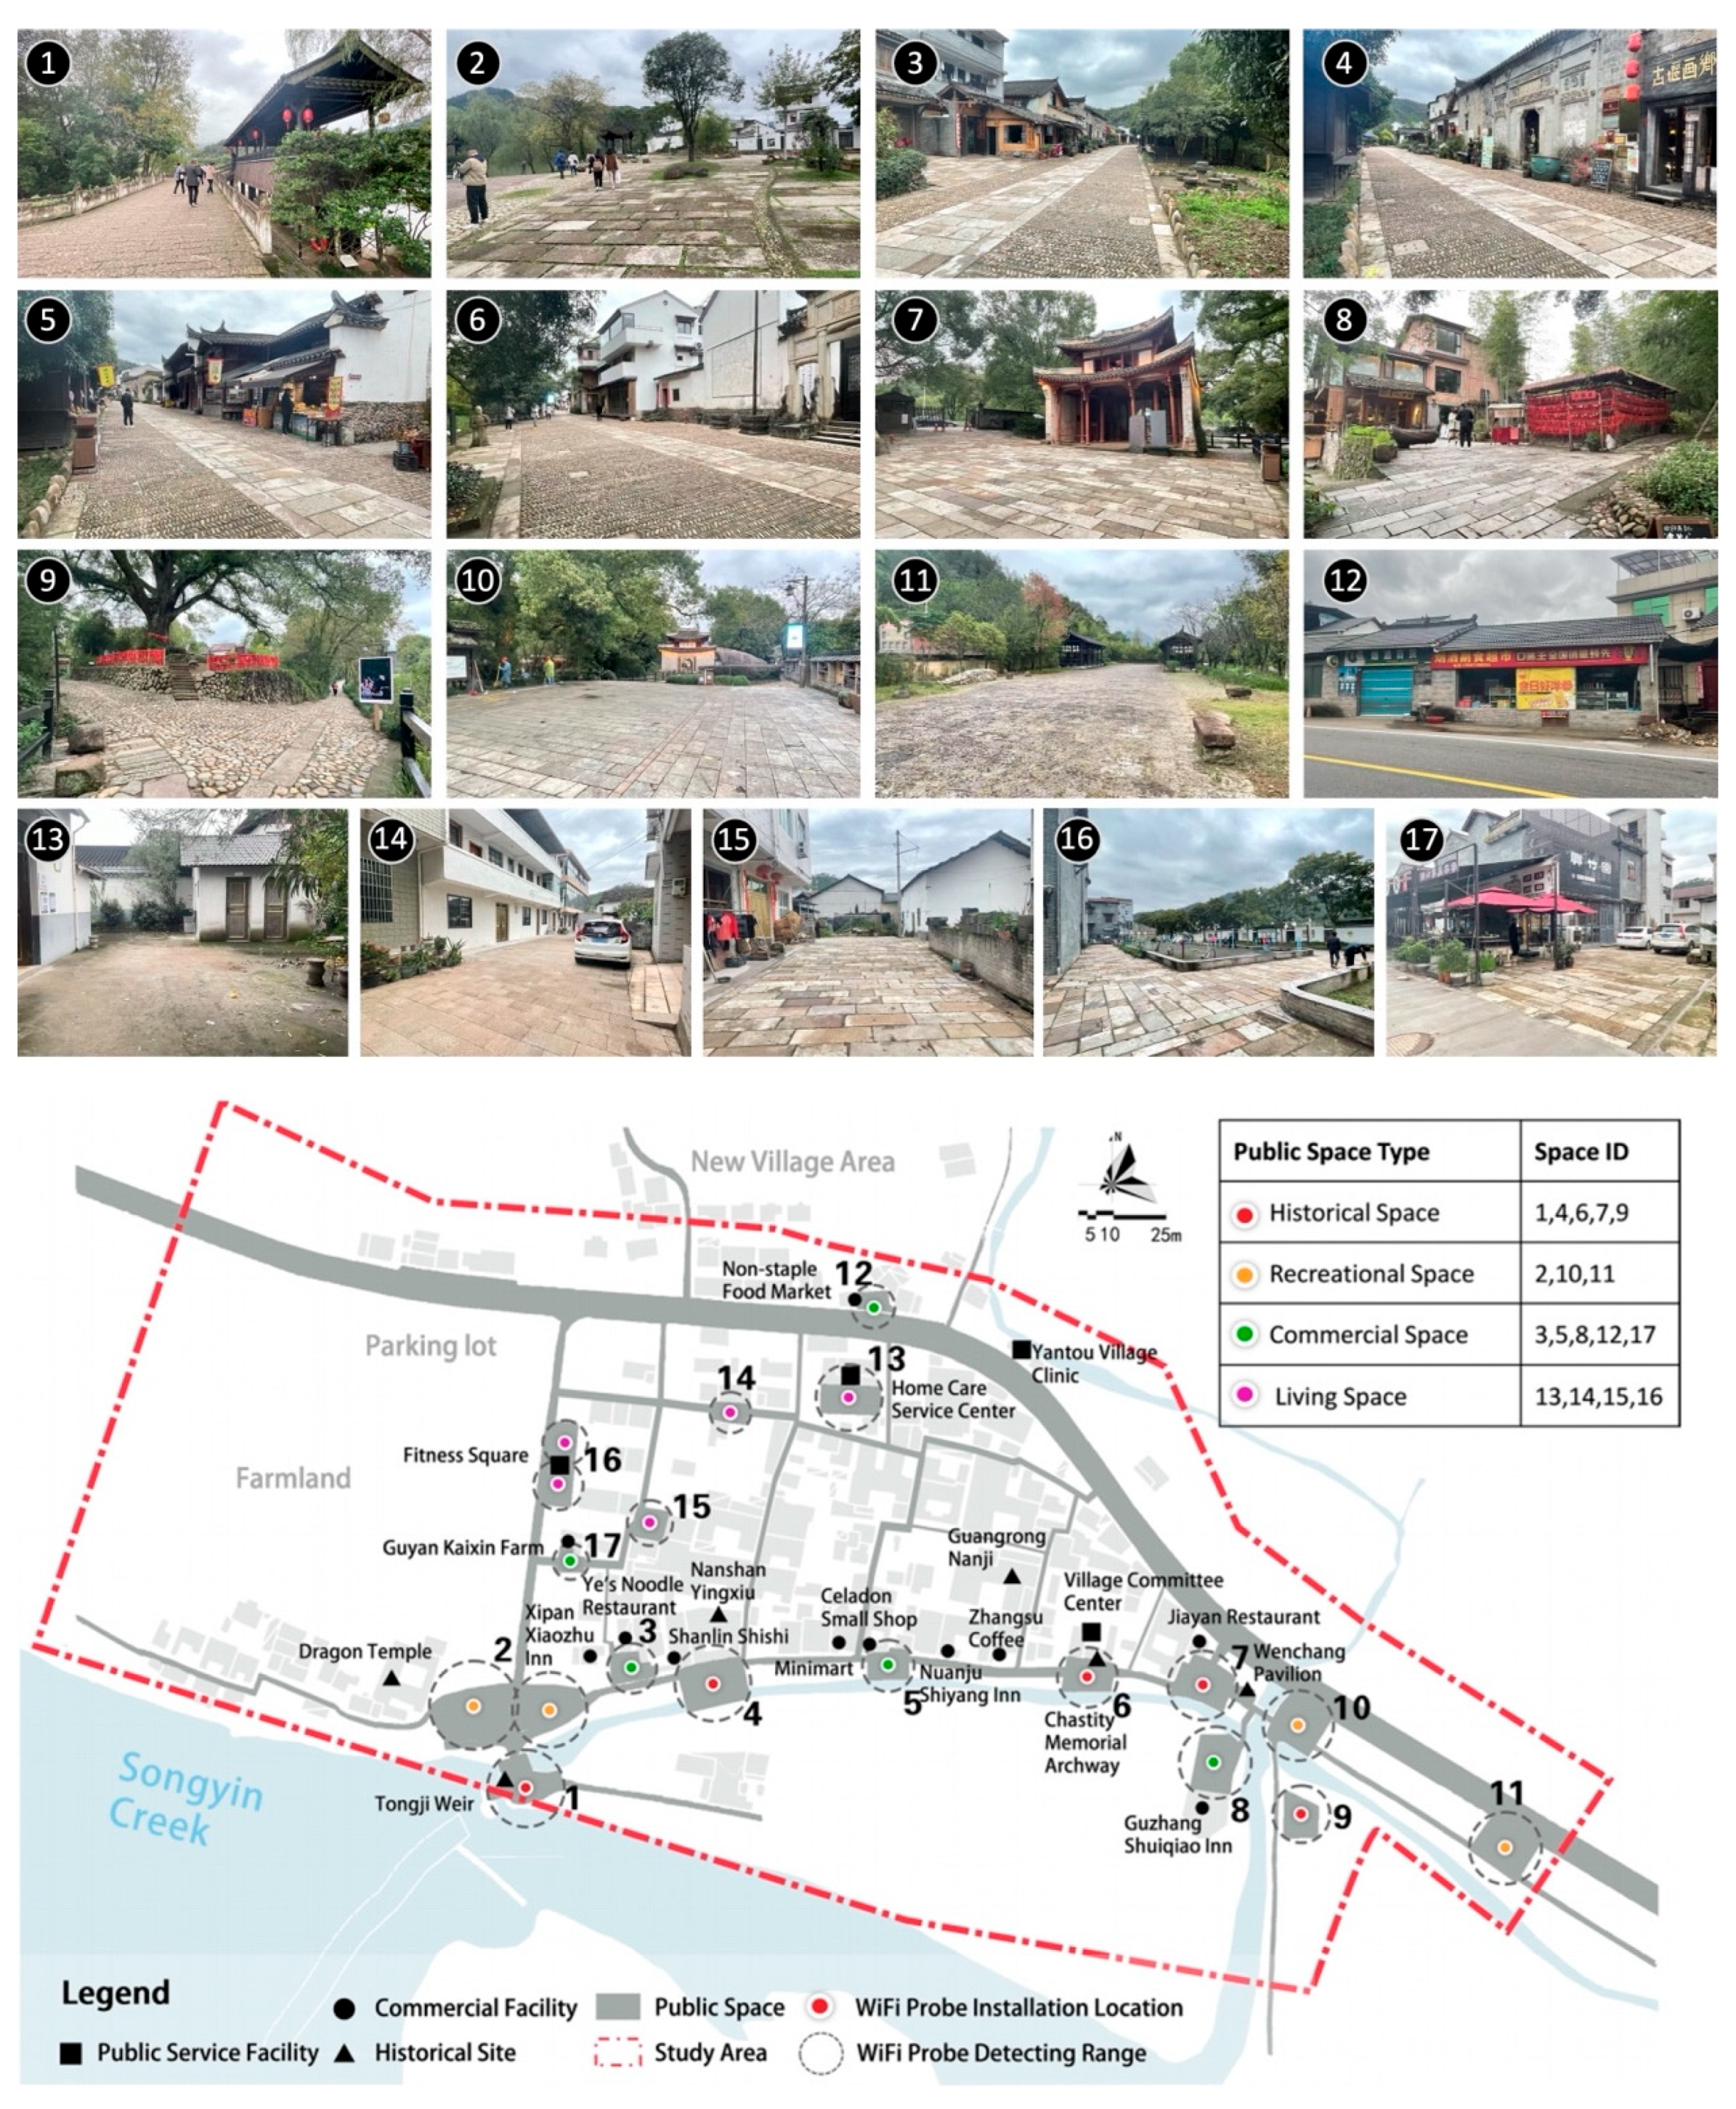
Figure 1. Study area.
Ijgi 14 00386 g001
Figure 2. Research framework.
Ijgi 14 00386 g002
Figure 3. Monitoring method using Wi-Fi probes: (a) the setup of Wi-Fi probe; (b) the installation of Wi-Fi Probes (the red box area is the Wi-Fi probe device); (c) process of data collection; (d) real-time data monitoring; (e) data sample uploaded to cloud server.
Ijgi 14 00386 g003
Figure 4. Spatial differentiation of overall vitality.
Ijgi 14 00386 g004
Figure 5. Vitality values across different time periods.
Ijgi 14 00386 g005
Figure 6. Vitality values during (a) Weekday morning peak; (b) Weekday midday off-peak; (c) Weekend morning peak; (d) Weekend midday off-peak.
Ijgi 14 00386 g006
Figure 7. Time-varying influence strength of key factors.
Ijgi 14 00386 g007
Figure 8. (a) Photo of the current state of Space 2; (b) Weekday function layout diagram; (c) Weekend function layout diagram.
Ijgi 14 00386 g008
Table 1. Indicator system for public space vitality calculation.
DimensionIndicatorConceptCalculationFormula
SpatialRetention Intensity (I)The ability to attract people to visit.The people flow per square metre per hour. I i , j = F i , j A j ,(1)
Ii,j: the retention intensity of space j at hour i;
Fi,j: the people flow in space j at hour i;
Aj: the area of space j.
TemporalRetention Durability (D)The ability to attract people to stay for a long time.The average duration of people’s stay. D i , j = m = 1 n i , j t m , i , j n i , j ,(2)
Di,j: the average duration of stay in space j at hour i;
tm,i,j: individual m’s single time stay length in space j at hour i;
ni,j: the total number of people who stay in space j at hour i.
Table 2. Impact factor system.
DimensionImpact Factor 8Concept and CalculationReferences
InternalSpatial Scale (X1)Area of public space.[68,69]
Spatial Accessibility (X2)Number of paths connected to the public space.[56,70]
Leisure Facility Count (X3)Number of leisure facilities within the space 1.[69,71,72]
Decorative Element Count (X4)Number of decorative elements within the space 2.[73]
ExternalCatering Facility Proximity (X5)Distance from the space centroid to nearest external catering facility 3.[68,74]
Catering Facility Count (X6)Number of catering facilities within the public space’s 25 m buffer zone.[75,76,77]
Retail Facility Proximity (X7)Distance from the space centroid to nearest external retail facility 4.[74]
Retail Facility Count (X8)Number of retail facilities within the public space’s 25 m buffer zone.[69,77]
Street Vendor Proximity (X9)Distance from the space centroid to nearest external street vendor 5.[74]
Street Vendor Count (X10)Number of street vendors within the public space’s 25 m buffer zone.[77]
Historical Element Proximity (X11)Distance from the space centroid to nearest external historical feature 6.[69,78]
Historical Element Count (X12)Number of historical features within line-of-sight range.[75]
Natural Element Proximity (X13)Distance from space centroid to nearest external natural element 7.[56]
Note: 1 Leisure Facility: includes benches, pavilions, walkways, fitness equipment, and other related amenities. Each individual bench is assigned a value of 1, each pavilion and walkway a value of 3, each set of accompanying tables and chairs a value of 2, and each individual piece of fitness equipment a value of 1. 2 Decorative Element: includes sculptures, landscape ornaments, and similar installations. Items exceeding 1.2 m in height are assigned a value of 2, while those below this height are assigned a value of 1. 3 Catering Facility: refers to fixed establishments primarily offering food services, such as farmhouse restaurants, ice cream shops, cafés, and Chinese restaurants. 4 Retail Facility: refers to fixed establishments focused on retail services, such as specialty shops, convenience stores, and department stores. 5 Street Vendor: refers to independently operated mobile vendors, excluding those affiliated with catering or retail facilities. 6 Historical Element: includes heritage sites, historic buildings, as well as other elements that reflect the village’s historical landscape and cultural identity, such as ancient towers, bridges, weirs, and trees. 7 Natural Element: refers to landscape features such as mountains, forests, farmland, and streams. 8 Data source: Count indicators were collected through field surveys, while area and proximity indicators were obtained from map measurements.
Table 3. Correlation analysis result.
Impact Factor Vitality Across Typical Time Periods
V1V2V3V4
Spatial Scale (X1)CC.0.3380.1150.3970.103
Sig.0.1840.6600.1150.694
Spatial Accessibility (X2)CC.0.3470.624 **0.4570.454
Sig.0.1720.0070.0650.067
Leisure Facility Count (X3)CC.0.2570.2520.558 *0.557 *
Sig.0.3190.3280.0200.020
Decorative Element Count (X4)CC.0.2570.589 *0.561 *0.495 *
Sig.0.3200.0130.0190.043
Catering Facility Proximity (X5)CC.−0.309−0.551 *−0.576 *−0.431
Sig.0.2280.0220.0160.084
Catering Facility Count (X6)CC.0.2020.525 *0.634 **0.597 *
Sig.0.4370.0300.0060.011
Retail Facility Proximity (X7)CC.−0.613 **−0.240−0.547 *−0.525 *
Sig.0.0090.3530.0230.031
Retail Facility Count (X8)CC.0.564 *0.0130.4310.382
Sig.0.0180.9620.0840.130
Street Vendor Proximity (X9)CC.−0.485 *−0.662 **−0.527 *−0.380
Sig.0.0480.0040.0300.133
Street Vendor Count (X10)CC.0.567 *0.4680.580 *0.223
Sig.0.0180.0580.0150.390
Historical Element Proximity (X11)CC.−0.370−0.380−0.654 **−0.397
Sig.0.1440.1330.0040.115
Historical Element Count (X12)CC.0.520 *0.555 *0.761 **0.424
Sig.0.0330.0210.0000.090
Natural Element Proximity (X13)CC.−0.330−0.361−0.481−0.370
Sig.0.1960.1550.0510.143
Note: * p < 0.05, ** p < 0.01, *** p < 0.001; CC.: Correlation Coefficient.
Table 4. Regression model for weekday morning peak.
PredictorsUnstandardized
Coefficient
Standardized
Coefficient
tpVIFModel Diagnostics
BStd. ErrorβR2adj R2F
(Constant)1.0640.075 14.2810.000 *** 0.2950.2486.290
(p = 0.024 *)
Historical Element Proximity (X11)−0.0050.002−0.544−2.5080.024 *1.000
Note: * p < 0.05, ** p < 0.01, *** p < 0.001; D-W = 2.019.
Table 5. Regression model for weekday midday off-peak.
PredictorsUnstandardized
Coefficient
Standardized
Coefficient
tpVIFModel Diagnostics
BStd. ErrorβR2adj R2F
(Constant)0.0730.199 0.3660.720 0.7840.73415.714
(p = 0.000 ***)
Spatial Accessibility (X2)0.1940.0400.6904.9020.000 ***1.190
Decorative Element Count (X4)0.0650.0250.5012.5770.023 *2.278
Historical Element Proximity (X11)−0.0100.002−0.904−4.9190.000 ***2.029
Note: * p < 0.05, ** p < 0.01, *** p < 0.001; D-W = 2.447.
Table 6. Regression model for weekend morning peak.
PredictorsUnstandardized
Coefficient
Standardized
Coefficient
tpVIFModel Diagnostics
BStd. ErrorβR2adj R2F
(Constant)−0.5790.175 −3.3010.013 * 0.9820.95841.824 (p = 0.000 ***)
Spatial Accessibility (X2)0.2450.0320.6557.5680.000 ***2.870
Leisure Facility Count (X3)0.0450.0050.6328.2260.000 ***2.262
Decorative Element Count (X4)0.1400.0180.8177.8260.000 ***4.177
Retail Facility Count (X8)−0.1260.029−0.678−4.3310.003 **9.401
Street Vendor Proximity (X9)0.0110.0010.9457.6350.000 ***5.872
Street Vendor Count (X10)0.1010.0181.0985.4830.001 ***15.363
Historical Element Proximity (X11)−0.0250.002−1.619−13.1830.000 ***5.779
Note: * p < 0.05, ** p < 0.01, *** p < 0.001; D-W = 2.730.
Table 7. Regression model of factors influencing vitality in weekend midday off-peak.
PredictorsUnstandardized
Coefficient
Standardized
Coefficient
tpVIFModel Diagnostics
BStd. ErrorβR2adj R2F
(Constant)0.5430.2322.3440.047 *0.8380.6765.180 (p = 0.016 *)
Spatial Accessibility (X2)0.1750.0660.5072.6360.030 *1.829
Catering Facility Count (X6)0.1600.0430.8453.6800.006 **2.606
Retail Facility Proximity (X7)0.0080.0030.6322.4950.037 *3.169
Retail Facility Count (X8)0.2810.0821.6513.4210.009 **11.513
Street Vendor Count (X10)−0.1590.046−1.883−3.4830.008 **14.450
Historical Element Proximity (X11)−0.0140.003−0.963−4.1620.003 **2.646
Note: * p < 0.05, ** p < 0.01, *** p < 0.001; D-W = 2.776.
Disclaimer/Publisher’s Note: The statements, opinions and data contained in all publications are solely those of the individual author(s) and contributor(s) and not of MDPI and/or the editor(s). MDPI and/or the editor(s) disclaim responsibility for any injury to people or property resulting from any ideas, methods, instructions or products referred to in the content.