Abstract
To address the flood risks driven by climate change and urbanization, this study proposes the DRIRA model (Driving Force, Resistance, Influence, Recoverability, Adaptability). Distinct from BRIC (Baseline Resilience Indicators for Communities) and PEOPLES (Population, Environmental/Ecosystem, Organized Governmental Services, Physical Infrastructure, Lifestyle, Economic Development, Social–Cultural Capital), the model emphasizes dynamic interactions across the entire disaster lifecycle, introduces the “Influence” dimension, and integrates SNA (Social Network Analysis) with a modified gravity model to reveal cascading effects and resilience linkages among cities. Based on an empirical study of 30 cities in the Central Plains Urban Agglomeration, and using a combination of entropy weighting, a modified spatial gravity model, and social network analysis, the study finds that: (1) Urban flood resilience increased by 35.5% from 2012 to 2021, but spatial polarization intensified, with Zhengzhou emerging as the dominant core and peripheral cities falling behind; (2) Economic development, infrastructure investment, and intersectoral governance coordination are the primary factors driving resilience differentiation; (3) Intercity resilience connectivity has strengthened, yet administrative fragmentation continues to undermine collaborative effectiveness. In response, three strategic pathways are proposed: coordinated development of sponge and resilient infrastructure, activation of flood insurance market mechanisms, and intelligent cross-regional dispatch of emergency resources. These strategies offer a scientifically grounded framework for balancing physical flood defenses with institutional resilience in high-risk urban regions.
1. Introduction
Flooding is one of the most frequently occurring and severely consequential natural disasters worldwide [1,2,3]. According to the World Meteorological Organization, over the past 50 years, more than 11,000 weather, climate, and water-related disasters have been reported, resulting in over 2 million deaths and $3.64 trillion in economic losses. Among these, tropical cyclones have caused the greatest economic damage, followed closely by floods [4]. This translates to an average of 115 deaths and $202 million in economic losses each day globally. China is one of the countries most prone to flooding, with approximately two-thirds of its territory at risk of experiencing various types and intensities of flood disasters. According to the “2021 China Water and Drought Disaster Prevention Bulletin” released by the Ministry of Water Resources of China, a total of 59.01 million people were affected by floods in 2021, resulting in 590 deaths and missing persons. The direct economic losses due to flooding reached 245.892 billion yuan, accounting for 0.22% of China’s GDP for that year. Among these, the provinces of Henan, Shaanxi, Sichuan, and Shanxi incurred direct economic losses of 190.78 billion yuan, representing 0.027% of China’s total GDP [5]. With the rapid development of urbanization, uncertainties faced by cities are increasing swiftly, and the frequent occurrence of flooding poses significant challenges to the stability of urban systems. It is estimated that among 13,816 cities worldwide, only 600 contribute to 50% of the global GDP, while the total GDP of the top 20 most competitive economies in 2018 accounted for approximately 15% of the world’s GDP [6]. As shown in Figure 1, with the continuous growth of GDP and urbanization rates, the direct economic losses from flooding disasters exhibit a fluctuating upward trend. Clearly, urbanization has not only facilitated urban construction and economic development but has also significantly increased the exposure of populations and assets, exacerbating casualties and economic losses in the face of intensive disasters. As a complex mega-system encompassing natural, economic, and social dimensions, cities exhibit characteristics such as sustained susceptibility, diverse types, and interconnected structures when facing flooding disasters, especially as economic development continues [7]. Once a disaster occurs, the entire urban system can experience a “domino effect.” In this context, traditional, singular, and reactive flood management approaches are increasingly inadequate to address the challenges posed by urbanization. There is an urgent need to shift the paradigm of disaster response and management. Thus, the concept of safety and resilience in urban governance has emerged. Compared to traditional approaches, resilient cities can achieve lower disaster losses and faster recovery, better adapting to future uncertainties and ultimately realizing safe and sustainable development.
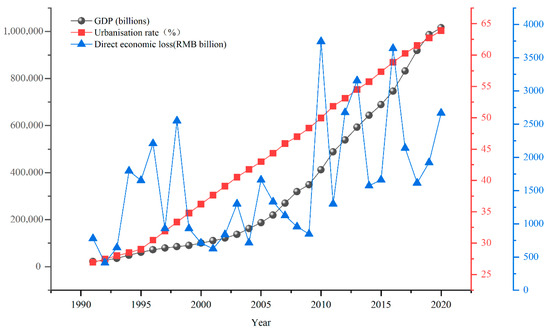
Figure 1.
Statistics of Gross Domestic Product, Urbanization Rate, and Direct Economic Losses from Flood Disasters in China from 1991 to 2021.
So far, the study of urban resilience has become an interdisciplinary field, with experts, scholars, and organizations from various domains engaging in discussions and research to varying degrees. Significant theoretical advancements and practical applications have been achieved in the field of disaster emergency management, including definitions of the urban resilience concept, development of indicator systems, and assessment methodologies. The literature on resilience has continuously expanded, evolving from the earliest notion of bouncing back to a previous state [8] to the current understanding of resilience as a dynamic system property characterized by the ability to endure, adapt, and recover rapidly [9]. This progression encompasses engineering resilience, ecological resilience, and evolutionary resilience [10]. Simultaneously, academic perceptions of the concept of resilience have shifted from a singular scale and linear logic to a multi-scale and cyclical framework [11]. The next aspect is the construction of the urban resilience indicator system. Overall, existing indicator systems primarily focus on three areas: first, they are built around the fundamental components of urban systems, including economic, social, ecological, and infrastructural elements [12,13], Kammouho et al. proposed a quantitative measurement method for community disaster resilience based on the PEOPLES framework, identifying improvement directions by comparing resilience indicators with acceptable levels [14]. Similarly, Cutter et al. developed the Baseline Resilience Indicators for Communities (BRIC), a resilience assessment framework that is not specific to any particular type of disaster [15]; second, they consider characteristics of resilient cities, such as redundancy, robustness, intelligence, responsiveness, and adaptability [16,17]; third, they center on the mechanisms of resilience, including resistance, recovery, adaptability, and transformative learning [18]. ZHANG J et al. proposed a multi-level urban function assessment framework and a new multi-stage resilience evaluation model based on lifecycle theory and the importance of the pre-disaster preparation phase. They specifically analyzed the variations of PDPS resilience curves, which include three scenarios: steady increase, continuous decline, and dynamic change [19]. The third aspect pertains to methods for assessing urban resilience. Quantitative research on urban resilience varies in approach, ranging from localized systems to the overall system, from physical systems to complex systems, and from current assessments to future modeling and predictions. Generally, these methods can be classified into comprehensive assessments and modeling simulations. Examples include numerical analyses of urban resilience levels based on resilience factors [20], characterization of specific urban resilience systems using functional time curves [16,21,22,23], depiction of changes in system functionality relying on historical disaster data and socio-economic data [24], integration of spatial information technologies for modeling [25], and scenario-based simulations to predict and replicate resilience characteristics under disaster conditions [26,27].
Based on a literature review, it is evident that significant progress has been made in the research on resilient cities. However, the scope of these studies is relatively broad. Most evaluations focus on the comprehensive assessment of urban resilience from a macro perspective, lacking detailed analyses of specific cities from the viewpoint of particular disasters. There is insufficient research on the interactions and mechanisms among resilience elements in the context of flood disasters. Methodologically, most existing studies on urban resilience focus on constructing indicator systems based on the dimensions and characteristics of resilience. For instance, the PEOPLES framework lacks a clear depiction of the dynamic response mechanisms across the full disaster lifecycle (pre-disaster, during-disaster, and post-disaster) and fails to integrate multi-scale spatial correlation analysis. Similarly, the BRIC model overlooks the temporal interaction effects between driving forces (e.g., climate change, urbanization pressures) and recoverability (e.g., post-disaster learning and adaptive capacity). In terms of research scale, there is a notable lack of multi-scale evaluations of urban resilience to flood disasters. Current literature predominantly concentrates on analyses and assessments at a single scale—such as individual communities, cities, or specific urban subsystems—while comparative studies of urban flood resilience across multiple scales are limited. Regarding research progress, most existing studies are based on single hazard types or static perspectives, making it difficult to reveal the nonlinear coupling relationships among multi-dimensional resilience factors within complex urban systems.
Based on previous research findings, this paper makes the following key contributions: (1) It explores the changes in urban resilience levels under the impact of flooding from the perspective of complex urban systems driven by the coupling of human and natural processes; (2) It identifies and investigates the influencing factors of urban flood resilience at a fundamental level, clarifying key factors and delineating the logical relationships among these influencing factors to elucidate their intrinsic interactions and hierarchical structures; (3) Based on the lifecycle theory, this study proposes the DRIRA model (Driving Force–Resistance–Influence–Recoverability–Adaptability), aiming to overcome the limitations of existing frameworks in three key aspects: (1) It captures the dynamic evolution of resilience across the disaster lifecycle, emphasizing the interactions between driving forces (e.g., climate pressures) and recoverability (e.g., post-disaster learning); (2) It introduces the “Influence” dimension to reveal nonlinear connections among economic, ecological, and infrastructural subsystems; (3) It integrates Social Network Analysis (SNA) and a modified gravity model to quantify resilience spillover effects and the potential for collaborative governance. (4) Through empirical analysis, this study explores configurational effects, with a focus on revealing the multi-scale transformations, synergistic driving of multiple factors, and dynamic evolutionary characteristics of urban flood resilience, and ultimately proposes corresponding strategies for resilience enhancement.
2. Analysis of the Mechanisms of Urban Resilience Under Floods
The mechanisms of urban flood resilience reflect the dynamic adaptation of social-ecological systems (SES). According to Holling’s Adaptive Cycle theory, cities under flood stress pass through four stages—exploitation, conservation, release, and reorganization—demonstrating their ability to maintain functions (resistance), adjust to shocks (adaptation), and improve through learning [10]. The SES resilience model further emphasizes resilience as a balance of exposure, sensitivity, and adaptive capacity, highlighting that urban resilience arises not only from physical infrastructure resistance but also from the joint adaptation of social, economic, and ecological subsystems.
Building on these theoretical foundations, this study classifies the mechanisms of urban flood resilience into three critical phases (Figure 2): Resistance → Adaptation → Transformation.
Resistance (t1). In the resistance phase, urban systems rely on their inherent structures and functions to absorb and withstand the initial impact of flood disasters. This phase aligns with Holling’s concept of ecological resilience, emphasizing the system’s ability to maintain its core functions under disturbance. Specifically, urban infrastructure such as drainage systems, river dredging, and green spaces for water retention play a crucial role in mitigating flood impacts [28]. The resilience at this stage is characterized by the stability of physical structures and functional systems.
Adaptation (t2). As the intensity of flood disasters increases, urban systems transition into the adaptation phase. During this phase, the system adjusts its structures and functions to respond to external shocks, demonstrating self-adjustment and adaptive capacity. This process aligns with Cutter et al.’s SES resilience model [29], where systems mitigate disaster impacts through strategic adjustments in policies, resource allocation, and social mechanisms. Adaptation is not limited to physical infrastructure but also encompasses social mechanisms, such as emergency response, information dissemination, and community coordination.
Transformation (D2). When the intensity of the flood exceeds the system’s adaptive capacity, the urban system enters the transformation phase. At this stage, the system relies on its recoverability to gradually restore functionality, undergoing a process of learning and enhancement. Rather than merely returning to its original state, the system evolves through adaptive learning, achieving a higher level of resilience. This phase reflects Holling’s concept of the “adaptive cycle,” where the system reorganizes and evolves to a more resilient state after disturbance.

Figure 2.
Mechanisms of Urban Flood Disaster Resilience. Recreated from [30], showing the resilience mechanisms before, during, and after a flood disaster.
2.1. Dynamic Evolution of Resilience Under the DRIRA Model
The DRIRA model (Driving Force-Resistance-Influence-Recoverability-Adaptability) is proposed based on a critical integration of Holling’s Adaptive Cycle theory and Cutter’s Social-Ecological System (SES) Resilience Model. The DRIRA model, based on this theoretical foundation, is specifically designed to address the cascading effects of flood disasters (heavy rainfall → urban inundation → economic losses → policy iterations). It innovatively dissects the resilience process into five interactive mechanisms (Figure 2): Driving Force (D): Represents external climatic pressures (e.g., extreme rainfall frequency). Resistance (Rs): Measures the capacity of infrastructure and emergency response systems. Influence (I): Reflects the cascading impacts of disasters on economic and ecological subsystems. Recoverability (Rc): Represents short-term reconstruction efficiency after disasters. Adaptability (A): Promotes long-term resilience enhancement through policy learning and technological upgrades.
The DRIRA model is closely associated with resilience phases, as shown in Figure 2: Pre-Disaster Phase (t1): The accumulation of driving force (D) (e.g., rainfall intensity) triggers resistance (Rs). If it exceeds the carrying capacity threshold, the system transitions to the disaster adaptation phase (t2). In this phase, temporary flood retention areas (R adjustment) and traffic control (I control) help mitigate impacts. When disaster intensity surpasses the resilience threshold, recoverability (Rc) and adaptability (A) work together, driving the system into the post-disaster transformation phase (D2).
The DRIRA model not only reveals the dynamic mechanisms of resilience but also provides a quantitative tool for policy design: First, Pre-Disaster Early Warning Optimization: By using driving force indicators (e.g., climate prediction data) to identify high-risk periods and proactively enhance resistance capacity. Second, Dynamic Resource Allocation During Disasters: Based on the influence dimension (e.g., real-time monitoring of economic losses), the model dynamically adjusts emergency response priorities. Third, Long-Term Post-Disaster Governance: Using adaptability assessment results (e.g., policy learning index) to plan sponge cities and insurance mechanisms.
2.2. Mechanisms of Urban Resilience Evolution Under Flood Disasters
Figure 2 illustrates the dynamic evolution of urban resilience in the context of flood disasters. Each flood event serves not only as a test of a city’s disaster resistance and recovery capabilities but also as an opportunity for continuous learning and optimization of response strategies. With the accumulation of response experience, urban resilience gradually transitions from “rigid resilience” to “flexible resilience” and ultimately evolves into “adaptive resilience,” reflecting a nonlinear progression from vulnerability to enhanced resilience within the urban system [30]. This evolution encompasses not only the enhancement of physical and infrastructural resilience but also the synergistic improvement of social, economic, and ecological resilience.
3. Methodology
To ensure the integrity and logical coherence of the research framework, this study constructs a multi-stage analytical structure based on the DRIRA model, which includes five dimensions: Driving Force, Resistance, Influence, Recoverability, and Adaptability. First, an indicator system is developed and optimized to reflect the characteristics of flood resilience across these five dimensions. The selection of indicators is based on a literature review and data availability, while correlation analysis is employed to ensure the scientific validity and independence of the selected indicators. Subsequently, the entropy method is applied to assign objective weights, and a comprehensive resilience evaluation model is constructed to quantitatively assess the urban resilience level.
Further, a combination of methods—including the modified gravity model, social network analysis (SNA), backpropagation (BP) neural network, coupling coordination model, and kernel density estimation—is employed to capture spatial distribution patterns, identify network structures, predict resilience evolution trends, and explore influencing mechanisms. Finally, empirical analysis is conducted using multi-source data from the Central Plains Urban Agglomeration to systematically reveal the spatiotemporal evolution and inter-city network structure of flood resilience in the region.
3.1. Establishment of an Indicator System
3.1.1. Preliminary Selection of the Indicator Framework
In the selection of indicator elements, the criteria layer of the indicator system constructed based on the resilience mechanisms of cities utilizes evidence-based social science research methods. A systematic search and selection of relevant existing literature were conducted, adhering to the PRISMA guidelines [31]. This process incorporated indicator systems from authoritative international institutions and literature from scholars regarding resilience city evaluation indicators, combined with actual data from the Central Plains Urban Agglomeration. Each indicator was categorized into five dimensions: driving force, resistance, adaptability, impact, and recovery. A preliminary selection resulted in an urban flood disaster resilience evaluation indicator system comprising 30 indicators, including “average precipitation, vegetation coverage rate, and comprehensive disaster reduction demonstration communities.”
3.1.2. Optimization of Indicators
To construct a streamlined and effective indicator system, a correlation analysis was conducted on the 30 preliminarily selected indicators. Based on the Pearson correlation coefficient, if the correlation between two indicators within the same criterion level exceeded 0.8, the indicator with higher redundancy was removed. For example, within the driving force dimension, the number of heavy rain days (D3) showed moderate or higher correlation with annual precipitation (D2), so D3 was deleted. Accordingly, the final evaluation system comprises 29 indicators, as presented in Table 1.
3.2. Model Construction
3.2.1. Objective Weight Assignment Based on the Entropy Method
“Entropy” originates from a physical term in thermodynamics and was later introduced into information theory by Claude Shannon, the father of information theory. It is now widely applied across various fields. Entropy is defined as a measure of the probability of discrete random events, representing the degree of uncertainty in information across different systems. The higher the order of a system, the lower its information entropy; conversely, the greater the disorder in a system, the higher its information entropy [32]. Thus, information entropy can be viewed as an index of system orderliness, reflecting a system’s capacity to reach its most stable internal state in the absence of external disturbances. The specific steps are as follows:
① Construct the original matrix. Select regions and indicators, where represents the value of the -th indicator for district in year t (where = 1, 2, …, ; = 1, 2, …, ).
② Data normalization.
In Equation (1), the normalized indicator value is denoted as , the original data for the -th indicator in district in year t is represented as , the maximum value of the -th indicator is denoted as max(), and the minimum value is denoted as min().
③ Calculate the indicator weights. Compute the proportion of district for the -th indicator as follows:
④ Calculate the information entropy. Compute the entropy value of the -th indicator as :
⑤ Calculate the coefficient of variation for the -th indicator.
⑥ Calculate the weight value for the -th indicator:
The results of the weight calculations are presented in Table 1. To avoid confusion, Resistance is denoted as Rs, while Recoverability is denoted as Rc throughout the paper. Moreover, indicators under the Impact (I) dimension are originally negative (e.g., disaster losses, casualties). For comparability across dimensions, these indicators are converted into positive ones using min–max normalization, ensuring that higher standardized values consistently indicate higher resilience levels. This technical transformation does not alter their substantive interpretation as losses.

Table 1.
Urban Flood Resilience Evaluation Indicator System.
Table 1.
Urban Flood Resilience Evaluation Indicator System.
| Objective Layer | Criteria Layer | System Layer | Unit | Indicator Attributes | Weight |
|---|---|---|---|---|---|
| Urban flood disaster resilience | Driving force (D) | D1—Annual average temperature [33] | °C | — | 0.0057 |
| D2—Annual rainfall [34] | mm | — | 0.0244 | ||
| D3—Topographic relief degree [35] | ° | — | 0.0186 | ||
| Resistance (Rs) [36,37,38] | R1—GDP per unit area | billion yuan/km2 | + | 0.0729 | |
| R2—Total agricultural output value | billion yuan | + | 0.0457 | ||
| R3—Total industrial output value | billion yuan | + | 0.0652 | ||
| R4—general public budget revenue | billion yuan | + | 0.0857 | ||
| R5—Population density | people/km2 | — | 0.0070 | ||
| R6—Coverage rate of the elderly population | % | — | 0.0077 | ||
| R7—Crop planting area density | Hectares/km2 | — | 0.0173 | ||
| R8—Per capita disposable income of urban and rural residents | yuan/person | + | 0.0327 | ||
| R9—Urban green space area | Hectares | + | 0.0514 | ||
| R10—Water storage per unit area | 10,000 m3/km2 | + | 0.0562 | ||
| R11—Building density | m3/km2 | — | 0.0047 | ||
| R12—Number of mobile phone users at year-end | Ten thousand households | + | 0.0319 | ||
| R13—Road network density | km/km2 | + | 0.0261 | ||
| Impact (I) [39,40] | I1—Direct economic loss | 10,000 yuan | — | 0.0011 | |
| I2—Casualty density | people/km2 | — | 0.0021 | ||
| I3—-Disaster-affected crop area density | % | — | 0.0012 | ||
| Recoverability (Rc) [41,42] | R1—Number of medical staff per ten thousand people | number of people | + | 0.0237 | |
| R3—Number of hospital beds per ten thousand people | people/bed | + | 0.0303 | ||
| R2—Medical coverage rate | % | + | 0.0607 | ||
| R4—Residents’ savings deposit balance | Billion yuan | + | 0.0537 | ||
| R5—Registered unemployment rate | % | — | 0.0082 | ||
| Adaptability (A) [43,44,45,46] | A1—Proportion of social security and employment expenditure | % | + | 0.0269 | |
| A2—Number of educated individuals per ten thousand people | number of people | + | 0.0885 | ||
| A3—Number of integrated disaster reduction demonstration communities | Units | + | 0.0520 | ||
| A4—Proportion of urban construction land | % | + | 0.0794 | ||
| A5—Density of drainage pipes in built-up areas | % | + | 0.0191 |
3.2.2. Comprehensive Evaluation Modeling of Resilience Levels
Based on the connotation of urban flood disaster resilience, this paper delves into and establishes the fundamental framework and principles for the indicator system of urban flood disaster resilience. It proposes a model of Driving Force-Resistance-Adaptation-Recovery-Impact to develop an indicator system that aligns with the current development characteristics of urban flood disaster resilience. As the previous section has already conducted a basic standardization of the data, each component of the urban flood disaster resilience evaluation indicators—driving force resilience level, resistance resilience level, adaptation resilience level, recovery resilience level, and impact resilience level—are all considered positive indicators.
The resilience levels for each criterion layer are as follows:
In the equation, when = 1, represents the level of driving resilience; when = 2, denotes the level of resistance resilience; when = 3, indicates the level of adaptive resilience; when = 4, signifies the level of recovery resilience; and when = 5, represents the level of influential resilience.
The comprehensive resilience level R for urban flood disasters is expressed as follows:
The resilience levels for urban flood disasters are classified based on the resilience level R, encompassing five distinct categories ranging from extremely high to extremely low: extremely high resilience, high resilience, moderate resilience, low resilience, and extremely low resilience, as shown in Table 2.
Table 2.
Classification Standards for Urban Flood Disaster Resilience Levels.
3.3. Methods
To systematically present the overall framework of the research methodology, Figure 3 illustrates the technical pathway for assessing urban flood resilience. The process encompasses key steps including the construction of the indicator system, weight assignment (entropy method), comprehensive evaluation of resilience levels, spatial network analysis (modified gravity model and social network analysis), coupling coordination degree calculation, and kernel density estimation.
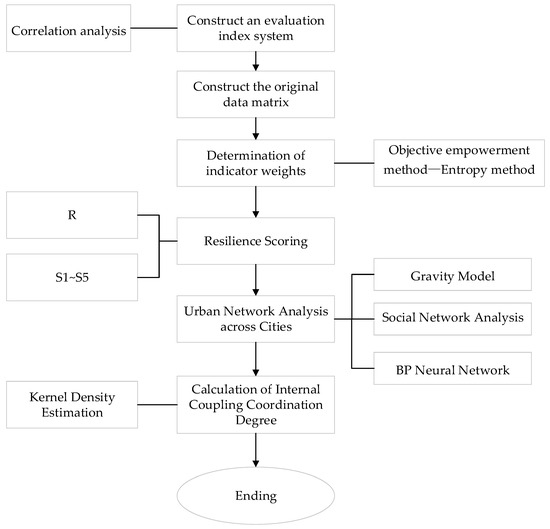
Figure 3.
Flowchart of the assessment method for urban flood resilience.
3.3.1. Modified Gravity Model
The gravity model is derived from the law of universal gravitation in physics and is primarily used to describe the interactions and influences between two spatial entities. The mathematical formulation of the gravity model, as shown in Equation (8), incorporates variables where , represent the masses of the two entities, denotes the spatial distance between them, and is the gravitational constant [47].
Subsequently, this model has been widely adopted across various disciplines, including psychology, economics, sociology, and urban planning. It has demonstrated extensive applicability, particularly in regional economics, where it aims to analyze the mutual influences and mechanisms of economic and social activities within geographical spaces. Through continuous exploration and refinement in the academic community, the gravity model has undergone multiple modifications, expanding its applications to areas such as geographical economic connections, spatial mobility, interrelations among urban networks, and the evolution of spatial structures, resulting in significant scholarly contributions.
Research has indicated that geographical distance constraints affect spatial associations, leading to distance decay [48]. Therefore, regarding the spatial correlations of urban flood disaster resilience, if both cities have high levels of resilience, the connectivity between them will be stronger, thereby enhancing their overall resistance to urban flood disaster risks. Consequently, building upon the work of related scholars, this study proposes a modified gravity model, which is specified as follows [49,50]:
In the equation, and represent the levels of urban flood disaster resilience development for cities and , respectively, which can be calculated using the entropy method. The distance between cities and is denoted as , where the shortest road distance obtained from Gaode Map is used for measurement, and is the friction coefficient, typically set to 2. The spatial connectivity matrix for intercity flood disaster resilience development must be processed to derive meaningful relationships. The average value of each row serves as the threshold for that row; values above the threshold are recorded as 1, indicating a relationship in the development of flood disaster resilience levels between the two cities. Conversely, values below the threshold are recorded as 0, signifying no relationship in the development of flood disaster resilience levels between the two cities.
It is important to note that this study adopts inter-city geographical distance as the fundamental decay factor in the gravity model to measure the resilience linkage strength based on spatial proximity. Although the occurrence and impacts of flood disasters exhibit significant spatial heterogeneity—being strongly influenced by factors such as precipitation intensity and geomorphology, which may lead to substantial differences in disaster risks and resilience levels even between neighboring cities—geographical distance remains a fundamental determinant of inter-city resource collaboration, emergency response efficiency, and transportation accessibility. Therefore, distance serves as a basic indicator for characterizing the spatial structure of resilience networks. However, employing geographical distance as the sole decay factor in the gravity model inevitably assumes spatial homogeneity and overlooks the resilience disparities arising from natural factors such as topographic barriers and precipitation variability. This constitutes a key limitation of the current approach. Future studies should consider integrating factors like terrain impedance and spatial correlation of precipitation to refine the model, thereby enhancing the accuracy and representativeness of resilience network construction.
3.3.2. Social Network Analysis
Social network analysis has been improved and optimized based on network space. This method primarily examines social networks from the perspectives of relational structures and attributes, exploring the spatial associations and structural properties of social networks through the construction of social relationship matrices [51,52]. In light of this, the present study employs social network analysis to examine the structural characteristics of the flood disaster resilience network within the Central Plains Urban Agglomeration. Specifically, the overall network characteristics are mainly represented by three indicators: network density, network centrality, and clustering coefficient, to identify the “influential cities” within the Central Plains Urban Agglomeration. “Influential cities” refer to cities that have a significant positive impact on other cities within the urban resilience network. These cities usually exhibit strong disaster resistance and recovery capabilities in terms of economy, society, or infrastructure. Among these indicators, network density reveals the closeness of connections among all nodes within the network. Its calculation formula is:
In the equation, represents network density, denotes the number of actual connections, and indicates the total number of members within the network.
Network centrality is an indicator used to assess the overall cohesion or integration of the network. It is derived by calculating the total difference between the centrality of actual core nodes and other nodes, compared to the maximum possible difference.
Network clustering measures the degree of mutual reachability among nodes within the network, reflecting the network’s stability and vulnerability. The calculation formula is as follows:
In the equation, represents the clustering coefficient of the network, denotes the number of unreachable members within the network, and indicates the total number of members in the network.
3.3.3. BP Neural Network
The Back Propagation (BP) neural network is a type of feedforward neural network that utilizes a forward propagation and backward adjustment mechanism to iteratively optimize internal parameters in order to achieve learning objectives. The training process primarily involves two stages: first, the input signals are propagated forward, and then the error between the predicted outcomes and the actual results is used to adjust the network’s weights and thresholds in a backward manner. This network typically comprises three main components: an input layer, a hidden layer, and an output layer, as illustrated in Figure 4.
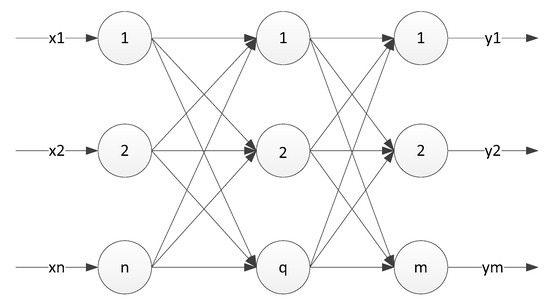
Figure 4.
Topology of the BP Neural Network Structure.
The specific structure of the BP neural network model is illustrated in Figure 5. In this model, the evaluation indicators for flood disaster resilience levels serve as the input (input) neurons, with = 29. There is only one evaluation result, so the number of nodes in the output layer (far right) is = 1. The number of neurons in the hidden layer does not have a standardized solution; typically, it draws on previous design experiences, with the number of hidden layer nodes ranging from 5 to 15 [53].
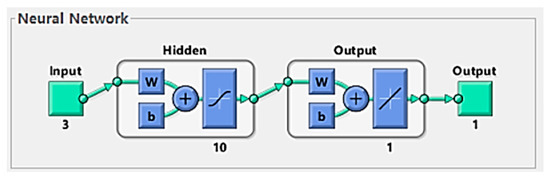
Figure 5.
Schematic Diagram of the BP Neural Network Structure.
Using the BP neural network to predict the flood disaster resilience of the Central Plains Urban Agglomeration involves treating the mapping from the input layer to the output layer as a highly nonlinear state. Signals pass from the input layer through the hidden layer to the output layer. If the results obtained differ from the expected values, backward propagation can be performed to continually adjust the weights and thresholds of the neurons in each layer, minimizing the final output error. This study selects the BP neural network as the prediction model, primarily due to its ability to capture complex nonlinear relationships. Flood resilience assessment involves multiple dimensions, including social, economic, infrastructure, and ecological variables, which exhibit highly nonlinear interactions. The BP neural network can automatically learn and fit these complex relationships.
3.3.4. Coupling Coordination Model
Coupling is fundamentally a term from physics. According to the Modern Chinese Dictionary, coupling refers to the phenomenon where two or more systems or forms of motion influence each other through interaction, achieving a unified state. This concept reveals the degree of closeness in their relationship [54]. The various dimensions of urban flood disaster resilience exhibit a nonlinear relationship; therefore, this study adopts relevant coupling coordination models to investigate the coordination among the five dimensions of urban flood disaster resilience.
(1) Coupling Degree . The coupling degree describes the extent of interaction and influence between two or more systems, illustrating the dynamic relationships in the process of achieving coordinated development. It is used to measure the degree of dependence and constraints among systems. By calculating the coupling degree, the strength of interactions between systems can be quantified. The specific calculation formula is as follows:
In the equation, represents the coupling degree, with a larger indicating stronger interactions between systems. , , , , and correspond to driving force, resistance, impact, recoverability, and adaptability, respectively.
(2) Coordination Index . While the coupling degree reflects the extent of mutual influence between systems, it does not adequately capture the synergistic effects among them. Relying solely on the coupling degree may lead to misleading evaluations of the coordination level. Therefore, to more scientifically assess the coordination of urban flood disaster resilience in the Central Plains urban agglomeration, an optimization of the dual and coordination models has been performed, with the specific formulas detailed as follows:
In the equation, denotes the coordination index, which measures the degree of positive coupling within the coupling relationship, reflecting the quality of the coordination state among various systems and indicating the synergistic effects between them. , , , , represent the coefficients for the five sub-dimensions: driving force, resistance, impact, recoverability, and adaptability, with their sum equal to 1. Based on relevant studies [55], this paper posits that the five sub-dimensions are of equal importance, and thus the coefficients , , , , and are assigned a value of 1/5.
(3) Coupling Coordination Degree . The coupling coordination degree reflects the development of the coupling and coordination between subsystems, and the specific formula is as follows:
In the equation, represents the coupling coordination degree, with ∈ [0, 1]. A larger indicates a higher level of coordination between systems. Through the analysis of the coupling coordination degree , it is categorized into ten levels [56], as detailed in Table 3.
Table 3.
Classification of Coupling Coordination Degree Levels for Urban Flood Disasters in the Central Plains Urban Agglomeration.
3.3.5. Kernel Density Estimation Method
Kernel density estimation is a non-parametric statistical method used to estimate the probability density function of a random variable. It estimates the shape and distribution characteristics of the probability density function by applying a kernel function to the regions surrounding the sample data points. Kernel density estimation is widely utilized in fields such as data analysis, pattern recognition, and signal processing. In this study, the Gaussian kernel function is selected for the kernel density estimation:
In the equation, represents the kernel density function of the random variable , while is the kernel function, with denoting the coupling coordination degree of each city’s sub-dimension. The symbol represents the mean, is the number of observations, and is the bandwidth. The bandwidth determines the width of the kernel function, which affects the influence range of the kernel function on the data points. A smaller bandwidth results in a sharper estimated density function, whereas a larger bandwidth produces a smoother estimated density function.
In order to apply the above methods, the study area and data sources are introduced as follows.
3.4. Study Area and Data Sources
3.4.1. Central Plains Urban Agglomeration Scope
The administrative divisions of the Central Plains Urban Agglomeration are as follows: The Zhengzhou Metropolitan Area includes Zhengzhou City, Xinxiang City, Xuchang City, Kaifeng City, and Jiaozuo City, encompassing a total of five prefecture-level cities. The core development zone consists of Pingdingshan City, Luohe City, Luoyang City, Zhoukou City, Jiyuan City, Shangqiu City, and Hebi City in Henan Province, as well as Jincheng City in Shanxi Province and Bozhou City in Anhui Province, totaling nine prefecture-level cities. The linked radiation zone includes Sanmenxia City, Anyang City, Nanyang City, Puyang City, Zhumadian City, and Xinyang City in Henan Province; Xingtai City and Handan City in Hebei Province; Yuncheng City and Changzhi City in Shanxi Province; Huaibei City, Fuyang City, Suzhou City, and Bengbu City in Anhui Province; as well as Liaocheng City and Heze City in Shandong Province, amounting to a total of sixteen prefecture-level cities. The administrative division map is shown in Figure 6.
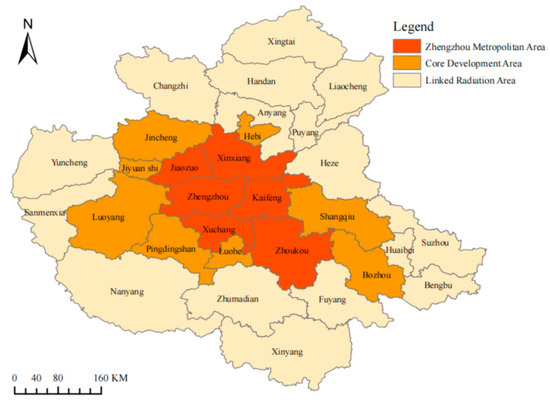
Figure 6.
Distribution of Administrative Areas in the Central Plains Urban Agglomeration.
This study focuses on the Central Plains Urban Agglomeration, characterized by several distinctive features. First, it has a high economic and population density. The Central Plains Urban Agglomeration is one of the economically developed regions in China, ranking among the top urban agglomerations in terms of total economic output. With a population exceeding 160 million, it is one of the largest urban agglomerations by population in China. Consequently, the impact of flood disasters on local populations, property, and infrastructure is particularly significant, making the study of flood disasters in this region of considerable practical importance.
Second, the area exhibits rich and complex topography. The Central Plains Urban Agglomeration encompasses various geomorphological types, including mountains, hills, plateaus, and plains. It is situated in a transitional zone between the second and third geomorphological steps, characterized by complex geological structures and significant topographical variations. This diverse terrain results in a variety of hydrogeological conditions that have a critical influence on the occurrence and evolution of flood disasters.
Third, the region experiences frequent flood disasters. The geographical location and climatic conditions of the Central Plains Urban Agglomeration render it susceptible to flooding. In 2020, flood disasters accounted for the most severe losses among all natural disasters in Henan Province, with floods representing the highest proportion of occurrences at 25%. The heavy rainfall in Henan in 2021 was a rare event for the region; however, it was not the first instance of flooding. The combination of frequent rainfall and the region’s topographical characteristics contributes to a high risk of flood disasters, necessitating significant attention and in-depth research.
3.4.2. Data Sources
Based on the established evaluation index system for urban flood disaster resilience in the Central Plains Urban Agglomeration, and considering the availability, authenticity, and completeness of the data, this study selects the years 2012 to 2021 for analysis. The data sources include the “China Urban Statistical Yearbook” (2012–2021), “The Henan Statistical Yearbook” (2012–2021), “The Shanxi Statistical Yearbook” (2012–2021), “The Hebei Statistical Yearbook” (2012–2021), “The Shandong Statistical Yearbook” (2012–2021), “The Anhui Statistical Yearbook” (2012–2021), as well as statistical yearbooks from various cities in Henan, Shanxi, Hebei, Anhui, and Shandong provinces, national economic and social development statistical bulletins, government work reports, meteorological data websites of the cities, and open-source geographic data websites. A small amount of additional data was obtained from local chronicles and the “National Economic and Social Development Statistical Bulletin” of the five provinces in the Central Plains Urban Agglomeration. Furthermore, some data were extracted using remote sensing imagery with ArcGIS 10.2 and gathered from official online media sources.
The relevant indicators involve economic data. To eliminate the impact of inflation, the economic data were adjusted for inflation. For the missing data in certain years, the adjacent year mean method and trend extrapolation were employed to fill in the gaps. To eliminate dimensional differences among the data, this study applied differential standardization to normalize the original data. The specific calculation steps are detailed in Formula (2).
4. Results and Discussion
4.1. Comprehensive Evaluation of Flood Disaster Resilience Levels
This section utilizes the entropy method to conduct a comprehensive evaluation of the flood disaster resilience levels in the Central Plains Urban Agglomeration. By applying Formulas (2)–(8), the assessment results for , , , , , and R for the 30 prefecture-level cities in the Central Plains from 2012 to 2021 were obtained. Based on these results, an analysis of the overall flood disaster resilience level, temporal evolution, and spatial variation in the Central Plains Urban Agglomeration is conducted. The specific results are analyzed as follows.
4.1.1. Temporal Evolution
From an overall developmental trend perspective, the resilience level of flood disasters in the Central Plains Urban Agglomeration exhibited an upward trajectory from 2012 to 2021, increasing from 0.199 in 2012 to 0.2696 in 2021, representing a growth of 35.5% (as shown in Figure 7). This indicates a transition of the overall resilience level from a low-resilience classification to a moderate-resilience classification. The continuous improvement in flood disaster resilience in the Central Plains Urban Agglomeration can be attributed to the ongoing socio-economic development and the emphasis on enhancing disaster management capabilities over the past decade, as well as the implementation of high-quality urban development policies. Comparing the average resilience scores across five dimensions reveals the following hierarchy: overall resilience > resistance resilience > adaptive resilience > recovery resilience > driving resilience > impact resilience. This pattern highlights the close relationship between the overall resilience enhancement of the urban agglomeration and the resilience, recovery capacity, and adaptability of urban systems. Although driving and impact factors exert direct negative effects on urban flood disaster resilience, their trends contrast sharply with the overall resilience score trends. The adverse impacts of flood disasters on urban systems are insufficient to undermine the development of urban resilience. Over the past decade, both adaptability and recoverability have steadily improved, indicating that positive results have been achieved across regions in terms of policy guidance and infrastructure development. In contrast, the impact indicator has shown significant fluctuations, suggesting that changes in the external environment continue to exert strong disturbances on urban resilience. Therefore, to enhance urban flood disaster resilience, it is crucial to focus on strengthening the inherent resistance, recovery, and adaptability levels of urban systems.
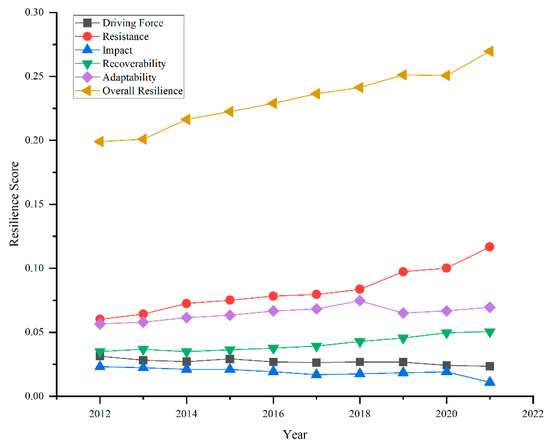
Figure 7.
Evolution of Resilience Across Sub-Dimensions in the Central Plains Urban Agglomeration.
Although this study adopts the entropy weight method for indicator weighting, resulting in relatively higher weights assigned to economic income, infrastructure, and social security indicators, this does not imply a diminished role of natural factors in resilience building. Due to the limited spatial variability of natural factors such as topographic relief and annual precipitation within the Central Plains Urban Agglomeration, their information entropy contribution is relatively low, leading to smaller weights in the entropy-based calculation. However, from the perspective of the underlying mechanisms of flood risk identification and resilience enhancement, natural factors remain critically important. Specifically, topographic relief directly influences surface runoff convergence and the spatial distribution of flood-prone areas, serving as a key basis for spatial risk identification and flood prevention in urban settings. Annual precipitation reflects the frequency and intensity of regional extreme rainfall events, providing fundamental support for indicators related to the “resistance” and “adaptation” phases of resilience assessment. Moreover, land use changes and the expansion of impervious surfaces are closely linked to natural factors, constituting important variables that shape the dynamic evolution of urban resilience. Therefore, despite their lower weights in model calculations, natural elements such as topography and hydrology should be given due attention in practical strategies for resilience enhancement, particularly in the governance and optimization of these foundational environmental factors.
The results of this study indicate that from 2012 to 2021, the overall flood resilience of the Central Plains urban agglomeration has shown a steady upward trend. However, this improvement is primarily relative to past historical baselines. Against the backdrop of global climate warming, the frequency and intensity of extreme precipitation events are expected to increase significantly, leading to heightened flood risks for cities. Under such a trend, the current level of resilience may still be insufficient to effectively cope with more frequent or more severe flood impacts—especially in the face of compound, recurrent, or unprecedented extreme disasters, urban systems remain vulnerable. Therefore, flood resilience assessment should not only focus on current trends but also incorporate future climate change scenarios through contextualized simulations and stress testing, in order to comprehensively evaluate cities’ adaptive capacity and systemic stability under extreme events.
4.1.2. Spatial Evolution
As shown in Figure 8, the spatial differentiation and evolution characteristics of flood disaster resilience levels in the Central Plains Urban Agglomeration are as follows: The “High-Low” categories were determined using the Natural Breaks method, which automatically sets thresholds based on data distribution, effectively revealing the spatial differences in flood resilience: Overall, the resilience levels of urban flood disasters tend to decrease from Zhengzhou to the surrounding areas. High-resilience cities are primarily concentrated in the Zhengzhou metropolitan area and the Luoyang urban agglomeration. This phenomenon can be attributed to Zhengzhou being the political and economic center of Henan Province, while Luoyang serves as a secondary center within the Central Plains Urban Agglomeration. Both cities have adopted complementary development strategies. Zhengzhou not only functions as the administrative center of the province but is also designated as a national-level central city, striving to become the regional economic core, a leading manufacturing base, a critical transportation hub, and an international cultural exchange platform. Thanks to its advantages in economic scale, structure, and innovation capacity, Zhengzhou and its neighboring cities have a more solid foundation for enhancing their flood disaster response capabilities. Over time, the number of cities with moderate resilience levels has gradually increased, while those with low and very low resilience levels have decreased. This trend indicates that the spatial differentiation pattern of urban flood disaster resilience in the Central Plains Urban Agglomeration is evolving toward a more balanced regional development. Overall, there is a growing trend in the resilience levels of cities within the Central Plains Urban Agglomeration. Overall, a “core-periphery” polarization pattern is observed. Zhengzhou, benefiting from the sponge city pilot program and favorable policy support, exhibits significantly higher resilience compared to surrounding areas. In contrast, peripheral cities face constraints in resilience improvement due to insufficient fiscal investment and lagging infrastructure development.
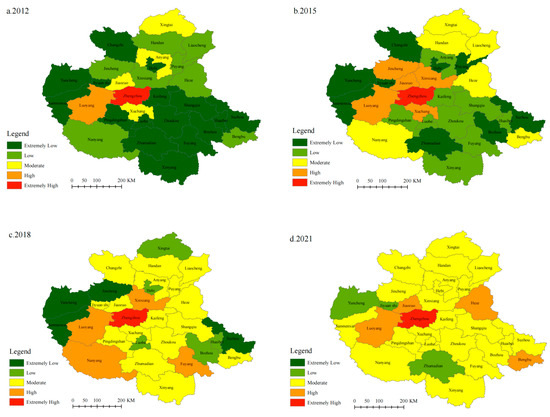
Figure 8.
Evolution of the Spatial Differentiation Pattern of Flood Disaster Resilience in the Central Plains Urban Agglomeration.
It is noteworthy that during the observation period from 2012 to 2021, the overall resilience of certain cities did not exhibit a linear upward trend; instead, some experienced notable declines or temporary regressions. Cities such as Xinxiang, Xuchang, Jiaozuo, Jincheng, and Nanyang showed significant drops in resilience levels in specific years, highlighting critical shortcomings in coping with extreme climatic shocks and in adapting urban systems. This trend likely reflects the interplay of multiple contributing factors. First, the lag in infrastructure investment and maintenance mechanisms, coupled with rapid urban expansion and high-intensity land development, has diminished natural rainwater retention spaces, thereby exacerbating flood risks. Meanwhile, the construction of drainage and flood control infrastructure has failed to keep pace, resulting in decreased indicators of resistance and recovery capacity. Second, in post-disaster governance, there is an overreliance on fiscal subsidies without adequate market-based mechanisms to complement recovery efforts. Moreover, these cities often prioritize physical reconstruction over institutional reform, lacking long-term capacity-building for adaptive governance. This imbalance has hindered improvements in recovery and adaptive capacities. Third, deficiencies in regional coordination mechanisms further compound the issue. Peripheral cities have struggled to integrate effectively into regional disaster prevention and mitigation frameworks, thereby missing out on critical external support resources. Thus, the differentiated evolution of urban flood resilience is not merely a reflection of engineering capabilities but is deeply rooted in outdated planning paradigms, institutional shortcomings, and the uneven allocation of governance resources. Enhancing urban resilience should not be confined to the question of “what to build,” but rather focus on “how to govern”—achieved through conceptual innovation, institutional synergy, and systemic mechanism reform to realize a comprehensive and transformative upgrade.
4.2. Simulation and Prediction of Flood Disaster Resilience
4.2.1. Prediction Results
Based on the comprehensive resilience values and average values of the 30 prefecture-level cities in the Central Plains Urban Agglomeration from 2012 to 2021, a BP neural network model was developed to predict the flood disaster resilience levels for the historical period of 2015 to 2021 and the future period from 2022 to 2026.
This study utilized the MATLAB R2019a platform to conduct neural network experiments, setting a target minimum error of 0.001, a learning rate of 0.01, and a maximum training step of 1000. Preliminary training was performed on the selected samples to determine the optimal number of hidden layer neurons, which was found to be 5 for this training session. The results of the BP neural network training, as shown in Figure 9 and Figure 10, indicate a small error between predicted values and actual values, demonstrating good fitting quality. The overall mean squared error (MSE) of the flood disaster resilience levels in the Central Plains Urban Agglomeration was calculated as MSE = 0.000000548, with a correlation coefficient (R) of 0.98636, indicating that the model achieved a good level of optimization.
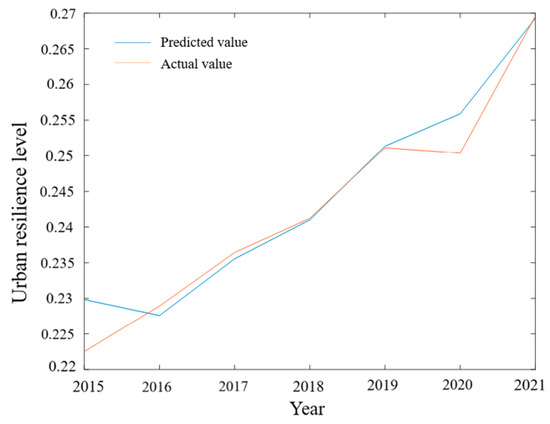
Figure 9.
Comparison of Predicted Values and Actual Values in the BP Neural Network Training Set.
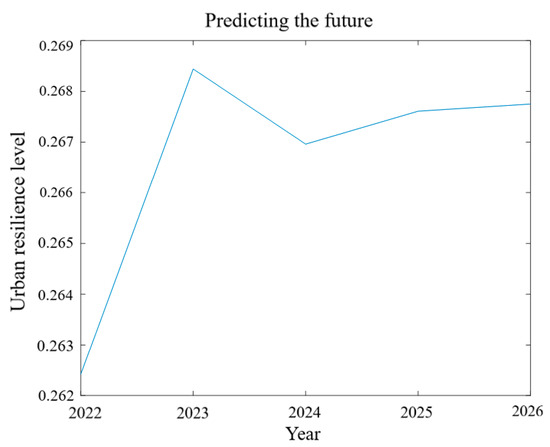
Figure 10.
Prediction Results of Urban Flood Disaster Resilience Levels.
Consequently, the results of the flood disaster resilience level prediction model for the Central Plains Urban Agglomeration are presented in Table 4, while the predicted values and their descriptive statistics can be found in Table 5 and Table 6. However, it should be noted that under the current short historical sequence and the goal-oriented input setting, the advantages of the BP neural network may not be fully demonstrated. When longer historical records become available, its predictive performance is expected to be more pronounced. To further enhance the interpretability of the model, we conducted a permutation importance analysis. The results show that several socio-technical indicators play particularly significant roles in shaping the forecasts and composite scores, with GDP per unit area (R1), residents’ savings deposit balance (R4), and density of drainage pipes in built-up areas (A5) ranking highest (Figure 11). This suggests that these factors represent the key policy levers for improving urban flood resilience. In addition, we performed a ±10% sensitivity analysis to verify the robustness of the results. The outcomes, presented in Supplementary Figure S1, indicate that resilience rankings are sensitive to perturbations in key indicators, further confirming the interpretability and policy relevance of the model outputs.
Table 4.
Verification Results of the Flood Disaster Resilience Level Prediction Model for the Central Plains Urban Agglomeration.
Table 5.
Forecast of Urban Flood Disaster Resilience Levels in the Central Plains Urban Agglomeration from 2022 to 2026.
Table 6.
Descriptive Statistics of Forecast Values for Urban Flood Disaster Resilience in the Central Plains Urban Agglomeration from 2022 to 2026.
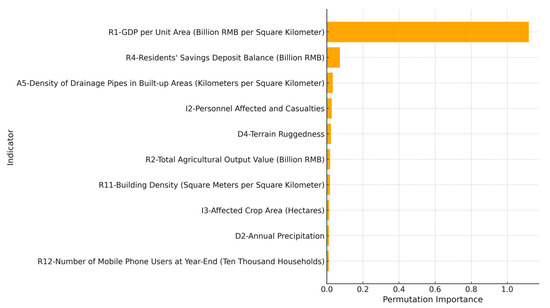
Figure 11.
Top-10 indicator importance based on permutation importance analysis.
4.2.2. Trend Analysis of Predictions
Based on the predicted resilience levels for the Central Plains Urban Agglomeration over the next five years (2022–2026) (see Table 5) and the descriptive analysis of the predicted values (see Table 6), the results indicate that, overall, the region exhibits a slight upward trend during the assessment period; however, the rate of growth is gradually slowing, and the overall resilience level remains relatively low. Overall, a “core-periphery” polarization pattern is observed. Zhengzhou, benefiting from the sponge city pilot program and favorable policy support, exhibits significantly higher resilience compared to surrounding areas. In contrast, peripheral cities face constraints in resilience improvement due to insufficient fiscal investment and lagging infrastructure development. The average resilience levels for urban flood disasters over the next five years are projected to be 0.2624, 0.2684, 0.2670, 0.2676, and 0.2678, respectively. During the period from 2022 to 2023, the resilience level for urban flood disasters increased slightly from 0.2624 to 0.2684. Although the growth is limited, the city’s resilience is gradually improving, indicating that the ability to respond to flood disasters is in a phase of enhancement, moving toward a better state. After 2023, the growth rate of resilience has slowed down, reflecting insufficient adaptive capacity in some cities (e.g., post-disaster recovery funding gaps, lag in policy learning), indicating the need for targeted interventions (as shown in Figure 10). In the subsequent years from 2024 to 2026, although the resilience level rises slightly from 0.2670 to 0.2678, indicating a degree of resilience enhancement, this increase primarily reflects a trend of stable development. To ensure the continuous improvement of urban resilience across various dimensions, future efforts should focus on strengthening disaster resistance capabilities in social systems, infrastructure construction, ecological environment protection, and economic development. This multifaceted approach will promote the overall resilience of cities in better resisting flood disasters.
By predicting the flood disaster resilience values for the Central Plains Urban Agglomeration from 2022 to 2026, the calculated standard deviations are 0.0943 (2022), 0.0929 (2023), 0.0896 (2024), 0.0903 (2025), and 0.0892 (2026) (see Table 6). The standard deviations are all below 0.1, indicating a lack of continuity in the performance of urban flood disaster resilience within the Central Plains Urban Agglomeration and suggesting that the overall level is relatively low. This highlights the disparities among cities in their capacity to respond to flood disasters, emphasizing the individualized characteristics in resilience building across the region. The coefficient of variation for the urban flood disaster resilience values is 0.3717 (2022), 0.3484 (2023), 0.3315 (2024), 0.3416 (2025), and 0.3125 (2026). The decrease from 0.3717 in 2022 to 0.3315 in 2024 indicates a gradual reduction in spatial distribution differences among cities in the Central Plains Urban Agglomeration. This value then increases to 0.3416 in 2025 before declining again to 0.3125 in 2026. Despite this fluctuation, the overall trend remains a decline compared to 2022, reflecting a 19% reduction by 2026. This suggests that over the next five years, the spatial distribution disparities among cities in the Central Plains Urban Agglomeration will gradually diminish, moving towards a more stable development model.
4.3. Network Association Analysis of Resilience to Flood Disasters
Based on the previous evaluation of the flood disaster resilience of each city, the intercity connectivity matrix was calculated using the gravity model Formula (9). The social network analysis (SNA) Formulas (11) and (12) were then applied, and the overall structural characteristics of the network for the Central Plains urban agglomeration in 2012, 2015, 2018, and 2021 were analyzed using UCINET software. The results are presented in Table 7. To provide a clearer illustration of the flood disaster resilience network connectivity among the 30 cities in the Central Plains urban agglomeration, the network evolution diagrams for the years 2012, 2015, 2018, and 2021 were drawn using the NetDraw tool, as shown in Figure 10, Figure 11, Figure 12 and Figure 13.
Table 7.
Calculation Results of the Overall Network Structure of Flood Disaster Resilience in the Central Plains Urban Agglomeration.
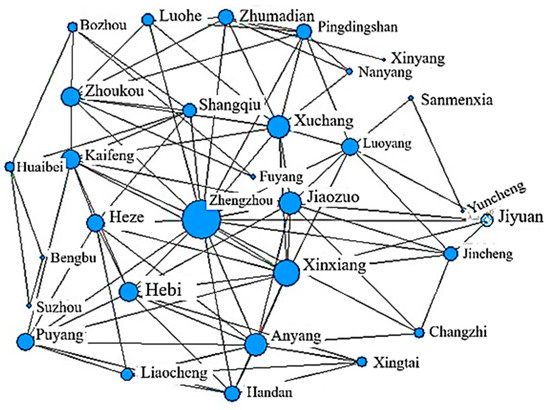
Figure 12.
Evolution of the Flood Disaster Resilience Network Connectivity in the Central Plains Urban Agglomeration (2012).
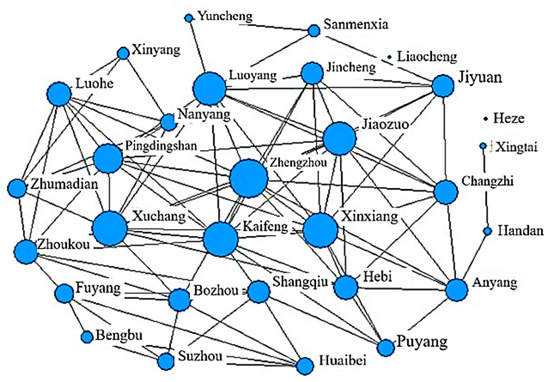
Figure 13.
Evolution of the Flood Disaster Resilience Network Connectivity in the Central Plains Urban Agglomeration (2015).
From Table 7, it can be observed that the network density of cities in the Central Plains Urban Agglomeration exhibited a trend of first increasing and then decreasing from 2012 to 2021. Specifically, it rose from 0.2149 in 2012 to 0.2299 in 2018, which to some extent indicates that cooperation and resource flow related to flood disaster management between cities gradually increased during this period. This suggests that special attention needs to be paid to potential spillover effects when enhancing urban flood disaster resilience. However, in 2021, the network density decreased to 0.2184. A possible reason for this decline could be the initiation of the Central Plains Urban Agglomeration Development Plan in 2016. This policy shift led to the gradual establishment of a collaborative development model between cities, which improved regional accessibility to some extent. Nevertheless, due to the time lag in policy effects, the changes in the overall characteristics of the flood disaster resilience network across the urban agglomeration were not fully realized by 2021. Overall, this trend suggests that the intercity resilience communication and collaboration in the Central Plains Urban Agglomeration are moving towards a positive and sustainable development trajectory.
Using the NetDraw tool in UCINET software, the network structure of flood disaster resilience connectivity in the Central Plains Urban Agglomeration was mapped (Figure 12, Figure 13, Figure 14 and Figure 15). The results indicate that the Central Plains Urban Agglomeration exhibits a complex and multi-threaded network structure in terms of flood disaster resilience, with increasing interactions between non-adjacent cities. However, the network has not yet achieved a fully interconnected state among the cities. Based on the analysis of network density values, it was observed that the economic connectivity network in 2012 was relatively loose compared to the networks in 2015, 2018, and 2021. In the figures, circles represent the network density attribute, with larger circles indicating cities that are more tightly connected to their surrounding areas. In the spatial network of flood disaster resilience development across the Central Plains Urban Agglomeration, the Zhengzhou metropolitan area plays a prominent structural role. Thanks to its advantageous geographical position, Zhengzhou has not only facilitated the exchange of information between cities but also established effective collaboration mechanisms with neighboring cities, thereby promoting the development of the entire urban agglomeration. From a macro perspective, the spatial connectivity structure of flood disaster resilience across cities in the Central Plains Urban Agglomeration has become more complex and robust. Key nodes such as Zhengzhou, Luoyang, Xuchang, Jiaozuo, and Xinxiang play pivotal roles. Through spatial agglomeration and diffusion effects, these cities have exerted significant influence on surrounding and peripheral cities. Based on Social Network Analysis (SNA), this study identified the “influencer cities” within the Central Plains Urban Agglomeration, including Zhengzhou and Luoyang. These cities exhibit high centrality in the resilience network, indicating their significant influence on other cities in the region.
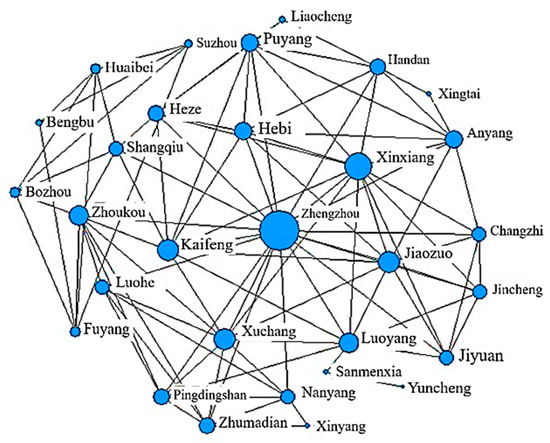
Figure 14.
Evolution of the Flood Disaster Resilience Network Connectivity in the Central Plains Urban Agglomeration (2018).
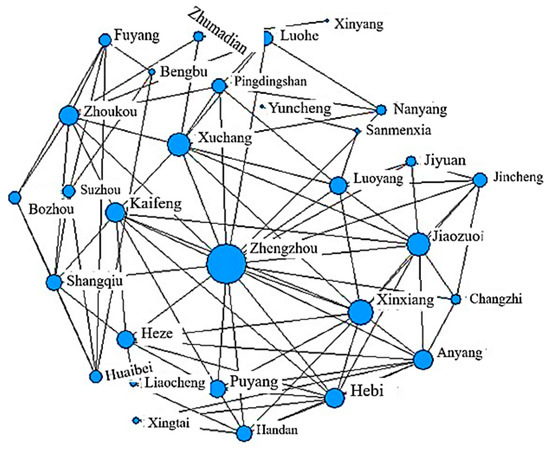
Figure 15.
Evolution of the Flood Disaster Resilience Network Connectivity in the Central Plains Urban Agglomeration (2021).
4.4. Analysis of Coupling Coordination of Flood Disaster Resilience
The sub-dimensions of urban flood disaster resilience—driving force resistance, impact, recoverability, and adaptability—interact, promote, and constrain each other, forming a typical coupled relationship. These dimensions exhibit a nonlinear interrelationship. Therefore, this section employs the coupling coordination degree model Equations (12)–(14) to explore the coordinated development level among the five dimensions of urban flood disaster resilience in the Central Plains Urban Agglomeration, based on the resilience assessments of drivability, resistance, impact, recovery, and adaptability from 2012 to 2021.
Overall, from 2012 to 2021, the coupling coordination level of the flood disaster resilience dimensions in the Central Plains Urban Agglomeration exhibited a fluctuating upward trend, as shown in Figure 16. The coupling degree consistently remained higher than the coordination degree, and the gap between the two gradually narrowed, indicating an enhancement in overall cooperation and a trend toward positive development. The coupling degree (C) ranged from a maximum of 0.919 to a minimum of 0.172, experiencing three declines, but the overall impact was minimal, reflecting the increasing interconnection among the driving force, resistance, impact, recoverability, and adaptability dimensions. The variation in the coordination degree (T) followed a similar pattern to the coupling degree, with C decreasing and T increasing from 2020 onward. This suggests a weakening of the interactions between the five dimensions; however, the national investments in flood disaster management and improvements in infrastructure have strengthened urban resistance and recovery capabilities, thereby verifying the enhancement of the synergistic effects. Overall, the coupling coordination degree (D) increased from 0.263 to 0.669, representing a 154% growth, demonstrating a strengthening of the synergistic effects between the sub-dimensions. This shift indicates a gradual adjustment from moderate disequilibrium in 2012 to a state of marginal coordination. The coupling coordination degree between the sub-dimensions of urban flood disaster resilience has had a certain impact on the overall resilience level. From the evolution of the Central Plains Urban Agglomeration’s flood disaster resilience (Figure 7), it can be seen that the years with smaller increases were 2013, 2018, and 2021. In contrast, the degree of coupling coordination declined in 2014, 2017, and 2021.
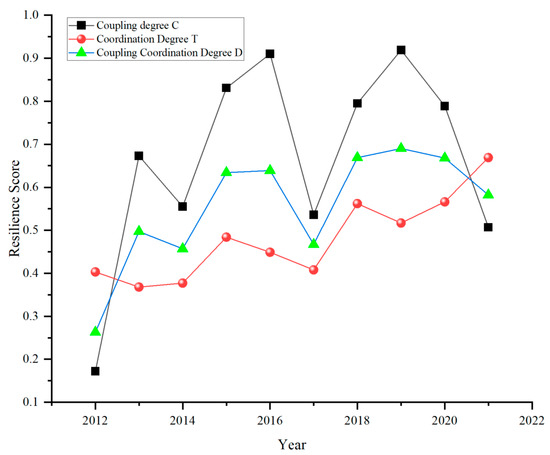
Figure 16.
Trend of Coupling Coordination Degree of Flood Disaster Resilience in the Central Plains Urban Agglomeration (2012–2021).
To more intuitively reflect the coupling coordination levels of flood disaster resilience across cities, the coupling coordination degree of 30 cities in the Central Plains Urban Agglomeration was classified for the years 2012, 2015, 2018, and 2021 using ArcGIS 10.8 software, as shown in Figure 17.
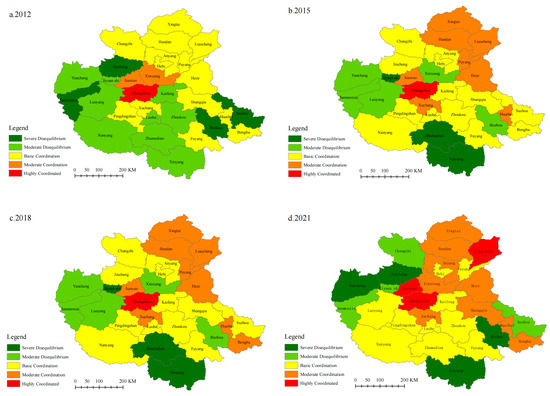
Figure 17.
Spatial Evolution and Differentiation Map of the Coupling and Coordination Degree Among Sub-dimensions of Flood Resilience in Cities of the Central Plains Urban Agglomeration.
The coupling and coordination of flood resilience in 30 cities of the Central Plains Urban Agglomeration across four key years exhibit a spatial distribution pattern of “high in the center, low at the periphery,” which is consistent with the distribution of flood resilience levels. This disparity is primarily driven by factors such as the cities’ natural conditions, development stages, and policy orientations. As the provincial capital, Zhengzhou possesses significant advantages in terms of economy, social security, and infrastructure, contributing to stronger flood resilience. Through spillover effects, Zhengzhou has driven the enhancement of resilience in surrounding cities such as Xuchang, Kaifeng, and Jiaozuo. These cities generally exhibit good coupling and coordination, focusing on high-quality development, optimizing functional layouts, accelerating industrial structure upgrades, and improving public service facilities and information networks. At the same time, they have prioritized strengthening their ability to respond to flood risks. For instance, in 2016, Zhengzhou implemented the “sponge city” concept, becoming a pilot for the province, which promoted the construction of a regional sponge city policy and management system. This initiative has set a model for regional development in the Central Plains, exploring new pathways for the area’s growth.
In contrast, peripheral cities such as Zhumadian, Xinyang, and Jiyuan exhibit lower resilience levels due to insufficient infrastructure, distance from central cities, and limitations on urbanization progress caused by natural conditions and economic structure. Consequently, their flood resilience coupling and coordination are relatively weak. Overall, the flood resilience in the Central Plains Urban Agglomeration presents a pattern of “prominent in the center, declining at the periphery.”
To visually and intuitively present the development level, distribution dynamics, extensibility, and polarization trends of the flood resilience coupling and coordination degree in the Central Plains Urban Agglomeration, this study depicts the three-dimensional dynamic Kernel density of flood resilience coupling and coordination degree in the region, as shown in Figure 18 and Figure 19.
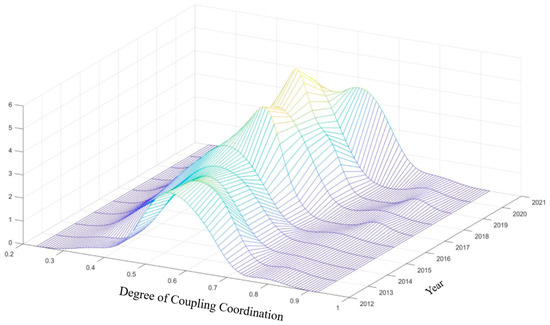
Figure 18.
Kernel Density Plot of the Coupling and Coordination Degree Between Sub-dimensions of Urban Flood Resilience in the Central Plains Urban Agglomeration.
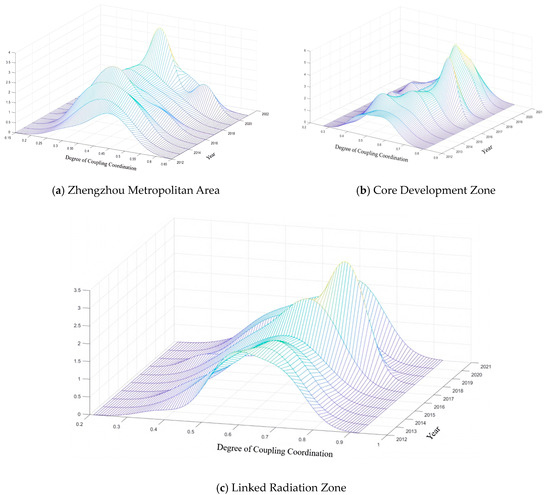
Figure 19.
Kernel Density Plot of the Coupling and Coordination Degree Between Sub-dimensions of Urban Flood Resilience in the Three Major Regions of the Central Plains Urban Agglomeration.
Overall, as shown in Figure 16, the development of the flood resilience coupling and coordination degree in the cities of the Central Plains Urban Agglomeration exhibits the following prominent characteristics: Firstly, from the perspective of distribution, the development level of the flood resilience coupling and coordination degree from 2012 to 2021 generally follows a curve of rightward shift followed by a leftward shift. This indicates a fluctuating upward trend in the coupling and coordination degree of flood resilience, which is consistent with the time-series analysis of the coupling and coordination degree across five dimensions of urban flood resilience in Section 4.1.
From the perspective of peak characteristics, from 2012 to 2018, the peak fluctuations of the overall sample kernel density distribution curve showed an upward trend, reaching the highest value in 2019. The peak shape narrowed, shifting from a broad peak to a narrow peak. Afterward, the peak value decreased year by year, and the peak shape became broader, indicating that the absolute gap in the coupling and coordination degree of flood resilience in the Central Plains Urban Agglomeration first fluctuated and then decreased, before increasing again. Lastly, the number of peaks reflects the polarization characteristics of the kernel density function. In addition to a single peak, the kernel density distribution for the Central Plains cities exhibited a small secondary peak in the right tail in 2017 and 2019, along with a rightward skew, indicating a slight polarization phenomenon. Overall, despite the narrowing of regional disparities within the Central Plains Urban Agglomeration, the coupling and coordination degree of development remains unstable, influenced by the developmental differences in the earlier stages.
From the kernel density plots of the three major regions of the Central Plains Urban Agglomeration, as shown in Figure 19, it can be observed that over the study period, the coupling and coordination degree of urban flood resilience in all three regions generally exhibited a rightward shift in their distribution. This indicates that the level of coupling and coordinated development of urban flood resilience in the three regions has been increasing.
Secondly, from the perspective of peak characteristics, overall, as time progresses, the kernel density curve shows a trend from a “flat” shape to a “tall” shape. This indicates that during the study period, the absolute gap and differentiation trend in coupling and coordination degree have been continuously narrowing. This also confirms the upward trend in the overall coupling and coordination degree of flood resilience in the Central Plains Urban Agglomeration, as discussed earlier. However, within the three major regions, the coupling and coordination degree value at the peak of the Zhengzhou Metropolitan Area is the lowest, suggesting that the coordinated development of urban flood resilience in this area lags behind that of the core development zone and the linked radiation zone. This phenomenon is closely related to the widening development gap between cities. In terms of the number of peaks, the kernel density curves of the core development zone and the linked radiation zone show a similar trend, with no significant secondary peaks apart from the main peak. However, in the Zhengzhou Metropolitan Area, noticeable secondary peaks appeared in 2016 and 2020, and by 2020, the kernel density curve of Zhengzhou showed a bimodal trend, indicating a severe polarization of the coupling and coordination degree in the Zhengzhou Metropolitan Area. In contrast, no significant polarization features are observed in the core development zone or the linked radiation zone.
Finally, from the perspective of distribution patterns, the Zhengzhou Metropolitan Area exhibits a distinct rightward skew, indicating a significant disparity in the level of coupling and coordination of urban flood resilience within the region. Some cities perform notably better than others. In contrast, neither the core development zone nor the linked radiation zone shows significant skewness, suggesting that these two regions exhibit more balanced levels of coupling and coordinated development. In summary, as time progresses, the coupling and coordination degree of urban flood resilience in the three major regions has steadily increased, with the gap gradually narrowing. However, attention should be paid to the need for more balanced development among cities within the Zhengzhou Metropolitan Area.
In summary, as time progresses, the coupling and coordination degree of urban flood resilience in the three major regions has steadily increased, with the gap gradually narrowing. From a policy perspective, this suggests that regional investments in infrastructure and governance coordination have been effective. However, the pronounced bimodal trend and skewness observed in the Zhengzhou Metropolitan Area highlight a risk of spatial polarization, where core cities advance while peripheral cities lag. This calls for targeted policies to promote balanced development, strengthen inter-city collaboration, and reduce internal disparities. By contrast, the more balanced distribution in the core development zone and linked radiation zone suggests that policy coordination in these areas has been more effective, offering useful lessons for addressing polarization in the Zhengzhou Metropolitan Area.
4.5. Recommendations for Response
- (1)
- Promoting the Urban “Resilience·Sponge” Flood Prevention System
In urban flood management practices, it is imperative to bridge the existing gap between “sponge city” and “resilient city” initiatives, fostering their synergistic development to establish a comprehensive system encompassing flood prevention, drainage, recovery, and adaptation. Integrated Planning in Early Urban Development: During the initial stages of urban planning, it is crucial to simultaneously incorporate the rainwater harvesting and infiltration capabilities emphasized by sponge city concepts, along with the systemic connectivity and rapid recovery attributes central to resilient city frameworks. For instance, in the development of new urban areas, the concurrent design and implementation of sunken green spaces, ecological retention basins, and zoned drainage systems can preempt the inefficiencies associated with retrofitting infrastructure post-construction. Promotion of Multifunctional Green Infrastructure: The construction of green infrastructure with multiple functionalities should be encouraged. Urban parks, green roofs, and rain gardens that serve both ecological conservation and emergency flood detention purposes exemplify such dual-purpose designs. Integrating these green infrastructures with existing urban drainage networks and transportation systems ensures both physical and functional connectivity, thereby enhancing the overall efficiency and responsiveness of urban systems. Implementation of Smart Monitoring and Dynamic Management Systems: Leveraging technologies such as intelligent sensing and City Information Modeling (CIM), cities can develop real-time monitoring and dynamic scheduling platforms for urban waterlogging. These platforms can coordinate critical infrastructure components—including drainage pump stations, sluice gates, and traffic signals—to facilitate adaptive urban operations during flood events and expedite post-disaster recovery processes. Cities such as Zhengzhou and Xinxiang have taken the lead in launching sponge city pilot projects. Their experiences can be gradually replicated and promoted in the peripheral corridor cities, achieving significant runoff reduction with relatively low marginal investment, thereby narrowing the resilience gap between the core and peripheral areas.
By integrating the principles of sponge and resilient cities, urban areas can not only enhance their structural defenses against flood disasters but also improve their adaptability and resilience in the face of extreme climatic events. This holistic approach contributes to the sustainable advancement of urban systems at a systemic level [57].
- (2)
- Promoting Multimodal Flood Disaster Insurance
Data shows that the losses caused by flood disasters in a single event can be several to dozens of times greater than the total annual budget for disaster prevention and emergency management in the affected province or city [58]. This indicates that the damage from flood disasters far exceeds local emergency management budgets, creating a significant financial impact on local governments. Given this context, there is an urgent need to shift away from disaster relief mechanisms primarily based on central government fiscal transfers and to leverage the function of market-based insurance mechanisms. In the implementation of this approach, the following aspects should be considered: first, increasing agricultural insurance coverage and improving the structural rationality of commercial property insurance; second, expanding the coverage of policy-based agricultural and rural housing insurance; and third, increasing the coverage limits of local disaster insurance plans. This initiative will not only establish a new insurance framework to enhance urban disaster resilience but is also expected to play a critical role in protecting the safety of people’s livelihoods and production [58]. In high-asset-intensive areas such as the Zhengzhou metropolitan region, pilot programs for parametric catastrophe insurance can be prioritized. In contrast, in peripheral agricultural areas and small- to medium-sized cities, the focus should first be on expanding the coverage of agricultural insurance and rural housing insurance. The national requirements for grain crop insurance coverage can also serve as a reference for regional promotion.
- (3)
- Strengthening Post-Disaster Economic Support and Investment
Economic support and investment are crucial safeguards for managing flood disasters and serve as a significant driving force for long-term post-disaster recovery and reconstruction. First, optimizing the structure of fiscal expenditures and adjusting the allocation of the fiscal budget to direct more funds toward disaster management and response measures is essential. Second, a sound funding allocation mechanism should be established to ensure that funds are distributed fairly and efficiently. Different funding allocation standards should be developed based on the severity of the disaster and local needs, with priority given to heavily affected regions and key projects to maximize the effectiveness of fund utilization. In addition, given the disparities in fiscal capacity observed across cities, exploring ways to involve social capital in post-disaster recovery and reconstruction may provide a useful supplement to government investment. Potential approaches, such as tax incentives, guidance funds, or bond issuance, could be considered in future practice to encourage private sector engagement, although further empirical evidence is needed to support these measures. Core cities such as Zhengzhou and Luoyang can prioritize allocating more local fiscal resources and special funds to drainage system renovation and resilience infrastructure upgrades. In contrast, peripheral cities with weaker fiscal capacity need to rely more on provincial transfer payments and attract private capital through the PPP model, so as to avoid widening the inter-city gap due to post-disaster investment pressures.
- (4)
- Implementing regular and extraordinary emergency management
Routine emergency management should focus on continuously updating and refining flood emergency plans for extreme rainfall events. This includes improving city-specific “one plan for one site” responses, strengthening evacuation and relocation strategies, and conducting regular flood defense drills. At the same time, risk monitoring and assessment must be institutionalized to identify latent hazards, complemented by measures such as drainage upgrading, soil erosion control, and rational land-use planning. Extraordinary emergency management requires establishing a clear response mechanism with well-defined responsibilities across different levels of government and departments, ensuring rapid activation of emergency procedures, and securing adequate reserves of supplies and equipment. Timely evacuation, rescue, and post-disaster recovery are critical for restoring damaged infrastructure and resuming normal life and production. Beyond individual cities, regional coordinated emergency management is essential. Within the Central Plains Urban Agglomeration, a “core emergency corridor” can be established along the Zhengzhou–Luoyang–Kaifeng axis, responsible for early warning dissemination, CIM-based smart monitoring, and material support. Peripheral cities such as Jiaozuo and Xuchang could connect to this corridor through data sharing and unified relocation protocols, thereby forming a core–periphery linkage pattern. This structure would enhance overall systemic efficiency and reduce the risk of fragmented responses under extreme rainfall events.
5. Conclusions and Future Research
5.1. Conclusions
- (1)
- Revealing the Mechanism of Urban Flood Resilience
Based on resilience theory, this study explores the relationships between urban flooding, urban systems, and urban resilience from a systems perspective, analyzing the mechanism of urban flood resilience. From a temporal dimension, the study examines a single disaster event and multiple disaster cycles throughout the pre-disaster, during-disaster, and post-disaster phases. It clarifies the expression of urban resilience in the context of flood disasters, framed as a process consisting of five stages: driving force, resistance, impact, recovery, and adaptation.
- (2)
- Development of an Urban Flood Resilience Evaluation Model
Based on relevant principles, an evaluation indicator system was constructed, comprising five dimensions: driving force, resistance, impact, recovery, and adaptation. The system includes four subsystems—economic, social, ecological, and engineering—covering a total of 29 indicators. Correlation analysis was applied to enhance the scientific robustness of the indicator system. Using the entropy weight method, the weights of the indicators were determined. A comprehensive urban flood resilience evaluation model was established, along with a grading evaluation standard.
- (3)
- Evaluation and Analysis of Flood Resilience Levels in the Central Plains Urban Agglomeration
Temporal Evolution: Over the study period, the flood resilience level of the Central Plains Urban Agglomeration showed an upward trend, increasing from 0.199 in 2012 to 0.2696 in 2021, representing a growth of 35.5%. In terms of the changes in urban flood resilience across different dimensions, the pattern was as follows: resistance > adaptation > recovery > driving force > impact. Spatial Evolution: Spatially, the flood resilience levels in the Central Plains Urban Agglomeration generally decreased from Zhengzhou to surrounding areas. High-resilience cities were mainly concentrated in the Zhengzhou Metropolitan Area and the Luoyang Urban Circle. However, the number of cities with high resilience levels was very limited, with a higher proportion of cities in the low-to-medium resilience range.
- (4)
- In-depth Analysis of the Network Correlation Characteristics and Coupling Coordination Level of Urban Flood Resilience
① The flood resilience network in the Central Plains Urban Agglomeration is closely interconnected. From 2012 to 2021, the network density showed a trend of first increasing and then decreasing, with distinct local correlation characteristics. Overall, this indicates that the exchange and connection of resilience between cities in the region tend toward positive development. ② The coupling and coordination degree of most cities’ flood resilience sub-dimensions increased over time. Spatially, the overall distribution exhibited a “high center, low periphery” pattern. ③ The three-dimensional dynamic Kernel density analysis reveals that the coupling and coordination development of flood resilience sub-dimensions among the 30 cities in the Central Plains Urban Agglomeration is uneven. There are disparities both between cities and across the three major regions, especially in the Zhengzhou Metropolitan Area, where there is severe polarization in coupling and coordination, as well as significant development gaps with other cities.
5.2. Future Research
(1) The current urban flood resilience indicator system requires further refinement. Some indicators lack clear definitions and standardized data processing, potentially amplifying subjective biases in expert evaluations. Data availability constraints have led to missing indicators for certain years or cities; although linear interpolation and similar methods have been applied to address these gaps, such approaches may still compromise the overall accuracy of the results. Additionally, the quantification of soft factors—such as cultural and institutional dimensions—remains inherently challenging, constraining the precision of the indicator system. It is noteworthy that this study employs the entropy weight method for objective weighting, which effectively captures the variability and information contribution of indicators. However, natural factors such as topographic relief and annual precipitation exhibit relatively limited spatial heterogeneity within the study area, resulting in low assigned weights. Consequently, their fundamental role in flood risk identification and resilience enhancement is insufficiently reflected. Future research could address this limitation by optimizing indicator design or adopting combined subjective-objective weighting approaches.
(2) The time span of flood resilience research is relatively short. Although the ten years of data provide some insights, there are still limitations. Short-term data exhibits significant fluctuations, particularly in economic and population factors, which affect the stability and reliability of resilience indicators, and fail to fully capture long-term development trends and evolutionary processes. Therefore, future research should involve multi-stage studies with a longer time span to better understand the dynamic changes in resilience.
(3) Enriching and refining urban flood resilience assessment methods. The study of urban flood resilience is a dynamic and complex process. Traditional methods, such as historical disaster statistics and indicator-based assessments, are limited in revealing the relationships and evolutionary dynamics of the various elements within the disaster system. In the future, scenario analysis should be combined with hydrological-hydraulic models and two-dimensional flood inundation models to simulate the dynamic process of urban flooding. Attention should be paid to the interactions among various factors. Further exploration should focus on the application of other models (such as random forest and support vector machine) in resilience assessment, along with attempts to compare and optimize multiple models. The use of artificial intelligence, big data, GIS, and remote sensing technologies should be leveraged to enable real-time monitoring and analysis of flood disaster spatial distribution and evolutionary trends, capturing the dynamic processes and spatial pattern changes of disaster events. This would provide a scientific basis for disaster response and prevention.
(4) Focusing on multi-scale transition in urban resilience research. The current study relies on relatively comprehensive city-level data; however, its application and scalability are constrained in regions with significant data gaps or smaller administrative units. The model developed herein primarily addresses urban flood resilience from the perspective of city administrators, focusing on specific disaster types and operating predominantly at a macro scale. Given the inherently multi-scalar nature of urban flood impacts, analyses confined to a single scale may not fully capture the complexity and diversity of such disasters. Consequently, future research should emphasize multi-scale transitions and develop integrated disaster resilience models applicable across macro to micro levels, thereby offering more comprehensive disaster response strategies and decision-making support.
(5) Exploring the transferability and broader applicability of the DRIRA model. This study applies the DRIRA framework to the context of flood disasters in the Central Plains Urban Agglomeration; however, future research should further examine its applicability in other urban agglomerations with different socio-economic and environmental characteristics, as well as its adaptability to other disaster types such as droughts, heatwaves, or earthquakes. Such comparative studies would not only help verify the robustness of the model but also contribute to refining the indicator system and enhancing its generalizability. In addition, future research could incorporate micro-level data (e.g., household surveys, community governance practices, post-disaster recovery times) to complement city-level analysis. A multi-scale and multi-dimensional approach would provide more comprehensive insights into resilience evolution mechanisms under different contexts.
Supplementary Materials
The following supporting information can be downloaded at: https://www.mdpi.com/article/10.3390/ijgi14100394/s1, Figure S1. Tornado plot of rank sensitivity under ±10% perturbation of resilience indicators.
Author Contributions
Conceptualization: Lu Liu, Huiquan Wang. Methodology: Lu Liu, Huiquan Wang, Jixia Li. Investigation: Lu Liu, Jixia Li. Visualization: Lu Liu, Huiquan Wang. Writing—original draft: Lu Liu, Huiquan Wang. All authors have read and agreed to the published version of the manuscript.
Funding
This research was funded by the Shanxi Federation of Social Sciences: “Multidimensional Indicator Evaluation and Mechanism Analysis of Livable, Resilient, and Smart City Construction in Shanxi Province” (SSKLZDKT2025083), and “Pathways and Mechanism of Building Livable, Resilient, and Smart Cities in Shanxi Province Oriented toward High-Quality Development” (2025W021).
Institutional Review Board Statement
Not applicable.
Informed Consent Statement
Not applicable.
Data Availability Statement
The data utilized in this study were primarily sourced from the “China City Statistical Yearbook” (2012–2021), the “Henan Statistical Yearbook” (2012–2021), the “Shanxi Statistical Yearbook” (2012–2021), the “Hebei Statistical Yearbook” (2012–2021), the “Shandong Statistical Yearbook” (2012–2021), and the “Anhui Statistical Yearbook” (2012–2021). Additionally, data were collected from the statistical yearbooks of individual cities within Henan, Shanxi, Hebei, Anhui, and Shandong provinces, as well as from the statistical bulletins on national economic and social development, government work reports, and meteorological data websites of these cities. Supplementary data were obtained from open-source geographic data platforms (National Geographic Information Resource Catalog Service System). A limited amount of data was also extracted from prefectural and county chronicles, as well as the “Statistical Bulletins on National Economic and Social Development” of the five provinces comprising the Central Plains Urban Agglomeration. Furthermore, some data were acquired through official media sources online, and remote sensing imagery was processed using ArcGIS 10.2 for additional spatial data extraction.
Acknowledgments
We are very grateful to the Department of Emergency Management at Shanxi Normal University for their support in contributing to this manuscript.
Conflicts of Interest
The authors declare that they have no competing interests.
References
- Ziegler, A.D.; Lim, H.S.; Jachowski, N.R.; Wasson, R.J. Reduce urban flood vulnerability. Nature 2012, 481, 145. [Google Scholar] [CrossRef]
- Willner, S.N.; Otto, C.; Levermann, A. Global economic response to river floods. Nat. Clim. Chang. 2018, 8, 594–598. [Google Scholar] [CrossRef]
- Najibi, N.; Devineni, N. Recent trends in the frequency and duration of global floods. Earth Syst. Dynam. 2018, 9, 757–783. [Google Scholar] [CrossRef]
- China Weather Website. Big Data Analysis of 30 Years of Flood Evolution in China: Revealing the Areas Most Vulnerable to Flood Disasters [EB/OL]. Available online: https://e.weather.com.cn/news/2022/03/3528589.shtml (accessed on 2 January 2023).
- Ministry of Water Resources of the People’s Republic of China. 2021 China Water and Drought Disaster Prevention Bulletin [EB/OL]. Available online: http://www.mwr.gov.cn/sj/tjgb/zgshzhgb/202302/t20230222_1646546.html (accessed on 6 November 2023).
- China Economic Net. Top 20 Cities by Economic Competitiveness: GDP of These Cities Accounts for 15% of the Global Total [EB/OL]. Available online: http://m.ce.cn/bwzg/201811/02/t20181102_30690150.shtml (accessed on 18 April 2023).
- Li, L.; Li, F. Key Scientific Issues and Reflections on the Construction of Sponge Cities. Acta Ecol. Sin. 2018, 38, 2599–2606. [Google Scholar]
- Klein, R.J.T.; Nicholls, R.J.; Thomalla, F. Resilience to natural hazards: How useful is this concept? Glob. Environ. Change Part B Environ. Hazards 2003, 5, 35–45. [Google Scholar] [CrossRef]
- Manyena, S.B.B.; Zhang, Y.Z.; Liu, H.L. A Reconsideration of the Concept of Resilience. Int. J. Urban Sci. 2015, 30, 13–21. [Google Scholar]
- Folke, C. Resilience: The emergence of a perspective for social–ecological systems analyses. Glob. Environ. Chang. 2006, 16, 253–267. [Google Scholar] [CrossRef]
- Li, T.; Zhu, S.; Huang, X. Research Progress on the Construction of Resilient Cities Based on Climate Disaster Impacts. Sci. Technol. Rev. 2020, 38, 30–39. [Google Scholar]
- Fang, D.; Li, Z.; Li, N.; Han, L.; Wu, J.; Lu, X.; Kong, X.; Li, Y.; Lü, X. Urban Resilience: A Reflection Based on the “System of Systems in Three-Dimensional Space”. Chn. Civil Engj. 2017, 50, 17. [Google Scholar]
- Liu, L.; Luo, Y.; Pei, J.; Wang, H.; Li, J.; Li, Y. Temporal and Spatial Differentiation in Urban Resilience and Its Influencing Factors in Henan Province. Sustainability 2021, 13, 12460. [Google Scholar] [CrossRef]
- Kammouh, O.; Zamani Noori, A.; Cimellaro, G.P.; Mahin, S.A. Resilience assessment of urban communities. ASCE-ASME J. Risk Uncertain. Eng. Syst. Part A Civ. Eng. 2019, 5, 04019002. [Google Scholar] [CrossRef]
- Cutter, S.L.; Burton, C.G.; Emrich, C.T. Disaster resilience indicators for benchmarking baseline conditions. J. Homel. Secur. Emerg. Manag. 2010, 7. [Google Scholar] [CrossRef]
- Parsons, M.; Morley, P. The Australian natural disaster resilience index. Aust. J. Emerg. Manag. 2017, 32, 20–22. [Google Scholar]
- Heeks, R.; Ospina, V.A. Concept ualising the link between information systems and resilience: A developing country field study. Inf. Syst. J. 2019, 29, 70–96. [Google Scholar] [CrossRef]
- Ouyang, M.; Dueñas-Osorio, L.; Min, X. A three-stage resilience analysis framework for urban infrastructure systems. Struct. Saf. 2012, 36, 23–31. [Google Scholar] [CrossRef]
- Zhang, J.; Zhang, M.; Li, G. Multi-stage composition of urban resilience and the influence of pre-disaster urban functionality on urban resilience. Nat. Hazards 2021, 107, 447–473. [Google Scholar] [CrossRef]
- Lu, H.; Lu, X.; Jiao, L.; Zhang, Y. Evaluating urban agglomeration resilience to disaster in the Yangtze Delta city group in China. Sustain. Cities Soc. 2022, 76, 103464. [Google Scholar] [CrossRef]
- Bruneau, M.; Chang, S.E.; Eguchi, R.T.; Lee, G.C.; O’Rourke, T.D.; Reinhorn, A.M.; Shinozuka, M.; Tierney, K.; Wallace, W.A.; Von Winterfeldt, D. A framework to quantitatively assess and enhance the seismic resilience of communities. Earthq. Spectra 2003, 19, 733–752. [Google Scholar] [CrossRef]
- Cimellaro, G.P.; Reinhorn, A.M.; Bruneau, M. Framework for analytical quantification of disaster resilience. Eng. Struct. 2010, 32, 3639–3649. [Google Scholar] [CrossRef]
- Francis, R.; Bekera, B. A metric and frameworks for resilience analysis of engineered and infrastructure systems. Reliab. Eng. Syst. Safe 2014, 121, 90–103. [Google Scholar] [CrossRef]
- Reed, D.A.; Kapur, K.C.; Christie, R.D. Methodology for assessing the resilience of networked infrastructure. IEEE Syst. J. 2009, 3, 174–180. [Google Scholar] [CrossRef]
- Lee, D.W. An exploratory assessment of infrastructure resilience to disasters. Int. J. Disaster Resil. 2020, 11, 519–533. [Google Scholar] [CrossRef]
- Li, G.; Kou, C.; Wang, Y.; Yang, H. System dynamics modelling for improving urban resilience in Beijing, China. Resour. Conserv. Recy. 2020, 161, 104954. [Google Scholar] [CrossRef]
- Shafieezadeh, A.; Burden, L.I. Scenario-based resilience assessment framework for critical infrastructure systems: Case study for seismic resilience of seaports. Reliab. Eng. Syst. Safe 2014, 132, 207–219. [Google Scholar] [CrossRef]
- Yu, S.; Yuan, M.; Wang, Q.; Corcoran, J.; Xu, Z.; Peng, J. Dealing with urban floods within a resilience framework regarding disaster stages. Habitat Int. 2023, 136, 102783. [Google Scholar] [CrossRef]
- Cutter, S.L.; Barnes, L.; Berry, M. A Place Based Model for Understanding Community Resilience to Natural Disasters. Glob. Environ. Change 2008, 18, 598–606. [Google Scholar] [CrossRef]
- Lei, Y.; Wang, J.A.; Yue, Y.; Zhou, H.; Yin, W. Rethinking the relationships of vulnerability, resilience, and adaptation from a disaster risk perspective. Nat. Hazards 2014, 70, 609–627. [Google Scholar] [CrossRef]
- Page, M.J.; McKenzie, J.E.; Bossuyt, P.M.; Boutron, I.; Hoffmann, T.C.; Mulrow, C.D.; Shamseer, L.; Tetzlaff, J.M.; Akl, E.A.; Brennan, S.E.; et al. The PRISMA 2020 statement: An updated guideline for reporting systematic reviews. J. Clin. Epidemiol. 2021, 134, 178–189. [Google Scholar] [CrossRef] [PubMed]
- Ye, T.; Jin, H.; Min, A. Evaluation of the efficiency of agricultural modernization development under the strategy of rural revitalization—Based on the combined analysis of super-efficiency DEA and comprehensive entropy method. Issues Agric. Econ. 2021, 3, 100–113. [Google Scholar]
- Jiang, S.; Chen, X. Assessment of Urban Resilience and Analysis of Barriers Under Flood Scenarios. Stat. Dec. 2022, 38, 63–67. [Google Scholar]
- Zhang, H.; Liu, Y.; Feng, J. The Impact of Urbanization Quality and Urban Resilience on Flood Disaster Risk: Based on Panel Data from 11 Prefecture-Level Cities in Shanxi. Econ. Probl. 2020, 4, 114–120. [Google Scholar]
- Chen, Z.; Wan, S.; Li, X.; Dong, Y.; Li, G. Spatial-Temporal Evolution and Driving Factors of Urban Flood Disaster Resilience in Hubei Province. China Rural. Water Resour. Hydropower 2024, 6, 21–30. Available online: http://kns.cnki.net/kcms/detail/42.1419.TV.20240315.1429.004.html (accessed on 12 April 2024).
- Zhang, Q.; Yu, X. Spatial Differences and Convergence of Urban Resilience Levels in Jiangsu Province. Urban. Stud. 2022, 43, 31–38. [Google Scholar]
- Jiao, L.; Wang, L.; Zhang, Y. Evaluation of Resilience Levels in the Yangtze River Delta Urban Agglomeration Based on the Multi-Barrel Model. World Reg. Stud. 2024, 33, 96–106. [Google Scholar]
- Du, J.; Tang, X.; Xu, J. Assessment of the Urgency for Enhancing Urban Resilience under Tropical Cyclone Disasters: A Case Study of Cities in the Pearl River Delta. J. Nat. Disasters 2020, 29, 88–98. [Google Scholar]
- Gao, Z.; Ding, Y. Resilience Measurement and Influencing Factors of Cities in Northwestern China. Sci. Technol. Rev. 2020, 39, 118–129. [Google Scholar]
- Javadpoor, M.; Sharifi, A.; Roosta, M. An adaptation of the Baseline Resilience Indicators for Communities (BRIC) for assessing resilience of Iranian provinces. Int. J. Disaster Risk Reduct. 2021, 66, 102609. [Google Scholar] [CrossRef]
- Yang, X.; Wang, B. Comprehensive Evaluation and Optimization Path of Urban Resilience in Beihai City Based on the Entropy Method. Future City Des. Oper. 2023, 10, 38–43. [Google Scholar]
- Zhao, D.Y.; Chen, C.K.; Yi, L.; Lei, P.; Xu, L.L. Research on a Multi-Factor Comprehensive Evaluation Model for Urban Resilience. China Saf. Sci. Technol. 2022, 18, 54–59. [Google Scholar]
- Rus, K.; Kilar, V.; Koren, D. Resilience assessment of complex urban systems to natural disasters: A new literature review. Int. J. Disaster Risk Reduct. 2018, 31, 311–330. [Google Scholar] [CrossRef]
- Zhao, S.; Bai, M.; Ruan, M.; Qian, H. Spatial-Temporal Evolution Characteristics and Barrier Factors of Coordinated Development between Tourism Resources and Ecological Security in Yunnan Province. J. Geogr. Sci. 2021, 3, 493–503. [Google Scholar]
- Alexeeff, G.V.; Faust, J.B.; August, L.M.; Milanes, C.; Randles, K.; Zeise, L.; Denton, J. A screening method for assessing cumulative impacts. Int. J. Environ. Res. Public Health 2012, 9, 648–659. [Google Scholar] [CrossRef] [PubMed]
- Chen, Y.; Zhu, M.; Zhou, Q.; Qiao, Y. Research on spatiotemporal differentiation and influence mechanism of urban resilience in China based on MGWR model. Int. J. Environ. Res. Public Health 2021, 18, 1056. [Google Scholar] [CrossRef] [PubMed]
- Zhang, X.; Fan, H.; Hou, H.; Xu, C.; Sun, L.; Li, Q.; Ren, J. Spatiotemporal evolution and multi-scale coupling effects of land-use carbon emissions and ecological environmental quality. Sci. Total Environ. 2024, 922, 171149. [Google Scholar] [CrossRef]
- Sun, Z.; Fan, J.; Sun, Y.; Liu, H.C. Spatial Network Structure and Influencing Factors of Green Technology Innovation Efficiency in China. Econ. Geogr. 2022, 42, 33–43. [Google Scholar]
- Shi, Y.; Niu, Y. Study on the Resilient Spatial Network and Its Influencing Factors of the Guanzhong Plain Urban Agglomeration. Arid Land Geogr. 2024, 47, 270–280. [Google Scholar]
- Shao, H.; Zhou, L.; Liu, Y. Spatial Network Structure and Driving Factors of Innovation Development in China. Stu. HST Sci. Tech. 2018, 36, 2055–2069. [Google Scholar]
- Teng, T.; Pan, Y.; Wang, S.; Bao, H. Evolution of the Urban Green Innovation Efficiency Network and Its Influencing Factors in the Yangtze River Delta Region. Resour. Environ. Yangtze Basin 2023, 32, 1335–1348. [Google Scholar]
- Liu, J. Comprehensive Network Analysis: A Practical Guide to UCINET Software, 2nd ed.; Gezhi Publ. House: Shanghai, China, 2014; pp. 56–60. [Google Scholar]
- Yuan, X.; Liu, J.; Song, K. Flood Disaster Vulnerability Assessment of the Disaster-bearing Bodies Based on BP Neural Network. Yangtze River 2024, 55, 26–34. [Google Scholar]
- Li, Y.; Li, Y.; Zhou, Y.; Shi, Y.; Zhu, X. Investigation of a coupling model of coordination between urbanization and the environment. J. Environ. Man. 2012, 98, 127–133. [Google Scholar] [CrossRef]
- Zhang, C.; Yang, J. Analysis and Forecast of the Coupling and Coordinated Development of Economy-Society-Resources-Environment: A Case Study of Chongqing. J. Chongqing Univ. Technol. 2018, 32, 73–84. [Google Scholar]
- Wang, J.; Han, Q. Spatiotemporal patterns of the coupling and coordination of urban economy-society-environment in China. Econ. Geogr. 2021, 41, 193–203. [Google Scholar]
- Zhang, X.M.; Wang, J.T.; Xu, W. Research on the coupling of “resilient city” and “sponge city” in urban flood prevention. In Proceedings of the 2nd Symposium on Urban Water Conservancy and Flood Prevention, Shijiazhuang, China, 25 November 2023; pp. 596–608. [Google Scholar] [CrossRef]
- He, X.; Tong, J.; Liu, Y. Flood disaster insurance in China: Current status, challenges, and optimization. Chin. Emerg. Manag. Sci. 2023, 11, 15–30. [Google Scholar]
Disclaimer/Publisher’s Note: The statements, opinions and data contained in all publications are solely those of the individual author(s) and contributor(s) and not of MDPI and/or the editor(s). MDPI and/or the editor(s) disclaim responsibility for any injury to people or property resulting from any ideas, methods, instructions or products referred to in the content. |
© 2025 by the authors. Published by MDPI on behalf of the International Society for Photogrammetry and Remote Sensing. Licensee MDPI, Basel, Switzerland. This article is an open access article distributed under the terms and conditions of the Creative Commons Attribution (CC BY) license (https://creativecommons.org/licenses/by/4.0/).