Abstract
Urban park green space (UPGS) is a key component of urban green infrastructure, yet it faces multiple contradictions, such as insufficient quantity and uneven distribution. Taking Zhengzhou City as a case study, this research explored the impacts of temporal thresholds and the modifiable areal unit problem (MAUP) on UPGS accessibility and equity. An improved multi-modal Gaussian two-step floating catchment area (G2SFCA) method was employed to measure UPGS accessibility, while the Gini coefficient and Lorenz curve were used to analyze its equity. The results show that (1) UPGS presents a dual-core agglomeration feature, with accessibility blind spots surrounding the edge of the study area and relatively low equity in the western and southern regions; (2) changes in temporal thresholds and spatial scales have a significant impact on UPGS accessibility (p < 0.001), whereas their impact on equity is minor; and (3) UPGS distribution suffers from spatial imbalance, with a huge disparity in resource allocation. This study overcomes the limitations of traditional evaluation methods that rely on a single mode or ignore scale effects and provides a more scientific analytical framework for accurately identifying the spatial heterogeneity of UPGS accessibility and the imbalance between supply and demand.
1. Introduction
Against the backdrop of rapid urbanization, the “living circle”—a spatial planning concept centered on residents’ daily activities—provides an important reference for the allocation of urban public service resources. However, limited spatial resources and high-density population agglomeration pose severe challenges to the planning and management of urban park green spaces (UPGSs) [1]. As a core carrier of the urban ecosystem, UPGSs are of great significance in improving the human settlement environment and enhancing residents’ well-being [2,3]. Their ecological service functions include environmental benefits, such as carbon sequestration, oxygen release, and air purification; meanwhile, they also hold social values of promoting physical and mental health, enriching cultural life, and strengthening community cohesion [4,5]. Nevertheless, whether UPGS can be conveniently accessed by citizens, and the issue of equity therein, have become key indicators for measuring the level of urban sustainable development and livability [6,7]. Currently, the layout of UPGS often exhibits problems, such as spatial inequality, blind spots in service coverage, and significant differences in resource access among resident groups with different socioeconomic attributes [8,9]. The core of these problems lies in the fact that traditional equity evaluations mostly focus on “spatial distance” while ignoring the differences in time costs incurred by residents when actually reaching UPGS. Therefore, in-depth exploration of UPGS equity—by analyzing changes in UPGS accessibility under different time thresholds—can more accurately capture the equity differences in its service coverage. This holds important theoretical and practical significance for optimizing the allocation of urban spatial resources, promoting social equity and justice, and building healthy and livable cities [10].
Studies on spatial equity typically rely on the measurement of accessibility, as the spatial distribution and accessibility of public services are crucial factors for equity assessment. Hansen [11] first proposed the concept of accessibility in 1959, defining it as “the magnitude of interaction opportunities between various nodes in a transportation network”. Building on this, UPGS accessibility refers to the relative or absolute difficulty of overcoming spatial resistance to reach UPGS from any point in space, reflecting the extent of spatial resistance overcome in the process of reaching UPGS [12]. With the integration of geographic information systems (GISs) and mathematical models, UPGS accessibility evaluation methods have undergone significant development, leading to the formation of multiple technical approaches, such as proximity analysis, opportunity supply, supply–demand balance, and network simulation [13,14,15,16,17,18,19,20,21,22,23,24,25]. The connotation and measurement criteria of equity are closely linked to urban development levels and residents’ needs, and its “spatial equity” can be roughly divided into three stages: regional equality, spatial balance, and social equality [26]. Its evaluation also covers areas such as the quantification of spatial equilibrium (e.g., the Gini coefficient and the Theil index), the characterization of distribution characteristics (e.g., spatial autocorrelation and kernel density estimation) [26,27,28,29,30,31,32,33,34,35], and the assessment of group benefit equity by integrating accessibility differences [36,37]. Current research on UPGS accessibility and equity is relatively mature, but certain limitations remain. On the one hand, most studies focus on the calculation of static spatial accessibility, neglecting multi-dimensional influencing factors such as the dynamics of travel patterns and the sensitivity of time thresholds. On the other hand, equity evaluation lacks sound theoretical support; it can only describe existing differences but cannot determine whether these differences are reasonable, which restricts the guiding value of such research for practical applications.
Specifically, existing studies have obvious deficiencies in exploring the core influencing factors: at the level of travel modes, relevant studies mostly focus on the single mode of walking or only compare the two modes of walking and cycling. For example, some studies simulate walking accessibility based on crowdsourced data [38], use the Gaussian two-step floating catchment area method (G2SFCA) to analyze the differences in walking accessibility among different age groups [39], or compare the accessibility of blue–green spaces under walking and cycling modes [40], and use GIS network analysis to compare the accessibility of the two modes [41]. However, a comprehensive analysis framework for the dynamic combination of multiple modes, such as walking, cycling, and driving, has not yet been constructed. Moreover, most studies rely on static road network data from OpenStreetMap (OSM), which makes it difficult to match the dynamics of residents’ actual travel scenarios. In terms of time threshold setting, existing studies generally adopt a fixed single threshold. For example, accessibility quantification and service coverage equity analysis are carried out with 10 min [42] and 15 min [43] as standards. They fail to fully consider the impact of time threshold selection on the robustness of research conclusions, as well as problems such as conclusion bias that may be caused by a single time threshold. At the spatial scale level, although studies cover different analysis units such as streets [6], communities [44], and 500 × 500 m grids [45], and discuss issues such as differences among social groups, the impact of transportation modes, and the regulatory role of streetscape perception, all studies are conducted on a single scale. They do not systematically examine the impact of spatial scale division and the modifiable areal unit problem (MAUP) on accessibility evaluation results, which makes it difficult to compare the conclusions of different studies horizontally. This limitation may restrict the universality of research conclusions. In addition, existing studies generally lack the support of theoretical hypotheses and do not clarify the reasonable standards for UPGS configuration. For example, in terms of service scale, there are international recommendations such as “a 500 m service radius for residential parks and a 2000 m service radius for regional parks”, but there is insufficient research on the adaptability to the population density of megacities, and the reasonable number of people served by UPGS and the corresponding area thresholds have not been clarified. In terms of accessibility standards, there is no unified consensus on the reasonable maximum time limits and travel speeds for walking, cycling, and driving.
Based on the above research gaps, this study takes Zhengzhou City as a case and aims to systematically answer the following three core questions through targeted method design and data analysis: (1) What are the spatial distribution characteristics and laws of UPGS accessibility and equity under the multi-mode travel scenarios integrating walking, cycling, and driving? (2) In the supply–demand matching relationship with UPGS as the supply side and urban residents as the demand side, how can we accurately identify the UPGS accessibility service blind spots? (3) What is the impact mechanism of time threshold differences and spatial scale selection (i.e., the MAUP effect) on UPGS accessibility evaluation results and equity judgments? (Blind spots shall be presented in the Results; the first paragraph of the Discussion shall supplement the observed phenomena; the Conclusion shall echo this part).
To effectively answer the above questions, this study constructs a multi-source data fusion analysis framework and adopts an improved multi-mode Gaussian two-step floating catchment area method to evaluate UPGS accessibility. By integrating real-time traffic data from the Baidu Maps API, this method can effectively avoid the limitations of traditional static road networks based on OpenStreetMap (OSM) in simulating dynamic travel time [46,47,48] and is more in line with residents’ actual travel scenarios. On the one hand, the results of this study can provide a scientific decision-making basis for optimizing the planning and layout of UPGS in Zhengzhou, making up for gaps in service coverage, and formulating management strategies; on the other hand, it can also provide theoretical support for improving the UPGS equity evaluation paradigm in eco-city construction, and promote the in-depth application of accessibility and equity research at the practical level.
2. Materials and Methods
2.1. Study Area
Zhengzhou City is situated in central China, within the middle and lower reaches of the Yellow River. As the capital of Henan Province and a core city of the Central Plains Urban Agglomeration, it occupies an area of 7567.22 km2 and has a permanent resident population of 13.008 million (from the official website of the Zhengzhou Municipal Government). The city holds a pivotal position in China’s national economic development pattern and regional coordinated development. Furthermore, Zhengzhou serves as a crucial transportation hub, integrating multiple modes of transport, including railways, highways, and aviation, providing robust support for economic exchange and urban growth. Simultaneously, leveraging its rich historical and cultural resources alongside vigorously developing modern industries, Zhengzhou demonstrates a unique charm characterized by a blend of historical heritage and modern vitality. The city administers 6 districts, 5 county-level cities, and 1 county, as well as functional zones including the Zhengzhou Airport Economy Comprehensive Experimental Zone, the Zhengdong New Area, the Zhengzhou Economic and Technological Development Zone, and the Zhengzhou High-Tech Industrial Development Zone. (In China’s administrative division system, districts, counties, and county-level cities all fall under the category of county-level administrative divisions.)
The study area comprises five core urban districts: Zhongyuan District, Erqi District, Guancheng Hui District, Jinshui District, and Huiji District, as shown in Figure 1. These districts serve as the primary hubs for political, economic, and cultural activities in the city, characterized by high concentrations of population and industries. The study area covers 729.76 km2 with a permanent resident population of 5.1002 million, accounting for 9.64% of Zhengzhou’s total area and 39.21% of its total population (data sourced from Zhengzhou Municipal Government’s official website as of the end of 2023). The area boasts relatively abundant urban park green spaces, featuring various distinctive parks and green areas that provide diverse recreational spaces for residents.
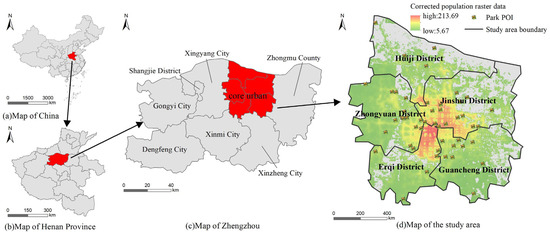
Figure 1.
The study area within Zhengzhou City.
2.2. Data Sources and Processing
2.2.1. Population Raster Data
The population raster data were sourced from the WorldPop official website “https://www.worldpop.org/ (accessed on 5 January 2025)”. These data avoid allocating populations to non-residential areas, making them more aligned with the actual population distribution. To more accurately reflect the actual conditions of the study area, this research used data from the Seventh National Population Census (hereinafter referred to as the “Seventh Census”) for correction. The correction factor was calculated as the ratio of the Seventh Census data to the WorldPop population raster data. Zonal statistics were performed on the corrected population raster data and compared with the Seventh Census data, resulting in a final population raster dataset that closely matches the actual population distribution of the study area, as shown in Table 1. The population raster data were then aggregated into 500 m grids (3981 grid cells) and 1000 m grids (1090 grid cells), respectively, generating the population grid data shown in Figure 2.

Table 1.
Statistical validation of population grid data.
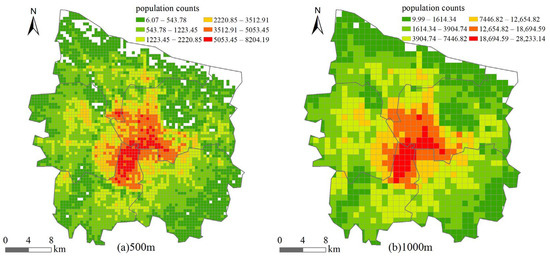
Figure 2.
(a) Population grid of 500 m; (b) 1000 m population grid.
2.2.2. Urban Park Green Space Data
The urban park green space data were obtained from the Baidu Maps open platform (https://lbsyun.baidu.com/, accessed on 9 January 2025). Using Python 3.7.0, we developed a program to batch acquire point-of-interest (POI) data for parks within the study area and subsequently crawled the corresponding area-of-interest (AOI) data. The acquired data underwent cleaning and processing, which included eliminating non-park green spaces and data points outside the study area. Furthermore, ArcGIS 10.5 was employed to convert AOI data into polygon features for area calculation and to extract geometric centroids (with latitude/longitude coordinates) as specific UPGS locations, thereby constructing the required UPGS database for this study.
2.2.3. Direction API Data
The route-planning data for this study were obtained from the Baidu Maps open platform (accessed on 11 January 2025) to accurately calculate actual travel distance and time. Using the centroids of 500 m and 1000 m population grids as origins and the centroids of UPGS AOIs as destinations, we constructed origin–destination (OD) matrices. Through Python 3.7.0, we batch sent route-planning requests to the Baidu Maps application programming interface (API) to retrieve the actual travel distance and time for three transportation modes (walking, riding, and driving) based on road network data and real-time traffic conditions, with key parameters shown in Table 2. After processing and statistically analyzing the returned data, we applied time thresholds of 10 min, 15 min, and 20 min to exclude data exceeding these limits, ultimately storing the results in the research database.
Table 2.
Key parameters of the lightweight route-planning service.
2.3. Methods
2.3.1. Improved Multi-Mode 2SFCA Method
The two-step floating catchment area (2SFCA) method addresses the supply of urban park green space (UPGS) and the demand for population quantity; however, it fails to account for the actual resistance within the search range and the distance decay effect [49]. Therefore, based on the Gaussian two-step floating catchment area (G2SFCA) method, this study further comprehensively considered multiple travel modes, including walking, cycling, and driving by integrating the AOI (area-of-interest) data of UPGS and the optimized OD (origin–destination) cost matrix, so as to evaluate the accessibility of UPGS in Zhengzhou. The specific calculation process includes three main steps.
Step 1: As illustrated in Figure 3a, using UPGS AOI centroids as supply points and considering the maximum acceptable travel time from population grid centroids to UPGS, we first identify all population grid centroids within the searchable area. These are then weighted using a Gaussian decay function based on travel time, followed by calculating the supply–demand ratio for park green spaces under three transportation modes, as formulated in Equation (1).
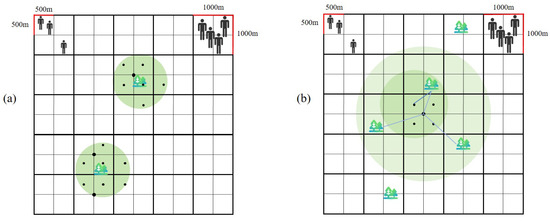
Figure 3.
Schematic diagram of the two-step floating catchment area (2SFCA) method principle. (a) step 1: calculate the supply-demand ratio using the center point of the AOI in UPGS as the supply point; (b) step 2: calculate accessibility using the center point of the population grid as the demand point.
In the equation, , , and correspond to walking, riding, and driving modes, respectively, and represents the supply–demand ratio of UPGS. denotes the area of UPGS. is the route-planning time between location for mode m. is the time threshold, set at 10 min, 15 min, or 20 min (depending on the context). represents the population count at location . The condition ensures that only locations within the time threshold of j are considered.
is the Gaussian decay function, as shown in Equation (2).
The second step, as illustrated in Figure 3b, involves taking location as the center and using the maximum acceptable travel time from to as the constraint to search for all UPGSs within the defined area. A Gaussian decay function is then applied to perform a weighted summation of the supply–demand ratios for all UPGSs within this range, ultimately yielding the accessibility indices for location across three travel modes, as expressed in Equation (3).
The third step involves calculating the integrated accessibility across all three travel modes, as formalized in Equation (4).
In the equation, , , and represent the accessibility indices for walking, riding, and driving modes, respectively, while denotes the comprehensive accessibility index obtained through the enhanced multi-mode two-step floating catchment area method. A higher value of this index indicates better park and green space accessibility at location , meaning easier access to nearby parks from that point. All other variables retain their previously defined meanings.
In this study, the improved multi-mode Gaussian two-step floating catchment area (G2SFCA) method was employed to calculate the accessibility results of Zhengzhou’s UPGS via integrated travel modes under grid scales of 500 m and 1000 m and time thresholds of 10 min, 15 min, and 20 min, respectively. Subsequently, min.–max. scaling was used to normalize the accessibility values. Finally, the geometrical interval method was adopted to classify the accessibility values into 6 categories for spatial visualization.
2.3.2. Gini Coefficient and Lorenz Curve
The Gini coefficient (GN) is a typical indicator for measuring gaps in public resources, constructed based on the Lorenz curve. It can be used to evaluate the equity of resource allocation for urban public service facilities (UPGS) related to urban park green spaces in the study area [50]. Its value ranges between 0 and 1, as shown in Formulas (5) and (6), and its specific implications are presented in Table 3. The Lorenz curve is a convex curve plotted by sorting the total population in ascending order of UPGS accessibility and then calculating the cumulative proportion of UPGS accessibility corresponding to each cumulative population proportion. The diagonal line is regarded as the line of absolute equity; the closer the Lorenz curve is to this line, the more equitable the distribution of UPGS. In this study, the Gini coefficient quantitatively and accurately measured the degree of inequality in the distribution of UPGS accessibility among different groups and regions, while the Lorenz curve intuitively and visually demonstrated the distribution characteristics of such inequality.
Table 3.
Gini coefficient explanation.
In the equation, represents the Gini coefficient; denotes the area between the Lorenz curve and the line of absolute equality; indicates the area under the Lorenz curve, as illustrated in Figure 4; signifies the total number of population grids in the study area; and refers to the -th population grid after sorting UPGS accessibility in ascending order, where is the cumulative population proportion of the -th grid, and represents the cumulative UPGS accessibility proportion of the -th grid.
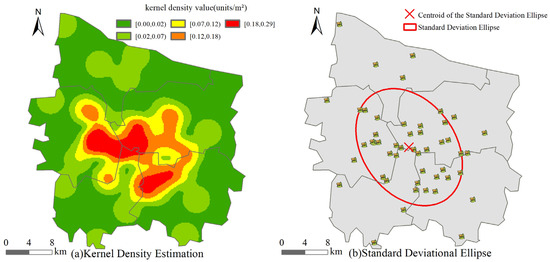
Figure 4.
(a) Kernel density estimation map; (b) standard deviational ellipse analysis map.
2.3.3. Location Quotient
The location quotient (LQ) is the ratio of the per capita UPGS accessibility of a grid to the per capita UPGS accessibility of the entire study area. It can reveal whether the distribution of UPGS resources across different grids is balanced [50]. When the location quotient is greater than 1, it indicates that the concentration of UPGS resources in the grid is higher than the average level of the study area. The larger the location quotient, the greater the equity of UPGS distribution in that grid. The calculation formula for the location quotient is shown in Formula (7).
In the equation, represents the location quotient; denotes the population count in grid ; indicates the accessibility value of grid ; signifies the total population across all grids in the study area; and is the aggregate accessibility value of all grids.
3. Results
3.1. Spatial Pattern Analysis of Urban Parks and Green Spaces in Zhengzhou City
To reveal the macro-distribution structure and inherent laws of urban public green spaces (UPGSs) in Zhengzhou, this study comprehensively adopted the kernel density estimation and standard deviation ellipse methods for analysis.
As shown in Figure 4a, the results of the kernel density analysis clearly reveal the overall framework and core–periphery structure of UPGS’s spatial distribution. Its spatial pattern presents a typical dual-core spatial agglomeration feature. The main high-density core is located at the geometric center of the study area, and the kernel density value decreases gradually from the center to the periphery. This is highly consistent with the waterfront green corridor axis planned by Zhengzhou, highlighting the key role of natural ecology in the layout of green spaces. The other core is located in the northwest of Guancheng Hui Autonomous District, and together with the main core, they form two major core areas for service supply. In sharp contrast, the density of UPGS is significantly lower in peripheral urban areas such as the entire Huiji District and the southwest of Erqi District. This unbalanced distribution pattern intuitively reflects the spatial mismatch between the supply of ecological resources and the demand for population agglomeration within the city.
Compared with kernel density estimation, which focuses on the form of the density field, the standard deviation ellipse method can effectively identify the dominant extension direction and spatial diffusion pattern of the facility layout. As shown in Figure 4b, the distribution of UPGS in Zhengzhou is relatively sparse. The major axis of the standard deviation ellipse extends along the northwest–southeast direction, forming a spatial coupling with the trends of natural water systems such as the Jialu River, Jinshui River, and Xionger River. This indicates the significant guiding role of waterfront ecological corridors in the layout of UPGS. The centroid of the standard deviation ellipse is located in the center of the study area, adjacent to Zhengzhou People’s Park, revealing the problem of marginal imbalance in the supply of ecological resources. Moreover, relying on its status as the administrative center, the central part of the study area has prioritized the layout of large-scale parks to form an agglomeration area. The spatial coupling mechanism driven by the dual effects of natural conditions and administrative orientation has led to the shift of the distribution center of Zhengzhou’s UPGS toward the geometric center.
3.2. Accessibility Analysis of Urban Parks and Green Spaces in Zhengzhou City
As shown in Figure 5a–c, this study explored the changes in the spatial distribution of UPGS (urban public service facilities) accessibility in Zhengzhou with the increase in time thresholds at the 500 m grid scale. Under the 10 min time threshold, the high-accessibility grids present a “one core and three stars” spatial differentiation pattern: the “one core” is located in the central area of Jinshui District, and the “three stars” are scattered in the northern and northwestern parts of Huiji District, as well as the southern part of Erqi District. Under the 15 min time threshold, the spatial differentiation characteristics of accessibility are relatively obvious, with the overall accessibility in the east being higher than that in the west, and the accessibility in the north being higher than that in the south. Under the 20 min time threshold, all regions except the central part of Erqi District have relatively high accessibility levels. As shown in Figure 6a and Table 4, the average value of accessibility significantly increases with the increase in the travel time threshold (p < 0.001), which indicates that the longer the travel time residents can accept, the higher the level of park and green space services they can enjoy.
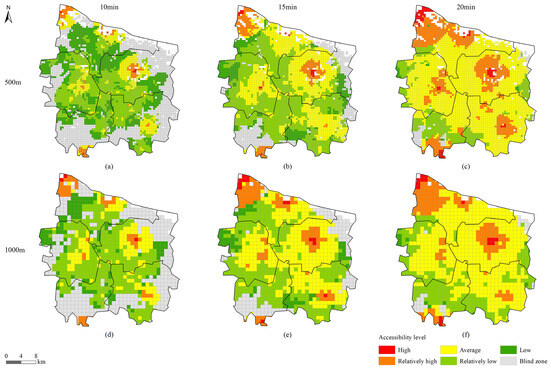
Figure 5.
Spatial distribution of park accessibility in Zhengzhou. (a–c) respectively represent the spatial distribution of accessibility under the 500 m grid scale with 10 min, 15 min, and 20 min time thresholds; (d–f) respectively represent the spatial distribution of accessibility under the 1000 m grid scale with 10 min, 15 min, and 20 min time thresholds.
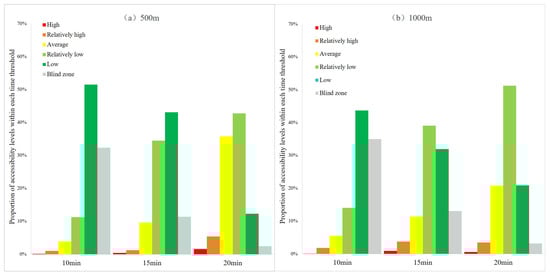
Figure 6.
Statistical analysis of park accessibility tiered distribution across time thresholds. (a) presents the statistical data on the proportion of accessibility levels for each time threshold at the 500 m grid scale; (b) presents the statistical data on the proportion of accessibility levels for each time threshold at the 1000 m grid scale.
Table 4.
The results of the repeated-measures analysis of variance for accessibility.
As shown in Figure 5d–f, the changes in the spatial distribution of Zhengzhou’s UPGS accessibility with the increase in time thresholds are explored at the 1000 m grid scale. Under the 10 min time threshold, the high-accessibility grids show a dual-core agglomeration feature, distributed around Longhu Park in Jinshui District and the northwestern part of Huiji District, while the relatively high-accessibility grids form a “core–periphery” diffusion pattern. Under the 15 min time threshold, the high-accessibility grids expand spatially based on the original relatively high-accessibility grids, and the relatively high-accessibility grids form value-added core areas in the central part of Jinshui District and Huiji District. Under the 20 min time threshold, the general accessibility grids are mainly located in the northern part of Huiji District, forming a spatial coupling with the Zhengzhou Yellow River Cultural Park and the Zhengzhou Yellow River National Wetland Park. As shown in Figure 6b and Table 4, the time threshold significantly impacts accessibility. Further pairwise comparison reveals that there are significant differences in accessibility between any two time thresholds (p < 0.001).
As shown in Figure 5 and Table 5, the changes in the spatial distribution of Zhengzhou’s UPGS accessibility with the increase in spatial scales are explored under the same time threshold. Under the 10 min time threshold, the average accessibility of the 1000 m grid is higher than that of the 500 m grid, with a t-value of 0.870 and a probability p-value of 0.385 (greater than 0.05), indicating that the difference in average accessibility is not statistically significant. The impact of the scale difference is not significant, which may be because the accessible range is very small at this time, making it difficult for both scales to capture effective spatial variation. Under the 15 min time threshold, the difference in average values is 0.00322, and the accessibility of the 1000 m grid is significantly higher than that of the 500 m grid (p < 0.001). The 1000 m scale tends to overestimate accessibility; the coarser scale smooths out details and may misclassify many inherently inaccessible areas as accessible simply because they are located within a large grid that is accessible on average. Under the 20 min time threshold, the difference in the average values is −0.005, and the accessibility measured by the 500 m grid is instead significantly higher than that measured by the 1000 m grid (p < 0.001). This is because, as the accessible range expands, the finer 500 m grid can more sensitively capture more discrete and accessible small areas. In contrast, the 1000 m grid, due to its larger unit size and lack of flexibility, may miss or smooth out these local accessibility advantages, resulting in lower measured values.
Table 5.
The results of the paired-samples t-test for accessibility between the 1000 m grid and the 500 m grid (with values aggregated to the 1000 m grid by averaging) under the same time threshold.
3.3. Equity Analysis of Urban Park Green Spaces in Zhengzhou
This study employed methods such as the Gini coefficient, the Lorenz curve, and location entropy to conduct an in-depth multi-dimensional analysis of the equity of Zhengzhou’s UPGS. As shown in Figure 7, at both the 500 m and 1000 m grid scales, the Gini coefficient values under different travel time thresholds are all greater than 0.5, indicating significant differences in resource allocation. This implies that the distribution of Zhengzhou’s UPGS is spatially imbalanced. Under the 10 min time threshold, the overall equity of the 1000 m grid is higher than that of the 500 m grid. Under the 15 min and 20 min time thresholds, the overall equity of the 500 m grid is higher than that of the 1000 m grid. The Lorenz curve generally presents a convex downward shape and deviates significantly from the line of absolute equity. In the initial stage of the Lorenz curve—corresponding to areas with low population and low accessibility—the curve has a small slope and rises extremely slowly. This indicates that in the early stage of resource allocation, a small portion of UPGS resources flows concentratedly to areas with high accessibility, while the UPGS resources available to the majority of the population are extremely limited. However, in the part where the cumulative percentage of the population is relatively high, the cumulative percentage of accessibility shows a rapid increase. This suggests that most residents face difficulties in accessing UPGS resources, and only when the cumulative population reaches a relatively high proportion can a certain improvement in accessibility be achieved. This indicates that the spatial matching between Zhengzhou’s UPGS and the population is irrational. Furthermore, according to the principle that the closer the Lorenz curve is to the line of absolute equity, the more equitable the allocation of public service facilities, the equity ranking of UPGS resource allocation under different time thresholds is 20 min > 15 min > 10 min, meaning the larger the time threshold, the higher the equity.
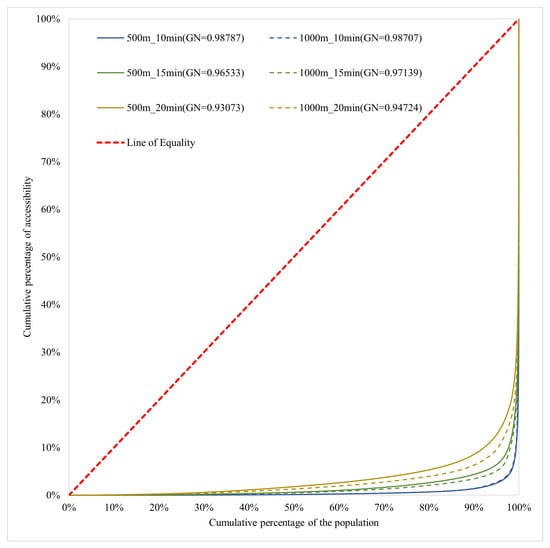
Figure 7.
Lorenz curve analysis of urban park green space (UPGS) distribution in Zhengzhou.
On the macro basis of the Gini coefficient and Lorenz curve analysis, the location quotient (LQ) was used to further conduct a refined analysis of the spatial distribution pattern of Zhengzhou’s UPGS equity. As shown in Figure 8a–c, the spatial distribution of Zhengzhou’s UPGS location quotient was explored at the 500 m grid scale. Under the 10 min time threshold, the proportion of grids with LQ > 1 accounted for 9.12%. The spatial distribution showed a multi-core feature, mainly distributed in the central area of Jinshui District, the northwestern and northern areas of Huiji District, and the southeastern area of Guancheng Hui Autonomous District. When the time threshold increased to 15 min, the proportion of grids with LQ > 1 rose to 16.15%. When the time threshold increased to 20 min, the proportion of grids with LQ > 1 increased to 22.83%, and the overall spatial expansion showed a continuous expansion feature. This indicates that with the increase in the time threshold, the equity of Zhengzhou’s UPGS gradually improved. In addition, at the 1000 m grid scale, the proportion of grids with LQ > 1 also showed an increasing trend with the increase in the time threshold, and the overall trend of its spatial distribution expansion was similar to that at the 500 m grid scale.
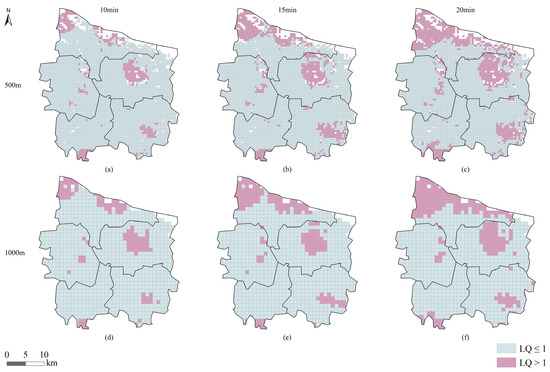
Figure 8.
Spatial distribution map of location quotient (LQ) for urban park green spaces (UPGSs) in Zhengzhou City. (a–c) respectively represent the spatial distribution of location quotients under the 500 m grid scale with 10 min, 15 min, and 20 min time thresholds; (d–f) respectively represent the spatial distribution of location quotients under the 1000 m grid scale with 10 min, 15 min, and 20 min time thresholds.
It can be seen from Table 6 that the average location quotient at the 500 m grid scale showed a significant downward trend with the increase in travel time (20 min: 14.851 < 15 min: 21.304 < 10 min: 25.205), which contradicts the rise in the proportion of LQ > 1. This may be because, although a longer travel time enables more regions to meet the equity benchmark (LQ > 1), it also greatly levels the equity level among different regions, leading to a decline in the overall average value of the location quotient, i.e., “equalization at the average level”. At the 1000 m grid scale, the variation pattern of equity with time was completely different. The average value of the location quotient showed a “first rise then fall” feature, and the results of paired t-tests under all time thresholds were not significant (all p-values > 0.05), indicating that the change in the time threshold had no obvious impact on equity.
Table 6.
The results of the repeated-measures analysis of variance for equity.
As shown in Table 7, the changes in the spatial distribution of Zhengzhou’s UPGS location quotient with the increase in spatial scale were explored under the same time threshold. Compared with the 500 m grid scale, the proportion of areas with LQ > 1 in the 1000 m grid increased by 1.43% under the 10 min threshold, while it decreased slightly by 0.19% and 0.45%, respectively, under the 15 min and 20 min thresholds. However, under the three time thresholds, there was no significant difference in the average location quotient measured by the 500 m and 1000 m grids (p > 0.05). This indicates that the location quotient, as a relative indicator, is far less sensitive to scale changes than the accessibility value, which is an absolute indicator. Although there were slight fluctuations in the proportion of high-equity areas (LQ > 1) between the two scales, from the perspective of the average equity level of the overall space, this difference did not reach statistical significance.
Table 7.
The results of the paired-samples t-test for equity between the 1000 m grid and the 500 m grid (with values aggregated to the 1000 m grid by averaging) under the same time threshold.
4. Discussion
Using the improved Gaussian two-step floating catchment area method, this study, based on the supply–demand matching relationship, where UPGSs serve as the supply side and urban residents as the demand side, identified that the spatial distribution characteristics of UPGS accessibility and equity show a significant evolutionary trend as the time threshold gradually increases, and such characteristics vary under the influence of two spatial grid scales (500 m and 1000 m). This indicates that the accessibility and equity of UPGSs are not static features, but rather a complex system dynamically affected by two key factors: the “time threshold” and the “spatial grid scale”. Among them, areas with high accessibility and high equity are located in the central part of Jinshui District, the northern part of Huiji District, and the southern part of Guancheng District; meanwhile, accessibility blind spots are situated at the edge of the study area, and areas with low equity are mainly distributed in the western and southern parts of the study area. This reveals that the accessibility and equity of UPGSs in the study area exhibit significant spatial characteristics of “central–peripheral difference” and “local concentration”, and behind such spatial differentiation, there exist explicit issues of supply–demand matching imbalance and uneven resource allocation. Notably, in the northwestern and northern parts of Huiji District, although UPGSs are sparsely distributed, their accessibility and equity are relatively high. This is attributed to the large area of parks in these regions. It can be seen that accessibility and equity are not only related to the spatial location of UPGSs but are also largely influenced by UPGS indicators.
This study showed that the MAUP has a dynamic influence mechanism on the accessibility and equity of UPGS. Under the 10 min time threshold, the 1000 m grid overestimates accessibility compared with the 500 m grid, while equity is underestimated. Under the 15 min time threshold, the 1000 m grid significantly overestimates accessibility and also overestimates equity in comparison with the 500 m grid. Under the 20 min time threshold, the 1000 m grid significantly underestimates accessibility but overestimates equity relative to the 500 m grid. However, most previous studies were conducted based on a single scale or comparisons at scales such as streets and communities, whereas this study analyzed the impact of the MAUP on the evaluation results of accessibility and equity from a refined multi-scale perspective. Meanwhile, considering that the accessibility and equity of UGS are affected by time costs, this study took the concept of the 15 min living circle as the benchmark and set 10 min and 20 min as the reference groups. In terms of research methods, unlike the traditional two-step floating catchment area method, which usually only considers a single travel mode, this study adopted an improved multi-modal Gaussian two-step floating catchment area method, which comprehensively takes into account multiple travel modes, including walking, cycling, and driving, making it more in line with actual situations. Overall, this study used the improved multi-modal Gaussian two-step floating catchment area method to reasonably evaluate the accessibility and equity of UPGS from the perspectives of multi-spatial scales and multi-time thresholds.
However, this study also had certain limitations. The current research mainly focused on the equity of UPGS resource allocation between geographical spatial distribution and population size. Future studies can further explore how UPGS promotes the comprehensive analysis of factors related to different social classes [51], cultural backgrounds [52], and age groups [53], as well as how to improve UPGS accessibility and equity for vulnerable groups, such as people with disabilities, low-income families, and the elderly [54,55]. Regarding Huiji District, where UPGS has a sparse spatial distribution and low density but relatively high accessibility and equity, it can be seen that in addition to geographical spatial distribution, UPGS supply indicators are also very important. This study mainly used area as the supply indicator, but UPGS accessibility is also affected by many factors, such as the number of fitness facilities [56], the quality of green and water landscapes [57], and park user ratings [58]. The research method of this study also has certain limitations: for the improved multi-mode G2SFCA method, the consideration of transportation modes is not comprehensive enough, and it does not fully cover the complex situations of public transportation [59] and the integration of multiple transportation modes [60]. Moreover, regarding the impact of research scales on accessibility and equity, this study only divided the 500 m and 1000 m grids; in the future, more types of research scales can be divided according to specific regions to systematically explore the impact of the MAUP problem.
The improved multi-transportation-mode G2SFCA method in this study has significant application potential in China and other cities in Asia, and its core lies in adapting to the highly dynamic and heterogeneous spatial structure of Asian cities. By integrating the multi-dimensional transportation network typical of high-density cities and real-time traffic data, this method can accurately depict the actual efficiency of the population in accessing key services under different commuting scenarios. For Southeast Asian cities such as Bangkok and Manila, which face severe traffic congestion and diverse transportation modes, this method can reveal the systemic barriers faced by vulnerable groups when accessing public services. For metropolitan areas highly dependent on rail transit, such as Tokyo and Seoul, it can evaluate the service accessibility of the elderly under slow-moving conditions, providing a quantitative basis for building inclusive cities. In promoting sustainable development, this method provides decision support for planners to achieve multi-dimensional development goals. By simulating the equity and efficiency of park coverage under multi-transportation strategies, this method can guide urban spatial resources toward green travel, reduce carbon emissions, and support the transformation of low-carbon cities. At the same time, the model’s accurate identification of service blind spots and population differentiation helps prioritize the layout of facilities such as parks in vulnerable areas, effectively promoting social equity, and upgrading infrastructure investment and public service allocation from empirical judgment to scientific planning oriented by “accessibility and equity indicators”, thereby maximizing the coordinated development of social, environmental, and economic benefits under the condition of limited spatial resources.
5. Conclusions
By adopting an analytical framework with multiple time thresholds and multiple spatial scales, this study systematically evaluated the spatial pattern, accessibility, and equity of urban park green space (UPGS) in Zhengzhou, and drew the following key conclusions:
(1) The distribution of urban park green space (UPGS) exhibits typical characteristics of dual-core agglomeration and axial extension. Accessibility blind spots are located at the edge of the study area, and the equity in the western and southern parts of the study area is relatively low. (2) The increase in travel time thresholds systematically improves the service level of UPGS, while spatial scales have a significant and dynamic impact on the evaluation results. (3) There is a significant spatial imbalance in UPGS resources. Although longer travel times can expand the spatial scope of equitable services, this process is accompanied by the spatial diffusion of services and, meanwhile, leads to the leveling of the overall service level.
The value of this study lies in revealing that the interaction effect between spatial scales and time thresholds is the key to understanding the pattern of urban public services. The constructed multi-method integrated analytical framework provides methodological support for accurately diagnosing spatial justice issues and optimizing resource allocation. Firstly, targeted and region-specific measures should be implemented based on the core–periphery structure of UPGS. For the identified service blind spots, key improvements should be made by building new pocket parks or optimizing transportation connections. Secondly, a hierarchical planning standard matching spatial scales should be established. For example, at the micro-community level, 5–10 min walking accessibility should be emphasized; at the macro-urban level, 15–20 min accessibility should be guaranteed through high-capacity public transportation, so as to balance the convenience of residents’ use and the service radius of facilities. Finally, through the organic connection of multi-scale planning, the allocation of UPGS resources should be promoted to evolve from extensive balance to precise and high-quality equity.
Author Contributions
Conceptualization, Yafei Wang and Tian Cui; methodology, Yafei Wang; software, Tian Cui; validation, Yafei Wang, Hongqiang Liu, and Tian Cui; formal analysis, Tian Cui; investigation, Tian Cui; resources, Yafei Wang and Chaoyang Shi; data curation, Wenyu Zhong; writing—original draft preparation, Yan Ma; writing—review and editing, Yafei Wang and Yunfei Zhang; visualization, Wenyu Zhong; supervision, Wenkai Liu; project administration, Bing Zhang; funding acquisition, Qingfeng Hu, Yafei Wang, and Chaoyang Shi. All authors have read and agreed to the published version of this manuscript.
Funding
This research was funded by the National Natural Science Foundation of China (grant no. 42101437), the National Key Research and Development Program of China (no. 2024YFC3212200), the Henan Science Foundation for Distinguished Young Scholars of China (no. 242300421041), the Henan Key Research and Development Program of China (no. 241111321100), the Science and Technology Innovation Team Project of Henan’s Higher Education Institutions for the Year 2025 (no. 25IRTSTHN008), and the Open Fund of the Engineering Laboratory of Spatial Information Technology for Highway Geological Disaster Early Warning in Hunan Province (Changsha University of Science and Technology, kfj230701).
Data Availability Statement
The area and population data of Zhengzhou City were sourced from the official website of Zhengzhou Municipal Government (https://tjj.zhengzhou.gov.cn/u/cms/tjj/statistical_2024/index.htm, accessed on 23 January 2025). Population raster data were sourced from the WorldPop official website (https://www.worldpop.org/, accessed on 1 January 2025). Urban park and green space data were acquired from the Baidu Maps Open Platform (https://lbsyun.baidu.com/, accessed on 9 January 2025). Path-planning data were derived from the Baidu Maps Open Platform (https://lbsyun.baidu.com/, accessed on 11 January 2025).
Conflicts of Interest
The authors declare no conflicts of interest.
Abbreviations
The following abbreviations were used in this manuscript:
| UPGS | Urban park green space |
| MAUP | Modifiable areal unit problem |
| POI | Point of interest |
| AOI | Area of interest |
| API | Application programming interface |
| LQ | Location quotient |
| OSM | OpenStreetMap |
References
- Yu, S.B.; Zeng, P.; Xie, X.L.; Chen, D.D. Equitable evaluation of supply-demand and layout optimization of urban park green space in high-density linear large city. PLoS ONE 2024, 19, e0310015. [Google Scholar] [CrossRef] [PubMed]
- Yang, J.P. Research on optimization strategies for urban park green space planning in Nanjing based on GIS from the perspectives of network analysis and Thiessen polygon theory. Int. J. Mod. Phys. C 2025, 36, 2441002. [Google Scholar] [CrossRef]
- Long, Y.; Qin, J.; Wu, Y.; Wang, K. Analysis of Urban Park Accessibility Based on Space Syntax: Take the Urban Area of Changsha City as an Example. Land 2023, 12, 1061. [Google Scholar] [CrossRef]
- Qin, J.; Tong, S.; Wang, Q. Exploring the disparities in urban park accessibility from multiple demand perspectives: A case study in Beijing, China. Ecol. Indic. 2024, 163, 112124. [Google Scholar] [CrossRef]
- Jeon, Y.; Jung, S. Spatial Equity of Urban Park Distribution: Examining the Floating Population within Urban Park Catchment Areas in the Context of the 15-Minute City. Land 2024, 13, 24. [Google Scholar] [CrossRef]
- Xia, G.; He, G.; Zhang, X. Assessing the Spatial Equity of Urban Park Green Space Layout from the Perspective of Resident Heterogeneity. Sustainability 2024, 16, 5631. [Google Scholar] [CrossRef]
- Yang, Z.; Fang, H.; Wei, G.; Mo, J.; Gao, X.; Zhang, S. An assessment of urban park accessibility using multi-source data in Hefei, China: A social equity perspective. Land Degrad. Dev. 2024, 35, 3627–3641. [Google Scholar] [CrossRef]
- Wang, J.; Jiang, H.; Wang, M.; Xiong, Y.; Zhu, A.; Wang, F. Assessment of Spatial Equality and Social Justice of Urban Park Distribution from Park Category Perspective: Evidence from Shanghai, China. Sustainability 2025, 17, 5474. [Google Scholar] [CrossRef]
- Liu, H.; Remme, R.P.; Hamel, P.; Nong, H.; Ren, H. Supply and demand assessment of urban recreation service and its implication for greenspace planning-A case study on Guangzhou. Landsc. Urban Plan. 2020, 203, 103898. [Google Scholar] [CrossRef]
- Ke, X.; Huang, D.; Zhou, T.; Men, H. Contribution of non-park green space to the equity of urban green space accessibility. Ecol. Indic. 2023, 146, 109855. [Google Scholar] [CrossRef]
- Hansen, W.G. How Accessibility Shapes Land Use. J. Am. Inst. Plan. 1959, 25, 73–76. [Google Scholar] [CrossRef]
- Talen, E.; Anselin, L. Assessing spatial equity: An evaluation of measures of accessibility to public playgrounds. Environ. Plan. A 1998, 30, 595–613. [Google Scholar] [CrossRef]
- Ali, M.J.; Rahaman, A.; Arafat, M.Y. Exploring how distribution pattern of urban green space relates to accessibility, utilization and health: Diagnostic planning for sustainable city living in KMC, India. Habitat Int. 2025, 161, 103408. [Google Scholar] [CrossRef]
- Zhang, L.; Chen, P.; Hui, F. Refining the accessibility evaluation of urban green spaces with multiple sources of mobility data: A case study in Shenzhen, China. Urban For. Urban Green. 2022, 70, 127550. [Google Scholar] [CrossRef]
- Almeida, D.Q.; Paciencia, I.; Moreira, C.; Rufo, J.C.; Moreira, A.; Santos, A.C.; Barros, H.; Ribeiro, A.I. Green and blue spaces and lung function in the Generation XXI cohort: A life-course approach. Eur. Respir. J. 2022, 60, 2103024. [Google Scholar] [CrossRef]
- Tomasiello, D.B.; Herszenhut, D.; Oliveira, J.L.A.; Braga, C.K.V.; Pereira, R.H.M. A time interval metric for cumulative opportunity accessibility. Appl. Geogr. 2023, 157, 103007. [Google Scholar] [CrossRef]
- Xiao, Z.; Mao, B.; Xu, Q.; Chen, Y.; Wei, R. Reliability of Accessibility: An Interpreted Approach to Understanding Time-Varying Transit Accessibility. J. Adv. Transp. 2022, 2022, 9380884. [Google Scholar] [CrossRef]
- Zhang, S.; Yu, P.; Chen, Y.; Jing, Y.; Zeng, F. Accessibility of Park Green Space in Wuhan, China: Implications for Spatial Equity in the Post-COVID-19 Era. Int. J. Environ. Res. Public Health 2022, 19, 5440. [Google Scholar] [CrossRef]
- Yang, W.; Cheng, Y.; Xu, C.; Zhang, J. The Seasonal Migrants Spatially Affect the Park Green Space Accessibility and Equity under Different Travel Modes: Evidence from Sanya, China. ISPRS Int. J. Geo-Inf. 2023, 12, 423. [Google Scholar] [CrossRef]
- Khattak, M.M.H.; Khan, M.A.; Din, S.U.; Khan, M.Z.; Habib, M.F. Examining equity of walking accessibility to green spaces: A case study of Islamabad. Ain Shams Eng. J. 2023, 14, 102556. [Google Scholar] [CrossRef]
- Chen, P.; Wang, W.; Qian, C.; Cao, M.; Yang, T. Gravity-based models for evaluating urban park accessibility: Why does localized selection of attractiveness factors and travel modes matter? Environ. Plan. B-Urban Anal. City Sci. 2024, 51, 904–922. [Google Scholar] [CrossRef]
- Zhang, R.; Huang, L.; Wang, H. Accessibility Improvement and Renewal of Urban Park Green Space for the Elderly and the Disabled. Forests 2023, 14, 1801. [Google Scholar] [CrossRef]
- Cui, Q.; Tan, L.; Ma, H.; Wei, X.; Yi, S.; Zhao, D.; Lu, H.; Lin, P. Effective or useless? Assessing the impact of park entrance addition policy on green space services from the 15-min city perspective. J. Clean. Prod. 2024, 467, 142951. [Google Scholar] [CrossRef]
- Wang, H.; Wei, X.; Ao, W. Assessing Park Accessibility Based on a Dynamic Huff Two-Step Floating Catchment Area Method and Map Service API. Isprs Int. J. Geo-Inf. 2022, 11, 394. [Google Scholar] [CrossRef]
- Kong, X.; Sun, Y.; Xu, C. Effects of Urbanization on the Dynamics and Equity of Access to Urban Parks from 2000 to 2015 in Beijing, China. Forests 2021, 12, 1796. [Google Scholar] [CrossRef]
- Zhou, Y.; Xie, H.; Liu, X.; Wang, X.; Wang, Z. From service capacity to spatial equity: Accurately and comprehensively evaluating urban park green space distribution under multi-trips mode. PLoS ONE 2024, 19, e0296629. [Google Scholar] [CrossRef]
- Ying, J.; Guo, Y.; Shao, Z.; Zhang, Y.; Zhang, R. Study on the Social Equity Impact Path of Community Life Circle Green Space from the Perspective of Configuration. Acta Montan. Slovaca 2022, 27, 201–215. [Google Scholar] [CrossRef]
- Zhang, J.; Li, J. Study on the Spatial Arrangement of Urban Parkland under the Perspective of Equity-Taking Harbin Main City as an Example. Land 2024, 13, 248. [Google Scholar] [CrossRef]
- Li, Y.; Xie, Y.; Sun, S.; Hu, L. Evaluation of Park Accessibility Based on Improved Gaussian Two-Step Floating Catchment Area Method: A Case Study of Xi’an City. Buildings 2022, 12, 871. [Google Scholar] [CrossRef]
- He, S.; Wu, Y.; Wang, L. Characterizing Horizontal and Vertical Perspectives of Spatial Equity for Various Urban Green Spaces: A Case Study of Wuhan, China. Front. Public Health 2020, 8, 10. [Google Scholar] [CrossRef]
- Yu, P.; Chan, E.H.W.; Yung, E.H.K.; Wong, M.S.; Chen, Y. Open space fragmentation in Hong Kong’s built-up area: An integrated approach based on spatial horizontal and vertical equity lenses. Environ. Impact Assess. Rev. 2023, 102, 107174. [Google Scholar] [CrossRef]
- Xing, L.; Liu, Y.; Liu, X.; Wei, X.; Mao, Y. Spatio-temporal disparity between demand and supply of park green space service in urban area of Wuhan from 2000 to 2014. Habitat Int. 2018, 71, 49–59. [Google Scholar] [CrossRef]
- Xie, Q.; Lu, M. Measures of Spatial and Demographic Disparities in Access to Urban Green Space in Harbin, China. Complexity 2020, 2020, 8832343. [Google Scholar] [CrossRef]
- Mylona, E.K.; Shehadeh, F.; Fleury, E.; Kalligeros, M.; Mylonakis, E. Neighborhood-Level Analysis on the Impact of Accessibility to Fast Food and Open Green Spaces on the Prevalence of obesity. Am. J. Med. 2020, 133, 340–346.e1. [Google Scholar] [CrossRef]
- Li, F.; Zhang, F.; Li, X.; Wang, P.; Liang, J.; Mei, Y.; Cheng, W.; Qian, Y. Spatiotemporal Patterns of the Use of Urban Green Spaces and External Factors Contributing to Their Use in Central Beijing. Int. J. Environ. Res. Public Health 2017, 14, 237. [Google Scholar] [CrossRef]
- Robbennolt, D.; Witmer, A.-P. GIS-Based Approach to Dynamic Accessibility: Incorporating a User Perspective to Recognize Social Equity Implications. Transp. Res. Rec. 2023, 2677, 22–33. [Google Scholar] [CrossRef]
- Baghestani, A.; Nikbakht, M.; Kucheva, Y.; Afshar, A. Assessing spatial and racial equity of subway accessibility: Case study of New York City. Cities 2024, 155, 105489. [Google Scholar] [CrossRef]
- Gong, F.-Y. Modeling walking accessibility to urban parks using Google Maps crowdsourcing database in the high-density urban environments of Hong Kong. Sci. Rep. 2023, 13, 20798. [Google Scholar] [CrossRef]
- Luo, W.; Chen, H.; Yang, Z.; Liu, J. Accessibility and Equity of Park Green Spaces: Considering Differences in Walking Speeds Across Age Groups. Land 2024, 13, 2240. [Google Scholar] [CrossRef]
- Dong, L.; Mei-Po, K.; Zihan, K.; Jianying, W. Toward a Healthy Urban Living Environment: Assessing 15-Minute Green-Blue Space Accessibility. Sustainability 2022, 14, 16914. [Google Scholar] [CrossRef]
- Kai, X.; Hao, X.; Jing, W. The Accessibility of Nanjing Urban Park Based on GIS. Open House Int. 2019, 44, 112–117. [Google Scholar] [CrossRef]
- Yu, S.; Zhu, X.; He, Q. An Assessment of Urban Park Access Using House-Level Data in Urban China: Through the Lens of Social Equity. Int. J. Environ. Res. Public Health 2020, 17, 2349. [Google Scholar] [CrossRef] [PubMed]
- Chuandong, T.; Yuhan, T.; Xuefei, W. Evaluation of the Equity of Urban Park Green Space Based on Population Data Spatialization: A Case Study of a Central Area of Wuhan, China. Sensors 2019, 19, 2929. [Google Scholar] [CrossRef]
- Xin, L.; Ying, H.; Xiaodong, M. Evaluation of the accessible urban public green space at the community-scale with the consideration of temporal accessibility and quality. Ecol. Indic. 2021, 131, 108231. [Google Scholar] [CrossRef]
- Guo, H.; Zhang, S.; Xie, X.; Liu, J.; Ho, H.C. Moderation Effects of Streetscape Perceptions on the Associations Between Accessibility, Land Use Mix, and Bike-Sharing Use: Cross-Sectional Study. JMIR Public Health Surveill. 2024, 10, e58761. [Google Scholar] [CrossRef]
- Le Texier, M.; Schiel, K.; Caruso, G. The provision of urban green space and its accessibility: Spatial data effects in Brussels. PLoS ONE 2018, 13, e0204684. [Google Scholar] [CrossRef]
- Niu, Q.; Wang, Y.; Xia, Y.; Wu, H.; Tang, X. Detailed Assessment of the Spatial Distribution of Urban Parks According to Day and Travel Mode Based on Web Mapping API: A Case Study of Main Parks in Wuhan. Int. J. Environ. Res. Public Health 2018, 15, 1725. [Google Scholar] [CrossRef]
- Zheng, Y.; Lin, T.; Hamm, N.A.S.; Liu, J.; Zhou, T.; Geng, H.; Zhang, J.; Ye, H.; Zhang, G.; Wang, X.; et al. Quantitative evaluation of urban green exposure and its impact on human health: A case study on the 3-30-300 green space rule. Sci. Total Environ. 2024, 924, 171461. [Google Scholar] [CrossRef]
- Sun, Y.; Tian, D.W.; Zhang, M.; Hou, Y. Spatial Green Space Accessibility in Hongkou District of Shanghai Based on Gaussian Two-Step Floating Catchment Area Method. Buildings 2023, 13, 2477. [Google Scholar] [CrossRef]
- Li, S.M.; Zeng, X.Y.; Zhang, X.G.; Jiang, J.C.; Wang, F.R.; Zhang, T.C.; Zhang, J.C. Spatial Justice of Urban Park Green Space under Multiple Travel Modes and at Multiple Scales: A Case Study of Qingdao City Center, China. Sustainability 2024, 16, 1428. [Google Scholar] [CrossRef]
- Cui, Q.; Huang, Y.; Yang, G.; Chen, Y. Measuring Green Exposure Levels in Communities of Different Economic Levels at Different Completion Periods: Through the Lens of Social Equity. Int. J. Environ. Res. Public Health 2022, 19, 9611. [Google Scholar] [CrossRef]
- Ma, Y.; Brindley, P.G.; Lange, E. Comparison of urban green space usage and preferences: A case study approach of China and the UK. Landsc. Urban Plan. 2024, 249, 105112. [Google Scholar] [CrossRef]
- Ma, Y.; Brindley, P.; Lange, E. The Influence of Socio-Demographic Factors on Preference and Park Usage in Guangzhou, China. Land 2022, 11, 1219. [Google Scholar] [CrossRef]
- Bao, Z.; Bai, Y.; Geng, T. Examining Spatial Inequalities in Public Green Space Accessibility: A Focus on Disadvantaged Groups in England. Sustainability 2023, 15, 13507. [Google Scholar] [CrossRef]
- Wang, Y.; Chang, Q. The role of urban parks in affecting health outcomes and the differences between vulnerable groups: Evidence from the central city of Beijing. Urban For. Urban Green. 2023, 89, 128110. [Google Scholar] [CrossRef]
- Lv, X.; Li, K.; Cheng, J.; Ren, Z. Demand-Responsive Evaluation and Optimization of Fitness Facilities in Urban Park Green Spaces. Buildings 2025, 15, 2500. [Google Scholar] [CrossRef]
- Xu, M.Y.; Xin, J.; Su, S.L.; Weng, M.; Cai, Z.L. Social inequalities of park accessibility in Shenzhen, China: The role of park quality, transport modes, and hierarchical socioeconomic characteristics. J. Transp. Geogr. 2017, 62, 38–50. [Google Scholar] [CrossRef]
- Mao, K.A.; Li, J.Z.; Yan, H.W. Measuring the Spatial Accessibility of Parks in Wuhan, China, Using a Comprehensive Multimodal 2SFCA Method. ISPRS Int. J. Geo-Inf. 2023, 12, 357. [Google Scholar] [CrossRef]
- Gu, K.; Liu, J.; Wang, D.; Dai, Y.; Li, X. Analyzing the Supply and Demand Dynamics of Urban Green Spaces Across Diverse Transportation Modes: A Case Study of Hefei City’s Built-Up Area. Land 2024, 13, 1937. [Google Scholar] [CrossRef]
- Qin, J.; Liu, Y.; Yi, D.; Sun, S.; Zhang, J. Spatial Accessibility Analysis of Parks with Multiple Entrances Based on Real-Time Travel: The Case Study in Beijing. Sustainability 2020, 12, 7618. [Google Scholar] [CrossRef]
Disclaimer/Publisher’s Note: The statements, opinions and data contained in all publications are solely those of the individual author(s) and contributor(s) and not of MDPI and/or the editor(s). MDPI and/or the editor(s) disclaim responsibility for any injury to people or property resulting from any ideas, methods, instructions or products referred to in the content. |
© 2025 by the authors. Published by MDPI on behalf of the International Society for Photogrammetry and Remote Sensing. Licensee MDPI, Basel, Switzerland. This article is an open access article distributed under the terms and conditions of the Creative Commons Attribution (CC BY) license (https://creativecommons.org/licenses/by/4.0/).