Article

Assessing Fire Station Accessibility in Guiyang, a Mountainous City, with Nighttime Light and POI Data: An Application of the Enhanced 2SFCA Approach

1
College of Geography and Planning, Chengdu University of Technology, Chengdu 610059, China
2
Research Center for Human Geography of Tibetan Plateau and Its Eastern Slope (Chengdu University of Technology), Chengdu 610059, China
3
Department of Regional and City Planning, College of Architecture and Civil Engineering, Zhejiang University, Hangzhou 310058, China
*
Author to whom correspondence should be addressed.
ISPRS Int. J. Geo-Inf. 2025, 14(10), 393; https://doi.org/10.3390/ijgi14100393
Submission received: 5 August 2025 / Revised: 1 October 2025 / Accepted: 7 October 2025 / Published: 9 October 2025

Abstract

Mountainous urban areas like Guiyang face unique fire safety challenges due to rugged terrain and complex road networks, which hinder fire station accessibility. This study proposes a GIS-based framework that integrates nighttime light (NPP/VIIRS) and point of interest (POI) data to assess fire risk and accessibility. Kernel density estimation quantified POI distributions across four risk categories, and the Spatial Appraisal and Valuation of Environment and Ecosystems (SAVEE) model combined these with NPP/VIIRS data to generate a composite fire risk map. Accessibility was evaluated using the enhanced two-step floating catchment area (E2SFCA) method with road network travel times; 80.13% of demand units were covered within the five-minute threshold, while 53.25% of all units exhibited low accessibility. Spatial autocorrelation analysis (Moran’s I) revealed clustered high risk in central basins and service gaps on surrounding hills, reflecting the dominant influence of terrain alongside protected forests and farmlands. The results indicate that targeted road upgrades and station relocations can improve fire service coverage. The approach is scalable and supports more equitable emergency response in mountainous settings.

1. Introduction

Urbanization in mountainous regions worldwide brings distinct challenges to public safety, particularly in ensuring efficient responses to fire emergencies. Rugged terrain, dense vegetation, complex road networks, and unique climatic factors are common in these areas. These characteristics impede fire station accessibility [1,2], which is a critical factor in safeguarding lives and property. As a result, mountainous cities are more vulnerable to fire hazards than their lowland counterparts [3,4,5]. Similar challenges have been reported in California, U.S., in cities such as Moraga-Orinda [6] and Olympic Valley [7], as well as during the Palisades and Eaton wildfires [8]. Comparable issues have also been observed in other mountainous cities worldwide, including Kathmandu, Nepal [9], San Ignacio de Velasco, Bolivia [10], and Porto Alegre City, Brazil [11]. Guiyang, a fast-growing city in southwest China, exemplifies these difficulties due to its karst topography and rising urban density.
To address the fire vulnerability of mountainous cities, it is essential to analyze the accessibility of fire stations within the legally mandated response time. Nighttime lights and POI data are commonly used to characterize human activity and potential fire risks, respectively. By integrating these two data sources within a Geographic Information System (GIS)-based framework, this study achieves a more comprehensive and nuanced representation of fire service demand and risk. Specifically, POI data are classified into four categories of potential fire risk locations, and kernel density estimation (KDE) is used to estimate the spatial distribution of fire risk for each type [12]. These POI-based risks are then combined with classified NPP/VIIRS nighttime light intensity using the SAVEE method to generate a composite fire risk surface, which serves as the basis for subsequent fire service demand analysis. This dual-source approach is supported by previous research, which has demonstrated the effectiveness of combining discrete and continuous spatial indicators for public service facility planning and risk assessment [13,14,15]. To further evaluate accessibility, the E2SFCA method, which incorporates a distance-decay function and road network analysis, was adopted to enable a more precise assessment of fire station accessibility in the complex urban environment of Guiyang.
This study had four objectives: (1) to apply the SAVEE method to integrate NPP/VIIRS and POI data and derive a composite fire risk surface that is transformed into a fire service demand index for subsequent analysis; (2) to evaluate five-minute fire station accessibility in Guiyang’s central urban area using the E2SFCA method; (3) to analyze spatial clustering patterns of five-minute fire service coverage; and (4) to develop recommendations to improve coverage, including road network enhancements, station layout refinement, and adoption of technologies such as drones for remote areas. By integrating remote sensing and GIS technologies, this study advances the methodological framework for accessibility analysis and offers actionable insights for urban planners and emergency managers in mountainous regions. The proposed approach is scalable and provides a practical tool for enhancing fire service equity and efficiency, with broader implications for mountainous cities worldwide.

2. Literature Review

Fire station accessibility is a crucial concern in urban planning and public safety, particularly in mountainous cities where complex terrain introduces distinct challenges. In this regard, many studies have explored accessibility analysis, the integration of remote sensing technologies, GIS methodologies, and the specific challenges posed by mountainous landscapes, collectively establishing the theoretical and methodological foundations of the current investigation.
The concept of spatial accessibility emerged in geography, with Hansen [16] defining it as the “potential for interaction opportunities,” thus laying the foundation for subsequent research. Morris et al. [17] later refined this framework, highlighting accessibility as “the means to reach activity locations from an origin,” thereby shifting focus to the pathways connecting supply and demand. Traditional approaches, such as buffer analysis [18,19,20], KDE [21,22], and network analysis [23,24], have been widely employed to evaluate facility coverage but often overlook dynamic shifts in population distribution and service demand [25]. More recently, the two-step floating catchment area (2SFCA) method has emerged as a robust tool for integrating supply and demand dynamics [26,27,28]. The 2SFCA framework, based on the gravity model, uses spatial search radii and cumulative opportunities to derive supply–demand ratios, accounting for both supply and demand. However, conventional 2SFCA assumes uniform access probability within thresholds, which oversimplifies real-world conditions [29,30]. Wang discussed the limitations of this method, as well as improvements proposed by other scholars [31]. The incorporation of the kernel density function [21] and the Gaussian distance-decay function [32] further refined the model. In 2009, these advancements led to the development of the enhanced two-step floating catchment area (E2SFCA) method, which further improved the original approach by explicitly incorporating a distance-decay function to better reflect the diminishing accessibility with increasing travel distance, thereby enhancing its practical applicability [33]. This model was initially applied to conduct accessibility analyses of healthcare facilities, with numerous studies concerning the accessibility of medical and health service facilities. Due to its reliability, the model has increasingly been adopted in studies of the accessibility of public service facilities, such as fire stations [34,35,36,37,38]. In China, studies on fire station accessibility in mountainous cities remain sparse, as many models were developed for flat terrains and inadequately addressed complex topography.
The use of POI data and nighttime light (NPP/VIIRS) data for fire risk and accessibility assessment is based on their complementary advantages. POI data provide detailed information about the locations and types of potential fire risk sites, such as gas stations, schools, and crowded public facilities. This allows for a direct understanding of where fire services are most needed [39,40,41]. However, relying only on POI data may miss areas with high human activity that do not have obvious risk points. Nighttime light data, in contrast, are a reliable indicator of urban activity and population distribution [42]. They offer continuous coverage and can reveal both formal and informal settlements, as well as areas with changing population flows [43,44]. This allows the identification of hidden fire risks in areas not covered by POI data, such as densely populated residential neighborhoods or informal communities. Many studies have shown that nighttime light data effectively represent human activity, including population concentration [45,46,47] and economic activity [42,48,49]. Areas with high population and economic activity also tend to have a higher fire risk [15]. Therefore, nighttime light data can be used to identify areas with greater demand for fire services [13,14]. When POI data, which provide specific information on potential fire risk locations [12,50,51,52], are combined with nighttime light data, the result is a more detailed and accurate assessment of fire risk and service needs [12,51]. Recent research supports this integrated approach, demonstrating its effectiveness in planning public service facilities and assessing risks in complex urban environments.
In this study, the SAVEE model [13,53] was employed to integrate the results of POI-based KDE with the classified NPP/VIIRS nighttime lights to derive a composite fire risk surface for a mountainous city. The SAVEE model is an evaluation methodology that quantifies normalized values, developed by the STARR Lab at Texas A&M University as a comprehensive valuation approach [54]. The SAVEE method uses the “Essential MYCIN” (EMYCIN) algorithm to perform the superposition of normalized values. The EMYCIN inference engine, originally developed in the 1970s as a general-purpose expert system framework, was derived from the earlier MYCIN system by removing its domain-specific medical knowledge [53]. Its adaptability enabled subsequent applications beyond medicine. Since the 1990s, the integration of the EMYCIN algorithm with GIS has been increasingly adopted in landscape ecology-related research, management, and planning [55,56,57]. This combined approach has demonstrated significant potential for spatially assessing the value of different areas, supporting resource suitability evaluation [58], sustainable development assessment and classification [59], and fire risk assessment [60,61]. These developments have laid the foundation for applying the SAVEE methodology to fire risk assessment, enabling the integrated analysis of multiple factors and the generation of spatially explicit fire risk indices at various resolutions. In addition, the E2SFCA, which integrates a distance decay function and detailed road network data, enables the accessibility and spatial variability of fire stations to be evaluated more realistically in complex mountainous environments. This approach accounts for the actual travel time costs imposed by terrain and infrastructure, providing city governments with a more accurate basis for optimizing fire station layout and road network planning.
Although prior work has advanced accessibility methods and remote sensing applications, gaps remain in integrating multi-source indicators and adapting accessibility models to the constraints of mountainous terrain. This study addresses these gaps with three targeted contributions: (1) a SAVEE+EMYCIN workflow that fuses NPP/VIIRS and POI-derived hazard metrics into a normalized composite fire risk surface; (2) an adaptation of the E2SFCA method that uses road network travel times and a Gaussian distance-decay weighting to provide more realistic accessibility estimates in karst and hilly environments; and (3) the translation of detailed risk and accessibility results into actionable recommendations for road improvements and station relocation to inform territorial spatial planning. These focused methodological and application advances distinguish the present work from previous studies and enhance its relevance for policy and planning in mountainous cities.

3. Study Area and Data Processing

3.1. Study Area

Guiyang City, the capital of Guizhou Province, is situated in southwestern China on the Yunnan–Guizhou Plateau, spanning geographic coordinates from 106°07′ E to 107°17′ E and from 26°11′ N to 26°55′ N. The region is characterized by a mountainous and hilly terrain, typical of a karst landform area, with mountains covering 52.30% of the area and a forest coverage rate of 55.3%. It experiences a subtropical monsoon climate with high humidity, an annual average temperature of approximately 15.3 °C, and a long-term average precipitation of about 1129.5 mm. Within the urban area, green spaces cover 59,907.09 hectares while residential land in the built-up area totals 7317.72 hectares, and there are 139 urban parks with a combined area of 5401.69 hectares. By the end of 2024, Guiyang’s gross domestic product (GDP) reached CNY 577.741 billion, with a permanent population of 6.6025 million, of which 5.3163 million resided in urban areas, resulting in an urbanization rate of 80.52% [62,63]. The study area encompasses the main urban zone within the Ring Highway of Guiyang City, covering Nanming District, Huaxi District, Wudang District, Baiyun District, a portion of Guanshanhu District, and the entirety of Yunyan District, spanning approximately 568.5 km2. The terrain of the study area exhibits significant elevation variations, with the northwestern part being higher and the central region forming a low-lying karst basin. It is primarily located within the Guiyang–Zhongcaosi syncline basin and the Baiyun–Huaxi–Qingyan area, with an average elevation of around 1000 m, as illustrated in the accompanying figure (see Figure 1).

3.2. Data Sources and Pre-Processing

The data required for this article and its sources are summarized in Table 1.
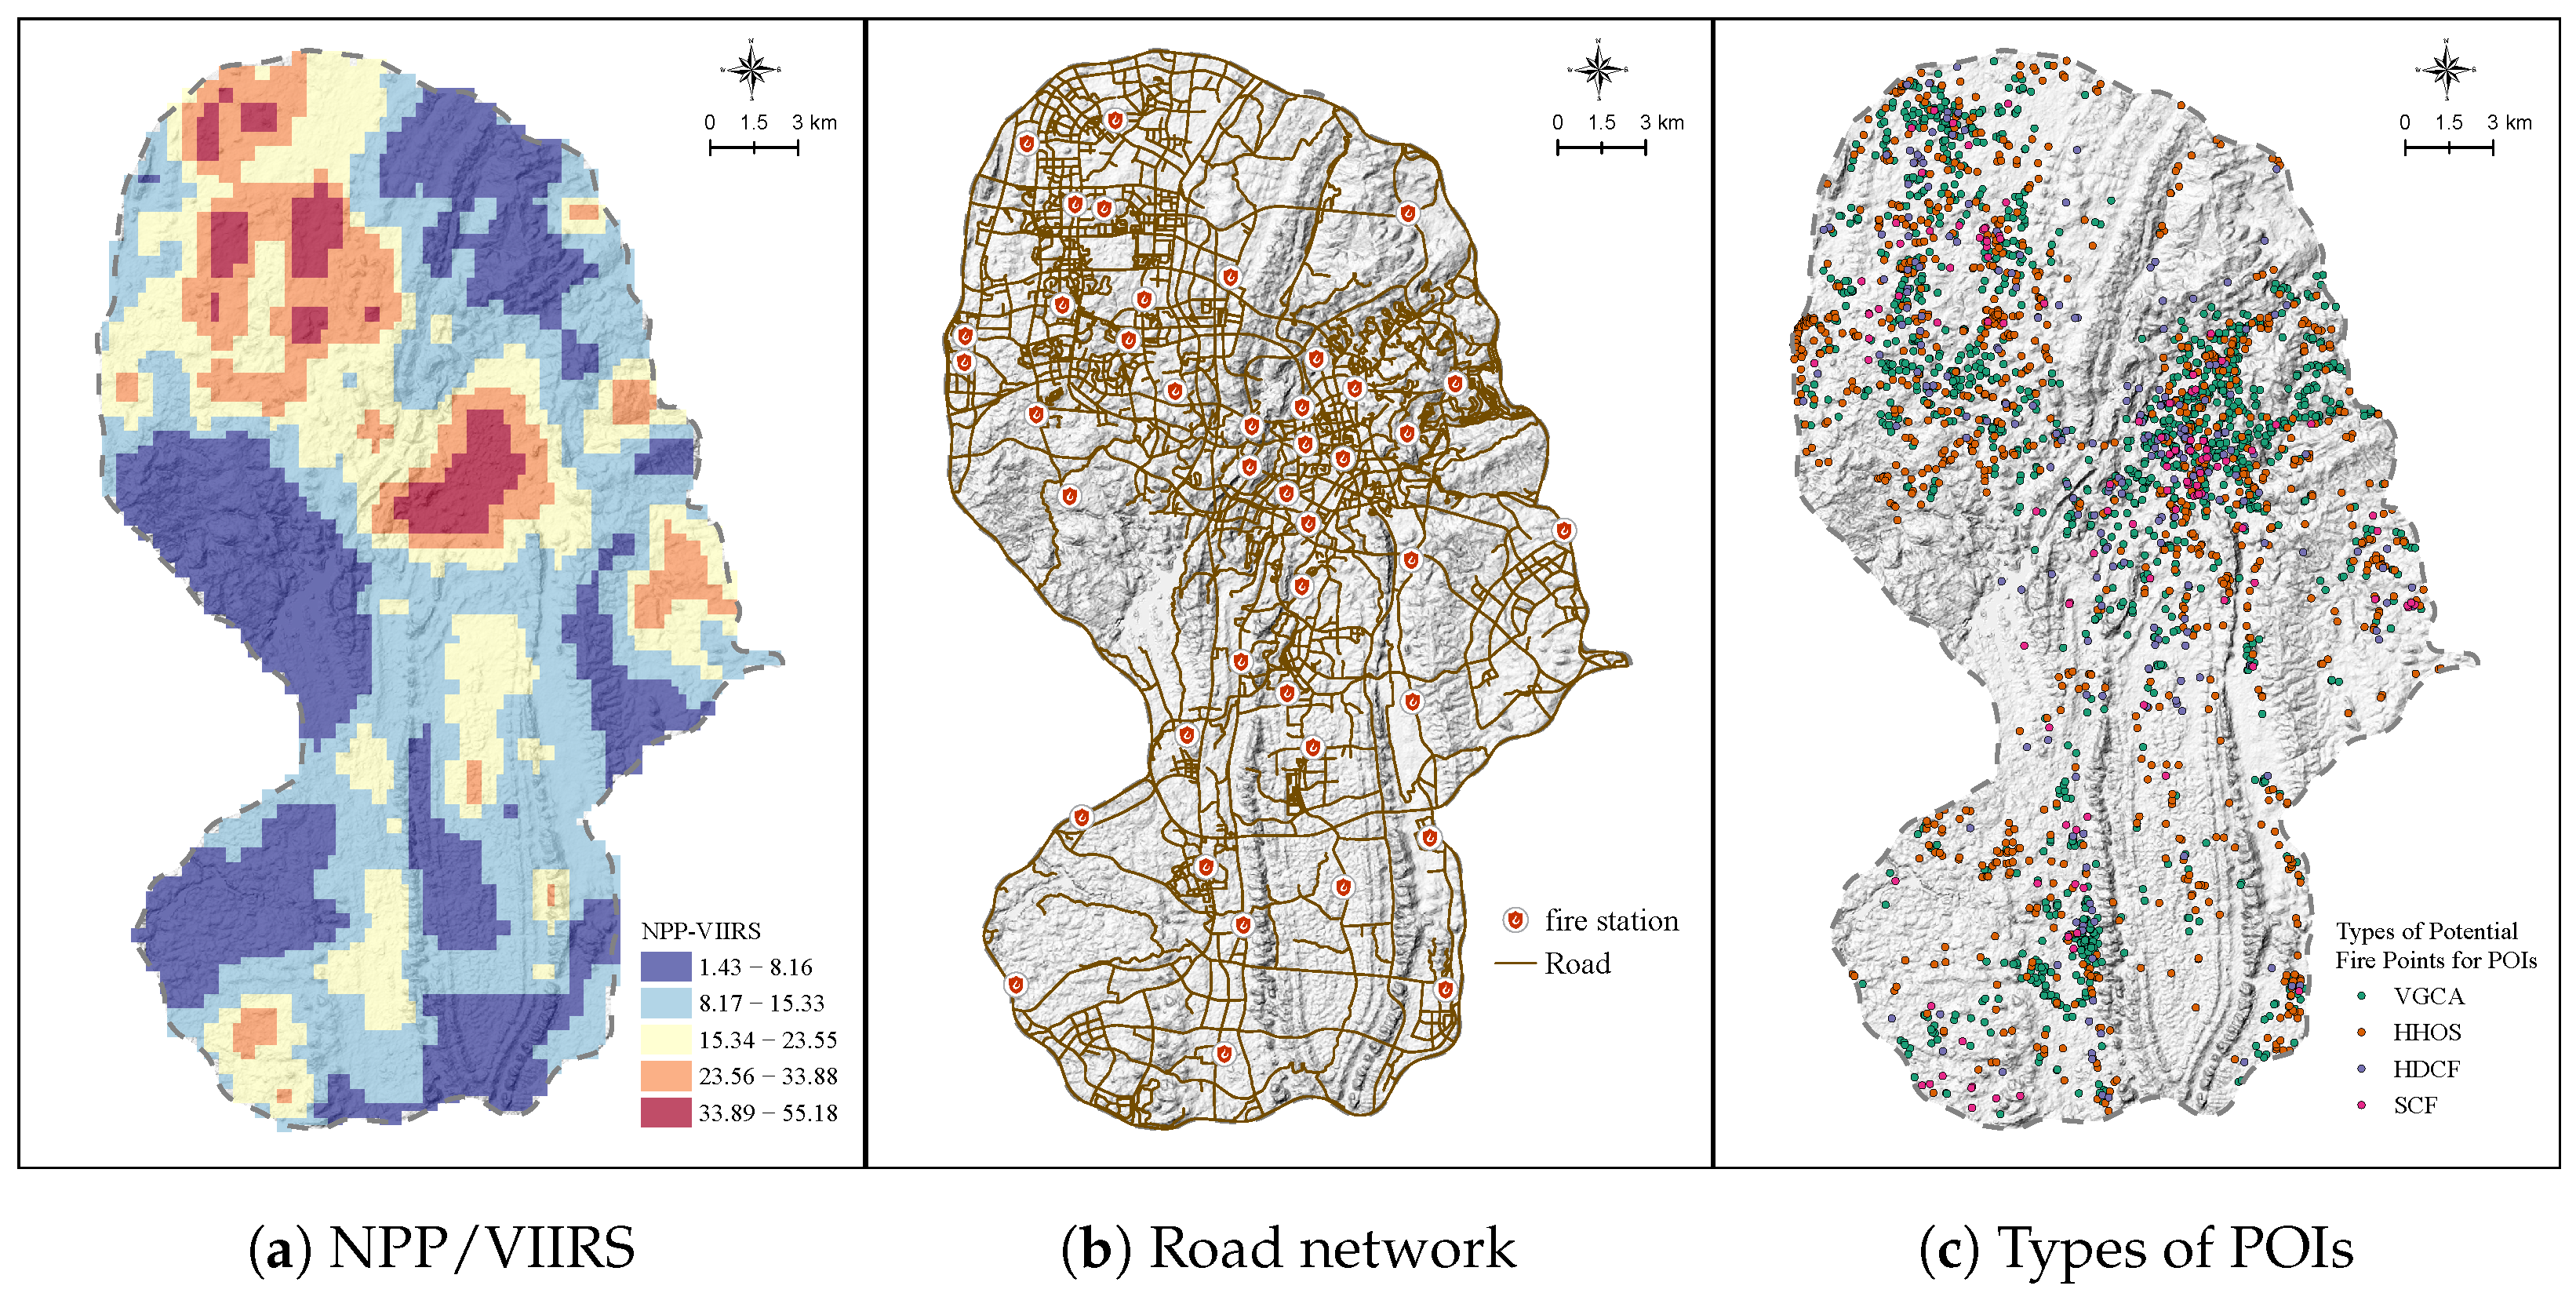
All spatial data were subjected to projection transformation using ArcGIS Pro (version 3.5.2), standardizing the projected coordinate system to “CGCS2000 GK Zone 18”. All raster data were resampled to a 250 m resolution, and the NPP/VIIRS data underwent noise reduction processing (Figure 2a); subsequently, the NPP/VIIRS data were specifically classified into three levels from low to high using the Natural Breaks (Jenks) method in ArcGIS Pro. The road network data, now unified in the projected coordinate system, were clipped, and the Guiyang City Ring Highway was extracted to create vector data for defining the study area’s boundaries. The roads within the study area were converted into single-line roads through a centerline extraction operation, followed by the identification and correction of topological errors (Figure 2b). Potential fire points were categorized into four types based on POI characteristics: high-hazard operation sites (HHOSs), vulnerable group congregate areas (VGCAs), high-density crowd facilities (HDCFs), and science and culture facilities (SCFs) (Figure 2c). High-hazard operation sites primarily encompass facilities such as fuel stations, gas refilling stations, EV charging stations, manufacturing complexes, and logistics warehouses—locations handling flammable/explosive materials that necessitate enhanced fire protection measures. Vulnerable group congregate areas encompass facilities such as schools, nursing homes, and hospitals where substantial populations of vulnerable individuals are concentrated, characterized by compromised evacuation capacity and heightened susceptibility to injury during fire emergencies. High-density crowd facilities primarily refer to scenic attractions, commercial centers, transportation hubs, and high-density residential zones characterized by extreme crowd concentrations where fire incidents may trigger catastrophic mass-casualty events. Science and culture facilities encompass libraries, museums, and historic sites housing collections of exceptional cultural/scientific significance [14]. Subsequently, the filtered and verified POI data were converted into vector data, and after clipping and coordinate projection transformation, the locations of fire stations and potential fire points within the study area were obtained.

4. Methods

4.1. Research Design Flowchart

To systematically address the challenges of fire station accessibility in mountainous cities, this study adopts an integrated methodological framework that combines multi-source spatial data, advanced risk modeling, and accessibility analysis. The overall research design is structured in sequential stages, from data collection and pre-processing, through fire risk assessment and accessibility modeling, to spatial statistical analysis and optimization recommendations. The workflow is illustrated in Figure 3, providing a clear overview of the logical relationships and analytical steps undertaken in this study.
Figure 3 presents the research design flowchart, which outlines the main stages of the analysis: (1) data collection and pre-processing, including nighttime light (NPP/VIIRS), POI, road network, and DEM data; (2) fire risk assessment using KDE, the SAVEE model, and EMYCIN aggregation; (3) accessibility analysis via the E2SFCA method; (4) spatial statistical analysis employing Moran’s I and Getis-Ord statistics; and (5) optimization and recommendations for fire station layout and road network improvements. This structured approach ensures that each analytical step builds upon the previous one, enabling a comprehensive and targeted evaluation of fire service accessibility in the complex terrain of Guiyang.

4.2. Urban Fire Risk Assessment

The magnitude of urban fire risk serves as an indicator of the demand level for fire services across spatial units within a city. This study employs NPP/VIIRS nighttime light images and POI data to comprehensively assess fire risk in Guiyang’s main urban area.

4.2.1. Facility-Type-Specific Kernel Density Analysis

Kernel density analysis was performed for each POI category using ArcGIS Pro software based on the classified POI data in order to quantify and visualize the spatial distribution of fire risks.

4.2.2. Overall Fire Risk Assessment Based on SAVEE Model

The SAVEE model serves as a comprehensive multi-dimensional value assessment framework capable of reflecting the differential influences of multi-source driving factors [53,60] and features advantages such as simplified quantitative analysis and high operability. Fundamentally, the SAVEE approach involves selecting relevant factors, standardizing them to obtain normalized values, and subsequently performing superposition of all factor values using an additive formula, thereby enabling the quantitative processing of complex decision-making and evaluation problems. The main steps of the SAVEE method are thus divided into (1) data normalization and (2) superposition operations.
(1) 
Normalization
The SAVEE model comprises four normalized equations, where Equations (1) and (2) correspond to positive indicators ( 0 V 1 ) , while Equations (3) and (4) pertain to negative indicators ( 1 V 0 ) . In these equations, the four equations are specified as follows.
For positive indicators whose value increases with the increase in the independent variable, the normalization Equation (1) is applied.
V = 1 e ( X + 1 ) | A | 5 , V X
For positive indicators whose value decreases as the independent variable increases, normalization Equation (2) is applied.
V = e ( X + 1 ) | A | 5 , V 1 X
For negative indicators whose value increases with the increase in the independent variable, normalization Equation (3) is applied.
V = e ( X + 1 ) | A | 5 , V X
For negative indicators whose value decreases as the independent variable increases, normalization Equation (4) is applied.
V = e ( X + 1 ) | A | 5 1 , V 1 X
In the equations, V represents the normalized value; A > 0 is the maximum value configured based on specific dataset characteristics. The parameter A controls the scaling of the normalization curve, determining how quickly the normalized value V approaches its upper or lower bound as the observed value X increases. A larger A results in a more gradual curve, while a smaller A produces a steeper transition. Here, A was set to 10 for illustrative purposes to demonstrate the behavior of the normalization equations (Figure 4). 0 X A denotes the observed variable’s value range. V X denotes a positive correlation between the normalized indicator value and the observed value, whereas V 1 X signifies a negative correlation between them.
The curves shown in Figure 4 visualize the effect of A = 10 on the four normalization equations used in the SAVEE model. The figure is crucial for understanding how different types of indicators (positive or negative) are transformed and normalized before aggregation. By examining these curves, it is easier to understand how the SAVEE model ensures comparability and appropriate scaling among heterogeneous risk factors, which is essential for robust multi-factor fire risk assessment.
(2) 
Superposition Operation
The normalized indicator values must undergo superposition operations to derive the composite fire risk index. The superposition process in SAVEE is based on the EMYCIN algorithm, which adapts EMYCIN’s confidence combination rules for aggregating multiple influencing factors [66]. By leveraging the inference logic of confidence measures from probability theory, this approach enables the integration of diverse risk factors in a manner that closely aligns with expert judgment, thereby enhancing both the reliability and interpretability of the assessment results.
Specifically, the appropriate normalization formula is first selected from Equation (1) to Equation (4) based on whether each factor is a positive or negative indicator and its relationship with the observed values. Then, the corresponding superposition formula is chosen from Equation (5) to Equation (7) according to the conditions satisfied. The superposition algorithm ultimately applies the EMYCIN formulas, which are as follows:
I ab = I a + I b I a I b , I a > 0 , I b > 0
I a b = I a + I b + I a I b , I a < 0 , I b < 0
I a b = I a + I b / 1 min I a , I b , rest
Equation (5) is used when both factors are positive. Equation (6) is used when both factors are negative, while Equation (7) is applied when the factors have opposite signs or do not meet the conditions for Equations (5) or (6), ensuring appropriate aggregation for all possible combinations of risk indicators. In the equations, I a and I b represent the weighted normalized values of factor a and factor b, respectively, where I a = V a × W a and I b = V b × W b . Here, W a and W b are the weights assigned to factor a and factor b, respectively, with 0 < W < 1 . I a b denoting the value obtained after the superposition of I a and I b . This process can be extended to multiple factors, as illustrated in Figure 5.
In Figure 5, the diagram shows the iterative superposition process of multiple weighted normalized factors ( I a , I b , I c , I d , etc.) using the EMYCIN algorithm. Each step combines two factors (or intermediate results) to produce a composite value (e.g., I a b , I a b c , and I a b c d ), ultimately yielding the overall composite risk index.
In the specific context of fire risk assessments in Guiyang’s main urban area, the SAVEE model allows distinct normalization procedures to be applied for diverse fire-influencing factors; furthermore, given that both the four POI categories and three NPP/VIIRS intensity levels represent positive indicators, Equations (1) and (5) were adopted for the risk assessment. Before the final superposition operations, with reference to the studies by Wang et al. [13], Wang et al. [60], Tao et al. [52], Tan et al. [61], and Huo et al. [67], weights were assigned to the normalization results of each fire risk factor category: HHOS at 0.6, VGCA at 0.4, HDCF at 0.4, SCF at 0.3, NPP/VIIRS Level 1 at 0.2, NPP/VIIRS Level 2 at 0.3, and NPP/VIIRS Level 3 at 0.4.

4.3. Fire Service Accessibility Assessment Using E2SFCA Method

The E2SFCA method was adopted in this study to evaluate fire station accessibility, incorporating distance decay and road network travel times to more accurately reflect service realities in mountainous urban environments. The E2SFCA method evaluates accessibility through a two-step process that simultaneously considers the supply capacity of each fire station, the demand represented by each grid cell, and the travel time or distance between them. A distinguishing feature of this approach is the use of a distance-decay function, which assigns greater weight to demand units closer to a fire station, while progressively reducing the influence of more distant units [8]. This framework ensures that accessibility calculations more accurately reflect the spatial realities of service provision and demand distribution.

4.3.1. Calculating the Supply–Demand Ratio for Each Fire Station

Centered on the fire station j, GIS network analysis is used to identify n demand units reachable by fire trucks within the search threshold t 0 , which defines the service coverage of the fire station j. The competitive advantage of each demand unit is determined by the time cost (calculated based on the road network) to the fire station. The supply–demand ratio R j of the fire station j is given by
R j = S j i = 1 n D i G t i j , t 0
In the equation, S j denotes the supply capacity of the fire station j. However, due to the lack of detailed data, and following relevant studies [14], all fire stations were assumed to have identical supply capacity, uniformly set to 1. D i represents the demand scale of the demand unit i, estimated through weighted POI data. G t i j , t 0 indicates the Gaussian distance-decay function, where t i j represents the time cost from the fire station j to the demand unit i, and t 0 represents the search threshold. The Gaussian distance-decay function is defined as
G t i j , t 0 = e 1 2 × t i j t 0 2 e 1 2 1 e 1 2

4.3.2. Measuring Accessibility for Each Demand Unit

Centered on the demand unit i, m fire service facility points reachable within the search threshold t 0 are identified. The accessibility of the demand unit i is obtained by weighting and summing the supply–demand ratios R j of the fire stations using the Gaussian distance-decay function G t i j , t 0 . The formula is
A i = j = 1 m R j G t i j , t 0

5. Results

5.1. Kernel Density Analysis Results

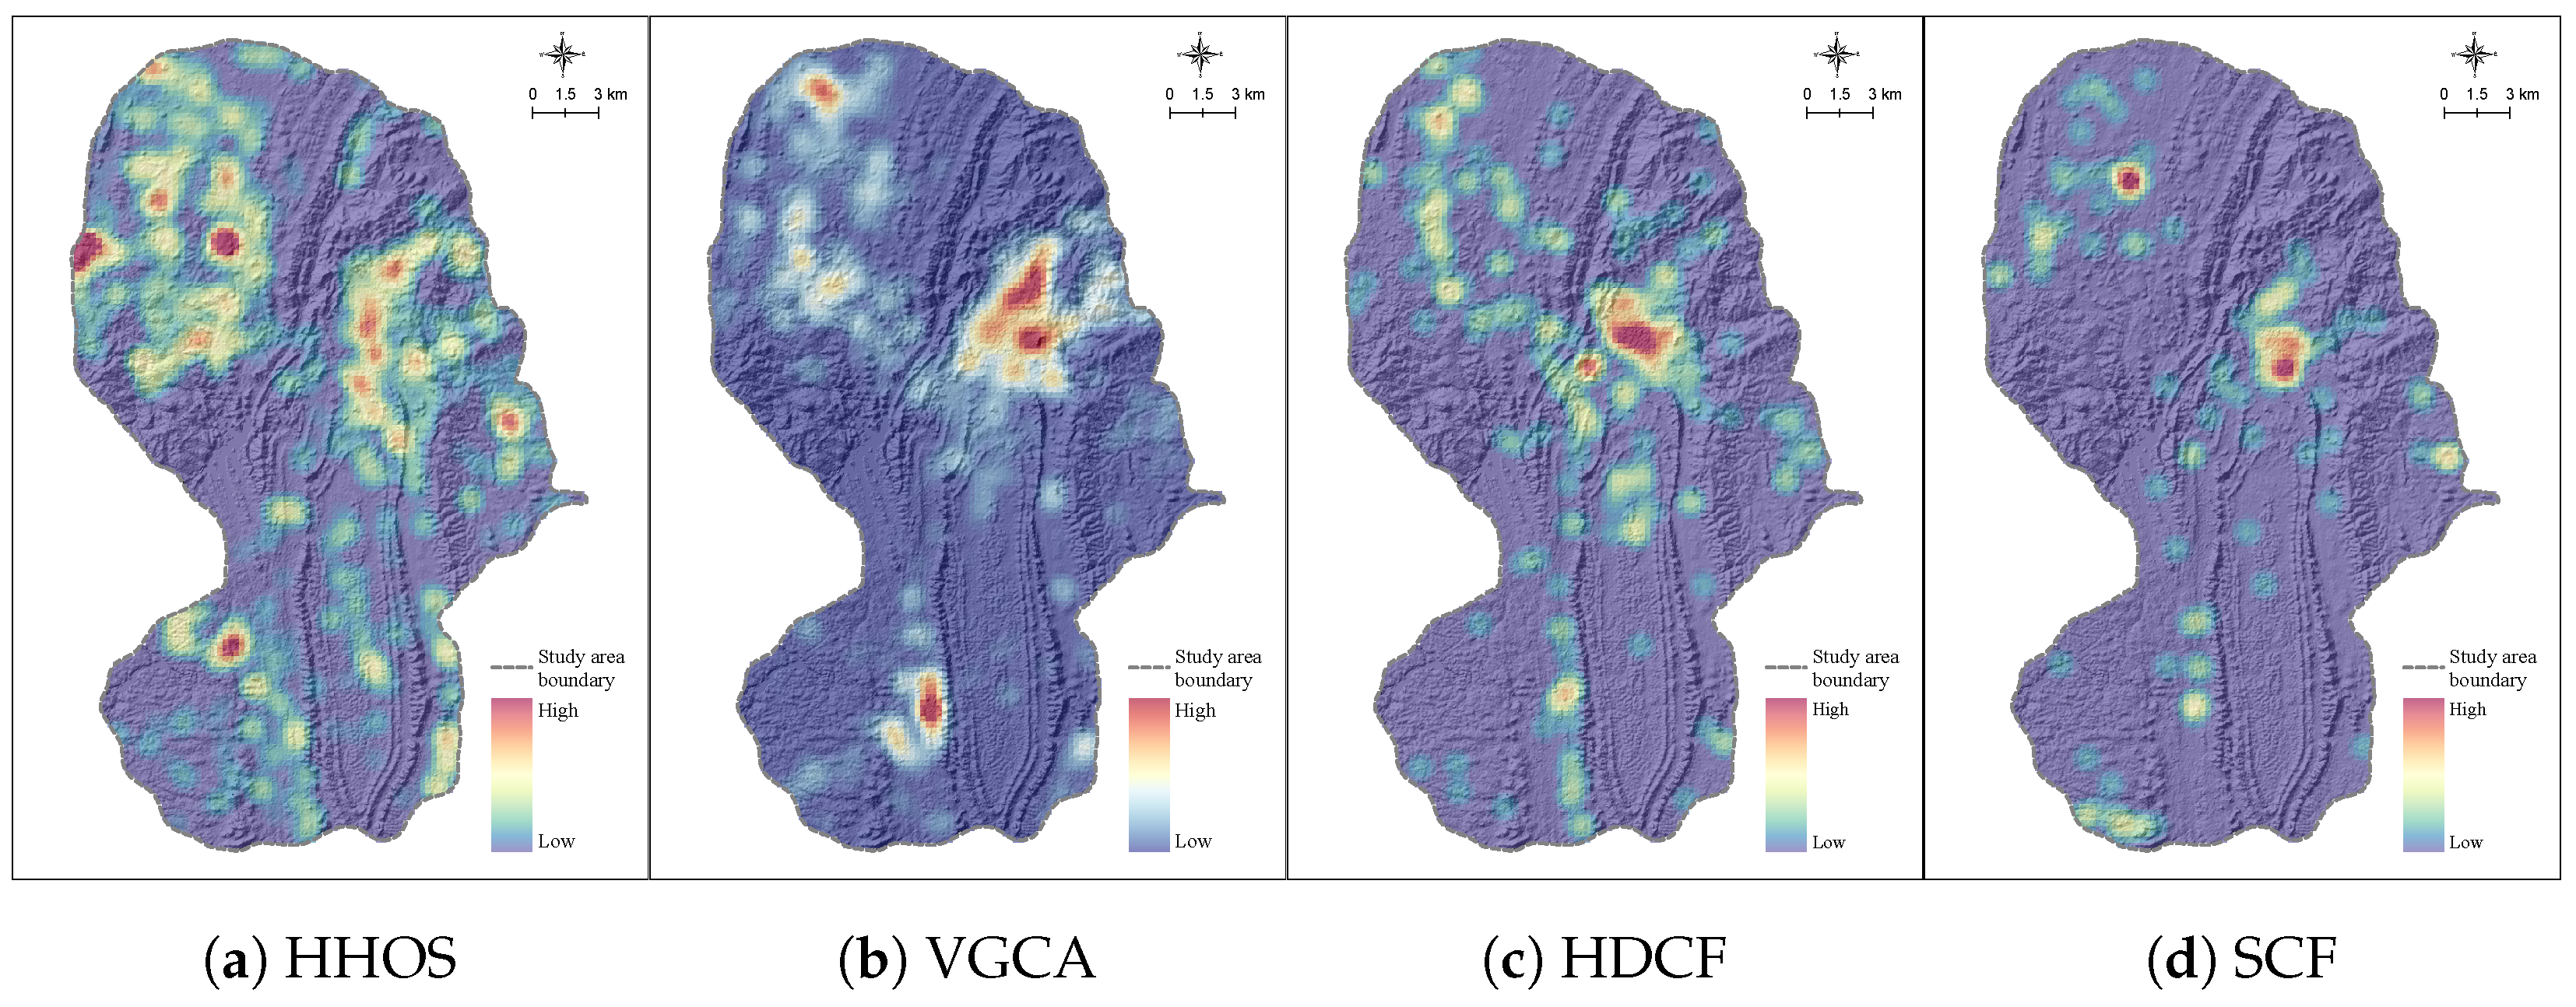
To reveal the spatial distribution and clustering characteristics of fire risk sources in Guiyang’s urban area, KDE was conducted for each of the four POI categories: high-hazard operation sites (HHOSs), vulnerable group congregate areas (VGCAs), high-density crowd facilities (HDCFs), and science and culture facilities (SCFs). The results are presented in Figure 6.
Figure 6 presents the KDE maps for the four POI categories, clearly visualizing the spatial heterogeneity of potential fire risks across Guiyang’s urban area. The color gradients, ranging from blue (low) to red (high), delineate zones of elevated risk and provide a basis for subsequent composite risk assessment and resource allocation strategies.
Specifically, Figure 6a shows that high-hazard operation sites (HHOSs) are moderately clustered in the central and northwestern sectors, particularly along major transportation corridors and flatter terrain. This spatial pattern suggests that these areas are more exposed to fire incidents involving flammable materials and thus require prioritized fire prevention and rapid response measures.
Figure 6b highlights that vulnerable group congregate areas (VGCAs) are strongly concentrated in the low-lying central basin and southern districts. These clusters coincide with densely populated neighborhoods and critical facilities such as schools and hospitals, indicating that populations with limited evacuation capacity are at heightened risk. This finding underscores the need for targeted evacuation planning and resource allocation in these zones.
Figure 6c reveals that high-density crowd facilities (HDCFs) are intensely aggregated in the urban core, with sharp density gradients toward the periphery. This reflects the concentration of commercial centers, transport hubs, and residential complexes in the city center, where fire incidents could result in mass casualties. The spatial gradient also suggests that peripheral hills, with lower density, may be underserved by existing fire services.
Figure 6d shows that science and culture facilities (SCFs) are more fragmented, with moderate clusters in the central and northern areas. The protection of these irreplaceable cultural assets requires special attention, especially where they overlap with other high-risk POI clusters.
Overall, the central karst basin emerges as a key hotspot where multiple POI categories overlap, amplifying composite fire risks. In contrast, the peripheral elevations are characterized by sparser, isolated clusters, often corresponding to natural or less-developed areas. These spatial patterns, as visualized in Figure 6, directly inform urban planning and fire service deployment: resources should be concentrated in the central basin and along major corridors, while peripheral areas may require innovative solutions such as mobile fire units or improved road access to mitigate response delays.

5.2. SAVEE Model Analysis Results

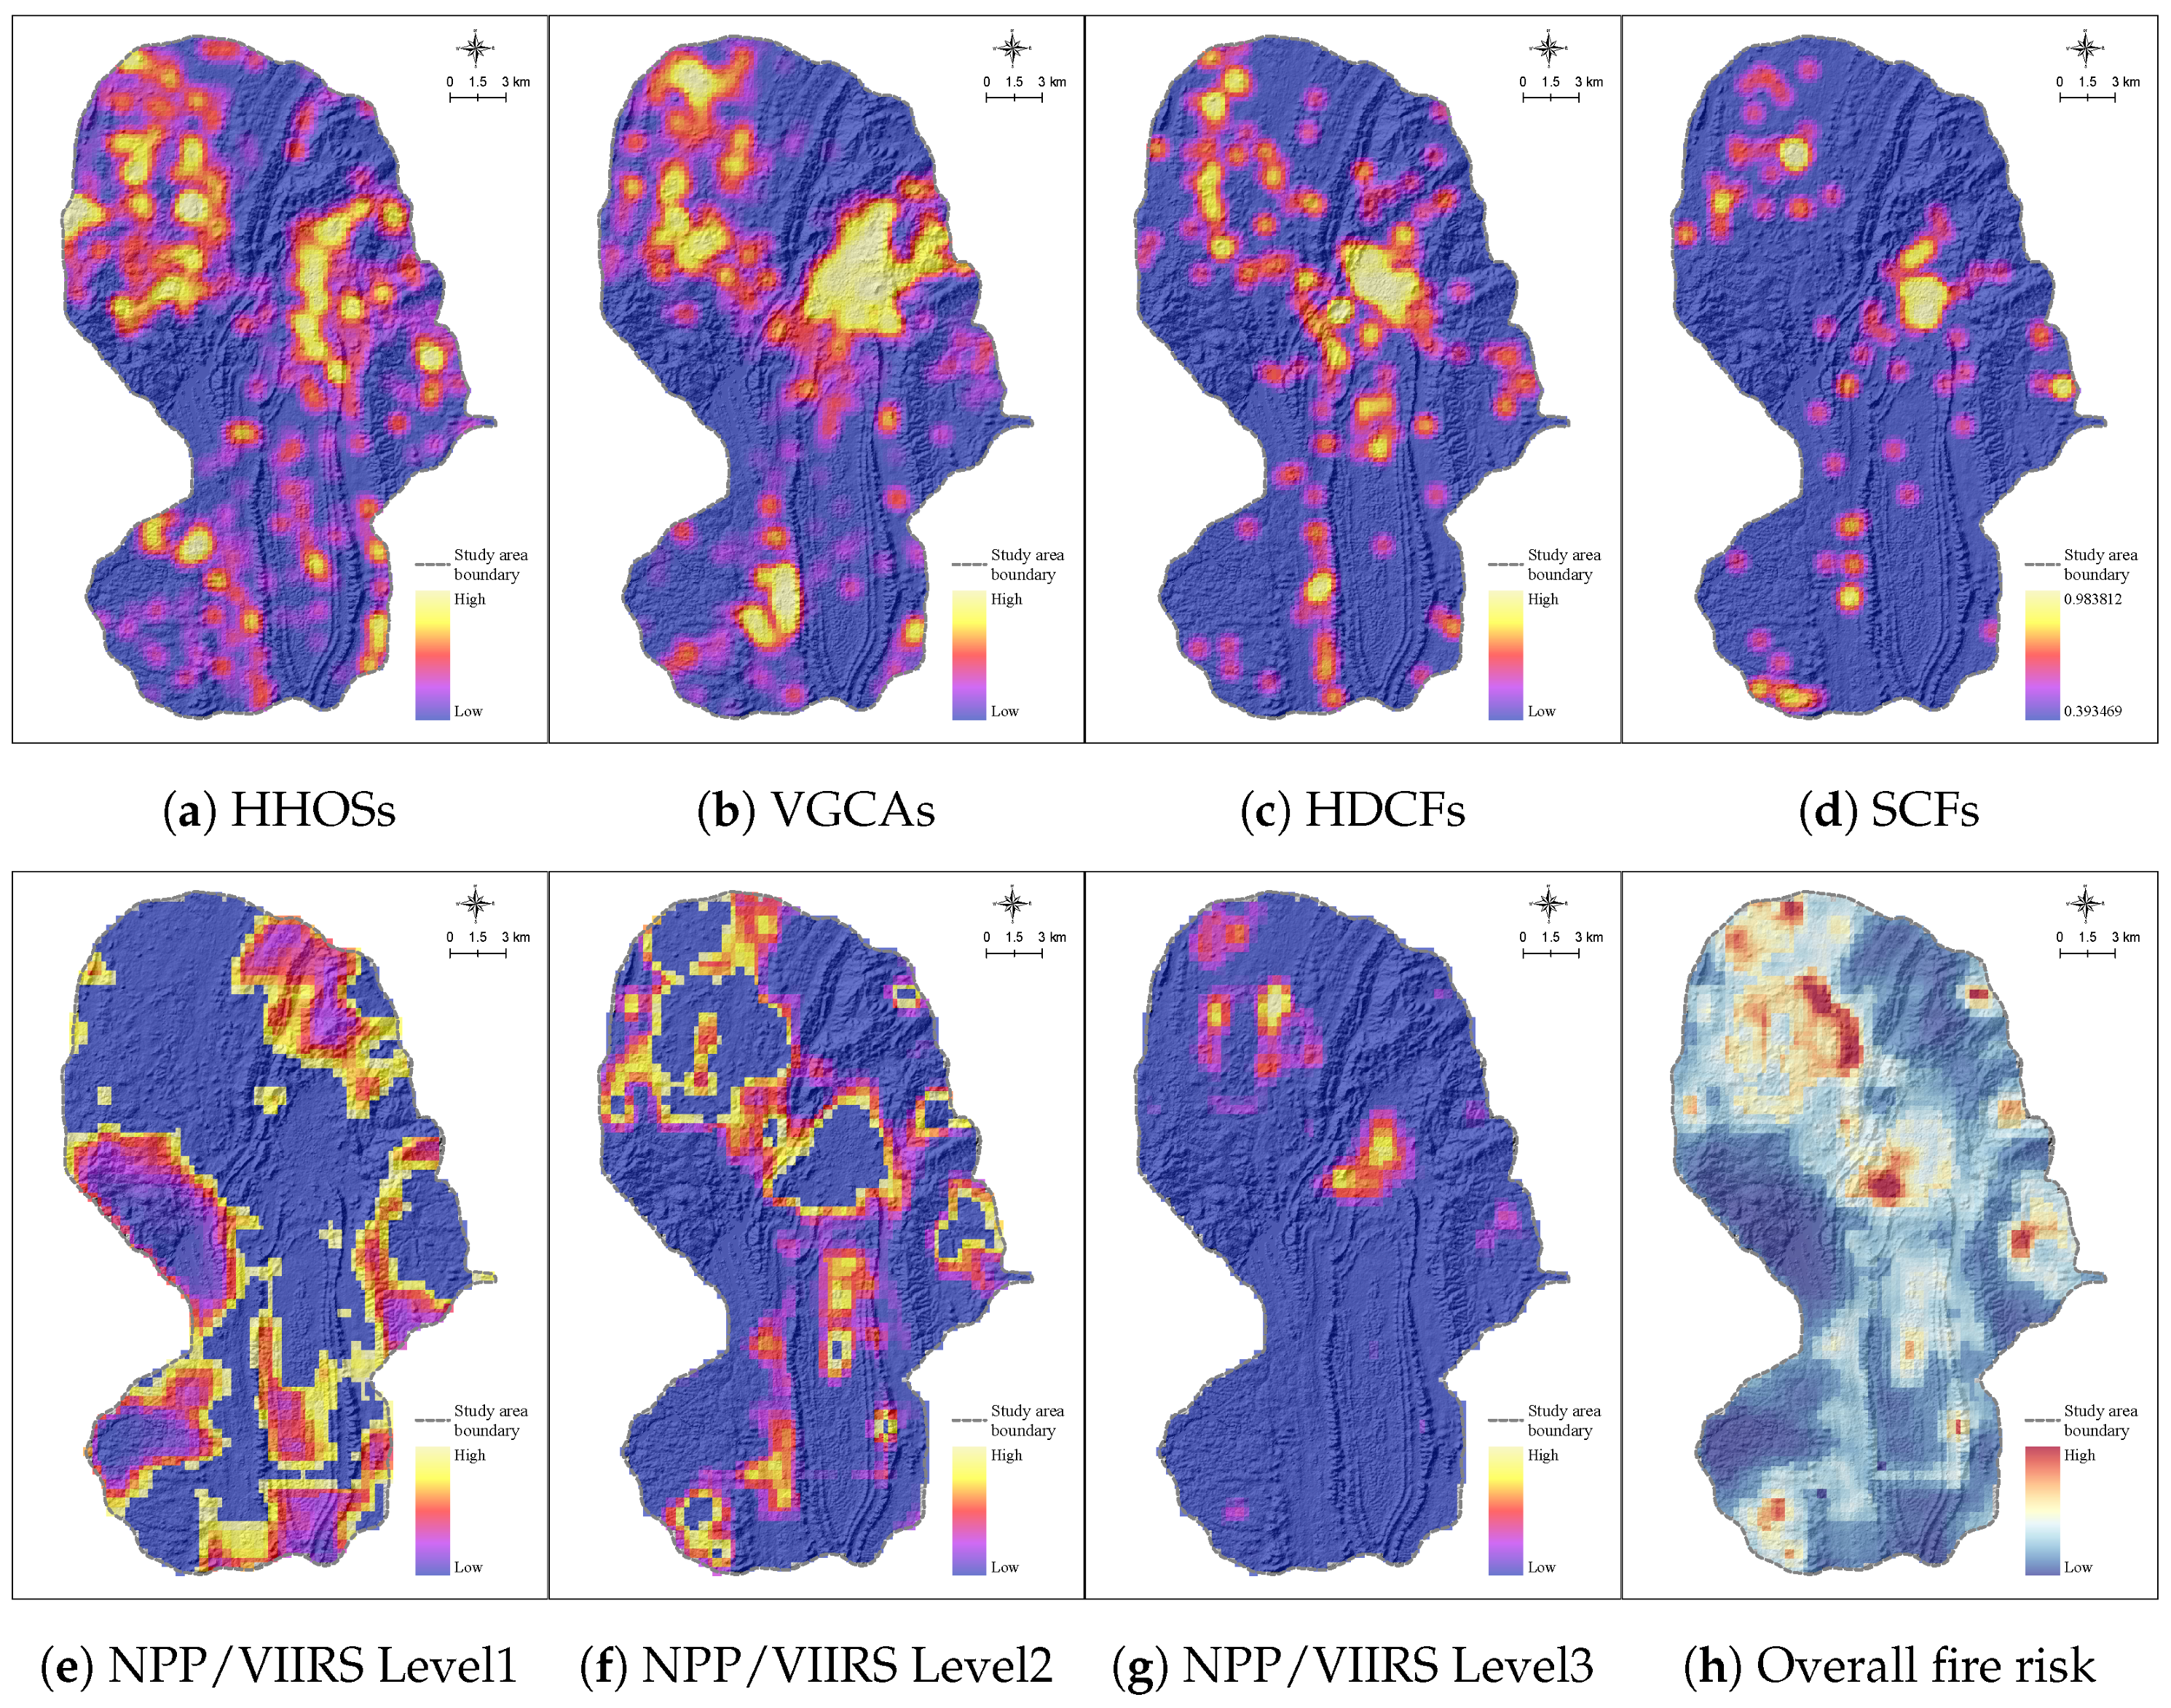
According to Equation (1), each fire-influencing factor was normalized, with the processed results illustrated in Figure 7a–g.
Subsequently, the weighted fire factors underwent pairwise iterative operations, as outlined in Equation (5) and Figure 7h, ensuring the incorporation of all factors. This comprehensive process ultimately yielded the fire risk assessment results for Guiyang City, as depicted in Figure 7h.
Figure 7 presents the results of the SAVEE model analysis, integrating POI categories and NPP/VIIRS data to assess fire risk in Guiyang City’s urban area. The color gradients range from blue (indicating low risk) to yellow/red (indicating high risk), effectively illustrating the spatial distribution of fire hazards against the backdrop of the karst topography.
Figure 7a–d reveal distinct patterns that align with the KDE results, highlighting areas of concentrated fire risk associated with various POI categories. These patterns indicate that high-hazard operation sites and vulnerable group congregate areas are primarily located in the central basin, where urban density is highest.
Figure 7e–g delineate the hierarchical processing structures of the NPP/VIIRS data, progressing from Level 1 through Level 2 to Level 3. This refinement enhances the proxies for human activity, allowing for a more nuanced layering of risk factors. The overall risk map in Figure 7h, aggregated using the EMYCIN algorithm, synthesizes these seven factors, identifying the central basin as a multifaceted high-risk nexus characterized by overlapping densities. In contrast, the peripheral hills exhibit lower and more isolated hazards.
These findings underscore the necessity for targeted firefighting strategies in mountainous urban environments. The analysis highlights the critical areas where fire risks are elevated, suggesting that interventions should focus on enhancing fire service accessibility and resource allocation in these high-risk zones. By addressing the identified vulnerabilities, urban planners and emergency managers can develop more effective strategies to mitigate composite threats and improve overall fire safety in Guiyang.

5.3. E2SFCA Analysis Results

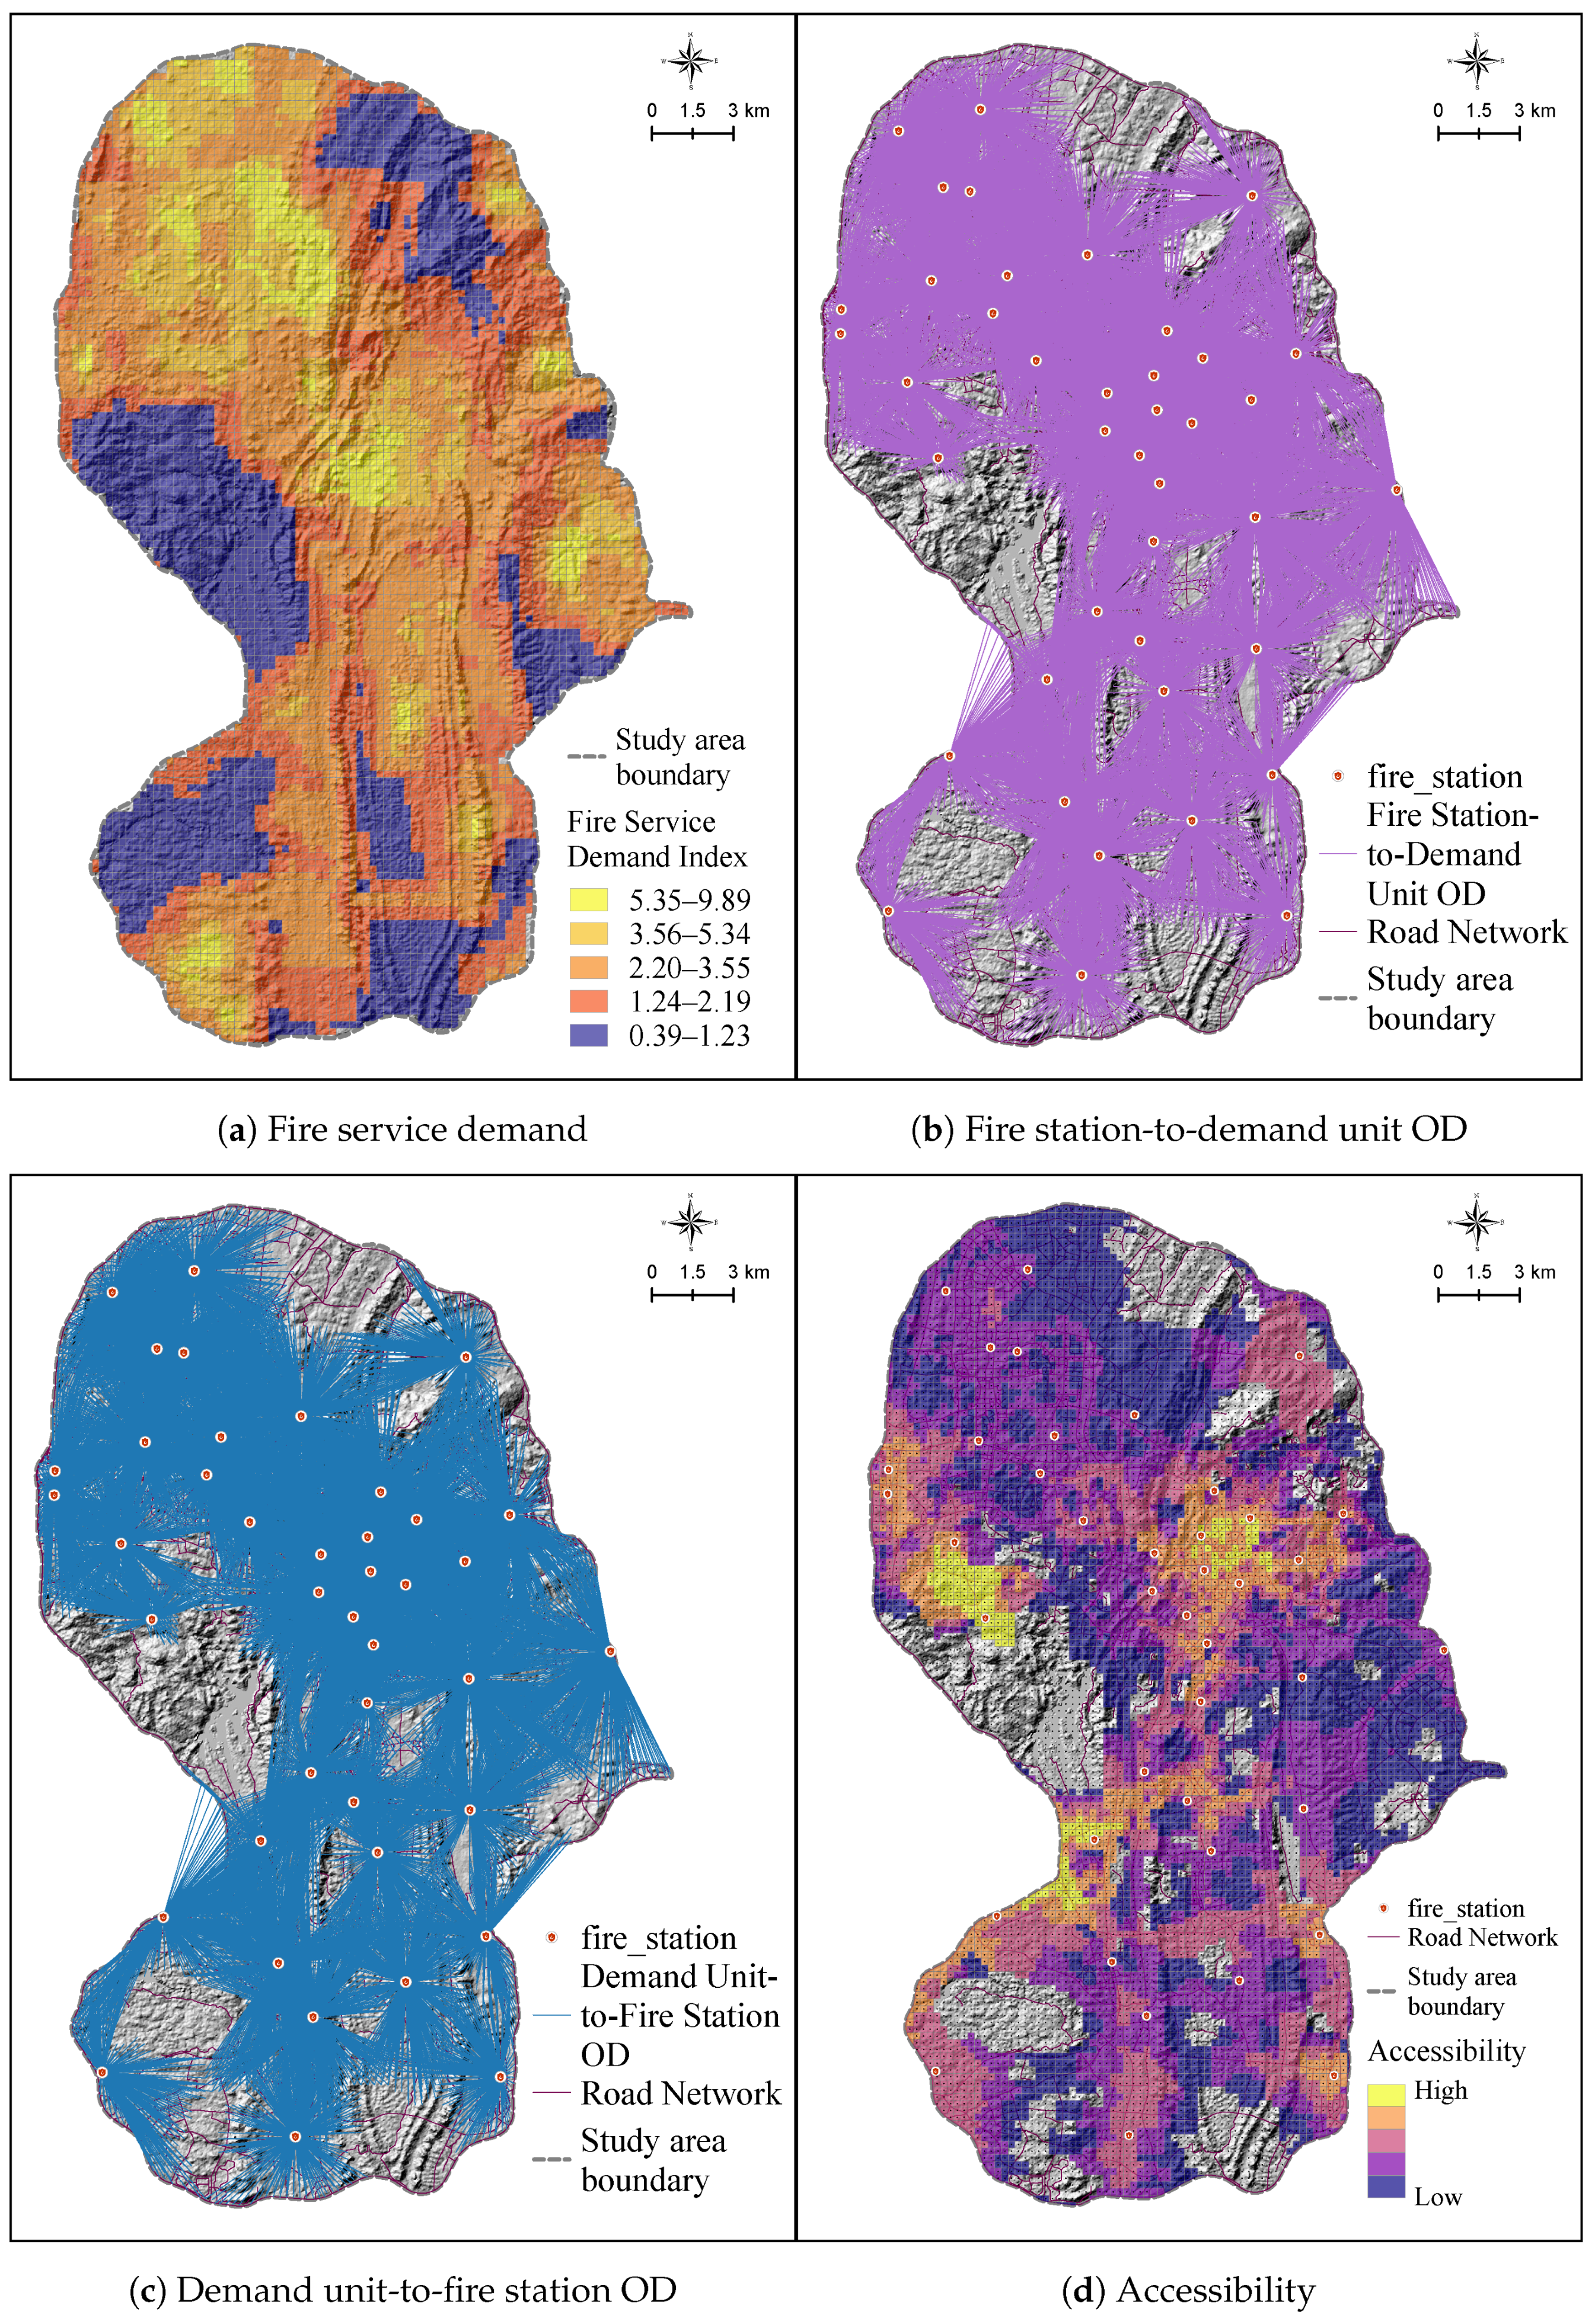
Fire service demand units were established using a grid system composed of 250 m × 250 m cells. Clipping against the study area boundary yielded 9402 valid units, with the travel times from unit centroids to fire facilities calculated as time-cost metrics. After spatially assigning the integrated fire risk assessment results to the existing 250 m × 250 m grid system, the fire risk value per cell can be used to quantitatively define the demand magnitude for fire service in each spatial unit (Figure 8a).
Compliant with China’s Code for Fire Station Construction in Urban Areas [68], urban fire station locations are required to satisfy five-minute response coverage to jurisdictional boundaries. Accounting for the one-minute dispatch capability of Chinese fire brigades, a four-minute search threshold is operationally defined in this research. The accessibility analysis results for fire stations in Guiyang’s core urban area are presented below.
Figure 8 illustrates the fire service demand units established using a grid system composed of 250 m × 250 m cells across Guiyang City. A total of 9402 valid units were identified after clipping against the study area boundary, with travel times from unit centroids to fire facilities calculated as time-cost metrics. This grid-based approach allows for a detailed spatial analysis of fire service demand, enabling a quantitative assessment of the demand magnitude for fire services in each spatial unit, as depicted in Figure 8a.
The fire station-to-demand unit origin–destination (OD) (Figure 8b) and demand unit-to-fire station OD (Figure 8c) maps illustrate the dual-step process of the E2SFCA method. Figure 8b reveals efficient supply allocation flows from fire stations to demand units, highlighting central clustering in urban cores while exposing sparse connections in peripheral areas due to hilly barriers. In contrast, Figure 8c shows demand-side perspectives, showcasing competition effects where demand from densely populated basins converges on nearby fire stations, while fringe areas exhibit elongated and lower-intensity links.
The resulting accessibility map (Figure 8d) synthesizes these dynamics, displaying higher accessibility scores in urban cores and northwestern zones, indicative of shorter response times and better coverage. In contrast, reduced accessibility is observed in the southern and eastern elevations, where network limitations exacerbate vulnerabilities. Under the defined five-minute response time threshold, fire services cover 7534 demand units (80.13% of the total). Of the total units, there were 5007 low-accessibility units (53.25%), 1641 medium-accessibility units (17.45%), 886 high-accessibility units (9.42%), and 1868 inaccessible units (19.87%), which were predominantly located in urban fringe areas.
From a land cover perspective, the areas with gaps in fire service coverage are primarily mountainous natural forest land, designated as protected forest parks, while southern regions also include farmland and reservoirs. This land cover pattern elucidates the reasons for coverage gaps in urban areas, as protected natural landscapes and agricultural zones restrict infrastructural development, further complicating access in topographically constrained regions.
These findings highlight a unique aspect of fire station accessibility studies in mountainous cities: accessibility levels are profoundly shaped by terrain, rather than solely attributable to inadequate station layouts or incomplete road networks. The spatial patterns observed underscore accessibility inequities, emphasizing the need for strategic infrastructure enhancements to mitigate fire response delays in underserved areas.

5.4. Spatial Clustering of Fire Station Accessibility

5.4.1. Global Spatial Autocorrelation Analysis

Global Moran’s I analysis in ArcGIS Pro confirmed a statistically significant positive spatial autocorrelation (p < 0.000001) for both demand magnitude and station accessibility for fire services across the study area. Both variables exhibited Moran’s I indices approaching 1, with strongly positive z-scores substantially exceeding the α = 0.01 critical threshold of 2.58. These spatial clustering patterns suggest influences from karst topography and urban structural factors, indicating non-random distributions that necessitate geographically targeted interventions to address fire response vulnerabilities (Table 2).
While global spatial autocorrelation analysis confirmed significant spatial dependence for both fire-related demand magnitude and fire station accessibility (Moran’s I p < 0.000001), it could not discern high-/low-value clustering intensity. Consequently, ArcGIS’s High/Low Clustering (Getis–Ord General G) tool was deployed for pattern identification, where the z-score quantifies clustering strength—with higher absolute values indicating stronger clustering, values near zero suggesting spatial randomness, positive scores denoting high-value clusters, and negative scores signaling low-value clusters. Crucially, both variables exhibited strongly positive z-scores (far exceeding the 2.58 threshold for α = 0.01) and exceptionally significant p-values (p < 0.000001), definitively confirming statistically significant high-value clustering patterns across the study area (Table 3).

5.4.2. Local Spatial Autocorrelation Analysis

Using the Cluster and Outlier Analysis tool in ArcGIS Pro, a local Moran’s I analysis was performed to investigate the spatial distribution of fire service demand magnitude and station accessibility within the study area. This analysis revealed localized spatial patterns significantly influenced by Guiyang’s karst topography, providing essential insights into the areas of high demand and accessibility (Figure 9).
The results for fire service demand magnitude exhibit dominant High–High (HH) clusters in Guanshanhu, Baiyun, and Nanming Districts, driven by NPP/VIIRS intensity and POI density in low-lying valleys (see Figure 9a). These clusters indicate areas with heightened fire service demand, necessitating focused resource allocation. Conversely, Low–Low (LL) clusters prevail in the peripheral sectors of Huaxi District, the northeastern periphery of Yunyan District, and convergence zones between Yunyan, Baiyun, and Wudang Districts, reflecting sparse demand in mountainous regions. In contrast, fire station accessibility shows extensive HH clusters in western Guanshanhu, central and western Yunyan, the western periphery of Wudang, and the northwestern, western, and eastern peripheries of Huaxi (see Figure 9b). The presence of HH clusters in central Yunyan District extending into Nanming District indicates strong coverage near fire stations, suggesting effective service provision in these areas. However, HL outliers in Nanming pockets suggest anomalous high accessibility, while LL clusters dominate the southern sectors of Huaxi District and the eastern sectors of Nanming District, highlighting significant accessibility gaps. These complementary patterns—intensified demand in basins versus accessibility gaps in hilly areas—underscore the need for strategic interventions such as station relocation and road upgrades. By advancing terrain-informed strategies, supply–demand imbalances in mountainous urban fire services can be effectively addressed.

6. Discussion

This study effectively assessed fire station accessibility in the urban core of Guiyang by employing an integrated framework of NPP/VIIRS and POI data, revealing significant spatial disparities and informing targeted optimization strategies. Kernel density estimation and SAVEE modeling results showed that fire risk is concentrated in the central basin, mainly due to POI clustering and human activity indicated by nighttime light data. Only 80.13% of demand units are accessible within five minutes; of all units, 53.25% fall into the low-accessibility category, while 19.87% are entirely inaccessible within the threshold. These findings underscore the necessity of considering both service demand and accessibility differences across regions in urban planning.
The spatial patterns uncovered by the analyses highlight the complex fire risk profile of Guiyang City and expose critical gaps in fire service accessibility under current standards. Urban structure and karst topography interact to amplify vulnerabilities, consistent with prior research [14,15], and the current infrastructure does not match the spatial heterogeneity of risk. KDE results demonstrate pronounced POI clustering in the valleys (Figure 6), particularly for HDCFs and VGCAs, elevating casualty risks in flatter terrains. The SAVEE model, integrating NPP/VIIRS intensity levels and POI KDEs, identified the basin core as a composite risk hotspot with high fire service demand (Figure 7). Compared to using POIs alone [51,69], the integration of NPP/VIIRS nighttime light data with POI advances fire risk assessment by achieving full spatial coverage, as NPP/VIIRS provides continuous human activity proxies across the study area. POIs represent discrete, point-based demand, while NPP/VIIRS data complement this by covering sectors without POI coverage that may still require fire services, thus capturing different demand scales and forms. Accessibility mapping via the E2SFCA method, using road network distances for realistic travel costs, synthesizes supply–demand interactions. Better coverage is observed in northwestern zones near stations, while significant gaps remain in southern elevations, as confirmed by OD flows and cluster analysis (Figure 8 and Figure 9), with HH clusters in Yunyan and Nanming Districts and LL clusters in Huaxi and Wudang, driven by strong spatial autocorrelation (Moran’s I > 0.85, p < 0.000001).
Guiyang’s rugged terrain critically exacerbates fire service inequities. Protected forested parks in Guanshanhu, Huaxi, Nanming, Yunyan, and Wudang correlate with Low–Low clusters [62], where infrastructure limitations delay emergency responses. Agricultural lands and reservoirs compound these barriers, rendering 19.87% of units inaccessible within five-minute response thresholds. Overall, 53.25% of the study area suffers from low accessibility—a spatial inequity shown by high demand clustering (z-scores > 126). This reinforces prior work on terrain-mediated emergency services, underscoring the need for conservation-sensitive planning that balances ecological protection and public safety. Therefore, targeted road upgrades in peripheral areas and the addition of fire stations in transitional zones are recommended to enhance service coverage and equity. Optimization strategies for Guiyang’s fire services should prioritize road enhancements and station relocations to counter topographic barriers, while avoiding simplistic additions of stations that impose heavy fiscal burdens on governments in mountainous contexts. Leveraging China’s infrastructure capabilities and constructing tunnels between central basins or valleys to add urban branch roads could expand service ranges in conventional truck-based planning. For surrounding mountainous forests designated as parks, establishing facilities with mobile tools like drones would deliver services efficiently, minimizing costs, human disturbance to ecosystems, and impacts on natural states.
Conventional fire accessibility models prove inadequate for karst cities like Guiyang. Here, topography—not merely station distribution or road networks—dictates outcomes [70]. Natural barriers elongate origin–destination flows, intensifying distance decay and isolating peripheral communities. Consequently, planar E2SFCA models require enhancement with DEM to capture real-world movement costs. Such methodological adaptations are essential to address the 53.25% low-accessibility coverage identified in this study. Moreover, this study is limited by the use of static POI and NPP/VIIRS data, potentially overlooking seasonal fluctuations or real-time traffic [14], while E2SFCA distance-decay assumptions may require karst-specific refinements and the 250 m resolution could mask micro-scale variations. Future research should integrate temporal VIIRS dynamics and machine learning for predictive clustering, extend to comparative mountainous city studies, and employ field simulations or agent-based modeling to validate optimizations; specifically, developing a DEM-integrated E2SFCA model would strengthen technical support for public service facility planning in cities like Guiyang.
The study will address limitations and enhance policy relevance with targeted improvements. Multi-period NPP/VIIRS and time-varying POI data will be combined with observed traffic speeds to model demand and travel costs over time. The SAVEE demand surface will be validated, and E2SFCA will be calibrated using historical incident and response-time data. A terrain-adjusted impedance will be developed with DEM data, and uncertainty will be assessed through multi-resolution and parameter sensitivity analyses. Cost-aware, multi-objective optimization will guide station siting and road link planning, including tunnels, to boost coverage and equity. Service fairness will be evaluated for vulnerable groups. The method will be tested in other mountainous cities. Hybrid responses with drones and off-road units will be piloted. An open, reproducible workflow will be provided. These efforts will produce validated, time-sensitive risk–demand maps, terrain-adjusted accessibility with uncertainty bounds, and cost-effective interventions that respect ecological limits.

7. Conclusions

This study provides practical insights for enhancing fire safety in a mountainous city, emphasizing the critical role of terrain in shaping accessibility. By integrating nighttime light (NPP/VIIRS) and POI data within a GIS-based framework, fire risk hotspots in Guiyang’s central basins were identified and significant gaps in service coverage were revealed, particularly in peripheral and topographically constrained areas. Kernel density and SAVEE analyses showed that fire risks are concentrated in areas with dense POI clusters and high nighttime light intensity, while the E2SFCA method highlighted that only 80.13% of demand units are accessible within five minutes, with 53.25% of all units exhibiting low accessibility and 19.87% entirely inaccessible within the threshold.
Spatial clustering confirmed non-random patterns, with high-accessibility cores in Yunyan and Nanming Districts contrasting the underserved peripheries in Huaxi and Wudang, a disparity closely linked to karst topography and protective land covers such as forests and farmlands. These findings demonstrate that urban planning must jointly consider both service demand and accessibility to achieve more equitable emergency response. Recommendations include targeted road improvements and the strategic placement of fire stations in high-risk or transitional zones to strengthen the city’s emergency response capacity and promote coverage equity.
Overall, this work advances the methodological framework for fire station accessibility assessment and offers actionable guidance for sustainable urban planning and emergency management in mountainous environments.
A terrain-aware E2SFCA with DEM integration will be used in future work. Time-varying demand will be included to improve accuracy. Observed response time data will validate the model. Multi-resolution sensitivity and uncertainty analyses will be conducted. A cost-aware plan will guide station layout and targeted road links. These steps will tackle identified limitations and boost policy relevance.

Author Contributions

Xindong He: Conceptualization, Project Administration, Investigation, Supervision, Methodology, Formal Analysis, and Writing—Review and Editing; Boqing Wu: Conceptualization, Project Administration, and Supervision; Guoqiang Shen: Conceptualization, Supervision, Methodology, and Review and Editing; Qianqian Lyu: Investigation and Data Processing; Grace Ofori: Investigation and Data Processing. All authors have read and agreed to the published version of the manuscript.

Funding

This research was funded by the International School-level Quality Courses of Chengdu University of Technology.

Data Availability Statement

The data presented in this study are available upon request from the corresponding author.

Conflicts of Interest

The authors declare no conflicts of interest.

References

  1. Alexandridis, A.; Russo, A.; Vakalis, D.; Siettos, C.I.; Bafas, G.V. Wildland fire spread modelling using cellular automata: Evolution in large-scale spatially heterogeneous environments under fire suppression tactics. Int. J. Wildland Fire 2011, 20, 633–647. [Google Scholar] [CrossRef]
  2. Jiang, Y.; Lv, A.; Yan, Z.; Yang, Z. A GIS-Based Multi-Criterion Decision-Making Method to Select City Fire Brigade: A Case Study of Wuhan, China. ISPRS Int. J. Geo-Inf. 2021, 10, 777. [Google Scholar] [CrossRef]
  3. Syphard, A.D.; Radeloff, V.C.; Keeley, J.E.; Hawbaker, T.J.; Clayton, M.K.; Stewart, S.I.; Hammer, R.B. Human influence on California fire regimes. Ecol. Appl. 2007, 17, 1388–1402. [Google Scholar] [CrossRef]
  4. Moritz, M.A.; Batllori, E.; Bradstock, R.A.; Gill, A.M.; Handmer, J.; Hessburg, P.F.; Leonard, J.; McCaffrey, S.; Odion, D.C.; Schoennagel, T.; et al. Learning to coexist with wildfire. Nature 2014, 515, 58–66. [Google Scholar] [CrossRef]
  5. Keeley, J.E.; Syphard, A.D. Climate change and future fire regimes: Examples from California. Geosciences 2016, 6, 37. [Google Scholar] [CrossRef]
  6. Moraga-Orinda Fire District. Ordinance No. 23-08: An Ordinance of the Moraga-Orinda Fire District of Contra Costa County, California, Adopting Requirements for Fuel Breaks on Certain Parcels in Both the State Responsibility and Local Responsibility Areas Within the Fire District, Adopting Findings of Fact Regarding Fire Hazards in the Fire District, Adopting Findings of Exemption Under the California Environmental Quality Act, and Repealing Ordinance 23-04, 2023. Available online: https://www.cityoforinda.org/DocumentCenter/View/4455/5-MOFD-Ordinance-23-03-Defensible-Space-and-Exterior-Hazard-Abatement-Ordinance?bidId= (accessed on 17 September 2025).
  7. Callenberger, B.; Dowling, J.; Lunder, Z. Olympic Valley Community Wildfire Protection Plan. Technical Report, Deer Creek Resources and Olympic Valley Public Service District, Olympic Valley, California, 2022. Developed with Input from Placer County, CAL FIRE, U.S. Forest Service, and Others. Available online: https://ovpsd.org/wp-content/uploads/2024/06/2022-11-15_OV_CWPP_FINAL.pdf (accessed on 17 September 2025).
  8. Han, S.Y.; Lee, Y.; Yoo, J.; Kang, J.Y.; Park, J.; Myint, S.W.; Cho, E.; Gu, X.; Kim, J.S. Spatial Disparities in Fire Shelter Accessibility: Capacity Challenges in the Palisades and Eaton Fires. arXiv 2025, arXiv:2506.06803. [Google Scholar] [CrossRef]
  9. KC, K.; Ardianto, R.; Wang, S. Examining fire service coverage and potential sites for fire station locations in Kathmandu, Nepal. Urban Inform. 2024, 3, 20. [Google Scholar] [CrossRef]
  10. Bustillo Sánchez, M.; Tonini, M.; Mapelli, A.; Fiorucci, P. Spatial assessment of wildfires susceptibility in Santa Cruz (Bolivia) using random forest. Geosciences 2021, 11, 224. [Google Scholar] [CrossRef]
  11. Lemmertz, C.K.; de Oliveira Rodrigues, A.; Mu, L.V.; Centeno, F.R. Fire vulnerability of informal settlements: A case study for Porto Alegre City (Brazil). Fire Technol. 2025, 61, 1383–1407. [Google Scholar] [CrossRef]
  12. Wang, K.; Yuan, Y.; Chen, M.; Wang, D. A POIs based method for determining spatial distribution of urban fire risk. Process Saf. Environ. Prot. 2021, 154, 447–457. [Google Scholar] [CrossRef]
  13. Wang, A.; Zhang, Q.; Lu, L.; Yu, H.; Huang, C. Urban Fire Risk Assessment and Planning Response Based on Multi-Source Data. China Saf. Sci. J. 2021, 31, 148–155. [Google Scholar] [CrossRef]
  14. Li, R.; Wang, J.; Li, M. Fine-Resolution Evaluation of Urban Fire Service Accessibility Under the Impact of a 100-Year Pluvial Flood. Prog. Geogr. 2022, 41, 143–156. [Google Scholar] [CrossRef]
  15. Chen, M.; Wang, Y.; Zheng, Z.; You, X.; Zeng, Y. Modeling the Forest Fire Risk by Incorporating a New Human Activity Factor from Nighttime Light Data. Geocarto Int. 2023, 38, 1–20. [Google Scholar] [CrossRef]
  16. Hansen, W.G. How Accessibility Shapes Land Use. J. Am. Inst. Planners 1959, 25, 73–76. [Google Scholar] [CrossRef]
  17. Morris, J.M.; Dumble, P.L.; Wigan, M.R. Accessibility Indicators for Transport Planning. Transp. Res. Part A Gen. 1979, 13, 91–109. [Google Scholar] [CrossRef]
  18. Nicholls, S. Measuring the Accessibility and Equity of Public Parks: A Case Study Using GIS. Manag. Leis. 2001, 6, 201–219. [Google Scholar] [CrossRef]
  19. Ergen, M. Using the Buffer Zone Method to Measure the Accessibility of the Green Areas in Tokat, Turkey. In Landscape Architecture—Processes and Practices Towards Sustainable Development; IntechOpen: London, UK, 2020. [Google Scholar] [CrossRef]
  20. Chen, X.; Pei, T.; Song, C.; Shu, H.; Guo, S.; Wang, X.; Liu, Y.; Chen, J.; Zhou, C. Accessing Public Transportation Service Coverage by Walking Accessibility to Public Transportation under Flow Buffering. Cities 2022, 125, 103646. [Google Scholar] [CrossRef]
  21. Guagliardo, M.F. Spatial Accessibility of Primary Care: Concepts, Methods and Challenges. Int. J. Health Geogr. 2004, 3, 3. [Google Scholar] [CrossRef]
  22. Liu, Y.; Gu, H.; Shi, Y. Spatial Accessibility Analysis of Medical Facilities Based on Public Transportation Networks. Int. J. Environ. Res. Public Health 2022, 19, 16224. [Google Scholar] [CrossRef]
  23. Balasubramani, K.; Gomathi, M.; Prasad, S. GIS-based Service Area Analysis for Optimal Planning Strategies: A Case Study of Fire Service Stations in Madurai City. Geogr. Anal. Union Geogr.-Infor-Mation Technol. 2016, 5, 11–18. [Google Scholar]
  24. Elsheikh, R. GIS-based Services Analysis and Multi-Criteria for Optimal Planning of Location of a Police Station. Gazi Univ. J. Sci. 2022, 35, 1248–1258. [Google Scholar] [CrossRef]
  25. Yang, D.H.; Goerge, R.; Mullner, R. Comparing GIS-based methods of measuring spatial accessibility to health services. J. Med Syst. 2006, 30, 23–32. [Google Scholar] [CrossRef]
  26. Radke, J.; Mu, L. Spatial Decompositions, Modeling and Mapping Service Regions to Predict Access to Social Programs. Ann. GIS 2000, 6, 105–112. [Google Scholar] [CrossRef]
  27. Luo, W.; Wang, F. Measures of spatial accessibility to health care in a GIS environment: Synthesis and a case study in the Chicago region. Environ. Plan. B Plan. Des. 2003, 30, 865–884. [Google Scholar] [CrossRef] [PubMed]
  28. Luo, W.; Wang, F. Spatial accessibility to primary care and physician shortage area designation: A case study in Illinois with GIS approaches. In Geographic Information Systems and Health Applications; IGI Global: Hershey, PA, USA, 2003; pp. 261–279. [Google Scholar]
  29. Chen, X.; Jia, P. A comparative analysis of accessibility measures by the two-step floating catchment area (2SFCA) method. Int. J. Geogr. Inf. Sci. 2019, 33, 1739–1758. [Google Scholar] [CrossRef]
  30. Tao, Z.; Dai, T.; Song, C. Improving spatial equity-oriented location-allocation models of urban medical facilities. Acta Geogr. Sin. 2023, 78, 474–489. [Google Scholar]
  31. Wang, F. Measurement, optimization, and impact of health care accessibility: A methodological review. Ann. Assoc. Am. Geogr. 2012, 102, 1104–1112. [Google Scholar] [CrossRef]
  32. Dai, D. Black residential segregation, disparities in spatial access to health care facilities, and late-stage breast cancer diagnosis in metropolitan Detroit. Health Place 2010, 16, 1038–1052. [Google Scholar] [CrossRef]
  33. Luo, W.; Qi, Y. An enhanced two-step floating catchment area (E2SFCA) method for measuring spatial accessibility to primary care physicians. Health Place 2009, 15, 1100–1107. [Google Scholar] [CrossRef]
  34. Szymon, W. Fire Service Accessibility to Potential Intervention Areas in Łódź Voivodship. Saf. & Fire Technol. 2016, 43, 21–36. [Google Scholar] [CrossRef]
  35. Wiśniewski, S. The Use of Network Analyst Tool and 2SFCA Method to Assess Fire Service Effectiveness in a City, as Exemplified by Łódź. Geomat. Landmanagement Landsc. 2017, 147–158. [Google Scholar] [CrossRef]
  36. Xia, Z.; Li, H.; Chen, Y.; Yu, W. Integrating Spatial and Non-Spatial Dimensions to Measure Urban Fire Service Access. ISPRS Int. J. Geo-Inf. 2019, 8, 138. [Google Scholar] [CrossRef]
  37. Kiran, K.C.; Corcoran, J.; Chhetri, P. Measuring the Spatial Accessibility to Fire Stations Using Enhanced Floating Catchment Method. Socio-Econ. Plan. Sci. 2020, 69, 100673. [Google Scholar] [CrossRef]
  38. Sahebgharani, A.; Haghshenas, H. Analyzing Accessibility to Fire Stations: A Floating Catchment Area Model for Stochastic Transportation Networks with Travel Time Correlation. Trans. GIS 2022, 26, 182–200. [Google Scholar] [CrossRef]
  39. Zeng, W.; Zhong, Y.; Li, D.; Deng, J. Classification of recreation opportunity spectrum using night lights for evidence of humans and POI data for social setting. Sustainability 2021, 13, 7782. [Google Scholar] [CrossRef]
  40. Li, L.; Li, N.; Wu, X.; Liu, B. A method for evaluating the spatial layout of fire stations in chemical industrial parks. Appl. Sci. 2024, 14, 2918. [Google Scholar] [CrossRef]
  41. Chen, Y.; Yao, J.; Wang, S.; Lai, Z.; Wu, L.; Dong, G. Location optimization of urban fire stations considering the variations in fire service demands: A bi-objective coverage model. Int. J. Digit. Earth 2025, 18, 2454386. [Google Scholar] [CrossRef]
  42. Mellander, C.; Lobo, J.; Stolarick, K.; Matheson, Z. Night-Time Light Data: A Good Proxy Measure for Economic Activity? PLoS ONE 2015, 10, e0139779. [Google Scholar] [CrossRef]
  43. Meng, Y.; Zhou, S.; Nie, Y.; Zeng, H.; Yu, J. Spatial Delimitation of the Urban-Rural Fringe Based on POI and Nighttime Light Data: A Case Study of Wuhan City. Geomat. Inf. Sci. Wuhan Univ. 2025, 50, 449–461. [Google Scholar] [CrossRef]
  44. Gao, C.; Li, J.; Wu, T.; Wang, R.; Wang, J.; Chen, H.; Jiang, Y. Spatialisation of GDP based on NPP-VIIRS night lighting and urban utilization. In Proceedings of the 3rd International Academic Conference on Blockchain, Information Technology and Smart Finance (ICBIS 2024), Kuala Lumpur, Malaysia, 23–25 February 2024; Atlantis Press: Dordrecht, The Netherlands, 2024; pp. 173–179. [Google Scholar] [CrossRef]
  45. Amaral, S.; Monteiro, A.M.V.; Camara, G.; Quintanilha, J.A. DMSP/OLS Night-time Light Imagery for Urban Population Estimates in the Brazilian Amazon. Int. J. Remote Sens. 2006, 27, 855–870. [Google Scholar] [CrossRef]
  46. Bagan, H.; Yamagata, Y. Analysis of Urban Growth and Estimating Population Density Using Satellite Images of Nighttime Lights and Land-Use and Population Data. GIScience Remote Sens. 2015, 52, 765–780. [Google Scholar] [CrossRef]
  47. Lu, D.; Wang, Y.; Yang, Q.; Su, K.; Zhang, H.; Li, Y. Modeling Spatiotemporal Population Changes by Integrating DMSP-OLS and NPP-VIIRS Nighttime Light Data in Chongqing, China. Remote Sens. 2021, 13, 284. [Google Scholar] [CrossRef]
  48. Keola, S.; Andersson, M.; Hall, O. Monitoring Economic Development from Space: Using Nighttime Light and Land Cover Data to Measure Economic Growth. World Dev. 2015, 66, 322–334. [Google Scholar] [CrossRef]
  49. Agnihotri, J.; Mishra, S. Indian Economy and Nighttime Lights. In Proceedings of the 2021 International Conference on Computational Intelligence and Knowledge Economy (ICCIKE), Dubai, United Arab Emirates, 17–18 March 2021; pp. 401–406. [Google Scholar] [CrossRef]
  50. Xia, Z.; Li, H.; Chen, Y. An integrated spatial clustering analysis method for identifying urban fire risk locations in a network-constrained environment: A case study in nanjing, china. ISPRS Int. J. Geo-Inf. 2017, 6, 370. [Google Scholar] [CrossRef]
  51. Chen, M.; Wang, K.; Yuan, Y.; Yang, C. A Pois Based Method for Location Optimization of Urban Fire Station: A Case Study in Zhengzhou City. Fire 2023, 6, 58. [Google Scholar] [CrossRef]
  52. Tao, L.; Cui, Y.; Xu, Y.; Chen, Z.; Guo, H.; Huang, B.; Xie, Z. Location Optimization of Urban Fire Stations Considering the Backup Coverage. Int. J. Environ. Res. Public Health 2022, 20, 627. [Google Scholar] [CrossRef]
  53. Klein, R.H. Quality of Life Assessment as a Preliminary Study on the Spatial Appraisal and Valuation of Environment and Ecosystems Methodology. Master’s Thesis, Texas A&M University, College Station, TX, USA, 2011. [Google Scholar]
  54. Loh, K.D.; Tapaneeyakul, S. GIS for Environmental Problem Solving. In Sustainable Development—Authoritative and Leading Edge Content for Environmental Management; Curkovic, S., Ed.; IntechOpen: London, UK, 2012; Chapter 4. [Google Scholar] [CrossRef]
  55. Loh, D.K.; Hsieh, Y.T.C.; Choo, Y.K.; Holtfrerich, D.R. Integration of a rule-based expert system with GIS through a relational database management system for forest resource management. Comput. Electron. Agric. 1994, 11, 215–228. [Google Scholar] [CrossRef]
  56. Loh, D.K.; Hsieh, Y.T.C. Incorporating rule-based modeling of succession in a savanna landscape. AI Appl. 1995, 9, 29–40. [Google Scholar]
  57. Loh, D.K.; Van Stipdonk, S.E.; Holtfrerich, D.R.; Hsieh, Y.T.C. Spatially constrained reasoning for the determination of wildlife foraging areas. Comput. Electron. Agric. 1996, 15, 323–334. [Google Scholar] [CrossRef]
  58. Dan, K.; Wang, R.; Tian, L.; Wang, X. Evaluation of Groundwater Exploitation on Islands Based on the SAVEE Method. J. Ocean Technol. 2020, 39, 78–83. [Google Scholar]
  59. Chen, S.; Xiao, L.; Liu, N.; Gong, Y.; Xiao, Y. Classificatory Assessment of Islands and Reefs in the South China Sea from the Perspective of Sustainable Development. Trop. Geogr. 2022, 42, 1039–1049. [Google Scholar]
  60. Wang, W.; Xu, Z.; Sun, D.; Lan, T. Spatial Optimization of Mega-City Fire Stations Based on Multi-Source Geospatial Data: A Case Study in Beijing. ISPRS Int. J. Geo-Inf. 2021, 10, 282. [Google Scholar] [CrossRef]
  61. Tan, L.; Qu, N.; Han, L.; Sui, Y. Fire Risk Assessment of Industrial Cities Based on the GIS-SAVEE Model. J. Inst. Disaster Prev. 2023, 25, 97–103. [Google Scholar]
  62. Liao, S.; Cai, H.; Tian, P.; Zhang, B.; Li, Y. Combined Impacts of the Abnormal and Urban Heat Island Effect in Guiyang, a Typical Karst Mountain City in China. Urban Clim. 2022, 41, 101014. [Google Scholar] [CrossRef]
  63. Guiyang City Statistics Bureau; National Bureau of Statistics Guiyang Investigation Team. 2024 Guiyang City Statistical Bulletin on National Economic and Social Development. 2025. Available online: https://www.guiyang.gov.cn/zwgk/zfxxgks/fdzdgknr/tjxx/tjgb/202504/t20250401_87326147.html (accessed on 17 June 2025).
  64. Xu, X. China Annual Nighttime Light Dataset. 2022. Available online: https://www.resdc.cn/DOI/doi.aspx?DOIid=105 (accessed on 9 February 2025).
  65. Xu, X. Multi-year County-Level Administrative Boundary Data of China. Registration and Publishing System. 2023. Available online: https://www.resdc.cn/DOI/doi.aspx?DOIid=120 (accessed on 9 February 2025).
  66. Wang, Q.; Su, F.; Zhang, Y.; Jiang, H.; Cheng, F. Morphological Precision Assessment of Reconstructed Surface Models for a Coral Atoll Lagoon. Sustainability 2018, 10, 2749. [Google Scholar] [CrossRef]
  67. Huo, F.; Hu, C.; Lei, P.; Jiang, S.; Qu, F. Risk Level-oriented Optimization of Multi-level Coverage Fire Station Location. J. Catastrophology 2025, 40, 178–184. [Google Scholar] [CrossRef]
  68. Ministry of Public Security of the People’s Republic of China. Code for Fire Station Construction in Urban Areas (Construction Standard 152—2017); China Planning Press: Beijing, China, 2017. [Google Scholar]
  69. Zhou, T.; Liu, D.; Liu, W.; Li, Y.; Zhu, S.; Wang, J.; Shi, L. Hierarchical Dynamic Estimation of Fire Service Accessibility Based on POI Big Data. Case Stud. Therm. Eng. 2024, 59, 104503. [Google Scholar] [CrossRef]
  70. Hong-yan, G.; Cheng-tai, D. Discussion on the impact of karst topography to urban development—A case in Guiyang City. Carsologica Sin. 2010, 29, 81–86. [Google Scholar]
Figure 1. Location map of the study area.
Ijgi 14 00393 g001
Figure 2. Map of NPP/VIIRS, types of potential fire points, and road network in the study area.
Ijgi 14 00393 g002
Figure 3. Research design flowchart for the study.
Ijgi 14 00393 g003
Figure 4. The curve of the normalization equation for A = 10.
Ijgi 14 00393 g004
Figure 5. The multi-factor superposition process using the EMYCIN algorithm.
Ijgi 14 00393 g005
Figure 6. Kernel density analysis results of the POI categories.
Ijgi 14 00393 g006
Figure 7. SAVEE assessment of fire risk.
Ijgi 14 00393 g007
Figure 8. Fire service accessibility assessment results.
Ijgi 14 00393 g008
Figure 9. Local spatial autocorrelation analysis maps.
Ijgi 14 00393 g009
Table 1. Data required for this study and their sources.
Data TypeDescriptionSource/Platform
Nighttime light dataNPP/VIIRS data (2021)Resource and Environmental Science Data platform [64]
POI data of fire stations and possible fire pointsCrawled using Python (version 3.9.13) from Gaode Map API (2023)Gaode Map
Road network dataRoad network of Guiyang City (2023)OpenStreetMap
Administrative division mapGuiyang City administrative boundaries (2022)Resource and Environmental Science Data platform [65]
Digital Elevation Model (DEM) data12.5 m resolution DEM for Guiyang CityResource and Environmental Science Data platform
Statistical yearbook dataSocioeconomic statisticsGuiyang City Statistical Yearbook (2023)
Table 2. Global autocorrelation significance test.
TypeMoran’s Iz-Scorep-Value
Fire service demand magnitude0.953673126.6211670.000000
Accessibility0.852655168.2669660.000000
Table 3. High/low clustering analysis.
TypeGeneral Gz-Scorep-Value
Fire service demand magnitude0.000150124.3645500.000000
Accessibility0.000200164.3515980.000000
Disclaimer/Publisher’s Note: The statements, opinions and data contained in all publications are solely those of the individual author(s) and contributor(s) and not of MDPI and/or the editor(s). MDPI and/or the editor(s) disclaim responsibility for any injury to people or property resulting from any ideas, methods, instructions or products referred to in the content.