Article

Mapping Street Patterns with Network Science and Supervised Machine Learning

1
Faculty of Geo-Information Science & Earth Observation (ITC), University of Twente, 7522 NB Enschede, The Netherlands
2
School of Geographical & Earth Sciences, University of Glasgow, Glasgow G12 8QQ, UK
*
Author to whom correspondence should be addressed.
ISPRS Int. J. Geo-Inf. 2024, 13(4), 114; https://doi.org/10.3390/ijgi13040114
Submission received: 20 December 2023 / Revised: 14 March 2024 / Accepted: 17 March 2024 / Published: 28 March 2024

Abstract

:
This study introduces a machine learning-based framework for mapping street patterns in urban morphology, offering an objective, scalable approach that transcends traditional methodologies. Focusing on six diverse cities, the research employed supervised machine learning to classify street networks into gridiron, organic, hybrid, and cul-de-sac patterns with the street-based local area (SLA) as the unit of analysis. Utilising quantitative street metrics and GIS, the study analysed the urban form through the random forest method, which reveals the predictive features of urban patterns and enables a deeper understanding of the spatial structures of cities. The findings showed distinctive spatial structures, such as ring formations and urban cores, indicating stages of urban development and socioeconomic narratives. It also showed that the unit of analysis has a major impact on the identification and study of street patterns. Concluding that machine learning is a critical tool in urban morphology, the research suggests that future studies should expand this framework to include more cities and urban elements. This would enhance the predictive modelling of urban growth and inform sustainable, human-centric urban planning. The implications of this study are significant for policymakers and urban planners seeking to harness data-driven insights for the development of cities.

1. Introduction

Studying urban morphology is crucial for a comprehensive understanding of the built environment in our increasingly complex urban landscapes [1,2], including a broad spectrum of elements such as buildings, streets, public spaces, and green spaces [3,4,5,6]. Streets, in particular, are the backbone of urban connectivity and accessibility, dictating the flow of people, goods, and information [7,8,9,10,11]. They significantly influence urban planning decisions, impacting everything from public transportation routes to the location of services and amenities. Streets are also a very complex subject to study as countless factors are involved in how a street performs and is perceived by people [7,12]. To ease the studying process, streets are abstracted as a network layout with street junctions as nodes and streets as edges. Street patterns further summarise the types of street network layouts to help scholars and planners ease the understanding of street morphology and provide effective communication tools for stakeholders. However, recognition of the street pattern at a large scale remains a challenge. Lately, new opportunities have arisen for identifying and mapping street patterns with the introduction of new data and quantitative methods. The new method has great potential to enhance the ability for large-scale urban studies with street patterns [13,14].
This research introduces a novel approach by utilising supervised machine learning to analyse these intricate components of urban morphology, emphasising the pivotal role of street patterns. First, our study aimed to show the novelty of applying machine learning and street-based local area (SLA) to urban morphology analysis with street patterns; second, investigate how the different street patterns may reveal the urban spatial structures of the cities, which in turn tell the stories of their urban development history and unique characters; and third, a preliminary comparison of how the different units of analysis may impact the result. By employing the OpenStreetMap (OSM) dataset from six case study cities and utilising machine learning techniques, notably the random forest method, we provide a fresh perspective on the analysis of street morphology. This approach enables us to categorise street networks into patterns, such as gridiron, organic, hybrid, and cul-de-sacs, offering insight into how these patterns may reflect urban spatial structure and development, thus contributing to the resident’s quality of life and sustainability.

2. Literature Review

2.1. Street Patterns in Urban Morphology

The study of street patterns transcends mere aesthetic appreciation; it is a lens through which the evolution of urban areas can be observed. These patterns reflect a city’s history, socio-economic status, and the prevailing urban planning philosophies over time [15,16]. The existing literature identifies these patterns as critical indicators of urban functionality, revealing the segregation of land uses, the hierarchy of transportation networks, and the delineation of socio-economic zones [17,18,19,20].
The challenge arises when attempting to scale these observations for cross-city comparisons; the current methodologies show significant variance in categorising and interpreting street patterns, especially when transitioning from a manual, heuristic-based approach to a more systematic one. Several ways of categorisation were mentioned in the summarised work of “Street and Patterns” by Marshall alone [7]. The categorisations, for example, include the ABCD type of street patterns, which focus on… aspects of street life and have been applied to study the relationship between streets and land use [21]. Another categorisation is based on connectivity, depth, and continuity, emphasising the street’s route type. With many other types of categorisations of street patterns existing in different fields of studies, there is no standard for which is better, only which classification is suitable. However, the common premise for these street patterns to be utilised in modern morphological studies is that they can be digitalised for quantitative analysis like other urban elements. They can either be stored as a networked structure, facilitating urban morphology analysis with their network metrics like connectivity [22,23], or stored as a raster file, providing detailed information for computer vision-based analysis [24,25].
Another challenge lies in how we separate the street network in a city, so in urban studies and planning, in other words, what is the best unit of analysis for streets? The street differs from other elements, such as buildings, and is a single continuous entity sprawling beyond the city. The current street analysis typically uses the administrative boundaries or the raster matrix to study the street network within a city’s boundary [24,26]. On the one hand, the performance of the administrative boundary depends on how well it captures the ground truth of the street network while being disadvantageous for a cross-city analysis. On the other hand, the raster matrix ignores the network nature of streets and may thus have a deeper modifiable areal unit problem (MAUP) that impacts the analysis results due to the different network structures.
Recent advancements have provided tools like OSMnx and NetworkX, which offer a new level of granularity in the analysis of street networks, allowing for comprehensive metrics at various scales to be extracted [13,14]. Moreover, the newly proposed street-based local area has also emerged as a new unit of analysis that uses the street’s network structure to define the boundary. However, a gap remains in utilising the full spectrum of metrics available to supervised machine learning algorithms. The opportunity lies in creating a standardised, scalable approach to map and interpret street patterns across different urban contexts, which can benefit from the consistent, metric-driven analysis that machine learning offers.

2.2. Machine Learning as a Quantitative Lever in Urban Morphological Studies

In urban morphology, machine learning represents a significant shift towards quantitative analysis, providing robust tools for assessing and categorising the complexities of street networks. It is also adept at managing large-scale data and revealing patterns that may be imperceptible to the human eye. Integrating machine learning with well-established GIS technology in urban studies is still in development. Machine learning encompasses a wide array of quantitative methods, from basic clustering and regression to sophisticated deep learning models based on neural networks. These methods have progressively infiltrated urban studies, becoming essential for analysing urban morphology. They enable researchers to find correlations, identify clusters, and make predictions with precision and efficiency previously unattainable [27,28,29,30]. Hence, integrating machine learning into urban morphology is not merely technical but methodological, enabling a profound understanding of urban form dynamics and interactions.
By leveraging the full suite of machine learning tools in concert with GIS, urban scholars can transition from a primarily descriptive to a predictive approach in urban morphology. It leverages historical and contemporary data to forecast future urban developments, offering insights into potential growth patterns, transformations, and the consequences of urban planning decisions [31,32,33]. This predictive power is invaluable for planning resilient and sustainable cities, enabling planners and policymakers to anticipate changes and make informed decisions. The scalability of machine learning methods further enhances their value in urban studies. Urban morphology often deals with large spatial datasets, encompassing various scales from individual streets to whole cities or regions [34,35]. Machine learning algorithms are adept at efficiently managing and analysing these large volumes of data, making it possible to conduct extensive studies that provide a comprehensive view of urban forms across different contexts [36,37]. Lastly, machine learning algorithms can automate the classification and analysis of urban forms, significantly reducing the time and effort required for such studies. This automation minimises human error, leading to more accurate and reliable results.
However, the literature still needs to fully explore the potential of deploying these technologies to offer profound insights into street patterns. Existing studies have primarily focused on selective metrics and their impact on urban dynamics; the comprehensive analysis of generalised street patterns in conjunction with machine learning represents a novel and crucial contribution to the field [23,38,39].

2.3. Machine Learning Framework for Street Morphology
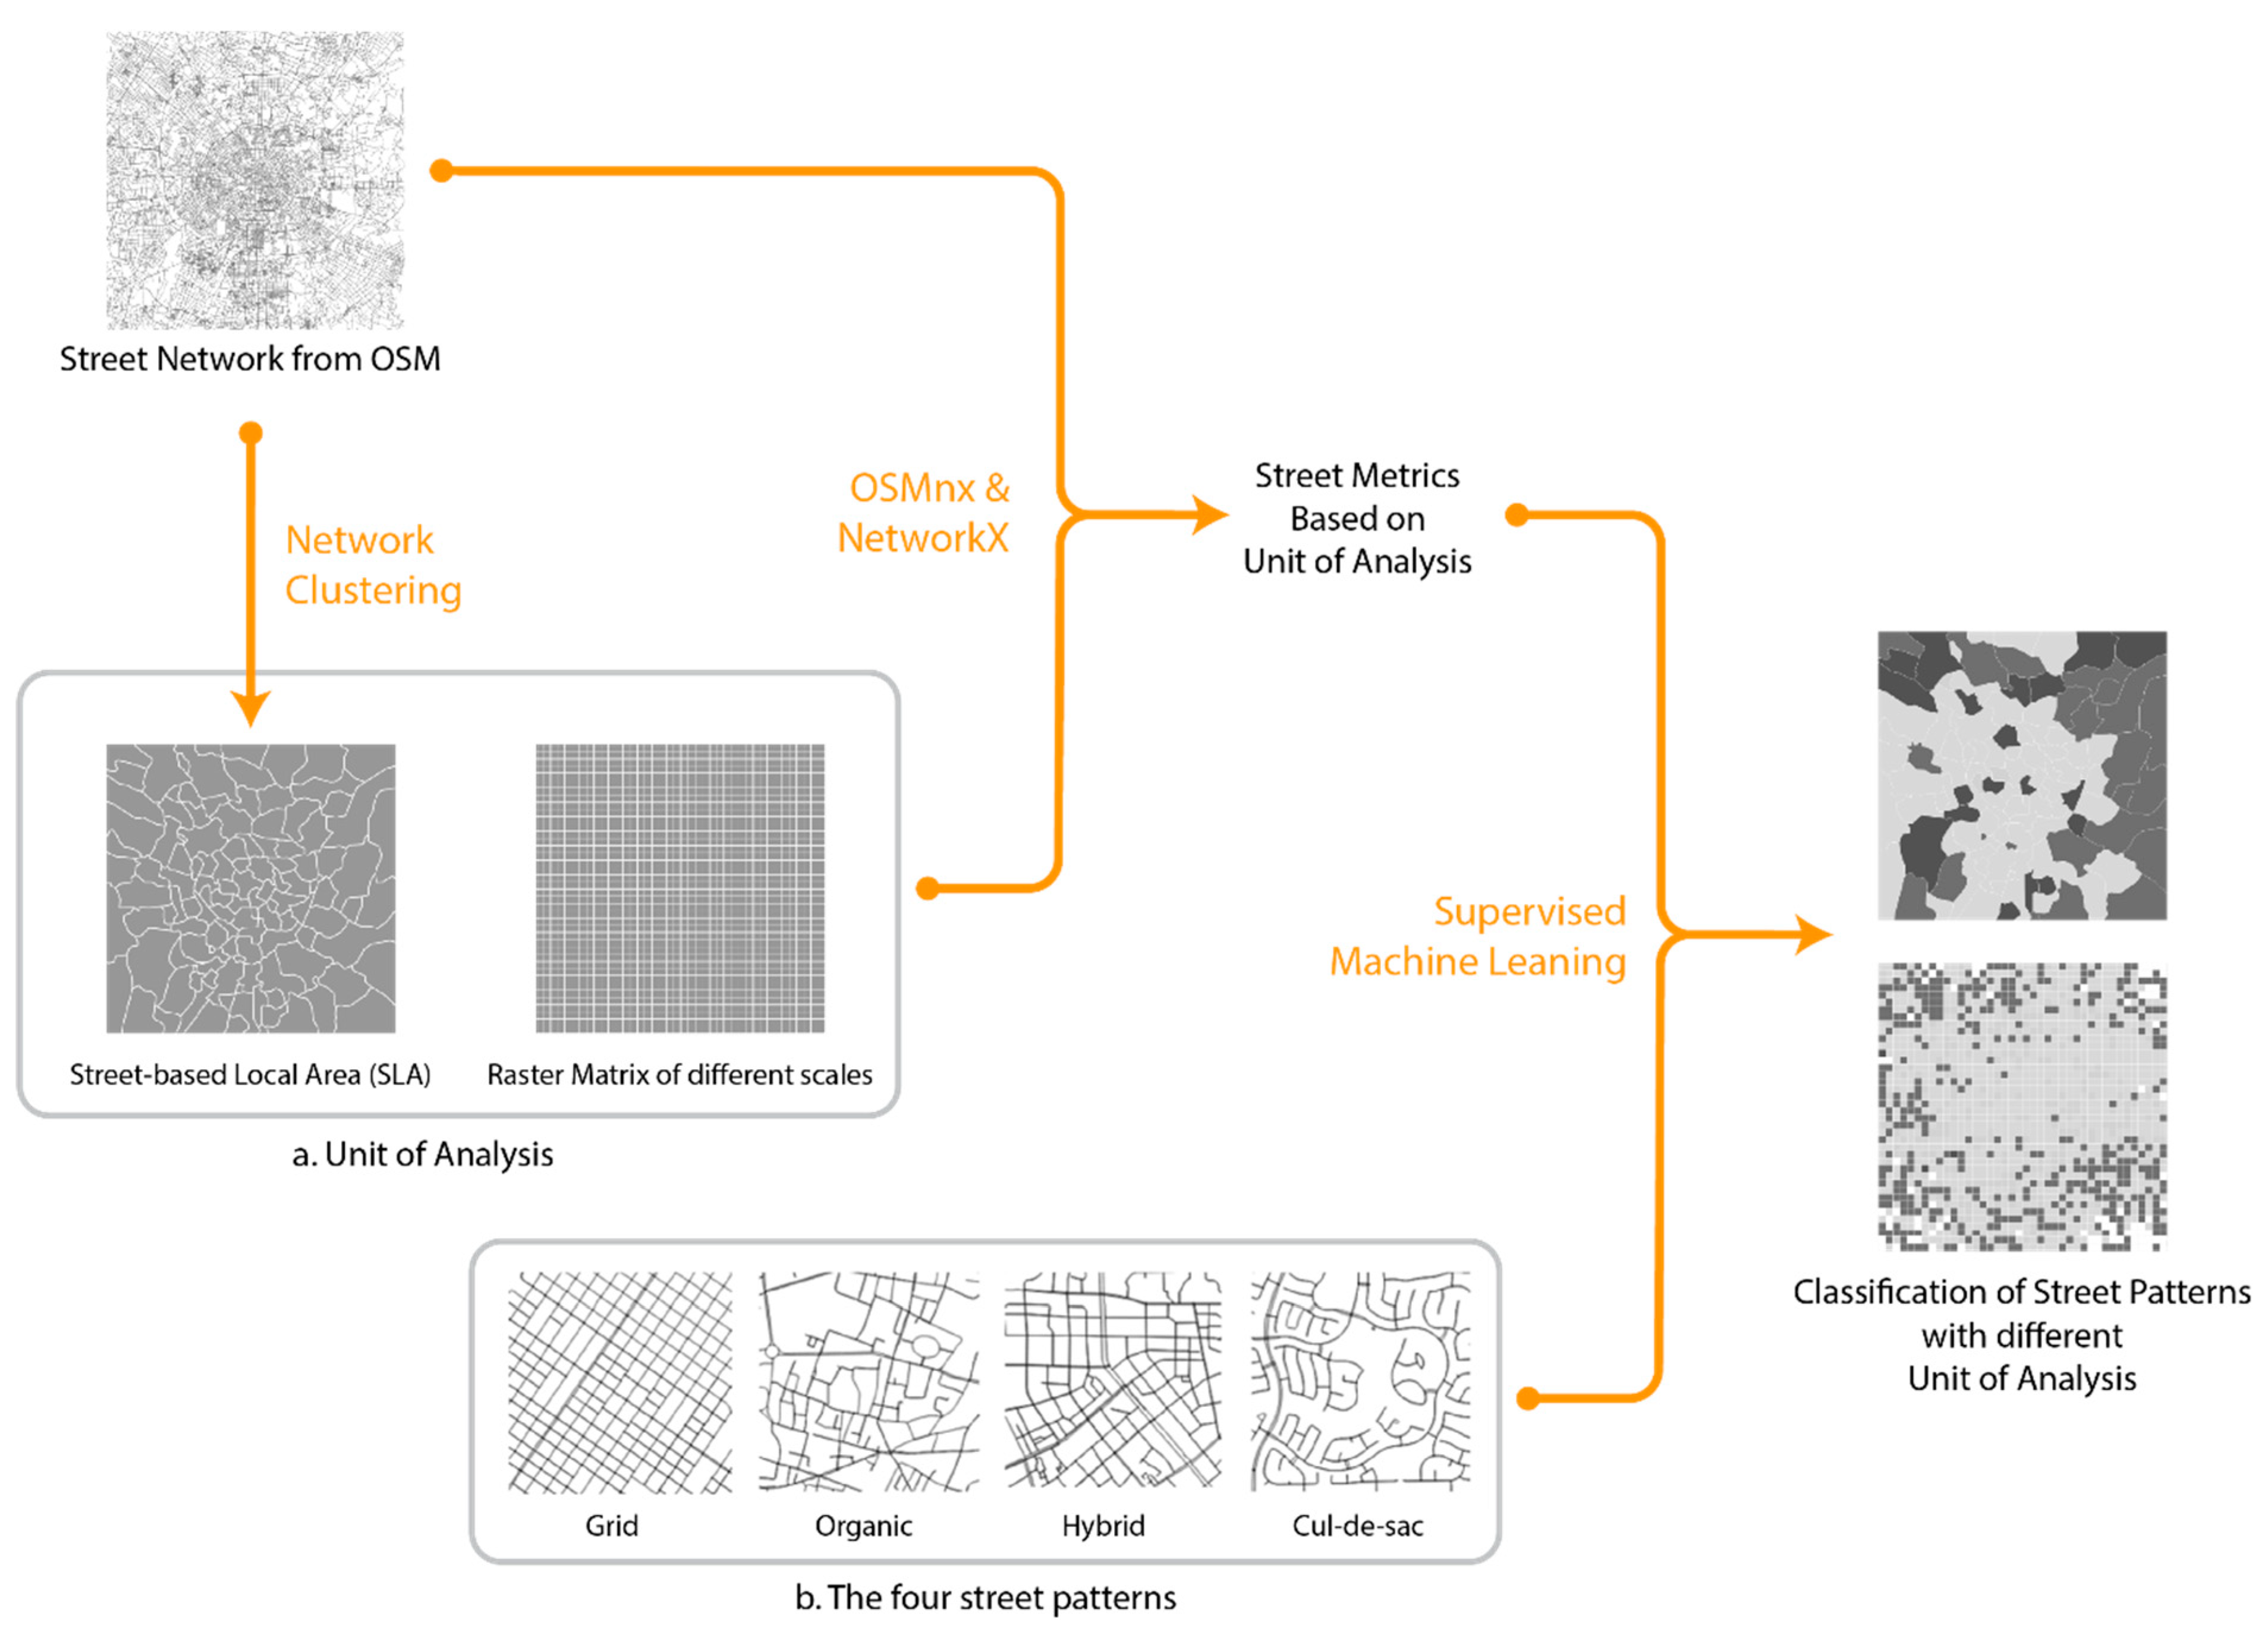
Given the importance of street patterns in urban morphology and planning, the availability of street metrics to inform the performance of street networks, and the effectiveness of machine learning methods in classifying urban patterns on a large scale with reproducibility, the mapping of street patterns meaningfully with consistency is compelling.
The digital classification and mapping of street patterns is standard in the existing literature and can be summarised into two streams. Starting from the street metrics we mentioned earlier, street patterns are classified by setting up a manual threshold of selective dimensions. However, this could be too stringent, as it only focuses on a few metrics while ignoring other emerging metrics and digital tools that could lead to a better understanding of street performance [36]. The later start of the more visual aspect of street layout, utilising methods like deep learning, has been explored for the visual categorisation of street morphology [24]; however, without considering the various street metrics proposed and the rich literature backing their ability to inform multiple urban phenomena. Such could represent a missing opportunity to define the character of street patterns, as they needed to use the street patterns to their full potential for both scenarios.
Another challenge when applying machine learning in studying street morphology is stemmed from choosing the unit of analysis. Considering the street as a continuous entity rather than a discrete urban element like a building, it is more subject to the MAUP [40] or uncertain geographic context problem (UGCoP) [41]. Currently, there are three ways to derive the study unit in street morphology. First, the administrative boundary, which is commonly used to study the street morphology within a city or cities following the same administrative systems [16]. Second, a raster matrix, the grid division, is commonly used in cross-city analysis where consistent administrative division is unavailable [24,42]. Finally, we have the street-based local area (SLA), which divides the unit of analysis based on the street’s network structure. The SLA is a relatively new unit of analysis in urban studies that was first introduced by Stephan Law [25]. After that, it was further developed to incorporate other urban elements for a more refined capture of the local area [10]. We believe that the SLA has great potential to map street patterns in cross-city research because, first, SLA’s street-based nature better captures the network structure and thus is more optimised for studying streets; second, it can be applied to any street network without prior knowledge, ensuring universal applicability between different cities [36]. However, the discussion on the merit of SLA over raster matrix division has remained theoretical, without illustrations in actual studies.
Together, these research gaps provided an opportunity for the comprehensive mapping and analysis of street patterns through machine learning. The added value of this methodology lies in its capacity to explore beyond the conventional single metric of street analysis, such as connectivity and centrality, to a broader examination of the street patterns that underpin urban form and function.

3. Methodology

This study proposed a framework to utilise street metrics to identify and map street patterns in multiple cities by mapping the street pattern with a supervised machine learning classifier. The SLA was selected as the primary unit of analysis for these classifications. Meanwhile, we also compared how the pattern identification and mapping results may differ with a raster matrix unit of analysis.
Figure 1 shows the flowchart of the general methodology. First, street networks were extracted from a single source of OpenStreetMap. Second, to ensure the consistency and optimisation of the unit of analysis, this study generated the SLA as the baseline together with a raster matrix of varying scales, as shown in Figure 1a. Third, all metrics were calculated quantitatively via NetworkX and OSMnx. Finally, several supervised classification methods were deployed to identify the street patterns and assess their performance on the training and testing dataset. Four types of street patterns were adopted from existing studies for mapping, as shown in Figure 1b: gridiron, organic, hybrid, and cul-de-sacs. The mapping of the four street patterns in the SLA across the six cities was eventually analysed and compared against the raster matrix to show the urban spatial structure.

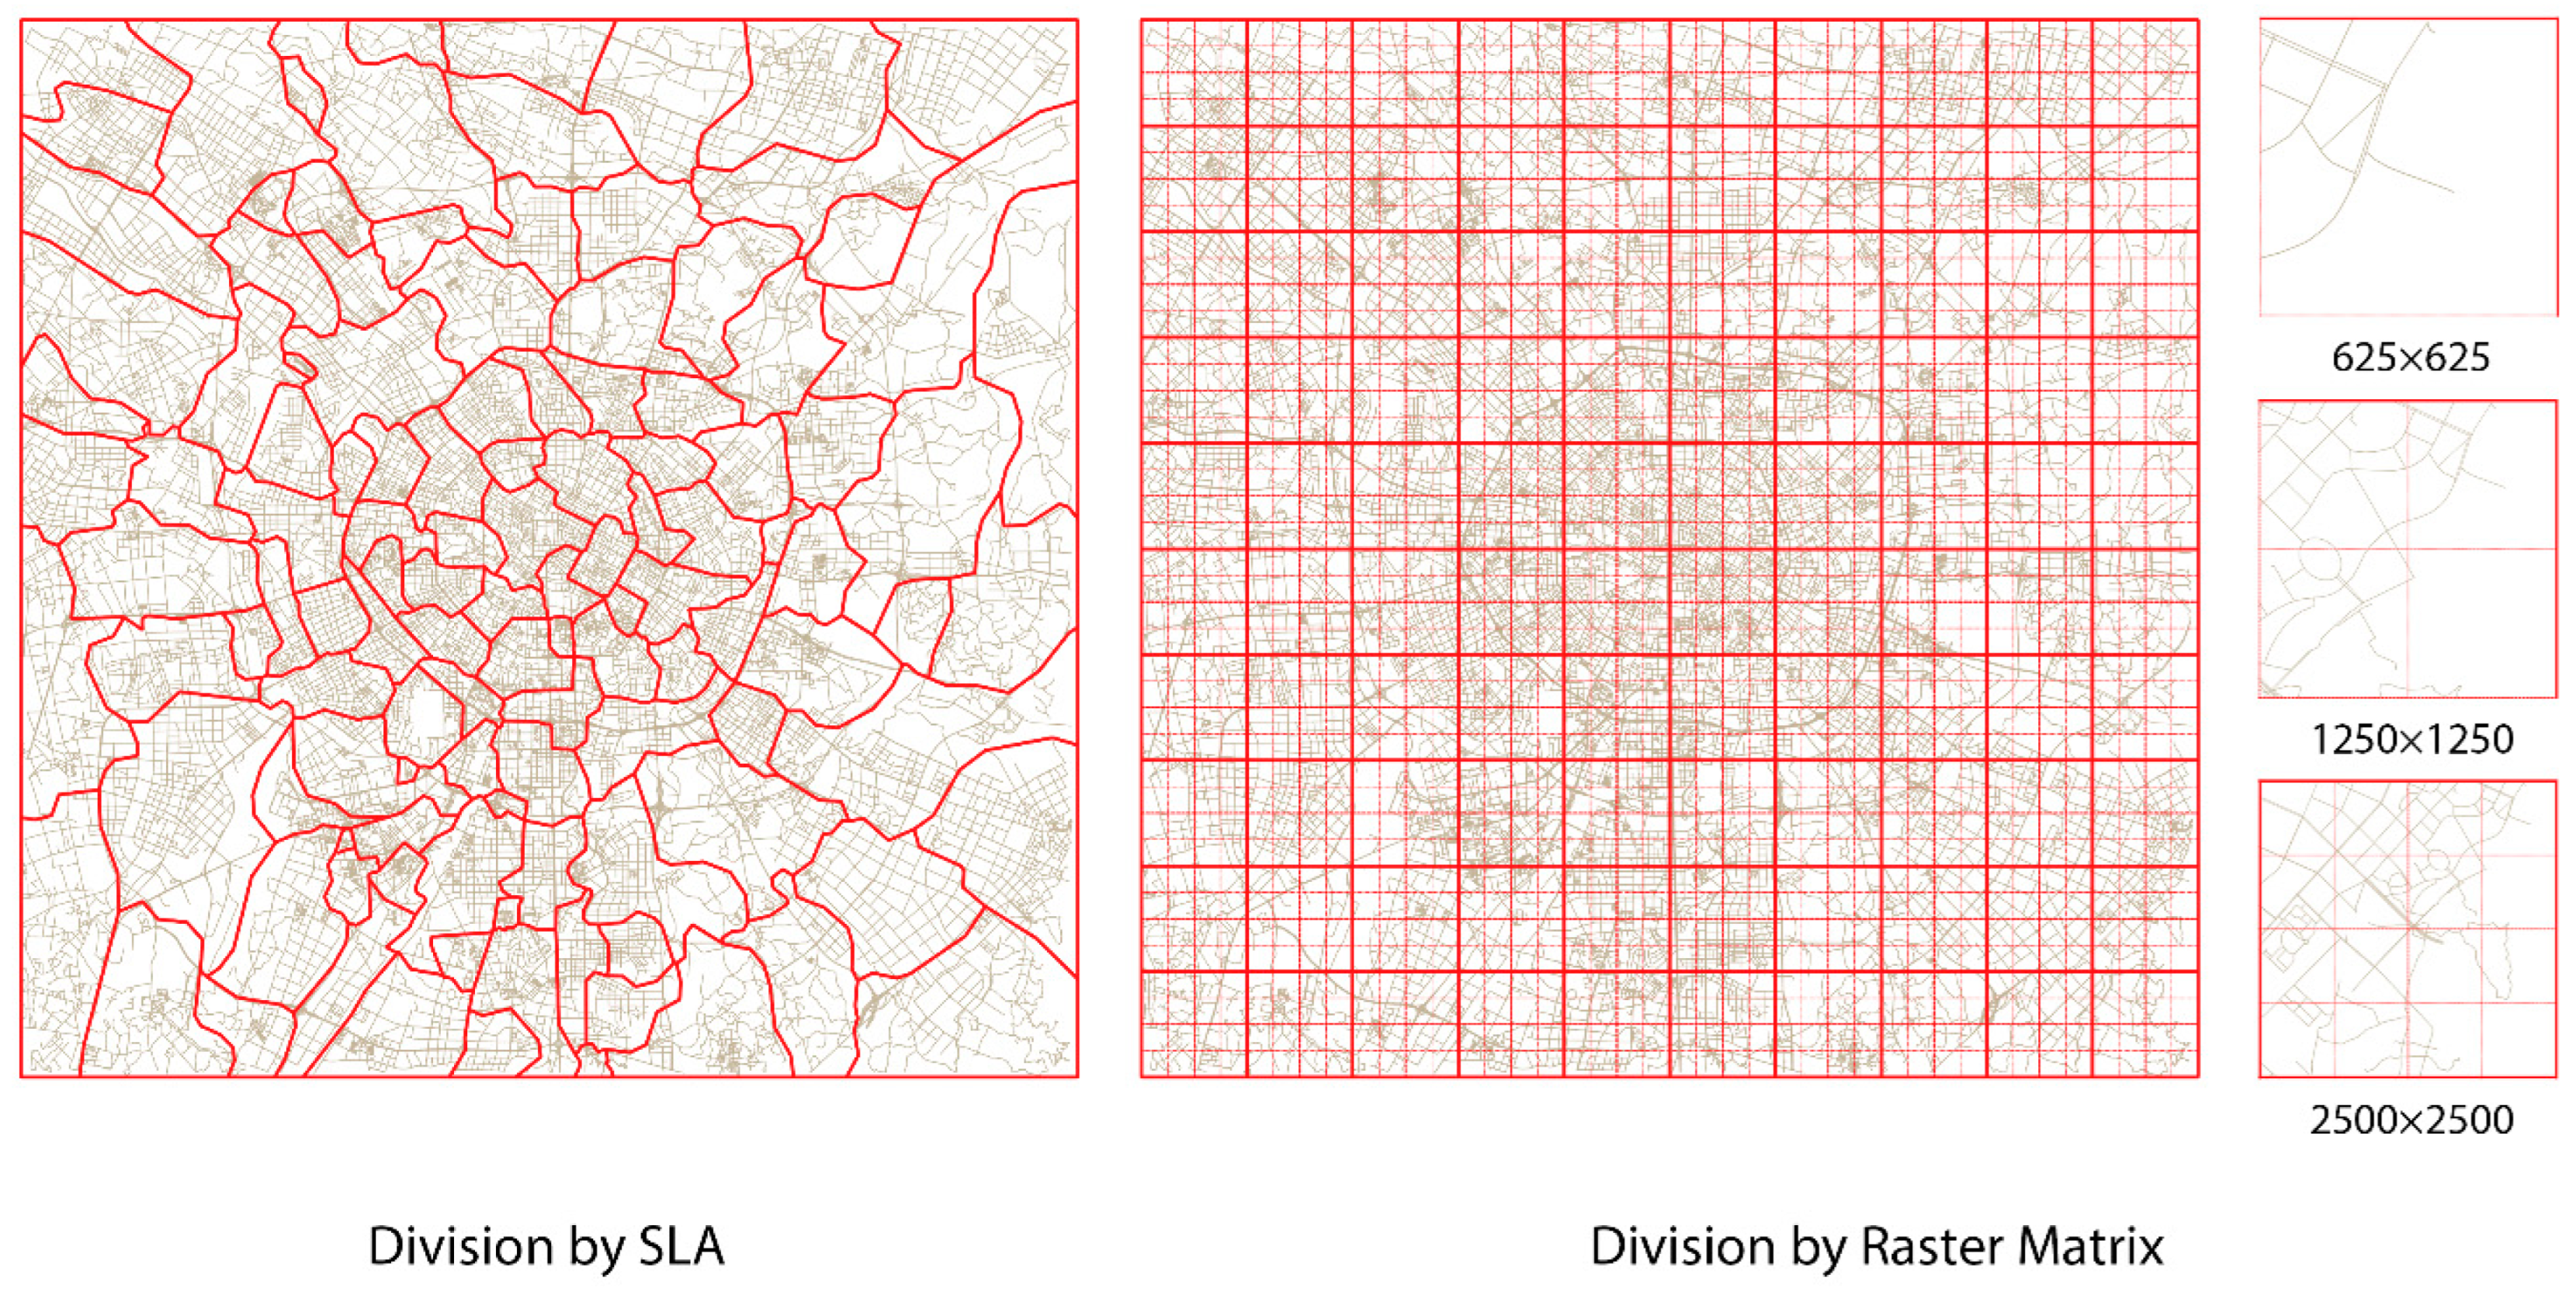
3.1. Case Study Area and Unit of Analysis

In a deliberate effort to encompass a broad spectrum of street morphology, the study focused on six global cities: Amsterdam, Chengdu, London, Seoul, Houston, and New York City. These cities stand out not only for their significant differences in history, economy, culture, and governance, but also for their distinctive patterns of urban development and transportation dynamics, which have shaped their unique street layouts. Furthermore, these case studies are advantageous for research due to the extensive existing literature, the availability of varied data sources, and the accessibility of high-quality open data, all of which open avenues for ongoing and future scholarly inquiry. Since they have different sizes and administrative divisions, this study unified the case study area in a square with a 25 km side length. For the same reason, universal units of analysis were adopted: SLA and raster matrix systems of different resolutions.
SLA as the unit of analysis offers significant advantages over traditional raster matrix approaches, particularly in urban morphology and street pattern analysis. Unlike the raster matrix, which does not consider the network character of the street due to its fixed, grid-like nature, the SLA methodology leverages the inherent network structure of urban streets, providing a more nuanced and accurate representation of urban forms. This methodological shift allows for a more detailed and context-sensitive analysis of street patterns, capturing the dynamic and interconnected nature of urban environments. By focusing on the connectivity and relationships within the street network, the SLA approach facilitates a deeper understanding of urban morphology. It enhances adaptability across different urban contexts, while its ability to incorporate a wide range of urban metrics makes it a superior choice for comprehensive urban studies, offering clear methodological advantages in terms of scalability, transferability, and analytical depth.
This study also sought to investigate how different units of analysis may affect the identification and mapping of street patterns in cross-study analysis. In contrast to the SLA is the conventional administrative boundary and raster matrix unit. Unfortunately, we could not find administrative divisions that worked for all six case study cities that could be comparable and meaningful for street analysis. For the raster matrix division, this study chose three scales. The size of the division was based upon two standards: first, the ease of division to the size of the study area of 25 km square, and second, the size should be suitable to capture the street network with different levels of detail. Hence, the street metric and pattern were identified as 2500 × 2500 m, 1250 × 1250 m, and 625 × 625 m square. This divided the study area into 100, 400, and 1600 standardised units of analysis, and we identified these as the macro-, meso-, and microscale, respectively.
An examination of the different units of analysis in Chengdu is shown in Figure 2. The SLA had varying sizes that adapted to the street network structure. In contrast, the right side shows the street network captured by the three scales of the raster matrix; the macroscale had the most information while having higher chances of including streets with distinctive structures. The microscale, at the different end of the spectrum, may need more information to deduce the street metrics. In extreme cases, some units of analysis may have too few or no streets captured. By comparing the mapping of the street pattern across the four different units of analysis/kernels, we hoped to reveal their strengths and limitations in capturing and mapping street patterns.

3.2. Street Metrics and Patterns

Street network data were extracted from OpenStreetMap, an open data platform, ensuring a universal data source. By representing streets as networks, several street morphological metrics were computed to capture the physical characteristics of the streets. The computation was implemented using network analysis tools such as Network and OSMnx. Due to the variation in the size of the units of analysis, any metric dealing with absolute size such as the total street length was omitted from the classification. This study also eliminated high-correlations metrics to ensure a better classification result. The explanation of the selected metrics is shown in Table 1 [36].
The metrics were calculated by the unit of analysis, one set by SLA and three sets by the raster matrix, making a total of four datasets. Note that for reduced sizes, the chances of the unit of analysis having less than sufficient street crossings to generate meaningful metrics to identify street patterns will also increase. This will probably skew the dataset and result in errors in calculating the metrics and street pattern identification. Hence, this study removed data entries with street junctions less than 20. The removed unit of analysis was coloured blank in the mapping, indicating no or insufficient streets present in the area.
Existing studies have proposed various street patterns based on the different purposes of the study. This study adopted the most common street patterns: gridiron, organic, hybrid, and cul-de-sacs [7], as shown in Figure 1b. Gridiron is a typical street pattern with uniform directions, straight streets, and right-angled X-shaped crossroads. The organic street pattern contrasts with gridiron; the street is curly in various directions, and the street junction also has diverse appearances. Hybrid street patterns fall between the gridiron and organic. Finally, cul-de-sacs are most recognisable for their dead-ends and circular streets.
To produce the training and testing dataset for the upcoming machine learning classification, a portion of the dataset needed to be randomly selected to identify street patterns manually. With the current four datasets of unique units of analysis, training, and testing datasets were prepared for the dataset with SLA for the following reasons. First, as illustrated in Figure 2, consistent manual identification of street patterns is impossible in raster matrix division because of the random division of the street network. Second, suppose we provide training and testing datasets with raster matrix division with an additional unspecified or no pattern, this may greatly skew the dataset and result in unusable predicting results. Third, the SLA itself has varying sizes, and the metrics we have selected do not deal with absolute sizes. Therefore, the resulting classifier from using this training dataset has the potential to be applied in units of analysis with varying sizes. Hence, 300 SLAs were randomly picked and manually identified for their street pattern, which was used to train and test the supervised machine learning classification model.

3.3. Machine Learning Classification

According to the analysis above, there are three characteristics when using machine learning (ML) for mapping street patterns. First, features used in ML were well-engineered with the quantitative metrics of Table 1, which could comprehensively describe the street patterns. This means that the extraction of features does not need to be implemented by ML itself [43]. Second, the target variable was well-defined label data (i.e., four types of street patterns). Third, training samples were limited. On the one hand, the lack of relevant research and the complexity of manual identification means that the amount of sample data cannot be large. On the other hand, ML should deal with this issue by automatically mapping street patterns using as few samples as possible, which was also a target of this research.
Based on these characteristics, the traditional ML approach, instead of deep learning, was more suitable for this study [43,44]. Referring to the research on urban geography [45,46,47], we compared five representative traditional ML algorithms in the proposed framework—K-nearest neighbours (KNN), multilayer perceptron (MLP) neural network, support vector machine (SVM), XGboost (XGB), and random forest (RF).
KNN is one of the simplest and historically supervised machine learning algorithms. By memorising all the sample data, KNN conducts the classification by looking at the ‘k’ nearest samples to find the majority class among them [48]. KNN is simple to use, insensitive to outliers, and is particularly suited to classifying geographic phenomena with spatial autocorrelation structures. However, KNN has a high storage overhead and high computational cost, which would face plenty of difficulties, especially in the face of potentially large data street patterns. Moreover, besides spatial autocorrelation, urban structure, and street patterns also have spatial heterogeneity [49], which might limit the use of KNN. In this research, the ‘k’ of KNN was set as 5. MLP is a basic and lightweight feedforward neural network on which various deep learning models are developed. It comprises a visible layer, an output layer, and only a few hidden layers (neurons interconnect all layers). It is capable of learning complex patterns in the sample data by a specific activation function [50]. MLP specialises in complex patterns and facilitates parallel computation. However, we must know that MLP is prone to overfitting and has a relatively tedious hyperparameter turning process, especially in street pattern classifications with diverse cities and data. There was only one hidden layer in the MLP of this research, and the activation function was a rectified linear unit function. SVM is also a famous supervised learning algorithm. SVM works by finding the optimal hyperplane that best separates data points into different classes while maximising the margin between the classes [51]. SVM is very effective in dealing with nonlinear relationships and high-dimensional data. However, SVM is also sensitive to feature scaling and noisy data. The kernel function is the most important hyperparameter of SVM. In this research, we chose a radial basis function kernel. XGB and RF are both representative ensemble learning methods. Boosting is a kind of approach that iteratively enhances the performance of the ML model. XGBoost is the abbreviation of eXtreme Gradient Boosting, an optimised boosting algorithm that is highly efficient, flexible, and scalable [52] In this research, the number of weak learners was 250, and the learning rate was 0.3. RF is a type of representative ensemble learning (besides RF, ensemble learning also has XGboost, Adaboost, etc.), combining multiple individual decision trees to obtain the final classification results through voting the individual tree’s results [53]. RF has many noticeable advantages such as being user-friendly and robust, stable, and accurate performances. In particular, RF has good versatility with data with different distributions or characteristics, which was quite helpful for our research’s street pattern mapping of different cities. Two key hyperparameters of RF, the number of trees and the maximum number of features were set as 500 and the square root of the number of covariates, respectively. Since the objective of this research was to build a feasible framework for mapping street patterns with supervised machine learning, after comparing three ML algorithms, we chose the best-performing one for the entire dataset.

4. Results and Discussion

4.1. Performance of Machine Learning Method

To select the best ML approach in this study, 5-fold cross-validation was implemented on the same training set to compare the five machine learning methods, where 20% was used for testing and 80% was used for training. To have a comprehensive comparison of all ML approaches, five metrics of classification accuracy were calculated simultaneously with scikit-learn [51], which were accuracy, precision_weighted, recall_weighted, f1_weighted, and the roc_auc_ovo_weighted (AUC). These five metrics provide different insights and can complement each other; more details can be found on scikit-learn. Considering that the street patterns are multiple (instead of binary) classes, and the amount of each class is balanced, the latter four metrics were modified as weighted averages from the original binary-class values. The results are shown in Table 2.
The results showed that RF was the best approach, outperforming KNN, MLP, and SVM in all of the evaluation metrics. The AUC score of RF was close to 0.8, which indicates that RF has good discriminatory power for street patterns and performed significantly better than random guessing. RF has other advantages for classifying street patterns; for example, RF is robust when facing different datasets [54], which satisfies the requirement of mapping street patterns in various cities. RF is also user-friendly and does not need complex parameter tuning process RF can list the feature importance once building the model, and it can help analyse how the quantitative metrics in Table 3 contribute to the street pattern identification.
Despite the application of various ML methods, the performance of our classifier in urban morphology studies—specifically in identifying street patterns—presents unique challenges not typically encountered in conventional natural sciences. Urban morphological studies inherently lack clear boundaries for classifying diverse street patterns, contributing to the complexity of machine learning applications in this field. Our study introduced four patterns that represent a spectrum rather than discrete categories, acknowledging the nuanced nature of the urban form. Additionally, the manual identification of the training data introduced uncertainty, particularly for patterns at the margins. There are several potential ways to increase the performance of the ML classifier; for example, by excluding the borderline cases and only including the most typical street patterns in the training dataset or by proposing pre-defined patterns based on selected metrics rather than the patterns that are commonly observed in existing practices and the literature. However, urban morphology, including the streetscape, is an inherent complex study object destined to be filled with uncertainty and unpredictability [55,56], which urban scholars need to be able to navigate. Hence, the classifier in this study did not aim to reproduce results from the training data perfectly but rather to provide a dependable standard that can classify street patterns with consistency and best capture the essence of manual identification. In this context, we consider the prediction performance achieved to be acceptable in the scope of our research, offering a dependable standard for urban morphology studies.

4.2. Street Pattern Features and Urban Spatial Structure with the Street Pattern

The random forest classifier indicated that the five most crucial attributes were: circuity (13.2%), X-junction (11.9%), street length (9.2%), degree Pearson (9.1%), and orientation entropy (7.5%), collectively accounting for 55% of the classification outcome explanation. Table 4 presents the average values of these metrics for each street pattern. Most of these values corresponded to the general descriptions of the patterns, with gridiron and organic types at opposite ends of the spectrum and the hybrid situated in between. The cul-de-sac style had the highest circuity, street length, and the lowest X-junction and degree Pearson values. Most of these characteristics could be easily discerned through visual observation, likely due to the original training dataset being manually identified based on the visual distinctions of the patterns.
Figure 3 shows the mapping of street patterns with the first column using the SLA. Several observations can be made concerning the urban spatial structure after mapping the street patterns in the SLA. Generally, most cities showed a ring structure with two to three layers of street patterns. A core was present at the centre of the case study area, which can be considered the historical urban area. Depending on the city, the core was mainly occupied by either the gridiron or organic types of street patterns. Surrounding the urban core was the second layer; this resulted from urban expansion and is considered as an extension of the urban core. The street network in this layer generally formed at a different period than the urban core, which broke away from the conventional pattern and appeared to be hybrid. Finally, the outermost layer at the city’s periphery mostly showed a cul-de-sac pattern and are considered suburban areas. Hence, the urban spatial structure revealed by the street pattern shows urban functions through the urban–suburban division and reflects the different stages of urban development.
The distribution of street patterns showed the urban structural differences between cities. First, as previously mentioned, some cities showed three layers of a ring structure while others only had two. Houston and London are typical cities with three layers of urban spatial structure where an urban core, urban extension, and suburban division can be identifiable. The gridiron inner core in Houston and the organic inner core in London reflect the differences in the planning and urban development in North American and traditional European cities. In contrast, Chengdu and Amsterdam showed a two-layer urban spatial structure where the urban core was not recognisable from the street pattern. In addition, the street pattern mapping also, to some degree, reflects the polycentricity [31,57] of the cities. For example, the study area in the Amsterdam region clearly showed a polycentric urban spatial structure with multiple urban cores present. This is probably because the study area covered surrounding cities like Haleem and Zaandam, which the street pattern can capture. In contrast, cities like Chengdu and Houston appeared to be more monocentric.

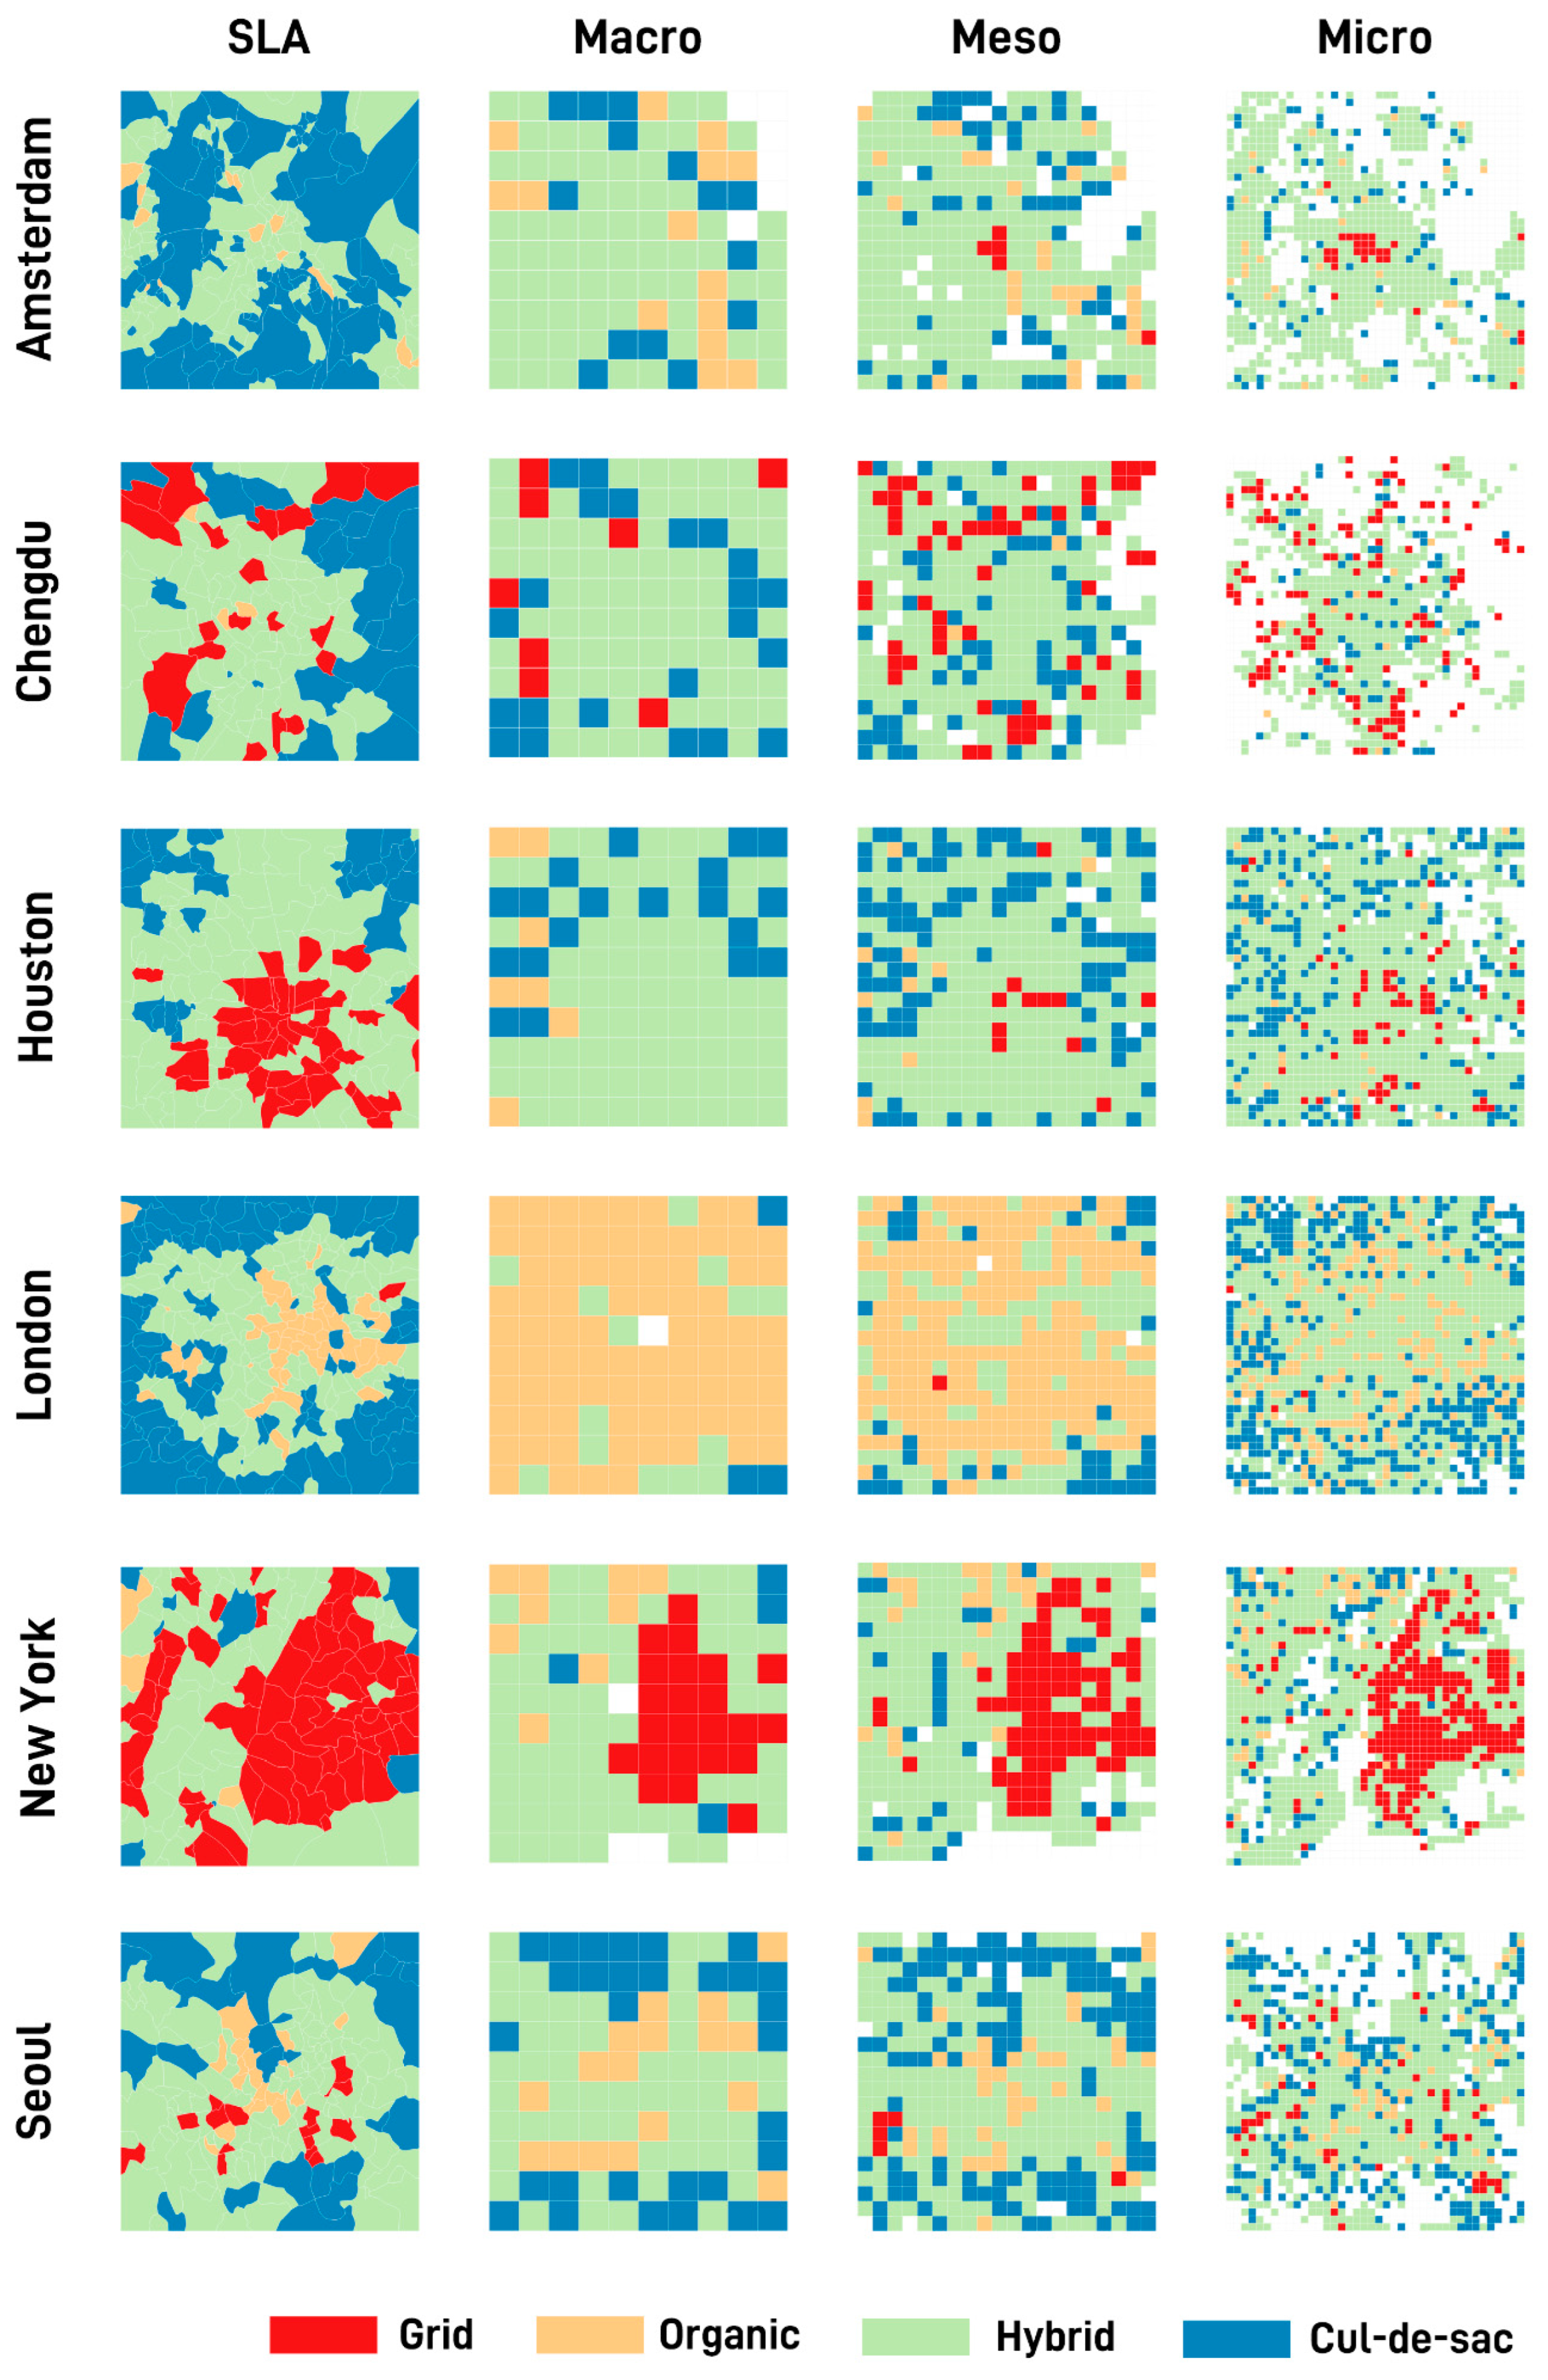
4.3. Impact of Different Units of Analysis

The mapping of the street pattern using the different raster matrices showed very distinctive results. The macro raster matrix size (2500 × 2500 m) tended to oversimplify, failing to capture the intricacies necessary for cross-city comparison. In stark contrast, the micro raster matrix size (675 × 675 m) delineated the street patterns more precisely, revealing distinct ring structures and urban cores, as seen in Amsterdam and London. Nonetheless, the finer scale also introduced larger areas of undefined space due to the smaller unit size. The mesoscale (1250 × 1250 m) provided a balanced resolution, capturing moderate detail without excessive generalisation or fragmentation.
The second observation was that different street patterns were identified with the shifting unit of analysis. Within the raster matrix system, the street pattern changed tremendously. In the case of London, the macro resolution almost categorised the entire city as a hybrid street pattern. In contrast, the cul-de-sac, peripheral, and hybrid street patterns began to appear for the mesoscale. At the finest micro level, the area for the organic pattern was significantly reduced, and the majority existed in transitional areas between the hybrid and cul-de-sac areas. Similar trends could also be observed in other cities like Amsterdam and Houston. Comparing the SLA mapping with the different resolutions of raster matrix mapping, a difference in street pattern identification was also observed. For example, in the meso- and microscales of the raster matrix, Amsterdam showed a grid urban core, while in the macroscale and SLA, no gird street pattern was identified. Like London, Houston, and the western part of the New York study area, the street pattern identified differed for the SLA and raster matrix division.
These variations echo two problems in the geographic analysis. The first is the MAUP that arises when the results of the spatial analysis change based on the scale or the way the boundaries are drawn in geographic data [40]. When different units of analysis are adopted, the street is dissected into different network structures with varying network characters that eventually end up in different street pattern classifications. The scale problem is especially evident when adopting the raster matrices, where the analysis results can differ depending on the size of the geographic units used. Larger units might mask variations that are visible at smaller scales. The second is the contextual uncertainty inherent in geographic analysis, a concept known as the uncertain geographic context problem (UGCoP). This refers to the idea that geographic units or areas are defined based on their relevance to human activities, behaviours, and social interactions. This concept emphasises that the boundaries of these units are not just physical or administrative but are also shaped by how people use and perceive spaces [41,58]. Unlike other urban elements, streets are presented as a single, continuous network structure and are not just physical spaces, but also channels of movements that influence and are influenced by human behaviours. Given that the choice of the spatial unit can profoundly affect the connectivity and accessibility property brought by the network structure, which is highly correlated to human behaviour, the choice of the spatial unit can profoundly affect the interpretation of urban form and function as well as the necessity of a nuanced approach to define urban areas for analysis, considering the multifaceted nature of urban development and the potential for varied interpretations arising from different methodological frameworks.
The core aim of this research was to introduce a machine learning approach to identify street patterns with significant implications for urban studies, especially in urban planning and policymaking, where accurate recognition of spatial structures is essential in these fields. However, applying machine learning to urban morphological patterns, especially at an exploratory stage, presents numerous challenges that must be addressed. Issues such as the MAUP and the lack of a quantitative definition for urban patterns highlight the complexity of this task. Furthermore, the variability in recognising patterns across different scales underscores the necessity for more sophisticated methods to accurately reflect urban forms’ intricacies.

5. Conclusions

This study has demonstrated a novel application of a quantitative framework that employs machine learning to systematically identify and map street patterns, offering a new dimension to the study of urban morphology. By integrating supervised learning techniques and street-based metrics with the SLA as the unit of analysis, the research has provided a consistent and scalable approach for analysing urban spatial structures across different cities. Machine learning tools have allowed for a transition from traditional, often subjective classification methods to a more objective, data-driven analysis. This shift is significant as it empowers urban scholars to move from descriptive assessment to predictive modelling, enabling the anticipation of urban growth patterns and the identification of emergent forms within the urban fabric. The methodology is evidently robust in its ability to handle large-scale data and uncover complex spatial relationships, offering invaluable insights for urban planners and policymakers.
This study mapped street patterns across six cities, showcasing the diversity of urban forms from historical cores to suburban peripheries. The observed ring structures signify the stages of urban development and each city’s unique socio-economic narratives. We could capture these nuances more accurately through the SLA than traditional raster matrices, which often neglect the continuous and networked nature of streets. However, the research acknowledges certain limitations. Although informed by extensive literature, the categorisation of street patterns still requires further refinement to enhance its precision and application in varied urban contexts. The manual selection process in the training set and the partial significance of the employed metrics in the classifier indicate areas where methodological improvements could be made. Moreover, the study reaffirms that street patterns alone cannot fully encapsulate urban morphology. A more holistic approach that includes multiple urban elements is necessary to grasp the complex interplay of the factors shaping our cities.
Future research should aim to refine the classification of street patterns, expand the framework’s application to a broader range of cities, and explore integrating additional urban elements into the analysis. Such advancements will enrich urban morphological studies and contribute to developing sustainable, resilient, and human-centric urban environments. This study’s findings underscore the potential of machine learning as a pivotal tool in urban studies, bridging the gap between theoretical frameworks and practical applications in urban planning and development.

Author Contributions

Conceptualization: Cai Wu, Jiong Wang, Yanwen Wang and Mingshu Wang; Methodology: Cai Wu, Jiong Wang, Yanwen Wang and Mingshu Wang; Software: Cai Wu and Yanwen Wang; Validation: Cai Wu, Jiong Wang, Yanwen Wang and Mingshu Wang; Formal analysis: Cai Wu; Investigation: Cai Wu; Data curation: Cai Wu; Writing—original draft preparation: Cai Wu; Writing—review and editing: Jiong Wang, Yanwen Wang, Menno-Jan Kraak and Mingshu Wang; Visualization: Cai Wu; Supervision, Jiong Wang, Menno-Jan Kraak and Mingshu Wang. All authors have read and agreed to the published version of the manuscript.

Funding

This research received no external funding.

Data Availability Statement

Data will be available afterwards on University of Twente’s dedicated open data platform.

Conflicts of Interest

The authors declare no conflict of interest.

References

  1. Oliveira, V.; Medeiros, V. Morpho: Combining Morphological Measures. Environ. Plan. B Plan. Des. 2016, 43, 805–825. [Google Scholar] [CrossRef]
  2. Wheeler, S.M. Built Landscapes of Metropolitan Regions: An International Typology. J. Am. Plan. Assoc. 2015, 81, 167–190. [Google Scholar] [CrossRef]
  3. Alexander, C.; Ishikawa, S.; Silverstein, M. A Pattern Language: Towns, Buildings, Construction; Oxford University Press: New York, NY, USA, 1977; ISBN 0195019199. [Google Scholar]
  4. Lopes, M.N.; Camanho, A.S. Public Green Space Use and Consequences on Urban Vitality: An Assessment of European Cities. Soc. Indic. Res. 2013, 113, 751–767. [Google Scholar] [CrossRef]
  5. Bolleter, J.; Hooper, P.; Kleeman, A.; Edwards, N.; Foster, S. A Typological Study of the Provision and Use of Communal Outdoor Space in Australian Apartment Developments. Landsc. Urban Plan. 2024, 246, 105040. [Google Scholar] [CrossRef]
  6. Berghauser-Pont, M.; Haupt, P. Spacematrix: Space, Density and Urban Form; CiNii Books: Rotterdam, The Netherlands, 2010. [Google Scholar]
  7. Marshall, S. Streets and Patterns; Routledge: New York, NY, USA, 2004; ISBN 0203589394. [Google Scholar]
  8. Hansen, W.G. How Accessibility Shapes Land Use. J. Am. Plan. Assoc. 1959, 25, 73–76. [Google Scholar] [CrossRef]
  9. Batty, M. Accessibility: In Search of a Unified Theory. Environ. Plan. B Plan. Plan. Des. 2009, 36, 191–194. [Google Scholar] [CrossRef]
  10. Webster, C. Pricing Accessibility: Urban Morphology, Design and Missing Markets. Prog. Plan. 2010, 73, 77–111. [Google Scholar] [CrossRef]
  11. Wang, M.; Chen, Z.; Mu, L.; Zhang, X. Road Network Structure and Ride-Sharing Accessibility: A Network Science Perspective. Comput. Environ. Urban Syst. 2020, 80, 101430. [Google Scholar] [CrossRef]
  12. Turner, A. From Axial to Road-Centre Lines: A New Representation for Space Syntax and a New Model of Route Choice for Transport Network Analysis. Environ. Plan. B Urban Anal. City Sci. 2007, 34, 539–555. [Google Scholar] [CrossRef]
  13. Boeing, G. OSMnx: New Methods for Acquiring, Constructing, Analyzing, and Visualizing Complex Street Networks. Comput. Environ. Urban Syst. 2017, 65, 126–139. [Google Scholar] [CrossRef]
  14. Hagberg, A.; Swart, P.; Chult, D.S. Exploring Network Structure, Dynamics, and Function Using NetworkX; Los Alamos National Lab. (LANL): Los Alamos, NM, USA, 2008.
  15. Alexander, C. “A City Is Not a Tree”: From Architectural Forum (1965). In The Urban Design Reader; Routledge: New York, NY, USA, 2013; pp. 152–166. ISBN 9781136205668. [Google Scholar]
  16. Boeing, G. Off the Grid… and Back Again?: The Recent Evolution of American Street Network Planning and Design. J. Am. Plan. Assoc. 2021, 87, 123–137. [Google Scholar] [CrossRef]
  17. Mohajeri, N.; Gudmundsson, A. Analyzing the Variation in Street Patterns: Implications for Urban Planning. J. Arch. Plan. Res. 2014, 31, 112–127. [Google Scholar]
  18. Pillsbury, R. The Urban Street Pattern as a Culture Indicator: Pennsylvania, 1682–1815. Ann. Assoc. Am. Geogr. 1970, 60, 428–446. [Google Scholar] [CrossRef]
  19. Liu, K.; Gao, S.; Lu, F. Identifying Spatial Interaction Patterns of Vehicle Movements on Urban Road Networks by Topic Modelling. Comput. Environ. Urban Syst. 2019, 74, 50–61. [Google Scholar] [CrossRef]
  20. Law, S.; Shen, Y.; Penn, A.; Karimi, K. Identifying Street-Character-Weighted Local Area Using Locally Weighted Community Detection Methods the Case Study of London and Amsterdam. In Proceedings of the 12th International Space Syntax Symposium, SSS 2019, Beijing, China, 8–13 July 2019. [Google Scholar]
  21. Al-Hinkawi, W.S.; Youssef, S.S.; Abd, H.A. Effects of Urban Growth on Street Networks and Land Use in Mosul, Iraq: A Case Study. Civ. Eng. Archit. 2021, 9, 1667–1676. [Google Scholar] [CrossRef]
  22. Boeing, G. Planarity and Street Network Representation in Urban Form Analysis. Environ. Plan. B Urban Anal. City Sci. 2020, 47, 855–869. [Google Scholar] [CrossRef]
  23. Hajrasouliha, A.; Yin, L. The Impact of Street Network Connectivity on Pedestrian Volume. Urban Stud. J. Ltd. 2015, 52, 2483–2497. [Google Scholar] [CrossRef]
  24. Chen, W.; Wu, A.N.; Biljecki, F. Classification of Urban Morphology with Deep Learning: Application on Urban Vitality. Comput. Environ. Urban Syst. 2021, 90, 101706. [Google Scholar] [CrossRef]
  25. Wu, A.N.; Biljecki, F. InstantCITY: Synthesising Morphologically Accurate Geospatial Data for Urban Form Analysis, Transfer, and Quality Control. ISPRS J. Photogramm. Remote Sens. 2023, 195, 90–104. [Google Scholar] [CrossRef]
  26. Boeing, G. Methods and Measures for Analyzing Complex Street Networks and Urban Form. Doctor Thesis, University of California, Berkeley, CA, USA, 2017. [Google Scholar]
  27. Goerlich Gisbert, F.J.; Cantarino Martí, I.; Gielen, E. Clustering Cities through Urban Metrics Analysis. J. Urban Des. 2017, 22, 689–708. [Google Scholar] [CrossRef]
  28. Fontana, A.G.; Nascimento, V.F.; Ometto, J.P.; do Amaral, F.H.F. Analysis of Past and Future Urban Growth on a Regional Scale Using Remote Sensing and Machine Learning. Front. Remote Sens. 2023, 4, 1123254. [Google Scholar] [CrossRef]
  29. Gruber, C.J.; Schweighart, M.; Seebauer, S.; Felbermair, S. Machine Learning for Land Use Scenarios and Urban Design. In CITIES 20.50—Creating Habitats for the 3rd Millennium: Smart—Sustainable—Climate Neutral, Proceedings of the REAL CORP 2021, 26th International Conference on Urban Development, Regional Planning and Information Society, Vienna, Austria, 7–9 September 2021; Schrenk, M., Zeile, P., Eds.; CORP—Competence Center of Urban and Regional Planning: Vienna, Austria, 2021; p. 489. [Google Scholar] [CrossRef]
  30. Koutra, S.; Ioakimidis, C.S. Unveiling the Potential of Machine Learning Applications in Urban Planning Challenges. Land 2022, 12, 83. [Google Scholar] [CrossRef]
  31. Wu, C.; Smith, D.; Wang, M. Simulating the Urban Spatial Structure with Spatial Interaction: A Case Study of Urban Polycentricity under Different Scenarios. Comput. Environ. Urban Syst. 2021, 89, 101677. [Google Scholar] [CrossRef]
  32. Herold, M.; Goldstein, N.C.; Clarke, K.C. The Spatiotemporal Form of Urban Growth: Measurement, Analysis and Modeling. Remote Sens. Environ. 2003, 86, 286–302. [Google Scholar] [CrossRef]
  33. Andrews, R.B. Elements in the Urban-Fringe Pattern. J. Land Public Util. Econ. 1942, 18, 169. [Google Scholar] [CrossRef]
  34. Schirmer, P.M.; Axhausen, K.W. A Multiscale Clustering of the Urban Morphology for Use in Quantitative Models; Modeling and Simulation in Science, Engineering and Technology; Birkhäuser: Cham, Switzerland, 2019; pp. 355–382. [Google Scholar] [CrossRef]
  35. Wang, J.; Fleischmann, M.; Venerandi, A.; Romice, O.; Kuffer, M.; Porta, S. EO + Morphometrics: Understanding Cities through Urban Morphology at Large Scale. Landsc. Urban Plan. 2023, 233, 104691. [Google Scholar] [CrossRef]
  36. Wu, C.; Wang, J.; Wang, M.; Kraak, M.-J. Machine Learning-Based Characterisation of Urban Morphology with the Street Pattern. Comput. Environ. Urban Syst. 2024, 109, 102078. [Google Scholar] [CrossRef]
  37. Chen, C.-Y.; Koch, F.; Reicher, C. Developing a Two-Level Machine-Learning Approach for Classifying Urban Form for an East Asian Mega-City. Environ. Plan. B Urban Anal. City Sci. 2023, 51, 1–16. [Google Scholar] [CrossRef]
  38. Yue, H.; Zhu, X. Exploring the Relationship between Urban Vitality and Street Centrality Based on Social Network Review Data in Wuhan, China. Sustainability 2019, 11, 4356. [Google Scholar] [CrossRef]
  39. Sheng, Q.; Jiao, J.; Pang, T. Understanding the Impact of Street Patterns on Pedestrian Distribution: A Case Study in Tianjin, China. Urban Rail Transit. 2021, 7, 209–225. [Google Scholar] [CrossRef]
  40. Wong, D.W.S. The Modifiable Areal Unit Problem (MAUP). In WorldMinds: Geographical Perspectives on 100 Problems; Springer: Dordrecht, The Netherlands, 2004; pp. 571–575. [Google Scholar] [CrossRef]
  41. Kwan, M.-P. The Uncertain Geographic Context Problem. Ann. Assoc. Am. Geogr. 2012, 102, 958–968. [Google Scholar] [CrossRef]
  42. Chen, W.; Huang, H.; Liao, S.; Gao, F.; Biljecki, F. Global Urban Road Network Patterns: Unveiling Multiscale Planning Paradigms of 144 Cities with a Novel Deep Learning Approach. Landsc. Urban Plan. 2024, 241, 104901. [Google Scholar] [CrossRef]
  43. Shinde, P.P.; Shah, S. A Review of Machine Learning and Deep Learning Applications. In Proceedings of the 2018 4th International Conference on Computing, Communication Control and Automation, ICCUBEA 2018, Pune, India, 16–18 August 2018. [Google Scholar] [CrossRef]
  44. Janiesch, C.; Zschech, P.; Heinrich, K. Machine Learning and Deep Learning. Electron. Mark. 2021, 31, 685–695. [Google Scholar] [CrossRef]
  45. Ma, J.; Cheng, J.C.P.; Jiang, F.; Chen, W.; Zhang, J. Analyzing Driving Factors of Land Values in Urban Scale Based on Big Data and Non-Linear Machine Learning Techniques. Land Use Policy 2020, 94, 104537. [Google Scholar] [CrossRef]
  46. Bordogna, G.; Fugazza, C.; Cetin, Z.; Yastikli, N. The Use of Machine Learning Algorithms in Urban Tree Species Classification. ISPRS Int. J. Geo-Inf. 2022, 11, 226. [Google Scholar] [CrossRef]
  47. Kim, D.; Shim, J.; Park, J.; Cho, J.; Kumar, S. Supervised Machine Learning Approaches to Modeling Residential Infill Development in the City of Los Angeles. J. Urban Plan. Dev. 2022, 148, 04021060. [Google Scholar] [CrossRef]
  48. Samaniego, L.; Schulz, K. Supervised Classification of Agricultural Land Cover Using a Modified K-NN Technique (MNN) and Landsat Remote Sensing Imagery. Remote Sens. 2009, 1, 875–895. [Google Scholar] [CrossRef]
  49. Longley, P.A.; Tobón, C. Spatial Dependence and Heterogeneity in Patterns of Hardship: An Intra-Urban Analysis. Ann. Assoc. Am. Geogr. 2004, 94, 503–519. [Google Scholar] [CrossRef]
  50. Park, Y.S.; Lek, S. Artificial Neural Networks: Multilayer Perceptron for Ecological Modeling. Dev. Environ. Model. 2016, 28, 123–140. [Google Scholar] [CrossRef]
  51. Pedregosa, F.; Varoquaux, G.; Gramfort, A.; Michel, V.; Grisel, O.; Blondel, M.; Prettenhofer, P.; Weiss, R.; Vanderplas, J.; Cournapeau, D.; et al. Scikit-Learn: Machine Learning in Python. J. Mach. Learn. Res. 2011, 12, 2825–2830. [Google Scholar]
  52. Chen, T.; Guestrin, C. XGBoost: A Scalable Tree Boosting System. In Proceedings of the ACM SIGKDD International Conference on Knowledge Discovery and Data Mining 2016, San Francisco, CA, USA, 13–17 August 2016; pp. 785–794. [Google Scholar] [CrossRef]
  53. Hengl, T.; Miller, M.A.E.; Križan, J.; Shepherd, K.D.; Sila, A.; Kilibarda, M.; Antonijević, O.; Glušica, L.; Dobermann, A.; Haefele, S.M.; et al. African Soil Properties and Nutrients Mapped at 30 m Spatial Resolution Using Two-Scale Ensemble Machine Learning. Sci. Rep. 2021, 11, 6130. [Google Scholar] [CrossRef] [PubMed]
  54. Wang, Y.; Khodadadzadeh, M.; Zurita-Milla, R. Spatial+: A New Cross-Validation Method to Evaluate Geospatial Machine Learning Models. Int. J. Appl. Earth Obs. Geoinf. 2023, 121, 103364. [Google Scholar] [CrossRef]
  55. Batty, M. Unpredictability. Environ. Plan. B Urban Anal. City Sci. 2020, 47, 739–744. [Google Scholar] [CrossRef]
  56. Batty, M. Defining Complexity in Cities; Springer: Cham, Switzerland, 2020; pp. 13–26. [Google Scholar] [CrossRef]
  57. Meijers, E. Measuring Polycentricity and Its Promises. Eur. Plan. Stud. 2008, 16, 1313–1323. [Google Scholar] [CrossRef]
  58. Kwan, M.-P. How GIS Can Help Address the Uncertain Geographic Context Problem in Social Science Research. Ann. GIS 2012, 18, 245–255. [Google Scholar] [CrossRef]
Figure 1. Methodology flowchart.
Ijgi 13 00114 g001
Figure 2. Example of different units of analysis division (in red line) of the street network in Chengdu.
Ijgi 13 00114 g002
Figure 3. The mapping of street patterns in the six case study cities.
Ijgi 13 00114 g003
Table 1. List of metrics [36].
MetricDefinitionValue Remark
CompositionStreet LengthCalculate the graph’s average edge length.In metres
DiameterIt is the shortest distance between the two most distant nodes in the network.In metres
A higher value implies slower movement through the network.
CircuityCircuity is the sum of edge lengths divided by the sum of straight-line distances between edge endpoints.1 to ½ π
A higher value implies the street is more circular.
Orientation EntropyOrientation entropy is the entropy of its edges’ bidirectional bearings across evenly spaced bins.1.386 to 3.584
A higher value implies the streets are more ordered.
Configurationk_avggraph’s average node degree (in-degree and out-degree)A higher value implies better connectivity with more route choices.
Self-loopCalculate the percentage of edges that are self-loops in a graph. 0 to 1
L-junctionThe proportion of nodes with two streets connected.0 to 1
T-junctionThe proportion of nodes with three streets connected.0 to 1
X-junctionThe proportion of nodes with four streets connected.0 to 1
ExplanatoryDegree PearsonCompute the degree assortativity, the similarity of connections in the graph concerning the node degree, which means the number of streets connected to a street junction.−1 to 1
A higher value implies that the streets are more ordered.
TransitivityThe ratio between the observed number of triangles and the number of closed triplets in the graph.0 to 1
A higher value implies that the network contains internal communities.
Global reaching centralityThe global reaching centrality of a weighted directed graph is the average over all nodes of the difference between the local reaching centrality of the node and the greatest local reaching centrality of any node in the graph. 0 to 1
A higher value means the network shows a more hierarchical structure.
Global EfficiencyThe average efficiency of all pairs of nodes in a graph is the average multiplicative inverse of the shortest path distance between the nodes.0 to 1
A higher value means the network shows better accessibility.
Table 2. Performances of the five ML approaches.
KNNMLPSVMXGBoostRF
Accuracy_weighted0.350.400.410.540.56
Precision_weighted0.340.280.300.560.57
Recall_weighted0.350.390.410.540.54
F1_weighted0.340.300.270.520.54
AUC0.540.630.540.750.78
Table 3. Feature importance.
circuity_avg0.132234
k_avg0.070243
diameter0.048768
edge_length_avg0.092476
streets_per_node_proportions_20.051252
streets_per_node_proportions_30.074068
streets_per_node_proportions_40.118955
self_loop_proportion0.046852
degree_pearson0.090698
orientation_entropy0.074808
transitivity0.047868
average_clustering0.047775
global_reaching_centrality0.052981
global_efficiency0.051022
Table 4. The average value for the top 5 features.
GridironOrganicHybridCul-De-Sac
Circuity1.0231.0711.0631.098
X-junction (%)38.413.518.812.0
Street Length (m)119.382.8115.5131.7
Degree Pearson0.3430.1040.1600.047
Orientation Entropy2.8033.3493.1323.265
Disclaimer/Publisher’s Note: The statements, opinions and data contained in all publications are solely those of the individual author(s) and contributor(s) and not of MDPI and/or the editor(s). MDPI and/or the editor(s) disclaim responsibility for any injury to people or property resulting from any ideas, methods, instructions or products referred to in the content.

