Review

Framing VRRSability Relationships among Vulnerability, Risk, Resilience, and Sustainability for Improving Geo-Information Evaluations within Geodesign Decision Support

by
Timothy Nyerges
1,*,
John A. Gallo
2,
Keith M. Reynolds
3,
Steven D. Prager
4,
Philip J. Murphy
5 and
Wenwen Li
6
1
Department of Geography, University of Washington, Seattle, WA 98195, USA
2
Conservation Biology Institute, Corvallis, OR 97333, USA
3
US Department of Agriculture, Forest Service Research, Corvallis, OR 97331, USA
4
Bill & Melinda Gates Foundation, Seattle, WA 98109, USA
5
Info Harvest, Inc., Seattle, WA 98165, USA
6
School of Geographical Science and Urban Planning, Arizona State University, Tempe, AZ 85287, USA
*
Author to whom correspondence should be addressed.
ISPRS Int. J. Geo-Inf. 2024, 13(3), 67; https://doi.org/10.3390/ijgi13030067
Submission received: 24 December 2023 / Revised: 6 February 2024 / Accepted: 16 February 2024 / Published: 23 February 2024

Abstract

:
Improving geo-information decision evaluation is an important part of geospatial decision support research, particularly when considering vulnerability, risk, resilience, and sustainability (V-R-R-S) of urban land–water systems (ULWSs). Previous research enumerated a collection of V-R-R-S conceptual component commonalties and differences resulting in a synthesis concept called VRRSability. As a single concept, VRRSability enhances our understanding of the relationships within and among V-R-R-S. This paper reports research that extends and deepens the VRRSability synthesis by elucidating relationships among the V-R-R-S concepts, and organizes them into a VRRSability conceptual framework meant to guide operationalization within decision support systems. The core relationship within the VRRSability framework is ‘functional performance’, which couples land and water concerns within complex ULWS. Using functional performance, we elucidate other significant conceptual relationships, e.g., scale, scenarios and social knowledge, among others. A narrative about the functional performance of green stormwater infrastructure as part of a ULWS offers a practical application of the conceptual framework. VRRSability decision evaluation trade-offs among land and water emerge through the narrative, particularly how land cover influences water flow, which in turn influences water quality. The discussion includes trade-offs along risk–resilience and vulnerability–sustainability dimensions as key aspects of functional performance. Conclusions include knowledge contributions about a VRRSability conceptual framework and the next steps for operationalization within decision support systems using artificial intelligence.

1. Introduction

An enhanced understanding of the trade-offs among decision evaluation objectives continues to motivate researchers and practitioners for improving geospatial decision support applications [1], particularly geodesign decision support for complex ‘sustainable systems’ evaluation [2]. The term ‘sustainable’ acts as a descriptor for many complex systems because of an interest in the ‘longevity of health and well-being’ of such systems. Decision support software applications encode our basic understanding of what we know about making decisions within programming languages and databases [1], whether for entire systems and/or portions thereof. Developing comprehensive frameworks is one way to contextualize complex system issues as a step toward practical implementation of applications, moving from data into information and onto knowledge-based applications, e.g., in the form of knowledge graphs representing open knowledge networks implemented using artificial general intelligence agents designed to help humans facilitate inter-organizational collaboration on decision support [3] about VRRSability decision trade-offs.
As part of the initial research about the fundamentals of sustainable systems, a framework called measurement-informed ontology and epistemology for sustainability information representation (MOESIR) was developed to clarify the steps for framing the development of spatial decision support systems [4]. Related research used a geodesign approach to decision support for examining green infrastructure development as a part of complex urban–land water systems (ULWS), concluding that we need more insight in addition to the vulnerability of systems to inform complex system decision evaluation [2,5]. Addressing that concern, other research identified vulnerability, risk, resilience, and sustainability (V-R-R-S) as four concepts commonly used in participatory decision support for sustainable systems [6]. We demonstrated that none of the four V-R-R-S concepts can replace one another when evaluating sustainable systems. Furthermore, VRRSability was identified as an overarching concept that synthesizes among V-R-R-S concepts and their associated components, providing an opportunity to facilitate decision trade-offs [6]. However, that research stopped short of elucidating conceptual relationships, which is a necessary next step for developing operational models.
The research effort reported herein represents a fourth effort in the series for extending and deepening collaborative decision support systems. The overall goal of this research is to broaden and deepen geospatial decision research that eventually implements a comprehensive yet flexible approach to decision evaluation within a geodesign decision support system. The objectives to reach that goal include the following: (1) complete a conceptual synthesis of VRRSability useful for decision evaluation, (2) specify constructs and their relationships within operational models based on the conceptual synthesis; (3) implement the operational models using geospatial technologies, making it clear that the synthesis precedes operational models that precede software technology implementation, e.g., within geospatial decision support systems, geographic information systems (GIS), and/or remote sensing. As such, the main objective of this paper is to report on the completion of the conceptual synthesis (at least to some extent) resulting in knowledge contributions within three focus areas. First, knowledge resulting from VRRSability synthesis flesh out MOESIR Tier 2 ontology and MOESIR Tier 4 epistemology for contributing to the focus area of geospatial ontology and epistemology. Second, the VRRSability conceptual framework composed of components and relations provides a solid foundation (in both breadth and depth) for the next step in operationalizing models characterizing decision evaluation trade-offs contributing to the focus area of geodesign assessment. Third, preliminary knowledge about the operationalization of VRRSability models using a VRRSability intelligence ramp of data, information, evidence, knowledge and wisdom contributes to the emerging focus area of artificial intelligence technology development.
Further formalization of concepts and relationships through the development of a comprehensive conceptual framework, consisting of conceptual components and relations among them, can guide the operationalization of decision evaluation trade-offs for improving software-enabled intelligence about the health and well-being of sustainable systems. The development of a comprehensive conceptual framework further details the synthesis across V-R-R-S, enabling articulation of VRRSability relationships as a basis for the examination of decision evaluation trade-offs. Identifying a core relationship between a stressor and receptor in terms of functional performance provides a basis for elucidating nuances among the V-R-R-S concepts and associated components of VRRSability. Application of the conceptual framework to green stormwater infrastructure (GSI) offers further insights into GSI functional performance as a key issue for improving decision evaluation at watershed and regional scales. Measuring the functional performance of low-impact development as an example of GSI can provide important insights into investments in, and implementation of, stormwater management options for addressing concerns about climate change within urban watershed environments [7]. GSI redevelopments, i.e., removing contaminants from fresh and estuarine waters plus the control of flooding through natural means, are of high interest world-wide for improving the sustainability of health and well-being within ULWS, particularly along coastal areas [5]. Micro-, meso-, and macro-scale insights are needed when considering reductions in vulnerability, risk mitigation, improving the resiliency of response, and enhancing the sustainability of well-being for both humans and the environment within urban–regional watersheds.
Moving toward the operationalization of VRRSability, a functional performance relationship between land and water offers a basis for characterizing how insights about data representations as measurements can lead to improved information representations as relationships among measurements. Formalizing information representations provides a basis for evidence representation, and evidence representations offer a basis for knowledge representations that can enhance decision support research that aligns with geospatial artificial intelligence (GeoAI) research [8]. A common long-held assumption is that improving data, information, evidence, knowledge, and wisdom-based representations as an ‘intelligence ramp’ will likely improve the characterization of complex system relationships, and therefore improve geodesign decision support applications [4]. We suggest that GeoAI research can be the next step to enhancing the development of a human–machine intelligence ramp for geodesign decision support. The next steps for developing a VRRSability intelligence ramp as a novel contribution to decision evaluation can take advantage of the three pillars of GeoAI technology, i.e., high-performance computing, machine learning, and geospatial big data [8]. Each of the three pillars will add a unique benefit to operational modeling as part of the next steps for VRRSability operationalization.
For example, research about cyberinfrastructure-based geographic information systems (CyberGIS) [9], which involves high-performance computing and geospatial big data, partially motivated the creation of the MOESIR framework to organize issues about complex systems decision problems [4]. Technology perspectives from GeoAI will help extend developments for geodesign assessment, implementing VRRSability intelligence within decision evaluation as a key step within geodesign assessment of complex human–natural system problems.
Conceptual frameworks about social–ecological (human–environment) systems assist with obtaining insight into the development of hypotheses and operational models [10,11]. As such, a VRRSability conceptual framework can organize relationships to improve our understanding of VRRSability and enhance prospects for specifying trade-offs among V-R-R-S decision objectives for improving spatial–temporal decision evaluation, particularly for improving decision support for participatory geodesign for ULWS [12,13]. To contextualize this synthesis research effort, we continue with an application of geodesign decision support for managing an ULWS, particularly low-impact development as part of GSI influences on water resource health as a sustainable system [2,4]. Functional performance of low-impact development is the ability of system elements in combination (e.g., for green infrastructure and water) to affect levels of service that foster well-being [7]. Focusing on functional performance relationships within systems enables people to examine various behaviors of complex systems, including those described in terms of any one of the V-R-R-S concepts, but particularly those in combination using VRRSability decision objectives. Functional performance emerges from multiple interacting factors, with some of them controlling variables (stressors) and others deemed variables reflecting change (often thought of as receptors) [14]. The behaviors of these factors are at play in physical, social, and social–physical systems, whether we refer to such systems as coupled natural–human systems, social–ecological systems, human–environment systems, hazard–receptor systems or nature–society systems, all of which take on some form of a sustainable system over the long-term [4].
In a geodesign workflow, intelligence insight is built by using an information gain and abstraction strategy by traversing six steps of modeling, often using model iteration. In brief, geodesign decision support involves three steps of assessment and three steps of intervention [13], wherein assessment results inform intervention strategies. A geodesign assessment workflow consists of representation, process, and evaluation modeling; assessment is a process that results in characterizing conditions of a problem from which appropriate solution options can be designed. A geodesign intervention workflow consists of design, impact, and choice modeling, in which intervention is a process that results in a choice for action. The research question calls out the geodesign assessment step involving evaluation modeling because evaluation results are the key input to a geodesign intervention workflow, and the basis of impact modeling.
The geodesign model (i.e., information) embedding strategy, referred to as information gain with information abstraction, was adopted for use in the MOESIR framework. As such, Tier 1 information about elements of a system is embedded within Tier 2 V-R-R-S evaluative information; consequently, Tier 2 layer extends the information of Tier 1 with an evaluative context. Tier 2 evaluative information is embedded within Tier 3 workflow information, wherein Tier 3 extends Tier 2 with how-to-measure information and work with evaluative information. Tier 3 decision support workflow information is embedded within Tier 4 application implementation information, i.e., how to compute evaluative information about GSI. This research clarifies Tier 2 VRRSability evaluative information, thus clarifying Tier 1 system information from previous research plus Tier 3 computational workflow information supporting Tier 4 application information about GSI. All four tiers together are required for the implementation of VRRSability in geodesign decision support.
This paper is organized as follows: in Section 2, we elucidate numerous relations among research publications about V-R-R-S syntheses with the potential to further elucidate VRRSability at MOESIR Tier 2. We synthesize a VRRSability conceptual framework using the relevant concepts, components, sub-components, and relationships. In Section 3, we present an application (MOESIR Tier 4) of ULWS as a social-ecological system. This information context focuses on a chain of relationships about land cover influencing water resource health (water flow and quality) and habitat condition in Puget Sound, while adopting Tier 2 VRRSability and Tier 3 geodesign workflow considerations to frame the application. Section 4 explores VRRSability as decision evaluation trade-offs among the V-R-R-S concepts together with the details of the components, using the functional performance of green stormwater infrastructure as the application context. Section 5 presents a discussion about decision trade-offs. We conclude in Section 6 by highlighting knowledge contributions and offering directions for VRRSability operationalization, with a particular focus on GeoAI research for enhancing geodesign decision support.

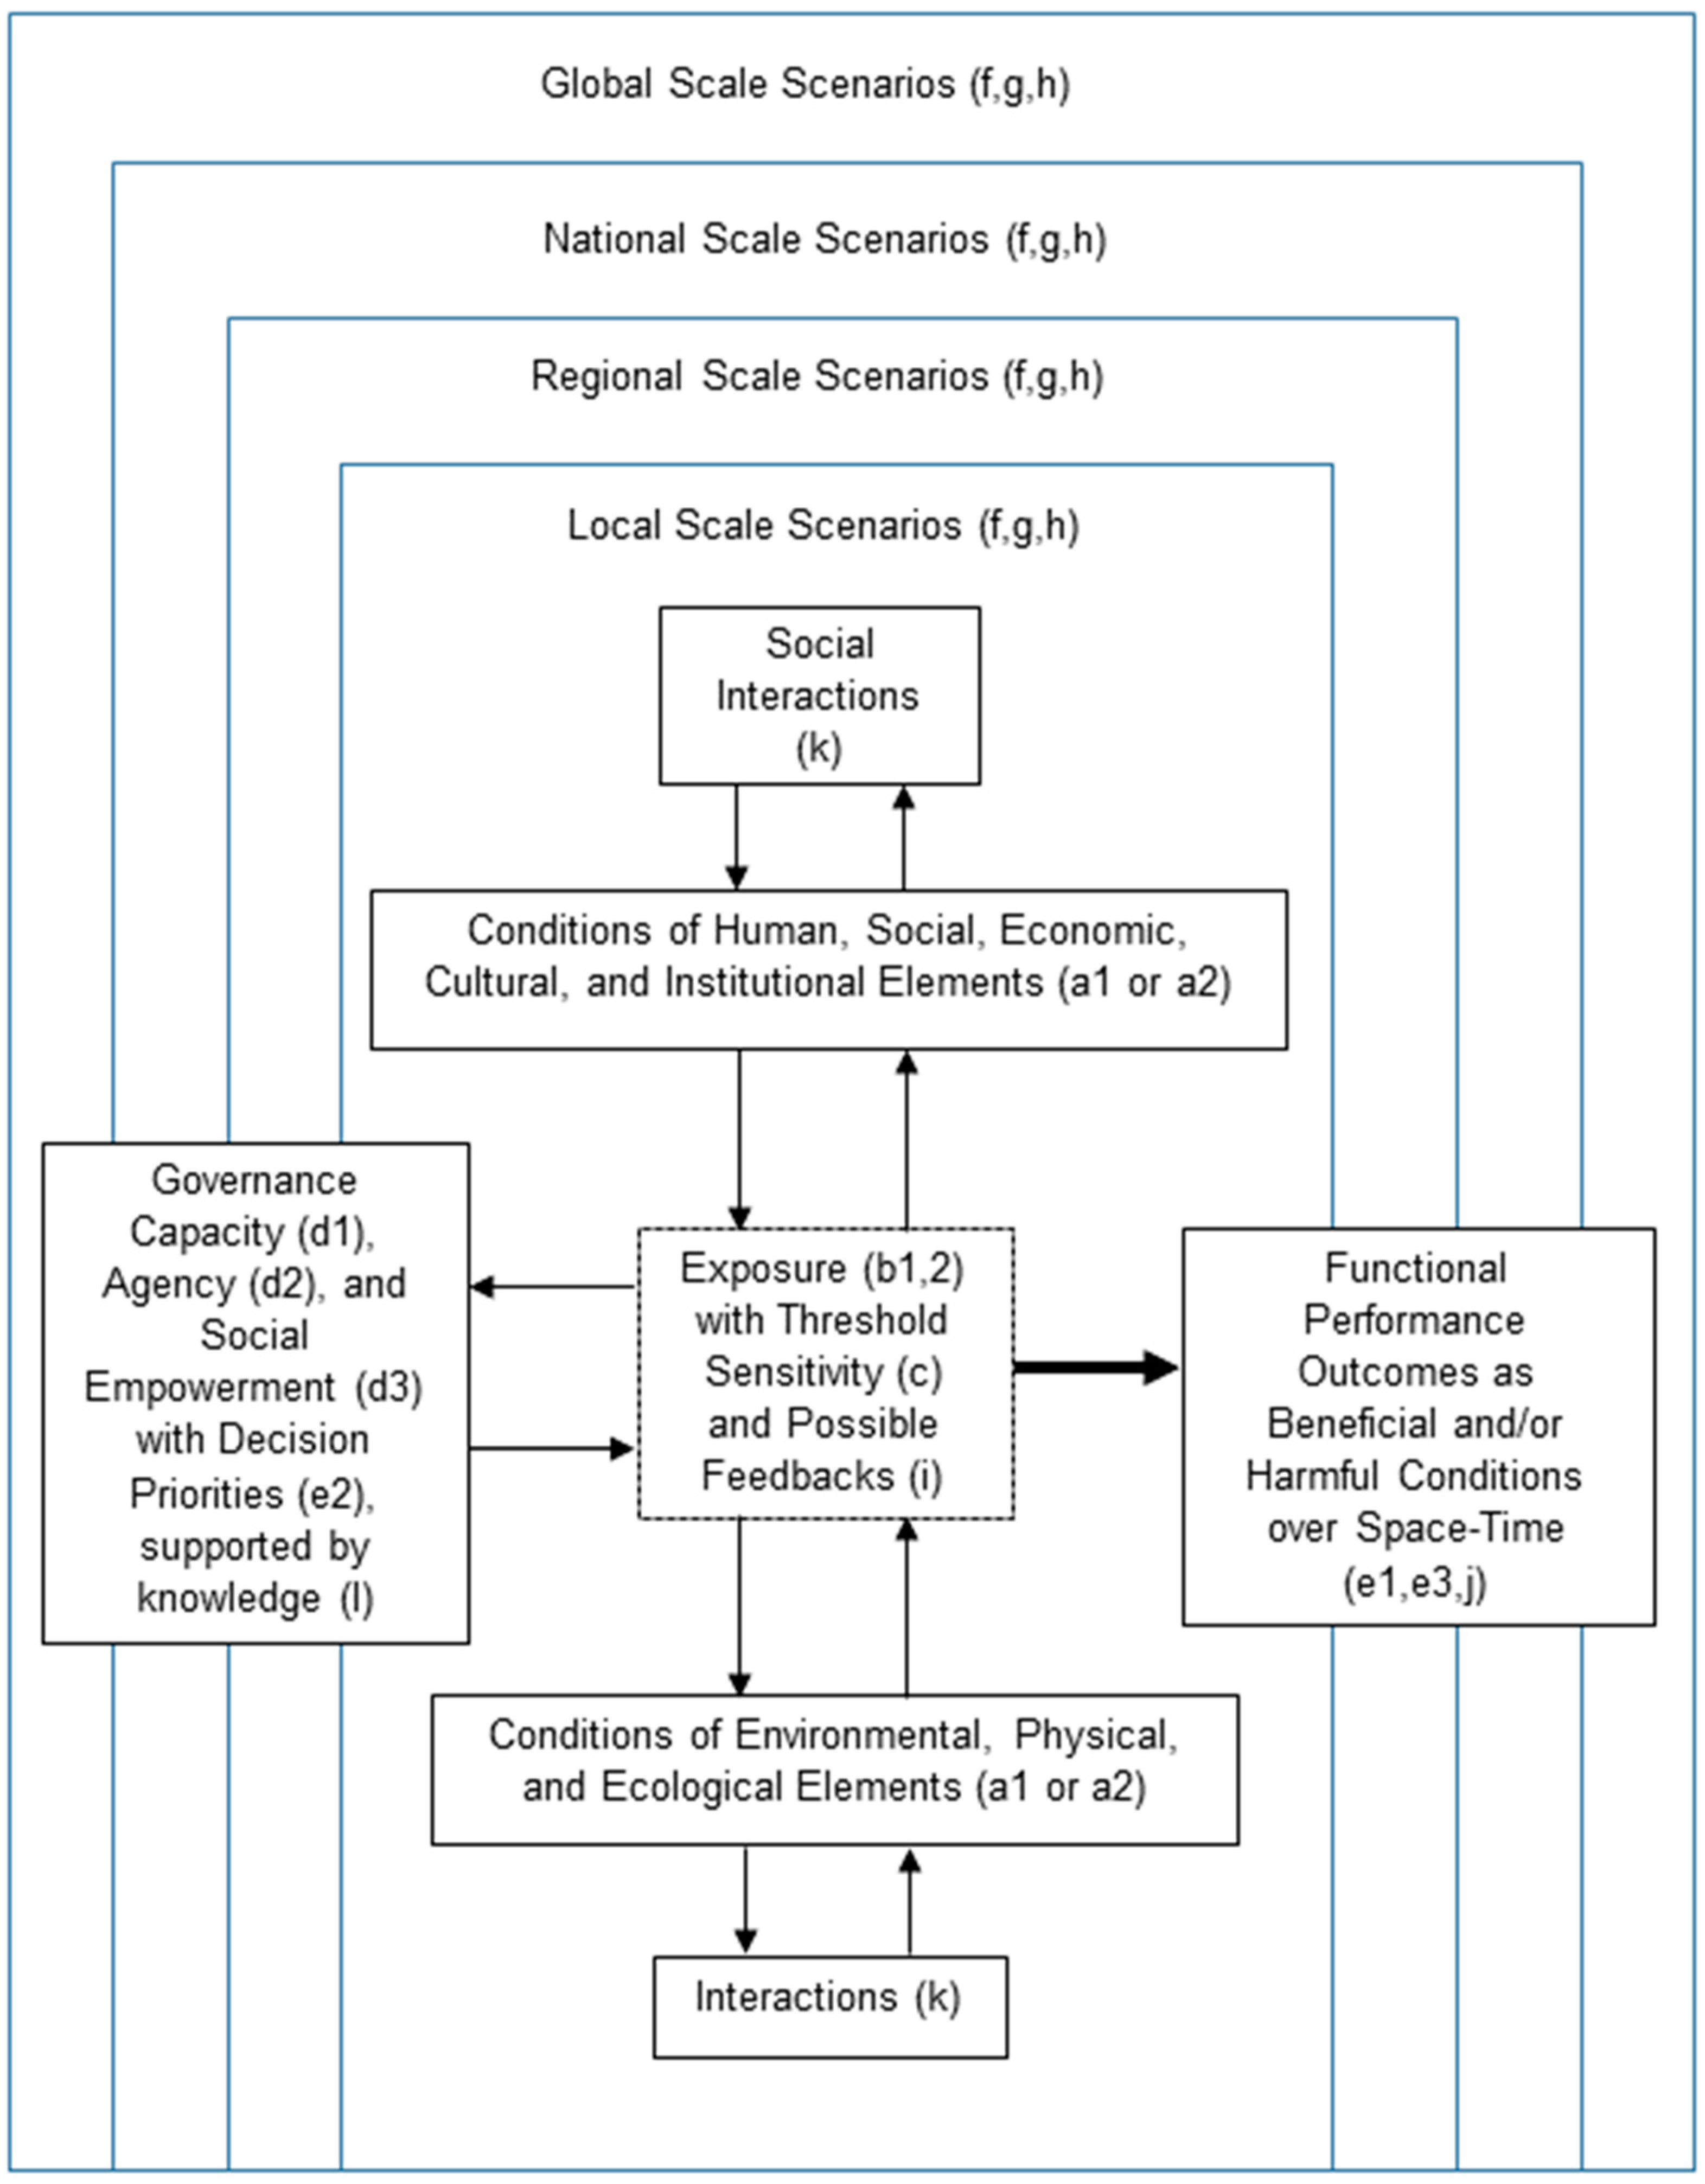
2. Geospatial Ontology for Decision Evaluation

In the MOESIR framework, Tier 2 evaluation ontology overlays the Tier 1 descriptive ontology to characterize sustainable system well-being. The singular V-R-R-S decision evaluation concepts, synthesized into the overarching VRRSability concept, contain evaluative relationships, e.g., about sensitivity, harm, improvement, and/or longevity (respectively), which provide insight into decision evaluation trade-offs about the health and well-being of complex systems. To initiate characterization of relationships among V-R-R-S concepts, we first identify variables with units of measure for the sub-components of GSI systems. We then turn to enumerating potential relationships among V-R-R-S using a Venn diagram approach and demonstrate why table-based analytical enumeration is a superior approach. From insights into the differences between information structures, we chose to enumerate a collection of seven approaches for depicting a conceptual framework. We explain why a box–relation diagram approach is the most appropriate for our purpose. We then organize the V-R-R-S concepts into a VRRSability conceptual framework using a box–relation approach. From there, we “drill down” into the core relationship of the framework, using the concept of functional performance to further explore relationships about sensitivity, harm, improvement, and longevity of sustainable system well-being.

2.1. MOESIR Tier 2 Using VRRSability for Decision Evaluation

As mentioned earlier, previous research about decision support for complex systems identified a need for synthesis of V-R-R-S concepts that could enhance participatory evaluation of decision support trade-offs [2]. Although resilience and sustainability are the more comprehensive concepts in contrast to vulnerability and risk, none of the four concepts individually provide an overarching focus through which decision trade-offs could be managed easily. VRRSability as an overarching concept offers a way to operationalize trade-offs [6], but details about the relationships among sub-components are needed for making VRRSability operational.
Based on previous research that offered a textual narrative for each of the V-R-R-S concepts and thirteen components and published by IJGI in 2021 [6], here we list the respective components of V-R-R-S concepts as a start to the analytical operationalization of VRRSability (Table 1). Note that the terms concepts and components are intentionally different for uniquely identifying the two lists. Components are meant to ‘specialize’ concepts and subcomponents specialize components from a data modeling perspective.
At this point, we offer a brief summary of the research workflow that led to the articulation and elucidation of the thirteen components with associated subcomponents, contributing to the veracity of this particular list of components. We started with the individual V-R-R-S concepts, identifying internationally published handbooks and/or papers containing one or more of the concepts as presented in [6]. We searched for handbook sources listing two or more of the concepts, as such inclusion indicated recognition of a broader topic treatment. At least three definitions for each concept were enlisted for content analysis. Using those definitions we performed a content analysis of phrases, iterating until all definitions were parsed completely into components. We compared and contrasted the phrases to identify commonalty, enumerating a comprehensive and unique collection of five conceptual components. The components include the following: (1) elements such as stressors or receptors, (2) functional performance related to exposure between the stressors/receptors, (3) dose–response thresholds associated with functional performance, (4) management actions based on decision evaluation, and (5) functional performance outcomes such as harm or improvement of well-being. The second major step involved identifying V-R-R-S references. We used Google Scholar to retrieve reference citations based on all combinations of V-R-R-S, discovering that the order of concepts in the query mattered when retrieving references. More than 100 references were identified. We then started with the five conceptual components to identify a collection of other (one might say secondary, but important) components. A total of thirteen unique conceptual components plus seven associated sub-components were identified through multiple iterations to foster consistency of interpretation and gather corroborating evidence about the components across the published works. A complete enumeration together with all reference citations associated with each component and sub-component appears in the earlier publication [6]. One of the principal recommendations for next-step research to that list of components included identifying and elucidating concept and component relations as provided within this paper.
Each of the V-R-R-S concepts contain a collection of components from among thirteen VRRSability components (a–m) as listed in Table 1 in column 1. Nine components characterize vulnerability, ten components characterize risk, twelve components characterize resilience, and eleven components characterize sustainability (Table 1 column headings). Although thirteen components of VRRSability fully describe the concept, several sub-components are needed for operationalizing the treatment of components. Although we address the full application in Section 3, here we introduce domain specificity to describe the components (a–m) using the ULWS context focusing on GSI. The GSI domain context offers the reader information on how and why all the components a–m are important as a basis for identifying and elucidating relations among the components from a practical application perspective. As such, the entries in Table 1 columns 2–5 suggest a collection of data needs that can be useful for model operationalization once the research achieves this level of specificity. Note that the duplication of component entries among the columns highlight the commonalty of components among V-R-R-S concepts, which suggests that a core set of computations underlie the overarching concept of VRRSability as a synthesis among V-R-R-S concepts. Identifying the best elucidation of components as a variable description (in italic font) offers initial insight into how each of the V-R-R-S concepts can contribute to VRRSability synthesis (in the last column).

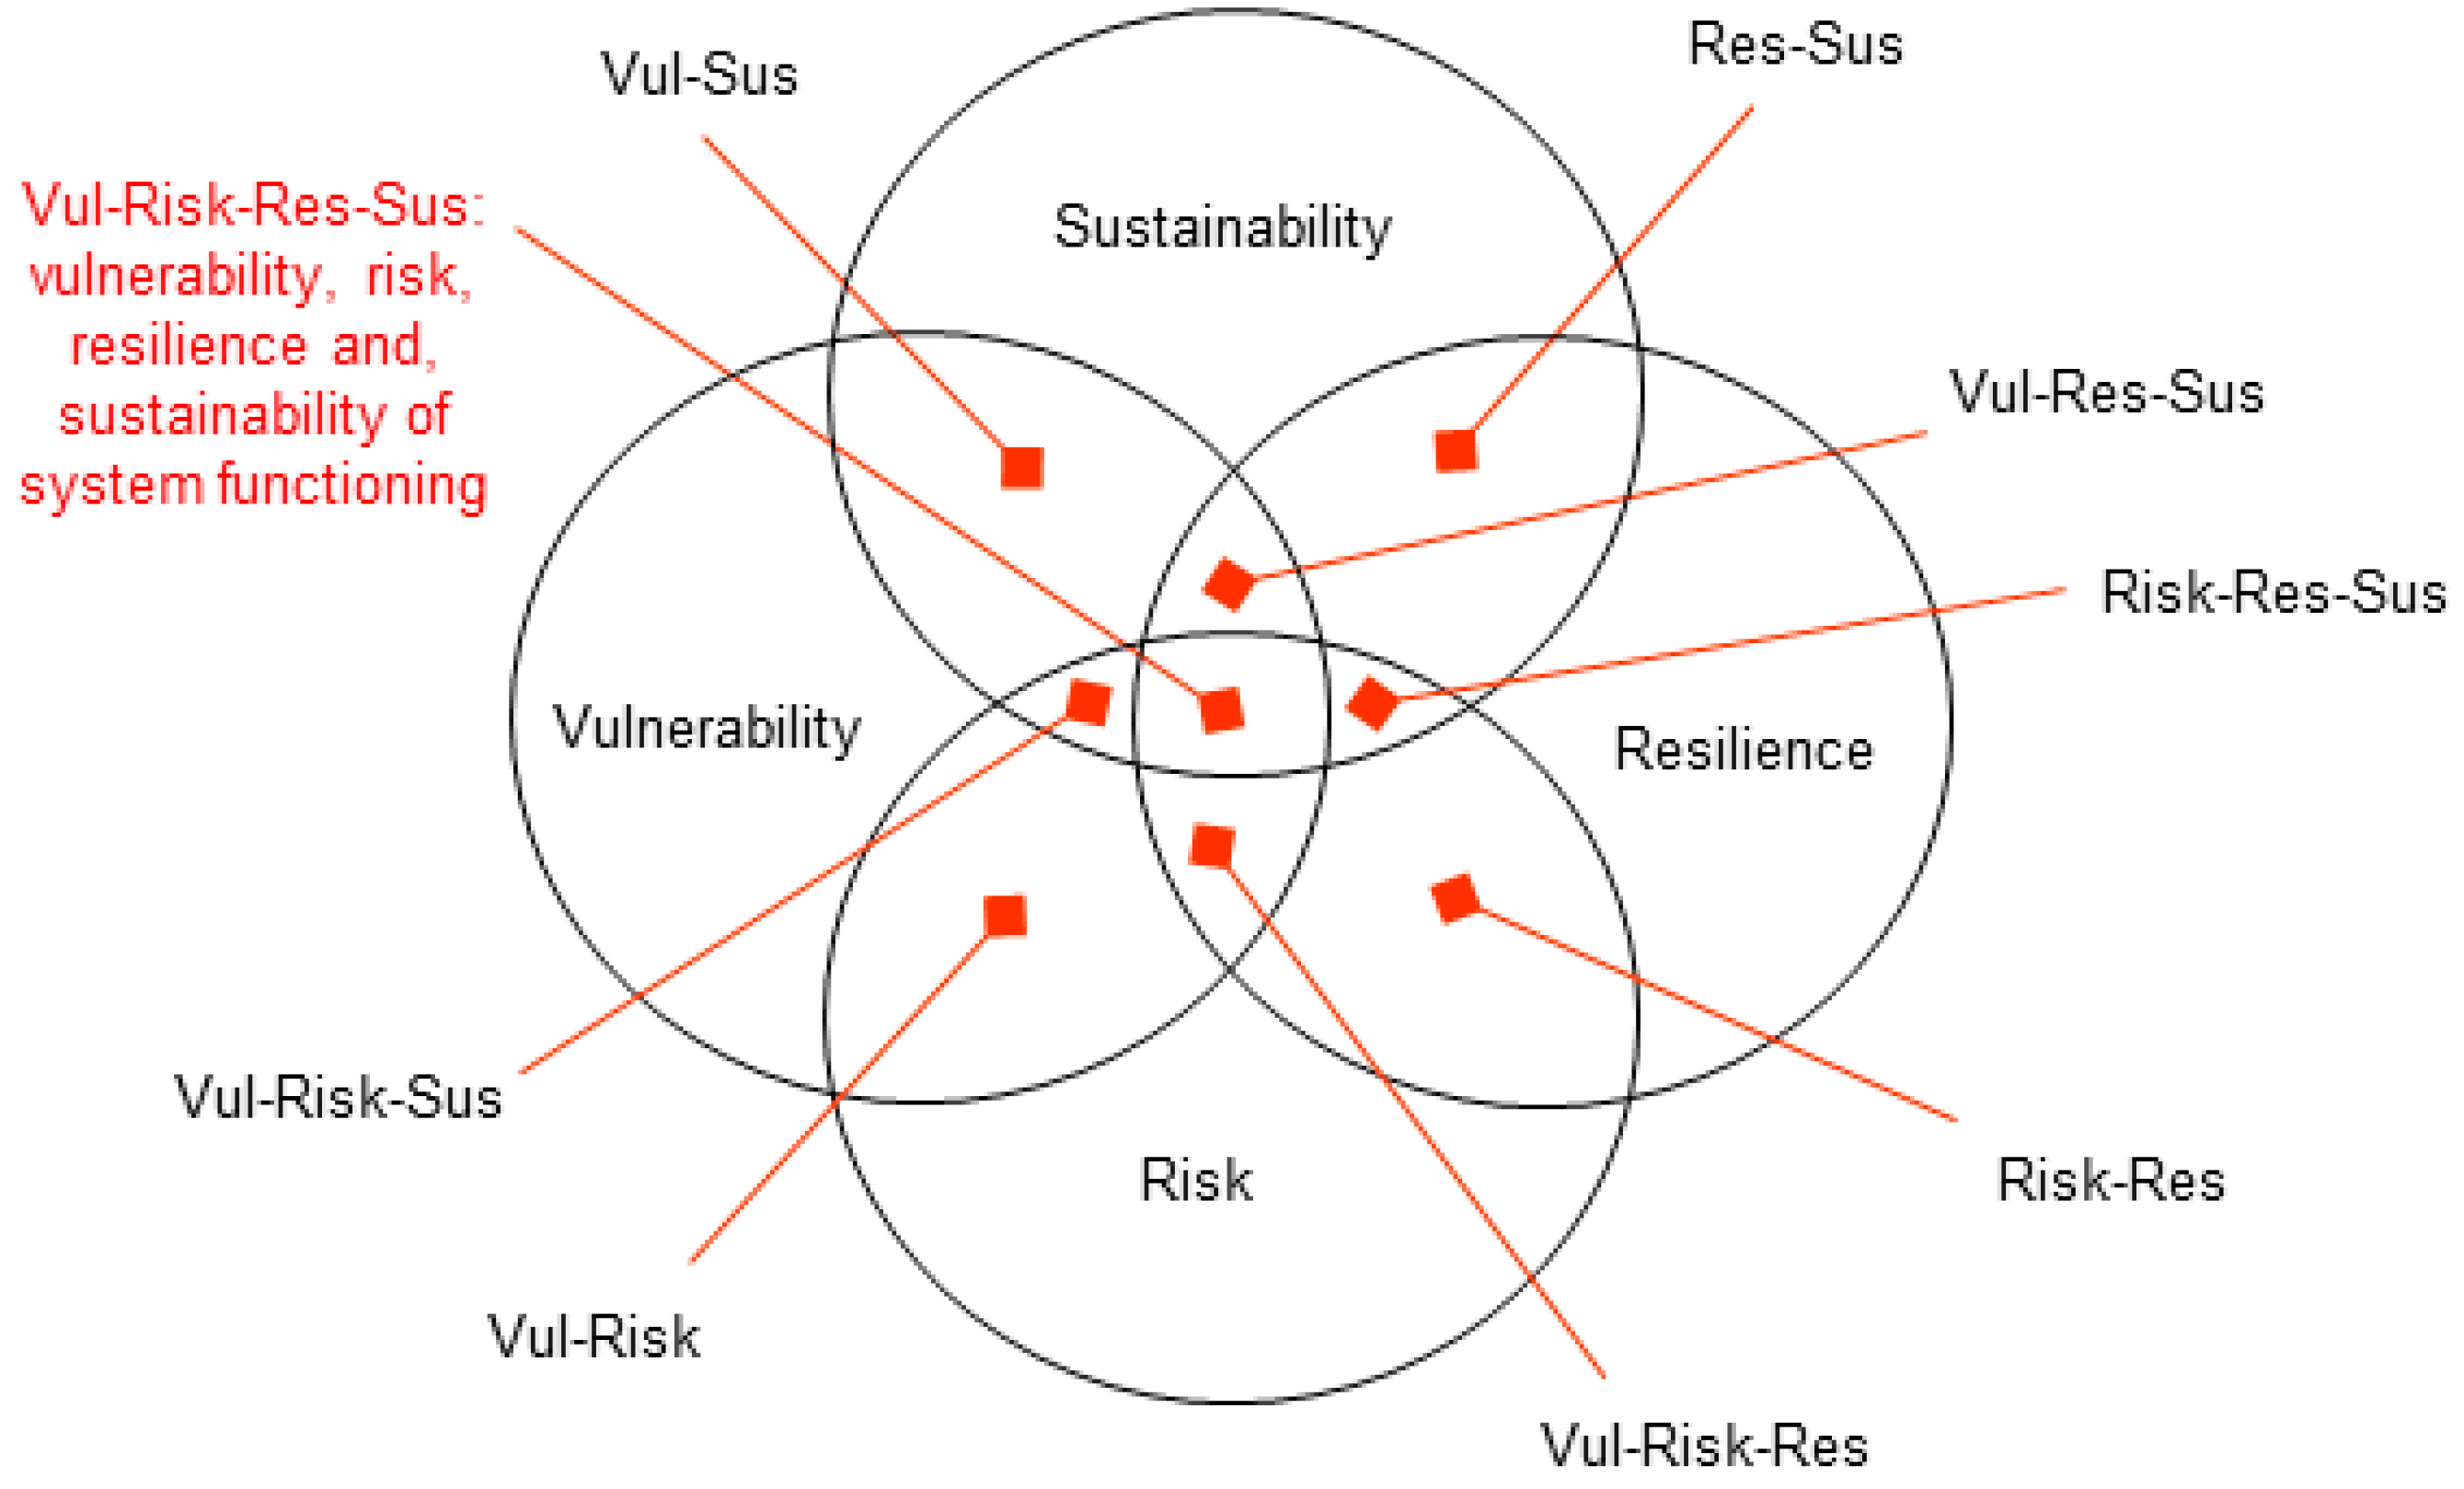
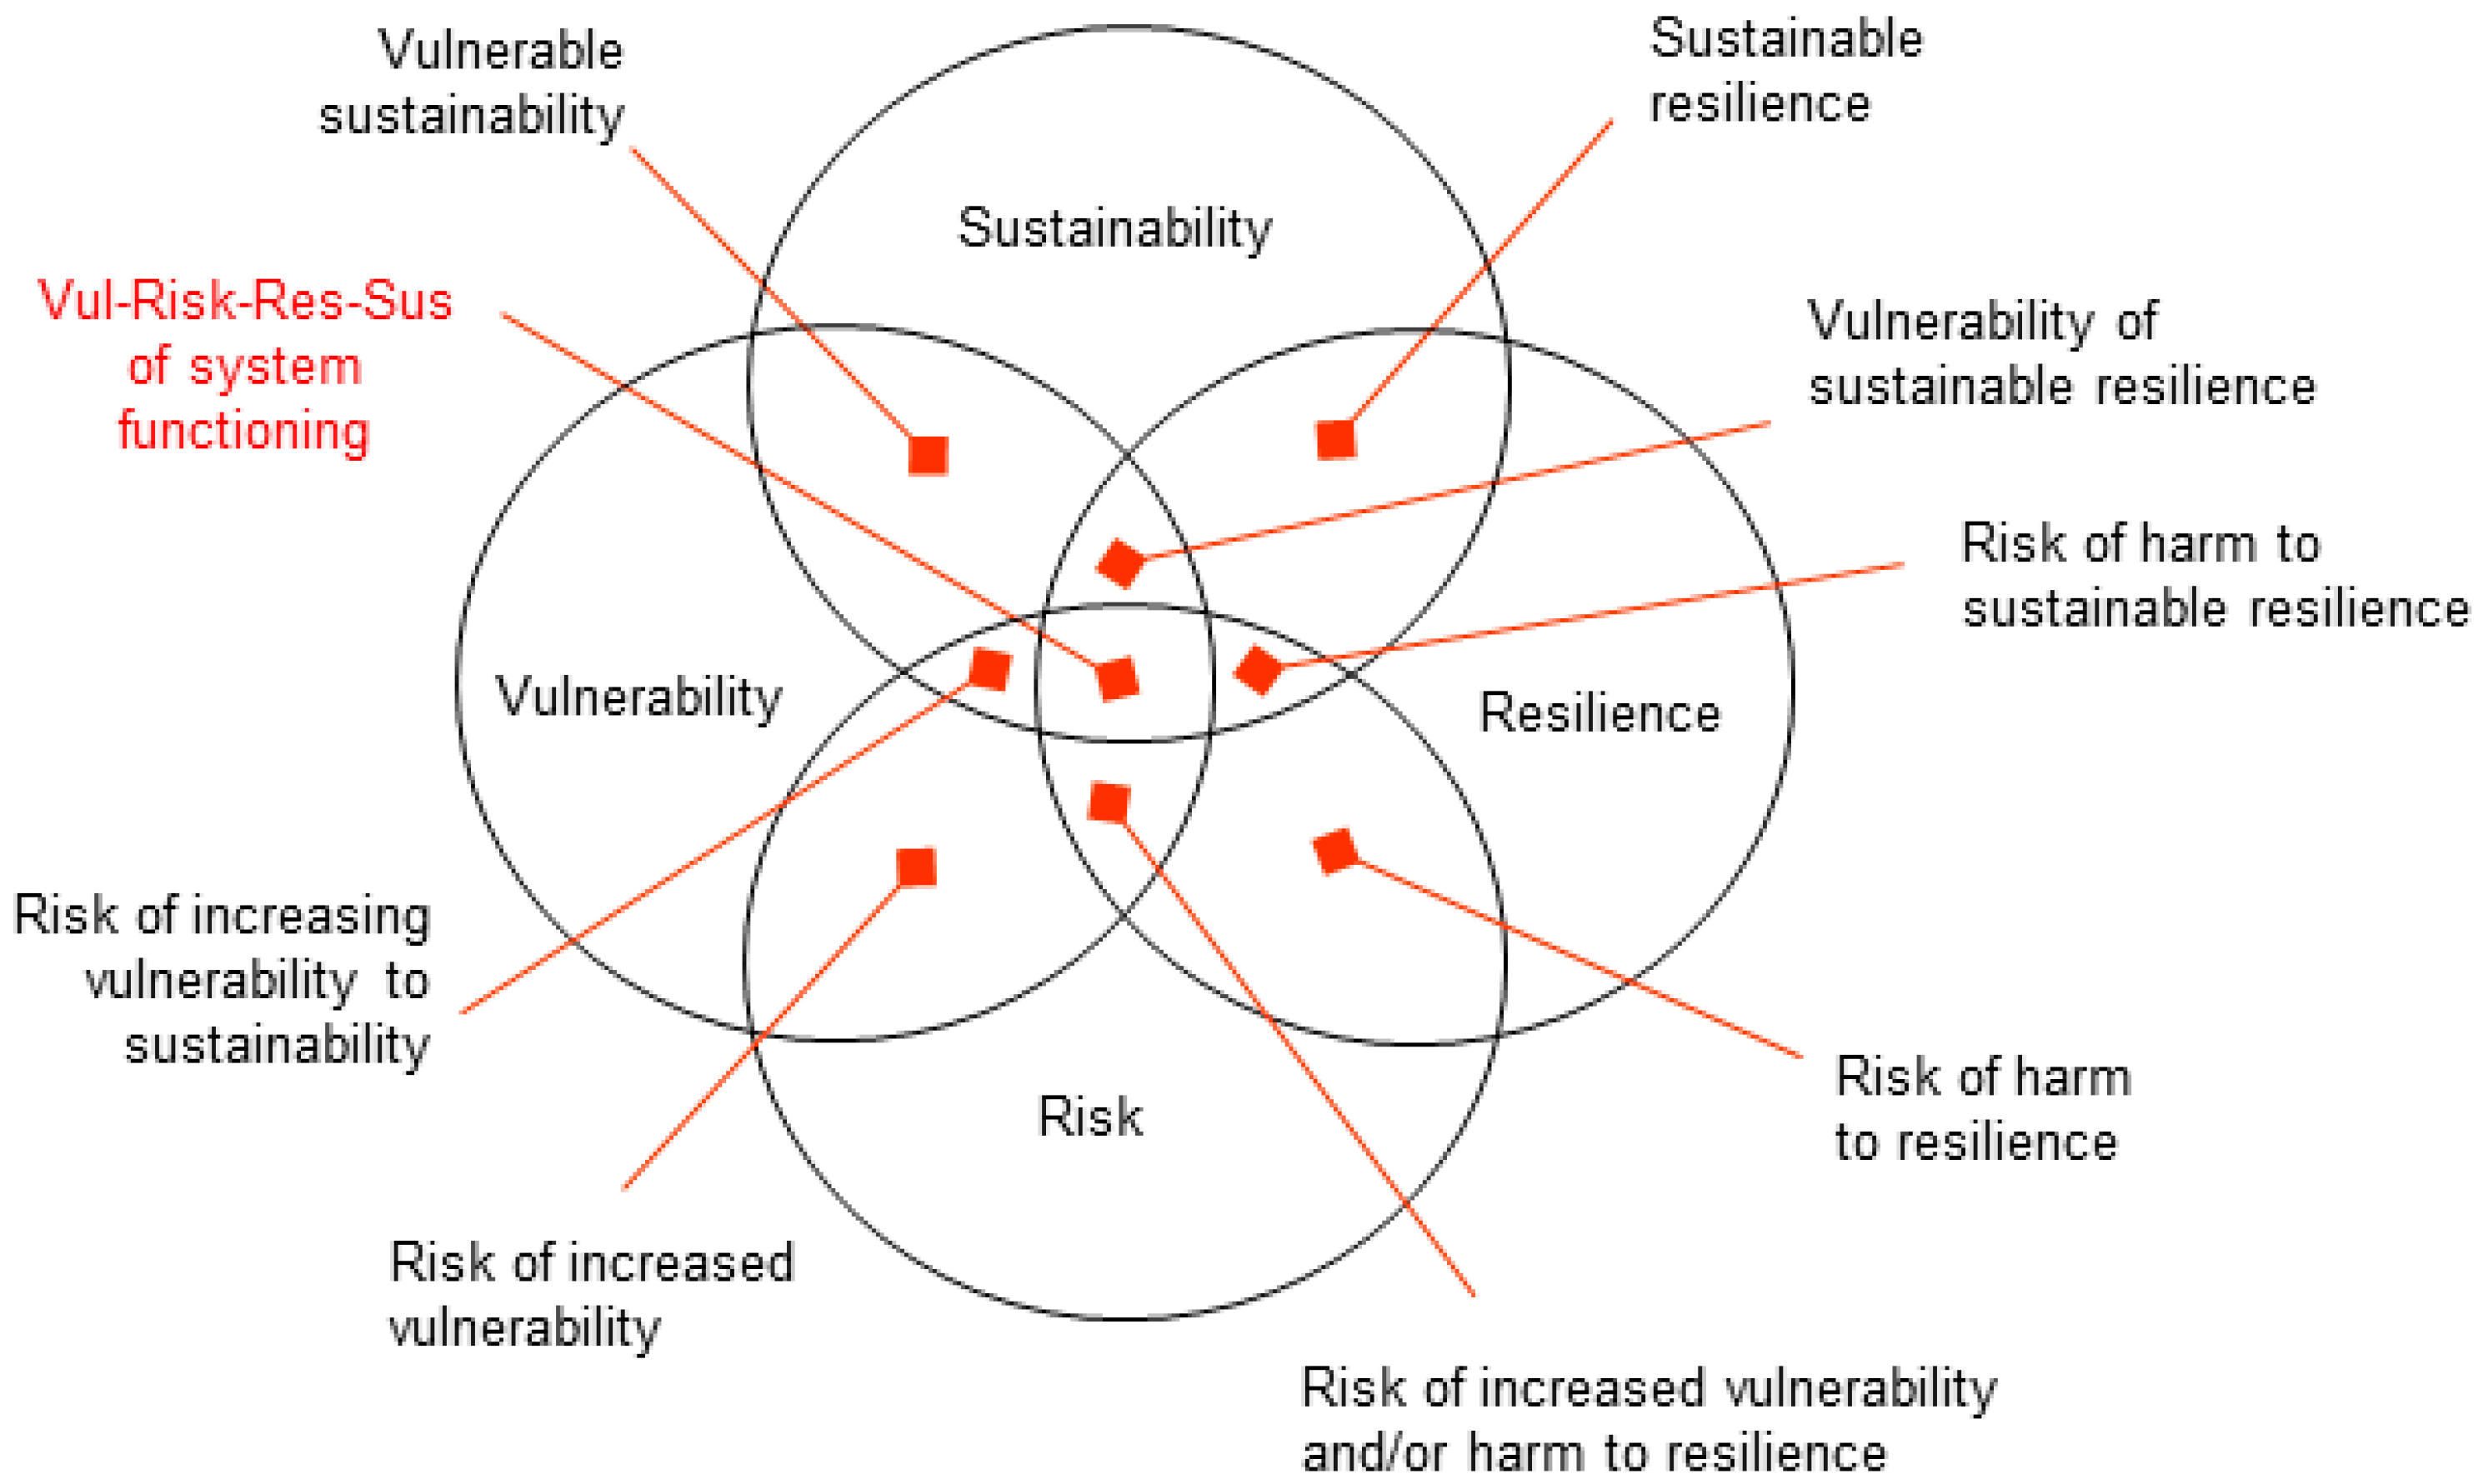
2.2. Articulating Relationships among V-R-R-S Concepts

Previous research [6] did not enumerate relationships among the four V-R-R-S concepts, let alone the thirteen components (and respective sub-components) composing VRRSability. Two levels of relationships were identified. The first are relationships among V-R-R-S, while the second are relationships among all thirteen components and respective sub-components. The V-R-R-S relationships formed from combinations of V-R-R-S concepts are more general in character than the relationships among components because the former is somewhat context-free, whereas the latter assumes a context about complex systems. However, both levels contribute to a comprehensive conceptual framework of VRRSability, and each offers insight for making VRRSability operational. While all the V-R-R-S concepts are important to consider, just how each is related to another presents a challenge, and how each of the thirteen components (and sub-components) relate to one another adds further complexity. This section about enumerating and elucidating concept and component relationships addresses a second clause within the research question.
A Venn diagram helps to enumerate the relations between and among the four V-R-R-S concepts and depict them for ease of understanding (Figure 1 and Figure 2). Figure 1 and Figure 2 show two ways to treat the combinations. Figure 1 depicts combinations wherein precedence order does not matter in the combinations, i.e., all the concepts are treated as nouns and as such, any ordering of the same collection of V-R-R-S would convey the same character of relationships. Figure 2 uses order to characterize relationships, wherein the ordering takes on a particular interpretation using adjectival precedence; thus, the last concept is the noun and the preceding concepts are adjectives. All combinations of adjectives should be described or the order could be misleading, at least initially. The main point of the difference in Figure 1 and Figure 2 is that they depict very different kinds of meaningful V-R-R-R concept relations. Nonetheless, after composing several versions, we discovered that a 2D Venn diagram cannot show all combinations of four concepts, no matter if the order is relevant or not. Although three circles can show all nine combinations of three concepts, four circles portraying combinations of four concepts prohibit two of the overlaps from being shown within any 2D display, no matter the configuration of the circles. The configuration in Figure 1 does not depict the sustainability–risk and vulnerability–resilience combinations. Similarly, the configuration in Figure 2 is missing the adjectival description of those two combinations. We assume that it would take a 3D diagram to show all combinations of the four concepts, for which a dynamic software application would be helpful. Nonetheless, the 2D rendition is useful for synoptic portrayal, and the enhancement to a 3D diagram is left for future research.
Recognizing the limitation of 2D Venn diagrams for our purpose, and having a list of all combinations of V-R-R-S concepts, we concluded that a table would enumerate the complete list of eleven combinations of V-R-R-S concepts as binary, ternary, and quad-nary combinations (Table 2, column 1), plus offer a means to describe them. Comparing and contrasting the potential of Venn diagrams and tables, we used this insight about information structuring (of synoptics and analytics) for exploring different ‘expression conventions’ that characterize relations among the thirteen components, seeking full enumeration, synoptic portrayal, and analytic detail of relations. A literature review (see references in Table 2, column 3) identified seven conventions, each expressing a different information structuring capability, including: O: operational expression, G: graph diagram (between two variables), M: map display, B: box-relation diagram, V: Venn diagram, T: table list of enumerated characteristics, and N: narrative (Table 2, column 2 and legend). These conventions are listed in order of potential for analytic expression, and capability for providing both an overview and details of elements while clarifying the character of a relation. The list is ordered from the most robust (i.e., operational expressions suitable for modeling) to narrative (i.e., textual description within paragraphs) to describe relationships among information elements (i.e., components).
Operational expression, graph, and map display information structures provide a basis for data structures within models, and thus are commonly more detailed than conceptual frameworks. Although those information structures will eventually be significant for research about VRRSability modeling, our main interest is in developing a robust conceptual framework before addressing logical modeling as discussed previously [6]. Consequently, graphs, box–relation diagrams, Venn diagrams, tables, and narratives provide the best source for an information structure approach to compose a conceptual framework.
We used those expression conventions to perform a meta-content analysis of the literature. Within each publication listed in Table 2, column 3, we identified the types of information structuring used as part of their contribution listed in Table 2, column 2. Readers might question the validity of the list of information structure entries within Table 2, i.e., whether each entry is accurately listed, and how significantly each entry might influence the overall research findings. The selection of the entries represented a pre-screening of the literature references as an intermediate finding, i.e., the entries offer nominal insight about possible considerations only. As such, Table 2 entries indicate the existence of information structures within specific references merely for later consideration. Identifying and characterizing one type of information structure in contrast to another is a matter of interpretation, based on expertise of those developing and interpreting such expressions. Since the lead author made all the interpretations, there is internal consistency with the listed entries. In brief, the principal form and function of each acted as a selection guideline as follows. Operational models characterize functional relationships most easily translated into methods and data structures in programming languages. Graphs portray trends between ranges of numbers, even when the ranges are abstractions. Maps are multidimensional characterizations of relations using world space and time as foundational domains. Box–relation diagrams emphasize connections (relations) among conceptual components (boxes). Venn diagrams as graphic portrays of information demonstrate nominal commonalty as the basis of relations, wherein overlapping areas depict similar content. Tables combine a list of primary entities (rows) and a list of characteristics (columns), wherein the advantage is the complete enumeration of lists, providing exhaustive treatment of entities. Narratives offer descriptions of relations in a free-form textual manner. As mentioned above, we applied the guidelines loosely, emphasizing inclusion as opposed to exclusion of entries for any given information structure associated with a published work. This process provided a sufficiently large number of information structures and references within Table 2 for consultation during the next steps of the research process. Although differences among information structures are important, we again note that the focus of this research is about enumeration and synthesis of meaningful V-R-R-S concept relations associated with VRRSability as opposed to focusing on how one type of information structure is more advantageous than another.
Table 2 helped us to identify which publications were the most salient for initiating work on a comprehensive VRRSability conceptual framework. Publications indicated with a plus (+) after the numbered reference in the table offer a particularly useful and explicit treatment of the VRRSability combinations, and thus provided special insight for framing a VRRSability synthesis, i.e., composing a conceptual framework.

2.3. Organizing V-R-R-S Components into a VRRSability Conceptual Framework

While we could enumerate all the relationships among all the 13 components across V-R-R-S, and although it would require considerable time, the result would be difficult to comprehend. Thus, as per the list of components in Table 1, we start with the core components of ‘human’, ‘related to’, and ‘environment’, and associate other components previously identified to these three components. This makes sense because those same three components are part of the Tier 1 system description ontology. The V-R-R-S conceptual components in Table 1 (far-left column) reappear in Table 3 (far-left column). We focus on the articles that use box–relation diagram(s) portraying a conceptual framework as a guide for developing insights about conceptual components, emphasizing articles with a plus (+) in the far-right column of Table 2. We argue that a box–relation diagram provides fruitful insight for organizing and portraying concepts and conceptual relations from a synoptic perspective, as they are related to flow charts, systems diagrams, entity–relationship diagrams, and can include hierarchical nesting. A box–relation diagram is the most similar to an entity–relationship diagram as a compromise between text narratives and operational models for organizing multi-dimensional topics and relationships. From the overall collection of references with box–relation diagrams listed in Table 2, we provide the most comprehensive treatments (references) at the top of columns 2–6 of Table 3. This sub-collection offers a more focused exploration of the potential for enumerating the thirteen components. Relevant descriptions associated with each component appear as row entries across columns 2–6 of Table 3.
V-R-R-S entries within Table 3 row with reference citations indicate the V-R-R-S focus of the respective frameworks. None of the references treat all four V-R-R-S concepts explicitly in a comprehensive manner; some treat two and others treat three. The framework created by Turner et al. [57] focuses on vulnerability, while incorporating resilience and sustainability. The framework created by Birkmann et al. [69] focuses on vulnerability, while incorporating risk and sustainability. The framework created by Birkmann et al. [51] focuses on vulnerability, while incorporating risk and adaptation, with adaptation being a core action associated with resilience. The framework created by Lam et al. [24] focuses on resilience, while incorporating vulnerability and adaptation. The framework created by Linkov et al. [29] focuses on risk and resilience, but contextualizes that relationship with vulnerability. The frameworks created by Lam et al. [24] and Linkov et al. [29] guide computational approaches that support the identification and use of methods, techniques, and tools for the respective concepts, but neither of them treats computational sustainability.
Row entries for the components (a–m) within Table 3 across columns 2–6 provide an overview of how each component is treated within the respective publication. Having already synthesized twenty components into thirteen main components (labels a–m) and seven sub-components (labels with letter–integer combinations) appearing in Table 1, we compared the entries to form conceptual component relationships. The row entries depicted with bold-faced font signify explicit consideration for inclusion in the syntheses within a VRRSability conceptual framework (Figure 3). The VRRSability framework is depicted as a box–relation diagram, which shows the resulting relationships among the components/subcomponents using text label codes within parentheses. No doubt there are other aspects of each component of the conceptual framework, but the framework depicts the salient relationships among the components. The relationships suggest the most interesting aspects of the framework for further investigation. Such investigation draws from insights about the variables offered in Table 1 about GSI, requiring variables for each of the components/sub-components, and focusing on a GSI core relationship to start.

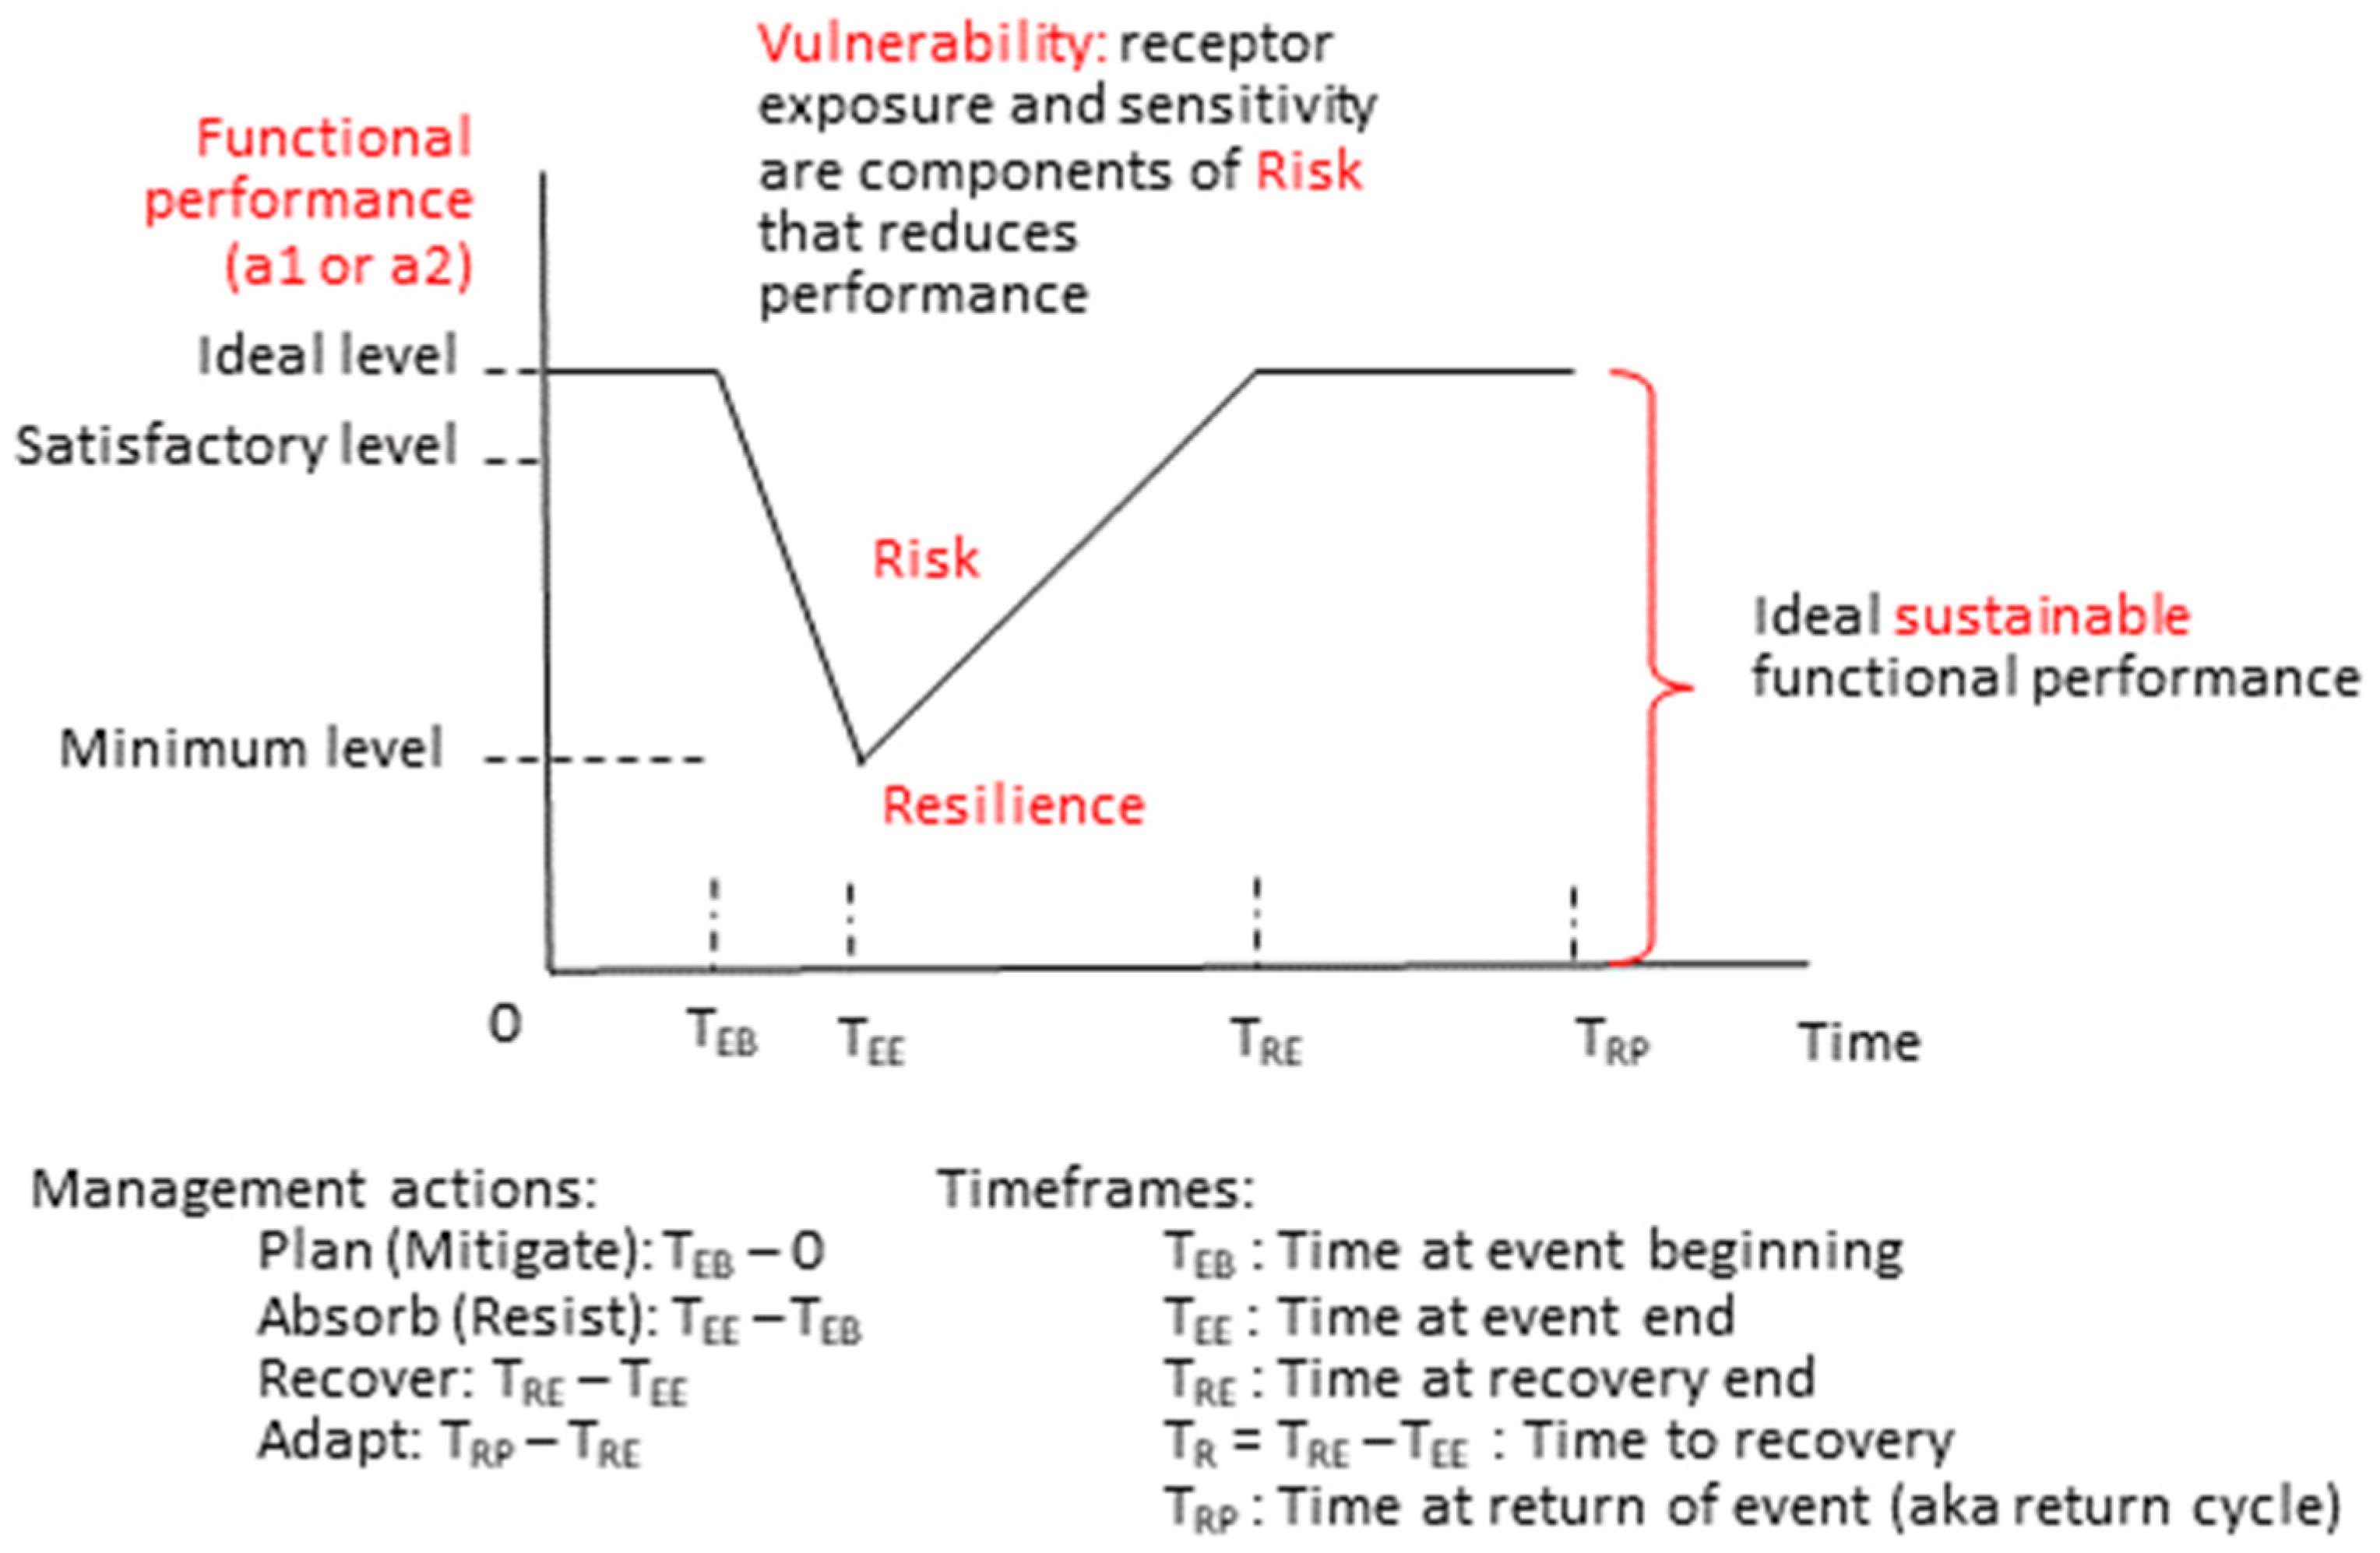
2.4. Exploring VRRSability Using Functional Performance as a Core Relationship

A functional performance relationship (center of Figure 3, i.e., a1 ← b1,2 → a2) within an integrated system involves several sub-components, including human (social, economic, cultural, and institutional conditions) elements (stressor label a1 and receptor label a2), interacting through exposure (label b, b1, b2) with environmental (physical and ecological) elements. Turner et al. [57] describe human–environment systems in terms of interacting human elements and environmental elements situated within potentially vulnerable places associated with the core of the conceptual framework. Space–time collocation, i.e., more specifically impact envelopes, often referred to as the exposure (b) of stressors (a1) and receptors (a2), is a key relation of the conceptual framework. Exposure pathways (label b1) between stressors and receptors as a sequence of collocations (impacts) take the form of event occurrences (label b2). These event occurrences pair stressor and receptors at different sensitivities based on various dose–response thresholds (label c) for the stressor–receptor combinations [24,51] through spatial–temporal dimensions. Lam et al. [24] link receptor exposure and receptor damage using a vulnerability relationship. Birkmann [69] explicitly recognizes hazard (stressor) event occurrences as the precursor to vulnerability that motivates exposure with a given set of receptors. Birkmann et al. [51] further explain that recognition by classifying hazards into natural and socio-natural events. Turner et al. [57] outline human and environmental sensitivity levels, with these sensitivity levels being associated with various dose–response thresholds (c1).
Units of measurement are fundamental for more precise characterization of functional performance, which is commonly measured on an ordinal level for vulnerability and sustainability [15,23,57], or on interval or ratio levels for risk and resilience [17,27,50], although intervals–ratios can be reduced to ordinals. Ganin et al. [27], Lam et al. [24], and Linkov et al. [26] present characterizations of functional performance using units of measurement within the context of vulnerability, risk, and resilience, without treating sustainability. We draw from their work and expand the treatment of V-R-R, adding sustainability of functional performance over the long term to a functional relation (Figure 4). Vulnerability is seen to be a part of risk (vulnerability is referenced within the concept of risk); the higher the vulnerability, the higher the risk associated with an event. Risk, as the probability of harm, is seen as the drop in functional performance from a level (be it ideal or satisfactory) in the time interval measured as the area between TEB and TRE (i.e., TRE − TEB), above the minimum level [17,50]. Generally, resilience has an inverse relationship to risk, and is measured as the area under the performance curve. However, locations (organizations) around the world will respond differently to in situ conditions given human, financial, and ecosystem resource availability; thus, curve shapes have an in situ context. We also note that vulnerability is also part of resilience, but in an inverse way: the lower the vulnerability, the greater the resilience. Sustainability takes a long-term perspective in the diagram; it incorporates much of resilience (area under the curve), but extends the area to time TRP, which then would cycle through multiple time periods. The work of Linkov et al. [29] extends the work of Linkov et al. [26] by recognizing acceptable and unacceptable levels of damage based on thresholds at local, regional, and global levels. It is these ‘informed’ levels of performance that underlay the meaning of ideal, satisfactory, and minimum, all of which are interpreted in terms of thresholds as in the resilience literature [14].
The performance curve provides insight into the timeframes associated with management actions (d) that result in certain impacts (e) as portrayed in Figure 3. Management actions to plan, absorb, recover, or adapt functional performance are associated with different timeframes as depicted in Figure 4. Although functional performance over time is important to track, understanding functional performance as a relation of stressors to receptors is just as important; Figure 4 does not characterize that insight about different types of functional performance influences. Walker and Salt [14] outline four types of relation (herein, we interpret them as functional performance) diagrams for characterizing relationships between stressors as controlling variables and receptors as variables of change (Figure 5). Using the idea of sensitivity within resilience relationships, we refer to performance thresholds as ‘tipping points’ within the relation [14].
The four types of conditions likely require different management actions (d) depending on the availability and adequacy of evaluation information, particularly from a resilience perspective involving space–time dynamics with feedback. Whether a management action occurs or not, an impact (e) is likely to occur, e.g., as in parts per million of water contamination to a measured degree above a regulated standard or land flooding to a measured height in inches/feet above the flood stage. Whether such impacts in the short term or long term are managed properly addresses concerns about sustainability.
In addition to different management actions, each of the sensitivity situations can be characterized in terms of different scenarios (f), each formed from a collection of conditions addressing components (a–e), which can help enrich relational perspectives. Natural processes work at different scales, e.g., global regions of warming oceans and cooling oceans influence low and high pressure, respectively, which in turn influence wind patterns, which in turn influence precipitation patterns directly related to stormwater. More widespread and longer-lasting and/or more intense precipitation events together with local conditions of elevation changes influence stormwater flow, often resulting in flooding at national and regional scales, although national does not necessarily imply a geo-political-oriented scale.
We extend the functional performance treatment to address scenario conditions, based in part on suggestions by Linkov et al. [26]. We identify four main types of scenarios based on the collections of conditions that result in different risk and resilience circumstances (Figure 6). Everyday normal scenarios involve conditions with a low risk with expected high resilience because the challenges are small. Acute scenarios involve conditions with a high risk with high resilience; the challenges do not occur often, but are reasonably well-known and people can prepare for these circumstances because resources are available and attention is high. Chronic scenarios involve conditions with a low risk and low resilience from circumstances that are continually at hand; resources are minimal and spread across a long time-period. Catastrophic scenarios involve conditions with a high risk and low resilience; the conditions seldom occur, are hard to predict, and therefore, recovery takes a long time, if it can occur at all, given the circumstances. When recovery is long and difficult, a new stable state can arise more easily, involving degraded performance over time, e.g., as depicted in Figure 5d. Although scenario types are generalizations, providing a rough idea of circumstances that can occur from time to time, they are useful because they synthesize a collection of conditions for ease of discussion.
Turner et al. [57] note the importance of scenarios for investigating vulnerability (sensitivity conditions) and resilience (response to hazards) within human–environment systems; units of measurements take the form of human-contextual and environmental-contextual conditions. Birkmann et al. [51] consider a variety of dimensions based on physical, ecological, social, economic, cultural, and institutional conditions for all four V-R-R-S concepts, with these dimensions measured to set specific features, conditions and events that contextualize the relation a1 → a2. Different features, conditions, and events occur at diverse local, regional, national, and global scales (label g) because every scenario is scale-dependent. Turner et al. [57] describe spatial, temporal, and functional scales, as shown in Figure 3, using embedded scales (box frames), which infer relative sizes (spatial extents) of areas. Spatial and temporal dimensions characterize feature attribute scales, i.e., attribute scales follow from space–time scales. Together, spatial-, temporal- and attribute-scale dimensions create a functional scale; that is, functional scales follow from attribute conditions, associated with space–time scales. Birkmann et al. [51] enumerate local, sub-national (aka regional), national, and international areal scales to embed functional relationships characterizing human–environment (e.g., people → land development → water) interactions. Due to different scales, we recognize different levels of resolution (label h) for events and conditions within diverse social, economic, cultural, institutional, physical, and ecological domains. Land resolution in terms of land parcels provides an institutional perspective as opposed to characterizing acres (or hectares) for land and acre-feet for water. Turner et al. [57] embed human–environment relationships within place, regional, and global scales, suggesting that scales and the features therein are each associated with finer to more coarse levels of resolution, i.e., individuals, groups, communities, states, or nations. Controlling variables as stressors and variables of concern as receptors require expression at specific levels of resolution, with finer levels of resolution providing better feature articulation of interaction relationships. Furthermore, Birkmann et al. [51] describe the susceptibility and fragility of conditions in terms of physical, ecological, social, economic, cultural, and institutional dimensions, and as such, resolution of the relation for susceptibility associated with vulnerability and fragility associated with resilience rely upon fine to coarse units of resolution for articulation of these relationships.
Scenario considerations, with appropriate scales (spatial extents of areas) and resolutions (unit of observables within those areas), guide the selection of stressor and receptor features, conditions, and events that underpin functional performance. For example, controlling variables as stressors (such as land as label a1) influence variables of concern as receptors (such as water with label a2) over space–time horizons [14]. Turner et al. [57] and Birkmann et al. [51] both describe hazards as being human and/or natural–environmental sourced (i.e., a1 or a2). Turner et al. [57] describe the variability and change in human conditions as the basis of variables of concern as receptors. Following-up on a previous characterization of functional performance [26], Linkov et al. [29] describe three tiers of assessment for functional performance relationships, considering different levels of resolution for elements participating in these relationships.
Feedback (i) from causal influences is critical for understanding functional performance sensitivities, particularly regarding reactions associated with tipping points. Feedback loops commonly create tipping points, causing systems to flip into a different state as a reaction [14]. Turner et al. [57] suggest that nested spatial–temporal scales are important for clarifying the different levels of resolution involved with feedback. Birkmann [69] recognizes the importance of feedback from events that foster successive rounds of (re)action.
Once insight about the interactions and the frames of reference that guide them is obtained, we can expand the perspective to examine agency (directed motivation) when taking action (label d1) implemented through social empowerment (label d2) and governmental (label d3) approaches. Birkmann et al. [51] reference risk governance regarding ‘human agency’ as motivation to act for improvement, and we recognize that this perspective extends to VRRSability governance. Regulatory contexts situate the importance of social empowerment in risk assessment [73], now extending to risk and resilience [29], both showing a need for practical methods and tools for performing assessments. Birkmann et al. [51] mention the importance of societal empowerment in addressing vulnerability. Lam et al. [24] enumerates many geodemographic variables suitable for characterizing social empowerment.
VRRSability evaluation, as a third step within geodesign VRRSability assessment, provides information insights for management intervention actions (label d). Social empowerment infuses stakeholder perspectives with diversifying perspectives on decision priorities (label e1). Turner et al. [57] describe place-based adjustments including coping and adaptation as responses to vulnerability. Birkmann et al. [51] describe how hazard intervention and vulnerability (and by extension VRRSability) intervention as adaptation (management action) can lead to risk reduction, while vulnerability intervention includes exposure reduction, susceptibility reduction, and resilience improvement. Resilience improvement could include increasing capacities for mitigation (planning before disturbance events), coping (acting during disturbance events) and recovery (efforts after disturbance events). Birkmann [69] describes intervention systems that can address vulnerability threats. Linkov et al. [29] outline decision priorities that foster choices about interventions based on evaluation of damage thresholds.
Decision priorities use guidelines from evaluation as they apply to potentially desired and undesired impact outcomes (e2), remembering that all components together interact to influence priority of outcomes. Thus, geodesign evaluation feeds forward when considering geodesign alternatives, each with various associated impacts. All frameworks consider impacts (degradations or improvements) at various levels of detail. Turner et al. [57] describe impacts as consequences in response to hazards. Birkmann [69] describes impacts within contexts of risk reduction and resilience improvement. Birkmann et al. [51] describe impacts within a context of risk reduction. Lam et al. [24] describe impacts within a context of vulnerability reduction. Linkov et al. [29] describe impacts within the contexts of risk reduction and vulnerability improvement. Birkmann [69], Lam et al. [24], and Schultz and Smith [28] consider impacts within multiple cycles over time, which aligns with emergency management life cycles.
Different circumstances of human–environment conditions lead to alternate stable states (label j): some preferred and others not preferred. Birkmann [69] and Walker and Salt [14] describe alternate state conditions in relation to thresholds that create alternate stable states of world conditions. Empowerment often involves social learning for setting directions that influence conditions (label k). Although that sub-component is not recognized explicitly within any framework, it is important to include it in the VRRSability framework because people within institutions act as agents of change.
Information technology-based knowledge systems can enhance learning to foster social empowerment and effectiveness of management actions (label l). Knowledge-based systems embedded within geographic information systems are useful for exploring VRRSability to support structural change [52,74]. Organizing many of the above components for fostering structural change can enhance sustainable development (label e3), wherein long-term structural change called ‘transformation’ leads to sustained functional performance over the long term [64]. Correspondingly, recognition of resilience cycles over time will foster sustainable development over the long term [24,69,71].
Turner et al. [57] recognize the importance of tools, but do not cite any references since their framework was an early treatment of V-R-R-S concepts. Birkmann et al. [51] describe tools and measurements (label m) that can be key to implementing software for assessing vulnerability, risk, and adaptation. Lam et al. [24] implemented computer methods for estimating resilience with subcomponents of vulnerability and adaptation using data at county levels along the US Gulf of Mexico. Linkov et al. [29] compare risk and resilience assessment methods to show that they are complementary to each other, and suggest how software tools could also be complementarity if implemented appropriately. With the above insights in mind, we now turn to outlining a VRRSability application focusing on functional performance evaluation of GSI.

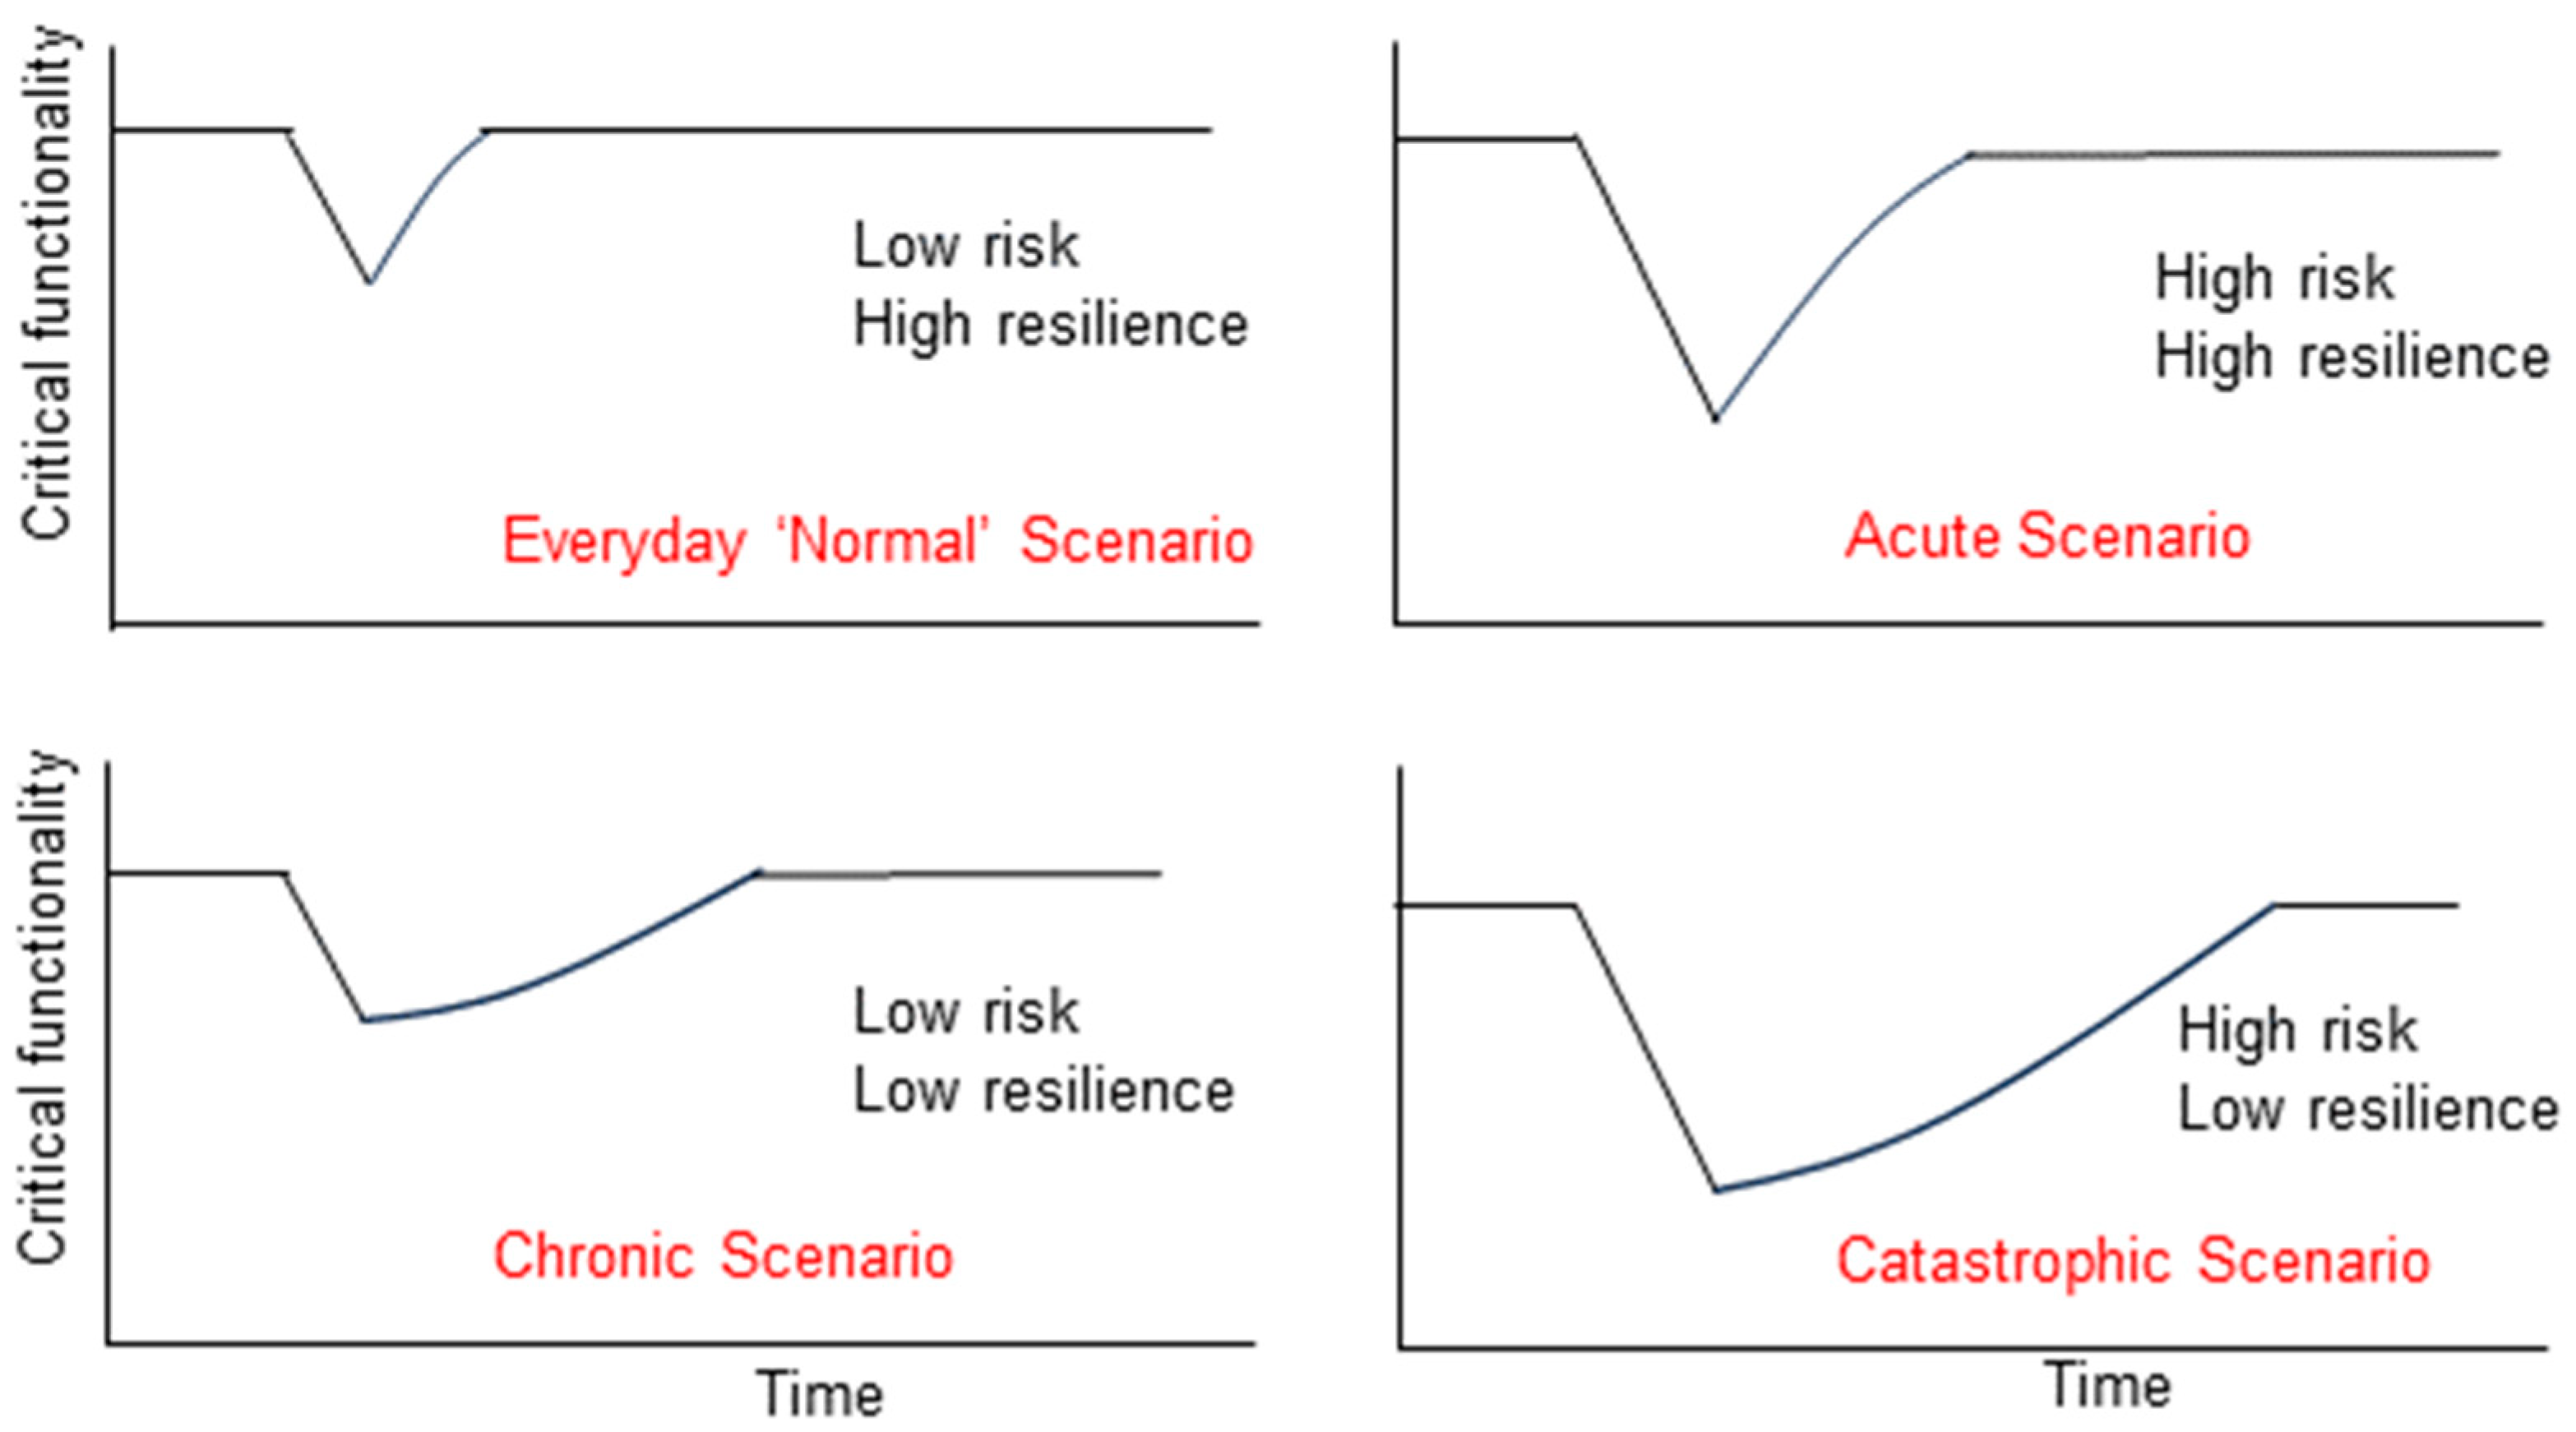
3. VRRSability Evaluation of Green Stormwater Infrastructure Functional Performance

In this section, we use the findings from the MOESIR Tiers 1–3, including the VRRSability synthesis elucidated above, for articulating a case study example focusing on the functional performance of GSI. Eckart et al. [7] investigate the functional performance of low-impact development (LID), and called for research on GSI decision evaluation at watershed and regional scales. Their research identifies several LID alternatives that perform various functions for returning stormwater runoff to the natural hydrologic cycle, including (1) a reduction in surface water runoff volume, (2) infiltration improvement, (3) a reduction in peak flow, (4) extending lag time reduction in pollutant loads, and (5) an increase in baseflow [7]. Each of those five functional performance behaviors contributes to a level of ‘functional performance’ for improving water flow and quality. The GSI example described herein adopts this perspective on water-focused GSI functional performance as an important focus within a ULWS, while treating the other components as needed.
The GSI example provides a proof-of-concept application toward making MOESIR Tiers 1–4 operational across various scales. This functional performance relationship is key to our GSI example, whether one examines two or more individual system elements, two or more subsystems within an individual system, or two or more interconnected systems. Regardless of the level of aggregation, GSI functional performance is at the core of ULWS relationships. Land–water relationships include components of land (a1), water (a2), land–water relationships (b1) and surge occurrences (b2), together with the resulting impacts (e1), e.g., degradation of the land or the water resource, for a1 or a2, whichever is relevant for the focus of functional performance. The direction of influence is important when characterizing the relation (i.e., arrows that depict interaction among elements). For example, the interaction between land (a1) → water (a2) would involve land cover (a1) as a stressor and water (a2) as a receptor. Alternatively, the interaction between water (a1) → land (a2) would involve water as a stressor (flood conditions) and land as a receptor (infiltration conditions). For both cases, dose–response sensitivity thresholds (c) are associated with each interaction. Water can suspend only so much contaminant material, e.g., phosphorous, nitrogen, or sediment with or without heavy metals(s). Alternatively, land can become saturated to a level wherein additional water causes flooding. Places are potentially vulnerable depending on the collocation of exposure and levels of influence, but specific measurements such as hectares (acres) of land and cubic feet (acre-feet) of water are required for the computation of risk probability.
As mentioned in the introduction, let us consider the water resource assessment of the Puget Sound Characterization (PSC) conducted by the Washington State Department of Ecology [74]. The geographic information system-enabled (GIS) multi-scale approach that addresses all nineteen watersheds within the Puget Sound basin represents a comprehensive water resource assessment of the regional resource. The assessment is part of the Puget Sound Partnership effort to understand land–water dynamics at multiple spatial and temporal scales, focusing on the influence of water flow on quality plus fish and wildlife habitats; the GIS data are available on the Washington Ecology GIS website [75]. The assessments examine water flow (WF), water quality (WQ) and habitat condition (HC). WF is of critical functionality within the water system in Puget Sound basin as it influences WQ and HC, particularly in relation to the health of salmon populations. The WF, WQ, and HC assessments include variables that combine with their respective functional performance levels. Considering a causality chain, WQ and HC functional performance stem from WF functional performance. Furthermore, the WF assessment points out that WF is a function of rainfall (RF) and land cover imperviousness (LCI), and the infiltration relationship between RF and LCI.
From the assessed levels of functional performance for WF, WQ, and HC, the PSC team recommended water resource planning strategies for local governments. Surprisingly, a text string search of the PSC volume 1 document (.pdf format) did not find explicit use of any V-R-R-S concepts. However, a search of other terms (e.g., water and assessment, etc.) did return results. Nonetheless, because the PSC report subtitle is “water resource assessments” and focuses on the importance and degradation of WF, WQ, and HC, we surmise that most researchers and practitioners would agree that V-R-R-S evaluations, and hence the VRRSability conceptual framework, could provide important evaluative information within V-R-R-S assessments. Furthermore, operationalizing VRRSability is possible only if all V-R-R-S components can be made operational. With WF being the most critical subsystem in relation to WQ and HC, space limitations encourage a focus on WF, while treating WQ and HC in relation to WF.
The VRRSability components listed in Table 3 and relationships depicted within Figure 3 provide the basis for a functional performance relationship (a1 → b1 → a2) that characterizes GSI VRRSability more specifically (Figure 7). In the PSC report [74], WF functional performance is computed as a combination of two main conditions, landscape physiographic conditions contributing to the unaltered capacity of the WF regime, and degradation of the land cover, which reduces the capacity of the WF regime. As such, WF functional performance is the combination of the level of importance of the physiographic conditions that facilitates flow function plus the level of degradation to flow function due to land development.
Detailing the WF regime, drainage analysis units (AUs) within the PSC watershed areas compose landscape groups with similar environmental characteristics, including precipitation, landform, and geology. The current version of model characterization includes landscape groups using geographical positions in terms of coastal, lowland, and mountain areas, plus a subset of lowland AUs that drain to one of four large lakes. In the models that assess AU importance, the study team compared AUs within landscape groups, but not between landscape groups. The PSC report states the following [74]:
“The importance submodel evaluates each AU in its ‘unaltered’ state—that is, based on its physical attributes of topography, soils, geology, and hydrology, and without any consideration of land-use changes or human modifications that may have occurred. It considers four fundamental groups of water-flow processes: delivery, surface storage, movement (separated into recharge and discharge), and loss of water in each AU. The fundamental assumption is that different parts of the landscape have intrinsic differences in their importance for supporting natural volumes, rates, and timing of delivery, storage, movement, and loss. Those areas that are most essential to maintaining natural flow regimes will presumably be those areas most critical to the support of aquatic biota that have evolved in concert with these natural conditions”.
[74] (p. 43)
The PSC report also states the following:
“The degradation submodel evaluates the watershed in its ‘altered’ state by considering the impact of human actions to the four water-flow processes (delivery, storage, movement, and loss) across all landscape groups. This evaluation is based on the magnitude of human-affected land cover (for the Puget Sound region, this is assumed to be all non-forest land, except those limited areas that are natural grassland), constructed infrastructure (roads and rooftops), and measures of consumptive water extraction and use”.
[74] (p. 44)
Based on the above narrative, the vulnerability of WF functional performance involves exposure to threats associated with sensitive conditions, e.g., the number of days without precipitation within a season. Dryness stems from the climate condition, which involves air and water circulation. WF functional performance is sensitive to the number of dry days, i.e., sensitivity increases when more than normal dry days occur. Vulnerability, in terms of exposure to dry conditions, would suppress WF functional performance. The risk of WF functional performance incorporates vulnerability, but the level of measurement is more refined, extending to a probability of harm resulting in damage to WF. Given a cycle of events within a season, we can compute the probability of damage to vegetation due to low water across a season, i.e., the risk of harm to vegetation increases when water availability decreases. This becomes an impact indicated on the right side of the LULC → WF interaction relationship depicted in the center of Figure 7. The probability of damage does not, however, offer insight about what to do to improve conditions, which is one reason for an emerging interest in resilience, shown on the left side of Figure 7. Resilience of WF functional performance focuses on the relationship between disturbance and improvements of functional performance conditions. In regard to functional performance, resilience is an inverse of risk; therefore, damage to functional performance plus remaining functional performance capacity equals total performance [26,27]. Resilience offers insight into the total capacity to respond to disturbances over time. Management action, in the form of LULC policy, is one such action, wherein these actions are often seasonal. Sustainability of WF functional performance focuses on maintaining a level of performance delivery satisfactory to all stakeholder groups over the long term (impacts on right side of Figure 7). Goal setting would be reasonable; goals and associated objectives are likely to involve decision trade-offs to maintain satisfactory functional performance, e.g., human drinking water, crop irrigation, and salmon habitats would involve many such trade-offs (priority settings on the left side of Figure 7). Overtime, an amount of damage to performance (considering risk) plus the amount of performance capacity (considering resilience) equals the total satisfactory functional performance over time. Therefore, sustainable functional performance in relation to satisfactory functional performance might be higher, the same, or lower depending on extant conditions, e.g., within scenarios developed using various assumptions about space–time conditions at local and regional scales. The above considerations are helpful for distinguishing and relating the VRRSability components, providing a guide to making V-R-R-S concepts operational in an integrated manner.
Within threshold diagrams of functional performance (e.g., Figure 5), time is assumed as the underlying relationship within the controlling variable; as such, the third dimension is assumed. Therefore, characterizing GSI functional performance, i.e., LULC imperviousness (in particular low-impact development) as a1 in association with functional performance of WF (a2), requires at least two 2D functional performance diagrams similar to Figure 4 because ‘time’ is the independent variable within the functional performance diagram.
For a given amount of water, the magnitude of infiltration (different for various imperviousness surfaces) across the amount of land area influences the amount of water filtering through the soils for groundwater recharge or seepage back into watercourses. For a given amount of land, the magnitude of water influences the amount of (potential) flooding that will likely occur for that land area. There are threshold magnitudes for both land and water as part of a dose–response relationship that subsequently results in impacts from infiltration or flooding. Based on Figure 5, thresholds for dose-response and interaction during evaluation modeling of green infrastructure include the (sub) components c, d1, d2, d3 and e3.
Depending on the magnitudes and timeframes as conditions, we might expect one or more of the scenarios to occur. Resources that commensurate with those conditions drive management actions for addressing conditions as less or more vulnerable, less or more risk prone, less or more resilient, and less or more sustainable; and together, these factors result in less or more VRRSability impacts. Based on Figure 6, operationalization (m) of VRRSability must include one or more scenarios (f) for contextualizing GSI decision evaluation modeling. Such scenarios specify space–time conditions, but not all conditions. Decision evaluation modeling must also include the other six contextual sub-components for particularizing situations, including the following: scale (g), resolution (h), feedback (i), alternate stable states (j), social learning (k), and knowledge systems (l). As mentioned earlier, scenarios at global to local scales include different forcing mechanisms for natural processes. As such, precipitation that causes stormwater can take on different spatial–temporal dynamics, wherein global processes of warmer oceans together with wind patterns can cause widespread and longer-lasting precipitation events across regions. Such large-scale events would encourage consideration of regional GSI development programs rather than single project activities. GSI investment programs as part of the more traditional capital investment in infrastructure programs are needed to address resilient and sustainable conditions. These six components represent a specification of social, economic, and physical conditions for contextualizing WF within a geographically based knowledge society. Each of the six components specify conditions of a particular situation needed for operationalizing VRRSability evaluation of GSI for watersheds.

4. Trade-Offs within a Green Stormwater Infrastructure Decision Evaluation

Changes in the conditions of complex human–environment systems over space and time encourage research into synthesis concepts about evaluating decision objective trade-offs that addresses the third and final clause within the research question. Elucidating all combinations of V-R-R-S and synthesizing them into a concept called VRRSability enables a wide-ranging perspective about what components and sub-components to consider within evaluation models. While the general overview of relationships is useful for understanding the scope of influences, drilling down into the details of the stressor–receptor functional performance relationship, i.e., a1 b a2, required several two-variable diagrams to characterize functional performance (as offered in Figure 4, Figure 5 and Figure 6). Four different scenarios of functional performance levels are provided in Figure 6, each offering a different shape of the curve, which show dramatic effects. When adding time into the functional relationship, as in Figure 6, we see that there are at least four possible scenarios. Factoring in Figure 5 relationships (stressors and receptors) and Figure 6 relationships (functional performance over time) results in at least 16 scenarios. Considering each of the V-R-R-S and VRRSability concepts, i.e., five concepts each applied to sixteen scenarios, results in eighty different scenarios. Such a conceptual enumeration begs for a computational approach, as a computational approach offers specificity for making decision objective trade-offs for any given application. Nonetheless, because a computational approach requires conceptual grounding, a narrative-based discourse of these concepts offers further clarification of the trade-offs as follows.
Resilience (as depicted in Figure 4, Figure 5 and Figure 6) offers a core (relationship) concept within VRRSability because resilience is an important quality for understanding improvement or degradation of well-being. The common dimension across Figure 4 and Figure 5 is functional performance, e.g., the level of water flow improvement within a land–water GSI relationship. Units of measure for the dimensions of Figure 4 and Figure 5 can be implemented in both ordinal and interval–ratio terms. At present, they are characterized in ordinal terms. Measuring those dimensions is key to implementing VRRSability for decision objectives. Evaluation trade-offs for decision objectives, which relate the controlling variable to the variable of concern in Figure 5, are fundamental in forming GSI decision options. Characterizing evaluation trade-offs across time as depicted in Figure 6 is a further explication of decision options, but we must draw upon the relationships among V-R-R-S concepts if we are to understand trade-offs.
For each of the four V-R-R-S concepts, consider the functional relationships among land cover, water flow, and water quality (LC → WF → WQ), wherein LC is the stressor and WF is the receptor for LC → WF, and WF is the stressor and WQ is the receptor for WF → WQ (See Table 4). Column 2 offers the unique character of each V-R-R-S concept described in terms of ‘sensitivity, harm, improvement and long-term well-being, respectively. Columns 3 and 4 present the stressor and receptor characterizations for LC → WF and WF → WQ, respectively. Column 5 presents the full functional performance relationship for LC → WF → WQ in the respective context.
The relationship of LC → WF → WQ (abbreviated as LC → WQ) functional performance is the basis for examining each of the V-R-R-S concepts in a pairwise manner (Figure 8). Arraying VRRSability components in terms of dimensions helps characterize geodesign decision evaluation trade-offs regarding functional performance among pairs of V-R-R-S concepts. Dimensions range from the minimum (min) to maximum (max) for each of the four V-R-R-S concepts, wherein each dimension characterizes an aspect of functional performance. The characterization shown in Figure 8 depicts the complementarity and inverse relationships of the V-R-R-S concepts. Vulnerability and risk complement each other. Resilience and sustainability are complements to each other. Vulnerability and sustainability are inverses of one another. Risk and resilience are inverses to one another. As such, a position within the framework identifies a trade-off for both VUL-SUS and RISK-RES dimensions; assuming we hold the other dimension constant. A position along the VUL-SUS dimensions (vertical dimensions in figure) indicates a trade-off between harm sensitivity and maintaining well-being. Positions along the RISK-RES dimensions (horizontal dimensions in the figure) indicate a trade-off between harm impact and capability (capacity + ability) to maintain well-being. The center point intersection of dimensions identifies a ‘balanced position’ among all four components, which may or may not be a beneficial condition. A position at maximum sensitivity and maximum harm is a position corresponding to minimum resilience and minimum sustainability. In contrast, a position at minimum sensitivity and minimum harm corresponds to a position of maximum resilience and maximum sustainability. The descriptions within the four quadrants offer further insight into the relations among the V-R-R-S concepts in a binary manner. We note that the figure depicts general relationships among the components; thus, we must be cautious that some (desired) conditions in the world might encourage other interpretations. For example, annual flooding of the Snoqualmie River just east of Seattle, WA, encourages nutrient renewal on an annual basis, so what was generally considered a high risk can at times be beneficial (high as opposed to low resilience). However, a knowledge-based operational model can sort through such relationships, and remains a goal in future research.
Pair-wise relationships are useful, but VRRSability is composed of all four concepts. Thus, we use binary, ternary and quaternary relations of the concepts to understand the basis of trade-offs (Table 5 is a summary and Table A1 in Appendix A offers a full table). Reading through the tables, there is a ‘building block’ relationship among the V-R-R-S concepts. Note that the last row entry is V-R-R-S, i.e., VRRSability. All other rows offer ‘coded relations’, e.g., Vul-Risk-Res, for describing the concepts. As before, land cover (LC) in relation to water flow (WF) in relation to water quality (WQ) functional performance relationships (i.e., LC → WF → WQ abbreviated as LC → WQ) appear for each of the binary, ternary, quaternary V-R-R-S coded relations. Remember, WF is a receptor in the LC → WF relationship (Table A1, column 3), but is a stressor in the WF → WQ relationship (Table A1 column 4). A summary of the trade-offs for the land cover to water quality functional relationship (LC → WF → WQ) appears in column 3 (Table 5), and that same summary appears in column 5 (Table A1). All of the functional relationships can be used to guide decision evaluation trade-offs for each of the eleven coded relations, when such relations are relevant to decision negotiation. LC-type (LULC imperviousness) contingencies for WF are presented in Appendix A Table A1, columns 3 and 4, which is the primary reason the full table is more informative, and more useful when moving toward operationalization.
Acting as a guide for moving toward implementation of operational models, Table 2 enumerates several approaches to operational models for combinations of V-R-R-S addressing trade-offs, although none of them treat all four concepts that demonstrate evaluation trade-offs. Nonetheless, the several combinations of two and three concepts can provide a solid next step when considering the enumeration of relationships as per Table 5. For example, mathematical operational models are published for combinations of Vul-Risk about social–ecological systems [16] and safety within hazardous systems [17]. Although Aven’s [17] approach is the more complete of the two, unfortunately neither is spatially explicit. Vul-Risk in Table 5 shows that a spatial–temporal explicit approach to land and water systems is necessary. A statistical spatially explicit operational model of the U.S. Gulf Coast exists for the combination of Vul-Res [24]; although it is temporally explicit, the temporality is limited. A geodesign operational model exists for Vul-Sus [2], but trade-offs between GSI scenarios are not treated in an explicit manner. Operational models combining trade-offs between Risk-Res include a mathematical model [27], a multicriteria decision model [30], and a spatially explicit simulation model [31]. Combining those three approaches offers valuable insight for integrating all combinations of V-R-R-S. Operational models combining trade-offs between Res-Sus include a spatially explicit statistical model for social–ecological systems [37,38] and composite indicator models for wastewater management [45]. Composite indicators offer a simple but effective approach for providing insights about functional performance levels. Operational models combining trade-offs among Vul-Risk-Res include a mathematical approach for earthquake seismic concerns [46], a qualitative approach to social concerns in social–ecological systems [59], and a general model about safety [50]. Those models provide insights about the explicit treatment of trade-offs that can improve the implementation of trade-offs. Operational models combining trade-offs among Risk-Res-Sus include two numerical models about bridge infrastructure [64,65]. Since Risk-Res-Sus are treated within those operational models, and Vul is often considered part of Risk, these approaches may be the next steps for implementing VRRSability. One operational model treats the collection of Vul-Risk-Res-Sus in the form of a time-series assessment of a water reservoir system [68], but trade-offs are not considered. The above observations suggest that a modeling platform that treats all combinations of V-R-R-S can be useful for comprehensive evaluation of VRRSability decision trade-offs. Furthermore, the entries in Table 5, and particularly entries in Table A1, suggest a detailed collection of data needs that can be useful for model operationalization once the research reaches that phase of effort.

5. Discussion

This paper elucidates the relations among V-R-R-S and the 13 components with respective sub-components. The Venn diagram approach to synthesis fell short for full elucidation of V-R-R-S concept combinations compared to a table that could enumerate all 2, 3, and 4 concept combinations. The latter enumeration provided a basis for considering how various types of information structures could depict relationships among the 13 components.
A box–relation information structure was selected for portraying a VRRSability conceptual framework because it provides a synoptic compromise between the narrative and operational approaches. Five sophisticated box–relation examples were chosen to represent component relationships across the components and sub-components as potential for organizing a VRRSability conceptual framework. We highlighted in bold a collection of the most effective characterizations of components for forming a comprehensive conceptual framework of VRRSability. Those selections were synthesized and organized to depict the ‘related to’ relationship at the core of the VRRSability conceptual framework. Many iterations were needed to develop the framework, but the iterations were guided by excellent partial frameworks. Whether this framework is truly comprehensive awaits further confirmation with operational models.
We applied the VRRSability conceptual framework to a UWLS, focusing on the VRRSability of GSI, particularly land cover in relation to water flow. The example provides a proof-of-concept validation of the relationships. Within a ULWS, land influences on water and water influences on land are both possible. Land influence on water is often seen as (potentially contaminated) ‘run-off;’ while water influence on land is seen as irrigation or flooding after the land is saturated. We chose the former land to water relationship as GSI for an application of the conceptual framework. The ULWS application helped verify the character of conceptual relations, demonstrating that the VRRSability of ULWS is indeed a useful and important application that would be improved considerably when a computational approach is available.
Using an ordinal level of measurement for the GSI functional relationship, decision evaluation trade-offs among vulnerability, risk, resilience, and sustainability include the following examples: (1) minimizing the sensitivity of receptors to harm from hazard(s) as part of vulnerability, (2) minimizing the probability of harm to receptors as part of risk, (3) maximizing the probability of capability for the improvement in wellbeing as part of resilience, and (4) maximizing the capability to maintain well-being over the long term. V-R-R-S concepts were arrayed in terms of dimensions to depict complementary and inverse relationships. This made it easier to characterize decision evaluation trade-offs within and among functional performance relationships in the context of V-R-R-S concepts. These relationships will be a key guide to specifying and implementing operational models of VRRSability.
Operationalization of decision evaluation trade-offs requires specification of data measurement units (metrics) within operational models designed by research practitioner analysts. Identifying units of measurement for the thirteen components plus sub-components characterized can be accomplished more easily for operational models based on the tables and frameworks presented herein. If these frameworks are not yet suitable, at least research groups now have a head start with sorting through the complexity to develop their own frameworks as researchers work toward comprehensive operational models. The enumeration of V-R-R-S partial combinations (Table 4 and Table A1) together with units of measurements (Table 1) can act as a guide for the comprehensive evaluation of VRRSability decision trade-offs.

6. Conclusions

Three main contributions to knowledge emerge from the research effort reported in this paper. First, the results about VRRSability synthesis flesh out MOESIR Tier 2 ontology as a proof of concept and elucidation of its use within a geodesign assessment of green stormwater application fleshes out MOESIR Tier 4 epistemology as a proof of concept, which together provide motivation for the continued use of the MOESIR framework as a guide for improving geospatial decision support research and development. Second, the VRRSability conceptual framework composed of components and relations among them provides a solid foundation (in both breadth and depth) for the next step in operationalizing models characterizing decision evaluation trade-offs among (1) minimizing the sensitivity of receptors to harm from hazard(s) as part of vulnerability, (2) minimizing the probability of harm to receptors as part of risk, (3) maximizing the probability of capability for improvement in wellbeing as part of resilience, and (4) maximizing the capability to maintain well-being over the long term. Third, informed by the conceptual framework, operationalization of VRRSability models using a VRRSability intelligence ramp of data, information, evidence, knowledge and wisdom can take advantage of two artificial intelligence directions: GeoAI technology composed of three pillars (i.e., high-performance computing, machine learning, and geospatial big data), which interact to provide insights and large language model (LLM) technology based on massive knowledge graphs to provide insights about VRRSability decision evaluation trade-offs.
In this synthesis of VRRSability, the number of V-R-R-S items being treated is beyond most peoples’ abilities when faced with making comparisons of evaluative constructs; therefore, computer-based decision support is required. The next steps for improving the designs of decision support software through systematic consideration of VRRSability decision trade-offs require operational modeling. As such, practical recommendations for the next steps in the research effort can draw information from Table 1, Table 2, Table 4 and Table A1 to offer direct insights into operational modeling across the combinations of V-R-R-S. As we examined each combination of V-R-R-S, many of those approaches identified with operational modeling will provide solid next steps for exploring the implementation of models. Some approaches offer useful insights about measurement, while others offer useful insights about multicriteria analysis. Some approaches offer insights about how to implement spatial and/or temporal models, while others offer insights about implementing trade-offs. We justified the selection of the thirteen components based on a preponderance of corroborating evidence culled from studies containing definitions and frameworks of one or more of V-R-R-S concepts. Although a preponderance of evidence approach will likely be used for enumerating operational constructs, a more structured approach such as SWOC (Strength, Weakness, Opportunity and Challenge) analysis [76] can provide additional insights for justifying and validating a selection of operational constructs. All of these insights can be useful for further integration and synthesis for implementing a family of operational models of VRRSability.
Operationalizing comprehensive models of VRRSability might look to GeoAI research that combines machine learning on big spatial data and ontology frameworks for developing knowledge-based systems [8] and/or to LLMs that operationalize massive narrative text, with both approaches using knowledge graph technology [77,78]. Measurements for variables of ULWS could be used in machine learning to obtain insights about trends, as a form of inductive inference. Concepts and relations in the conceptual framework could be used as an ontology for analyzing and synthesizing information, and when verified, that insight becomes evidence. Use of that ontology takes the form of deductive inference to guide machine learning. Merging (moving between) machine learning with big data (inductive reasoning) and analysis/synthesis with ontology (deductive reasoning) approaches as a cycle of processing constitutes the basis of GeoAI [8], and is the strategy employed in abductive reasoning, as a more effective approach for discovering hypotheses for knowledge building than either inductive or deductive reasoning alone [79]. GeoAI approaches have been used to merge data science, big spatial data, and geographic information systems and science to improve smart city approaches for spatial planning and decision support [80].
An approach to a GeoAI-VRRSability application could be as follows. VRRSability can be the ontology that serves as the schema that defines the semantic structure of V-R-R-S domain knowledge. With this, a knowledge graph can be created that is manually and auto populated with millions of triples: <subject, predicate, object>. This knowledge graph can be conversed via natural language queries by humans, as well as be the starting point for the GeoAI agent to find patterns, learn, adapt, and suggest robust and/or novel geospatial decision support. Critical to the success of this vision is ensuring this starting “top down” ontology is correct. The contributions in this paper move us closer as a community to that type of development.
As a supplement to GeoAI, AI for LLM software technology has been developing for decades, but recent wide-spread availability of highly parallel computing has made LLMs more viable for synthesizing large amounts of text [77,78]. Such syntheses can enhance solutions that address the myriad of relationships within complex GSI decision problems that are often common in addressing improvement across ULWS, for example by reducing hallucinations and improving reasoning accuracy through augmentation by knowledge graph representations [81]. Furthermore, LLMs have been shown to enhance the transparency of large amounts of narratives within sustainability reports [82]. Adding VRRSability ontology and epistemology to that mix of GeoAI and LLM technology will likely advance the transparency of decision evaluation trade-offs within geodesign decision problem assessment for ULWS within participatory decision settings. For example, Participatory AI can be used to help professional facilitators improve the way stakeholder participatory and decision-making processes are structured and performed [83]. The amount of LLM AI agents that can support VRRSability is exponentially increasing [84]. There is also the frontier of artificial general intelligence [85] that broadens the many specific AI areas of expertise, like GeoAI and Participatory AI, in integrated AI with the goal of supporting VRRSability. An enabling factor for this is the recognition that the VRRSability intelligence ramp as a novel contribution to the data–information–evidence–knowledge–wisdom spectrum can be enabled by including purpose as a pivotal parameter, thus contextualizing how data are processed into wisdom [85]. If we as a community can ensure that MOESIR and VRRSability are right, then many other promising developments can flow.
Moving toward operational modeling of VRRSability can benefit from using a convergent research approach, which combines analysis and synthesis approaches while taking advantage of CyberGIS computing [9]. CyberGIS computing employs big data and high-performance resources as two of the three pillars of GeoAI [8], and as mentioned earlier, the original context motivates the development of MOESIR. CyberGIS computing can improve geodesign decision support applications of GSI with big data resources [9] and improve decision support processing of ULWS with high-performance computing. Developing insights across an intelligence ramp of data–information–evidence–knowledge–wisdom using CyberGIS-enabled GeoAI resources may provide the exciting next steps for operationalizing and implementing the MOESIR framework, and thereby considerably enhance ULWS-focused geodesign decision support.
Finally, recommendations about the next steps for follow-on research by researchers across the world include broadening the VRRSability synthesis to address other geodesign application areas requiring the specification of variables and measurements (at MOESIR Tier 4). Many research application areas are in need of improved assessment of conditions, e.g., ocean ecosystem resources under considerable pressure from warming ocean regions, wildfire hazard pressures on forest ecosystem resources, water resource pressures such as extended droughts causing regional famines, aquifer depletion with associated collapses of farm productivity, homelessness community issues within urban–regional settings, and almost any application area addressing sustainable system health and well-being. Addressing any one (or more) of these topic areas will likely broaden and deepen our knowledge about applications at MOESIR Tier 4, and provide insights into the VRRSability synthesis at MOESIR Tier 2, while at the same time improving geodesign decision evaluation (assessment) by offering insights into MOESIR Tier 3, thereby enhancing decision support research and practice for communities around the world.

Author Contributions

Conceptualization, Timothy Nyerges, John A. Gallo, Keith M. Reynolds, Steven D. Prager, Philip J. Murphy and Wenwen Li; methodology, Timothy Nyerges, John A. Gallo, Keith M. Reynolds, Steven D. Prager and Philip J. Murphy; validation, Timothy Nyerges, Keith M. Reynolds and Philip J. Murphy; formal analysis, Timothy Nyerges and Keith M. Reynolds; investigation, Timothy Nyerges, Steven D. Prager and Philip J. Murphy; writing—original draft preparation, Timothy Nyerges; writing—review and editing, Timothy Nyerges, John A. Gallo, Keith M. Reynolds, Steven D. Prager, Philip J. Murphy and Wenwen Li; visualization, Timothy Nyerges and Keith M. Reynolds; supervision, Timothy Nyerges; project administration, Timothy Nyerges. All authors have read and agreed to the published version of the manuscript.

Funding

This research received no external funding.

Data Availability Statement

Data resources and reports used are documented in the reference section under the respective reference citation.

Conflicts of Interest

Author Philip J. Murphy was employed by the company Info Harvest, Inc. The remaining authors declare that the research was conducted in the absence of any commercial or financial relationships that could be construed as a potential conflict of interest.

Appendix A

Table A1. V-R-R-S binary, ternary, and quaternary relations for undergirding functional relationships between land cover (LC), water flow (WF), and water quality (WQ). This table offers the full collection of table cells as an expansion of Table 5.
V-R-R-S RelationsRelationship as a Basis for Trade-Off between V-R-R-S ConceptsLand Cover (LC) to Water Flow (WF) Functional Relationship WF to Water Quality (WQ) Functional Relationship LC → WF → WQ Functional Relationship
Vul-RiskDirect relation between receptor (vul) sensitivity and (risk of) harm to receptor When LC (stressor) increases, e.g., from low to high imperviousness, (vul) sensitivity of WF (receptor) increases, WF probability of harm (risk) likely increases When WF (stressor) decreases, WQ (receptor) sensitivity (vul) increases, and WQ probability of harm (risk) likely increasesWhen LC imperviousness increases (decreases) or WF decreases (increases), probability of harm to WQ likely increases (decreases)
Vul-ResIndirect relation between receptor (vul) sensitivity and (res of) improvement in receptor. When LC (stressor) increases, e.g., from low to high imperviousness, (vul) sensitivity to WF (receptor) increases, probability of WF improvement (res) likely decreases When WF (stressor) decreases, WQ (receptor) sensitivity (vul) increases, and WQ probability of improvement (res) likely increases When LC imperviousness increases (decreases) or WF decreases (Increases), WQ probability of improvement likely decreases (increases)
Vul-SusIndirect relation between (vul) sensitivity and (sus) maintenance of long-term well-beingWhen LC (stressor) increases, e.g., from low to high imperviousness, (vul) sensitivity to WF (receptor) increases, WF maintenance of long-term well-being likely increases When WF (stressor) decreases, WQ (receptor) sensitivity increases, and WQ maintenance of long-term well-being likely increases When LC imperviousness increases (decreases) or WF decreases (increases), maintenance of long-term well-being of WQ likely decreases (increases)
Risk-ResIndirect relation between (risk of) harm and (res of) improvementWhen LC (stressor) increases, e.g., from low to high imperviousness, (risk) probability of harm to WF (receptor) likely increases, and (res to) improvement decreasesWhen WF (stressor) increases, WQ (receptor) probability (of risk) harm increases or decreases depending on LC type, and probability of improvement (res) to WQ increases or decreases depending on LC typeWhen LC imperviousness increases (decreases) and WF increases (decreases), WQ (receptor) probability (of risk) harm increases (decreases), and probability of WQ (res) improvement likely decreases (increases)
Risk-SusIndirect relation between (risk of) harm and (sus) maintenance of long-term well-beingWhen LC (stressor) increases, e.g., from low to high imperviousness, (risk) probability of harm to WF (receptor) likely increases and (sus) maintenance of long-term well-being likely decreasesWhen WF (stressor) increases, probability of harm (risk) to WQ (receptor) increases or decreases depending on LC type, and (sus) maintenance of long-term well-being increases or decreases depending on LC typeWhen LC imperviousness increases (decreases) and WF increases (decreases), WQ (receptor) probability (of risk) harm increases (decreases), and maintenance of long-term well-being decreases (increases)
Res-SusDirect relation between (res) probability of improvement and (sus) maintenance of long-term well-beingWhen LC (stressor) increases, e.g., from low to high imperviousness, (res) probability of WF (receptor) likely increases, but (sus) maintenance of long-term well-being might increase or decrease depending on LC type When WF (stressor) increases, probability of improvement (res) to WQ (receptor) increases depending on amount of volume, contingent on LC type contributing contaminantsWhen LC imperviousness increases (decreases) and WF increases (decreases), probability of WQ improvement likely decreases (increases), and (sus) maintenance of long-term WQ well-being likely decreases (increases)
Vul-Risk-ResDirect relation between (vul) sensitivity plus (risk) harm with indirect relation to (res) improvementWhen LC (stressor) increases, e.g., from low to high imperviousness, (vul) sensitivity of WF (receptor) increases, WF probability of harm (risk) likely increases, and probability of WF improvement (res) likely decreasesWhen WF (stressor) decreases, WQ (receptor) sensitivity (vul) increases, and WQ probability of harm (risk) likely increases, and WQ probability of improvement (res) likely increasesWhen LC imperviousness increases (decreases) or WF decreases (increases), probability of harm to WQ likely increases (decreases), and probability of WQ improvement likely decreases (increases)
Vul-Risk-SusDirect relation between (vul) sensitivity plus (risk) harm with indirect relation to (sus) maintenance of long-term well-beingWhen LC (stressor) increases, e.g., from low to high imperviousness, (vul) sensitivity of WF (receptor) increases, WF probability of harm (risk) likely increases, and probability of WF improvement (res) likely decreases, and (sus) maintenance of long-term WF well-being likely increasesWhen WF (stressor) decreases, WQ (receptor) sensitivity (vul) increases, and WQ probability of harm (risk) likely increases, and WQ probability of improvement (res) likely increases, and maintenance of long-term well-being of WQ (sus) likely increasesWhen LC imperviousness increases (decreases) or WF decreases (increases), probability of harm to WQ likely increases (decreases), and probability of improvement in WQ likely decreases (increases), and (sus) maintenance of long-term WQ well-being likely decreases (increases)
Vul-Res-SusIndirect relation between (vul) sensitivity and (res) improvement and (sus) maintenance of long-term well-beingWhen LC (stressor) increases, e.g., from low to high imperviousness, (vul) sensitivity to WF (receptor) increases, probability of WF improvement (res) likely decreases, but (sus) maintenance of long-term WF well-being might increase or decrease depending on LC type When WF (stressor) decreases, WQ (receptor) sensitivity (vul) increases, and WQ probability of improvement (res) likely increases depending on amount of volume, contingent on LC type (stressor) contributing contaminantsWhen LC imperviousness increases (decreases) or WF decreases (Increases), probability of improvement in WQ likely decreases (increases), and (sus) maintenance of long-term WQ well-being likely decreases (increases)
Risk-Res-SusIndirect relation between (risk) harm and (res) improvement with direct relation between (res) improvement and (sus) maintenance of long-term well-beingWhen LC (stressor) increases, e.g., from low to high imperviousness, (risk) probability of harm to WF (receptor) likely increases, and (res to) improvement decreases, and (sus) maintenance of long-term WF well-being might increase or decrease depending on LC typeWhen WF (stressor) increases, WQ (receptor) probability (of risk) harm increases or decreases depending on LC type, and probability of improvement (res) to WQ increases or decreases depending on LC type, and (sus) maintenance of long-term WQ well-being might increase or decrease depending on LC typeWhen LC imperviousness increases (decreases) and WF increases (decreases), WQ (receptor) probability (of risk) harm increases (decreases), and probability of WQ (res) improvement likely decreases (increases), and (sus) maintenance of long-term WQ well-being likely decreases (increases)
Vul-Risk-Res-Sus
aka VRRSability
Direct relation between (vul) sensitivity and (risk) harm with indirect relation to (res) improvement and (sus) maintenance of long-term well-beingWhen LC (stressor) increases, e.g., from low to high imperviousness, (vul) sensitivity of WF (receptor) increases, WF probability of harm (risk) likely increases, and probability of WF improvement (res) likely decreases, and (sus) maintenance of long-term WF well-being might increase or decrease depending on LC typeWhen WF (stressor) decreases, WQ (receptor) sensitivity (vul) increases, and WQ probability of harm (risk) likely increases, and WQ probability of improvement (res) likely increases, and (sus) maintenance of long-term WQ well-being might increase or decrease depending on LC typeWhen LC imperviousness increases (decreases) or WF decreases (increases), probability of harm to WQ likely increases (decreases), and probability of improvement in WQ likely decreases (increases), and (sus) maintenance of long-term WQ well-being likely decreases (increases)

References

  1. Keenan, P.B.; Jankowski, P. Spatial Decision Support Systems: Three decades on 2020. Decis. Support Syst. 2019, 116, 64–76. [Google Scholar] [CrossRef]
  2. Nyerges, T.; Ballal, H.; Steinitz, C.; Canfield, T.; Roderick, M.; Ritzman, J.; Thanatemaneeratt, W. Geodesign Dynamics for Sustainable Urban Watershed Development. Sustain. Cities Soc. 2016, 25, 13–24. [Google Scholar] [CrossRef]
  3. Gordon, S.N.; Murphy, P.J.; Gallo, J.A.; Huber, P.; Hollander, A.; Edwards, A.; Jankowski, P. People, Projects, Organizations, and Products: Designing a Knowledge Graph to Support Multi-Stakeholder Environmental Planning and Design. ISPRS Int. J. Geo-Inf. 2021, 10, 823. [Google Scholar] [CrossRef]
  4. Nyerges, T.; Roderick, M.; Prager, S.; Bennett, D.; Lam, N. Foundations of sustainability information representation theory: Spatial–temporal dynamics of sustainable systems. Int. J. Geogr. Inf. Sci. 2014, 28, 1165–1185. [Google Scholar] [CrossRef]
  5. Li, Y.; Lin, J.; Li, Y.; Nyerges, T. Developing a Resilience Assessment Framework for the Urban Land-Water System. J. Land Degrad. Dev. 2019, 30, 1107–1120. [Google Scholar] [CrossRef]
  6. Nyerges, T.; Gallo, J.A.; Prager, S.D.; Reynolds, K.M.; Murphy, P.J.; Li, W. Synthesizing Vulnerability, Risk, Resilience, and Sustainability into VRRSability for Improving Geoinformation Decision Support Evaluations. ISPRS Int. J. Geo-Inf. 2021, 10, 179. [Google Scholar] [CrossRef]
  7. Eckart, K.; McPhee, Z.; Bolisetti, T. Performance and implementation of low impact development—A review. Sci. Total Environ. 2017, 607, 413–432. [Google Scholar] [CrossRef]
  8. Li, W. GeoAI: Where machine learning and big data converge in GIScience. J. Spat. Inf. Sci. 2020, 20, 71–77. [Google Scholar] [CrossRef]
  9. Wang, S.; Anselin, L.; Bhaduri, B.; Crosby, C.; Goodchild, M.F.; Liu, Y.; Nyerges, T.L. CyberGIS software: A synthetic review and integration roadmap. Int. J. Geogr. Inf. Sci. 2013, 27, 2122–2145. [Google Scholar] [CrossRef]
  10. Ostrom, E. A general framework for analyzing sustainability of social–ecological systems. Science 2009, 325, 419–422. [Google Scholar] [CrossRef]
  11. Poteete, A.; Janssen, M.; Ostrom, E. Working Together: Collective Action, the Commons, and Multiple Methods in Practice; Princeton University Press: Princeton, NJ, USA, 2010. [Google Scholar]
  12. Nyerges, T.; Jankowski, P. Regional and Urban GIS: A Decision Support Approach; Guilford: New York, NY, USA, 2010. [Google Scholar]
  13. Steinitz, C. A Framework for Geodesign: Changing Geography by Design; Esri Press: Redlands, CA, USA, 2012. [Google Scholar]
  14. Walker, B.H.; Salt, D. Resilience Practice: Building Capacity to Absorb Disturbance and Maintain; Island Press: Washington, DC, USA, 2012. [Google Scholar]
  15. Nyerges, T.; Robkin, M.; Moore, T.J. Geographic Information Systems for Risk Evaluation: Applications in Environmental Health. Cartogr. Geogr. Inf. Syst. 1997, 24, 123–144. [Google Scholar] [CrossRef]
  16. Brooks, N. Vulnerability, Risk and Adaptation: A Conceptual Framework; Tyndall Centre for Climate Change Research, University of East Anglia: Norwich, UK, 2003; p. 21. Available online: https://www.researchgate.net/profile/Nick_Brooks2/publication/200029746_Vulnerability_Risk_and_Adaptation_A_Conceptual_Framework/links/0fcfd50ac169e15865000000.pdf (accessed on 6 January 2020).
  17. Aven, T. A unified framework for risk and vulnerability analysis covering both safety and security. Reliab. Eng. Syst. Saf. 2007, 92, 745–754. [Google Scholar] [CrossRef]
  18. Adger, W.N. Vulnerability. Glob. Environ. Chang. 2006, 16, 268–281. [Google Scholar] [CrossRef]
  19. Gallopin, G. Linkages between vulnerability, resilience, and adaptive capacity. Glob. Environ. Chang. 2006, 16, 293–303. [Google Scholar] [CrossRef]
  20. Manyena, S.B. The concept of resilience revisited. Disasters 2006, 30, 434–450. [Google Scholar] [CrossRef] [PubMed]
  21. Smit, B.; Wandel, J. Adaptation, Adaptive Capacity, and Vulnerability. Glob. Environ. Chang. 2006, 16, 282–292. [Google Scholar] [CrossRef]
  22. Vogel, C.; Moser, S.C.; Kasperson, R.E.; Dabelko, G.D. Linking vulnerability, adaptation, and resilience science to practice: Pathways, players, and partnerships. Glob. Environ. Chang. 2007, 17, 349–364. [Google Scholar] [CrossRef]
  23. Cutter, S.; Barnes, L.; Berry, N.; Burton, C.; Evans, E.; Tate, E.; Webb, J. A place-based model for understanding community resilience to natural disasters. Glob. Environ. Chang. 2008, 18, 598–606. [Google Scholar] [CrossRef]
  24. Lam, N.S.N.; Reams, M.; Li, K.; Li, C.; Mata, L.P. Measuring Community Resilience to Coastal Hazards along the Northern Gulf of Mexico. Nat. Hazards Rev. 2016, 17, 04015013. [Google Scholar] [CrossRef]
  25. Mol, A.P.J. Boundless biofuels—Between environmental sustainability and vulnerability. Sociol. Ruralis. 2007, 47, 297–315. [Google Scholar] [CrossRef]
  26. Linkov, I.; Todd, B.; Felix, C.; Jennifer, D.; Cate, F.-L.; Wolfgang, K.; James, H.L.; Anders, L.; Benoit, M.; Jatin, N.; et al. Miranda Schreurs and Thomas Thiel-Clemen 2014, Changing the resilience paradigm. Nat. Clim. Chang. 2014, 4, 407–409. [Google Scholar] [CrossRef]
  27. Ganin, A.A.; Massaro, E.; Gutfraind, A.; Steen, N.; Keisler, J.M.; Kott, A.; Mangoubi, R.; Linkov, I. Operational resilience: Concepts, design and analysis. Sci. Rep. 2016, 6, 19540. [Google Scholar] [CrossRef]
  28. Schultz, M.T.; Smith, E.R. Assessing the Resilience of Coastal Systems: A Probabilistic Approach. J. Coast. Res. 2016, 29, 1029–1050. [Google Scholar] [CrossRef]
  29. Linkov, I.; Fox-Lent, C.; Read, L.; Allen, C.R.; Arnott, J.C.; Bellini, E.; Coaffee, J.; Florin, M.-V.; Hatfield, K.; Hyde, I.; et al. Tiered Approach to Resilience Assessment. Risk Anal. 2018, 38, 1772–1780. [Google Scholar] [CrossRef] [PubMed]
  30. Thekdi, S.A.; Santos, J. Decision-Making Analytics Using Plural Resilience Parameters for Adaptive Management of Complex Systems. Risk Anal. 2018, 39, 871–889. [Google Scholar] [CrossRef] [PubMed]
  31. Wang, Y.; Zhang, C.; Chen, A.S.; Wang, G.; Fu, G. Exploring the relationship between urban flood risk and resilience at a high-resolution grid cell scale. Sci. Total Environ. 2023, 893, 164852. [Google Scholar] [CrossRef]
  32. Anderson, D.R. The critical importance of sustainability risk management. Risk Manag. 2006, 53, 66–74. Available online: https://rmmagazine.com (accessed on 19 December 2023).
  33. Roper, J. Environmental risk, sustainability discourses, and public relations. Public Relat. Inq. 2012, 1, 69–87. [Google Scholar] [CrossRef]
  34. Tessler, Z.D.; Vörösmarty, C.J.; Grossberg, M. Profiling risk and sustainability in coastal deltas of the world. Science 2015, 349, 638–643. [Google Scholar] [CrossRef]
  35. Taylor, A. Aligning sustainability and risk management. Risk Manag. 2019, 66, 10–11. Available online: https://www.rmmagazine.com/articles/article/2019/11/01/-Aligning-Sustainability-and-Risk-Management- (accessed on 19 December 2023).
  36. Milman, A.; Short, A. Incorporating resilience into sustainability indicators: An example for the urban water sector. Glob. Environ. Chang. 2008, 18, 758–767. [Google Scholar] [CrossRef]
  37. Cumming, G.S. Spatial Resilience in Social-Ecological Systems; Springer: London, UK, 2011. [Google Scholar]
  38. Cumming, G.S. Spatial resilience: Integrating landscape ecology, resilience, and sustainability. Landsc. Ecol. 2011, 26, 899–909. [Google Scholar] [CrossRef]
  39. Nelson, P.P.; Sterling, R.L. Sustainability and resilience of underground urban infrastructure: New approaches to metrics and formalism. In GeoCongress 2012; ASCE: Reston, VA, USA, 2012; pp. 3199–3208. Available online: https://ascelibrary.org/doi/abs/10.1061/9780784412121.327 (accessed on 19 December 2023).
  40. Rodriguez-Nikl, T. Linking disaster resilience and sustainability. Civ. Eng. Environ. Syst. 2015, 32, 157–169. [Google Scholar] [CrossRef]
  41. Redman, C.L. Should Sustainability and Resilience Be Combined or Remain Distinct Pursuits? Ecol. Soc. 2014, 19, 37. [Google Scholar] [CrossRef]
  42. Minsker, B.; Baldwin, L.; Crittenden, J.; Kabbes, K.; Karamouz, M.; Lansey, K.; Malinnowski, P.; Nzewi, E.; Pandit, A.; Parker, J.; et al. Progress and Recommendations for Advancing Performance-Based Sustainable and Resilient Infrastructure Design. J. Water Resour. Plan. Manag. 2015, 141, A4015006. [Google Scholar] [CrossRef]
  43. Berkes, F. Social-Ecological Systems, Resilience, and Collaborative Learning. Sustainability 2017, 9, 1232. [Google Scholar] [CrossRef]
  44. Upadhyaya, J.K.; Biswas, N.; Tam, E.K.L. Managing for Change: Integrating Functionality, Resiliency, and Sustainability for Stormwater Infrastructure Assessment. J. Infrastruct. Syst. 2018, 24, 04018007. [Google Scholar] [CrossRef]
  45. Sun, Y.; Garrido-Baserba, M.; Molinos-Senante, M.; Donikian, N.A.; Poch, M.; Rosso, D. A composite indicator approach to assess the sustainability and resilience of wastewater management alternatives. Sci. Total Environ. 2020, 725, 138286. [Google Scholar] [CrossRef]
  46. Bruneau, M.; Chang, S.E.; Eguchi, R.T.; Lee, G.C.; O’Rourke, T.D.; Reinhorn, A.M.; Shinozuka, M.; Tierney, K.; Wallace, W.A.; von Winterfeldt, D. A Framework to quantitatively assess and enhance the seismic resilience of communities. Earthq. Spectra 2003, 19, 733–752. [Google Scholar] [CrossRef]
  47. Eakin, H.; Luers, A.L. Assessing the Vulnerability of Social-Environmental Systems. Annu. Rev. Environ. Resour. 2006, 31, 365–394. [Google Scholar] [CrossRef]
  48. Haimes, Y. On the Definition of Resilience in Systems. Risk Anal. 2009, 29, 498–501. [Google Scholar] [CrossRef] [PubMed]
  49. Haimes, Y. On the Complex Definition of Risk: A Systems-Based Approach. Risk Anal. 2009, 29, 1647–1654. [Google Scholar] [CrossRef] [PubMed]
  50. Aven, T. On Some Recent Definitions and Analysis Frameworks for Risk, Vulnerability, and Resilience. Risk Anal. 2011, 31, 515–522. [Google Scholar] [CrossRef] [PubMed]
  51. Birkmann, J.; Cardona, D.O.; Carreno, M.L.; Barbat, A.H.; Pelling, M.; Schneiderbauer, S.; Kienberger, S.; Keiler, M.; Alexander, D.; Zeil, P.; et al. Framing vulnerability, risk and societal responses: The MOVE framework. Nat. Hazards 2013, 67, 193–211. [Google Scholar] [CrossRef]
  52. Gheorghe, A.V. Risks, vulnerability, sustainability and governance: A new landscape for critical infrastructures. Int. J. Crit. Infrastruct. 2004, 1, 118–124. [Google Scholar] [CrossRef]
  53. Hay, J.; Mimura, N. Supporting climate change vulnerability and adaptation assessments in the Asia-Pacific region: An example of sustainability science. Sustain. Sci. 2006, 1, 23–35. [Google Scholar] [CrossRef]
  54. Pelling, M. Measuring urban vulnerability to natural disaster risk benchmarks for sustainability. Open House Int. 2006, 31, 125–132. [Google Scholar] [CrossRef]
  55. Fedeski, M.; Gwilliam, J. Urban sustainability in the presence of flood and geological hazards: The development of a GIS-based vulnerability and risk assessment methodology. Landsc. Urban Plan. 2007, 83, 50–61. [Google Scholar] [CrossRef]
  56. Folke, C.; Carpenter, S.; Elmqvist, T.; Gunderson, L.; Holling, C.S.; Walker, B. Resilience and Sustainable Development: Building Adaptive Capacity in a World of Transformations. Ambio 2002, 31, 437–440. [Google Scholar] [CrossRef]
  57. Turner, B.L., II; Kasperson, R.E.; Matson, P.A.; McCarthy, J.J.; Corell, R.W.; Christensen, L.; Eckley, N.; Kasperson, J.X.; Luers, A.; Martello, M.L.; et al. A framework for vulnerability analysis in sustainability science. Proc. Natl. Acad. Sci. USA 2003, 100, 8074–8079. [Google Scholar] [CrossRef]
  58. Turner, B.L., II. Vulnerability and Resilience: Coalescing or Parallel Approaches for Sustainability Science? Glob. Environ. Chang. 2010, 20, 570–576. [Google Scholar] [CrossRef]
  59. Tompkins, E.L.; Adger, W.N. Does Adaptive Management of Natural Resources Enhance Resilience to Climate Change? Ecol. Soc. 2004, 9, 10. [Google Scholar] [CrossRef]
  60. Blackmore, J.M.; Plant, R.A.J. Risk and Resilience to Enhance Sustainability with Application to Urban Water Systems. J. Water Resour. Plan. Manag. 2008, 134, 224–233. [Google Scholar] [CrossRef]
  61. Coaffee, J. Risk, resilience, and environmentally sustainable cities. Energy Policy 2008, 36, 4633–4638. [Google Scholar] [CrossRef]
  62. White, I. Water and the City: Risk, Resilience and Planning for a Sustainable Future; Routledge: London, UK, 2010. [Google Scholar]
  63. McLellan, B.; Zhang, Q.; Farzaneh, H.; Utama, N.A.; Ishihara, K.N. Resilience, Sustainability and Risk Management: A Focus on Energy. Challenges 2012, 3, 153–182. [Google Scholar] [CrossRef]
  64. Bocchini, P.; Frangopol, D.M.; Ummenhofer, T.; Zinke, T. Resilience and Sustainability of Civil Infrastructure: Toward a Unified Approach. J. Infrastruct. Syst. 2014, 20, 04014004. [Google Scholar] [CrossRef]
  65. Lounis, Z.; McAllister, T.P. Risk-Based Decision Making for Sustainable and Resilient Infrastructure Systems. J. Struct. Eng. 2016, 142, F4016005. [Google Scholar] [CrossRef]
  66. Uda, M.; Kennedy, C. Evaluating the Resilience of Sustainable Neighborhoods by Exposing LEED Neighborhoods to Future Risks. J. Infrastruct. Syst. 2018, 24, 4. [Google Scholar] [CrossRef]
  67. Tobin, G.A. Sustainability and community resilience: The holy grail of hazards planning? Glob. Environ. Chang. Part B Environ. 1999, 1, 13–25. [Google Scholar] [CrossRef]
  68. Kjeldsen, T.R.; Rosbjerg, D. Choice of reliability, resilience and vulnerability estimators for risk assessments of water resources systems. Hydrol. Sci. J. 2004, 49, 767. [Google Scholar] [CrossRef]
  69. Birkmann, J. Measuring vulnerability to promote disaster-resilient societies: Conceptual frameworks and definitions. In Measuring Vulnerability to Natural Hazards: Towards Disaster Resilient Societies; Birkmann, J., Ed.; United Nations University Press: Tokyo, Japan, 2006; pp. 9–54. [Google Scholar]
  70. Baker, S.M. Vulnerability and Resilience in Natural Disasters: A Marketing and Public Policy Perspective. J. Public Policy Mark. 2009, 28, 114–123. [Google Scholar] [CrossRef]
  71. Miller, F.; Osbahr, H.; Boyd, E.; Thomalla, F.; Bharwani, S.; Ziervogel, G.; Walker, B.; Birkmann, J.; van der Leeuw, S.; Rockström, J.; et al. Resilience and vulnerability: Complementary or conflicting concepts? Ecol. Soc. 2010, 15, 11. Available online: https://www.ecologyandsociety.org/vol15/iss3/art11/ (accessed on 19 November 2023). [CrossRef]
  72. Romero-Lankao, P.; Dodman, D. Cities in transition: Transforming urban centers from hotbeds of GHG emissions and vulnerability to seedbeds of sustainability and resilience. Curr. Opin. Environ. Sustain. 2011, 3, 113–120. [Google Scholar] [CrossRef]
  73. Kasperson, R.E.; Renn, O.; Slovic, P.; Brown, H.S.; Emel, J.; Goble, R.; Kasperson, J.X.; Ratick, S. The social amplification of risk: A conceptual framework. Risk Anal. 1988, 8, 177–187. [Google Scholar] [CrossRef]
  74. Stanley, S.; Grigsby, S.; Booth, D.; Hartley, D.; Horner, R.; Hruby, T.; Thomas, J.; Bissonnette, P.; Fuerstenberg, R.; Lee, J.; et al. Puget Sound Characterization-Volume 1: The Water Resource Assessments (Water Flow and Water Quality). 2015. Available online: https://fortress.wa.gov/ecy/publications/SummaryPages/1106016.html (accessed on 12 September 2023).
  75. WA Ecology Puget Sound Watershed Characterization Website. Available online: https://apps.ecology.wa.gov/coastalatlas/wc/landingpage.html (accessed on 12 September 2023).
  76. Adhikari, A.D. Technology Integration in ELT: SWOC Analysis; An Analysis of Strengths, Weaknesses, Opportunities and Challenges of Technology Integration in ELT. 2023, p. b39. Available online: https://ijcrt.org/papers/IJCRT2301130.pdf (accessed on 28 January 2024).
  77. Fan, L.; Li, L.; Ma, Z.; Lee, S.; Yu, H.; Hemphill, L. A Bibliometric Review of Large Language Models Research from 2017 to 2023. Available online: https://arxiv.org/ftp/arxiv/papers/2304/2304.02020.pdf (accessed on 13 December 2023).
  78. Jin, B.; Liu, G.; Han, C.; Jiang, M.; Ji, H.; Han, J. Large language models on graphs: A comprehensive survey. J. Latex Class Files 2021, 14, 1. Available online: https://arxiv.org/pdf/2312.02783.pdf (accessed on 13 December 2023).
  79. Burks, A.W. Peirce’s Theory of Abduction. Philos. Sci. 1946, 13, 301–306. Available online: http://www.jstor.org/stable/185210 (accessed on 25 November 2023). [CrossRef]
  80. Mortaheb, R.; Jankowski, P. Smart City re-imagined: City Planning and GeoAI in the age of big data. J. Urban Manag. 2023, 12, 4–15. [Google Scholar] [CrossRef]
  81. Agrawal, G.; Kumarage, T.; Alghami, Z.; Liu, H. Can knowledge graphs reduce hallucinations in LLMs? A Survey. arXiv 2023, arXiv:2311.07914. Available online: https://arxiv.org/pdf/2311.07914.pdf (accessed on 13 December 2023).
  82. Ni, J.; Bingler, J.; Colesanti-Senni, C.; Kraus, M.; Gostlow, G.; Schimanski, T.; Stammbach, D.; Vaghefi, S.A.; Wang, Q.; Webersinke, N.; et al. CHATREPORT: Democratizing Sustainability Disclosure Analysis through LLM-Based Tools. arXiv 2023, arXiv:2307.15770. Available online: https://arxiv.org/abs/2307.15770 (accessed on 13 December 2023).
  83. Zhang, A.; Walker, O.; Nguyen, K.; Dai, J.; Chen, A.; Lee, M.K. Deliberating with AI: Improving decision-making for the future through participatory AI-design and stakeholder deliberation. Proc. ACM Hum.-Comp. Interact. 2023, 7, 1–32. [Google Scholar] [CrossRef]
  84. Wang, L.; Ma, C.; Feng, X.; Zhang, Z.; Yang, H.; Zhang, J.; Chen, Z.; Tang, J.; Chen, X.; Lin, Y.; et al. A Survey on Large Language Model based Autonomous Agents. arXiv 2023, arXiv:2308. Available online: https://arxiv.org/abs/2308 (accessed on 13 December 2023).
  85. Duan, Y. Bridging the gap between purpose-driven frameworks and artificial general intelligence. Appl. Sci. 2023, 13, 10747. [Google Scholar] [CrossRef]
Figure 1. Synthesizing vulnerability (Vul), risk (Risk), resilience (Res), and sustainability (sus) in a Venn diagram shows nine of eleven combinations of concepts; Vul-Res and Risk-Sus cannot be depicted when using four concept circles in this manner, as a third concept Sus for Vul-Res, and Res for Vul should be included with Risk-Sus.
Ijgi 13 00067 g001
Figure 2. V-R-R-S Venn diagram depicting commonalty among vulnerability, risk, resilience and sustainability using adjectival precedence to describe concepts.
Ijgi 13 00067 g002
Figure 3. VRRSability conceptual framework for synthesizing perspectives on vulnerability, risk, resilience, and sustainability about human–environment, social–ecological and natural–human systems.
Ijgi 13 00067 g003
Figure 4. Functional performance levels regarding the V-R-R-S time points of an event.
Ijgi 13 00067 g004
Figure 5. Four functional profiles between a stressor (controlling) variable and a receptor variable of change) demonstrating dose–response sensitivity thresholds, also called tipping points (based on diagrams in [14]).
Ijgi 13 00067 g005
Figure 6. Different scenario conditions commonly associated with different functional performance curve shapes (adapted after [26]).
Ijgi 13 00067 g006
Figure 7. VRRSability of water flow (WF) and water quality (WQ) functional performance influenced by land-use land-cover (LULC) imperviousness. Letters a-l are V-R-R-S component labels.
Ijgi 13 00067 g007
Figure 8. VRRSability dimensional (V-R-R-S) concepts depicting complementary and inverse relationships.
Ijgi 13 00067 g008
Table 1. VRRSability components detailed as measurable variables. Italics signifies the best elucidation of a measurable variable relative to other expressions in the row, and thus the basis of entry in the VRRSability column at right side of table.
V-R-R-S Components (Letter Labels Precede Text Narrative)Vulnerability
Components 1:
a,b,e,f,g,h,k,l,m
Risk
Components 1:
a,b,c,e,f,g,h,k,l,m
Resilience
Components 1:
a,b,d,e,f,g,h,i,j,k,l,m
Sustainability
Components 1:
a,b,c,d,e,f,g,h,k,l,m
VRRSability Components 1:
a,b,c,d,e,f,g,h,i,j,k,l,m
abcde: Identification of systems, e.g., social–ecological, coupled human–environment, coupled natural–humanCollections of abcde for broadly characterizing i←→jIndividual a values for specifically characterizing i←→jCollections of abcde for specifically characterizing i←→jCollections of abcde for broadly characterizing i←→jIndividual a values and collections of abcde for specifically characterizing i←→j
a1: Stressors/hazards/disturbances as controlling variablesImpervious land acreage % impervious land acreage% impervious land acreageImpervious land acreage% impervious land acreage
a2: Fast versus slow change variables regarding receptor functional performanceWater and ecosystem acreage and degradationWater and ecosystem acreage and degradation %Water and ecosystem acreage and degradation %Water and ecosystem acreage and degradationWater and ecosystem acreage and degradation %
b1: Exposure relationship(s) between elements Nominal units of change% change% changeNominal unit change% change
b2: Event occurrence(s)Ordinal magnitude of rainfall and infiltration occurrencesFrequency of rainfall and infiltration occurrencesFrequency of rainfall and infiltration occurrencesGeneral count of rainfall and infiltration occurrencesFrequency of rainfall and infiltration occurrences
c: Dose–response thresholdNormally not considered Acreage of % impervious; % percolation over time; water degradation %Not commonly measuredLumped amount of acreage, imperviousness, and percolation over time; water degradation %Acreage of % impervious; % percolation over time; water degradation %
d1: Management action and capacity to actNot commonly included Mgt action to decrease degradation Mgt action to increase infiltration Mgt action to increase infiltration and/or decrease degradationMgt action to increase infiltration and/or decrease degradation
d2: Agency for taking actionNominal identification of agency if specified at all Mission and custodianship of problem not generally specifiedFed, state, local mission and custodianship to address degradation and infiltration problemFed, state, local mission and amount of custodianship of % degradation and % infiltration problemFed, state, local mission and amount of custodianship of % degradation and % infiltration problem
d3: Empowerment of social group(s) to address conditionsInvolve stakeholder groups for general value-laden conditions influencing degradation and/or infiltrationInvolve stakeholder groups for specific value-laden conditions influencing degradation and/or infiltrationInvolve stakeholder groups for specific value-laden conditions influencing degradation and/or infiltrationInvolve stakeholder groups for general value-laden conditions influencing degradation and/or infiltrationInvolve stakeholder groups for specific and general value-laden conditions influencing degradation and/or infiltration
e1: Impact/harm reduction/benefit improvement Impact reduction ecosystem(s) and/or land acreagesHarm reduction per ecosystem(s) and/or land acreagesBenefit improvement per ecosystem(s) and/or land acreagesMaintenance per ecosystem(s) and/or land acreagesHarm, benefit improvement, and maintenance per ecosystem(s) and/or land acreages
e2: Decision trade-offs and prioritiesOrdinal impact characterization of prioritized trade-offs Reduction in degradation harm traded-off in prioritized dimensions of decision objectivesImprovement of infiltration benefit trade-offs from prioritized actions about decision objectivesMaintain infiltration using prioritized actions about decision objectivesBenefits from reduction, improvement, maintenance in X amount gained/lost due to mgt prioritized actions about decision objectives
e3: Transformation as long-term structural changePotential influence on ecosystem sensitivity and/or land changes over the long term, sometimes irreversibleProbable harm to ecosystems and/or land changes over the long termImprovement of ecosystems and/or land over the long termMaintaining ecosystems and/or land functional performance enhanced over the long termNet change in sensitivity, (irreversible) harm, improvement and/or well-being of land and/or ecosystems over the long term
f: ScenariosGeneral study area conditions, e.g., social, economic, and environmental climateSpecific study area conditions, e.g., temp, population, income, and water flow and qualityGeneral study area conditions, e.g., social, economic, and environmental climateGeneral study area conditions, e.g., social, economic, and environmental climateSpecific and/or general study area conditions
g: Spatial, temporal, attribute scaleStudy area space, time, attribute plus general micro, meso, macro scaleStudy area space, time, attribute plus specific micro, meso, macro scaleStudy area space, time, attribute plus general micro, meso, macro scaleStudy area space, time and attribute plus specific and/or general micro, meso, macro scaleStudy area space, time and attributes plus specific and/or general micro, meso, macro scale
h: Levels of resolution for units of analysisArea acreageParcel (acreage)Parcel (acreage)Area acreageArea(s), parcel(s), and acreage
i: FeedbackFeedback to receptor sensitivityFeedback to probability of harmFeedback to stressor disturbanceConsistent feedback to land–water or water–land over the long termFeedback to all influences (sensitivity, harm, improvement and maintenance) relating land–water or water–land
j: Alternate stable statesSignificant change to be more/less sensitive in the context of scenariosSignificant change to be more/less probably harmed in the context of scenariosSignificant change to be more/less improved in the context of scenariosSignificant change to be more/less maintained in the context of scenariosSignificant change to be more/less harmed, improved, maintained in the context of scenarios
k: Social learning about VRRSability conditionsPeople within stakeholder groups learning about relationships, and general conditions of sensitivityPeople within stakeholder groups learning about relationships, and specific conditions of harmPeople within stakeholder groups learning about relationships, and specific conditions of improvementPeople within stakeholder groups learning about relationships, and general conditions of well-beingPeople within stakeholder groups learning about relationships and specific and/or general conditions of harm, improvement and/or well-being
l: Knowledge systems about VRRSability conditionsKnowledge focuses on stressors and sensitivity of receptor performanceKnowledge focuses on stressors and probability of harm to receptor performance Knowledge focuses on stressors and probability of improvement in receptor performanceKnowledge focuses on stressors and maintenance of receptor performance Knowledge focused on stressors and related sensitivity, harm, improvement and well-being to receptor performance over the long term
m: Operational implementationImplement all within this columnImplement all within this columnImplement all within this columnImplement all within this columnImplement all within this column
1 Components are described in terms of GSI sub-components for the respective V-R-R-S concepts.
Table 2. Conceptual frameworks across vulnerability, risk, resilience, and sustainability.
Domain AddressedInformation Structures 1Published Articles, Books, Reports Associated with Specific Information Structures Listed in Column 2
Vul-RiskM,B,T,N[15] Nyerges, Robkin and Moore 1997
O,T,N[16] Brooks 2003
O,N[17]+ Aven 2007
Vul-ResT,N[18] Adger 2006
B,N[19]+ Gallopin 2006
T,N[20] Manyena 2006
B,V,N[21] Smit and Wandel 2006
B,N[22] Vogel et~al., 2007
V,B,T,N[23] Cutter et~al., 2008
O,B,V,M,T,N[24]+ Lam et~al., 2016
Vul-SusG,T,N[25] Mol 2007
O,G,M,B,T,N[2] Nyerges et~al., 2016
Risk-ResG,N[26]+ Linkov et~al., 2014
O,G,N[27] Ganin et~al., 2016
T,N[28] Schultz and Smith 2016
B, T, N[29]+ Linkov et~al., 2018
O,G,B,T,N[30] Thekdi and Santos 2018
O,G,M,T,N[31] Wang et~al., 2023
Risk-SusN[32] Anderson 2006
N[33] Roper 2012
G,M[34] Tessler et~al., 2015
N[35] Taylor 2019
Res-SusT,N[36] Milman and Short 2008
O,G,M,B,T,N[37,38]+ Cumming 2011a,b
B,G,N[39] Nelson and Sterling 2012
B,G,N[40] Rodriguez-Nikl et~al., 2014
T.N[41] Redman 2014
T,N[42] Minsker et~al., 2015
N[43] Berkes 2017
B,V,T[44] Upadhyaya, Biswas, and Tam 2018
O,G,T,N[45] Sun et~al., 2020
Vul-Risk-ResO,G,B,T[46]+ Bruneau et~al., 2003
T,N[47] Eakin and Luers 2006
T,N[48,49]+ Haimes 2009a,b
O,B,N[50] Aven 2011
B,T,N[51]+ Birkmann et~al., 2013
Vul-Risk-SusN[52] Gheorghe 2004
G,T[53] Hay and Mimura 2006
N,T[54] Pelling 2006
M,B,T[55] Fedeski and Gwilliam 2007
Vul-Res-SusT,N[56] Folke et~al., 2002
B,N[57,58]+ Turner et~al., 2003, Turner 2010
T,N[59] Tompkins and Adger 2004
Risk-Res-SusG,B,T,N[60] Blackmore and Plant 2008
T,N[61] Coaffee 2008
T,N[62] White 2010
B,T,N[63] McLellan et~al., 2012
O,G,B,T,N[64]+ Bocchini et~al., 2014
O,G,B,T,N[65] Lounis and McAllister 2016
T,N+[66] Uda and Kennedy 2018
Vul-Risk-Res-SusB,N[67] Tobin 1999
O,G,T,N[68] Kjeldsen and Rosbjerg 2004
B,V,N[69]+ Birkmann 2006
T,N[70] Baker 2009
T,N[71]+ Miller et~al., 2010
N[72] Romero-Lankao and Dodman 2011
1 Legend: Information structures listed in order of most to least relationally robust. O: Operational expression. G: Graph (between 2 variables) diagram. M: Map display. B: Box-relation diagram. V: Venn diagram. T: Table list of enumerated characteristics. N: Narrative. + Particularly useful publication for conceptualizing relations.
Table 3. VRRSability components compared and contrasted from selected conceptual frameworks.
 
 
Reference Source:
Five Most Salient Conceptual Frameworks Depicted as Box–Relation Diagrams Characterizing Combinations of Two or Three V-R-R-S Concepts as Listed Below 1
Turner et al. [57]Birkmann [69]Birkmann et al. [51]Lam et al. [24]Linkov et al. [29]
Conceptual Components for:
Vulnerability
Risk
Resilience
Sustainability
 
Vulnerability
 
Resilience
Sustainability
 
Vulnerability
Risk
 
Sustainability
 
Vulnerability
Risk
Adaptation
 
Vulnerability
 
Adaptation
 
 
Risk
Resilience
Identity of social–ecological (coupled human–environment and coupled natural–human) systems (abcde)Human–environment conditions of a systemNatural phenomena; hazard; exposed and vulnerable elementsEnvironments contain hazards and society interaction couplingSocial (community) and ecological (hurricane) system interactionComplex social–ecological–technical systems
Stressors/hazards/disturbances (controlling variables) (a1)Interactions of hazards; human influence outside place; environmental influence outside placeElements; hazardHazards as natural events and socio-natural eventsHazardsHazards
Change (receptor) variables regarding functional performance (fast versus slow change) (a2)Variability and change in human conditionsElements within environmental, social, and economic spheres Society and multiple scales of communityCommunity variablesFunctional performance condition outcomes
Exposure relationship(s) between elements (b1)Exposure within vulnerabilityExposure within vulnerabilitySpatial–temporal exposure within vulnerabilityExposure and damage linked through vulnerabilityPresumed to be within risk
Event occurrence(s) (b2) Hazard event occurrencesNatural events and socio-natural event occurrences
Dose–response Threshold (c1)Sensitivity Acceptability of thresholds at local and global scales
Management action and capacity to act (d1)Place-based adjustment and adaptation/response; place-based copingIntervention system; coping capacityRisk reduction plus adaptation as hazard intervention and vulnerability intervention; capacities for anticipation, coping and recoveryRecovery as adaptation and
mitigation
Intervention options
Agency for taking action (d2) Risk governance Local government
Empowerment of social group(s) to address conditions (d3) SocietySocial group empowerment described using geodemographic variables
Impact/influence reduction/improvement (e1)Consequences, impact/responsesRisk reduction/resilience improvementRisk reductionVulnerability reductionRisk reduction; resilience improvement
Decision trade-offs and priorities (e2) About intervention systems and functional performance Decision priorities
Transformation as long-term structural change (e3) Many cycles involved in sustainable development Multiple cycles
Scenarios (f)Collection of human and environmental conditions at spatial–temporal scalesCollection of sphere conditionsCollection of dimensions at spatial–temporal scales Tier 3 scenarios
Spatial, temporal, attribute scale (g)Spatial, functional, temporal dimensions at place, region, world scales Local, sub-national, national, internationalCounty scale for space, yearly for timeMultiple scales
Levels of resolution for units of analysis (h)Conditions within place, region, and global scalesElements in more detail; environmental, social economic spheresSusceptibility and fragility of physical, ecological, social, economic, cultural, institutional conditionsStorm frequency, county community variablesMultiple resolution units considered, but not explicit
Feedback (i) Feedback Adaptation and mitigation
Alternate stable states (j) Alternate conditions that create stable states
Social learning about VRRSability conditions (k)
Knowledge systems characterize VRRSability conditions (l)
Operationalization, implementation (m) Tools and measurement are keyImplementation case studySeveral tools called out
1 Boldface entries for rows signify explicit consideration for inclusion in the conceptual framework synthesis. Letters (a–m) label the conceptual components as in Table 1. Numbers indicate sub-components.
Table 4. V-R-R-S component relationships for land cover (LC), water flow (WF), and water quality (WQ) 1.
V-R-R-S ConceptsLC → WF → WQ FocusLC → WF Functional Performance RelationshipWF → WQ Functional Performance RelationshipLC → WF → WQ Functional Performance Relationship
VulnerabilitySensitivity of WF to LC type; sensitivity of WQ to WF Land-cover (LC)-type imperviousness and contamination of WFWF in acre-feet and WQ contamination in ppm in relation to standardPotential WQ ppm in relation to WF range in relation to LC imperviousness over space–time
RiskProbability of harm to WF from LC-type imperviousness; probability of harm to WQ from WFProbability that LC type leaches contamination into WF due to imperviousnessProbability that WF column releases WQ contamination in ppmProbability of WQ harm at WF levels of probability in relation to LC imperviousness over space-time
ResilienceWF improvement based on LC improvement; WQ improvement based on WF improvement Probability of LC improvement that can influence WF improvementProbability that WF and WQ can improve in relation to standardsProbability of WQ improvement at WF levels of probability in relation to LC imperviousness over space–time
SustainabilityMaintain long-term well-being of LC, WF, and WQMaintain long-term achievement of LC for low impact to WFProbability that WF and WQ stay above standard over the long termWF and WQ cumulative performance over space–time in relation to LC imperviousness over space and long–term time
1 Boldface entries indicate emphases of the V-R-R-S concepts.
Table 5. Summary of V-R-R-S binary, ternary, and quaternary relations for undergirding functional relationships among land cover (LC), water flow (WF), and water quality (WQ). Appendix A Table A1 offers a fully expanded version of Table 5.
V-R-R-S RelationsRelationship as a Basis for Trade-Off between V-R-R-S ConceptsLC → WF → WQ Functional Relationship, Abbreviated as LC → WQ
Vul-RiskDirect relation between receptor (vul) sensitivity and (risk of) harm to receptor. When LC imperviousness increases (decreases) or WF decreases (increases), probability of harm to WQ likely increases (decreases)
Vul-ResIndirect relation between receptor (vul) sensitivity and (res of) improvement of receptor. When LC imperviousness increases (decreases) or WF decreases (increases), probability of improvement in WQ likely decreases (increases)
Vul-SusIndirect relation between (vul) sensitivity and (sus) maintenance of long-term well-beingWhen LC imperviousness increases (decreases) or WF decreases (increases), maintenance of long-term well-being of WQ likely decreases (increases)
Risk-ResIndirect relation between (risk of) harm and (res of) improvementWhen LC imperviousness increases (decreases) and WF increases (decreases), WQ (receptor) probability (of risk) harm increases (decreases), and probability of WQ (res) improvement likely decreases (increases)
Risk-SusIndirect relation between (risk of) harm and (sus) maintenance of long-term well-beingWhen LC imperviousness increases (decreases) and WF increases (decreases), WQ (receptor) probability (of risk) harm increases (decreases), and maintenance of long-term well-being decreases (increases)
Res-SusDirect relation between (res) probability of improvement and (sus) maintenance of long-term well-beingWhen LC imperviousness increases (decreases) and WF increases (decreases), probability of WQ improvement likely decreases (increases), and (sus) maintenance of long-term WQ well-being likely decreases (increases)
Vul-Risk-ResDirect relation between (vul) sensitivity plus (risk) harm with indirect relation to (res) improvementWhen LC imperviousness increases (decreases) or WF decreases (increases), probability of harm to WQ likely increases (decreases), and probability of improvement in WQ likely decreases (increases)
Vul-Risk-SusDirect relation between (vul) sensitivity plus (risk) harm with indirect relation to (sus) maintenance of long-term well-beingWhen LC imperviousness increases (decreases) or WF decreases (increases), probability of harm to WQ likely increases (decreases), and probability of improvement in WQ likely decreases (increases), and (sus) maintenance of long-term WQ well-being likely decreases (increases)
Vul-Res-SusIndirect relation between (vul) sensitivity and (res) improvement and (sus) maintenance of long-term well-beingWhen LC imperviousness increases (decreases) or WF decreases (increases), probability of improvement in WQ likely decreases (increases), and (sus) maintenance of long-term WQ well-being likely decreases (increases)
Risk-Res-SusIndirect relation between (risk) harm and (res) improvement with direct relation between (res) improvement and (sus) maintenance of long-term well-beingWhen LC imperviousness increases (decreases) and WF increases (decreases), WQ (receptor) probability (of risk) harm increases (decreases), and probability of WQ (res) improvement likely decreases (increases), and (sus) maintenance of long-term WQ well-being likely decreases (increases)
Vul-Risk-Res-Sus
aka VRRSability
Direct relation between (vul) sensitivity and (risk) harm with indirect relation to (res) improvement and (sus) maintenance of long-term well-beingWhen LC imperviousness increases (decreases) or WF decreases (increases), probability of harm to WQ likely increases (decreases), and probability of improvement in WQ likely decreases (increases), and (sus) maintenance of long-term WQ well-being likely decreases (increases)
Disclaimer/Publisher’s Note: The statements, opinions and data contained in all publications are solely those of the individual author(s) and contributor(s) and not of MDPI and/or the editor(s). MDPI and/or the editor(s) disclaim responsibility for any injury to people or property resulting from any ideas, methods, instructions or products referred to in the content.

