

Preserving Spatial Patterns in Point Data: A Generalization Approach Using Agent-Based Modeling


Abstract
1. Introduction
2. Related Work
2.1. Point Generalization
2.2. Preserving Spatial Patterns
2.3. Agent-Based Modeling in Map Generalization
3. Method
3.1. Definition of Constraints
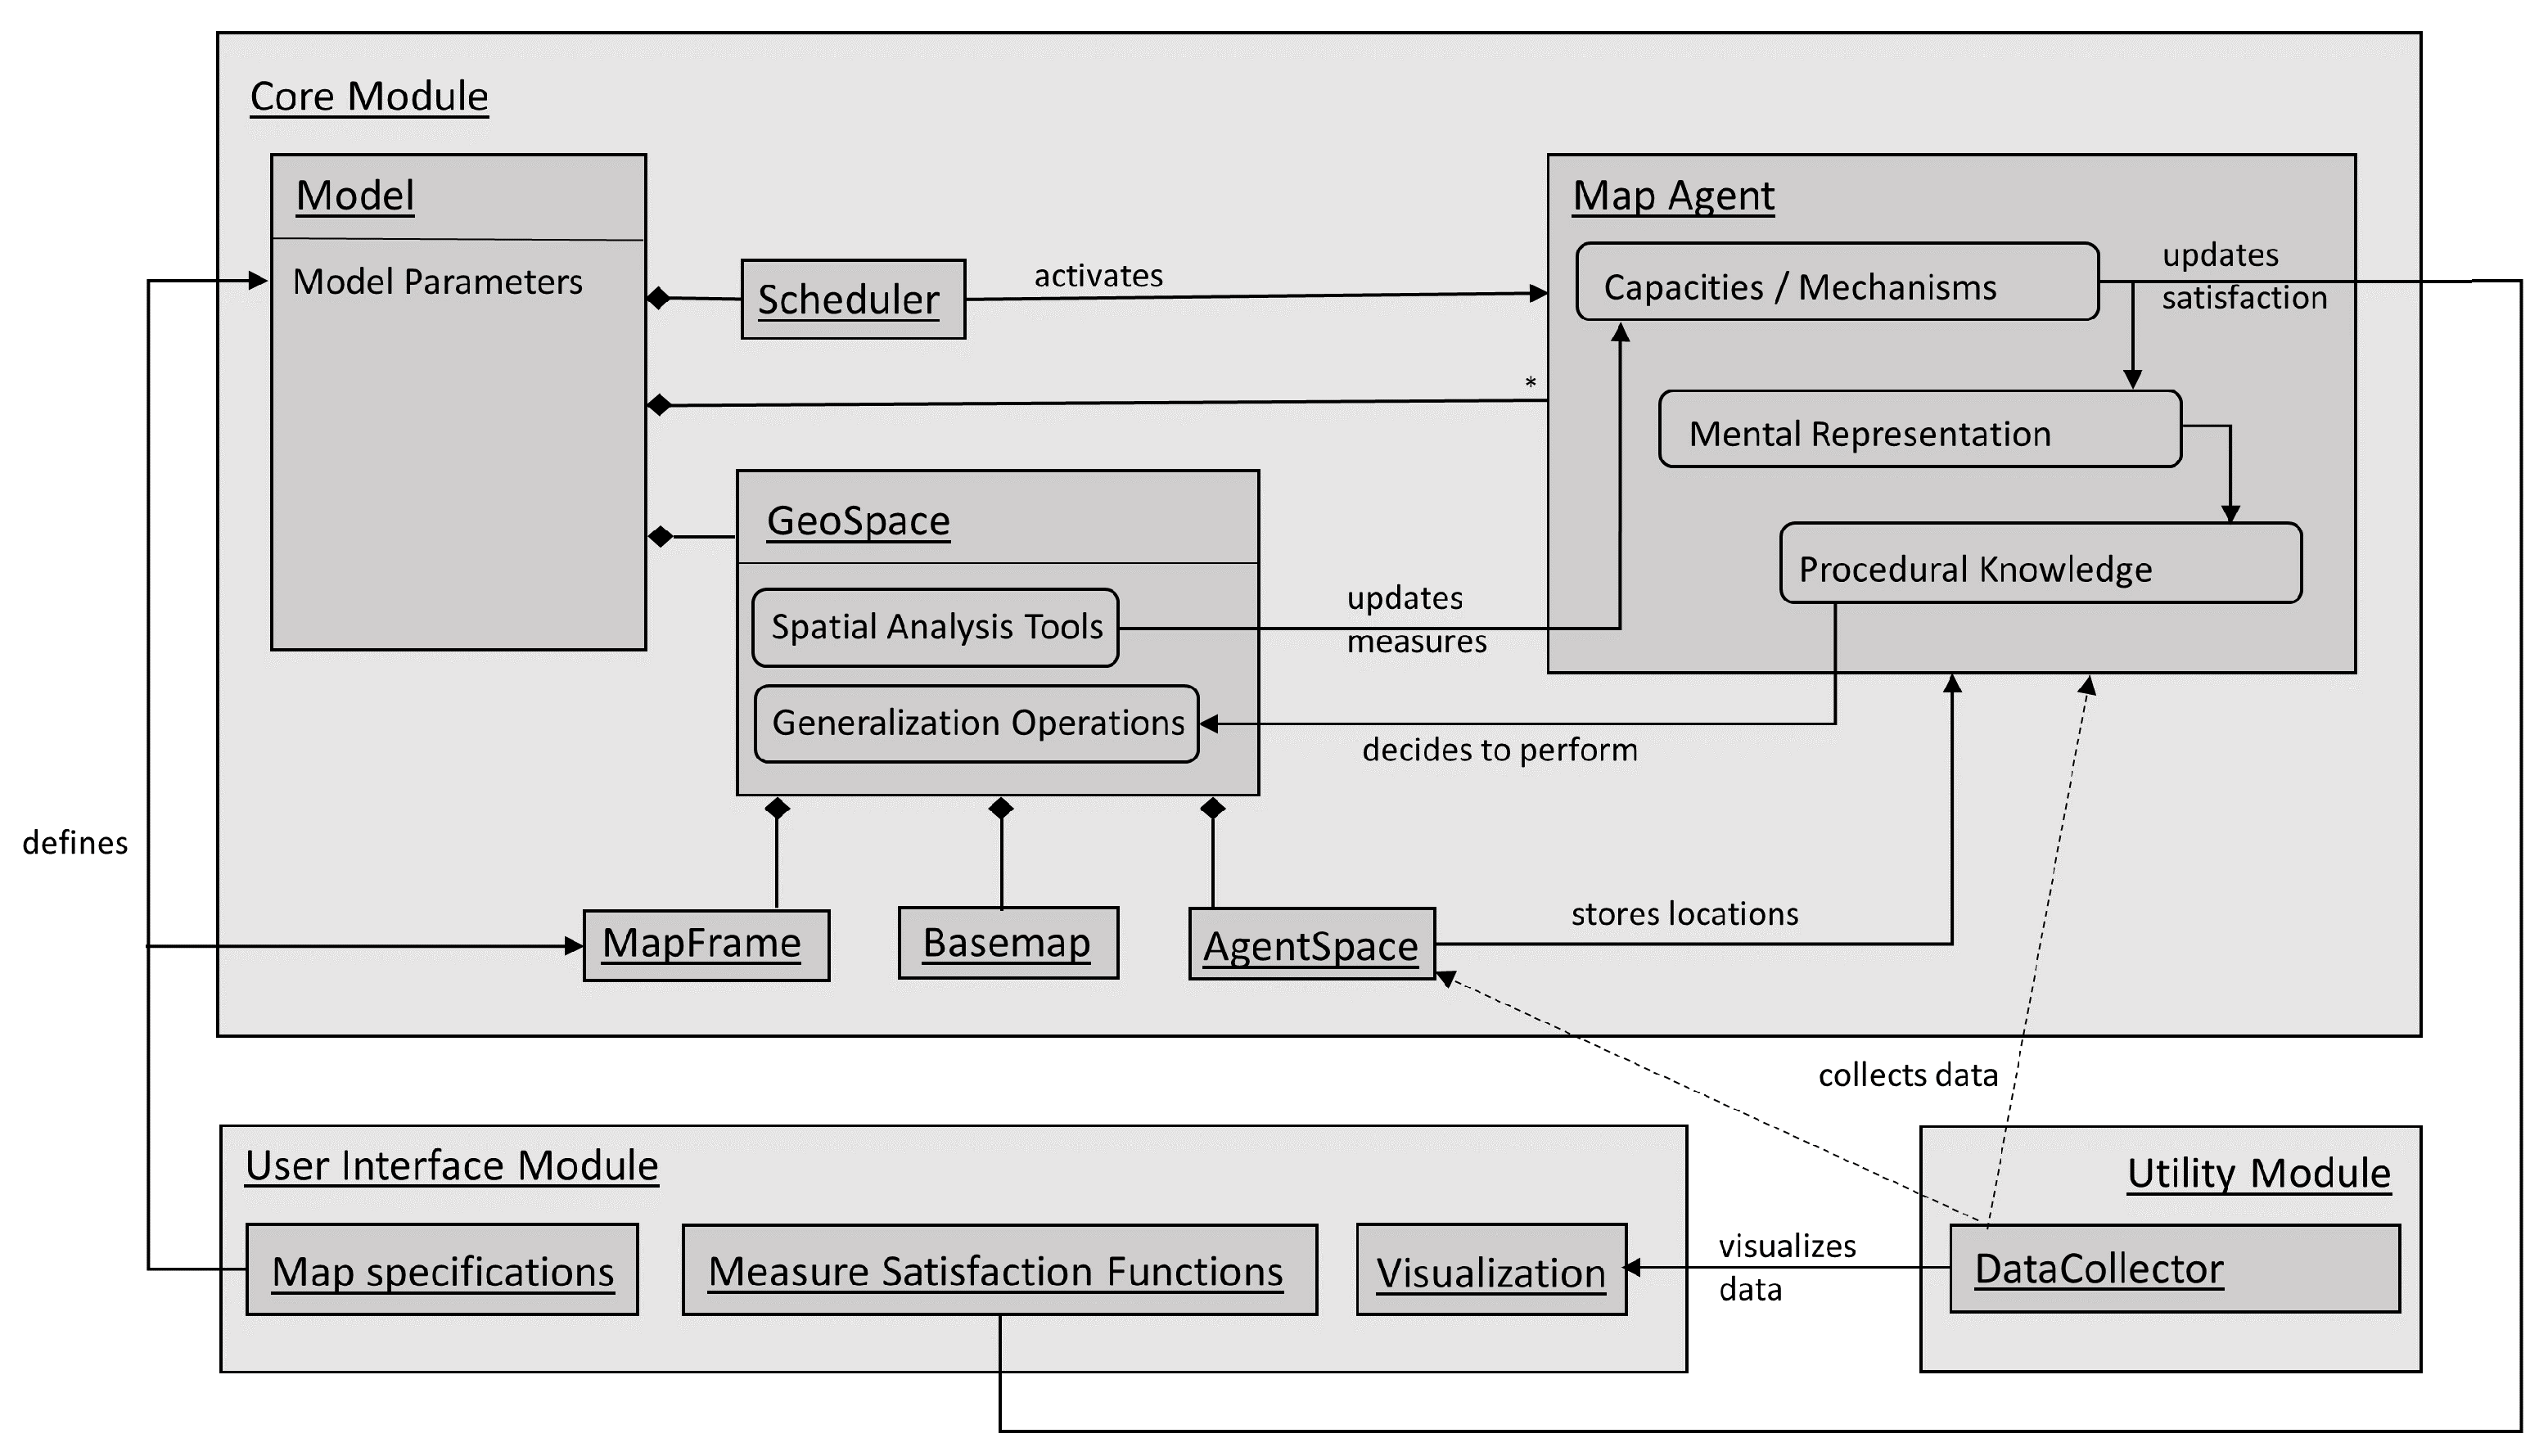
3.2. Architecture of the Agent-Based Model
3.2.1. General Architecture
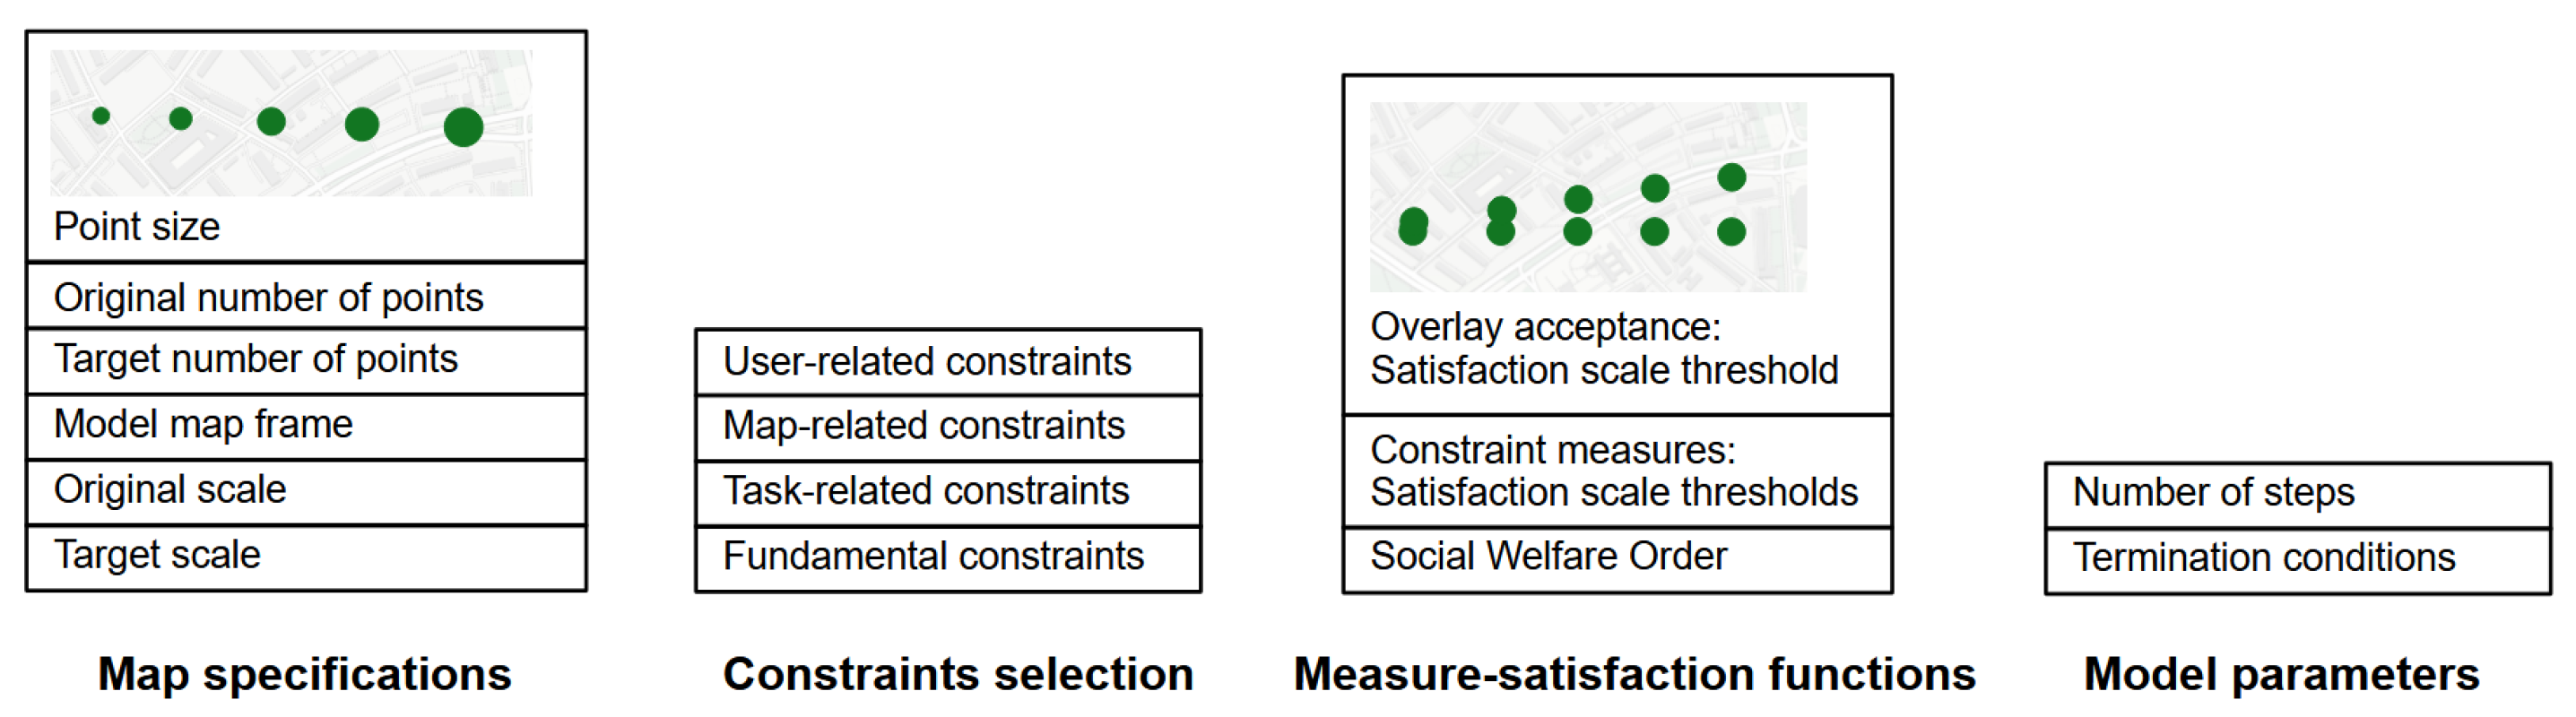
3.2.2. User Interface Module
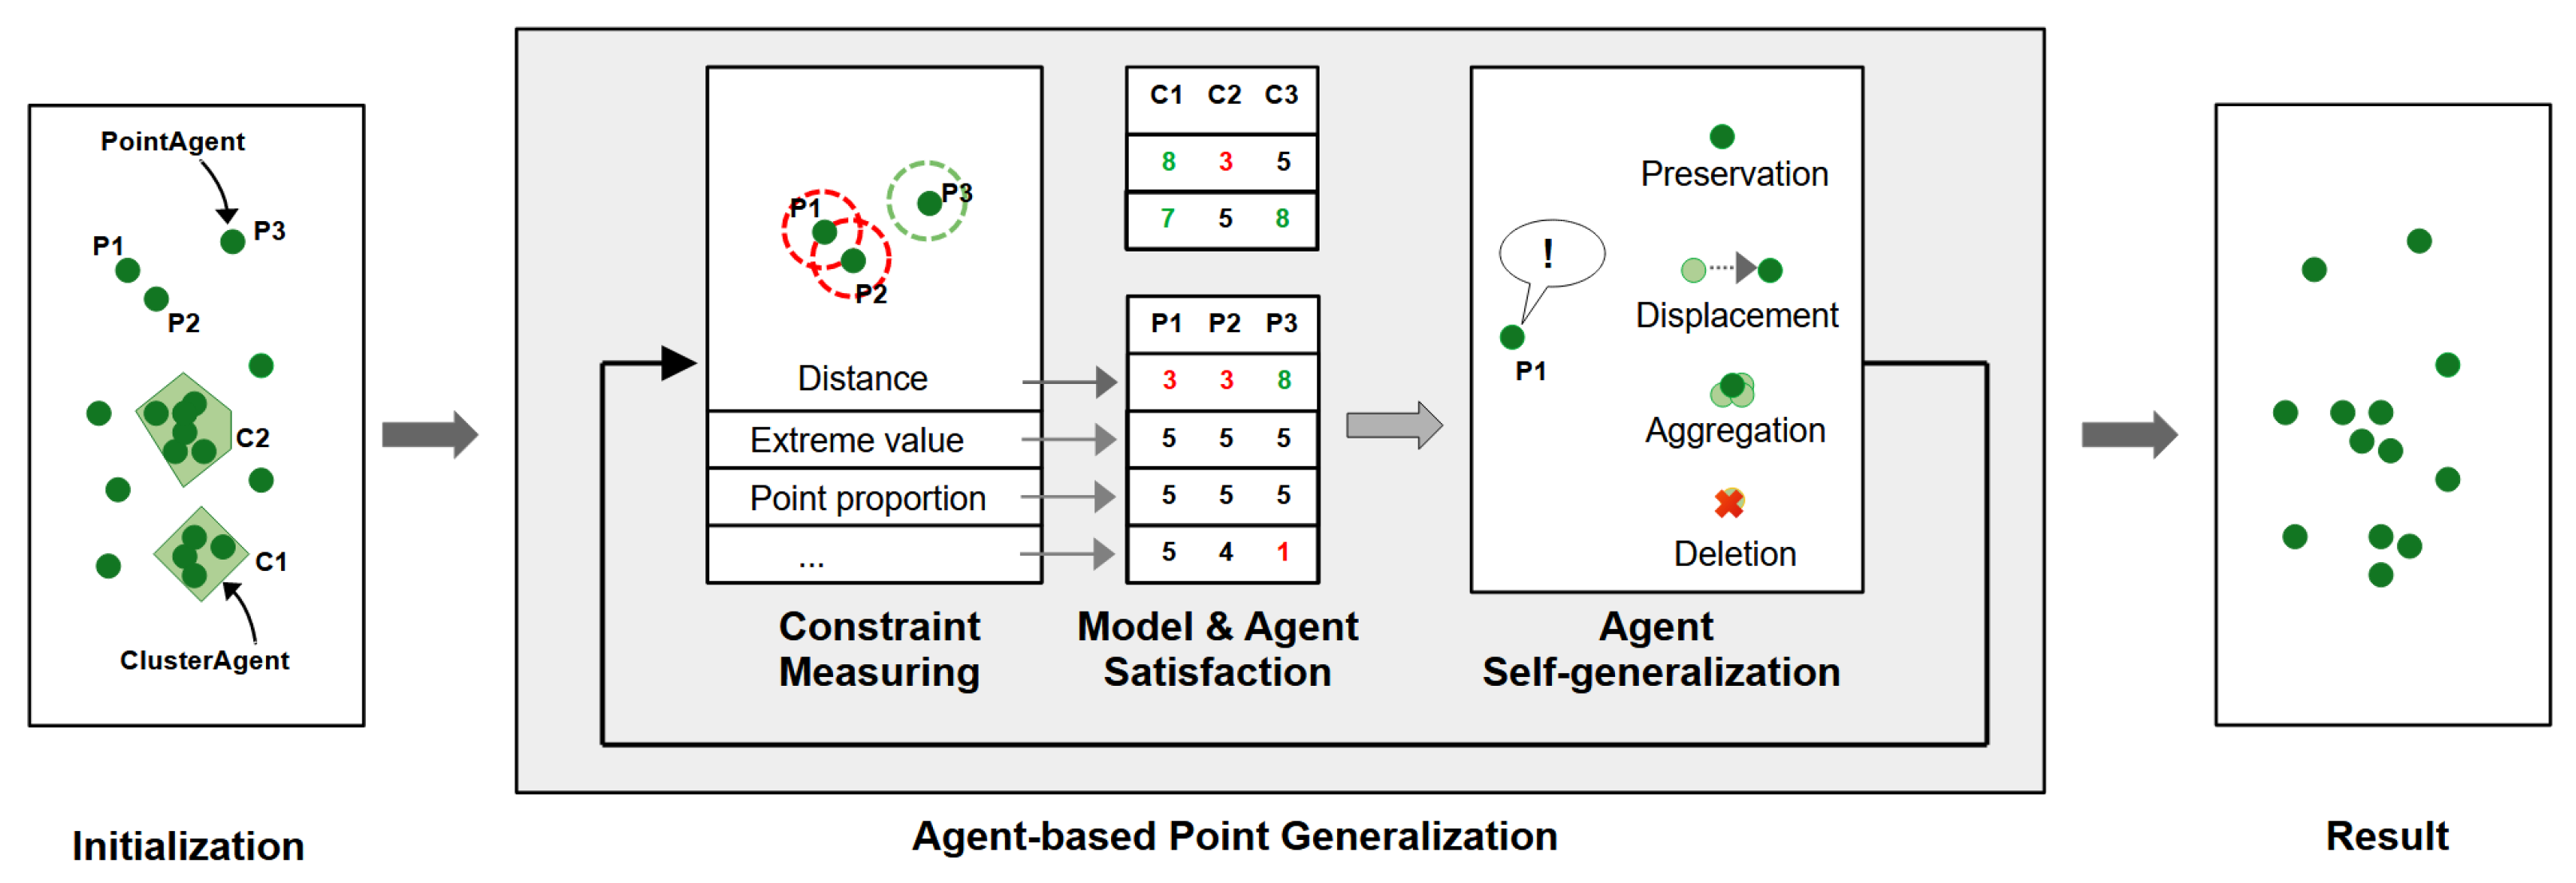
3.2.3. Core Module
4. Experiments
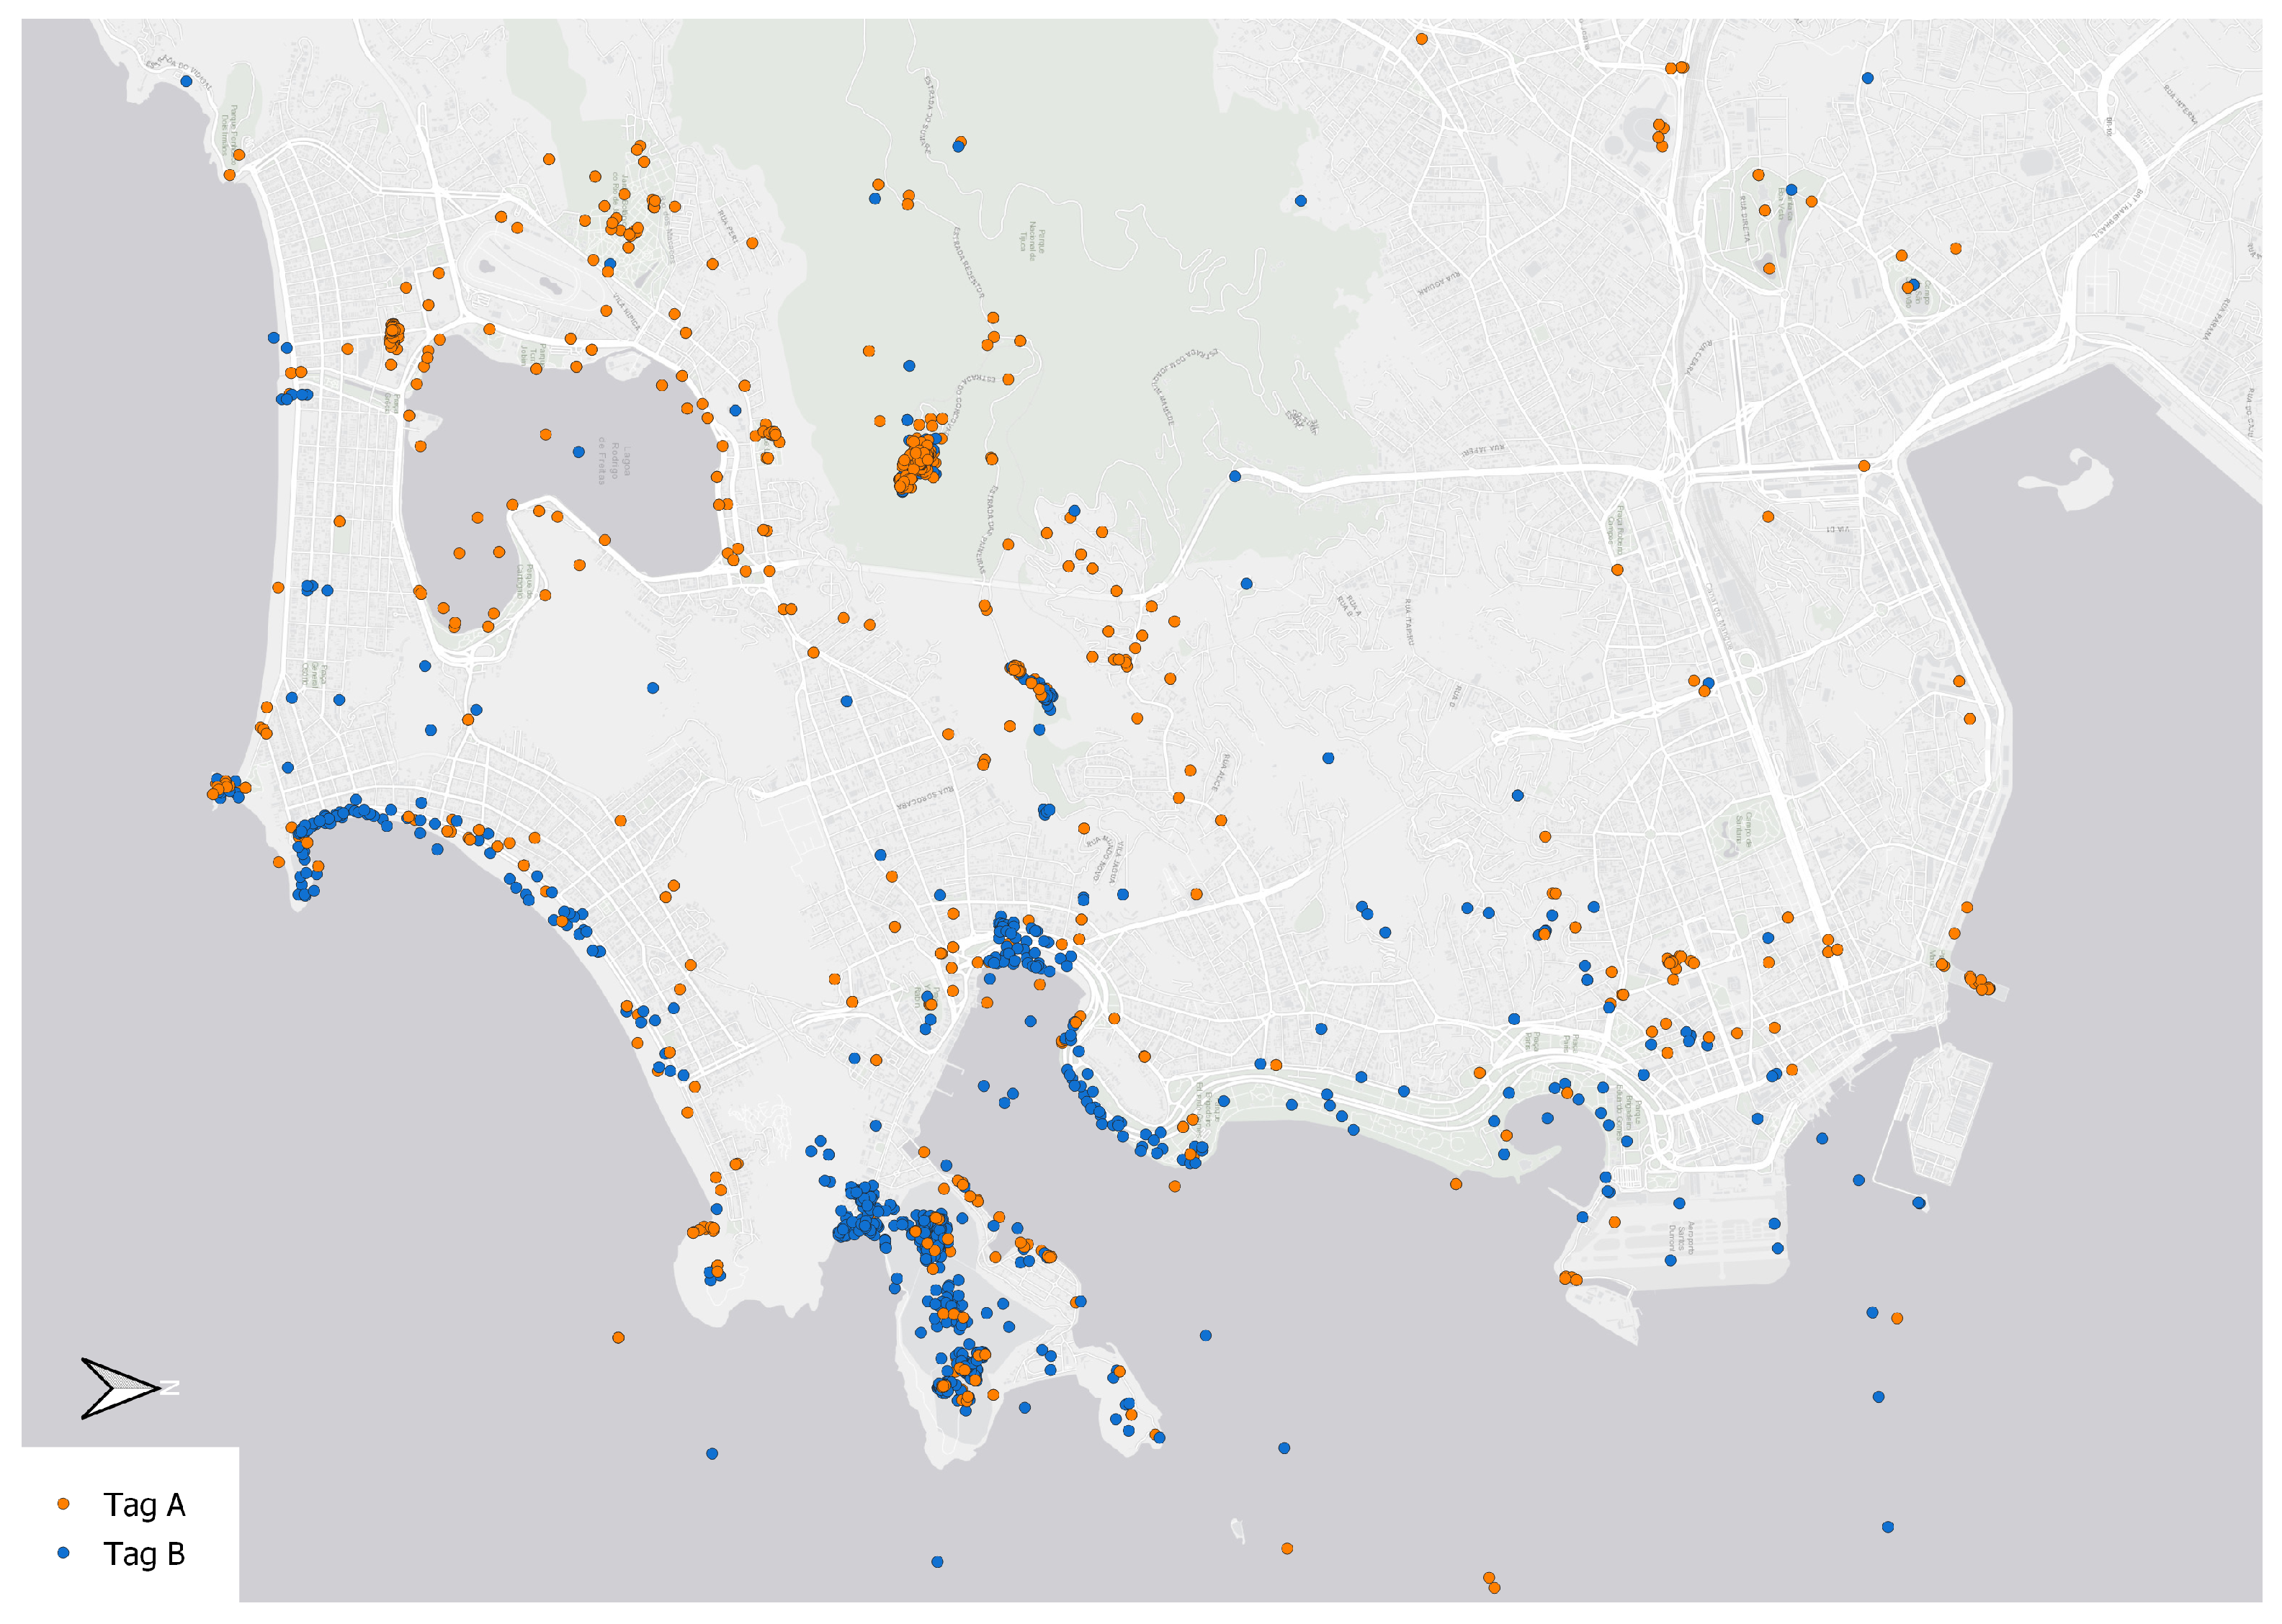
4.1. Data
4.2. Performance Metrics
4.3. Results
5. Discussion
6. Conclusions
Author Contributions
Funding
Data Availability Statement
Conflicts of Interest
References
- Goodchild, M.F. Citizens as Voluntary Sensors: Spatial Data Infrastructure in the World of Web 2.0. Int. J. Spat. Data Infrastruct. Res. 2007, 2, 24–32. [Google Scholar]
- Zhang, G.; Zhu, A.X. The representativeness and spatial bias of volunteered geographic information: A review. Ann. GIS 2018, 24, 151–162. [Google Scholar] [CrossRef]
- Rosenholtz, R.; Li, Y.; Nakano, L. Measuring visual clutter. J. Vis. 2007, 7, 17. [Google Scholar] [CrossRef] [PubMed]
- Touya, G.; Hoarau, C.; Christophe, S. Clutter and Map Legibility in Automated Cartography: A Research Agenda. Cartogr. Int. J. Geogr. Inf. Geovisual. 2016, 51, 198–207. [Google Scholar] [CrossRef]
- Beard, K. Constraints on rule formation. Map Generalization: Making Rules for Knowledge Representation; Addison-Wesley Longman Ltd.: Toronto, ON, Canada, 1991; pp. 121–135. [Google Scholar]
- Harrie, L.; Weibel, R. Modelling the Overall Process of Generalisation. In Generalisation of Geographic Information; Mackaness, W.A., Ruas, A., Sarjakoski, L.T., Eds.; International Cartographic Association, Elsevier Science B.V.: Amsterdam, The Netherland, 2007; pp. 67–87. [Google Scholar] [CrossRef]
- Duchêne, C.; Touya, G.; Taillandier, P.; Gaffuri, J.; Ruas, A.; Renard, J. Multi-Agents Systems for Cartographic Generalization: Feedback from Past and On-going Research; Research report; IGN (Institut National de l’Information Géographique et Forestière); LaSTIG, équipe COGIT: Saint-Mandé, France, 2018. [Google Scholar]
- Knura, M.; Schiewe, J. Improvement of Task-Oriented Visual Interpretation of VGI Point Data. In Volunteered Geographic Information; Burghardt, D., Demidova, E., Keim, D.A., Eds.; Springer: Berlin/Heidelberg, Germany, 2023; pp. 89–111. [Google Scholar] [CrossRef]
- Knura, M.; Schiewe, J. Analysis of User Behaviour While Interpreting Spatial Patterns in Point Data Sets. KN J. Cartogr. Geogr. Inf. 2022, 72, 229–242. [Google Scholar] [CrossRef]
- Yan, H.; Weibel, R. An algorithm for point cluster generalization based on the Voronoi diagram. Comput. Geosci. 2008, 34, 939–954. [Google Scholar] [CrossRef]
- Meier, S. The Marker Cluster: A Critical Analysis and a New Approach to a Common Web-based Cartographic Interface Pattern. Int. J. Agric. Environ. Inf. Syst. 2016, 7, 28–43. [Google Scholar] [CrossRef]
- Slocum, T.; McMaster, R.; Kessler, F.; Howard, H. Thematic Cartography and Geovisualization; Prentice Hall Series in Geographic Information Science; Pearson Prentice Hall: Upper Saddle River, NJ, USA, 2009. [Google Scholar]
- Gröbe, M.; Burghardt, D. Scale-Dependent Point Selection Methods for Web Maps. KN J. Cartogr. Geogr. Inf. 2021, 71, 143–154. [Google Scholar] [CrossRef]
- Mackaness, W.A.; Purves, R.S. Automated Displacement for Large Numbers of Discrete Map Objects. Algorithmica 2001, 30, 302–311. [Google Scholar] [CrossRef]
- Touya, G.; Zhang, X.; Lokhat, I. Is deep learning the new agent for map generalization? Int. J. Cartogr. 2019, 5, 142–157. [Google Scholar] [CrossRef]
- Xiao, T.; Ai, T.; Yu, H.; Yang, M.; Liu, P. A point selection method in map generalization using graph convolutional network model. Cartogr. Geogr. Inf. Sci. 2024, 51, 20–40. [Google Scholar] [CrossRef]
- Touya, G. Multi-Criteria Geographic Analysis for Automated Cartographic Generalization. Cartogr. J. 2022, 59, 18–34. [Google Scholar] [CrossRef]
- Armstrong, M.P.; Xiao, N.; Bennett, D.A. Using Genetic Algorithms to Create Multicriteria Class Intervals for Choropleth Maps. Ann. Assoc. Am. Geogr. 2003, 93, 595–623. [Google Scholar] [CrossRef]
- Chang, J.; Schiewe, J. An open source tool for preserving local extreme values and hot/cold spots in choropleth maps. KN J. Cartogr. Geogr. Inf. 2018, 68, 307–309. [Google Scholar] [CrossRef]
- Qiang, Y.; Buttenfield, B.; Xu, J. Analyzing multi-scale spatial point patterns in a pyramid modeling framework. Cartogr. Geogr. Inf. Sci. 2022, 49, 370–383. [Google Scholar] [CrossRef]
- Zahtila, M.; Knura, M. Visualizing Point Density on Geometry Objects: Application in an Urban Area Using Social Media VGI. KN J. Cartogr. Geogr. Inf. 2022, 72, 187–200. [Google Scholar] [CrossRef]
- Mackaness, W.A.; Ruas, A. Evaluation in the Map Generalisation Process. In Generalisation of Geographic Information; Mackaness, W.A., Ruas, A., Sarjakoski, L.T., Eds.; International Cartographic Association, Elsevier Science B.V.: Amsterdam, The Netherlands, 2007; pp. 89–111. [Google Scholar] [CrossRef]
- Harrie, L.; Stigmar, H. An evaluation of measures for quantifying map information. ISPRS J. Photogramm. Remote Sens. 2010, 65, 266–274. [Google Scholar] [CrossRef]
- Töpfer, F.; Pillewizer, W. The Principles of Selection. Cartogr. J. 1966, 3, 10–16. [Google Scholar] [CrossRef]
- Edelsbrunner, H.; Kirkpatrick, D.; Seidel, R. On the shape of a set of points in the plane. IEEE Trans. Inf. Theory 1983, 29, 551–559. [Google Scholar] [CrossRef]
- Kazil, J.; Masad, D.; Crooks, A. Utilizing Python for Agent-Based Modeling: The Mesa Framework. In Proceedings of the Social, Cultural, and Behavioral Modeling; Thomson, R., Bisgin, H., Dancy, C., Hyder, A., Hussain, M., Eds.; Springer International Publishing: Cham, Switzerland, 2020; pp. 308–317. [Google Scholar]
- Wang, B.; Hess, V.; Crooks, A. Mesa-Geo: A GIS Extension for the Mesa Agent-Based Modeling Framework in Python. In Proceedings of the 5th ACM SIGSPATIAL International Workshop on GeoSpatial Simulation, Seattle, WA, USA, 1 November 2022; Association for Computing Machinery: New York, NY, USA, 2022. GeoSim ’22. pp. 1–10. [Google Scholar] [CrossRef]
- Touya, G. Social Welfare to Assess the Global Legibility of a Generalized Map. In Geographic Information Science; Springer: Berlin/Heidelberg, Germany, 2012; pp. 198–211. [Google Scholar] [CrossRef]
- Taillandier, P.; Gaffuri, J. Designing generalisation evaluation function through human-machine dialogue. arXiv 2012, arXiv:1204.4332. [Google Scholar]
- Knura, M.; Kluger, F.; Zahtila, M.; Schiewe, J.; Rosenhahn, B.; Burghardt, D. Using Object Detection on Social Media Images for Urban Bicycle Infrastructure Planning: A Case Study of Dresden. ISPRS Int. J. Geo-Inf. 2021, 10, 733. [Google Scholar] [CrossRef]
- Jabeur, N.; Boulekrouche, B.; Moulin, B. Using Multiagent Systems to Improve Real-Time Map Generation. In Proceedings of the Advances in Artificial Intelligence; Lamontagne, L., Marchand, M., Eds.; Springer: Berlin/Heidelberg, Germany, 2006; pp. 37–48. [Google Scholar]


| Constraint (Type) | Measure |
|---|---|
| Retain proportion of points between areas (2) | spatial distribution of points [23] |
| Preserve ranking of densities between areas (2) | cluster density ranking [23] |
| Preserve local extreme values (1) | local extreme value preservation |
| Maintain at least one point per class (2) | point category preservation |
| Preserve cluster density (1) | mean distance to cluster members |
| Preserve spatial correctness (3) | distance to origin location |
| Reduce number of points (3) | number of points via Radical Law [24] |
| Preserve Gestalt law rules for cluster shape (3) | convex hull or alpha shape [25] |
| Preserve Gestalt law rules for cluster orientation (3) | minimum bounding rectangle |
| MPD | SDPD | EXT | Ptp | Pfk | |
|---|---|---|---|---|---|
| quad tree generalizing | 0.26 | 0.14 | 20/27 | 12/44 | 10/68 |
| discrete isolation | 0.12 | 0.06 | 25/27 | 6/44 | 6/68 |
| agent-based model | 0.35 | 0.12 | 23/27 | 20/44 | 16/68 |
Disclaimer/Publisher’s Note: The statements, opinions and data contained in all publications are solely those of the individual author(s) and contributor(s) and not of MDPI and/or the editor(s). MDPI and/or the editor(s) disclaim responsibility for any injury to people or property resulting from any ideas, methods, instructions or products referred to in the content. |
© 2024 by the authors. Published by MDPI on behalf of the International Society for Photogrammetry and Remote Sensing. Licensee MDPI, Basel, Switzerland. This article is an open access article distributed under the terms and conditions of the Creative Commons Attribution (CC BY) license (https://creativecommons.org/licenses/by/4.0/).
Share and Cite
Knura, M.; Schiewe, J. Preserving Spatial Patterns in Point Data: A Generalization Approach Using Agent-Based Modeling. ISPRS Int. J. Geo-Inf. 2024, 13, 431. https://doi.org/10.3390/ijgi13120431
Knura M, Schiewe J. Preserving Spatial Patterns in Point Data: A Generalization Approach Using Agent-Based Modeling. ISPRS International Journal of Geo-Information. 2024; 13(12):431. https://doi.org/10.3390/ijgi13120431
Chicago/Turabian StyleKnura, Martin, and Jochen Schiewe. 2024. "Preserving Spatial Patterns in Point Data: A Generalization Approach Using Agent-Based Modeling" ISPRS International Journal of Geo-Information 13, no. 12: 431. https://doi.org/10.3390/ijgi13120431
APA StyleKnura, M., & Schiewe, J. (2024). Preserving Spatial Patterns in Point Data: A Generalization Approach Using Agent-Based Modeling. ISPRS International Journal of Geo-Information, 13(12), 431. https://doi.org/10.3390/ijgi13120431