Article

A Spatial Information Extraction Method Based on Multi-Modal Social Media Data: A Case Study on Urban Inundation

1
College of Geographical Science, Fujian Normal University, Fuzhou 350117, China
2
Institute of Geography, Fujian Normal University, Fuzhou 350117, China
3
School of Software Engineering, Xiamen University of Technology, Xiamen 361024, China
4
Ministry of Education Key Laboratory of Virtual Geographic Environment, Nanjing Normal University, Nanjing 210097, China
*
Author to whom correspondence should be addressed.
ISPRS Int. J. Geo-Inf. 2023, 12(9), 368; https://doi.org/10.3390/ijgi12090368
Submission received: 8 July 2023 / Revised: 21 August 2023 / Accepted: 29 August 2023 / Published: 5 September 2023
(This article belongs to the Topic Urban Sensing Technologies)

Abstract

:
With the proliferation and development of social media platforms, social media data have become an important source for acquiring spatiotemporal information on various urban events. Providing accurate spatiotemporal information for events contributes to enhancing the capabilities of urban management and emergency responses. However, existing research regarding mining spatiotemporal information of events often solely focuses on textual content and neglects data from other modalities such as images and videos. Therefore, this study proposes an innovative spatiotemporal information extraction method, which extracts the spatiotemporal information of events from multimodal data on Weibo at coarse- and fine-grained hierarchical levels and serves as a beneficial supplement to existing urban event monitoring methods. This paper utilizes the “20 July 2021 Zhengzhou Heavy Rainfall” incident as an example to evaluate and analyze the effectiveness of the proposed method. Results indicate that in coarse-grained spatial information extraction using only textual data, our method achieved a spatial precision of 87.54% within a 60 m range and reached 100% spatial precision for ranges beyond 200 m. For fine-grained spatial information extraction, the introduction of other modal data, such as images and videos, resulted in a significant improvement in spatial error. These results demonstrate the ability of the MIST-SMMD (Method of Identifying Spatiotemporal Information of Social Media Multimodal Data) to extract spatiotemporal information from urban events at both coarse and fine levels and confirm the significant advantages of multimodal data in enhancing the precision of spatial information extraction.

1. Introduction

With the rapid advancement of internet technology, social media platforms have emerged as principal channels for individuals to acquire and disseminate information. For instance, as of December 2022, Weibo witnessed a year-on-year net increase of 13 million active users per month, reaching a total of 586 million, which was a historical record [1]. The extensive nature of information dissemination on social media renders it a rich source of spatiotemporal data [2]. Within urban management and emergency response domains, spatiotemporal information holds immense value and facilitates event situation awareness [3], spatial analysis in disaster management [4,5], and geotagged disaster assessments [6,7], among other applications. Furthermore, precise and reliable spatiotemporal information contributes to wiser and timelier decisions [8]. However, despite the relative ease of processing textual information, existing research on spatiotemporal information extraction predominantly focuses on unimodal data, particularly text data. Moreover, the diversity and complexity of social media data pose numerous challenges for conventional methods in handling these data. In this context, exploring ways to effectively leverage the abundant multimodal data present in social media, including text, images, and videos, extracting more accurate and comprehensive spatiotemporal information becomes critically important.
As previously mentioned, although social media offers rich multimodal data, prevailing research on spatiotemporal information extraction is typically centered on utilizing single-mode data, particularly text data. Text data processing is relatively convenient with common extraction methods, including rule-based methods and named entity recognition (NER) approaches. Rule-based methods rely on manually defined rules and patterns for information extraction and typically require domain knowledge and linguistic resources [9]. Because they do not require extensive labeled data or complex computational resources, these methods are advantageous in quickly and efficiently building system prototypes and are, therefore, adopted in numerous studies [10]. However, the diversity, informality, and ambiguity of social media text make it challenging for rule-based methods to accommodate all possible scenarios, which necessitates significant human involvement and maintenance and makes them unsuitable for the rapid evolution, frequent updates, and large volume characteristics of social media text. Named entity recognition (NER)-based methods involve extracting spatiotemporal information through the detection of spatiotemporally relevant entities within the text data. Recently, and with the rapid advancements in natural language processing theories and applications within the field of machine learning [11,12], many studies have started to employ this approach for spatiotemporal information extraction [13,14]. The advantage of this method is the ability to automatically identify entities within text and reduce human involvement and maintenance. However, issues such as entity ambiguity, expression diversity, and nested entities in the text can impact extraction results.
Although solely leveraging unimodal data to a certain extent can effectively extract the spatiotemporal information inherent in the data, the precision of the achievable spatiotemporal information extraction is constrained to a certain degree, particularly evident when spatial information is involved. In contrast, image and video data inherently encompass abundant spatial information [15]. In the context of a multimodal data environment where image and video data are integrated with textual data, it can provide more accurate and refined spatial information support for spatiotemporal information extraction. This integration of multimodal data contributes to further enhancing the accuracy and comprehensiveness of spatiotemporal information extraction. As a result, this study draws inspiration from the process of manual geographic localization [16], whereby initial location candidates are acquired using textual data. Subsequently, with the aid of other modalities such as images or videos, a high-precision matching method is employed to correlate the user-uploaded query image from social media with the surrounding street view images near the preliminary location candidates. Throughout this process, the preliminary location with the highest confidence becomes designated as the final geographic location. Nevertheless, it is worth noting that while existing research has undertaken tasks such as information mining [17] and classification [18] on the foundation of multimodal data from social media, studies specifically addressing the extraction of spatiotemporal information from multimodal social media data remain relatively scarce. Simultaneously, extracting spatiotemporal information from multimodal social media data presents numerous challenges, primarily due to the presence of issues such as noise, heterogeneity, and sparsity associated with such publicly generated participatory data [19,20].
Over the past two decades, the frequency and intensity of flood disasters in major cities worldwide have escalated, posing severe threats to economic development and social stability [21]. Therefore, studying how to effectively extract spatiotemporal information about flood disasters has become an imperative subject as predicting potential urban flooding areas through spatiotemporal information monitoring of urban flood disasters has evolved into an essential means for managing urban flooding [22]. Current monitoring of urban flood disasters often utilizes Internet of Things (IoT) sensing [23] and remote sensing technology [24,25] for analysis. On a small spatial scale, IoT sensors can accurately and swiftly respond to urban inundation issues and facilitate real-time alerts and monitoring [26]. On a large spatial scale, although optical and radar satellite remote sensing can provide more effective continuous coverage of weather and inundation events compared to IoT sensors [27], flood disasters have short durations with small and concentrated surface water coverage, and due to factors such as cloud cover and vegetation canopy, microwave remote sensing is limited by the total internal reflection effect and cannot monitor or extract surface water information, which makes the original revisit cycle even longer [28]. Therefore, existing methods exhibit numerous inadequacies in extracting spatiotemporal information about flood disasters, and these methods struggle to meet the high spatiotemporal resolution requirements of urban flood disaster monitoring. However, when flood disasters occur, people often share information on social media, which may contain details such as the time, location, magnitude, affected area, and duration of the disaster [29]. This information holds significant importance for urban inundation management and prediction [30].
This study investigates the potential for high-precision refinement of extracted spatial information through other modalities (such as images and videos) based on the capability to extract spatiotemporal information from social media text. Thus, we propose a MIST-SMMD to address challenges related to multimodal data fusion and heterogeneity handling with the expectation of providing robust support for urban events and early warning and management of disasters. Additionally, to evaluate and validate this method, we employ urban floodwater accumulation events as a case study. The code, models, and datasets used in this study are publicly available for researchers to reproduce and conduct further research, and these are located at https://github.com/orgs/MIST-SMMD (accessed on 19 May 2023).
MIST-SMMD is an innovative approach for extracting spatiotemporal information, particularly high-precision spatial information, from multimodal data within the realm of social media. This approach substantiates the pronounced advantages of utilizing multimodal data over single-modal data to enhance the precision of spatial information extraction. The contribution of MIST-SMMD can be divided into three main aspects according to its corresponding three steps:
  • In terms of data preprocessing and compared with predecessors, we use a text classification model to filter related information and remove similar blog posts within the same day. This is beneficial for cleansing the noise in social media data and standardizing the dataset as much as possible;
  • For the extract of coarse-grained spatiotemporal information, we introduce a comprehensive set of stringent standardization rules for spatiotemporal data. This approach aims to facilitate the optimal structuring of potential spatiotemporal information, thereby ensuring a consistent representation across a variety of unstructured text:
    a.
    Time information → “Year–Month–Day”;
    b.
    Spatial information → “Province–City–District (or County)-Specific Geographic; Location” → Latitude and Longitude coordinates (WGS1984);
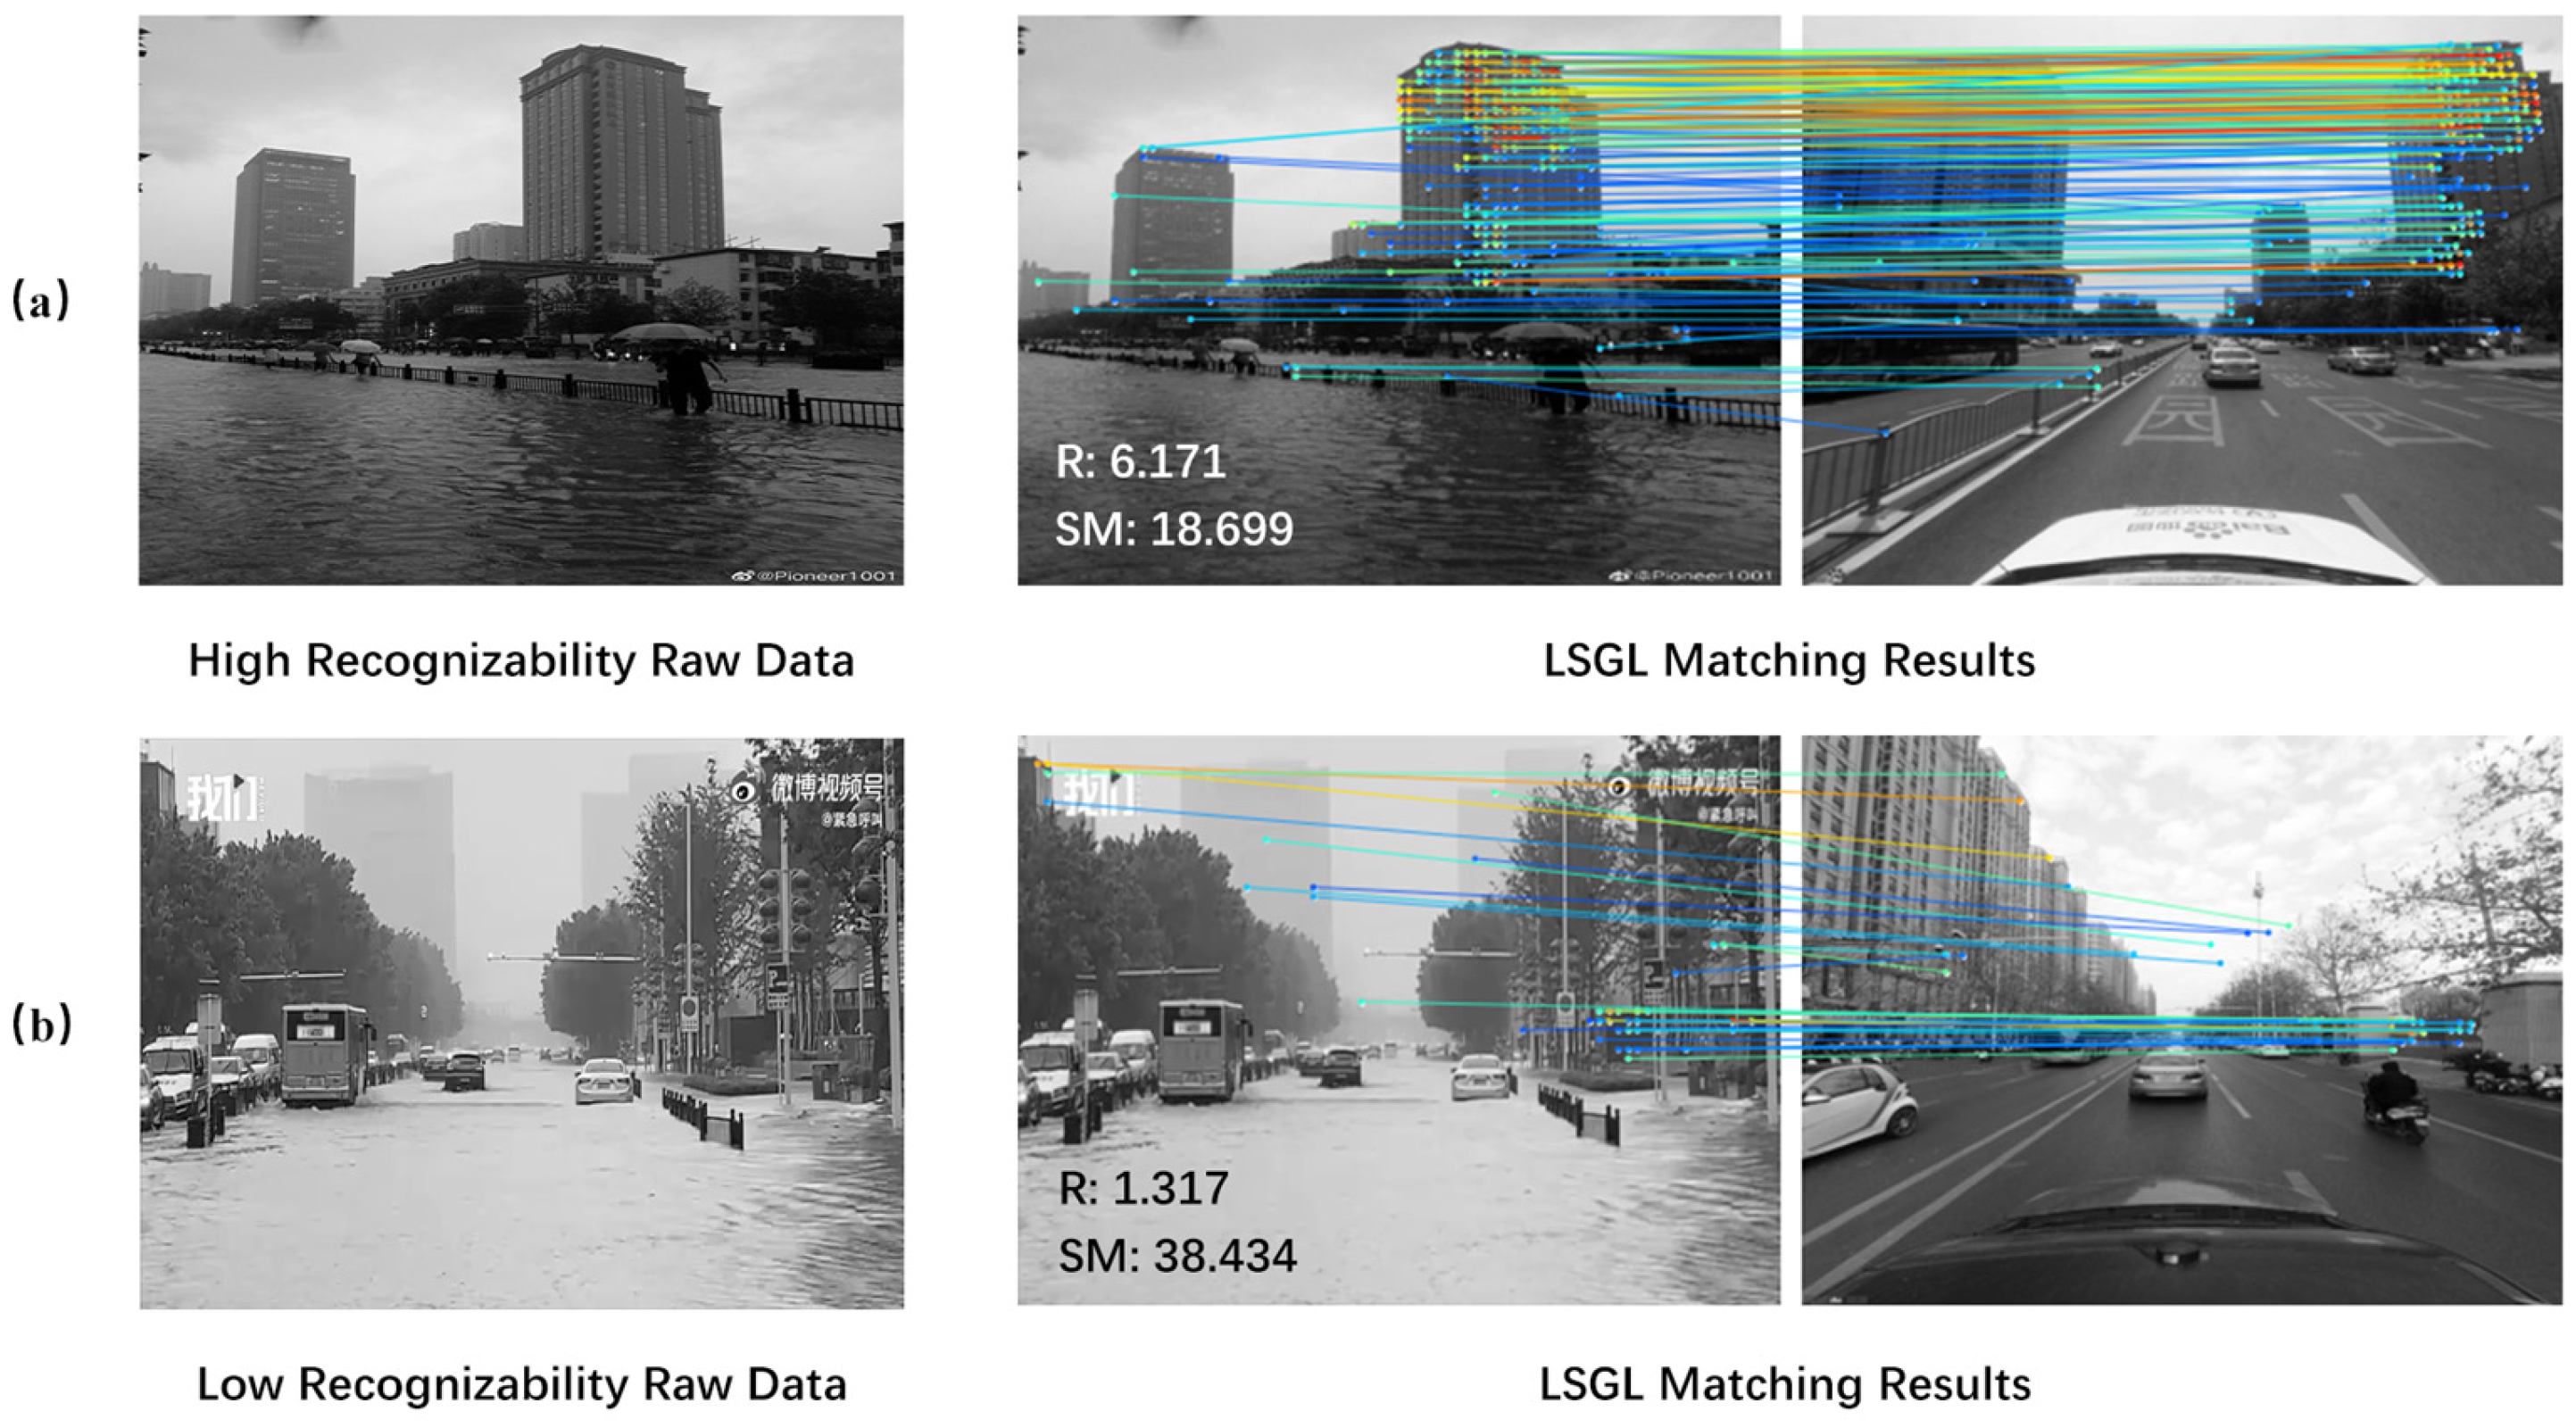
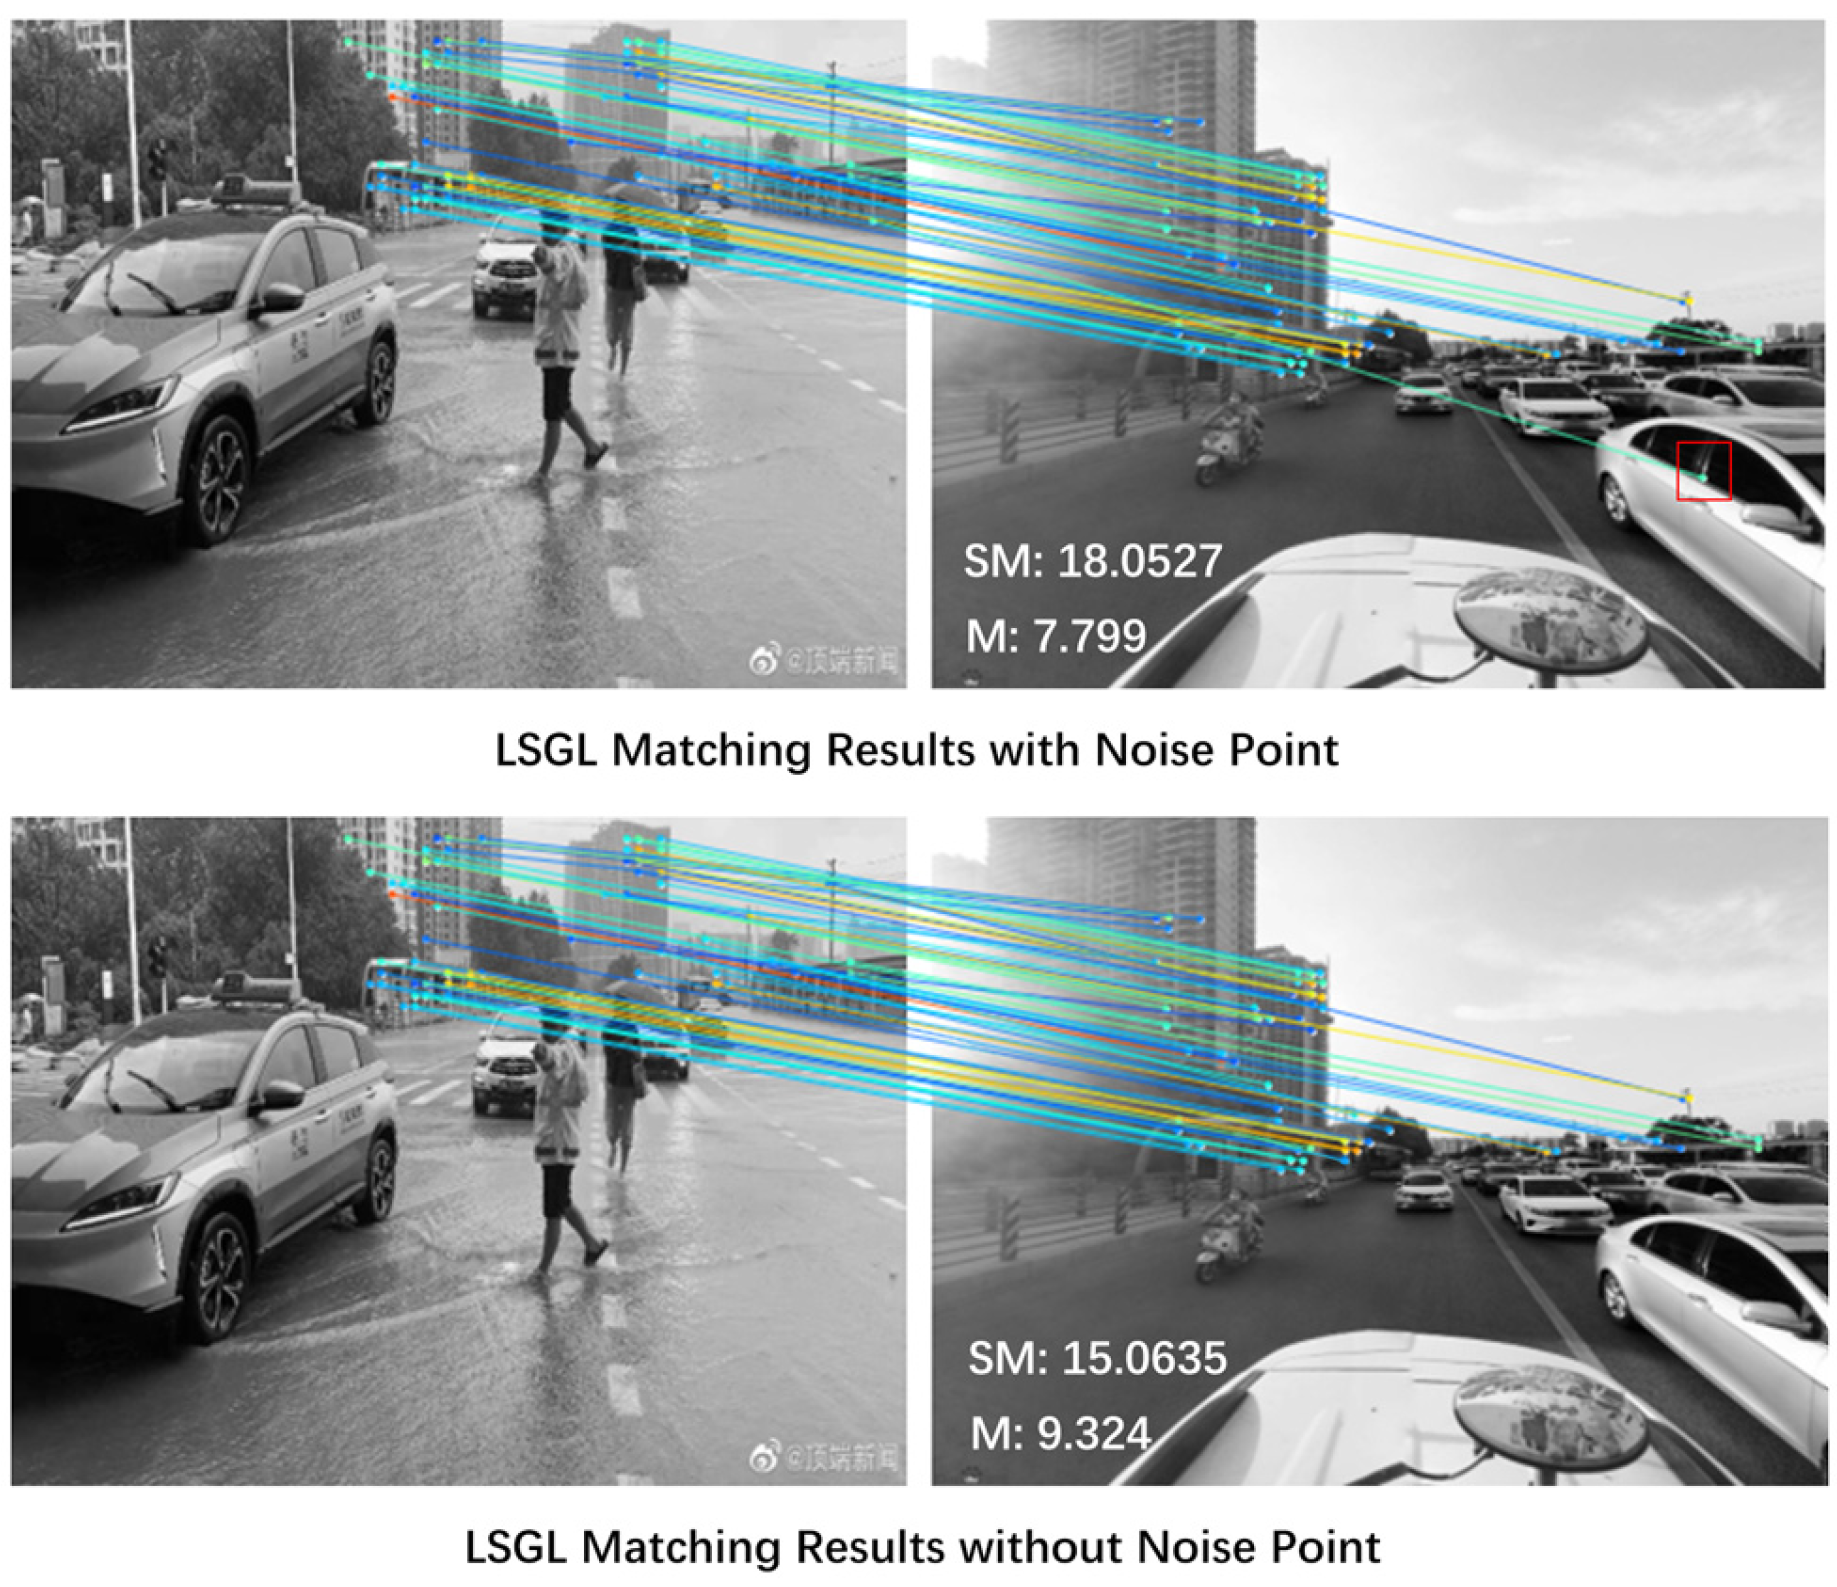
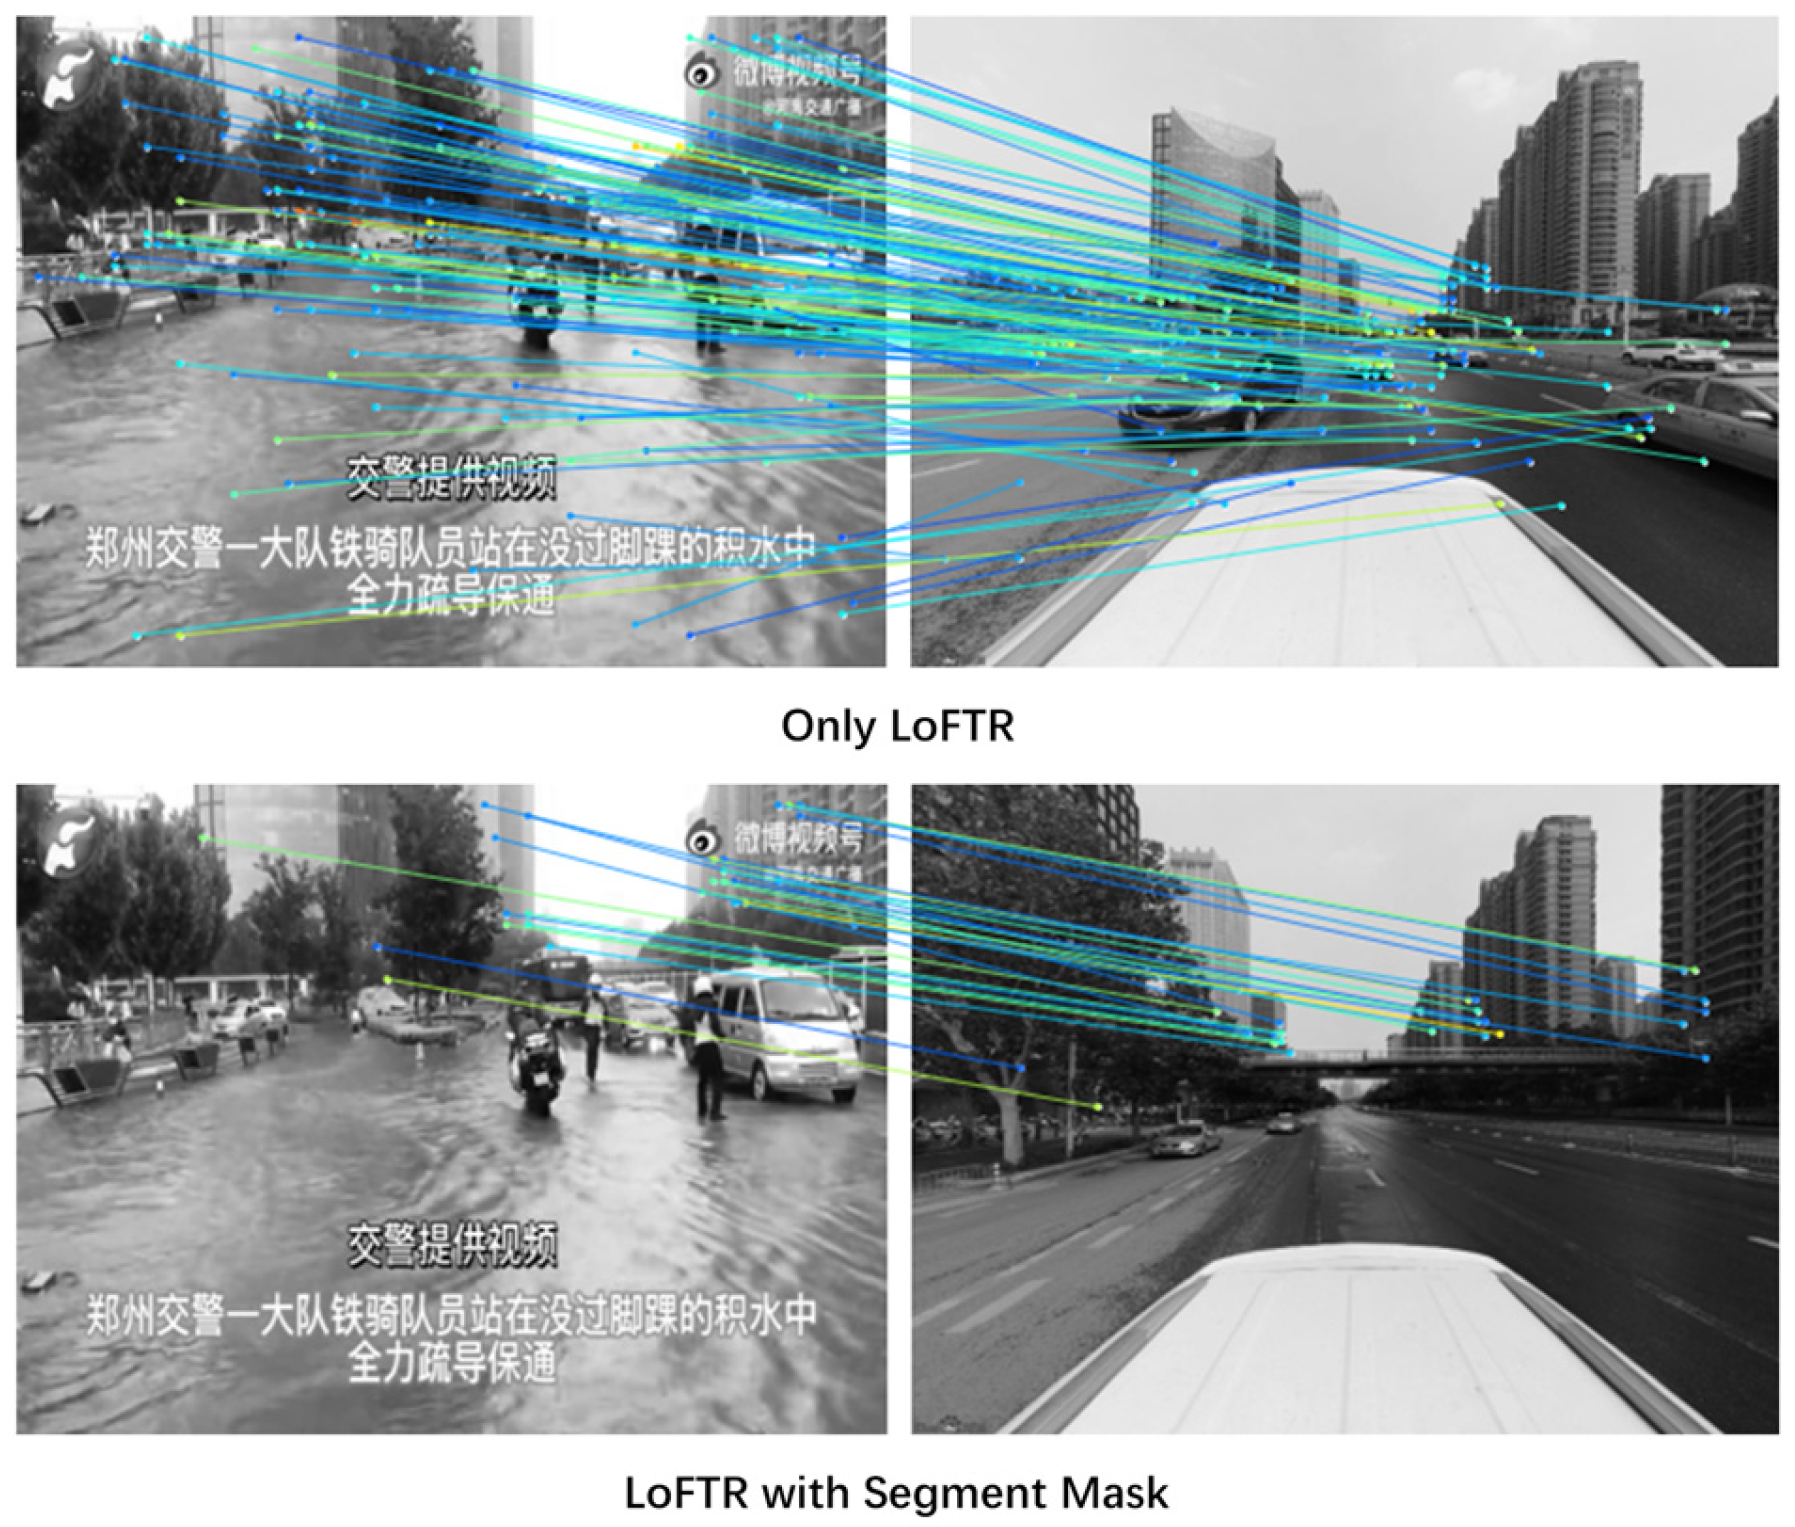
  • For the extraction of fine-grained spatial information, we propose an LSGL (LoFTR-Seg Geo-Localization) method. This leverages cascading computer vision models to further improve the accuracy of spatial information extracted from coarse-grained data and, thus, enhances the utilization of image and video modal data from social media;
  • The structure of this paper is as follows: Section 2 introduces our innovative multimodal social media data spatiotemporal information extraction method (MIST-SMMD); Section 3 uses the urban inundation event of the “20 July Zhengzhou Torrential Rain” as an experiment to evaluate and verify this method; Section 4 discusses and analyses the effectiveness of the method based on Section 3; and Section 5 summarizes the entire research and proposes the potential prospects for its use.

2. Methods

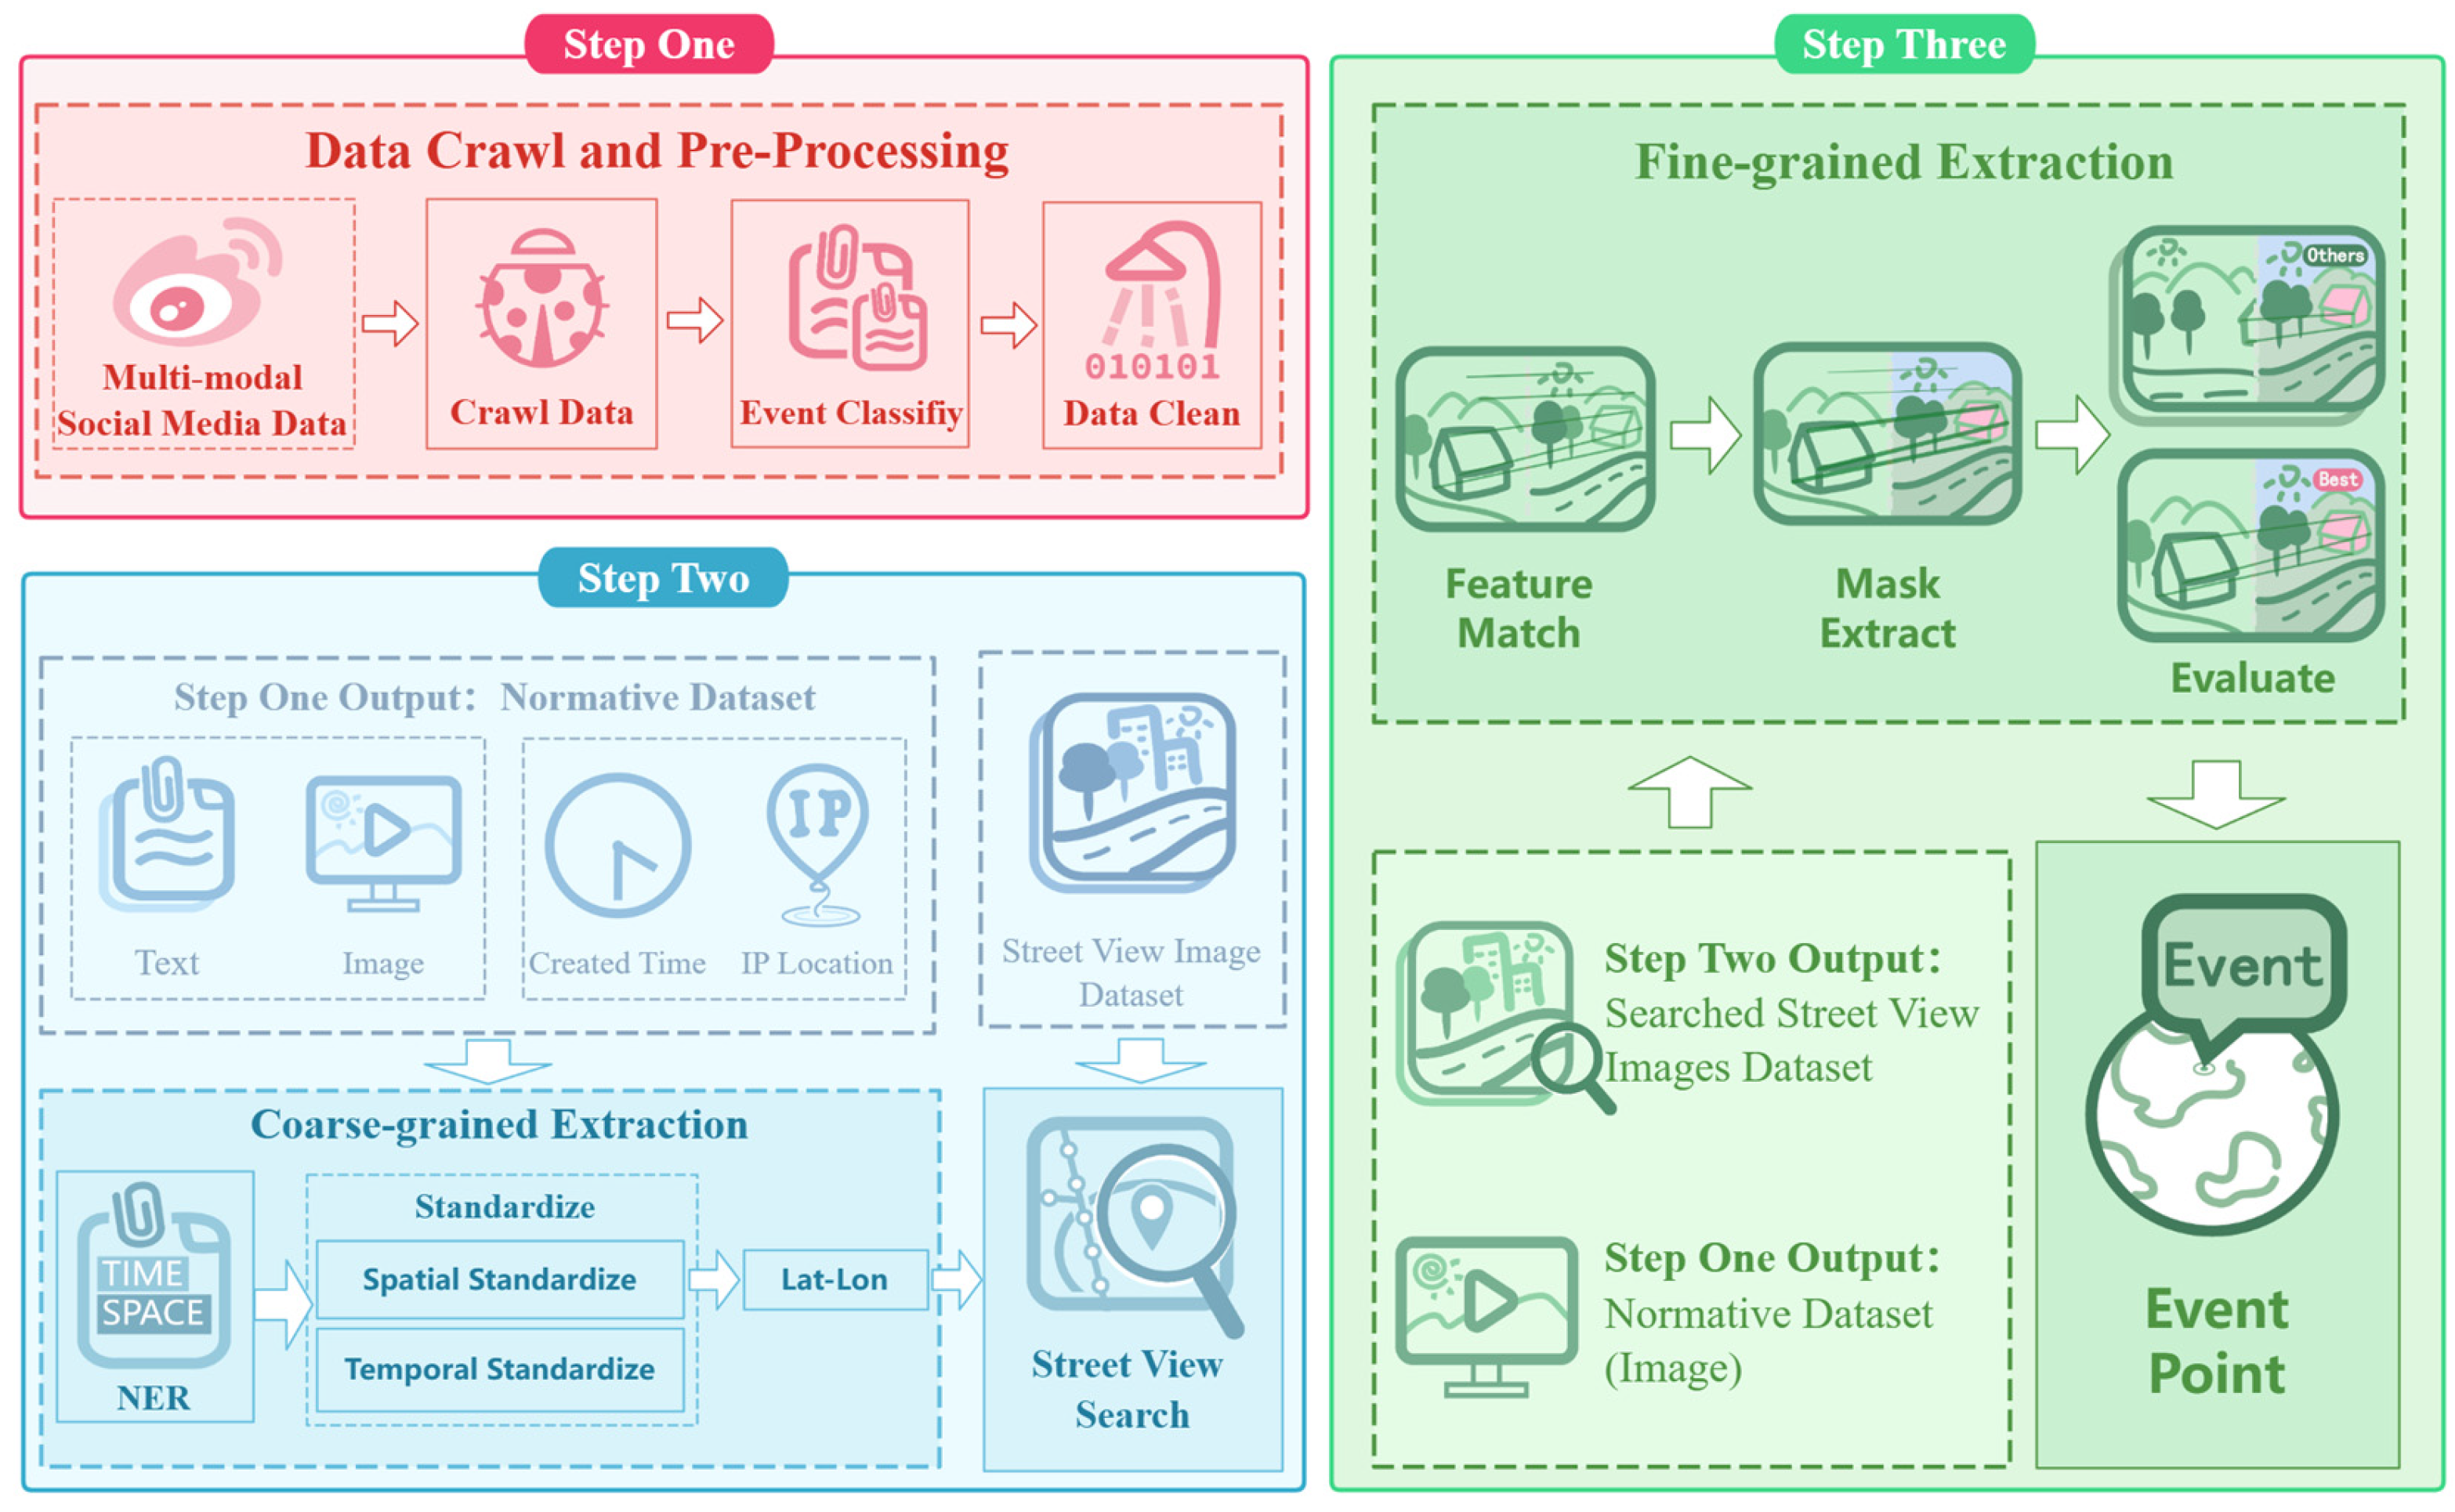
2.1. Technical Process

We introduce a method for extracting spatiotemporal information from multimodal social media data, which is known as MIST-SMMD. The MIST-SMMD process is comprised of the three steps:
  • Step One: Crawling and Preprocessing of social media data;
  • Step Two: Coarse-grained extraction of spatiotemporal information;
  • Step Three: Fine-grained extraction of spatial information.
The normative dataset for Step Two is derived from the crawling and preprocessing of social media data performed in Step One. The Street View Image Dataset refers to all street view data from Baidu Maps. However, as Step Two only involves coarse-grained spatiotemporal extraction from the microblog text, image data (including segmented video images) are not needed. These data are instead used in Step Three for the fine-grained extraction of spatial information.
MIST-SMMD leverages the complementarity of multimodal data and the flexibility and generalizability of model cascading and sequentially processes the text and images from social media. The overall flow of the method is shown in Figure 1.

2.2. Data Crawl and Pre-Process

2.2.1. Crawl Data

To obtain Weibo data, we utilize the public interface of Sina Weibo. The Weibo multimodal data are crawled using the Python programming language by setting the time range and keywords related to city events. These data include Weibo creation time, text content, images (if any), videos (if any), IP-owned provinces (starting from 1 August 2022), etc. For videos, we extract stable frame images using the optical flow method.

2.2.2. Event Classification

Despite initial keyword filtering, not all Weibo posts containing event-related keywords are actually related to the event. Therefore, a text classification model has been employed in this study to discern pertinent text corresponding to the designated urban event.

2.2.3. Data Cleaning

Subsequently, to efficiently process text data, we need to clean up the noise in the data. Character-level cleaning includes removing topic tags, zero-width spaces (ZWSP), @other users, emoji, HTML tags, etc. However, as an event often receives coverage from multiple media sources, overly similar report posts may lead to data redundancy. Therefore, we vectorize all the text and use an efficient cosine similarity matrix to calculate the similarity between each text and all other texts, which eventually removes Weibo posts that are highly similar (with a similarity score of 0.9 or higher).
After the above three steps of data preprocessing, we obtain a normative city event Weibo dataset that is largely noise-free and relevant to the required event. An example of a processed dataset is shown in Table 1.

2.3. Coarse-Grained Spatiotemporal Information Extraction

Due to the high degree of spontaneity and diversity in social media narratives and the lack of a unified text format, we proposed the “Coarse-grained Spatiotemporal Information Extraction” includes two parts: NER (Named Entity Recognition); and Standardization.

2.3.1. NER

First, we need to extract spatiotemporal information from the text. For the normative city event dataset from data preprocessing, we use NER technology to identify entities related to spatiotemporal information. To improve the efficiency of subsequent spatiotemporal information standardization, we merge similar labels. Specifically, we combine DATE and TIME labels into the TIME category as they can both be used as materials for time standardization. The GPE (Geopolitical Entity) label is maintained as a separate category as it provides the basis for administrative divisions for spatial standardization. We integrate LOC (Locations) and FAC (Facilities) labels into the FAC category because they can identify specific facilities or locations, which can serve as specific place names for spatial standardization. Table 2 shows the built-in labels that are required for extracting spatiotemporal information and reclassified label types.
For temporal–spatial standardization, specific attention is given to both temporal and spatial aspects. Hence, we utilized the JioNLP library, which currently provides the highest quality open-source temporal parsing tools and convenient location parsing tools [31]. Within this context, we harnessed the “parse_time” and “parse_location” functions, integral components of our temporal and spatial standardization processes. The descriptions of these functions are as follows:
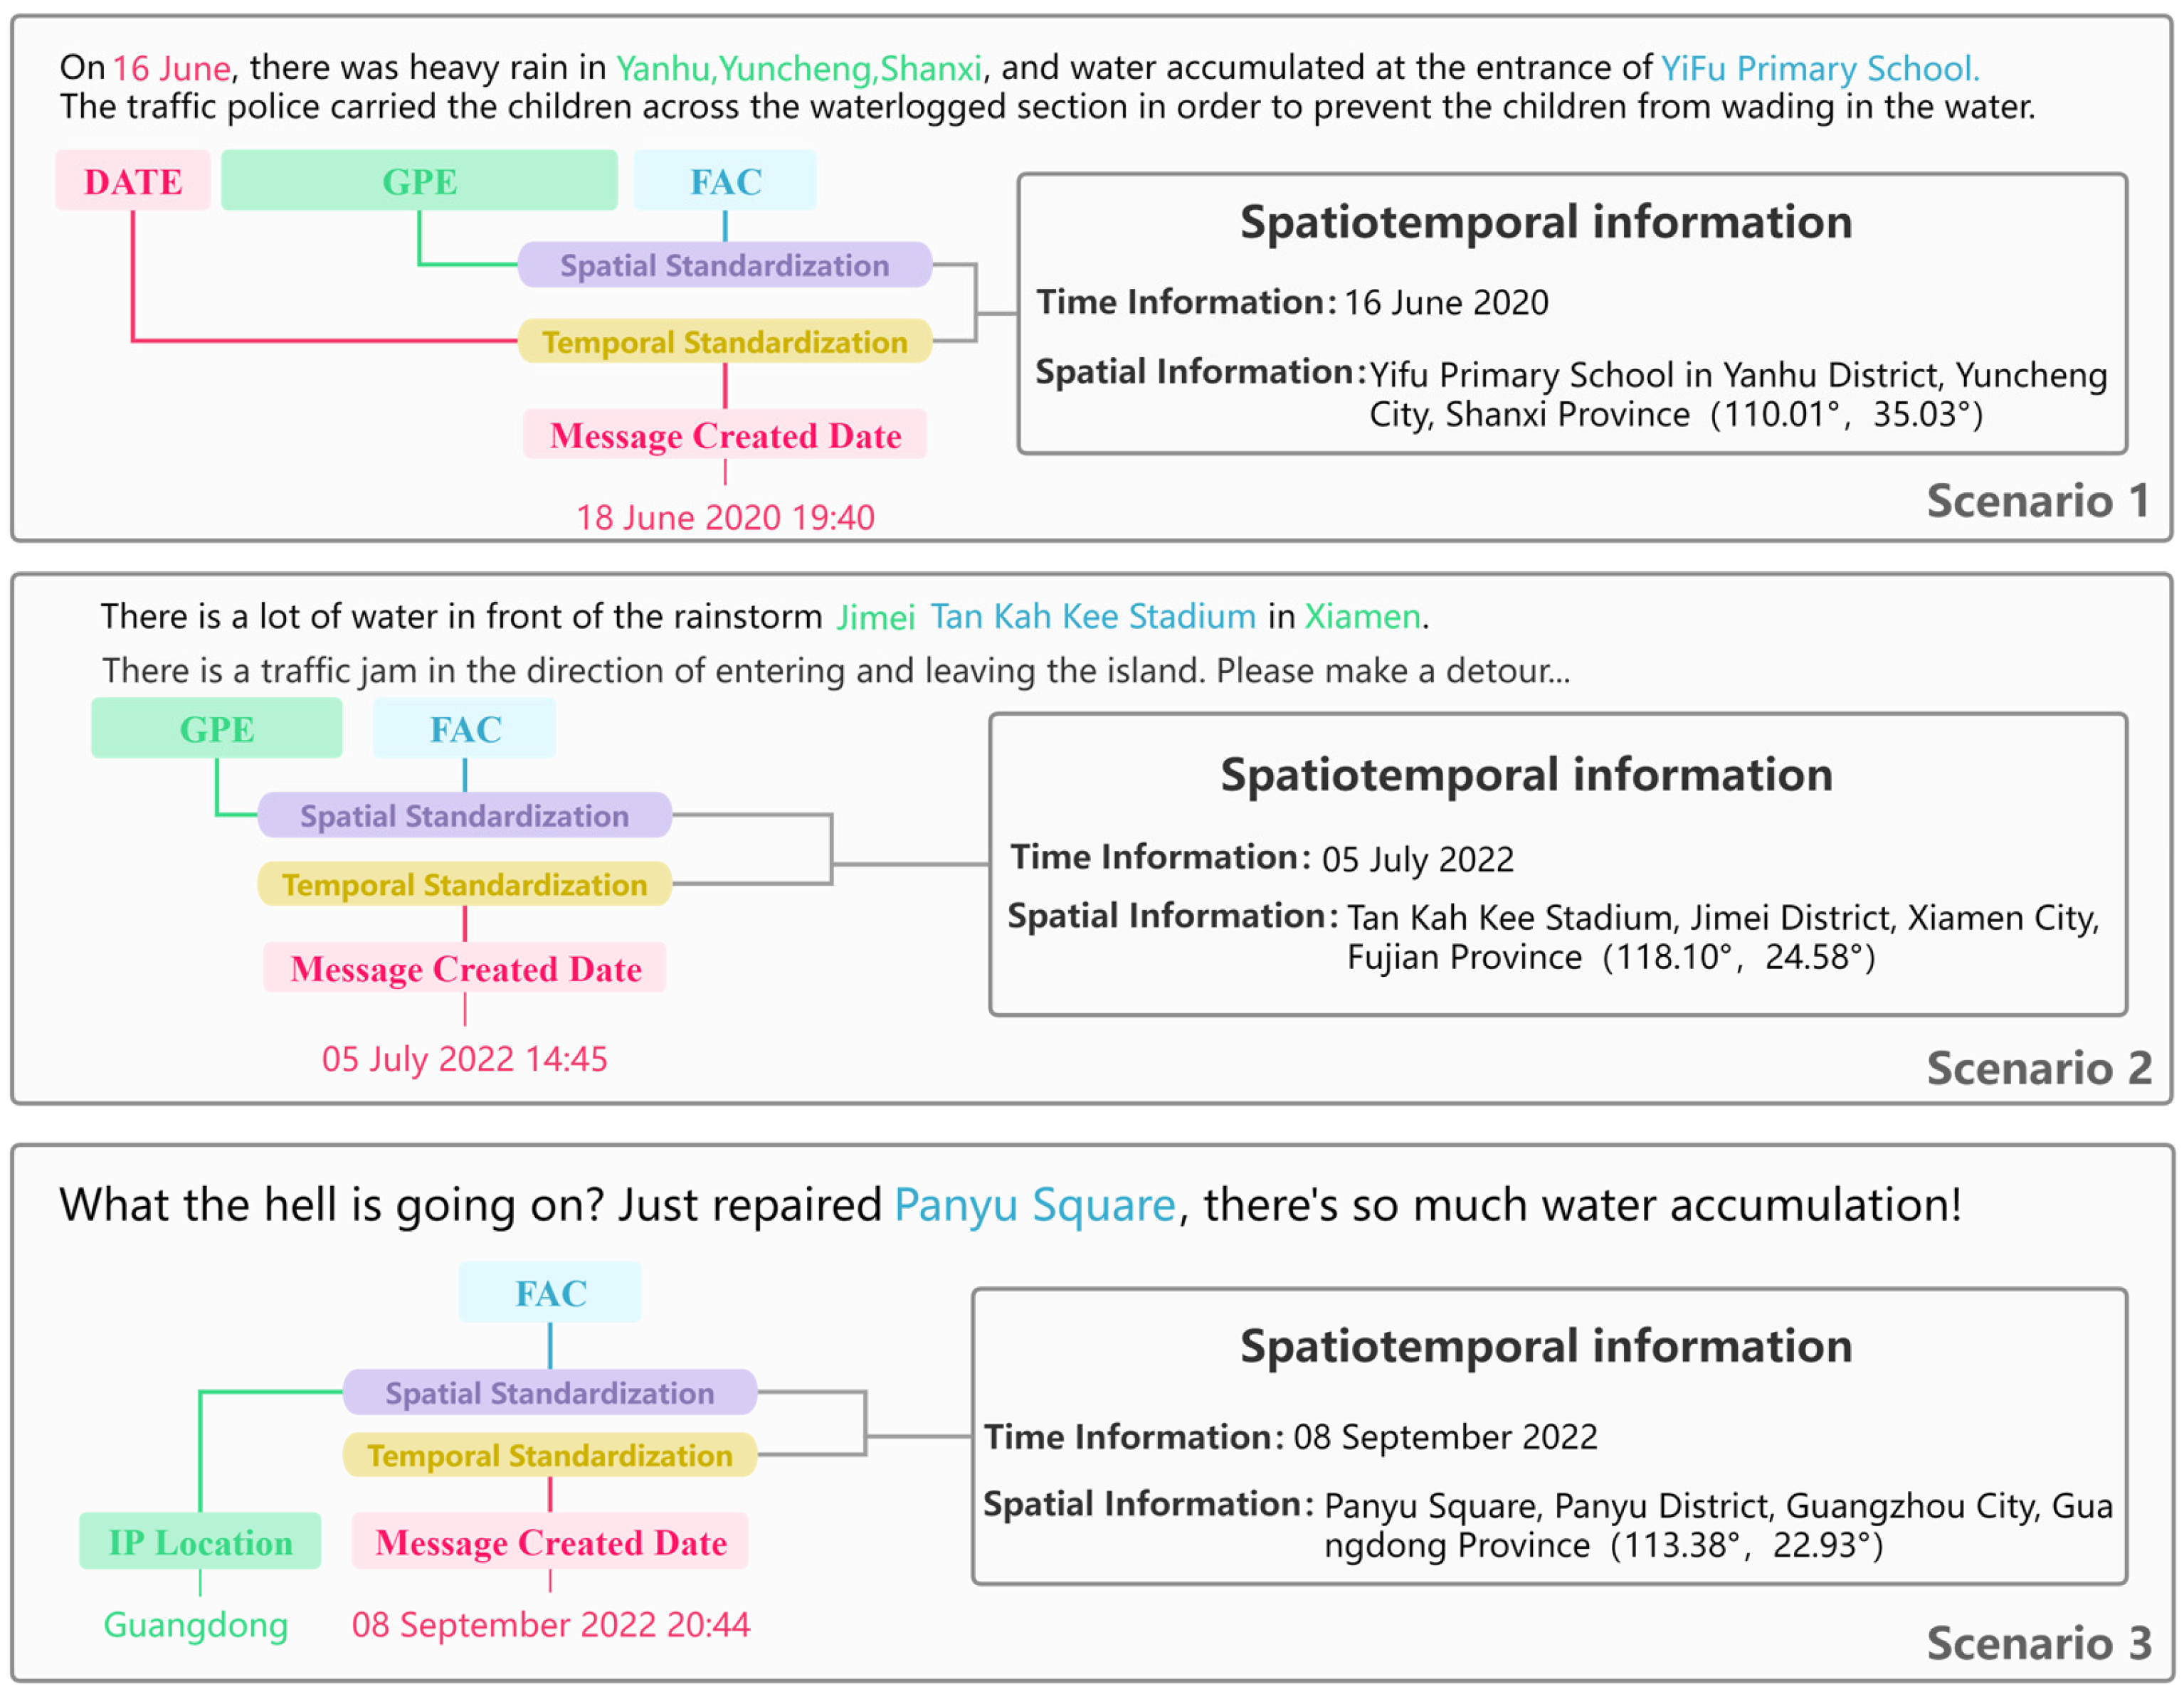
  • parse_time: This function takes as input any expression relating to time (e.g., “yesterday,” “afternoon”) and returns the parsed result, mapping it onto the real-time axis (in the format of “19 May 2002 20:15:00”). This function corresponds to the “Parse Time” component in the “Time Standardization” section of Figure 2.
  • parse_location: This function accepts input strings relevant to any address (e.g., “Fujian Normal University”) and provides a completed parsing result (e.g., “Fujian Province, Fuzhou City, Minhou County, Fujian Normal University”). This function corresponds to the “Parse Space” component in the “Spatial Standardization” section of Figure 2.
With this, we propose a comprehensive set of stringent standardization rules for spatiotemporal information to facilitate the optimal structuring of potential spatiotemporal information, thereby ensuring a consistent representation across a variety of unstructured text.

2.3.2. Standardization

For temporal standardization, Weibo publication times are standardized to the format “Year–Month–Day,” and omit the specific “Hour–Minute–Second”. This is because events typically occur spontaneously, and it is difficult to determine the exact time of the event based solely on the Weibo publication time and the implied time information in the text. Consequently, the lowest unit of time is retained only up to “Day” rather than the specific Weibo publication time or the detailed specifics implied in the text. Regarding the spatial standardization, we transform the potential spatial information in Weibo posts into a “Province–City–District (County)-Specific Geographic Location” pattern for ease of comprehension during subsequent geocoding and then accurately convert it into the WGS1984 latitude and longitude coordinates for that address.
For this study, a meticulous refinement of spatial information is of paramount significance. Initially, it is imperative to filter out data that lacks Facility (FAC) entities. The rationale behind this step is to exclude instances wherein the text does not explicitly mention facilities. Generally, the presence of relevant entities representing facilities (FAC) within a passage signifies the potential presence of relatively high-precision spatial information. For example, when the text mentions “Fujian Normal University,” it allows for a narrowed scope of location around this entity. Subsequently, the existence of the Geopolitical Entity (GPE) label within the text is assessed. Given that spatial information standardization necessitates a reference point, GPE labels denoting geopolitical administrative entities assume paramount importance. It is worth noting that as of 1 August 2022, the National Internet Information Office in China mandates internet service providers to display users’ IP address geographical information. This development opens new possibilities for texts with FAC labels but lacking GPE labels. In the context of mainland China, cases involving entities outside China’s borders need to be excluded. Upon successful acquisition of texts featuring GPE labels or IP address geographical attributions alongside FAC labels, the “parse_location” function within the JioNLP library is employed to complete partial GPE label content, adhering to the “Province–City–District (or County)” pattern. Finally, this augmented “Province–City–District (or County)” pattern is integrated with FAC information. A rigorous validation process ensues, resulting in the ultimate standardized spatial information structure, which takes the form of “Province–City–District (or County)-Specific Geographic Location.”
In the realm of temporal information standardization, the presence of TIME class labels within the text is crucial. In instances where such labels are absent, the posting date of the microblog is directly utilized as the final standardized time. Conversely, if TIME class labels are present, a forward-looking screening process involving keywords such as “today”, “yesterday”, and “day” is conducted. Leveraging the temporal parsing function within the JioNLP library and utilizing the microblog’s posting time as a foundation, entities designated as TIME are identified, serving as reference points for temporal standardization. Finally, only meaningful instances of discrete time points are retained (e.g., “19 May 2002 20:15:00,” as opposed to time spans). In cases where such instances are absent, the microblog’s posting date (Created Time) is employed as the final temporal reference.
Different statuses of standardization results returned by the above temporal–spatial standardization are mainly categorized into three types as follows: 0; 1; and 2. Here, 0 represents a failure of standardization parsing; 1 represents incomplete standardization parsing, and 2 signifies successful standardization parsing. Based on the different types of standardization parsing, we only geocoded the spatial information after the standardization of types 1 and 2 using the Baidu Map Geocoder API, which converted the standardized addresses into Wgs1984 coordinates.
Through this series of steps, we effectively extract coarse-grained temporal–spatial information and lay the foundation for further research. The overall approach for the standardization of temporal–spatial information in the Weibo text is visualized in Figure 2 and demonstrates the program’s assignment of different status types based on different standardization results. Additionally, three common examples of standardization rules are shown in Figure 3.
While coarse-grained spatial and temporal information has been effectively extracted via the previously described steps, in social media data, users often express location and orientation based on their personal perception and cognition of the geographical environment. Thus, the spatial coordinates extracted through coarse-grained extraction may only reflect a representative building or place, while specific orientation descriptions, such as “nearby”, “at the corner”, and “next to”, etc., are often vague. One solution to this issue is to categorize the standardized addresses into two main classes, namely, roads and nonroads, by referring to the categorization after Baidu Map geocoding. For standardized addresses of road type, street view sampling points are generated at 5-m intervals along the road network vector in the Open Street Map (OSM) that corresponds to the road name. For nonroad-type standardized addresses, a buffer zone with a radius of 200 m is created around the address, and street view sampling points are similarly generated at 5-m intervals along the road network vector in the OSM that has been clipped within this zone.
However, the unpredictability inherent in social media data engenders another quandary: within a single microblog post, the spatial context depicted in an image may not be directly linked to the spatial context conveyed in the accompanying textual content. (Hereafter, we shall denote this relationship between image–text data as “relevance.”) This implies that even if a microblog mentions a particular spatial entity, the image associated with it might not necessarily exhibit relevance to that specific spatial information. Furthermore, owing to the heterogeneous quality of images and videos uploaded by users, there is a scarcity of clear and spatially informative street-view images. (Henceforth, we will refer to these images as “high-quality images.”) To delve deeper into these multimodal data, a semi-automated filtering approach can be adopted.
Initially, the groundwork entails leveraging street view semantic segmentation, followed by a straightforward algorithmic assessment to ascertain if each user-uploaded image qualifies as a high-quality depiction. In other words, a high-quality image must encompass at least three out of four image semantics: road; sky; building; and pole. Subsequently, through manual evaluation, spatial information extracted at a coarse granularity that aligns with the relevance criteria is selected from microblog posts containing high-quality images. This amalgamation forms a pair of image–text data. Consequently, this process facilitates the curation of high-quality and relevant microblog image–text data, classified as “Positive”(See the upper part of Figure 4 for details), while instances devoid of both high-quality and relevant images conform to the coarse-grained standardized spatial points labeled as “Negative”(See the bottom half of Figure 4 for details).

2.4. Fine-Grained Extraction of Spatial Information

To extract fine-grained spatial information from the high-quality microblog image–text data above, a series of image processing techniques are required to compare it with street view images that already contain spatial information and, thereby, screen out the best match for spatial information migration. In this process, the matching degree between the social media images and street view images determines the reliability of the fine-grained spatial information. To maximize the reliability of this process as much as possible, we designed a cascade model LSGL based on match–extraction–evaluation.

2.4.1. Feature Match

Given the randomness of social media, most user-uploaded images are blurry, which greatly affects the selection of feature points. To solve this problem, the LSGL model adopts the LoFTR (Local Feature Transformer) [32] feature matching method in the matching stage. This method not only extracts feature points from blurry textures effectively but also maintains a certain relative positional relationship between feature point pairs through a self-attention mechanism and significantly improves the performance of street view image matching.

2.4.2. Feature Match

For the ideal street view image-matching task, the feature-matching degree between buildings generally represents the similarity of the shooting locations of the two scenes. However, in practical operations, the matching task is often affected by the sky, roads, vegetation, and other strong similarity feature information, which results in a large number of feature points in the image that do not carry significant reference information. To reduce the influence of irrelevant information on the matching task, LSGL adopts the DETR model [33], which can efficiently segment images and label them at a relatively low-performance overhead level, thereby extracting practical reference feature points from the images for further evaluation.

2.4.3. Evaluate

To select the best-matched street view image from all the matching results and extract its coordinates, a quantifiable indicator is required to assess the degree of image matching. With this goal in mind, we rely on the reference feature points of each scene to design this indicator from two dimensions as follows: the feature point feature vector matching degree and the feature point spatial position difference.
First, we consider the feature point feature vector matching degree. The LoFTR feature matching method can output the feature point coordinates and the corresponding confidence. We first filter out feature points not within the target category based on their coordinates. Then, we use an exhaustive statistical method to calculate the number of remaining feature points. Subsequently, the confidence of each feature point is multiplied and added, and the average of the cumulative result is used as the confidence of all feature points in the image. In mathematical terms, this is represented as follows:
R = i = 0 n C i n ,
In this formula, R represents the feature vector matching degree of the feature point; n represents the number of feature points, and C i signifies the confidence of the feature points.
Second, we consider the spatial position difference in the feature points. As user images come from Weibo and are influenced by user devices, shooting level, etc., the features and objects in their images may be slightly offset compared to street view images. However, the spatial relationship between feature points should remain similar. Therefore, based on the coordinates of each pair of feature points in their respective images, we calculate their Euclidean distance and Euclidean direction as follows:
E d = ( x x 0 ) 2 + ( y y 0 ) 2 ,
E a = t a n 1 y y 0 x x 0 ,
In Equations (2) and (3), E d and E a , respectively, denote the Euclidean distance and direction of the feature points in the user image and the reference image. x   a n d   y represent the coordinates of the feature points in the user image, while x 0 and y 0 signify the coordinates of the feature points in the reference image.
To assess the impact of changes in Euclidean distance and direction on the spatial position of feature points, we calculate the root mean square error for these two indices separately, which results in R M S E d   and R M S E a . Multiplying these two values yields the spatial position discrepancy of the feature points, as shown in the following equation:
S M = R M S E d × R M S E a ,
Standardizing the indicators can more intuitively reflect the relative advantages of the evaluation results. Therefore, it is necessary to process the results of individual evaluations and round evaluations. The main methods are as follows:
S t a n R = R R m a x R m i n ,
S t a n S M = S M S R m a x S R m i n ,
In these equations, R and S M represent the matching degree and spatial position discrepancy of the feature vector in a single match, respectively. R m a x and R m i n are the optimal and worst feature vector matching degrees in a single round of matching, respectively.   S R m a x and S R m i n are the optimal and worst spatial position discrepancies in a single round of matching, respectively.
Given the differing impacts of these two factors on the results of feature-point matching, we constructed the following final scoring method:
M = S t a n R S t a n S M ,
The more reliable the result of feature matching, the higher the feature vector matching degree and the lower the spatial position matching degree.
Finally, we select the image with the optimal M value from all matching results and obtain its specific coordinates. Then, we return this as fine-grained spatial information. Through this series of processes, we established a cascaded model that can better extract fine-grained spatiotemporal information. Figure 5 shows the impact of each level in this model on the image-matching result.The colors of the matching lines represent the confidence level of the feature points, transitioning from blue (low confidence) to red (high confidence).

3. Experimental Setup

3.1. Research Event

This paper selected the “20 July Heavy Rainstorm in Zhengzhou” as the experimental event to verify the effectiveness of the MIST-SMMD method and conduct an accuracy assessment. This event had widespread impacts, caused severe disaster losses, and attracted much attention in society. During the period from 2020 to 2023, the number of posts related to urban waterlogging due to this event was the highest on Weibo and provided rich research value.
We targeted the situation of urban waterlogging and selected 11 keywords that are highly related to waterlogging events, namely, “urban waterlogging, accumulated water, inundation, flooding, water intrusion, water rise, water disaster, washing away, drainage, wading through water, and water entering,” to crawl and preprocess Weibo data from 18 July 2021 to 20 July 2021. After character cleaning, applying classification models, and removing similar articles in the preprocessing steps, we enhanced the dataset’s quality and relevance to the target event and, thereby, obtained a structured dataset regarding the “20 July Heavy Rainstorm in Zhengzhou” event. This lays a solid foundation for our subsequent extraction of coarse-grained and fine-grained spatiotemporal information. Table 3 shows the statistics of the preprocessed Weibo data during the three days of crawling.
Table 3 shows that the original Weibo data related to urban waterlogging decreased from 26,560 entries to 3047 structured data entries after preprocessing. Moreover, data with both text and images (videos) are always more informative than the data with text only, which further proves the richness of other modalities in social media data.
However, as Weibo is a social media platform facing China and the world, it is necessary to first perform coarse-grained spatiotemporal information extraction and then further narrow it down to the spatial scope of Zhengzhou City. Subsequently, from the Weibo posts with spatial information extracted at the coarse-grained level, we selected 23 pairs of high-quality Weibo text and image data, which were termed “Positive,” while the standardized address points at the coarse-grained level without high-quality, relevant images were termed “Negative”. Figure 6 displays the distribution of urban waterlogging event points in China (a) extracted at the coarse-grained level during the three days and the positive and negative points within the urban area of Zhengzhou (b) used for evaluating and validating the spatial information extracted at the coarse-grained and fine-grained levels in the next section. The ground truth includes the submerged spatial distribution (including water bodies) extracted using the GF-3 radar satellite and the official waterlogging points. It should be noted that the submerged spatial distribution extracted through the GF-3 radar satellite includes water bodies, and so the water bodies with regular water levels will be excluded in the subsequent coarse-grained spatial information extraction.

3.2. Experimental Environment

The evaluation testing environment for MIST-SMMD runs on the deep learning frameworks of PyTorch 1.10.0 and TensorFlow 2.6, and a performance assessment was completed on a Windows Server 2016 workstation equipped with a Tesla P40 GPU, a dual-route E5 2680 V2 CPU, and 64 GB RAM.

3.3. Evaluation Metrics

To comprehensively evaluate the accuracy of the extracted event point spatial information and verify the advantages of multimodal data, this study designed two methods for evaluation.
The accuracy of the standardized spatial information extracted at the coarse-grained level is based on the spatial distribution of flood inundation during the Zhengzhou City heavy rain and flood disaster as the benchmark dataset. When the spatial information exists in a submerged area within a specified nearby range, the spatial information is considered accurate. It should be noted that our method mainly serves as a supplement to traditional methods, so we only evaluate the precision metric and do not involve recall.
The calculation formula for spatial precision is as follows:
S p a t i a l   P r e c i s i o n = T P T P + F P ,
Herein, T P denotes the number of inundation areas present within the designated proximity of each extracted coarse-grained inundation point, while F P represents the number of cases in which no inundation areas exist within the specified proximity of each coarse-grained inundation point.
For the 23 coarse-grained spatial data points refined by fine-grained correction extracted in this case, we use S p a c e   E r r o r as an evaluation index to standardize different methods due to the limited sample size. Furthermore, we extended two different indicators as follows: the error between the spatial coordinates after fine-grained correction and the actual coordinates under limited sample evaluation and the superiority of spatial information incorporating image modality compared to using textual unimodal spatial information alone.
S p a c e   E r r o r = ( L o n t r u e L o n f i n ) 2 + ( L a t t r u e L a t f i n ) 2 ,
M A E S E = 1 n i = 1 n S p a c e   E r r o r ,
R M S E S E = 1 n i = 1 n ( S p a c e   E r r o r ) 2 ,
where ( L o n t r u e , L a t t r u e ) refers to the longitude and latitude coordinates of the official inundation points corresponding to the content of the Weibo posts mentioned above; ( L o t f i n , L a t f i n ) represents the longitude and latitude coordinates extracted by fine-grained methods, and n stands for the sample size.

4. Experimental Results and Analysis

4.1. Effectiveness Analysis

In the phase of coarse-grained extraction of spatiotemporal information, we observed that with the enlargement of the defined “proximity” range, there is a corresponding increase in the S p a c i a l   P r e c i s i o n of the extracted points of the urban flooding events as depicted in Figure 7. Notably, we identified two gradient points (referring to the local maxima in the S p a c i a l   P r e c i s i o n curve and indicating points within a certain range where S p a c i a l   P r e c i s i o n rapidly increases). When the range is expanded to 52 m, S p a c i a l   P r e c i s i o n reaches 65.88%, and when further expanded to 60 m, S p a c i a l   P r e c i s i o n climbs to 87.54%. Ultimately, within a 201-m range, spatial precision reaches a peak of 100%. This implies that our method of coarse-grained extraction of spatial information is effective because it covers the majority of the flood-stricken areas within a relatively small range (e.g., 52 and 60 m). Furthermore, in this stage, the pre-trained BERT-Base Chinese model implemented by the spaCy library was utilized for named entity recognition (NER). This model not only possesses the functionality required for this study (including event classification during data preprocessing) but is also ranked first in terms of efficiency among common NLP tools [34], which satisfies our need for processing large volumes of Weibo data. Although this model and technology can efficiently accomplish the task, there may still be uncertainties inherent to the model and technology, such as bias in extraction results when dealing with ambiguous or vague text.
After conducting fine-grained extraction of spatial information on 23 pairs of high-quality image–text data, Table 4 shows that both M A E S E and R M S E S E are above 50 even in the multimodal case (Text + Images), which is mainly due to the influence of some outliers with large errors. However, in reality, and as seen from Figure 8, the majority of data points maintain a low level of S p a c i a l   E r r o r (approximately 20). This level of error is sufficient to meet the requirements of many practical applications, such as providing real-time and accurate spatial information for guiding rescue and relief operations in response to sudden urban disasters or events (e.g., floods and earthquakes). In this context, social media data serve as a low-cost data source with extensive coverage and effectively complement traditional monitoring systems. Moreover, we discovered that compared to the coarse-grained extraction method based solely on text, fine-grained extraction significantly reduces spatial errors (Figure 8) with overall improvements of 95.53% and 93.62% in M A E S E and R M S E S E , respectively (Table 4). This result verifies that utilizing multimodal data, such as images and videos, in the extraction process can effectively compensate for the insufficiency in spatial accuracy of single-modal extraction methods and, thereby, enhance the precision of spatial information.
Despite the relatively small number of these 23 pairs of image–text data points, our method still has value. Due to the spontaneous nature of social media data, there are relatively few data points with high-quality images, but this situation is expected to improve with the proliferation of social media and advancements in internet technology. Moreover, in the future, multi-modal fusion classification models can be trained with high-quality social media image–text data to achieve high-quality image–text large-scale data collection on social media and reduce misselection and errors caused by manual screening of high-quality data being missed. Moreover, we acknowledge that larger datasets can enhance the robustness of the findings and their applicability to wider contexts. Against this backdrop, our study lays the groundwork for future studies that may involve larger and more diverse datasets, thereby providing broader insights.
There is still considerable room for improvement in reducing the time cost of fine-grained extraction of spatial information. Due to the significant variation in road lengths, the number of street view sampling points markedly fluctuates due to the coarse-grained standardization of road types, which further impacts the stability of time costs. Conversely, for nonroad type coarse-grained standardized addresses with a 200-m buffer and generating sampling points every 5 m, an average of 635 sets of street view images are obtained for a single event point totaling 2540 images. The average time consumed for acquisition and matching per image is 2.55 s; thus, the total average time required is 1 h and 48 min. Additionally, due to API request limitations for street view image data, the image acquisition time may increase if the model is used outside mainland China. Notably, when processing multimodal data and although our method classifies text, the problem remains regarding how to determine whether images are relevant to the standardized address. This could lead to a large number of irrelevant images being matched with text and indirectly increase the time cost. Moreover, from a data perspective, street views only cover fixed routes, and not all areas have street views. Furthermore, factors such as the quality and shooting angle of user-uploaded images could also affect the extraction results. During image matching analysis, the accuracy may also be limited by the training data of the model and the generalization ability of the model itself.
In summary, the coarse-grained and fine-grained spatial information extraction methods proposed in this paper demonstrate significant effectiveness. Through comparisons of spatial distribution maps and specific metrics, we found that the fine-grained extraction method can significantly improve spatial accuracy. This result confirms that employing multimodal data for fine-grained spatial information extraction can effectively compensate for the deficiencies of single-modal extraction methods and contribute to more precise monitoring and responses to urban events. However, it is essential to emphasize that our method should be viewed as supplementary. As mentioned earlier, in multimodal data from social media, the volume of data that can simultaneously achieve spatiotemporal normalization parsing and accurate image matching is not large. Therefore, the spatiotemporal information extracted from social media data should only serve as an effective supplement to traditional urban event monitoring and not as a complete replacement for conventional methods.

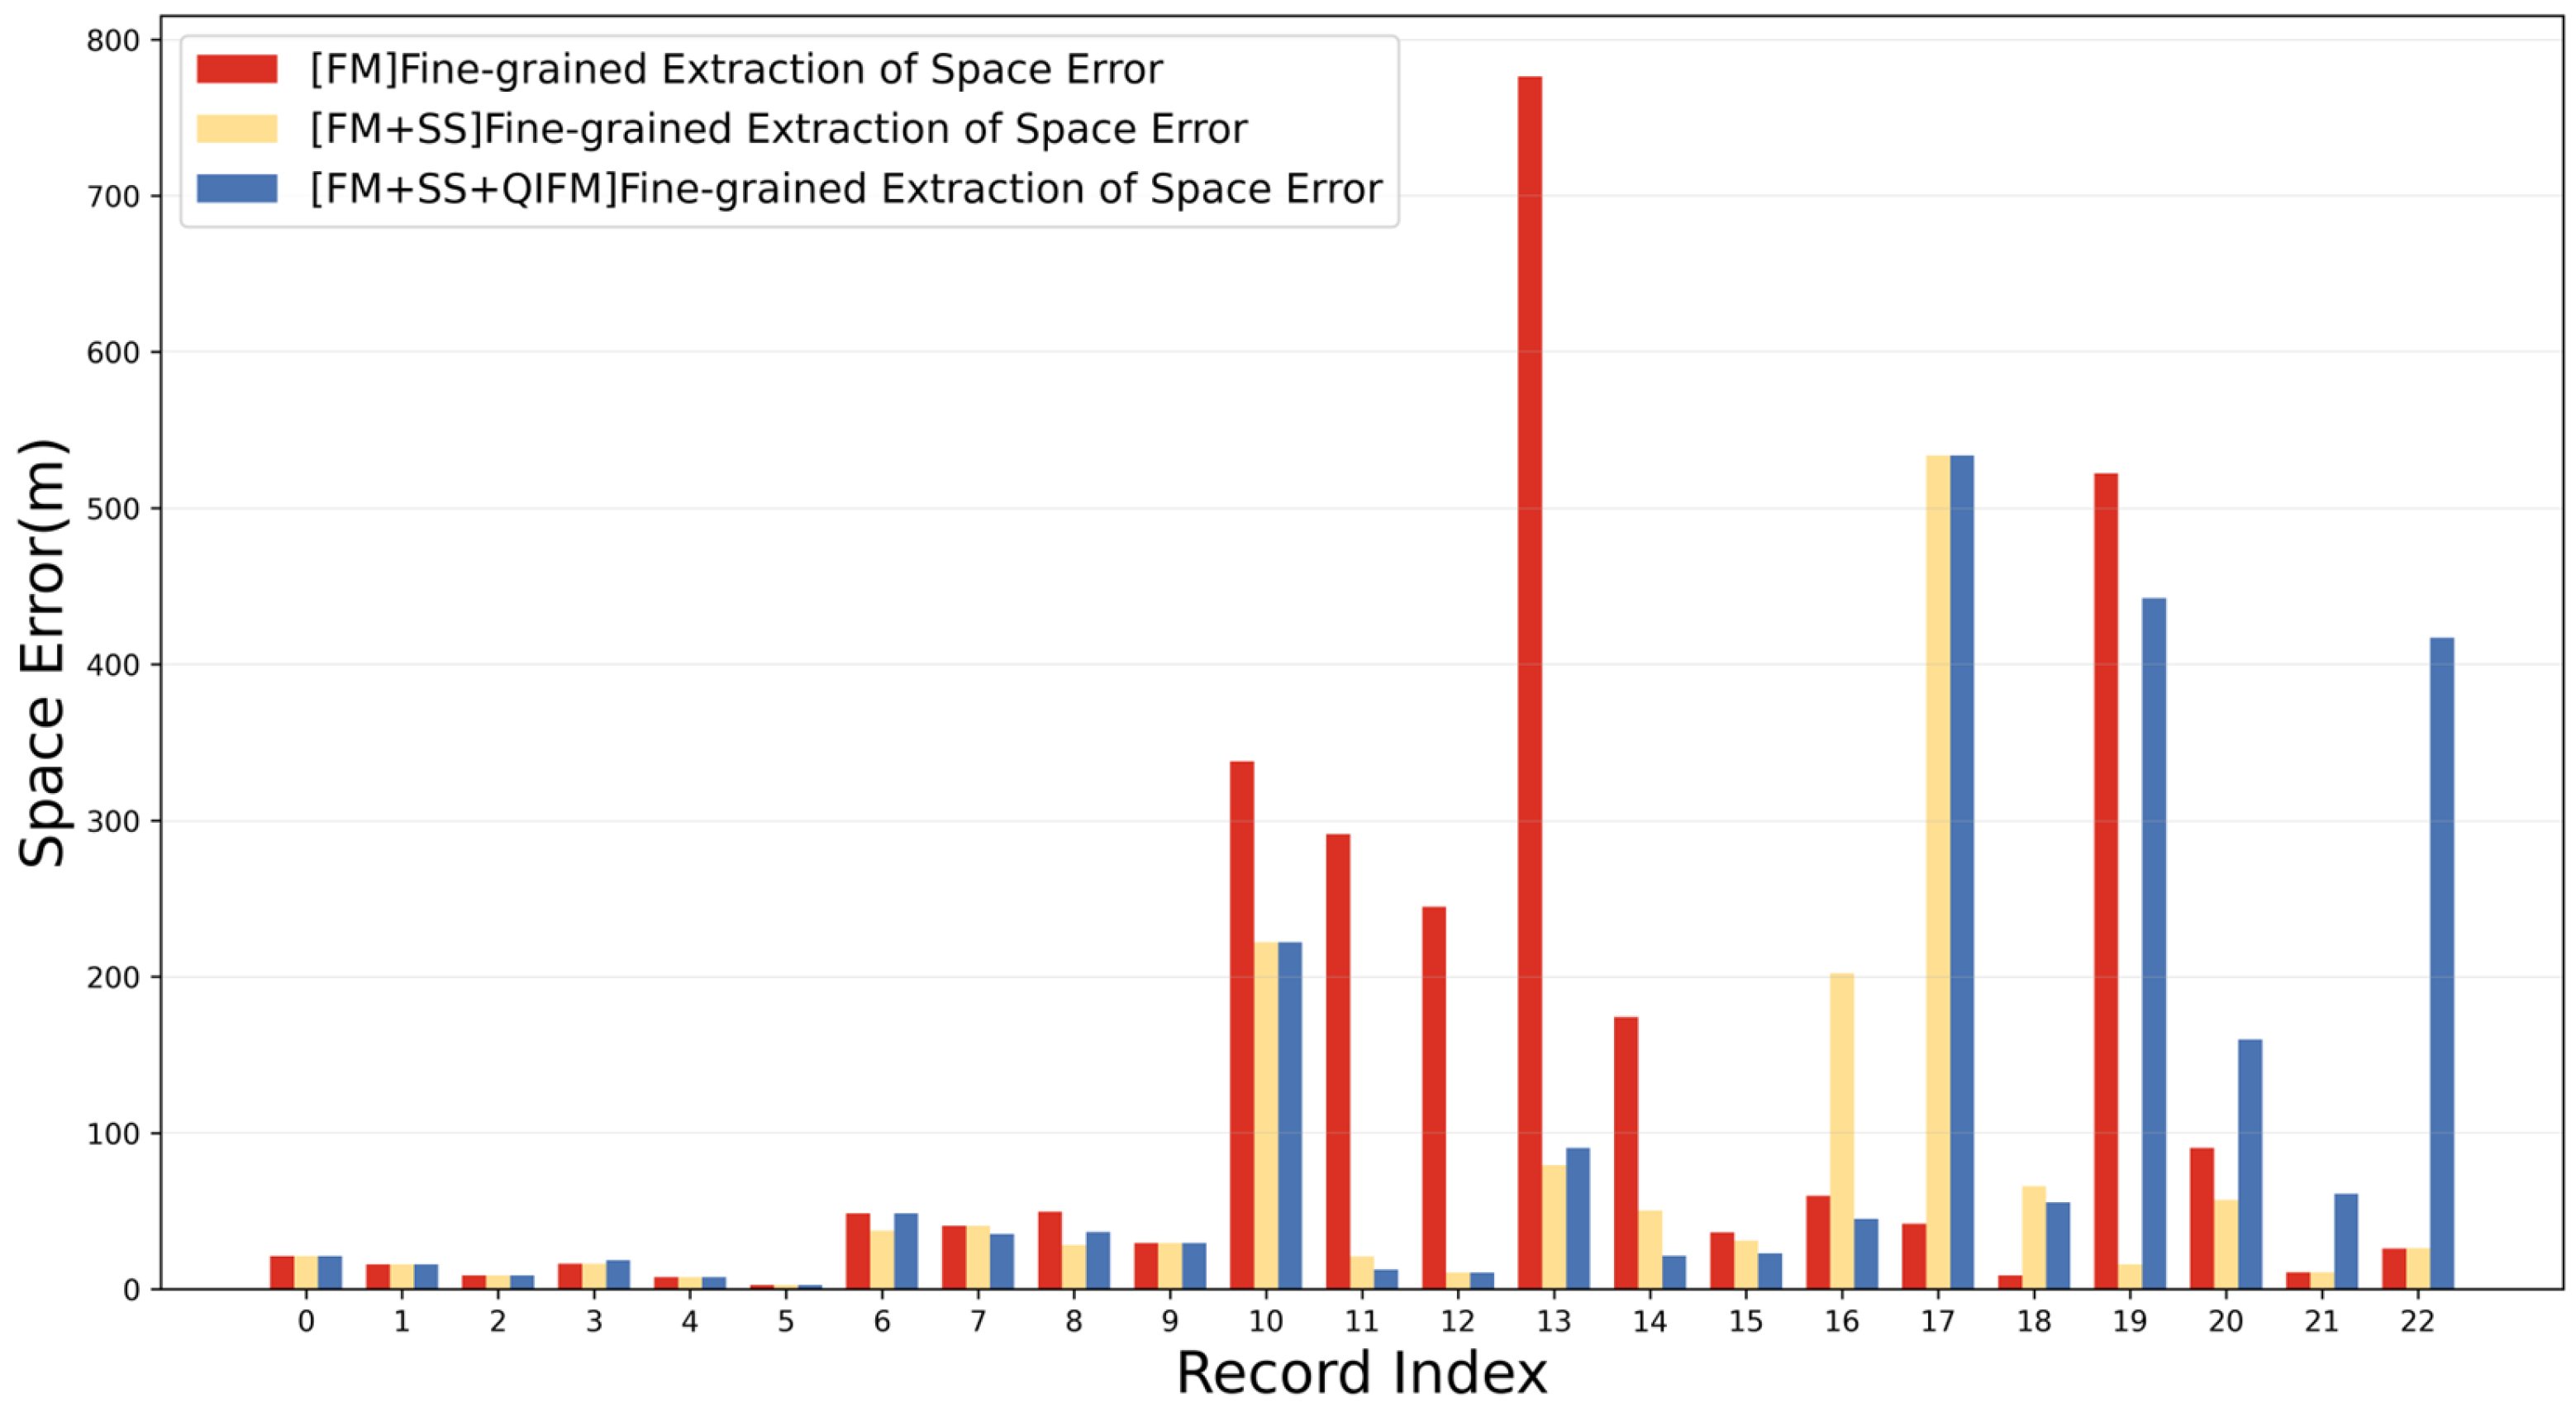
4.2. Analysis of Fine-Grained Extraction

Additionally, during fine-grained extraction, we also conducted ablation experiments to compare the advantages of the LSGL model with the introduction of masking and similarity matching algorithms in the extraction of fine-grained spatial information. As seen in Table 5, whether M A E S E or R M S E S E metrics, the combination of FM + SS performed the best overall while using only FM performed the worst. This is not entirely consistent with our initial expectation that FM + SS + QIFM would be optimal. Additionally, compared to the other two combinations, and although using only FM has the poorest performance, in reality, using only FM still plays a significant role and shows a substantial improvement over the performance of coarse-grained spatial information extraction.
Figure 9 shows the error performances ( M A E S E ) of the four different combinations in the ablation experiments across 22 case studies. Based on the performance of each case study combination, we categorized the results as shown in Table 6.
In the cases of experimental samples RI.0–RI.9, the results of all four ablation experiment methods are consistent, and S p a c i a l   E r r o r is relatively low. This generally occurs when the resolution of images uploaded by social media users is high, and the images contain a large number of semantic feature points, such as buildings, which are easily distinguishable. This consistency reflects our method’s dependency on high-quality images. Specifically, as shown in Figure 10a, high-quality images uploaded by users provide clearer and more detailed visual information and features, such as buildings, which aid the LSGL in more accurately identifying and extracting the spatial information of event points. However, this also implies that the method may face challenges when the image quality is too low or lacks key features of building facades, as seen in the experimental sample RI.10 and shown in Figure 10b.
For experimental samples RI.10–RI.16, we found that incorporating SS and QIFM can significantly enhance the performance of LSGL. This is mainly because SS can effectively filter out irrelevant background information, and QIFM can provide a more intuitive and precise spatial distance measure. The combination of these two methods allows LSGL to pinpoint the location of urban flooding event points with greater accuracy and, thereby, improve the overall spatial precision. However, for experimental samples of RI.19–RI.22, the inclusion of QIFM worsened the results. This is primarily due to the limitations of the semantic segmentation model used for masking, which results in the generation of imprecise masks. In this scenario, inaccurate masks may not be able to fully eliminate features such as cars and pedestrians that affect street view matching (as shown in Figure 11), and the matching results of these noise points usually result in abnormal Euclidean distances and directions and interfere with the calculation of spatial position discrepancies.
Furthermore, cases RI.16–RI.22 are somewhat unique, as demonstrated by the experimental results of RI.19 in Figure 12. Within the buffer range, there are many buildings with strong regular textures that are similar to the target scene. When matching points lack high confidence, other smaller elements in the scene, such as utility poles and sidewalks, become crucial for improving the results of LSGL. However, due to lower image resolutions, these smaller elements are often excluded from the mask. In such cases, further fine-grained extraction can actually lower the S p a c i a l   E r r o r . This suggests that although SS and QIFM improve results in most cases, we need to be aware of their possible limitations and challenges.

4.3. Limitations Analysis

Even though we optimized various algorithms during the model design process, this method still has limitations. In our research, we found that the geospatial information carried by some social media images does not align with the geographical location information contained in their text. As a result, the coarse-grained location information extracted from the text already deviates significantly from the actual results, leading to anomalies in fine-grained results. Furthermore, the quality assessment of social media images cannot be simply calculated through quantitative models. Factors such as image resolution, exposure conditions, and rotation angles introduce blurriness to image features, thereby introducing noise.
Additionally, the accuracy of the model’s operational results is influenced by the density and timeliness of local street-view images. When the density of street-view image collection is too low or the collection time is outdated, the matching results between street-view images and social media images may be less convincing. Most importantly, in the research process, although our primary target for collecting social media data is public media, during the collection process, we unavoidably collected images uploaded by some individual users and self-media contributors. When processing this portion of information, we removed all personal information about the uploading users to mitigate potential privacy infringements. However, we still cannot effectively avoid issues related to location privacy and image copyright infringement.

5. Conclusions

This study presents the innovative MIST-SMMD method, which can extract the spatiotemporal information of urban events from coarse to fine-grained through hierarchical processing. Leveraging the advantages of multimodal data, our research reveals the enormous potential of social media data (especially Weibo) as a source for acquiring dynamic, high-precision information on urban events.
Our method can be broadly applied to the field of urban disaster management and also has potential in other areas where real-time and precise spatial information is needed. For example, in the monitoring and management of traffic congestion and accidents, since not all road sections are equipped with monitoring equipment, our method can provide on-site spatiotemporal information about traffic congestion or current situations based on real-time information from social media. This can help traffic management departments adjust signal light settings in a timely manner or promptly dispatch rescue vehicles. Moreover, picture and video data on social media have potential utility value, for example, to extract the severity of events or for data archiving, temporal tracking, and further in-depth analysis of the same events at different time points.
Future research could explore more potential directions and improvement strategies, including adopting more advanced models to enhance the accuracy of urban event classification and named entity extraction, more comprehensively integrating unutilized information in social media, and introducing other types of data sources to enhance the robustness of data extraction and analysis. Furthermore, we believe that the real-time extraction and processing of event information from multimodal social media data has significant potential for urban emergency systems, and it could contribute to more efficient and timely urban management, command, and disaster reduction work.

Author Contributions

Conceptualization, Yilong Wu and Yingjie Chen; methodology, Yilong Wu and Yingjie Chen; software, Yilong Wu, Yingjie Chen, Rongyu Zhang, and Zhenfei Cui; validation, Yilong Wu and Yingjie Chen; data curation, Yilong Wu, Yingjie Chen, Zhenfei Cui, Xinyi Liu, and Jiayi Zhang; writing—original draft, Yilong Wu, Yingjie Chen, Zhenfei Cui, Xinyi Liu, and Jiayi Zhang; writing—review and editing, Meizhen Wang and Yong Wu; visualization, Yilong Wu and Yingjie Chen; supervision, Meizhen Wang and Yong Wu; funding acquisition, Yilong Wu and Yong Wu. All authors have read and agreed to the published version of this manuscript.

Funding

This research was funded by the Special Fund for Public Welfare Scientific Institutions of Fujian Province (Grant No.2020R1002002) and School-level Innovative Entrepreneurial Training Plan for College Students of Fujian Normal University (Grant No.cxxl-2023292).

Data Availability Statement

Lu et al., 2022. Spatial distribution dataset of flood inundation in Zhengzhou City, Henan Province, July 2021 by heavy rainfall and flooding; ChinaGEOSS Data Sharing Network; 2017YFB0504100.

Acknowledgments

Thanks to Guangfa Lin and Xiaochen Qin for their constructive suggestions and Shuying Luo for her art support.

Conflicts of Interest

The authors declare no conflict of interest.

References

  1. Weibo Reports Fourth Quarter and Fiscal Year 2022 Unaudited Financial Results. Available online: http://ir.weibo.com/node/8856/pdf (accessed on 15 May 2023).
  2. Song, Y.; Huang, B.; He, Q.; Chen, B.; Wei, J.; Mahmood, R. Dynamic assessment of PM2.5 exposure and health risk using remote sensing and geo-spatial big data. Environ. Pollut. 2019, 253, 288–296. [Google Scholar] [CrossRef]
  3. Li, Z.; Wang, C.; Emrich, C.T.; Guo, D. A novel approach to leveraging social media for rapid flood mapping: A case study of the 2015 South Carolina floods. Cartogr. Geogr. Inf. Sci. 2018, 45, 97–110. [Google Scholar] [CrossRef]
  4. Zhang, Z. Spatial Analysis of Internet Sensation Based on Social Media—Taking the Jiuzhaigou Earthquake as an Example. Master’s Thesis, Nanjing University, Nanjing, China, 2019. [Google Scholar]
  5. Li, S.; Zhao, F.; Zhou, Y. Analysis of public opinion and disaster loss estimates from typhoons based on Microblog data. J. Tsinghua Univ. Sci. Technol. 2022, 62, 43–51. [Google Scholar]
  6. Wu, Q.; Qiu, Y. Effectiveness Analysis of Typhoon Disaster Reflected by Microblog Data Location Information. J. Geomat. Sci. Technol. 2019, 36, 406–411. [Google Scholar]
  7. Liang, C.; Lin, G.; Zhang, M. Assessing the Effectiveness of Social Media Data in Mapping the Distribution of Typhoon Disasters. J. Geogr. Inf. Sci. 2018, 20, 807–816. [Google Scholar]
  8. Yu, M.; Bambacus, M.; Cervone, G.; Clarke, K.; Duffy, D.; Huang, Q.; Li, J.; Li, W.; Li, Z.; Liu, Q. Spatio-temporal event detection: A review. Int. J. Digit. Earth 2020, 13, 1339–1365. [Google Scholar] [CrossRef]
  9. Etzioni, O.; Cafarella, M.; Downey, D.; Kok, S.; Popescu, A.-M.; Shaked, T.; Soderland, S.; Weld, D.S.; Yates, A. Web-scale information extraction in knowitall: (preliminary results). In Proceedings of the 13th International Conference on World Wide Web, New York, NY, USA, 17–20 May 2004; pp. 100–110. [Google Scholar]
  10. Ritter, A.; Etzioni, O.; Clark, S. Open domain event extraction from twitter. In Proceedings of the 18th ACM SIGKDD International Conference on Knowledge Discovery and Data Mining, Beijing, China, 12–16 August 2012; pp. 1104–1112. [Google Scholar]
  11. Huang, Z.; Xu, W.; Yu, K. Bidirectional LSTM-CRF Models for Sequence Tagging. arXiv 2015, arXiv:1508.01991v1. [Google Scholar]
  12. Devlin, J.; Chang, M.W.; Lee, K.; Toutanova, K. BERT: Pre-training of Deep Bidirectional Transformers for Language Understanding. arXiv 2018, arXiv:1810.04805. [Google Scholar]
  13. Ma, K.; Tan, Y.; Tian, M.; Xie, X.; Qiu, Q.; Li, S.; Wang, X. Extraction of temporal information from social media messages using the BERT model. Earth Sci. Inform. 2022, 15, 573–584. [Google Scholar] [CrossRef]
  14. Yuan, W.; Yang, L.; Yang, Q.; Sheng, Y.; Wang, Z. Extracting Spatio-Temporal Information from Chinese Archaeological Site Text. ISPRS Int. J. Geo-Inf. 2022, 11, 175. [Google Scholar] [CrossRef]
  15. MacEachren, A.M.; Jaiswal, A.; Robinson, A.C.; Pezanowski, S.; Savelyev, A.; Mitra, P.; Zhang, X.; Blanford, J. SensePlace2: GeoTwitter analytics support for situational awareness. In Proceedings of the VAST 2011—IEEE Conference on Visual Analytics 458 Science and Technology, Providence, RI, USA, 23–28 October 2011; pp. 181–190. [Google Scholar]
  16. Huang, G.S.; Zhou, Y.; Hu, X.F.; Zhao, L.Y.; Zhang, C.L. A survey of the research progress in image geo-localization. J. Geo-Inf. Sci. 2023, 25, 1336–1362. [Google Scholar]
  17. Ofli, F.; Alam, F.; Imran, M. Analysis of Social Media Data using Multimodal Deep Learning for Disaster Response. In Proceedings of the International Conference on Information Systems for Crisis Response and Management, Blacksburg, VA, USA, 24–27 May 2020. [Google Scholar]
  18. Zou, Z.; Gan, H.; Huang, Q.; Cai, T.; Cao, K. Disaster image classification by fusing multimodal social media data. ISPRS Int. J. Geo-Inf. 2021, 10, 636. [Google Scholar] [CrossRef]
  19. Baltrušaitis, T.; Ahuja, C.; Morency, L.-P. Multimodal machine learning: A survey and taxonomy. IEEE Trans. Pattern Anal. Mach. Intell. 2018, 41, 423–443. [Google Scholar] [CrossRef] [PubMed]
  20. Shuai, X.; Hu, S.; Liu, Q. Internet media-based acquisition and processing model of earthquake disaster situation. J. Nat. Disasters 2013, 22, 178–184. [Google Scholar]
  21. Zhang, S.; Yang, Z.; Wang, Y. Simulation on Flood Disaster in Urban Building Complex System Based on LBM. J. Simul. 2022, 34, 2584–2594. [Google Scholar]
  22. Yuan, F.; Xu, Y.; Li, Q.; Mostafavi, A. Spatio-temporal graph convolutional networks for road network inundation status prediction during urban flooding. Comput. Environ. Urban Syst. 2022, 97, 101870. [Google Scholar] [CrossRef]
  23. Wang, E.K.; Wang, F.; Kumari, S.; Yeh, J.H.; Chen, C.M. Intelligent monitor for typhoon in IoT system of smart city. J. Supercomput. 2021, 77, 3024–3043. [Google Scholar] [CrossRef]
  24. Wang, Z.J.; Chen, X.Y.; Qi, Z.S.; Cui, C.F. Flood sensitivity assessment of super cities. Sci. Rep. 2023, 13, 5582. [Google Scholar] [CrossRef]
  25. Xing, Z.Y.; Yang, S.; Zan, X.L.; Dong, X.R.; Yao, Y.; Liu, Z.; Zhang, X.D. Flood vulnerability assessment of urban buildings based on integrating high-resolution remote sensing and street view images. Sustain. Cities Soc. 2023, 92, 104467. [Google Scholar] [CrossRef]
  26. Zhang, Z.; Wang, Z.; Fang, D. Optimal Design of Urban Waterlogging Monitoring and Warning System in Wuhan Based on Internet of Things and GPRS Technology. Saf. Environ. Eng. 2018, 25, 37–43. [Google Scholar]
  27. Zeng, Z.; Xv, J.; Wang, Y. Advances in flood risk identification and dynamic modelling based on remote sensing spatial information. Adv. Water Sci. 2020, 31, 463–472. [Google Scholar]
  28. Wang, R.-Q.; Mao, H.; Wang, Y.; Rae, C.; Shaw, W. Hyper-resolution monitoring of urban flooding with social media and crowdsourcing data. Comput. Geosci. 2018, 111, 139–147. [Google Scholar] [CrossRef]
  29. Songchon, C.; Wright, G.; Beevers, L. Quality assessment of crowdsourced social media data for urban flood management. Comput. Environ. Urban Syst. 2021, 90, 101690. [Google Scholar] [CrossRef]
  30. BLE, SOCIAL MEDIA & FLOOD RISK AWARENESS. Available online: https://www.fema.gov/sites/default/files/documents/fema_ble-social-media-flood-risk-awareness.pdf (accessed on 15 May 2023).
  31. JioNLP. Available online: https://github.com/dongrixinyu/JioNLP (accessed on 15 May 2023).
  32. Sun, J.; Shen, Z.; Wang, Y.; Bao, H.; Zhou, X. LoFTR: Detector-free local feature matching with transformers. In Proceedings of the IEEE/CVF Conference on Computer Vision and Pattern Recognition, Nashville, TN, USA, 20–25 June 2021; pp. 8922–8931. [Google Scholar]
  33. Carion, N.; Massa, F.; Synnaeve, G.; Usunier, N.; Kirillov, A.; Zagoruyko, S. End-to-end object detection with transformers. In Proceedings of the Computer Vision–ECCV 2020: 16th European Conference, Glasgow, UK, 23–28 August 2020; pp. 213–229. [Google Scholar]
  34. Schmitt, X.; Kubler, S.; Robert, J.; Papadakis, M.; LeTraon, Y. A replicable comparison study of NER software: StanfordNLP, NLTK, OpenNLP, SpaCy, Gate. In Proceedings of the 2019 Sixth International Conference on Social Networks Analysis, Management and Security (SNAMS), Granada, Spain, 22–25 October 2019; pp. 338–343. [Google Scholar]
Figure 1. The Overall Structure of the MIST-SMMD Process.
Ijgi 12 00368 g001
Figure 2. Flowchart of the Spatiotemporal Standardization.
Ijgi 12 00368 g002
Figure 3. Three Common Examples of Standardization (Weibo posts have been translated).
Ijgi 12 00368 g003
Figure 4. Typical High-Quality (Positive) and Low-Quality (Negative) Images.
Ijgi 12 00368 g004
Figure 5. Effect of Each Level of the Model on the Matching Results.
Ijgi 12 00368 g005
Figure 6. (a) Spatial Distribution of Inundation Points from Coarse-Grained Extraction in China from 18 to 20 July 2021; (b) Official Iundation Points and Area in Zhengzhou City from 18 to 20 July 2021.
Ijgi 12 00368 g006
Figure 7. Spatial Precision of Coarse-grained Spatial Information Extraction within Different Buffer Ranges.
Ijgi 12 00368 g007
Figure 8. Comparison of Coarse and Fine-grained Extraction.
Ijgi 12 00368 g008
Figure 9. Ablation Experiments for Fine-grained Extraction.
Ijgi 12 00368 g009
Figure 10. Matching Results of the LSGL with High-Recognizability Images (a) and Low-Recognizability Images (b).
Ijgi 12 00368 g010
Figure 11. The Effect of Noise Points on LSGL Matching Results.
Ijgi 12 00368 g011
Figure 12. LSGL Matching Results in Complex Scenarios.
Ijgi 12 00368 g012
Table 1. Normative City Event Weibo Dataset Example (Step One Output).
Weibo Post 1Post
Information
Post Information Values
Ijgi 12 00368 i001Created time19 July 2021 14:28:17
IP LocationNo data
On 19 July, reporters discovered significant water accumulation on Jin Dai Road, Zhengzhou, approximately one kilometer from the southern Fourth Ring Road. The road lanes were severely flooded, with a nearly one-kilometer stretch of accumulated water, spanning the six lanes in both north and south directions. The deepest point of the flooding could submerge half of a vehicle’s wheel. The water was deeper on the outer lanes of the road in both directions, and when vehicles traveled at slightly higher speeds, it caused splashes exceeding twice the height of the vehicle body. Currently, this flooding situation persists, and on-site reporters did not observe any water pumping operations. Why has this particular road section experienced such severe flooding? And why has not there been any drainage operation? Journalists from Henan Traffic Radio will continue to monitor the situation. (5G On-site Reporters, Jing Yi and Lei Jing)Is relevantTrue
Mid 24660679711922369
1 This Weibo post translated from: https://weibo.com/1732802301/Kpsyv845X?refesr_flag=1001030103_ (accessed on 16 August 2023). 2 Unique identification code for each Weibo post.
Table 2. Description of spaCy Named Entity Labels and Label Classes Identified in This Study.
Label TypeNamed Entity LabelsDescription
TIMEDATEAbsolute or relative dates or periods
TIMETimes smaller than a day
GPEGPEGeopolitical entity, i.e., countries, cities, and states
FACLOCNon-GPE locations, mountain ranges, bodies of water
FACBuildings, airports, highways, bridges, etc.
Table 3. Statistics of the Preprocessed Dataset for the July 20 Heavy Rainstorm in Zhengzhou.
TypeOnly TextWith Text + Images (Video)Total
Origin12,33814,22226,560
Text classify6750788614,636
Data clean109619513047
Table 4. Comparison of Spatial Error between Coarse-grained Spatial Information Extraction with Text Modality Only and Multimodal Data Integration for Refining Coarse-grained Spatial Information Extraction with Image Modality.
Space ErrorOnly TextText + ImagesImprovement
MAESE1491.1366.6395.53%
RMSESE2068.43131.8893.62%
Table 5. Comparison of Spatial Error in Coarse-grained and Fine-grained Spatial Information Extraction with Different Combinations.
Space ErrorCoarse-Grained ExtractionFine-Grained Extraction
FM 1FM + SS 2 + QIFM 3FM + SS
MAESE1491.13124.30100.7466.63
RMSESE2068.43227.35181.16131.88
1 Feature Matching; 2 Semantic Segmentation; 3 Quantitative Indicators for Feature Matching.
Table 6. Classification of the Results of Ablation Experiments.
Classification of ResultReasonRI *
Same ResultThe results are all very good0, 1, 2, 3, 4, 5, 6, 7, 8, 9
The results are all not good10
ImprovementImprovement after adding SS10, 11, 12, 13
Improvement after adding SS and QIFM14, 15, 16
DeteriorationDeterioration after adding SS16, 17, 18
Deterioration after adding SS and QIFM19, 20, 21, 22
* Record Index.
Disclaimer/Publisher’s Note: The statements, opinions and data contained in all publications are solely those of the individual author(s) and contributor(s) and not of MDPI and/or the editor(s). MDPI and/or the editor(s) disclaim responsibility for any injury to people or property resulting from any ideas, methods, instructions or products referred to in the content.

