Article

Revealing Schematic Map Designs with Preservation of Relativity in Node Position and Segment Length in Existing Official Maps

State-Province Joint Engineering Laboratory in Spatial Information Technology for High-Speed Railway Safety, Faculty of Geosciences and Environmental Engineering Institute of Sustainable Development of National Land, Southwest Jiaotong University, Chengdu 611756, China
*
Author to whom correspondence should be addressed.
ISPRS Int. J. Geo-Inf. 2023, 12(8), 309; https://doi.org/10.3390/ijgi12080309
Submission received: 26 April 2023 / Revised: 20 July 2023 / Accepted: 26 July 2023 / Published: 28 July 2023

Abstract

:
Schematic maps have widely been used for representing transport networks. In the schematization process, preserving the relative position of nodes and the relative length of segments are considered highly important for constructing spatial cognition. Some researchers have regarded these as general principles of automated schematization. However, in-depth investigations into the conversion of these general principles into specific schematic network map designs are still lacking. This study aimed to empirically investigate how the two relative relations are preserved in existing manually produced schematic maps to better understand and interpret designer thinking. Official underground network maps of 32 cities were used in this study. The results revealed that (1) relative relations were largely preserved with a preservation ratio of approximately 80%, and the global preservation ratios of two relative relations were significantly higher than those of local preservation; (2) the preservation of relative position took priority over the preservation of relative length for the schematic maps with significant enlargement of dense regions; and (3) a reference object may be used for preserving relative relations, for example, the center region or major axis. The findings of this study will assist in developing and/or optimizing design rules for automated schematization while preserving relative relations.

1. Introduction

For many map applications, precise spatial information is not of particular concern; however, visual clarity is of considerable interest. In such cases, map features are usually simplified because detailed information may result in visual overload and clutter. A schematic map is such an example, which is intentionally distorted and simplified to reduce the cognitive load but still provides qualitative descriptions of physical environments [1,2]. The London tube map, originally designed by Harry Beck in 1931 (Figure 1a), is a typical example of a schematic map. The original map is shown in Figure 1b. In recent decades, the automated generation of schematic maps has become an important research topic in the cartographic community, and many automated methods have been developed [3,4,5,6,7,8,9,10,11,12,13,14,15,16,17,18]. In these automated methods of schematic network maps, the available design rules are defined by following the designs utilized in the London tube map, including the preservation of topology, simplification of the shapes and directions of network lines, and enlargement of dense regions [19,20]. However, the generation of schematic maps has not yet been completely codified in cartography, and their underlying design is highly complex [19,21]. Specifically, additional underlying design principles must be incorporated for the automated generation of schematic maps.
An important consideration in the design of a schematic representation is the simplification of shapes that lead to topographical distortion, which should be controlled to minimize misunderstandings in map cognition [22,23]. The relative relationships between map features play an important role in spatial cognition [24,25,26,27]. The relative positions of nodes and vertices have been considered in some schematization algorithms [28,29,30,31]. For map applications, the relative lengths of segments are crucial for effectively conveying route information and decision making [27,31,32], and most users assume that lengths on maps are actual distances that can be used to decide the path choice, even for underground train network maps [26,33]. Consequently, Li [34] indicated that keeping relativities in position and length intact is very desirable unless there is an absolute need to violate them and termed them as the “principle of relativity in position” and “principle of relativity in length”. In the current automated schematization methods that follow these two principles [9,11], the adopted design rules preserve the relative relations for all pairs of vertices or segments on a network map as much as possible.
However, if the design rule conflicts with other map designs that consider representation clarity and esthetics (e.g., greatly shrinking peripheral regions relative to the central region in the London tube map), preservation of all relative relations may not be reasonable. One reason may be that the degrees of importance of relative position and length are different for the cognition of maps [1]. In automated schematization methods, mathematical optimization models have been widely used in the current automated schematization of network maps, and the solution time of such an algorithm is affected by the number of constraints; that is, more constraints increase the model size, slowing down the solution time [35]. However, the constraint construction of relative relations for all pairs of nodes or segments in a network may result in many constraints, significantly reducing the computational efficiency of the automated schematization. Furthermore, the pairwise preservation manner may be intractable for a manually generated design, particularly for larger networks.
Wolff et al. [36] indicated that the available methods for automated schematization still lack awareness of the underlying structures, so automatically generated results were less pleasing than the available manually generated schematic maps. To understand the design process better, some studies have conducted experiments using existing manually generated products. These studies aim to uncover the “underlying structures” while considering user preferences and wayfinding performance [37], simplification styles of lines [22], major axis design [38], color-coding [39], etc. The preservation of relative relations is critical for the understanding and cognition of schematic maps [25,26,27]. This study focused on experimental investigations on the preservation of relations in existing manually generated schematic maps. To the best of our knowledge, this study is a first. The preservation of relative relations is critical to the understanding and cognition of schematic maps used for the qualitative representation of the real environment. This study addresses this gap in the literature. In particular, we aimed to address the following questions:
(1)
How well are the relative relations preserved in existing official schematic maps?
(2)
Should there be a priority for preserving different relative relations?
(3)
To what extent are relative relations preserved in existing official schematic maps?
Our approach consists of (1) estimating the preservation ratios of relative relations in official schematic maps; (2) analyzing the preservation situations of different relative relations; and (3) discussing possible designs for preserving relative relations. Our research aims to shed light on human designers’ ideations by revealing schematic map designs that preserve relative relations. This knowledge will provide valuable guidance and assistance in developing and refining design rules for automated schematization of network maps. Ultimately, our findings will contribute to a deeper understanding of how to enhance the automated map design process while preserving crucial aspects of human-created designs.

2. Methods

2.1. Relative Relations in Network Map Schematization: Definitions

To determine the relative position, three types of reference frames exist: extrinsic, intrinsic, and deictic [40]. For an extrinsic reference system, the origin of the coordinate system is determined based on a reference object, and the orientation is determined by external factors. In an intrinsic reference system, the origin and orientation of the coordinate system are determined based on a reference object. A deictic reference system is constructed using a primary object, a reference object, and a point of view that determines the orientation of the system [41,42]. An extrinsic reference system is desirable to describe the relative position between two nodes on a network map because a node has no intrinsic orientation, and there is no particular point of view in general. Hence, an extrinsic reference system was used in this study. A two-dimensional (2D) coordinate system was applied to define the relative position between two nodes, which are the intersections of segments, as illustrated in Figure 2. In this reference system, the vertex v i is set as the origin of the coordinate system, and the horizontal axis x and vertical axis y are considered reference lines that divide the regions into four zones. Normally, the horizontal direction is from west to east, and the vertical direction is from south to north on a map. Therefore, the vertex v j lies in Zone 1. Preserving the relative position between v i and v j implies that the new location of the vertex v j should still be in Zone 1 or on the positive axes of x and y after schematization.
According to the definition of relativity in length in schematization given by Li et al. [34], if segment 2 , 5 ¯ is longer than segment 2 , 4 ¯ on the original map (Figure 3a), then the length of segment 2 , 5 ¯ should be longer than or equal to the length of segment 2 , 4 ¯ after schematization to preserve the relative length. Figure 3b,c show the correct and incorrect preservations of the relative length of the two segments, respectively.

2.2. Relative Relations in Network Map Schematization: Global vs. Local

In practice, map users generally require detailed information about their nearby surrounding regions and an overview of remote regions [43,44]. In other words, the information detail requirements depend on the distance from a particular position to other map regions. Some previous studies [26,45,46,47] have considered distance relations among spatial objects in qualitative spatial representation and reasoning. This approach aims to provide more efficient and meaningful information, often described by qualitative levels such as near and far, or near, medium, and far.
In our study, we considered distance relations among nodes and segments to assess how changes in distance affect the preservation of relative position and length. By doing so, we aim to identify any potential differences in preservation based on distance.
Some studies have examined relative relations at different levels in schematic map design, involving global preservation for map layout [5,22] and local preservation for adjacent or connecting vertices and lines [28]. In practice, map users generally require detailed information about nearby regions while also seeking an overview of remote areas [43,44]. In other words, the information detail requirements depend on the distance from a particular position to other map regions.
In qualitative spatial representation and reasoning, previous research [26] has considered distance relations among spatial objects to provide more efficient and meaningful information. These relations are typically described qualitatively, using two levels such as near and far, or three levels such as near, medium, and far [45]. In this study, we also consider distance relations among nodes and segments to explore how changes in distance may impact the preservation of relative position and length.
Our investigation focuses on three types of relative relations: relativity in positions for nodes, relativity in length for segments, and distance relations. To achieve local preservation situations for adjacent and connecting nodes and segments, we estimate preservation ratios within near and medium distances. Additionally, preservation ratios within the far distance allow us to achieve global preservation situations. For clarity, we define distances as follows:
(1)
The near distance of a node is defined as the maximum straight-line distance from that node to its adjacent nodes connected by a segment.
(2)
The middle vertex of a segment is used to represent the segment. The near distance of a segment is defined as the maximum straight-line distance from the middle vertex of the segment to the middle vertex of its connecting segments.
(3)
The far distance for a node is defined as the maximum value of the straight-line distance from the node to all other nodes in the network.
(4)
The far distance for a segment is defined as the maximum value of the straight-line distance from the middle vertex of the segment to the middle vertex of all segments in a network.
(5)
The medium distance is the mean value of the near and far distances.
Figure 4a,b show the three types of distances for node N1 and segment L. Considering a node and the middle vertex of a segment as the center point and the three distances (near, medium, and far) as the radius, three circular regions can be formed. This study defined the preservation of relations in the three regions as local, half, or global preservation. Hence, the relative relations can be classified into six classes: local:position, local:length, half:position, half:length, global:position, and global:length.

2.3. Relative Relations in Network Map Schematization: A Strategy

In the analysis experiments conducted in this study, the first step was to quantitatively estimate the preservation ratio of the relative relations for manually generated schematic maps widely used in practice, to verify whether relative relations have been subconsciously preserved by the designers. Before the quantitative estimation, the mathematical definitions of the relative relations in a network, including the relative positions of nodes and the relative length of segments, should be given. Considering that the information detail requirements depend on the distance from a particular position to other map regions, the distance relations among nodes and segments are considered in this study to determine whether there are differences in the preservation of relative position and length with changes in distance relations.
The total preservation of relative relations among all nodes and segments on a map may not be necessary for qualitative spatial representation, for example, in schematic representations of network maps [34]. In designing existing manually generated schematic maps, the compression of sparse and empty regions relative to the central dense region has been adopted as a design rule to improve map clarity, for example, in the London tube map. However, such map distortions may result in difficulties in preserving relative relations. Hence, it is necessary to conduct a quantitative analysis to determine whether there are differences in the preservation of relative relations between manually generated schematic maps with and without noticeable distortions. Furthermore, this analysis helps check whether there is equal importance or priority for the preservation of different relative relations in the case of non-preservation.
In the current automated schematization of network maps, mixed-integer linear programming (often called MIP) is used as an appropriate mathematical model for optimizing schematic maps [9,11,34]. To acquire the optimal solutions of MIP models, exact algorithms (e.g., branch and bound algorithms and cutting plane algorithms) are widely used. However, the time required to acquire optimal solutions of the MIP by such an algorithm is affected by the number of constraints; that is, more constraints increase the model size, which slows down the solution time [9]. Furthermore, in current methods, the constraints for the preservation of relative relations are developed by constructing the relations of each node/segment pair with all other nodes/segments in a network, resulting in many constraints. For example, for the London network containing 97 nodes, 9312 constraints must be constructed to preserve relative positions. As the global and local preservations of relative relations are considered at different levels separately, i.e., for the layout of the whole map and for adjacent or connecting vertices and lines [5,22,28], a qualitative analysis using the different preservation ratios estimated in this study was conducted to better understand how the relative relations were preserved in these manually generated products.
Based on the above considerations, the rest of this article is organized as follows: in Section 3, the preservation ratios of relative relations in official schematic maps are estimated, and an analysis of the preservation situations is conducted; Section 4 conducts a comparative analysis to examine the preservation differences for official schematic maps with and without significant enlargement of dense regions; and Section 5 analyzes possible designs for preserving the relative relations in official schematic maps. Finally, Section 6 presents the conclusions of this study.

3. Results of Experiment 1: Estimating Preservation Ratios of Relative Relations in Official Schematic Maps

As verifying whether designers have subconsciously preserved these relations by visual inspection is difficult, this section presents a quantitative estimation of the preservation ratios for the manually generated schematic maps commonly used in practice. We estimated six combinations of local and global preservation, as described in Section 2.2.

3.1. Measures for Estimating the Preservation Ratios of Relative Relations

According to the definition of relative position in Section 2, for two nodes v i ( x i , y i ) and v j ( x j , y j ) in a network, their relative position can be formulated as follows:
zon e ( i , j ) = 1 ,     i f     x i x j   a n d   y i y j 2 ,     i f     x i x j   a n d   y i y j 3 ,     i f     x i x j   a n d   y i y j 4 ,     i f     x i x j   a n d   y i y j
If the relative positions of the two nodes are maintained during schematization, then the original zon e value should be equal to that of the zon e after schematization. For v i ( x i , y i ) , preservation of the relative position R P ( i , j ) can be written as follows:
R P ( i , j ) = 1 ,     i f     z o n e o r i g i n a l ( i , j ) = z o n e s c h e m a t i z e d ( i , j ) 0 ,     i f     z o n e o r i g i n a l ( i , j ) z o n e s c h e m a t i z e d ( i , j )
The preservation ratios of the relative positions were calculated using Equation (3):
R P g = i = 1 n j = 1 , j i n R P ( i , j ) n ( n 1 ) × 100 %
where n was the total number of network nodes in a given region.
According to the definition of preserving the relative length given in Section 2, if segment l i has a longer or shorter length than segment l j in the original map, the length of segment l i should not become shorter or longer than segment l j in the schematized map, indicating that the relative length was preserved. Here, the preservation ratio of the relative length was estimated according to the preservation and non-preservation between segments. Therefore, the preservation situation λ ( i , j ) can be expressed as follows:
λ i , j = 1 , i f R L ( i , j ) = 1 , 3 0 , i f R L ( i , j ) = 2 , 4 where R L ( i , j ) = 1 , i f l o r g i n a l ( i ) l o r i g i n a l ( j ) a n d l s c h e m a t i z e d ( i ) l s c h e m a t i e d ( j ) 2 , i f l o r g i n a l ( i ) l o r i g i n a l ( j ) a n d l s c h e m a t i z e d ( i ) > l s c h e m a t i e d ( j ) 3 , i f l o r g i n a l ( i ) l o r i g i n a l ( j ) a n d l s c h e m a t i z e d ( i ) l s c h e m a t i e d ( j ) 4 , i f l o r g i n a l ( i ) l o r i g i n a l ( j ) a n d l s c h e m a t i z e d ( i ) < l s c h e m a t i e d ( j )
The preservation ratio of the relative length was calculated using Equation (5):
R L g = i = 1 n j = 1 , j i n λ ( i , j ) n ( n 1 ) × 100 %
where n is the total number of network segments in a given region.

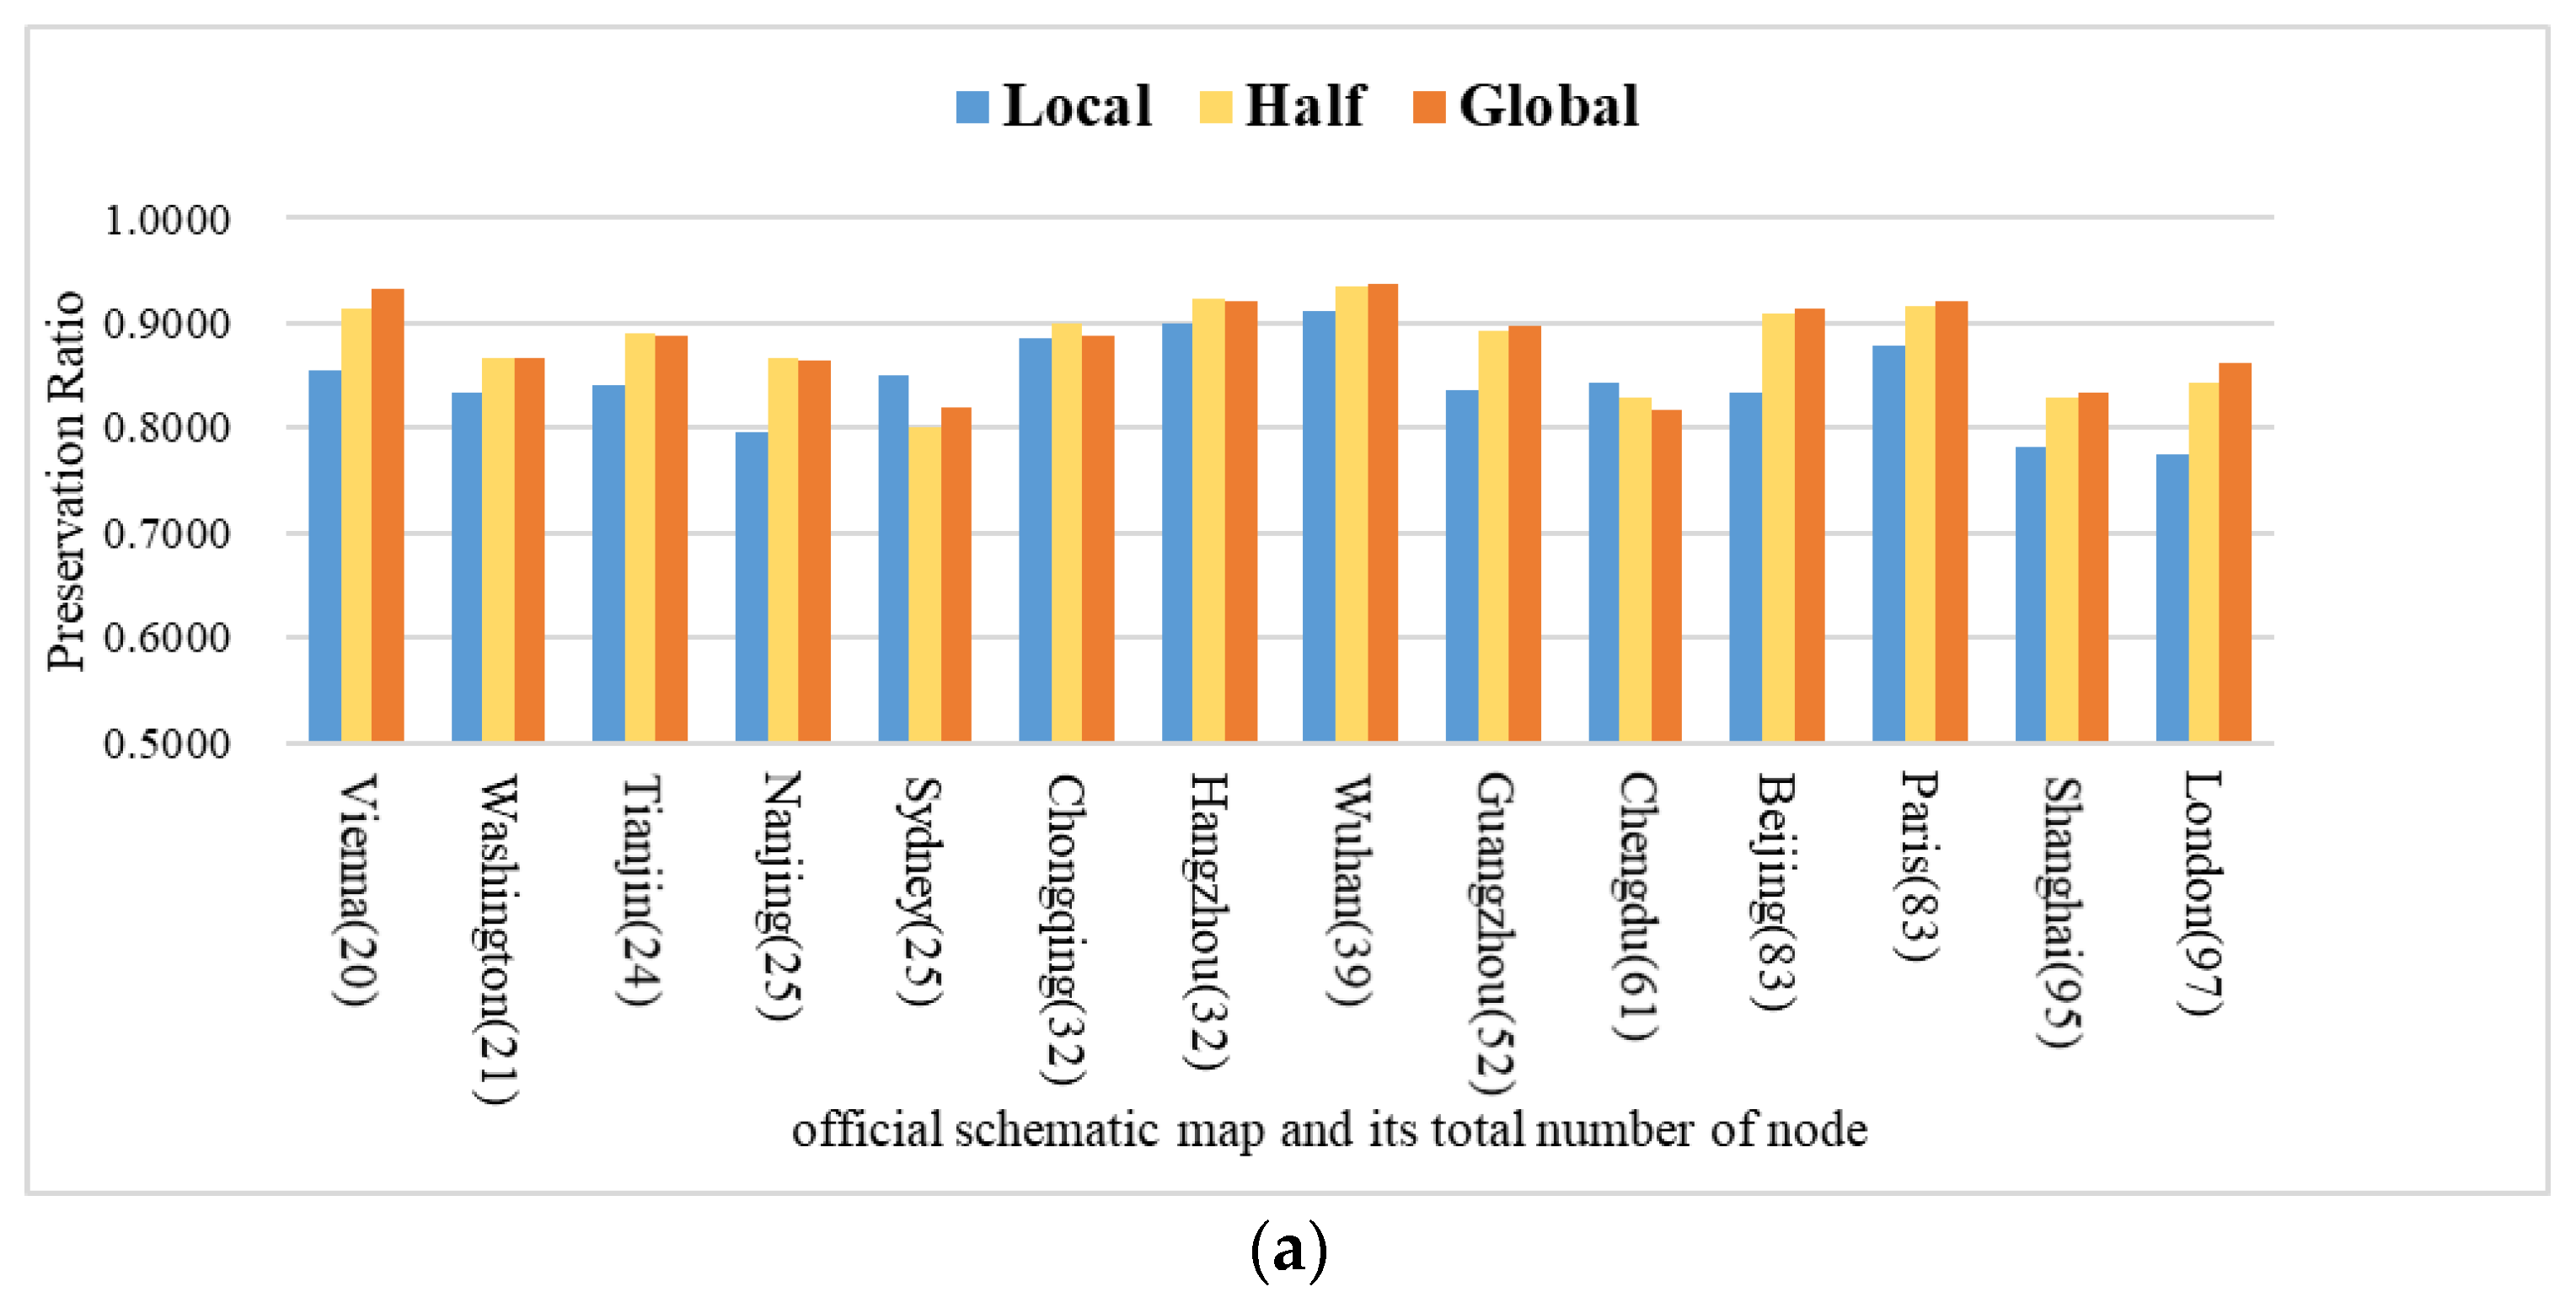
3.2. Preservation Ratios of 32 Official Maps: Over 78%

In this study, we conducted experiments using 32 official schematic maps from various cities, containing a total of 922 nodes and 1294 segments as our test data. All 32 original maps and their official version of schematic maps are shown in Appendix A. The selection of these maps was based on two main considerations. Firstly, we ensured that the chosen official schematic maps displayed different graph drawing styles, such as color coding, annotating, legend, etc. This was to avoid any potential biases resulting from maps produced by the same designer. Secondly, we selected maps with different network sizes and spatial distributions to enable a comparative analysis of the preservation of relative relations both with and without significant enlargement of dense regions, as seen in the London tube map. The calculation workflow for determining preservation ratios using the test data is shown in Figure 5.
Table 1 lists the average preservation ratios and variances of the relative positions and lengths of the 32 test maps. The estimated results indicated that almost all preservation ratios were higher than 78%, and the average ratio was approximately 88% for relative position and 83% for relative length. Specifically, in the manual production process, the relative relations were largely preserved by the designers.
Figure 6a,b show the estimated results of the local, half, and global preservation ratios of the relative positions of the nodes and relative lengths of the segments for the 32 official schematic maps, respectively. The vertical axis represents the preservation ratios in Figure 6a,b, the horizontal axis represents the city names and node numbers of the corresponding official schematic maps in Figure 6a, and the city names and segment numbers in Figure 6b. These results confirmed that designers had subconsciously considered preserving relative relations in the schematic process to a large degree, although the preservation degrees for different regions (local, half, global) may not be the same.

3.3. Significant Difference between Global and Local Preservation Ratios

A one-tailed t-test was conducted to verify whether there were statistically significant differences between the means of these two groups of data (local vs. half and half vs. global), and the significance level α was 0.05. Table 2 presents the results of the one-tailed t-tests.
The t-test results for the relative position indicated that local preservation was significantly less than half preservation, and half preservation was slightly significantly less than global preservation. Regarding the preservation of relative length, local preservation was significantly less than half preservation, whereas there was no significant difference between half and global preservation. According to the t-test results, the global preservation ratios of the two relative relations were significantly larger than those of local preservation. This may imply that the global preservation of relative relations should be considered in designing these manually generated products. The reason may be that good global preservation can be helpful to better maintain the overall similarity of geometric shapes to the original networks to reduce the recognition difficulty due to network shape simplification in schematization, which is important for map usability for deformed representations of maps [43].

4. Results of Experiment 2: A Comparative Analysis for Preserving Relative Relations with and without Significant Enlargement of Dense Regions

4.1. One-Tailed t-Tests to Reveal Significant Differences in Local and Global Preservation

By comparing the 32 official schematic maps with their original maps through visual inspection, the test maps were divided into two groups: Group A contained 15 maps with apparent local enlargement of dense regions, and Group B contained 17 maps without apparent map distortion. The average preservation ratios and variances are presented in Table 3. In addition, the local, half, and global preservation ratios of relative relations are shown in Figure 7a,b for Group A and in Figure 7c,d for Group B. One-tailed t-tests were conducted to verify whether there were statistically significant differences between the means of these two-group data (local vs. half, half vs. global) for the two groups and the significance level α was 0.05. Table 4 presents the results of the one-tailed t-tests.
Comparing the average preservation ratios of Groups A and B in Table 3, the preservation ratios of the local, half, and global regions for relative positions were almost the same. In contrast, Group A had lower preservation ratios for relative length than Group B. According to the results of the t-tests shown in Table 4, the local preservation of relative positions for Groups A and B was significantly less than half and global preservation, whereas for relative length, there was a significant difference for local and global preservation for Group A, but no significant difference for Group B.

4.2. One-Tailed t-Tests to Reveal Significant Differences between Groups A and B

A one-tailed t-test was conducted to verify whether there were statistically significant differences between these means of Groups A and B, and the significance level α was 0.05. Table 5 presents the results of the one-tailed t-tests.
According to the t-test results shown in Table 5, there was no significant difference between the two groups for the preservation of relative position in local and half regions, and global preservation of Group A was slightly significantly less than Group B. In contrast, for the preservation of relative length, Group A was significantly less than Group B. Based on the t-test results in Table 4 and Table 5, we might infer from this that the preservation of relative positions takes priority over the preservation of relative length in the designs of manually generated products. This hierarchy preservation may be because it is difficult to preserve all relative relations at high degrees when adopting an apparent relative enlargement of dense areas to other map areas in the designs of most maps in Group A. In fact, according to Barkowsky and Freksa [1], for the cognition of maps, relativity in distance is less important than relativity in position. Hence, it may be considered that the preservation of the relativity in position should be regarded as having a higher priority than the preservation of the relativity in length in the development of automatic schematization methods when it is necessary to achieve the balance between the preservation of relative relations and better map clarity, as in the design of the London tube map.

5. Discussion: Possible Designs for Preserving Relative Relations Using a Reference Object

5.1. Central Region Reference Objects for Preserving Relative Relations

As stated in Section 2, constructing relative relations among all nodes and segments in a manual design process is impossible. We suspect some reference objects were used to preserve relative relations to reduce the design difficulty. Figure 8a,b show an example of the London tube map, which shows the local and global preservation situations in relative relation to the London tube map. Larger nodes and thicker lines represent lower preservation ratios. In the design of the London tube map, the peripheral regions shrank toward the center region according to an analysis of map distortion [48]. By comparing Figure 8a,b, the global preservation ratios are lower than those of local preservation in the central dense region. This may be because the central dense region is regarded as a reference object for preserving the relative relations of nodes and segments in the peripheral regions. More specifically, after finishing the compression and schematization of peripheral regions, the relative relations in the center region are preserved in schematization, and the relation between the nodes and segments between the peripheral and central regions may be ignored. The same situations occur in most manually generated schematic maps containing many nodes with a highly non-uniform distribution.

5.2. Major Axes as Reference Objects for Preserving Relative Relations

Some manually generated schematic maps follow a major-axis design. Because the relative relations of all the other nodes or segments are preserved regarding the major axis, the nodes and segments on the axis should have higher ratios for local and global preservation. Two examples are shown in Figure 9, where an ellipse is used to circle a possible major axis. Roberts and Rose [38] found that such a major-axis design can lead to a more efficient journey. Li [34] indicated that the preservation of the main structure of line networks should be a general principle in schematization and that a major road on a network is a typical main structure, which has been considered in some automated schematization methods [7,11,20]. Using a reference object can reduce the difficulty in preserving relative relations in manual map design without considering all the relations among nodes or segments. Furthermore, because schematization is a simplification process, preservation of the main structure used as a principle in map generalization [49] can also be suitable for schematization to better maintain map recognition. For automated schematization, the use of a reference object may significantly reduce the number of constraints and enhance computational efficiency. For example, the boundary of a dense region is constructed by a regular polygon, and the preservation of relative relations for the nodes or segments in peripheral regions is achieved by constructing the constraints between them and the polygon instead of all nodes or segments in the dense region.
In public transportation maps, the map distances between two connecting stations or bus stops are often depicted as almost the same length, whereas the actual distances are different. If a short path contains more bus stops or stations than a longer path from an origin to a destination, the short path has a longer map distance, which may mislead users [50]. For road maps, although planning the fastest route is affected by many criteria [51], the relative map distances of routes are crucial for path choice [27,33]. Therefore, a possible design is that the path from start to destination should be considered as a reference line (or axis) to preserve better relative relations during map schematization.

6. Conclusions

In the design of schematic maps, the preservation of relative relations has been recognized as playing an important role in minimizing misunderstandings in map cognition due to the simplification of shapes leading to topographical distortion. Li [34] revealed that it is very desirable to keep relativities in position and length intact unless there is an absolute need to violate them and termed these the “principle of relativity in position” and “principle of relativity in length”. To achieve more practical and specific design rules for general principles, this study conducted experimental investigations into the preservation of relative relations in existing schematic maps, which may be beneficial for developing or optimizing design rules for the automated schematization of network maps. First, the preservation ratios of the relative relations in these manually generated products were estimated, and an analysis of the distribution characteristics of preservation was performed. Second, a comparative analysis of the differences in preservation conditions for the two types of schematic maps—with and without apparent map distortions—was carried out. Third, we analyzed the use of reference objects to preserve relative relations.
According to the experimental results and analysis, the findings of this study are as follows:
(1)
Relative relations were well-preserved in manually designed products, with preservation ratios exceeding 80% in almost all cases, except for the local preservation ratio of relative position, which was approximately 79%.
(2)
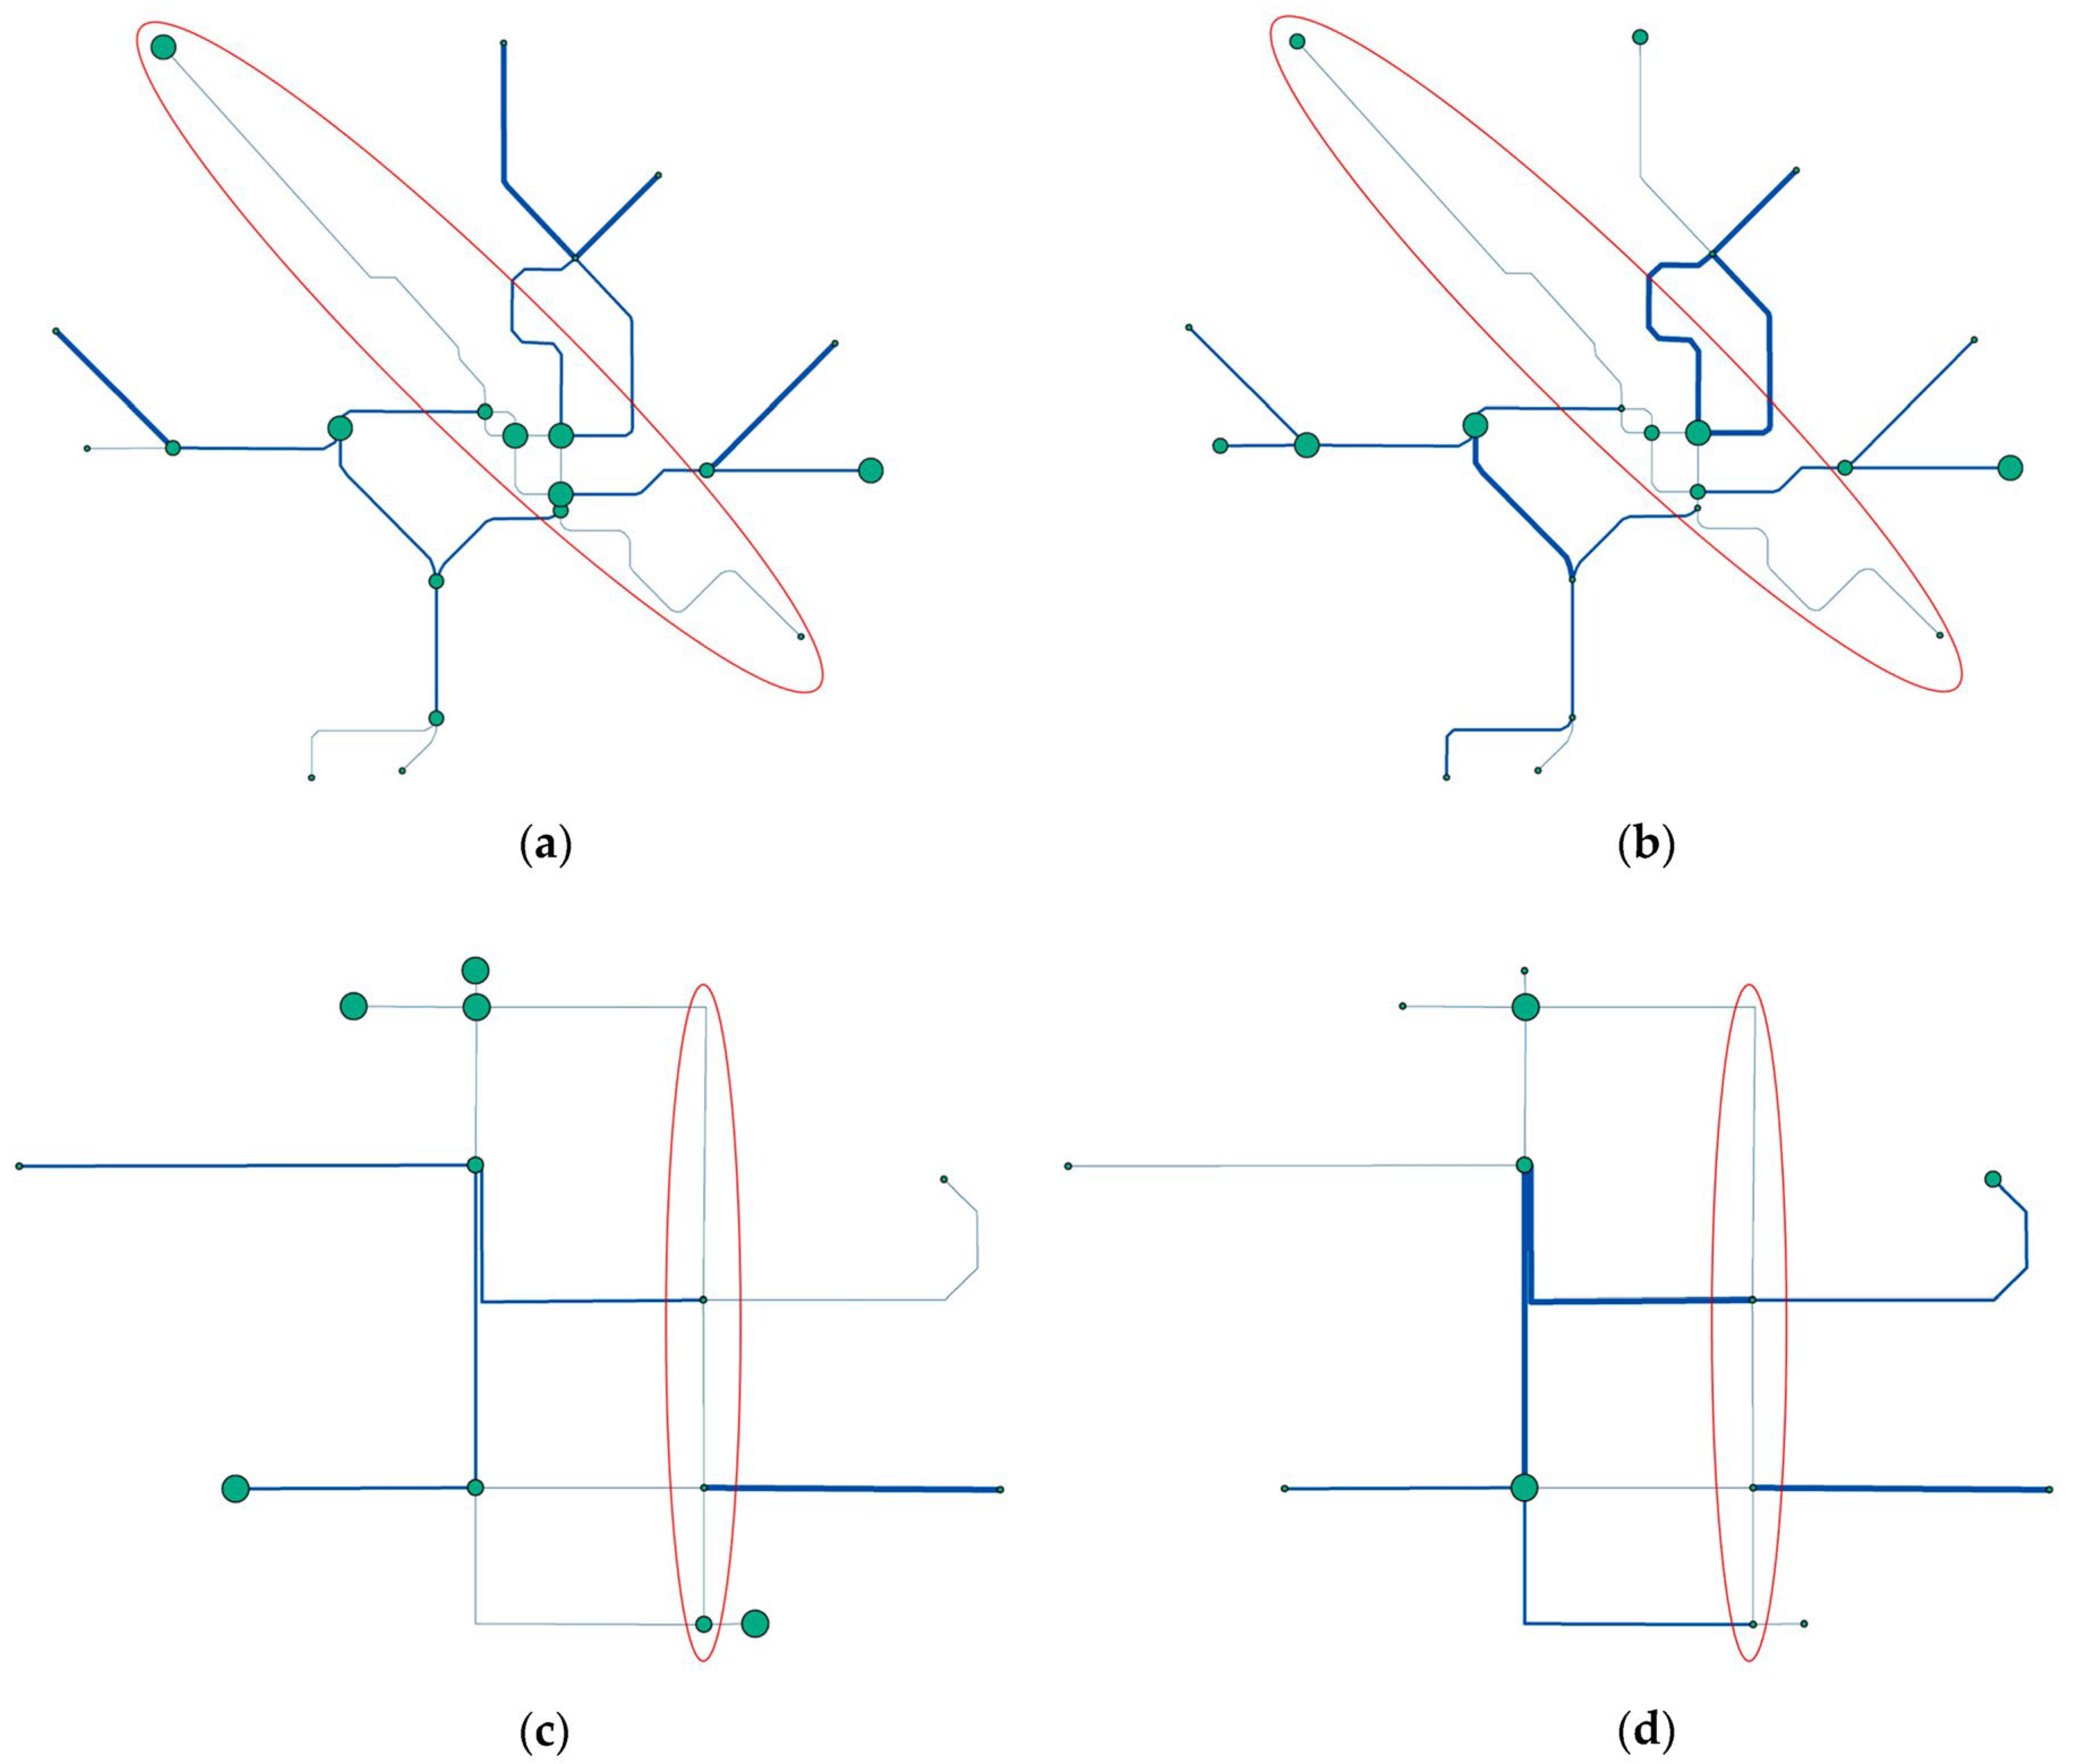
Global preservation ratios for different relative relations were significantly higher than local preservation ratios in manual designs. Notably, when facing larger distortions in map design, such as the enlarging of the central dense region in the London tube map, the preservation ratios of relative positions exceeded those of relative lengths in the manual designs.
(3)
The qualitative analysis comparing preservation ratios led to the observation that designers may adopt the use of a reference object, like the central dense region in the London tube map or a major axis in the Washington tube map, to preserve relative relations in existing official schematic maps.
This study contributes to the design of schematic network maps by empirically exploring methods to preserve relative relationships. Based on these findings, some guidance for the design of schematic maps can be derived:
(1)
Based on the third finding, a design rule can be formed: relative positions have a higher preservation priority than relative lengths.
(2)
Considering preservation methods used in existing official schematic maps, the use of reference axes or lines may serve as characteristics for the main structure of a network [34].
One limitation of this study is that only the preservation of relative relations among nodes and segments in a network is considered. Hence, in future work, it is important to consider incorporating other map features and information into network maps. For instance, this could involve accounting for the relative relations among stations on metro maps, identifying landmarks and points of interest within a city, and considering traffic time. In addition, the formation of an effective and feasible reference object or main structure to preserve the relative relations requires further study. To advance our understanding, it is crucial to conduct a comprehensive analysis of how preserving relative relations influences human cognition and various map applications and tasks, such as navigation, tourism, city planning, and 3D scene reconstruction [52]. This will enable the development of design rules for automated schematization methods that yield schematic maps which are cognitively adequate, satisfying, and practical in nature.

Author Contributions

Conceptualization, methodology, and writing—original draft preparation, Peng Ti; methodology and investigation Hao Wu; editing and project administration, writing—review & editing, Zhilin Li; data curation, Mingyao Li; writing—review & editing, Ruyu Dai; formal analysis Tao Xiong. All authors have read and agreed to the published version of the manuscript.

Funding

This research was funded by the National Natural Science Foundation of China (41930104).

Data Availability Statement

The data and codes that support the findings of this study are available at ‘figshare.com’ with the identifier(s) at the private link: https://figshare.com/s/fd17e620b1ce5f8626ff, accessed on 14 April 2023.

Conflicts of Interest

The authors declare no conflict of interest.

Appendix A

Original Map and the Official Version of its Schematic Map
BeijingIjgi 12 00309 i001Ijgi 12 00309 i002
Original Map (https://pic1.zhimg.com/80/v2-8aed32241cdc24155094ad00ed8ea1d8_720w.webp, accessed on 14 April 2023)Official Schematic Map (http://map.amap.com/subway/index.html?&1100, accessed on 14 April 2023)
ChangchunIjgi 12 00309 i003Ijgi 12 00309 i004
Original Map (https://pic2.zhimg.com/80/v2-137f68f9aed0a2606996d6092f8583ed_720w.webp, accessed on 14 April 2023)Official Schematic Map (http://map.amap.com/subway/index.html?&2201, accessed on 14 April 2023)
ChangshaIjgi 12 00309 i005Ijgi 12 00309 i006
Original Map (https://picx.zhimg.com/v2-6e7b6a7dde4e423c9adfe7cecc2816c1_1440w.jpg, accessed on 14 April 2023)Official Schematic Map http://map.amap.com/subway/index.html?&4301(, accessed on 14 April 2023)
ChengduIjgi 12 00309 i007Ijgi 12 00309 i008
Original Map (https://pic1.zhimg.com/80/v2-8804cb2a7a544530da128291dcb3a7bc_720w.webp, accessed on 14 April 2023)Official Schematic Map (http://map.amap.com/subway/index.html?&5101, accessed on 14 April 2023)
ChongqingIjgi 12 00309 i009Ijgi 12 00309 i010
Original Map (https://pic1.zhimg.com/80/v2-4e5d47090d6a227a68f3d64824c31568_720w.webp, accessed on 14 April 2023)Official Schematic Map (http://map.amap.com/subway/index.html?&5000, accessed on 14 April 2023)
DalianIjgi 12 00309 i011Ijgi 12 00309 i012
Original Map (https://image.ditietu.com/upload/2019/01/201901071546830156174883.jpg, accessed on 14 April 2023)Official Schematic Map (http://map.amap.com/subway/index.html?&2102, accessed on 14 April 2023)
FuzhouIjgi 12 00309 i013Ijgi 12 00309 i014
Original Map (https://pics2.baidu.com/feed/7e3e6709c93d70cfb980708fa2b22506bba12bab.jpeg, accessed on 14 April 2023)Official Schematic Map (https://map.amap.com/subway/index.html?&3501, accessed on 14 April 2023)
GuangzhouIjgi 12 00309 i015Ijgi 12 00309 i016
Original Map (https://pic3.zhimg.com/80/v2-0af775b08325f3c7c0975338d59158e2_720w.webp, accessed on 14 April 2023)Official Schematic Map (https://map.amap.com/subway/index.html?&4401, accessed on 14 April 2023)
HangzhouIjgi 12 00309 i017Ijgi 12 00309 i018
Original Map https://pic1.zhimg.com/80/v2-72a9594d0d279b570ec7d80396f26d58_720w.webp, accessed on 14 April 2023)Official Schematic Map (http://map.amap.com/subway/index.html?&3301, accessed on 14 April 2023)
HefeiIjgi 12 00309 i019Ijgi 12 00309 i020
Original Map (https://pic4.zhimg.com/v2-f09ee2e13dc2a79b843568327c209b17_r.jpg, accessed on 14 April 2023)Official Schematic Map (https://map.amap.com/subway/index.html?&3401, accessed on 14 April 2023)
HoustonIjgi 12 00309 i021Ijgi 12 00309 i022
Original Map (https://assets.dmagstatic.com/wp-content/uploads/2013/08/houston11.jpg, accessed on 14 April 2023)Official Schematic Map (https://i.pinimg.com/originals/f7/72/f3/f772f3b73c667ba8f9f5d7d5381774fa.jpg, accessed on 14 April 2023)
KunmingIjgi 12 00309 i023Ijgi 12 00309 i024
Original Map (https://image.ditietu.com/upload/2019/01/201901071546843569326107.jpg, accessed on 14 April 2023)Official Schematic Map (https://map.amap.com/subway/index.html?&5301, accessed on 14 April 2023)
LondonIjgi 12 00309 i025Ijgi 12 00309 i026
Original Map (https://www.flickr.com/photos/saltation/58922336, accessed on 6 July 2023)Official Schematic Map (http://www.afn.org/~alplatt/tube.html, accessed on 6 July 2023)
Los AngelesIjgi 12 00309 i027Ijgi 12 00309 i028
Original Map (https://i.ytimg.com/vi/nH9toJw6-k8/maxresdefault.jpg, accessed on 14 April 2023)Official Schematic Map (https://usa.wangnafei.com/wp-content/uploads/1555/615cbc8ff3b0a39.jpg, accessed on 14 April 2023)
MiamiIjgi 12 00309 i029Ijgi 12 00309 i030
Original Map (https://i.pinimg.com/originals/cf/b1/f7/cfb1f71c639b6490ae7a657fa3b841dc.jpg, accessed on 14 April 2023)Official Schematic Map (https://img.sj33.cn/uploads/allimg/201003/20100312171345348.jpg, accessed on 14 April 2023)
NanchangIjgi 12 00309 i031Ijgi 12 00309 i032
Original Map (https://pic1.zhimg.com/v2-81605ff102029ed7cbc71064b0f58a05_b.jpg, accessed on 14 April 2023)Official Schematic Map (https://map.amap.com/subway/index.html?&3601, accessed on 14 April 2023)
NanjingIjgi 12 00309 i033Ijgi 12 00309 i034
Original Map (https://pic4.zhimg.com/80/v2-1183549ed76b4ee2628eeafb98590f07_720w.webp, accessed on 14 April 2023)Official Schematic Map (https://map.amap.com/subway/index.html?&3201, accessed on 14 April 2023)
NanningIjgi 12 00309 i035Ijgi 12 00309 i036
Original Map (https://image.ditietu.com/upload/2019/01/201901071546845559430226.jpg, accessed on 14 April 2023)Official Schematic Map (https://map.amap.com/subway/index.html?&4501, accessed on 14 April 2023)
NingboIjgi 12 00309 i037Ijgi 12 00309 i038
Original Map (http://imgbdb3.bendibao.com/nbbdb/20152/12/20150212142120_38228.jpg, accessed on 14 April 2023)Official Schematic Map (https://map.amap.com/subway/index.html?&3302, accessed on 14 April 2023)
ParisIjgi 12 00309 i039Ijgi 12 00309 i040
Original Map (https://pic3.zhimg.com/v2-3e231625dc3bae946fcb9abc014c5cde_r.jpg, accessed on 14 April 2023)Official Schematic Map (https://www.ile-de-france-paris.com/images/plan-metro-rer-paris-ile-de.png, accessed on 14 April 2023)
ShanghaiIjgi 12 00309 i041Ijgi 12 00309 i042
Original Map (https://pic3.zhimg.com/80/v2-92e93aaf761ff4916c47dce3978760aa_720w.webp, accessed on 14 April 2023)Official Schematic Map (https://map.amap.com/subway/index.html?&3100, accessed on 14 April 2023)
ShenyangIjgi 12 00309 i043Ijgi 12 00309 i044
Original Map (https://ditiemap.com/zb_users/upload/ditie/202007191595124974461901.jpg, accessed on 14 April 2023)Official Schematic Map (https://map.amap.com/subway/index.html?&2101, accessed on 14 April 2023)
SuzhouIjgi 12 00309 i045Ijgi 12 00309 i046
Original Map (https://pic2.zhimg.com/80/v2-2ebf949fce914b05f47c2d3b75b3ec7d_720w.webp, accessed on 14 April 2023)Official Schematic Map (https://map.amap.com/subway/index.html?&3205, accessed on 14 April 2023)
SydneyIjgi 12 00309 i047Ijgi 12 00309 i048
Original Map (https://transportsydney.files.wordpress.com/2020/10/2020-10-22-sydney-metro-network.jpg, accessed on 14 April 2023)Official Schematic Map (https://www.ditietu.com/zb_users/upload/2017/07/201707261501080543114406.jpg, accessed on 14 April 2023)
TianjinIjgi 12 00309 i049Ijgi 12 00309 i050
Original Map (https://pic1.zhimg.com/80/v2-e63a6dadad8306a5bf6da5a0543fe67c_720w.webp, accessed on 14 April 2023)Official Schematic Map (https://map.amap.com/subway/index.html?&1200, accessed on 14 April 2023)
ViennaIjgi 12 00309 i051Ijgi 12 00309 i052
Original Map (https://img.oumengke.com/attachments/month_2_1910/1910111330ee29f29a2cfe483a.jpg, accessed on 14 April 2023)Official Schematic Map (https://youimg1.c-ctrip.com/target/100m0y000000m2app5C76.png, accessed on 14 April 2023)
WashingtonIjgi 12 00309 i053Ijgi 12 00309 i054
Original Map (https://i1.hdslb.com/bfs/archive/1e501e0b54342680baaa862c1959bf7fbcbc86b0.jpg, accessed on 14 April 2023)Official Schematic Map (https://image.ditietu.com/upload/2016/11/201611221479825627197289.jpg, accessed on 14 April 2023)
WuhanIjgi 12 00309 i055Ijgi 12 00309 i056
Original Map (https://pic3.zhimg.com/80/v2-52ab6ff0b1c01c240815ee76934d1812_720w.webp, accessed on 14 April 2023)Official Schematic Map (https://map.amap.com/subway/index.html?&4201, accessed on 14 April 2023)
WuxiIjgi 12 00309 i057Ijgi 12 00309 i058
Original Map (https://www.huocheso.com/uploads/new/image/20150618/1434607557264476.png, accessed on 14 April 2023)Official Schematic Map (https://map.amap.com/subway/index.html?&3202, accessed on 14 April 2023)
XiamenIjgi 12 00309 i059Ijgi 12 00309 i060
Original Map (https://p0.itc.cn/q_70/images03/20201102/69b0a3fd5b4c423bbd818f2ffb942bff.png, accessed on 14 April 2023)Official Schematic Map (https://map.amap.com/subway/index.html?&3502, accessed on 14 April 2023)
Xi’anIjgi 12 00309 i061Ijgi 12 00309 i062
Original Map (https://pic2.zhimg.com/80/v2-ec184cc7612c691a1f36ce2ef13c8e9d_720w.webp, accessed on 14 April 2023)Official Schematic Map (https://map.amap.com/subway/index.html?&6101, accessed on 14 April 2023)
ZhengzhouIjgi 12 00309 i063Ijgi 12 00309 i064
Original Map (https://map.amap.com/subway/index.html?&4101, accessed on 14 April 2023)Official Schematic Map (https://image.ditietu.com/upload/2021/04/202104181618727545434600.jpg, accessed on 14 April 2023)

References

  1. Barkowsky, T.; Freksa, C. Cognitive Requirements on Making and Interpreting Maps; Lecture Notes in Computer Science; Springer: Berlin/Heidelberg, Germany, 1997; pp. 347–361. ISBN 9783540636236. [Google Scholar]
  2. Klippel, A.; Richter, K.-F.; Barkowsky, T.; Freksa, C. The Cognitive Reality of Schematic Maps. In Map-Based Mobile Services; Springer: Berlin/Heidelberg, Germany, 2005; pp. 55–71. ISBN 9783540230557. [Google Scholar]
  3. Ware, J.M.; Anand, S.; Taylor, G.E.; Thomas, N. Automated Production of Schematic Maps for Mobile Applications. Trans. GIS 2006, 10, 25–42. [Google Scholar] [CrossRef]
  4. Anand, S.; Avelar, S.; Ware, J.M.; Jackson, M. Automated Schematic Map Production Using Simulated Annealing and Gradient Descent Approaches. In Proceedings of the 15th Annual GIS Research UK Conference, Dublin, Ireland, 11–13 April 2007; pp. 54–60. [Google Scholar]
  5. Avelar, S.; Mueller, M. Generating Topologically Correct Schematic Maps. In Proceedings of the 9th International Spatial Data Handling, Beijing, China, 10–12 August 2000. [Google Scholar]
  6. Merrick, D.; Gudmundsson, J. Path Simplification for Metro Map Layout. In Graph Drawing; Springer: Berlin/Heidelberg, Germany, 2007; pp. 258–269. ISBN 9783540709039. [Google Scholar]
  7. Li, Z.; Dong, W. A Stroke-Based Method for Automated Generation of Schematic Network Maps. Geogr. Inf. Syst. 2010, 24, 1631–1647. [Google Scholar] [CrossRef]
  8. Stott, J.; Rodgers, P.; Martínez-Ovando, J.C.; Walker, S.G. Automatic Metro Map Layout Using Multicriteria Optimization. IEEE Trans. Vis. Comput. Graph. 2011, 17, 101–114. [Google Scholar] [CrossRef] [Green Version]
  9. Noellenburg, M.; Wolff, A. Drawing and Labelling High-Quality Metro Maps by Mixed-Integer Programming. IEEE Trans. Vis. Comput. Graph. 2011, 17, 626–641. [Google Scholar] [CrossRef] [Green Version]
  10. Ti, P.; Li, Z.; Xu, Z. Automated Generation of Schematic Network Maps Adaptive to Display Sizes. Cartogr. J. 2015, 52, 168–176. [Google Scholar] [CrossRef]
  11. Lan, T.; Li, Z.; Ti, P. Integrating General Principles into Mixed-Integer Programming to Optimize Schematic Network Maps. Geogr. Inf. Syst. 2019, 33, 2305–2333. [Google Scholar] [CrossRef]
  12. Lan, T.; Li, Z.L.; Wang, J.; Gong, C.; Ti, P. An Anns-Based Method for Automated Labelling of Schematic Metro Maps. ISPRS Int. J. Geoinf. 2022, 11, 36. [Google Scholar] [CrossRef]
  13. Galvão, M.L.; Krukar, J.; Schwering, A. Evaluating Schematic Route Maps in Wayfinding Tasks for In-Car Navigation. Cartogr. Geogr. Inf. Sci. 2021, 48, 449–469. [Google Scholar] [CrossRef] [PubMed]
  14. Lan, T.; Li, Z.L.; Peng, Q.; Gong, X. Automated Labeling of Schematic Maps by Optimization with Knowledge Acquired from Existing Maps. Trans. GIS 2020, 24, 1722–1739. [Google Scholar] [CrossRef]
  15. Wu, H.Y.; Niedermann, B.; Takahashi, S.; Nöllenburg, M. A Survey on Computing Schematic Network Maps: The Challenge to Interactivity. arXiv 2022, arXiv:2208.07301. [Google Scholar]
  16. Taukebayev, O.; Seitkazy, M.; Salmurzauly, R.; Sakhariyev, B.; Aktymbayeva, A.; Tussupkanova, A.; Batay, G. Creating Schematic Map of Tourist Routes and Infrastructure of Ayusai Gorge (Ile-Alatau National Park). J. Geogr. Environ. Manag. 2021, 62, 78–91. [Google Scholar]
  17. Bauer, C.; Bernd, L. Schematic Maps and Indoor Wayfinding. In Proceedings of the 14th International Conference on Spatial Information Theory (COSIT 2019), Regensburg, Germany, 9–13 September 2019. [Google Scholar]
  18. Listabarth, J. Automated Polygon Schematization for Thematic Maps. Master’s Thesis, University of Twente, Enschede, The Netherlands, 2021. [Google Scholar]
  19. Avelar, S.; Hurni, L. On the Design of Schematic Transport Maps. Cartogr. Int. J. Geogr. Inf. Geovis. 2006, 41, 217–228. [Google Scholar] [CrossRef]
  20. Ti, P.; Li, Z. Generation of Schematic Network Maps with Automated Detection and Enlargement of Congested Areas. Geogr. Inf. Syst. 2014, 28, 521–540. [Google Scholar] [CrossRef]
  21. Barkowsky, T.; Latecki, L.J.; Richter, K.-F. Schematizing Maps: Simplification of Geographic Shape by Discrete Curve Evolution; Lecture Notes in Computer Science; Springer: Berlin/Heidelberg, Germany, 2000; pp. 41–53. ISBN 9783540675846. [Google Scholar]
  22. Roberts, M.J.; Gray, H.; Lesnik, J. Preference versus Performance: Investigating the Dissociation between Objective Measures and Subjective Ratings of Usability for Schematic Metro Maps and Intuitive Theories of Design. Int. J. Hum. Comput. Stud. 2017, 98, 109–128. [Google Scholar] [CrossRef] [Green Version]
  23. Ti, P.; Li, Z.; Xu, Z.; Jia, H. Optimizing the Balance between Area and Orientation Distortions for Variable-Scale Maps. ISPRS J. Photogramm. Remote Sens. 2016, 117, 237–242. [Google Scholar] [CrossRef]
  24. Pullar, D.; Egenhofer, M. Toward Formal Definitions of Topological Relations among Spatial Objects. In Proceedings of the Third International Symposium on Spatial Data Handling, Sydney, Australia, 17–19 August 1988. [Google Scholar]
  25. Papadias, D.; Sellis, T. Qualitative Representation of Spatial Knowledge in Two-Dimensional Space. VLDB J. 1994, 3, 479–516. [Google Scholar] [CrossRef]
  26. Clementini, E.; Felice, P.D.; Hernández, D. Qualitative Representation of Positional Information. Artif. Intell. 1997, 95, 317–356. [Google Scholar] [CrossRef] [Green Version]
  27. Guo, Z. Mind the Map! The Impact of Transit Maps on Path Choice in Public Transit. Transp. Res. Part A Policy Pract. 2011, 45, 625–639. [Google Scholar] [CrossRef] [Green Version]
  28. Casakin, H.; Barkowsky, T.; Klippel, A.; Freksa, C. Schematic Maps as Wayfinding Aids; Lecture Notes in Computer Science; Springer: Berlin/Heidelberg, Germany, 2000; pp. 54–71. ISBN 9783540675846. [Google Scholar]
  29. Gemsa, A. Schematized Visualizations of Shortest Paths in Road Networks. In Proceedings of the Informatiktage, Boon, Germany, 19–20 March 2010. [Google Scholar]
  30. Gemsa, A.; Nöllenburg, M.; Pajor, T.; Rutter, I. On D-Regular Schematization of Embedded Paths. In SOFSEM 2011: Theory and Practice of Computer Science; Springer: Berlin/Heidelberg, Germany, 2011; pp. 260–271. ISBN 9783642183805. [Google Scholar]
  31. Agrawala, M.; Stolte, C. Rendering Effective Route Maps: Improving Usability through Generalization. In Proceedings of the Special Interest Group on Computer Graphics, New York, NY, USA, 1 August 2001; pp. 241–250. [Google Scholar]
  32. Ti, P.; Dai, R.Y.; Wan, F.Y.; Xiong, T.; Wu, H.; Li, Z.L. Influencing Pedestrians’ Route Choice Using Route Shape Simplification. ISPRS Int. J. Geo-Inf. 2023, 12, 66. [Google Scholar] [CrossRef]
  33. Liu, Z.; Li, Z.L. Impact of Schematic Designs on the Cognition of Underground Tube Map. Int. Arch. Photogramm. Remote Sens. Spat. Inf. Sci. 2016, 41, 421–423. [Google Scholar] [CrossRef] [Green Version]
  34. Li, Z. General Principles for Automated Generation of Schematic Network Maps. Cartogr. J. 2015, 52, 356–360. [Google Scholar] [CrossRef]
  35. Avelar, S. Convergence Analysis and Quality Criteria for an Iterative Schematization of Networks. Geoinformatica 2007, 11, 497–513. [Google Scholar] [CrossRef]
  36. Wolff, A. Drawing Subway Maps: A Survey. Informatik 2007, 22, 23–44. [Google Scholar] [CrossRef] [Green Version]
  37. Grison, E. Schematic Map Design: From Performance to Preference? A Literature Review of Empiral Research. In Proceedings of the 2nd Schematic Mapping Workshop, Vienna, Vienna, 11–12 April 2019. [Google Scholar]
  38. Roberts, M.J.; Rose, D. Map-Induced Journey-Planning Biases for a Simple Network: A Docklands Light Railway Study. Transp. Res. Part A Policy Pr. 2016, 94, 446–460. [Google Scholar] [CrossRef] [Green Version]
  39. Lloyd, P.B.; Rodgers, P.; Roberts, M.J. Metro Map Colour-Coding: Effect on Usability in Route Tracing. In Diagrammatic Representation and Inference: In Proceedings of the 10th International Conference, Diagrams 2018, Edinburgh, UK, 18–22 June 2018; Springer International Publishing: Berlin/Heidelberg, Germany, 2018. [Google Scholar]
  40. Retz-Schmidt, G. Various Views on Spatial Prepositions. Various Views on Spatial Prepositions. AI Mag. 1988, 9, 95–105. [Google Scholar]
  41. Hernández, D. Maintaining Qualitative Spatial Knowledge; Lecture Notes in Computer Science; Springer: Berlin/Heidelberg, Germany, 1993; pp. 36–53. ISBN 9783540572077. [Google Scholar]
  42. Clementini, E. A Conceptual Framework for Modelling Spatial Relations. Inf. Technol. Contr. 2019, 48, 5–17. [Google Scholar] [CrossRef] [Green Version]
  43. Harrie, L.; Sarjakoski, L.T.; Lehto, L. A Variable-Scale Map for Small-Display Cartography. Int. Arch. Photogramm. Remote Sens. Spat. Inf. Sci. 2002, 34, 237–242. [Google Scholar]
  44. Haunert, J.-H.; Sering, L. Drawing Road Networks with Focus Regions. IEEE Trans. Vis. Comput. Graph. 2011, 17, 2555–2562. [Google Scholar] [CrossRef]
  45. Hernández, D.; Clementini, E.; Felice, P. Qualitative Distances; Lecture Notes in Computer Science; Springer: Berlin/Heidelberg, Germany, 1995; pp. 45–57. ISBN 9783540603924. [Google Scholar]
  46. Frank, A.U. Qualitative Spatial Reasoning: Cardinal Directions as an Example. Int. J. Geogr. Inf. Sci. 1996, 10, 269–290. [Google Scholar] [CrossRef]
  47. Frank, A.U. Qualitative Spatial Reasoning about Distances and Directions in Geographic Space. J. Vis. Lang. Comput. 1992, 3, 343–371. [Google Scholar] [CrossRef]
  48. Jenny, B. Geometric Distortion of Schematic Network Maps. Bull. Soc. Cartogr. 2006, 40, 15–18. [Google Scholar]
  49. Li, Z.L. Algorithmic Foundation of Multi-Scale Spatial Representation; CRC Press: New York, NY, USA, 2007. [Google Scholar]
  50. Forrest, D. Causes and Consequences of Scale Change in Schematic Maps: Are Users Aware and Do They Care? In Proceedings of the Schematic Mapping Workshop, Essex, UK, 2–3 April 2014. [Google Scholar]
  51. Hochmair, H. The Influence of Map Design on Route Choice from Public Transportation Maps in Urban Areas. Cartogr. J. 2009, 46, 242–256. [Google Scholar] [CrossRef] [Green Version]
  52. Chen, J.; Wang, Y.H.; Wu, H.; Liu, W.Z. Basic Issues and Development Directions of High-Quality Development Empowered by Spatio-Temporal Information. J. Spatio-Temporal Inf. 2023, 30, 1–11. [Google Scholar]
Figure 1. London tube map. (a) Official London tube map (http://www.afn.org/~alplatt/tube.html, accessed on 6 July 2023). (b) Original shape of the London tube map (https://www.flickr.com/photos/saltation/58922336, accessed on 6 July 2023).
Ijgi 12 00309 g001
Figure 2. Orientation relation between vertices.
Ijgi 12 00309 g002
Figure 3. Representation of a problem of relative length preservation in schematization. (a) Part of a road network; (b) possible schematized result while preserving relative length; and (c) possible schematized result without preserving relative length.
Ijgi 12 00309 g003
Figure 4. Three types of distance relations, (a) for a node; and (b) for a segment.
Ijgi 12 00309 g004
Figure 5. The workflow of the calculation of the preservation ratio using test maps.
Ijgi 12 00309 g005
Figure 6. Local, half, and global preservation ratios for 32 test schematic maps. (a) Node relative position preservation; and (b) segment relative length preservation.
Ijgi 12 00309 g006
Figure 7. The preservation ratios of relative relations for Groups A and B. (a) Relative position preservation of Group A, (b) relative length preservation of Group A, (c) relative position preservation of Group B, and (d) relative length preservation of Group B.
Ijgi 12 00309 g007aIjgi 12 00309 g007b
Figure 8. Possible reference region highlighted in red circle for the preservations of relative relations on the London tube map. (a) Global preservation of relative relations, (b) local preservation of relative relations.
Ijgi 12 00309 g008
Figure 9. Possible major-axis (highlighted in red circle) designs for the preservation situations of relative relations. (a) Local preservation of relative relations on the Washington tube map, (b) global preservation of relative relations on the Washington tube map, (c) local preservation of relative relations on the Ningbo tube map, and (d) global preservation of relative relations on the Ningbo tube map.
Ijgi 12 00309 g009
Table 1. Preservation ratio means and variances of relative position and relative length for 32 test maps.
LocalHalfGlobal
Relative position78.98%/0.0687.40%/0.0188.34%/0.01
Relative length81.59%/0.0383.66%/0.0283.62%/0.01
Table 2. Results of the t-test for the preservations of relative position and length between different regions.
Hypothesis:tTResultp
Relative
position
local vs. halfH0: μ1 = μ2
H1: μ1 < μ2
−9.361.65As t < -T, H1 is accepted0.00
half vs. global−2.001.65As t < -T, H1 is accepted0.02
Relative lengthlocal vs. half−3.341.65As t < -T, H1 is accepted0.00
half vs. global0.091.65As t < T, H0 is accepted0.46
Table 3. Preservation ratio means and variances of relative position and relative length for Groups A and B.
GroupLocal
(Ratio/Variance)
Half
(Ratio/Variance)
Global
(Ratio/Variance)
Relative positionA79.21%/0.0687.40%/0.0188.02%/0.01
B78.30%/0.0887.41%/0.0289.29%/0.01
Relative lengthA80.10%/0.0382.87%/0.0182.78%/0.01
B87.23%/0.0386.66%/0.0286.81%/0.02
Table 4. Results of the t-tests for the preservations of relative position and length between different regions.
Hypothesis:tTResultp
Group ARelative
position
local vs. halfH0: μ1 = μ2
H1: μ1 < μ2
−8.301.65As t < -T, H1 is accepted0.00
half vs. global−1.221.65As t > -T, H0 is accepted0.11
Relative
length
local vs. half−3.981.65As t < -T, H1 is accepted0.00
half vs. globalH0: μ1 = μ2
H1: μ1 > μ2
0.181.65As t < T, H0 is accepted0.42
Group BRelative
position
local vs. halfH0: μ1 = μ2
H1: μ1 < μ2
−4.451.65As t < -T, H1 is accepted0.00
half vs. global−1.731.65As t < -T, H1 is accepted0.04
Relative
length
local vs. halfH0: μ1 = μ2
H1: μ1 > μ2
0.441.65As t < T, H0 is accepted0.33
half vs. globalH0: μ1 = μ2
H1: μ1 < μ2
−0.131.65As t > -T, H0 is accepted0.45
Table 5. Results of the t-tests for the differences in the preservations of relative relations between Groups A and B for different preservation regions.
A vs. BHypothesis:tTResultp
Relative
position
local H0: μ1 = μ2
H1: μ1 > μ2
0.391.65As t < T, H0 is accepted0.35
half H0: μ1 = μ2
H1: μ1 < μ2
−0.141.65As t > -T, H0 is accepted0.44
global −1.891.65As t < -T, H1 is accepted0.03
Relative lengthlocal H0: μ1 = μ2
H1: μ1 < μ2
−6.171.65As t < -T, H1 is accepted0.00
half −4.231.65As t < -T, H1 is accepted0.00
global −4.941.65As t < -T, H1 is accepted0.00
Disclaimer/Publisher’s Note: The statements, opinions and data contained in all publications are solely those of the individual author(s) and contributor(s) and not of MDPI and/or the editor(s). MDPI and/or the editor(s) disclaim responsibility for any injury to people or property resulting from any ideas, methods, instructions or products referred to in the content.

