Article

Research on Spatial Patterns and Mechanisms of Live Streaming Commerce in China Based on Geolocation Data

1
Center for Modern Chinese City Studies, East China Normal University, Shanghai 200062, China
2
School of Urban and Regional Science, East China Normal University, Shanghai 200062, China
3
Institute of Geography, Faculty of Chemistry and Earth Sciences, Heidelberg University, 69120 Heidelberg, Germany
*
Author to whom correspondence should be addressed.
ISPRS Int. J. Geo-Inf. 2023, 12(6), 229; https://doi.org/10.3390/ijgi12060229
Submission received: 22 March 2023 / Revised: 16 May 2023 / Accepted: 1 June 2023 / Published: 2 June 2023

Abstract

:
Live streaming commerce (LSC) effectively combines the traditional real economy and e-commerce. Based on more than half a million unique GIS data values on LSC activities sourced via Taobao (Alibaba), we traced the spatial distribution of different players along the supply chain and further highlighted the intermediary role of streamers in developing the inter-regional industry. This study guides industrial planning in a diversified regional context, especially in economically peripheral regions. Our results show the following outcomes: (1) in contrast to dispersed suppliers, streamers and consumers are highly clustered. This trend proves that streamers are rooted in a specific urban context while playing the role of an intermediary in inter-regional supply chains, effectively extending geographic interactivity between suppliers and (potential) customers. (2) LSC primarily promotes regional light industry, especially in economically peripheral and rural areas, and provides opportunities for rapid development in cities with skilled handicraft providers. (3) China’s LSC streams have a pyramid structure, and the top group is highly clustered in metropolitan regions, such as the Yangtze River Delta (YRD) and the Pearl River Delta (PRD). This clustering makes it easier for streamers to work with large, well-known brands. The bottom group is mainly in charge of expanding the supply chain within the region and relies more on the local industrial base. It is diversified due to the different types of businesses or products. Ultimately, we draw attention to adaptive spatial planning and resource allocation in the context of the economic and geographic reforms brought by this growing industry, and discuss the policy implications based on the relationships between the supply of and demand for live streamers from a broader regional perspective.

1. Introduction

Physical consumption has been greatly constrained by the COVID-19 pandemic since 2020; however, online sales have seen unprecedented growth and become popular globally. In particular, a new type of online sales, namely live streaming commerce (LSC), achieved the most remarkable development and sparked lively debate worldwide. Such direct selling channels became popular since they are accessible to everyone and offer small, self-employed sellers’ unseen levels of consumer interaction and engagement [1]. Despite gaining traction all over the world, live streaming has yet to reach popularity in any other countries more than it has in China. By June 2021, the size of Chinese webcasting market reached 638 million users, accounting for 63.1% of the total number of Internet users in China [2]. Among them, e-commerce platforms (e.g., Taobao, Jingdong) and creative content platforms (e.g., TikTok, Kuaishou) are leaders in the live streaming business in China, and their output value is worth nearly 900 billion yuan in total [3]. Such platforms are increasingly important in the value co-creation process because of their ability to reach everyone, anywhere in the world [4,5]. With their respective clientele strengths and fan bases, these platforms assume the role of “middlemen (mediators)”, reinforcing the network connections with other actors, such as consumers, advertisers, producers, and suppliers [6,7,8]. They also created a new commercial environment, i.e., the platform economy [9,10,11], dramatically changing the spatial and temporal distribution of traditional supply and demand relationships.
Extant research focused on describing the phenomenon of live e-commerce [12], which involved analyzing consumers’ motivations and intentions and identifying sellers’ approaches and strategies [1]. Recently, some studies focused on the spatial layout, clustering, and influencing factors of LSCs in China. Live streaming as a virtual business model changed the traditional commercial geographic space, especially for streamers and online customers, and is rooted in specific regional contexts [13,14,15]. The aggregation of these actors reshaped, to some extent, the urban level in urban systems [16]. Existing literature provides a sound basis for further understanding the characteristics of key players in the LSC supply chain and the differences in their influence on various segments by applying a big data approach (i.e., a half-million Taobao LSC set of data values). More importantly, actors on the LSC interact with each other in a virtual streaming space, and the network of living supply chain relationships, thus, influences the upgrading of the city’s position in the original urban system and the further transformation of the entire system [17]. Hence, it is necessary to empirically describe this emerging commercial mode and analyze the impact of live streamers on the supply and demand relationship, regional infrastructure, and talent requirements. Currently, the development of live streaming platforms (LSPs) is entering a rapid boom, and China’s experience serves as a good example. One of China’s earliest and largest live e-commerce platforms, Taobao from Alibaba, leads the LSC market in terms of merchandise transaction volume.
In addition, with the expanding number of netizens and the improvement of supporting facilities, such as e-commerce finance and logistics, the demand for talents in live e-commerce is also increasing, especially live streamers who broadcast products or services in LSPs [18]. Some of them are influencers, Key Opinion Leaders (KOLs), or even celebrities, and they link their fans (potential consumers) and goods and play significant roles in online shopping [19]. Their style, reputation, and number of fans can often influence turnover during a live broadcast. It is vital to systematically describe the distribution characteristics of steamers of LSPs and explore the mechanisms behind the causes of current patterns.
More importantly, LSPs and their related buying and selling behaviors have become integral to Chinese citizens’ daily lives. To formulate relevant industrial strategies and appropriately adjust resource and service allocations, there are practical implications involved in explaining the spatial pattern of LSC in terms of product types, supply–demand relationships, and the urban/regional contexts behind these relationships. As a popular consumption model in the current information age, market data can bring the most intuitive and realistic understanding of live streaming with regard to goods [20,21]. At the supply chain level, companies use big data to gain insights into product and process design, supplier and customer needs, and market opportunities [22]. With the development of big data and artificial intelligence technologies, it is possible to use new research methods such as web crawlers and data tracking. Live streaming on e-commerce platforms, such as Taobao, is a particular category in the LSC given its commodity properties, and we can link the commodity information tracked using big data to sellers and (potential) buyers.
In this study, we observed the emerging economic and geographic reforms caused by live e-commerce in China, employing GIS spatial analysis. While changing traditional supply and demand relationships, the emerging live e-commerce in China brought rapid, far-reaching, and rarely documented changes to the geographic distribution of China’s production and sales. To better describe where China’s live economy is taking place and how this pattern works, this paper describes the spatial pattern of live streaming e-commerce producers, live streamers, and buyers. It analyses this mechanism from urban contexts, taking Taobao’s streamers as an example. As a result, we encouraged discussions about what kind of urban context China’s live streaming economy depends on and what adjustments should be made to spatial planning and resource allocation to provide better incubation conditions for similar e-commerce models.
The paper is organized as follows: Section 2 presents the relevant conception and research framework; Section 3 describes the methodology; Section 4 gives the results and analyzes the reasons for such outcomes; and, finally, Section 5 concludes with a discussion.

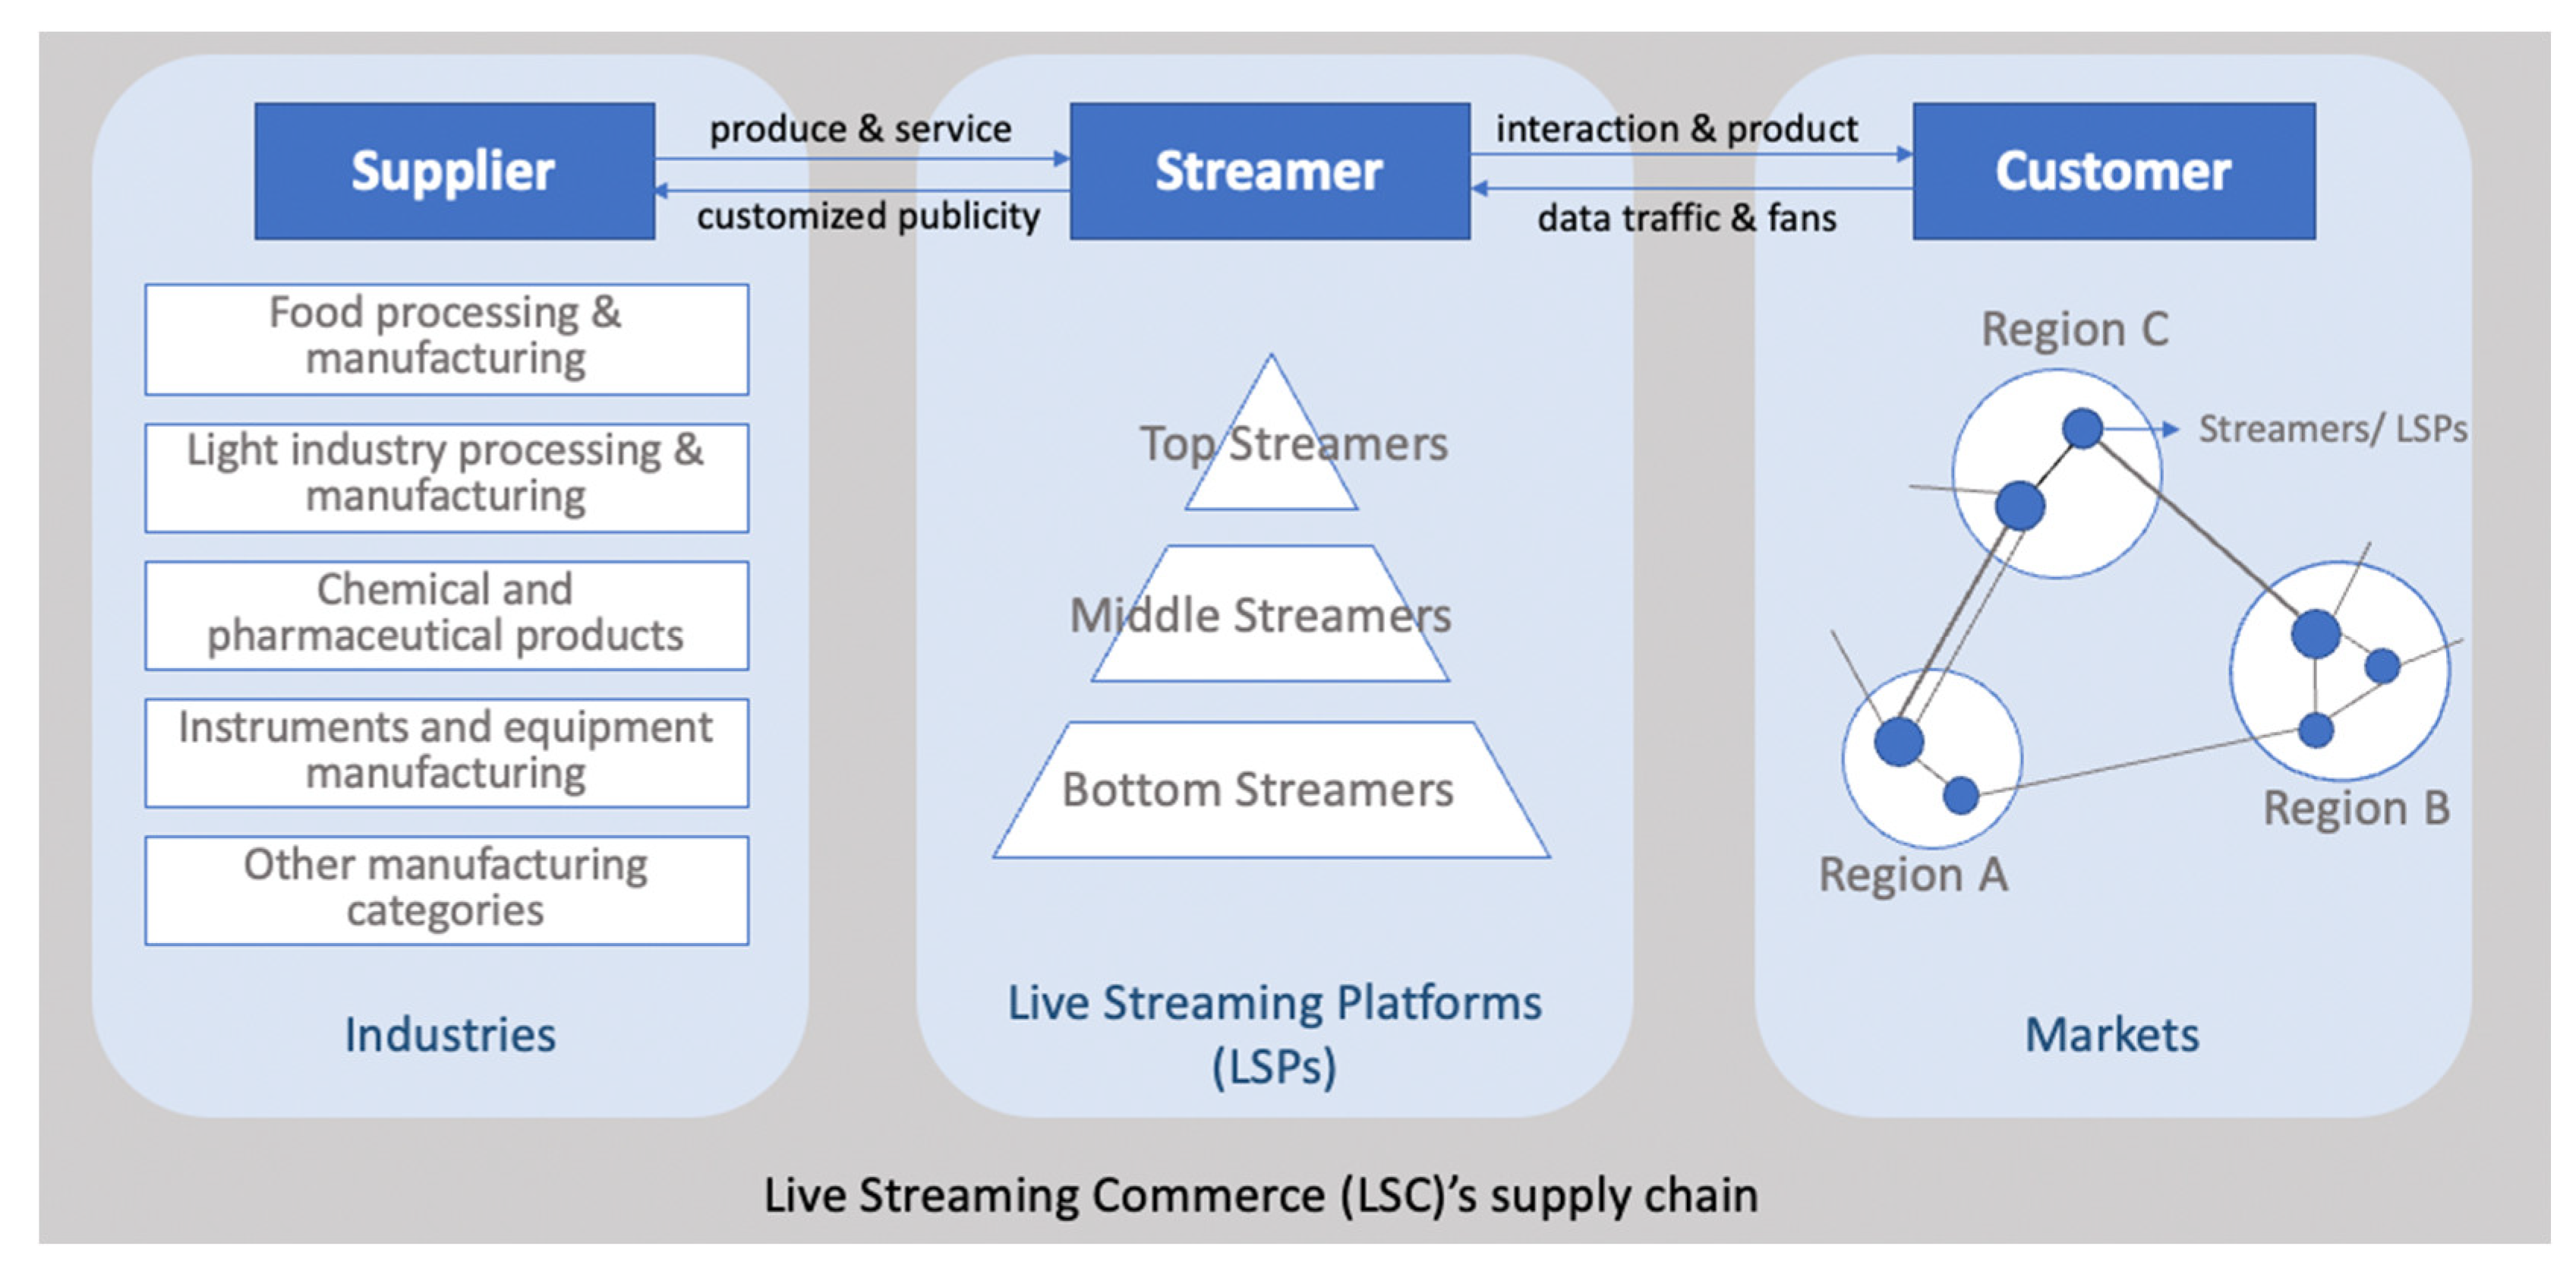
2. Conception and Research Framework

2.1. Emerging Live Streaming Commerce in China

China’s live e-commerce market originated from the live streaming industry. In the decades after the birth of television, news on TV was dispersed mainly in the form of live broadcasts. Subsequently, the rapid development of the new live channels available via Internet webcasting, such as BBS forum, graphic sports live, PC concert live, etc., became supplementary forms of live TV but did not achieve the real-scale economies effect. In November 2015, Alibaba launched “Taobao Live”, which authentically combined live streaming and e-commerce [23].
E-commerce is a powerful force used to connect B2B markets and producers to consumers (B2C markets) [24]. The online marketplaces serve both geographically close and remote customers. LSC combines live streaming and e-commerce, enhancing authenticity, visualization, and interactivity. It is a subset of e-commerce embedded with real-time social interaction, a feature that is unique to live streams, including real-time video and text-based chat channels [25]. Through live streaming, these real-time interactions overcome the drawbacks of delayed and unintuitive traditional online shopping experiences [1]. In LSC, live streamers can interact with potential customers via audio, video, and text; introduce product features; answer customer questions; and make sales in real time; likewise, customers can comment and ask questions during the broadcast to communicate with the streamers. It provides a sense of direct, synchronous communication, as customers observe a seller’s verbal/non-verbal behaviors and his/her identity [26,27], greatly enhancing consumers’ willingness to purchase [1,28].
As the broker of the live streaming ecosystem, live streamers can efficiently realize the accurate connection between upstream and downstream sections of the supply chain. Most streamers have their “own relationship” (“Guanxi” in Chinese) with supply chains, allowing them to shift their marketing strategies by quickly responding to customers’ needs and launching products with consumers’ recognition. The engagement between live streamers and the upstream and downstream sections of the supply chain improves the efficiency of the supply chain. On one hand, the comments, likes, shares, add-ons, and deals generated through real-time interaction can reflect customers’ needs and consumption tendencies. Accordingly, streamers and upstream producers can make precise adjustments in terms of new product development, process improvement, and price design. At the same time, streamers can adjust the frequency of live broadcast according to the supply of raw material, the level of productivity, and the storage inventory of the manufacturer, thus realizing the deep integration of e-commerce and supply chains. On the other hand, some multi-channel network (MCN) organizations shorten the path from supply to demand by building their own chains, thus de-intermediating lower channel fees, improving the efficiency of different segments of cooperation, and reducing costs simultaneously.
LSC generates brand value through the emotional capital that is invested by streamers in their fans [16]. The “scenario” [29] created by the live streamer in his/her studio may also influence the demand of consumers. Similar to the direct sales, a studio with many active customers, a good shopping atmosphere, and word-of-mouth credit can enliven the shopping experience and influence customer decisions [27,30]. As a result of the above characteristics of live streaming, a fan-based economy emerged. Here, fans are potential customers in the LSC supply chain who have distinct consumption preferences and form influential consumer communities [31].

2.2. Intermediary Role of Live Streamers in Live Streaming Commerce

There are three categories of key participants in the supply chain in LSC. The first category is the live streamers, who broadcast themselves and, more importantly, sell products online through a live stream to audiences. To provide consumers with a complete “closed-loop shopping transaction”, streamers act as intermediaries between suppliers and LSPs with multifunctional roles, not only acting like spokespeople to present videos, images, attributes, and other product-related information, but also like salespeople to select products, promote sales, and even acquire consumers through online marketing [17]. The second category is consumers of LSPs. They follow streamers and make purchases while watching their videos via mobile phones or computers. More importantly, consumers derive information, entertainment, and social value from watching live streams. They also interact with streamers and other viewers and collect and maintain information pools [32], which, in turn, help streamers to expand their market scope. The third category is suppliers of products sold via live sales. Most suppliers manage the supply of products through a specific platform, set their sales prices, and share revenues with streamers at a certain commission rate.
This paper focuses on the spatial distribution and characteristics of these three actors’ categories and highlights the role of streamers as intermediaries in bridging the gap between the other two actors (Figure 1). In addition, we discuss the spatial patterns of different organizations/individuals in LSC and highlight the varied effects of different types of intermediaries on expanding industrial supply chains and adjusting urban–rural structures in China.
In particular, the intermediary role of online streamers in the supply chain and its influence across industry suppliers may vary depending on their own attributes. Live streamers have become a sub-sector of “internet marketers” in China (the Ministry of Human Resources and Social Security promulgated 35 national vocational skills standards, such as Internet marketer and online delivery person; the Ministry of Human Resources and Social Security of PRC (2020), http://www.mohrss.gov.cn/SYrlzyhshbzb/rdzt/zyjntsxd/zyjntsxd_zxbd/202112/t20211228_431485.html, accessed on 15 March 2023). In terms of their affiliation, there are mainly independent, merchant-linked, and platform-signed streamers [23]. Independent streamers carry out live broadcasts independently without being attached to MCN organizations or merchants. Merchant streamers are those employed by brands or merchants, and platform-signed streamers are contracted with MCN companies. From the perspective of the number of followers and streamers’ sales volume, three groups of streamers can be identified: top streamers, middle streamers, and bottom streamers. It is found that an apparent Matthew effect exists in the streamers’ segment, with 2.16% of the top streamers occupying nearly 90% of the market share [33]. For top streamers with leading positions, such as Weiya, Jiaqi Li and Simba, their gross merchandise volume (GMV) reached a hefty 22.539 billion, 13.931 billion, and 7.613 billion RMB, respectively, in the second half of 2020. Middle streamers account for nearly 20% of the total number of followers. The rest of market is made up of a vast number of bottom streamers, mostly grass-rooted streamers, who are the mainstay of shop casting and rural farming live streaming, albeit with limited influence and content creation capacity.
In this paper, we will not discuss the embedded relationship between streamers and their affiliation, rather classifying the streamers by their volume of internet traffic and sales according to the differences in the impact they would have on various subjects in upstream and downstream sections the supply chain.

2.3. Distributions and Connection of Live Streaming Commerce

With the development of urbanization and industrialization, the concentration of resources (e.g., investments, talents and technologies) and innovation differences lead to uneven regional development and variations in the scale of specialized production [34]. In particular, for those emerging economies such as China, which are eagerly seeking technological upgrading [35] and have constrained resources and inconsistent public investment, some regions will be received preferential public support before others, leading to geo-spatial inequality and agglomerative development. Since the reform and opening up, the eastern coastal regions in China have been the ideal location for firms in terms of location theory [36], agglomeration effect [37], and external economies [38]. Following China’s accession to the WTO in the 21st century, more frequent transnational cooperation and deepened globalization were observed, while further imbalanced industrial distribution also happened in China, i.e., coastalisation [39]. Data show that more than 65% of the total industrial output of Chinese textile and apparel enterprises is clustered around Guangdong, Shandong, Jiangsu, and Zhejiang [40].
The relationship between e-commerce and urban development is intermixed. The formation of e-commerce platforms is influenced by information and communications technology (ICT) infrastructure and production networks, social networks and power relations, and urban form and land use, which are all interconnected [41]. On one hand, the development of e-commerce and its impact on the regional economy is very much related to its regional context; for example, the impact of Taobao platforms on China’s rural economy is related to the relative locations of rural areas and central cities [42]. In addition, live streamers and their marketing potential are also geographically heterogeneous; for example, the Yangtze River Delta (YRD), Pearl River Delta (PRD), and the Beijing–Tianjin–Hebei and Chengdu–Chongqing regions have the advantage of concentrating streamers, which is associated with the relatively developed information development level and economic strength of these locations [14,16]. With the rise in ICT, the productive capacity of society was greatly enhanced, which changed global economic relations and organization. It is argued that a new form of organization is arising and that any space on the Internet can be part of cyberspace [43,44]. However, there is also a similar geographical tendency in the ICT industry to be located in particular cities in coastal areas with well-developed economies, high trade openness, and a prevalence of communication technology and research talent [45]. This trend is also in line with the idea of combining ICT with geospatial research [46]; while ICT in the digital economy reduces the cost of physical communication between organizations across regions, it is worth emphasizing that the selection preference of organizations generated from the embeddedness in regional contexts can also bring about spatial imbalances in their organizational network relationships [47].
On the other hand, the agglomeration and network relationships of e-commerce platforms also reshaped the urban system [16,17]. It is recognized that new relationships formed by aggregated and interconnected e-commerce organizations are reconfiguring the original urban–rural economy, society, and space, as shown by the case of Taobao village in China [48,49]. Nowadays, platforms in digital technology are new social, economic, and political intermediaries that promote urban development and improve our daily lives [50]. It is of great research significance and value to think about the interaction between platform capital and urban space [51], effectively combine platforms with some business models [52,53], and discuss issues related to platform urbanization from a network perspective [54].
With the rapid rise in LSC, the spatial layout of streamers and their platforms is influenced by the type of goods and their regional contexts, logistics and storage capacity, and transportation conditions [17]. By emphasizing the consistency of “people, goods, and places”, the supply chain can be effectively interlinked, which is the reason why urban retailing usually has a certain spatial radius. It is found that leading influencers and large LSPs are still highly concentrated in the YRD and PRD metropolitan regions [14]. Thus, cyberspace and geographic space have a symbolic relationship [55]. Since communication technologies and production and consumption opportunities have a strong geographic propensity [56,57,58,59], cyberspace also has its own geographical location and irregular topology [60,61].
Despite certain geographical tendencies and disparities in the industries involved in e-commerce and the space in which the streamers are located, studies analyzed the expansion of the traditional supply and demand distribution based on the emerging live streaming industry. Due to the location- and time-free nature of online shopping, it provides an equal opportunity for development not only in large cities, but also in those small or even remote towns and villages. Currently, top streamers in China serve suppliers and customers across the country, and bottom streamers are prominent in expanding their business in suburban and rural areas. LSC enables agricultural products, rural cultural tourism products, and other rural specialties to be linked to a broader market across regions, promoting agricultural sales and raising farmers’ incomes through massive exposure and streamers’ influence. Over the past decade, China saw more than 3000 “Taobao villages” emerge, and these clusters of rural online entrepreneurs became a significant force behind the development of “rural e-commerce” [62]. In addition, data show that China’s webcast agricultural sales grew from 158.9 billion to 422.1 billion between 2016 and 2021. Significant economic growth is generated through e-commerce and live streaming by linking unequal local products to urban purchasing power; this growth is recognized to “not only be an interesting development and employment program for rural and remote areas in China, but most probably also for other Asian countries with a distinctly rural character and a rural-urban divide” [63].
In this paper, we argue that the LSC enables the resource endowments and industrial base of certain regions to become more valuable. As intermediaries between goods and consumers, online streamers can link supply and demand more widely and precisely and, to a certain extent, bridge regional development inequalities. Therefore, starting from the basic economic theory of “supply and demand”, we explain how the geospatial pattern of suppliers, streamers, and customers is characterized in China’s current LSC and, more importantly, whether it brings new opportunities for city regions that were traditionally less competitive, before discussing how this emerging economic model may challenge existing urban and rural planning, industrial infrastructure, and public facilities.

3. Methodology

3.1. Data Collection

The data in this article come from the database of Huitun, China’s leading data and service platform for live streaming and short video e-commerce (Table 1). It contains detailed transaction data from the leading LSPs in China, such as Taobao, TikTok China, and Kuaishou, with data covering 14 segments, including apparel, luggage, beauty, fresh food, and electrical appliances. We selected data (until 31 December 2021) from players (suppliers/live streamers/customers) mainly involved in Taobao’s (Alibaba) live commerce activities.
Taobao was the earliest available C2C e-commerce platform in China and is owned by one of the largest LSPs—Taobao Live. It uses an innovation business model that uses live streaming to absorb data traffic and create a better online shopping conversion rate. The essence of Taobao Live is market-driven, allocating live traffic to potential high-traffic products and efficiently connecting suppliers and customers in an intermediary way. Compared to platforms such as Kuaishou and TikTok, which focus more on social contact and content, Taobao’s e-commerce business is more professional, with advantages in marketing, transaction guarantee, and user retention. According to the “Online survey report on consumer satisfaction of live e-commerce shopping” released by the China Consumers Association, in terms of active user volume, Taobao ranked first with 874,915,600 monthly active users in June 2022, which was nearly 1.3 times more than TikTok China in second place; in terms of platform share, Taobao live consumers accounted for 68.5%, followed by TikTok China live consumers, who accounted for 57.8%.
To ensure the integrity and scientific nature of the study, we pre-processed all the data. Firstly, the data were interpreted and reviewed as part of this study. Ultimately, we obtained 540,896 valid data containing information on 999 leading Taobao live streamers in 77 cities in China. The information included the live streamer’s city, the live streamer’s type, the live streamer’s sales, the supplier’s city, the number of consumers, and consumers’ geographical distribution. Secondly, referring to the basic geo-information data published by the National Geomatics Center of China (http://bzdt.ch.mnr.gov.cn/, accessed on 31 December 2021), this paper summarized all of the suppliers, live streamers, and consumers at a point and spatially visualized them with GPS Visualizer and ArcGIS 10.6 to obtain the spatial database of the distribution of each node in the supply and demand chain of Taobao LSP.

3.2. Research Method

Kernel density estimation (KDE) is the application of kernel smoothing for probability density estimation, i.e., a non-parametric method to estimate the probability density function of a random variable based on kernels as weights. KDE answers a fundamental data smoothing problem through which inferences about the population are made based on a finite data sample. The result can be used to smoothly identify and represent the aggregation and dispersion of sample points in the research area [64], having the advantages of simplicity and intuition. The KDE method is suitable for the visual expression of the point distribution pattern, and the formula is,
γ h p = i = 1 n 1 h 2 k ( p p i h )
where k is the weight function, (p − pi) represents the distance between the points p and pi that needs density estimation, and h is the bandwidth, i.e., the search radius.
Drawing on the existing literature [65,66,67], this paper set the cell size and search radius to the default values, i.e., the coarsest input raster dataset determined the cell size. The use of spatial variables of the “Silverman Rule of Thumb” to calculate the default search radius (bandwidth) for supplier, streamer, and consumer datasets generally avoided the doughnut phenomenon around points that often occur in sparse datasets and prevented spatial outliers (i.e., a few points away from the remaining points) [68], which was well applicable to the data situation in this study (e.g., a frequent occurrence in individual cities within the national scale). Its calculation formula is as follows:
SearchRadius = 0.9     min SD , 1 ln 2     D m     n 0.2
where D m is the (weighted) median distance from the (weighted) average center, n is the number of points that did not use the population field, and SD is the standard distance.
We obtained geographic location information for suppliers, live streamers, and customers via Taobao Live-recorded streaming transactions. Using the KDE method, we abstracted the location information of different trading entities into “point” elements and analyzed their spatial agglomeration characteristics.
We also used statistical analysis of spatial data from GIS in our research. Data generated by social media users were valuable by-products of urban studies [69], and when this information was georeferenced, it added value to urban studies. Depending on the different data characteristics, the spatial analysis of GIS could be divided into analytical operations based on spatial graph data, non-spatial attribute data, and mixed operations on spatial and non-spatial data. In our research, we combined the non-spatial attribute data of the GMV of the Taobao streamers with the attribute data of each city. Through the spatial analysis of GIS, we summarized the spatial characteristics of the supply chain of different industries at the city or regional level, as well as the different performances of different types of live streamers.

4. Results

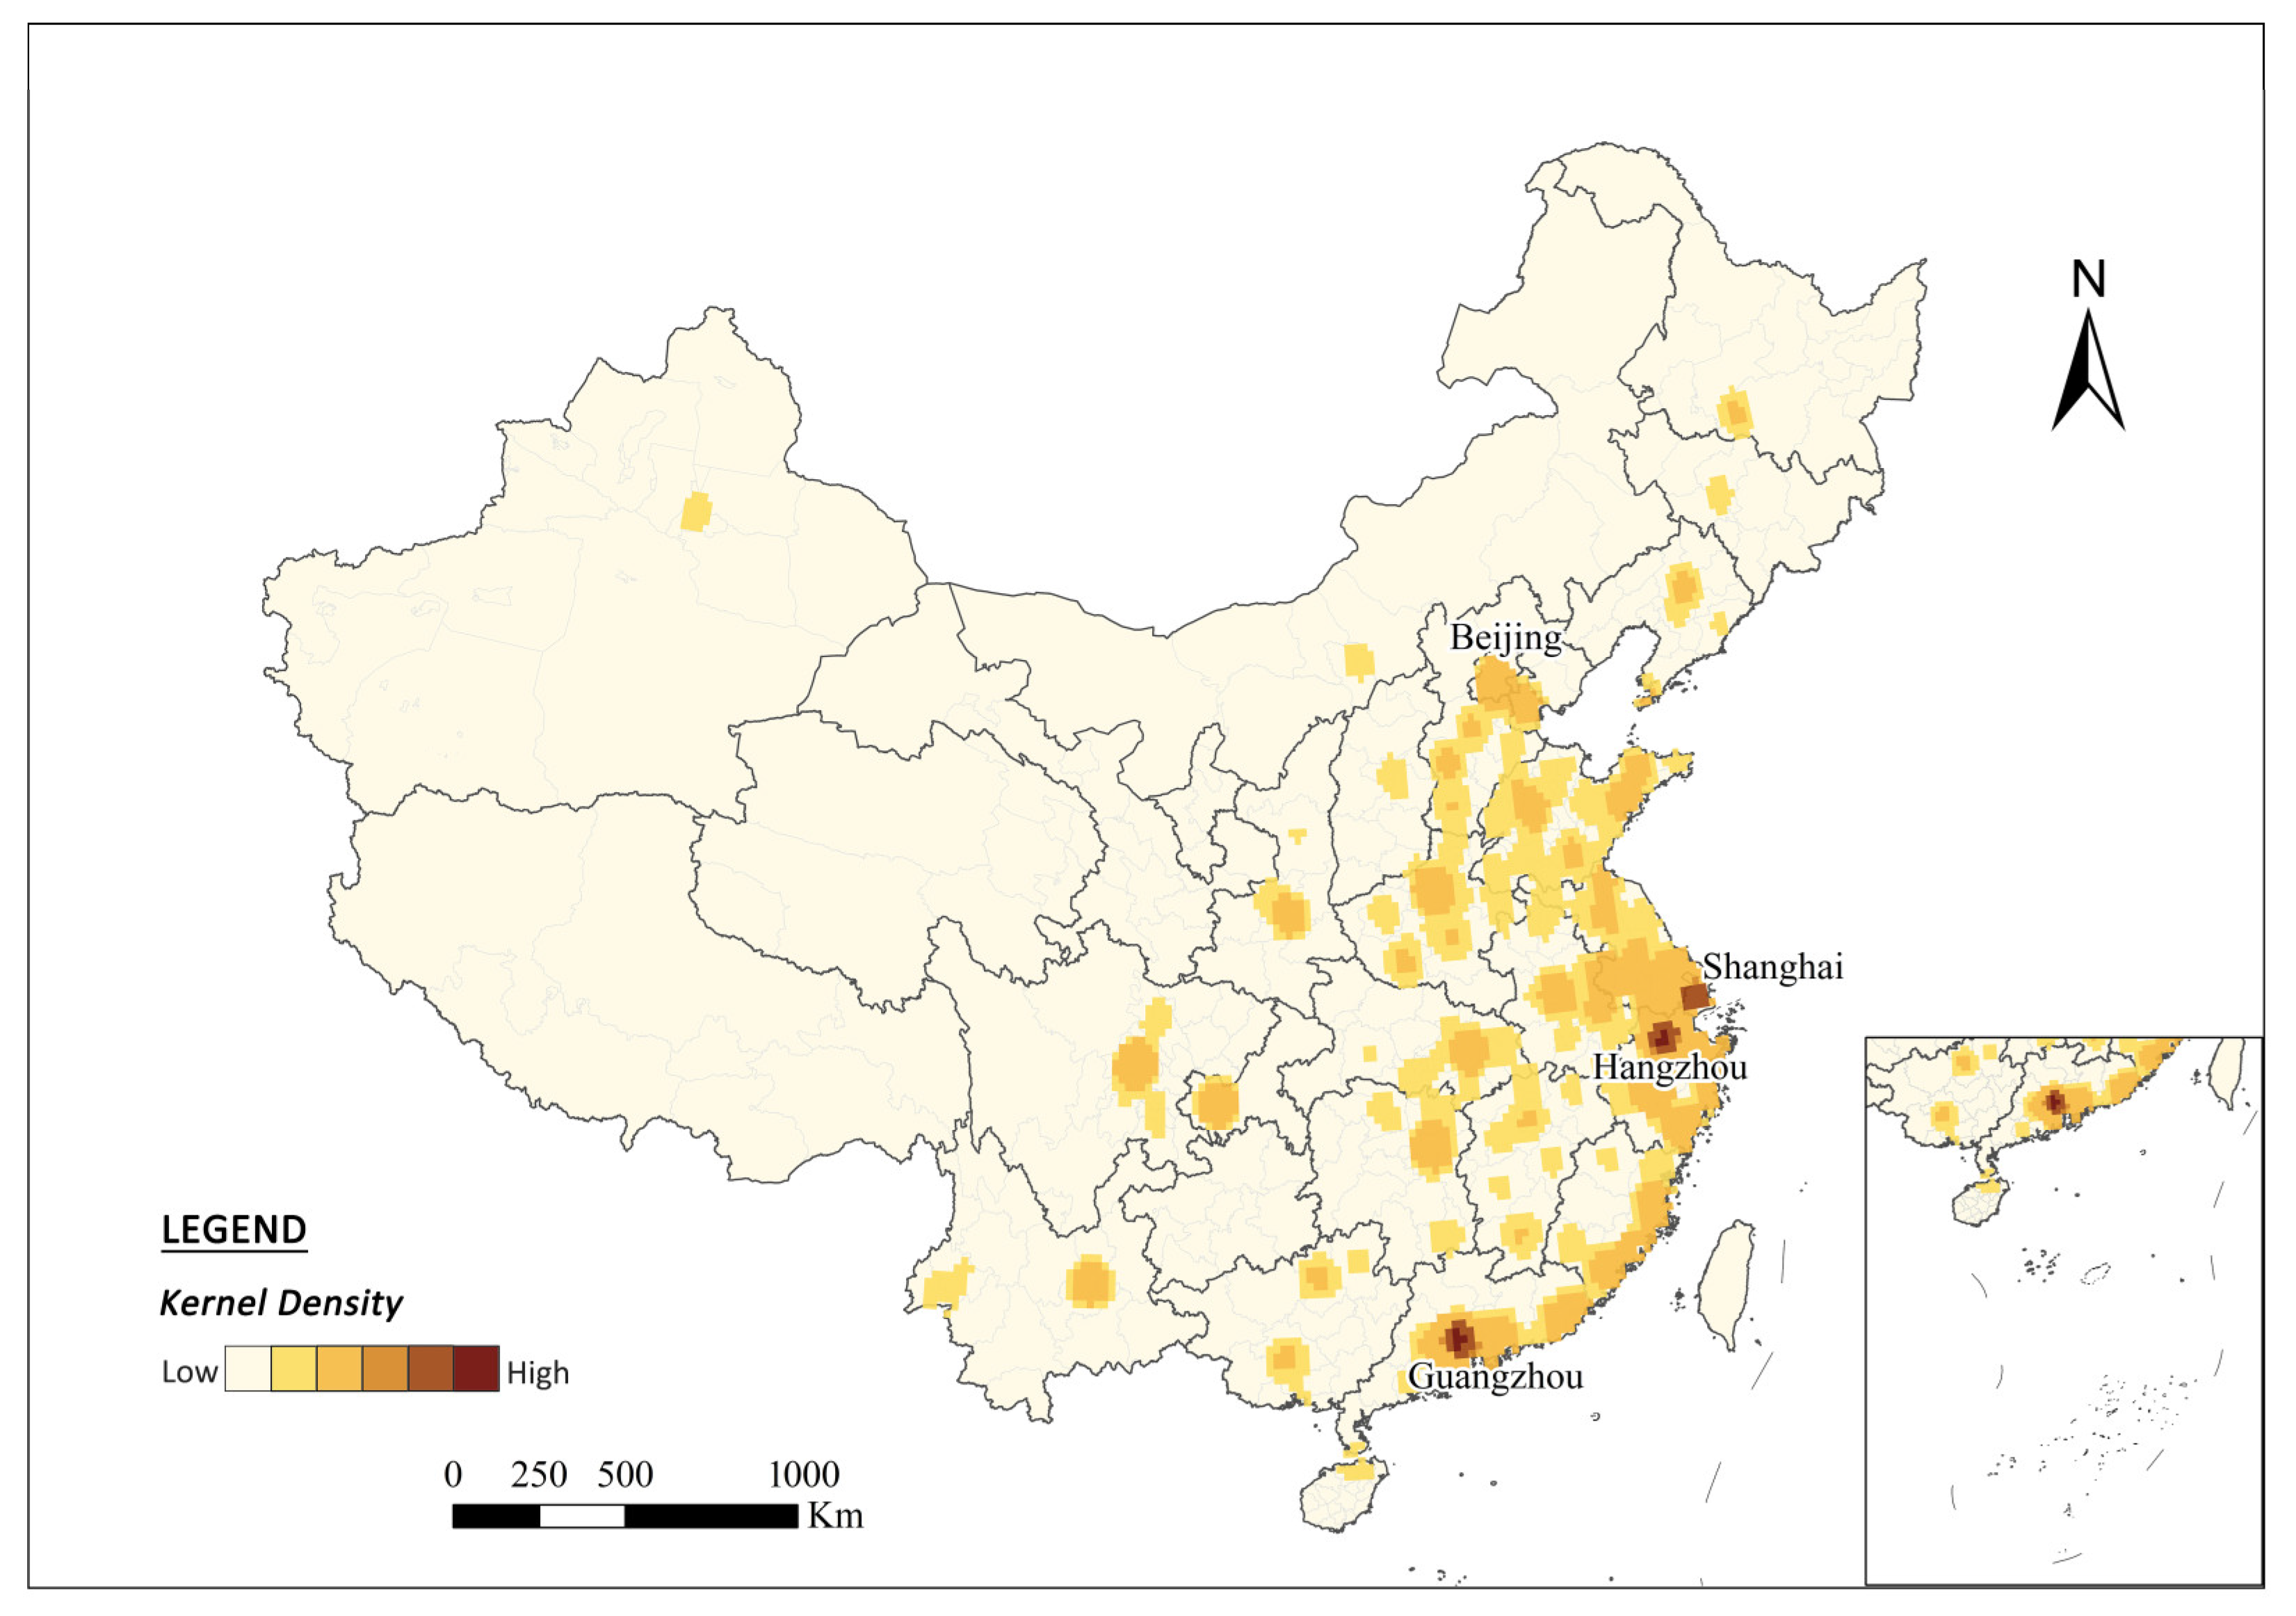
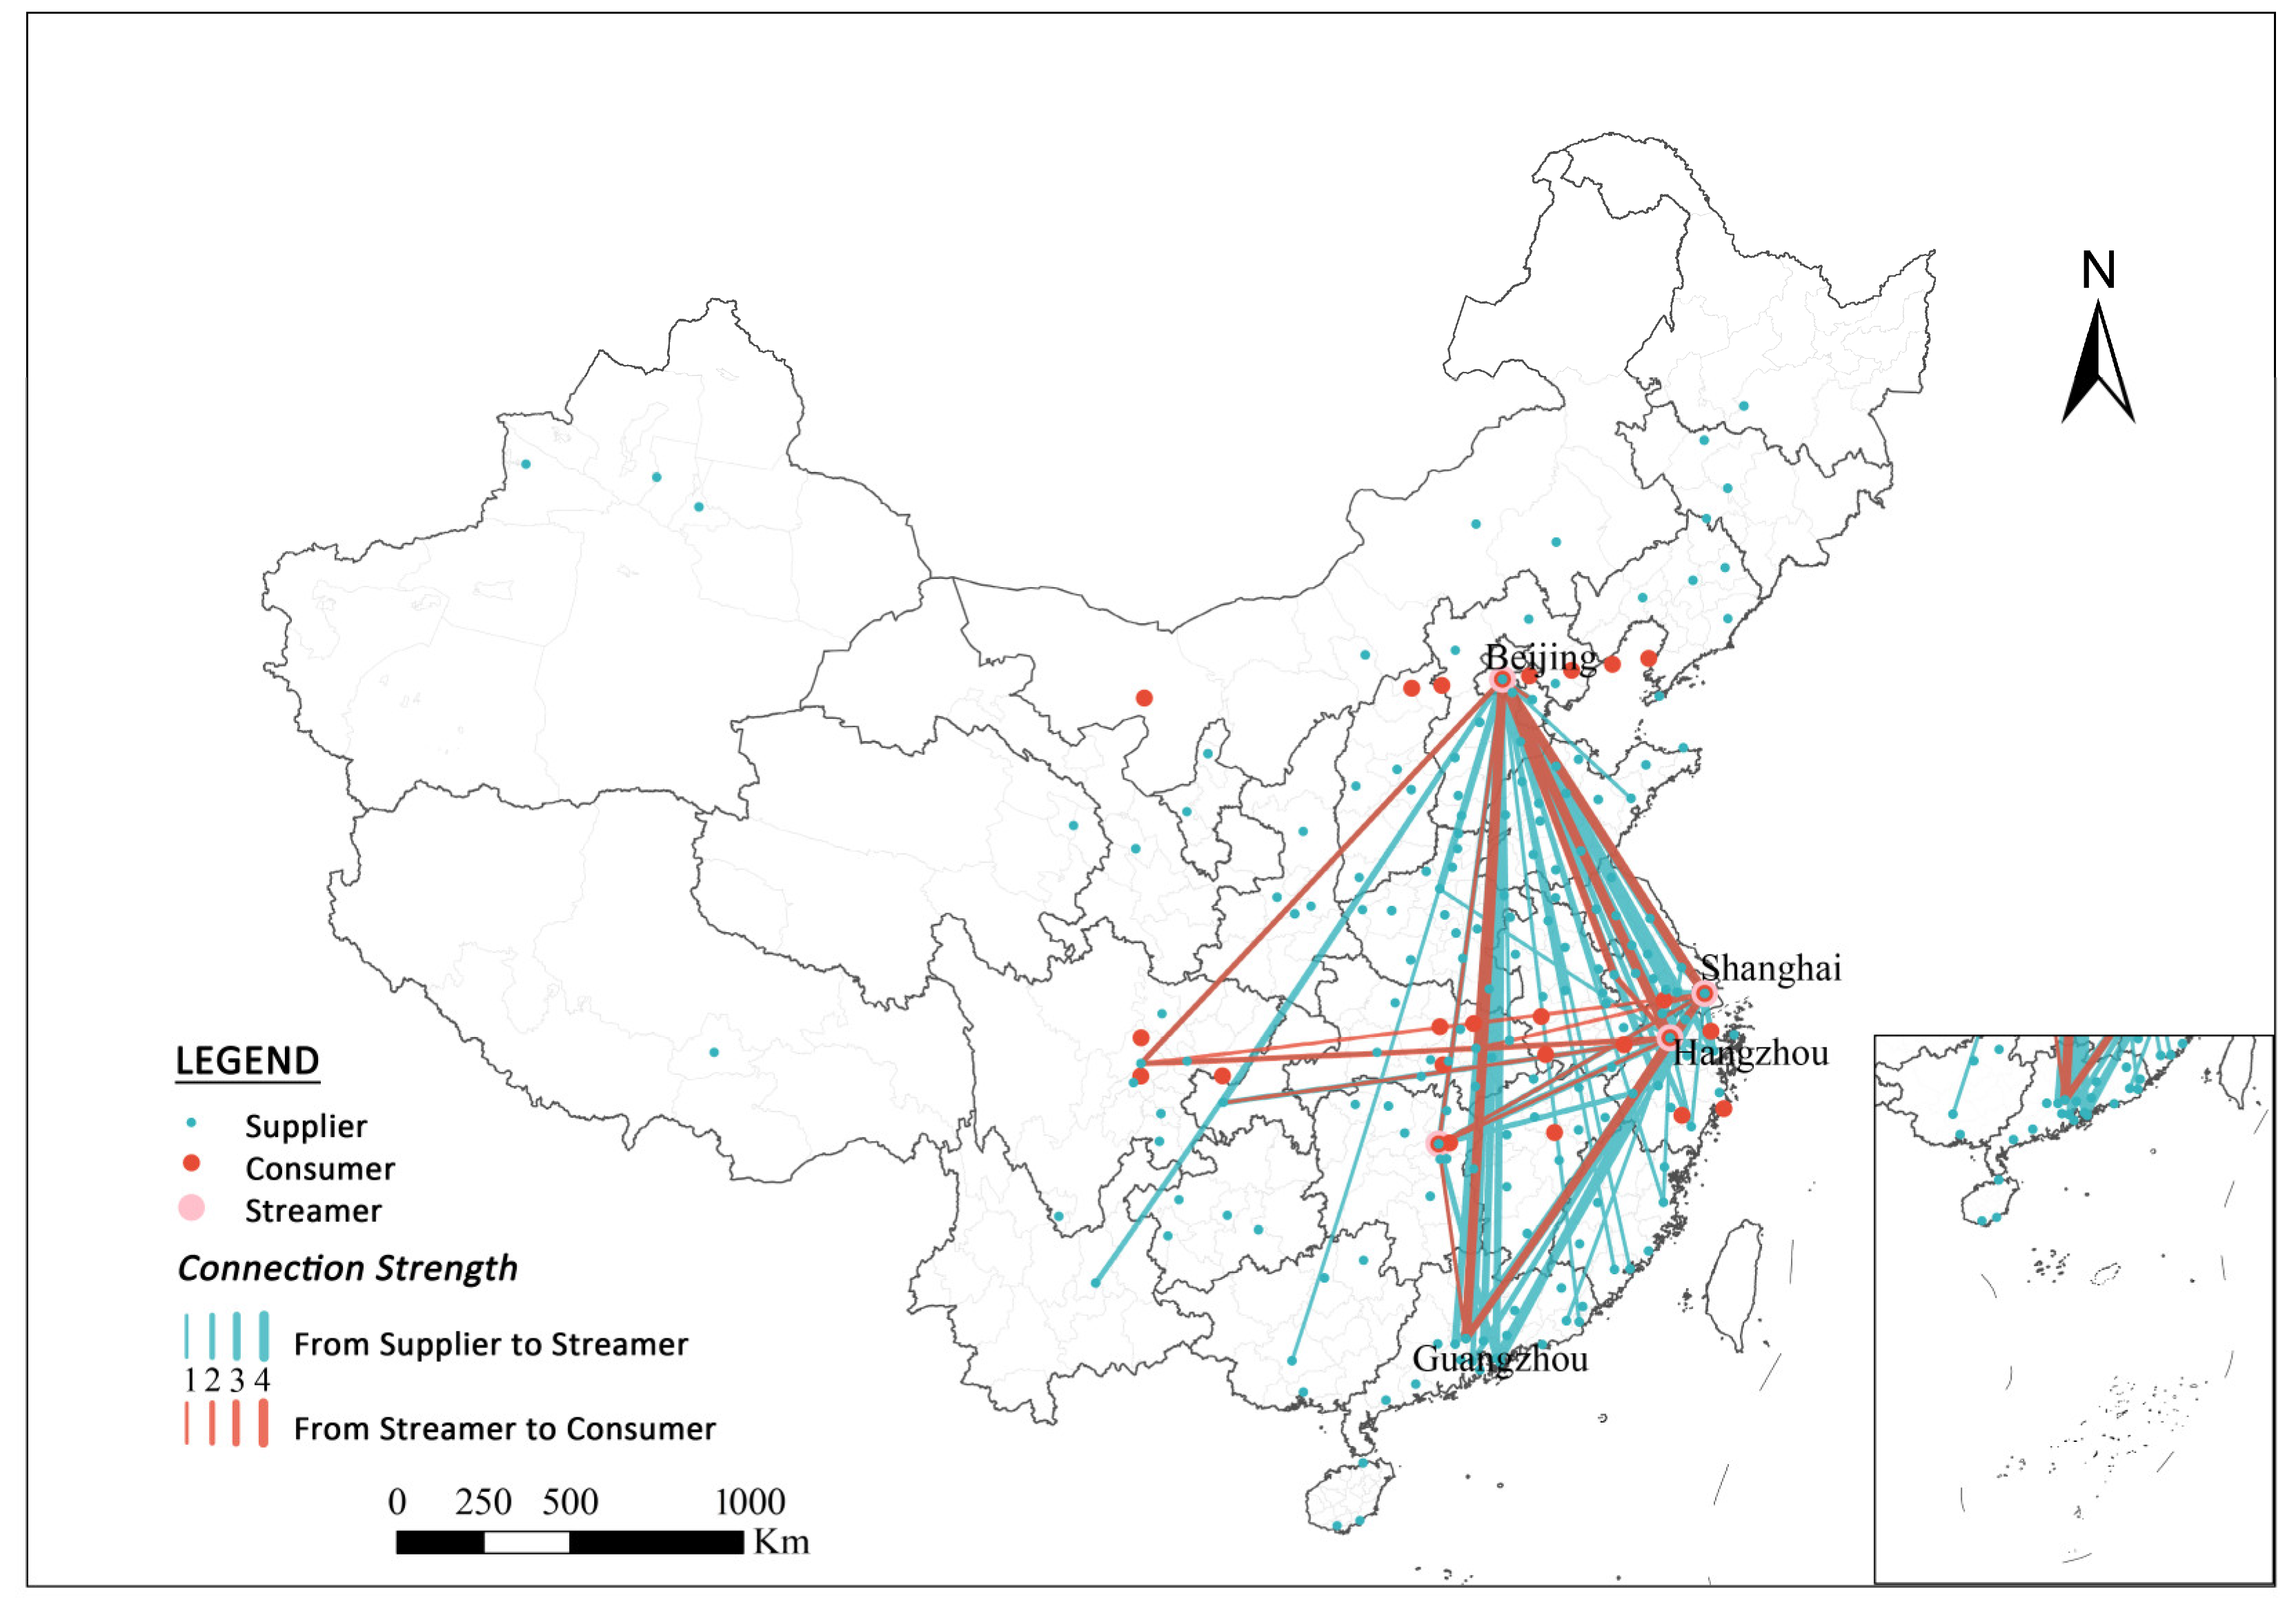
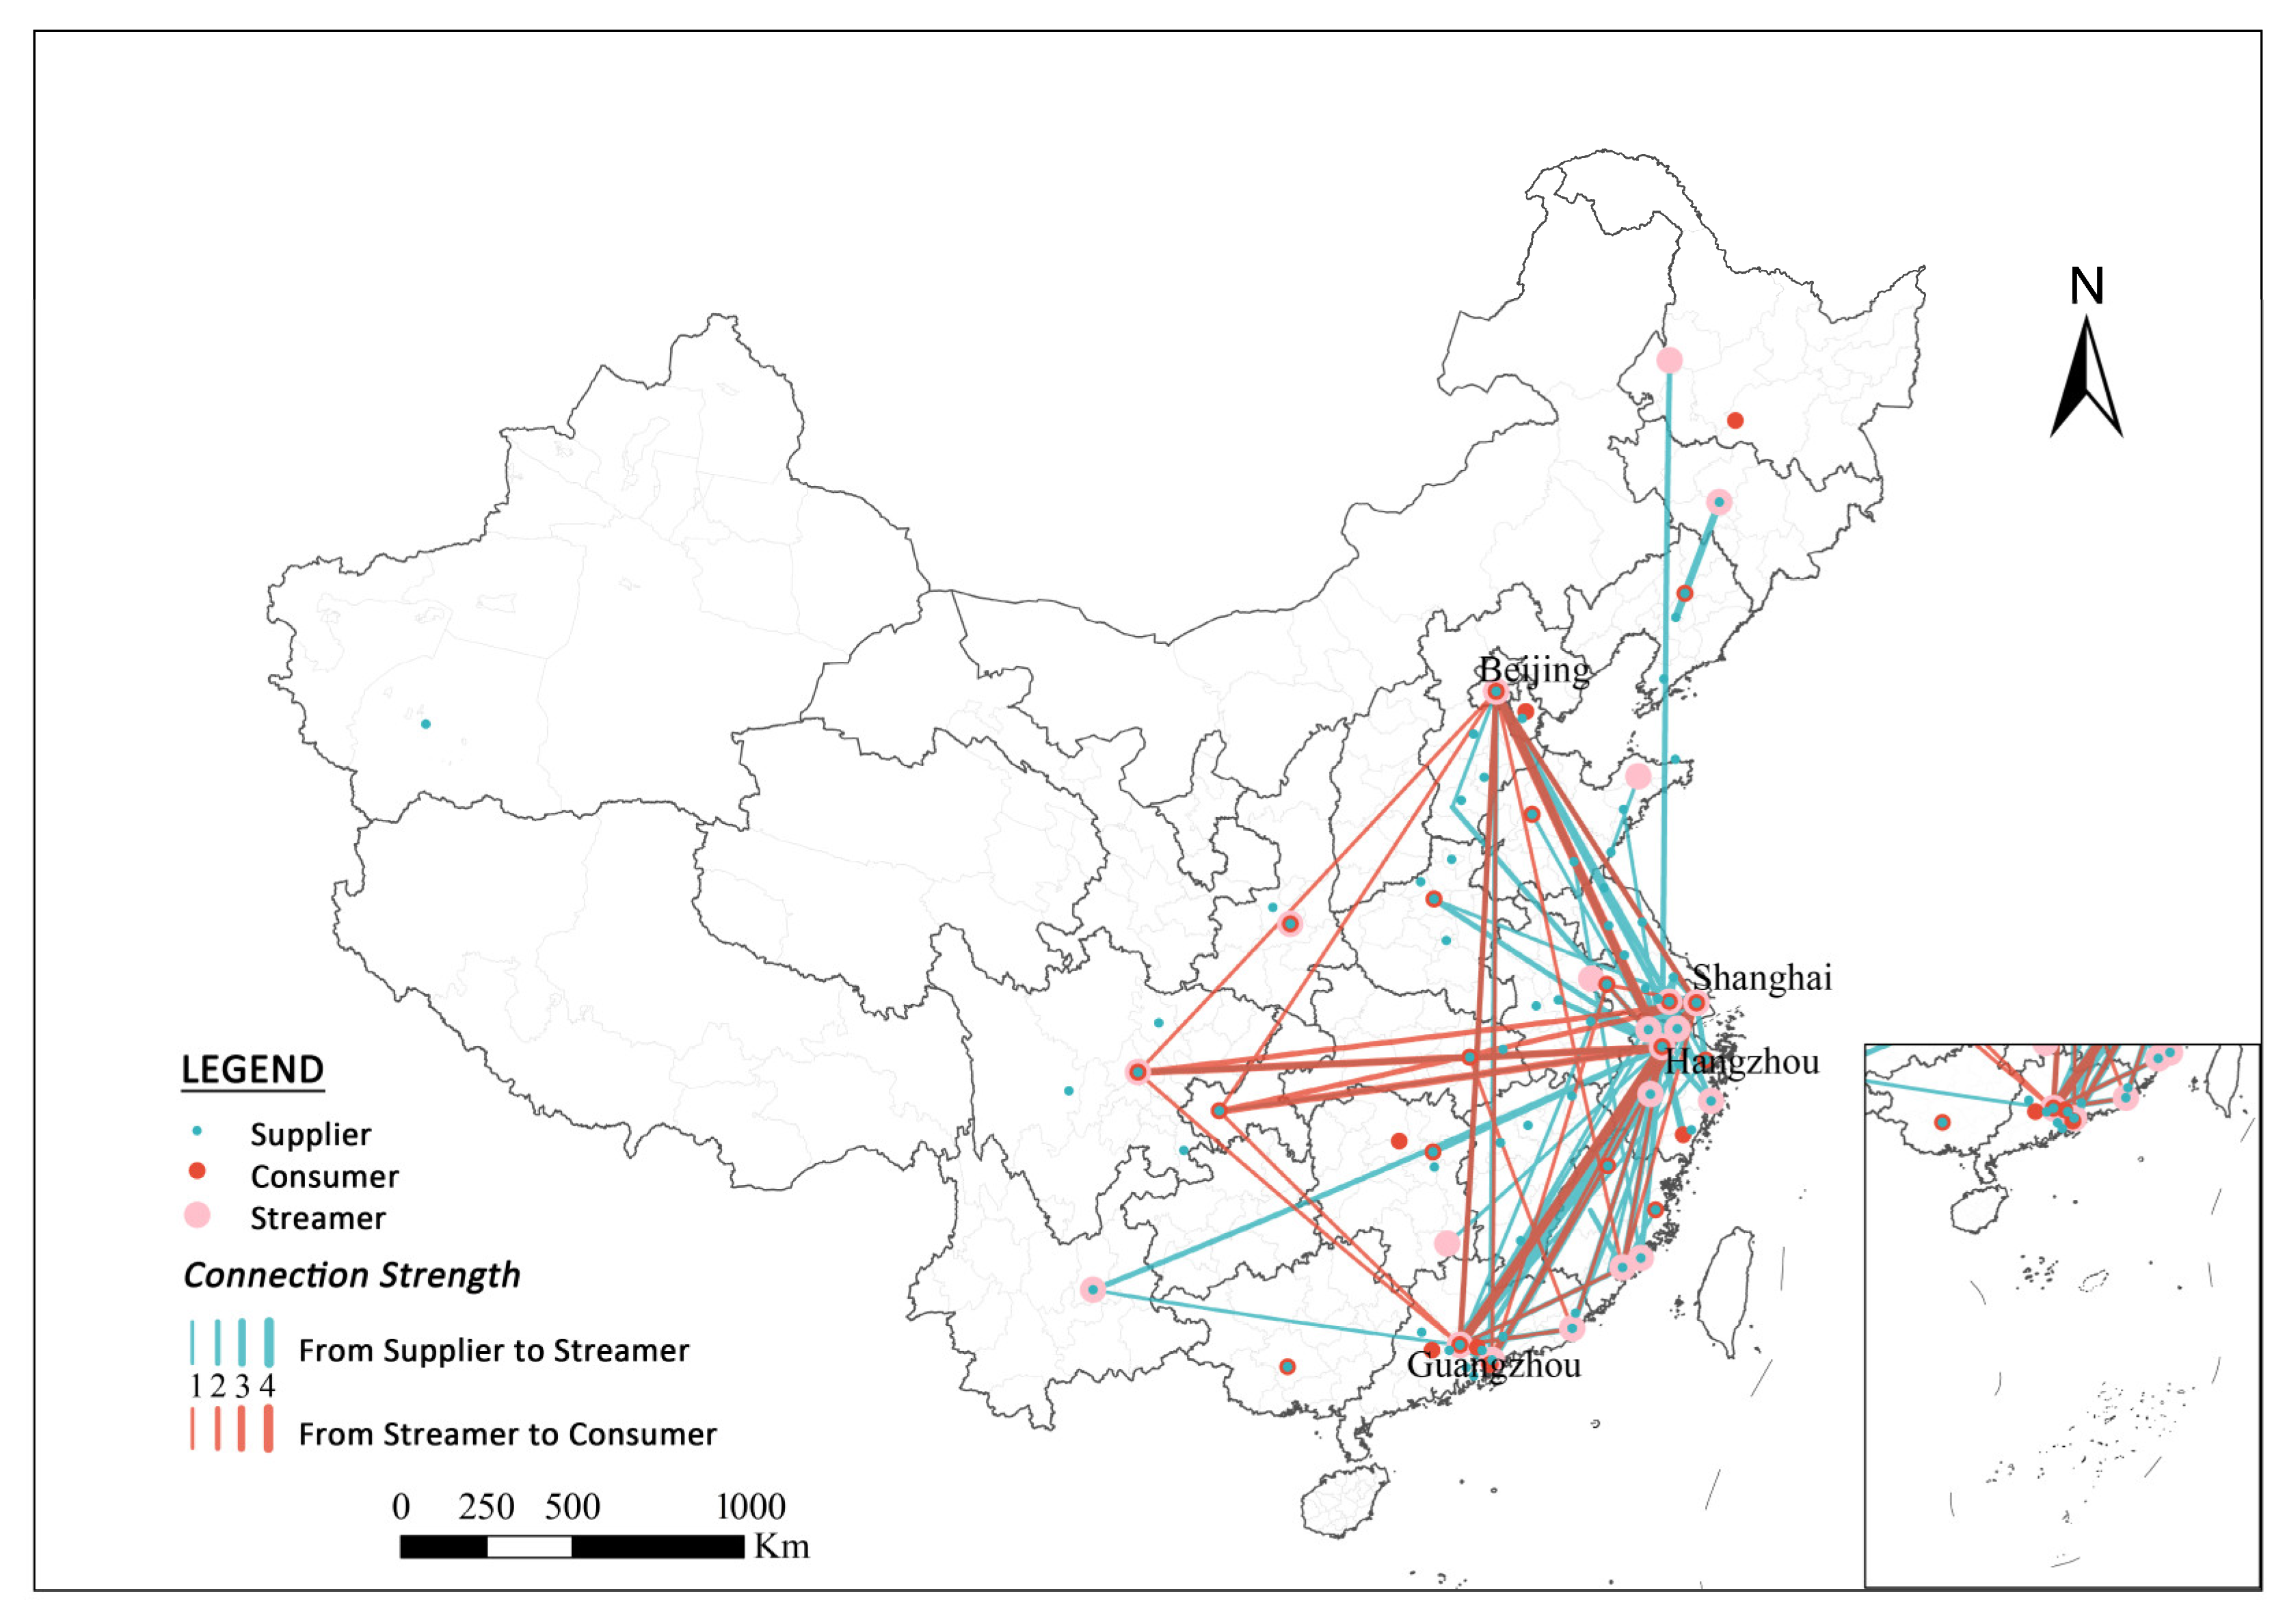
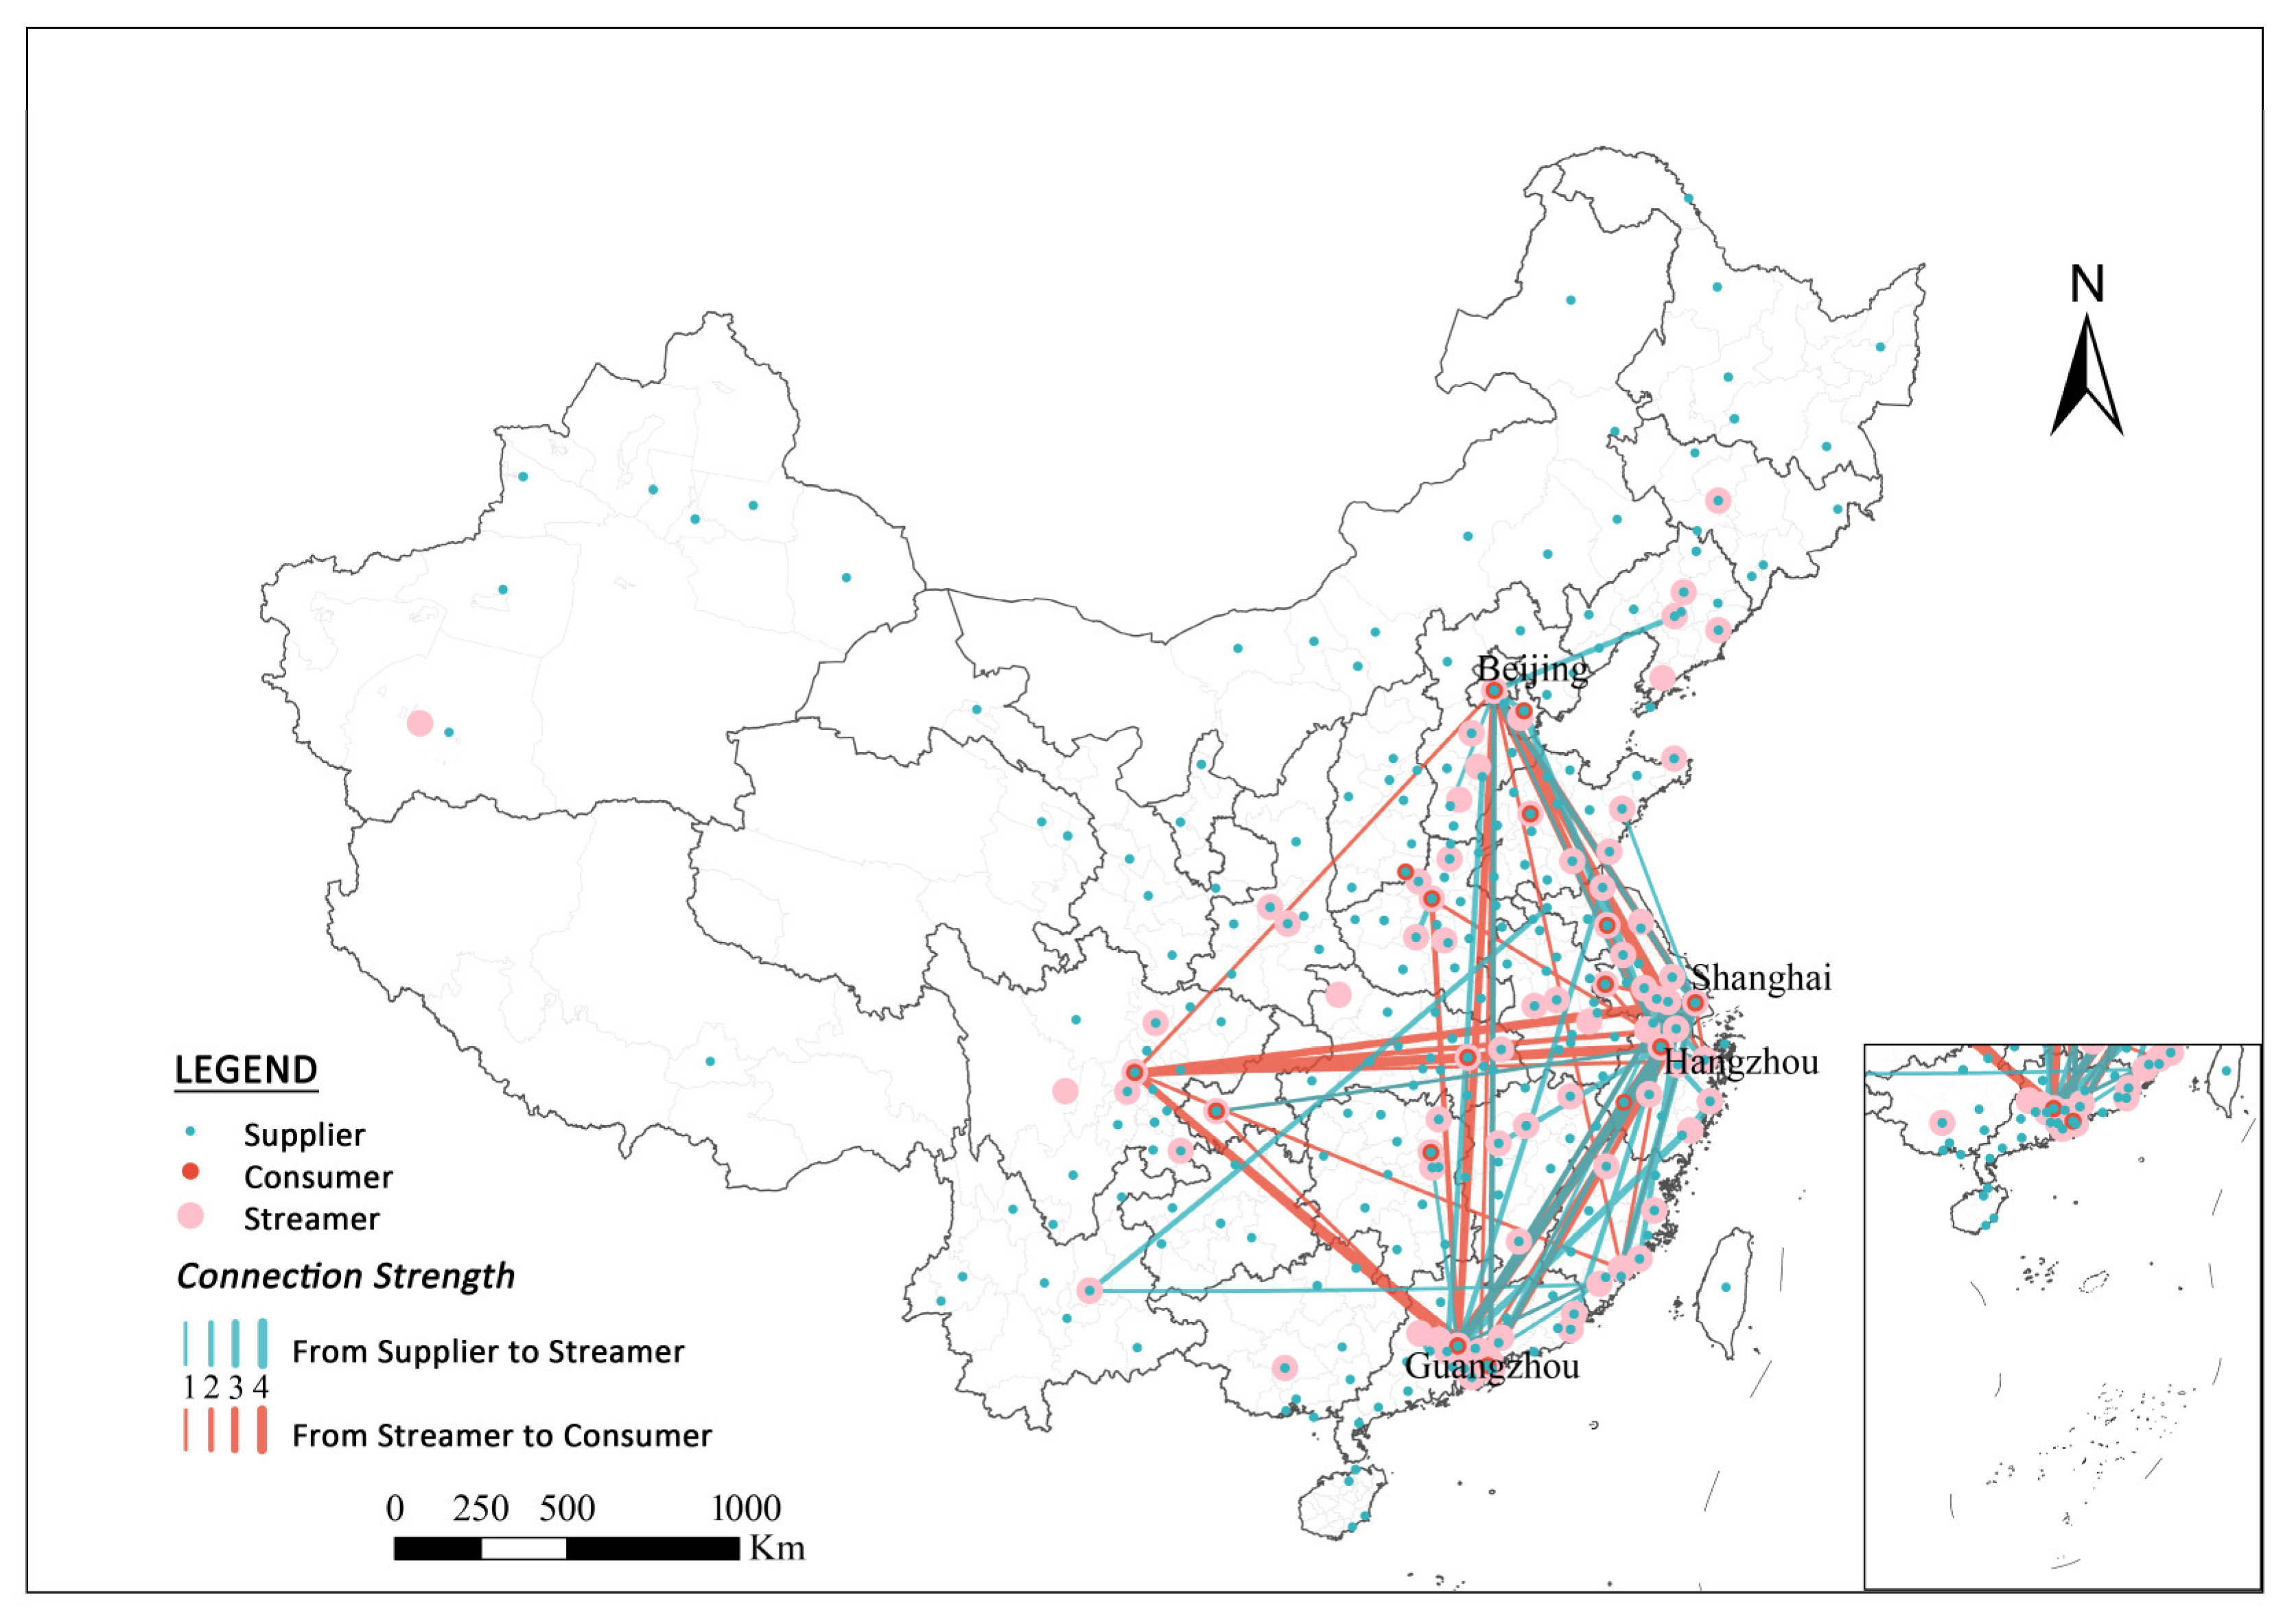
4.1. Spatial Distribution Characteristics of Suppliers, Streamers and Consumers

According to the KDE method, suppliers, streamers, and consumers’ spatial distributions vary. Suppliers show significant spatial diffusion; in contrast, intermediaries and customers have significant geographical agglomeration characteristics.
The spatial distribution of suppliers (Figure 2) is concentrated in the eastern coastal region of China and diffuses to the inland regions. There are 7746 (83.21%) live streaming suppliers in eastern China, compared to only 1116 (9.53%) in central China and 851 (7.27%) in western China. The spatial distribution pattern of suppliers is relatively fragmented compared to patterns of streamers and consumers, which are presented later in this study. The advantages of live streaming sales—taking place anytime and anywhere—were leveraged to mobilize production resources distributed throughout the country, especially in the eastern and central regions. Agglomerations occurred only in cities such as Hangzhou, Shanghai, and Guangzhou, being tied to their vibrant local e-commerce industry base (Figure 3). For example, there are 978 professional markets in Guangzhou, accounting for one-seventh of the total professional market transactions in the country. Textile and garment, Chinese herbal medicine, timber, aquatic product, and other industries formed the “Guangzhou price” (https://tech.sina.cn/csj/2020-06-29/doc-iircuyvk0929107.d.html?wm=3049_0032, accessed on 1 March 2023), which highly benefits the multi-category supply chain and price–cost control required for LSC.
In contrast to the geographic diffusion of suppliers, intermediaries show pronounced spatial agglomeration (Figure 4). There are some “poles” “and “clusters” in the South Coast region. The agglomeration of live streaming talents is mainly due to the unbalanced social and economic regional context. Regarding regional distribution, 999 Taobao streamers are distributed in 77 cities across China, with the clustering dynamics decreasing sharply from the east to the west. Among them, 898 streamers are located in the eastern region, accounting for 93.74% of the national total; 30 are located in the central region, accounting for 3.13% of the national total, and only 26 are located in the western region, accounting for 2.71% of the national total. The agglomeration phenomenon can also be confirmed at the city level, being mostly clustered in cities such as Hangzhou, Guangzhou, Shanghai, and Beijing (Figure 3). Among them, Hangzhou ranks first with 264 streamers, followed by Guangzhou, which ranks second, with only 164 streamers. According to a survey report by China Merchants Securities, 6 of the top 10 MCNs in China are located in Hangzhou, with the others located in Jiaxing, Shanghai, Guangzhou, and Shenzhen. This result is further evidence of Hangzhou’s outstanding urban competitiveness in accumulating talent and establishing businesses for LSC. Despite the possibility of live streaming via mobile devices (cell phones or laptops), many streamers in China are congregated in city regions with higher levels of economic development, showing that the streamer/platform is rooted in a specific urban/regional context [53], while the regional environment and socio-economic development considerably influences the site selection of streamers [16].
In addition to the socioeconomic context, intensive talent policies and an advantageous industrial base promote the rise of China’s “second- or third-tier cities” in LSC. For example, some Chinese “second- or third-tier cities” are emerging as streamer bases, such as Chengdu, Kunming, Xi’an, Zhengzhou, Changsha, and Jinhua (Figure 3). In particular, in Yiwu, Jinhua City, a village attracted more than 7000 streamers and delivered orders averaging around 600,000 pieces per day. This result is highly related to the local industries and talent policies. For example, the Government of Yiwu City introduced a series of live e-commerce talent support policies and financial incentives in 2020. Statistically, in the first quarter of 2022, the LSC turnover in Yiwu exceeded 8.7 billion yuan (Jinhua gov. 2022, http://www.jinhua.gov.cn/art/2022/5/6/art_1229159969_60237635.html, accessed on 28 February 2023). In addition, the Department of Commerce of Zhejiang Province announced “26 provincial LSC bases in 2021”. This new type of industrial park integrates display, brand empowerment, broadcasting training and incubation, and operation guidance, which are becoming new “engines” to drive local industries and revitalize traditional manufacturing. Simultaneously, ever- more streamers are gathering not only in “city centers”, but also in “peripheral regions”, especially in the YRD and PRD. Therefore, streamers and the live streaming industry behind them can bring opportunities to urban fringes and even rural areas.
Moreover, we can divide cities into five tiers based on the amount of LSC sales made by streamers, with apparent differences in performance within or between tiers. Hangzhou is in the first tier, in which sales exceeding 100 billion yuan: Hangzhou’s sales total 489.9 billion yuan, which is highly correlated with Hangzhou’s pioneering advantage in developing LSCs and relevant preferential policies implemented in recent years. Shanghai and Guangzhou are 2 of 18 cities located in the second tier, with sales of more than 1 billion yuan; Wuhu, Wuhan, Jinhua and other 26 cities are in the third tier, with sales of more than 100 million yuan. Jinan, Yangzhou and 25 other cities are located in the fourth tier, while the fifth tier includes cities with less than 10 million yuan in sales, such as Dalian and another 12 cities. The overall distribution of cities in different tiers gradually expands from coastal to inland areas, and cities with higher sales values usually have more dense rail transportation lines, roads, and other transit traffic networks [16].
According to the statistics on the location of LSC’s customers (Figure 5), it is found that the cities with the most customers and the strongest purchasing power are well-developed areas. Regionally, the eastern market is the main force, with 3317 customers, accounting for 76.69% of the total customer base, while the central market accounts for 271 customers (6.27%), and the western market has 737 customers (17.04%). First-tier cities in metropolitan areas, such as Shanghai, Guangzhou, Beijing, Hangzhou, and Chengdu, are the main marketplaces due to their strong purchasing power and excellent urban logistics infrastructure; the second-tier cities of consumption are mostly provincial capitals, such as Wuhan and Nanjing, showing a “diamond structure” similar to the macroeconomic development level of Chinese cities (Figure 3). On one hand, due to the higher income and education levels in these areas, the information accessibility and acceptance of new commercial models, such as Taobao Live, are correspondingly higher. On the other hand, streaming market growth is also related to the local consumption mindset and living atmosphere; for example, residents in Chengdu prefer slower lifestyles and are more interested in consumption than savings. Therefore, Chengdu has a larger consumer group in LSC despite its lower level of economic development than other cities in the same tier.
To sum up, streamers can bridge the accessibility between suppliers and customers across regions. For suppliers in remote areas whose products have lower bargaining power, the business model of LSC brings more choice in terms of product agents, resellers, and distributors. More importantly, many long-distance supply and sales relationships are created, thus allowing supplier distribution to expand beyond the locality. In addition, many individuals (e.g., farmers) can become streamers themselves, which not only greatly reduces the intermediate steps and costs between production and sales, but also increases the circulation and accessibility of products.

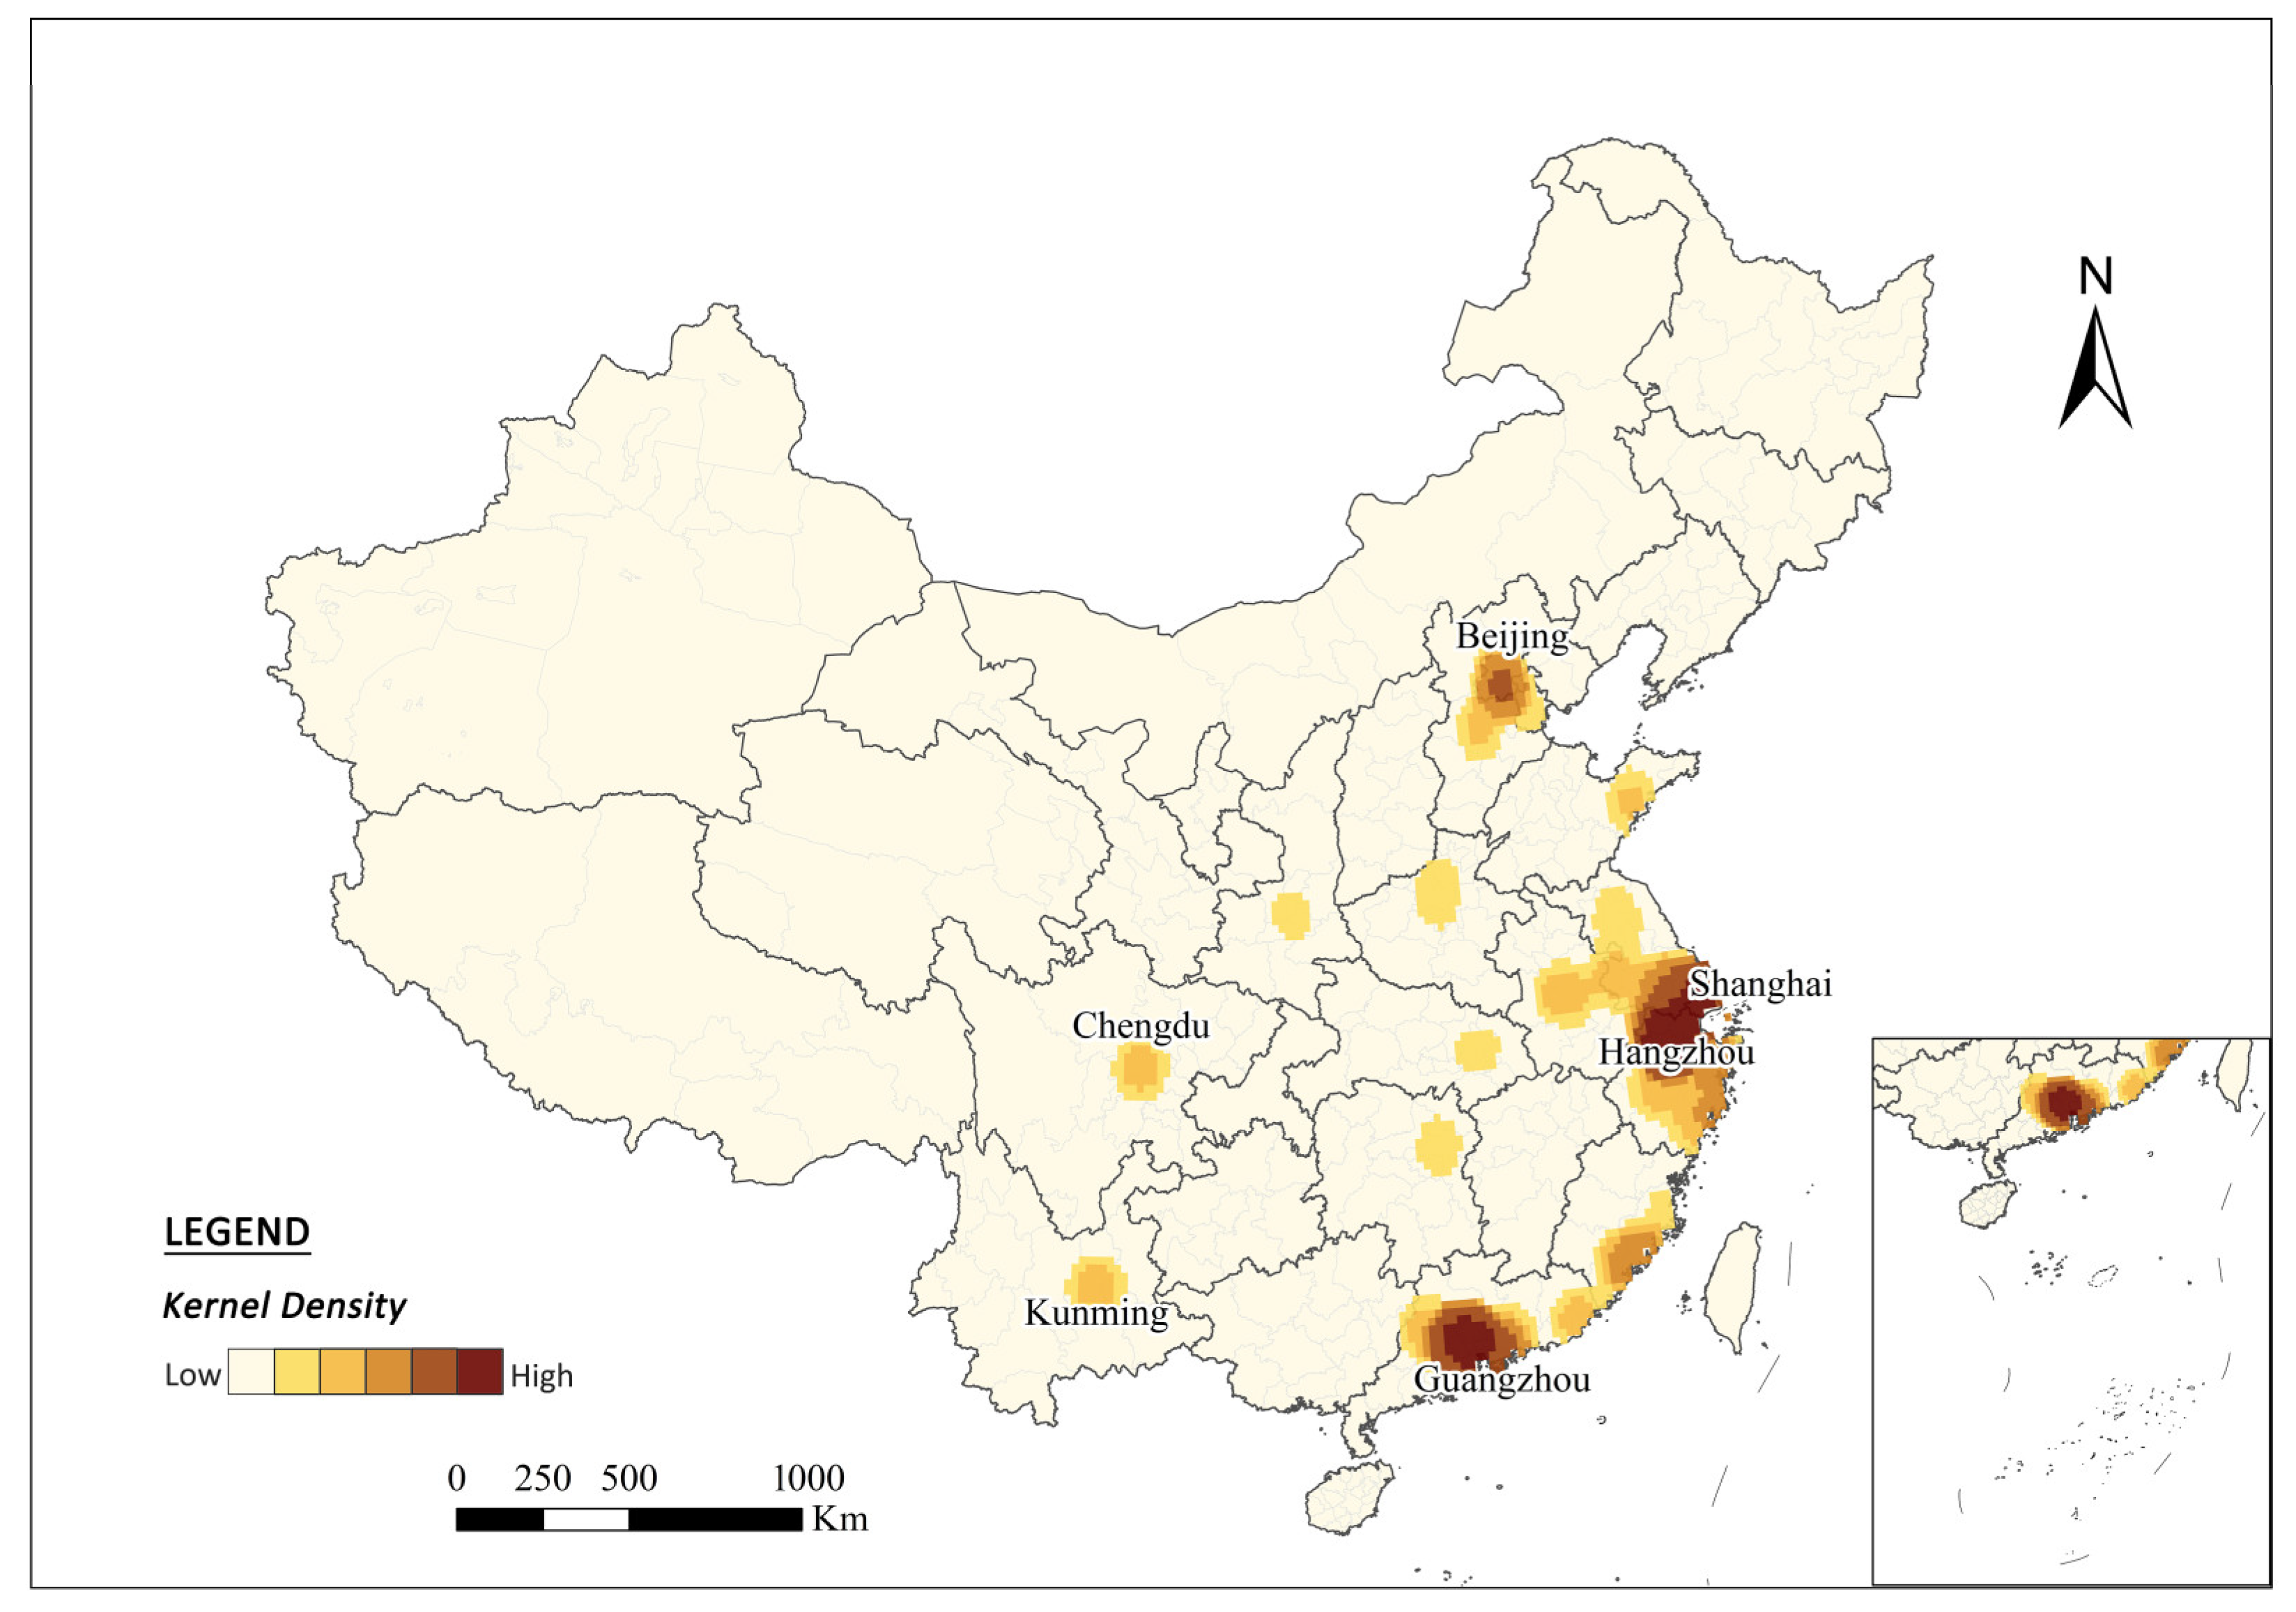
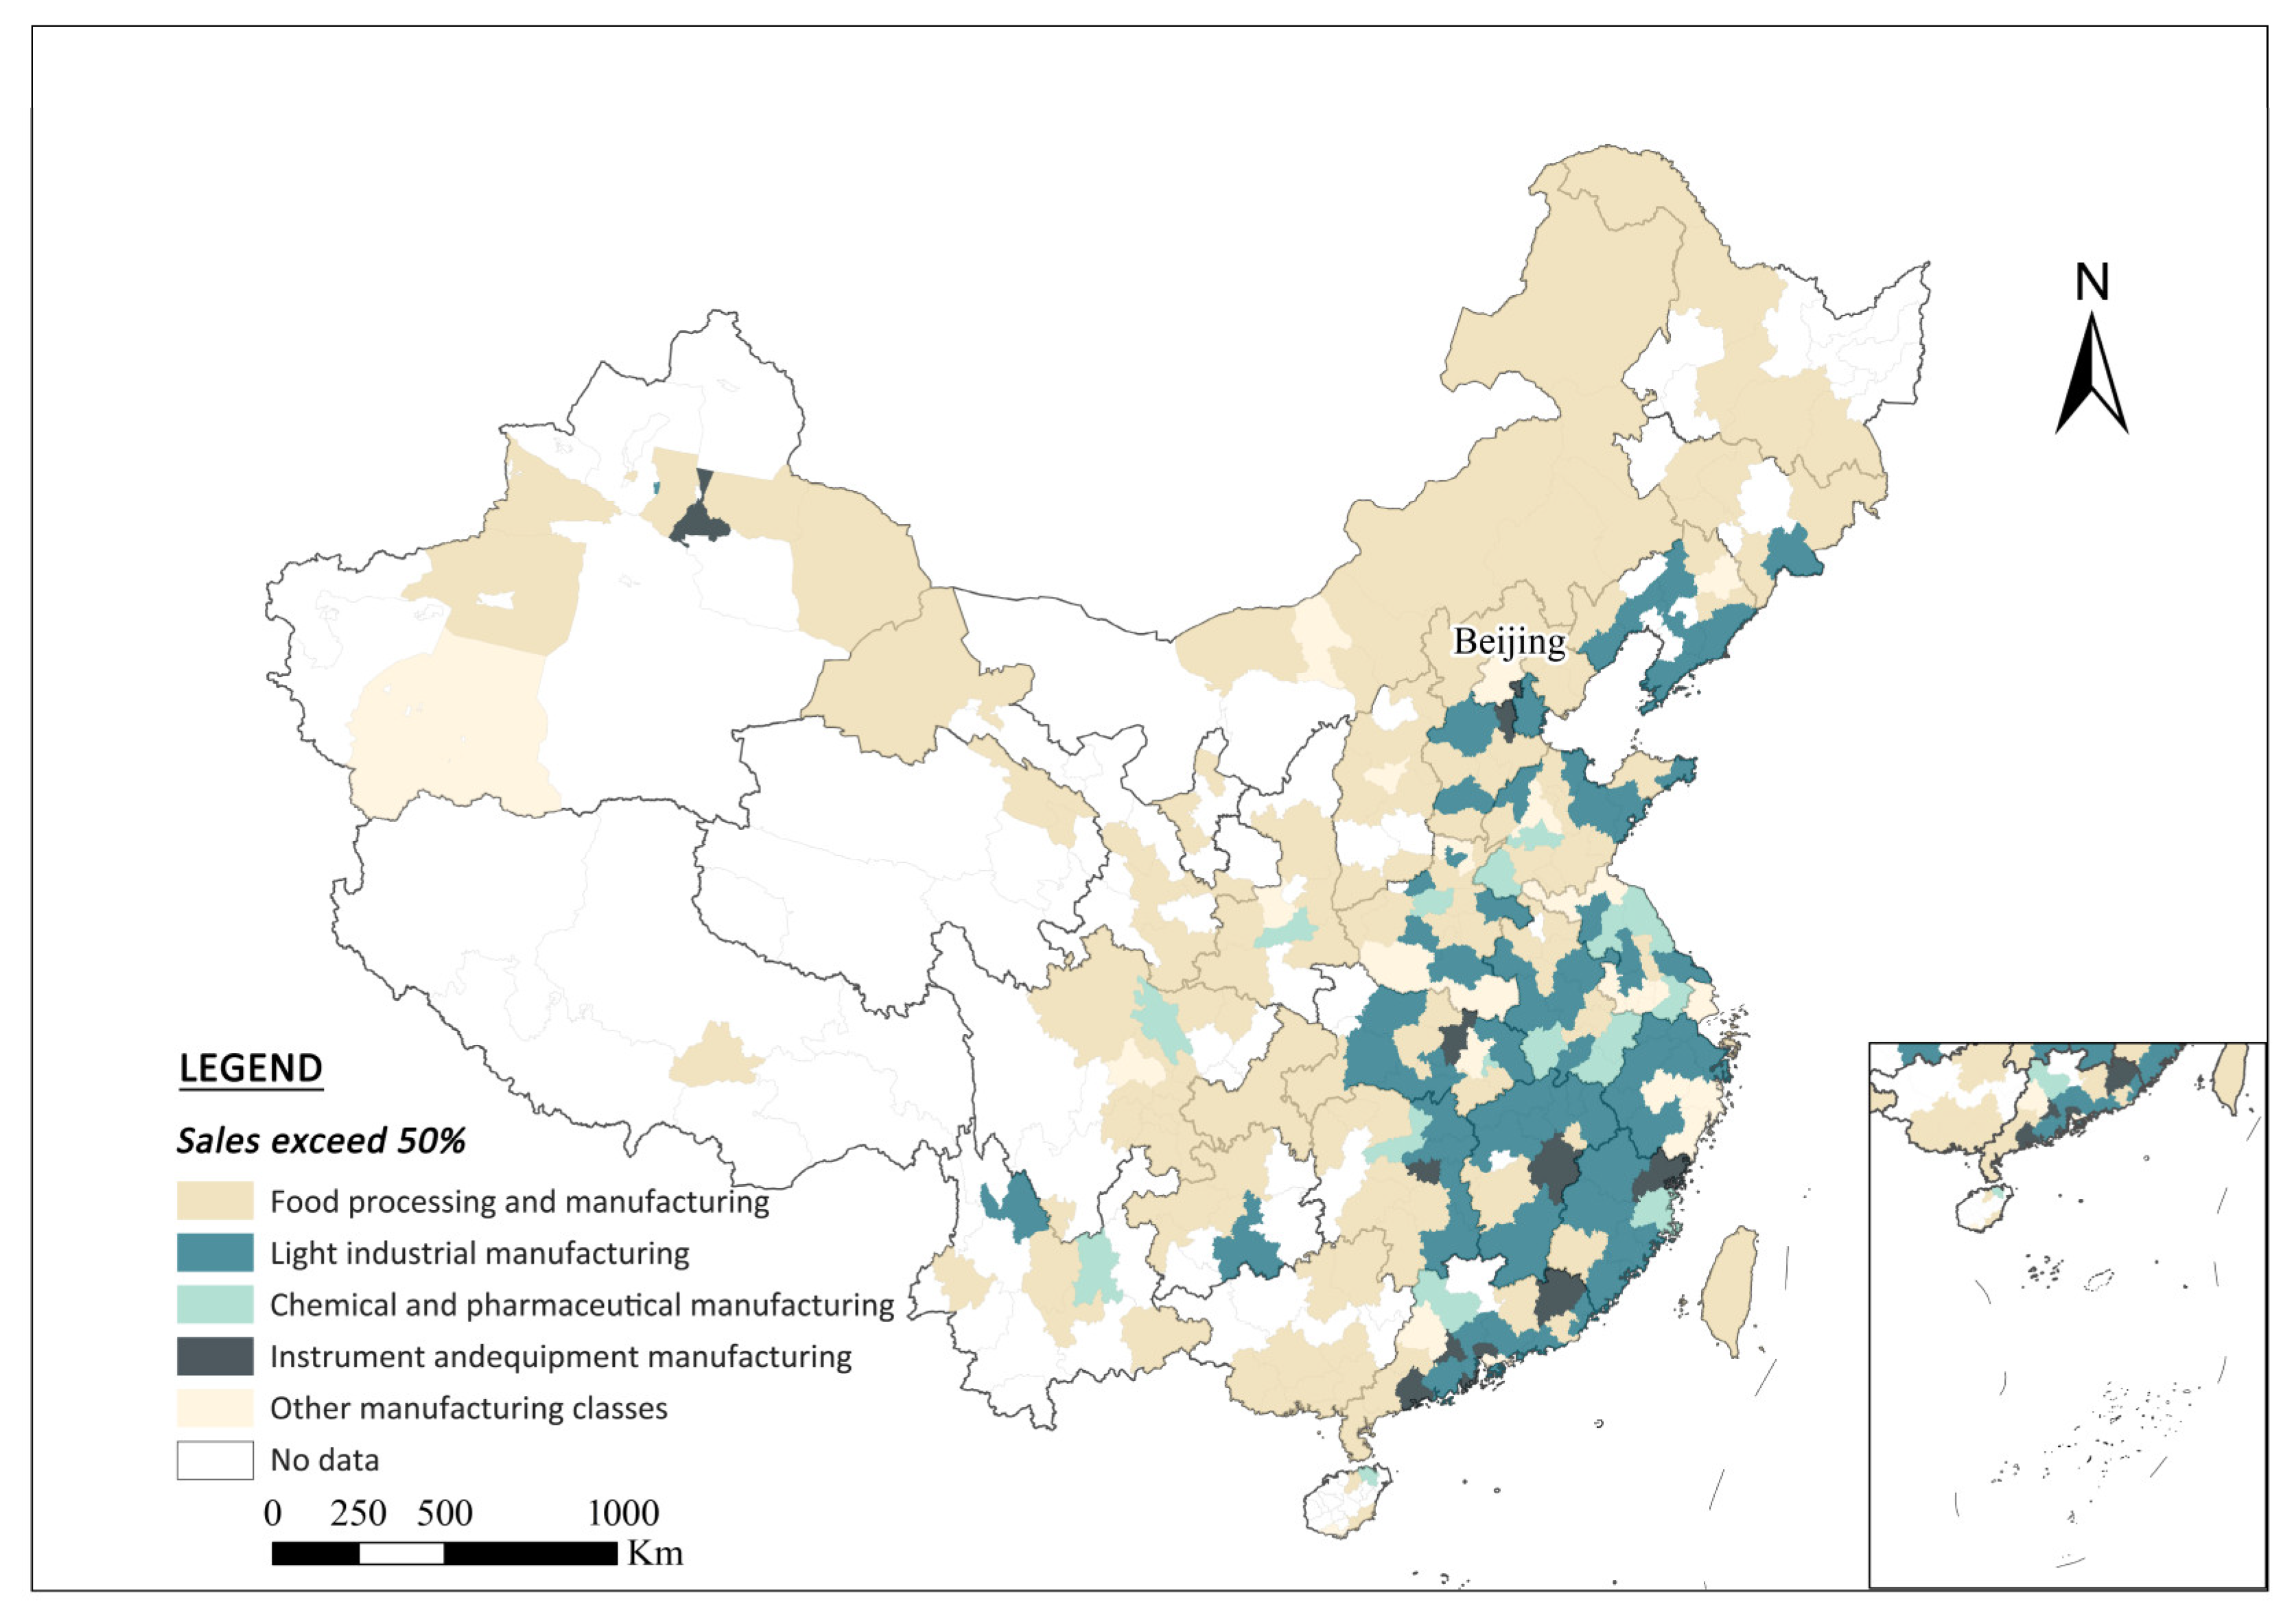
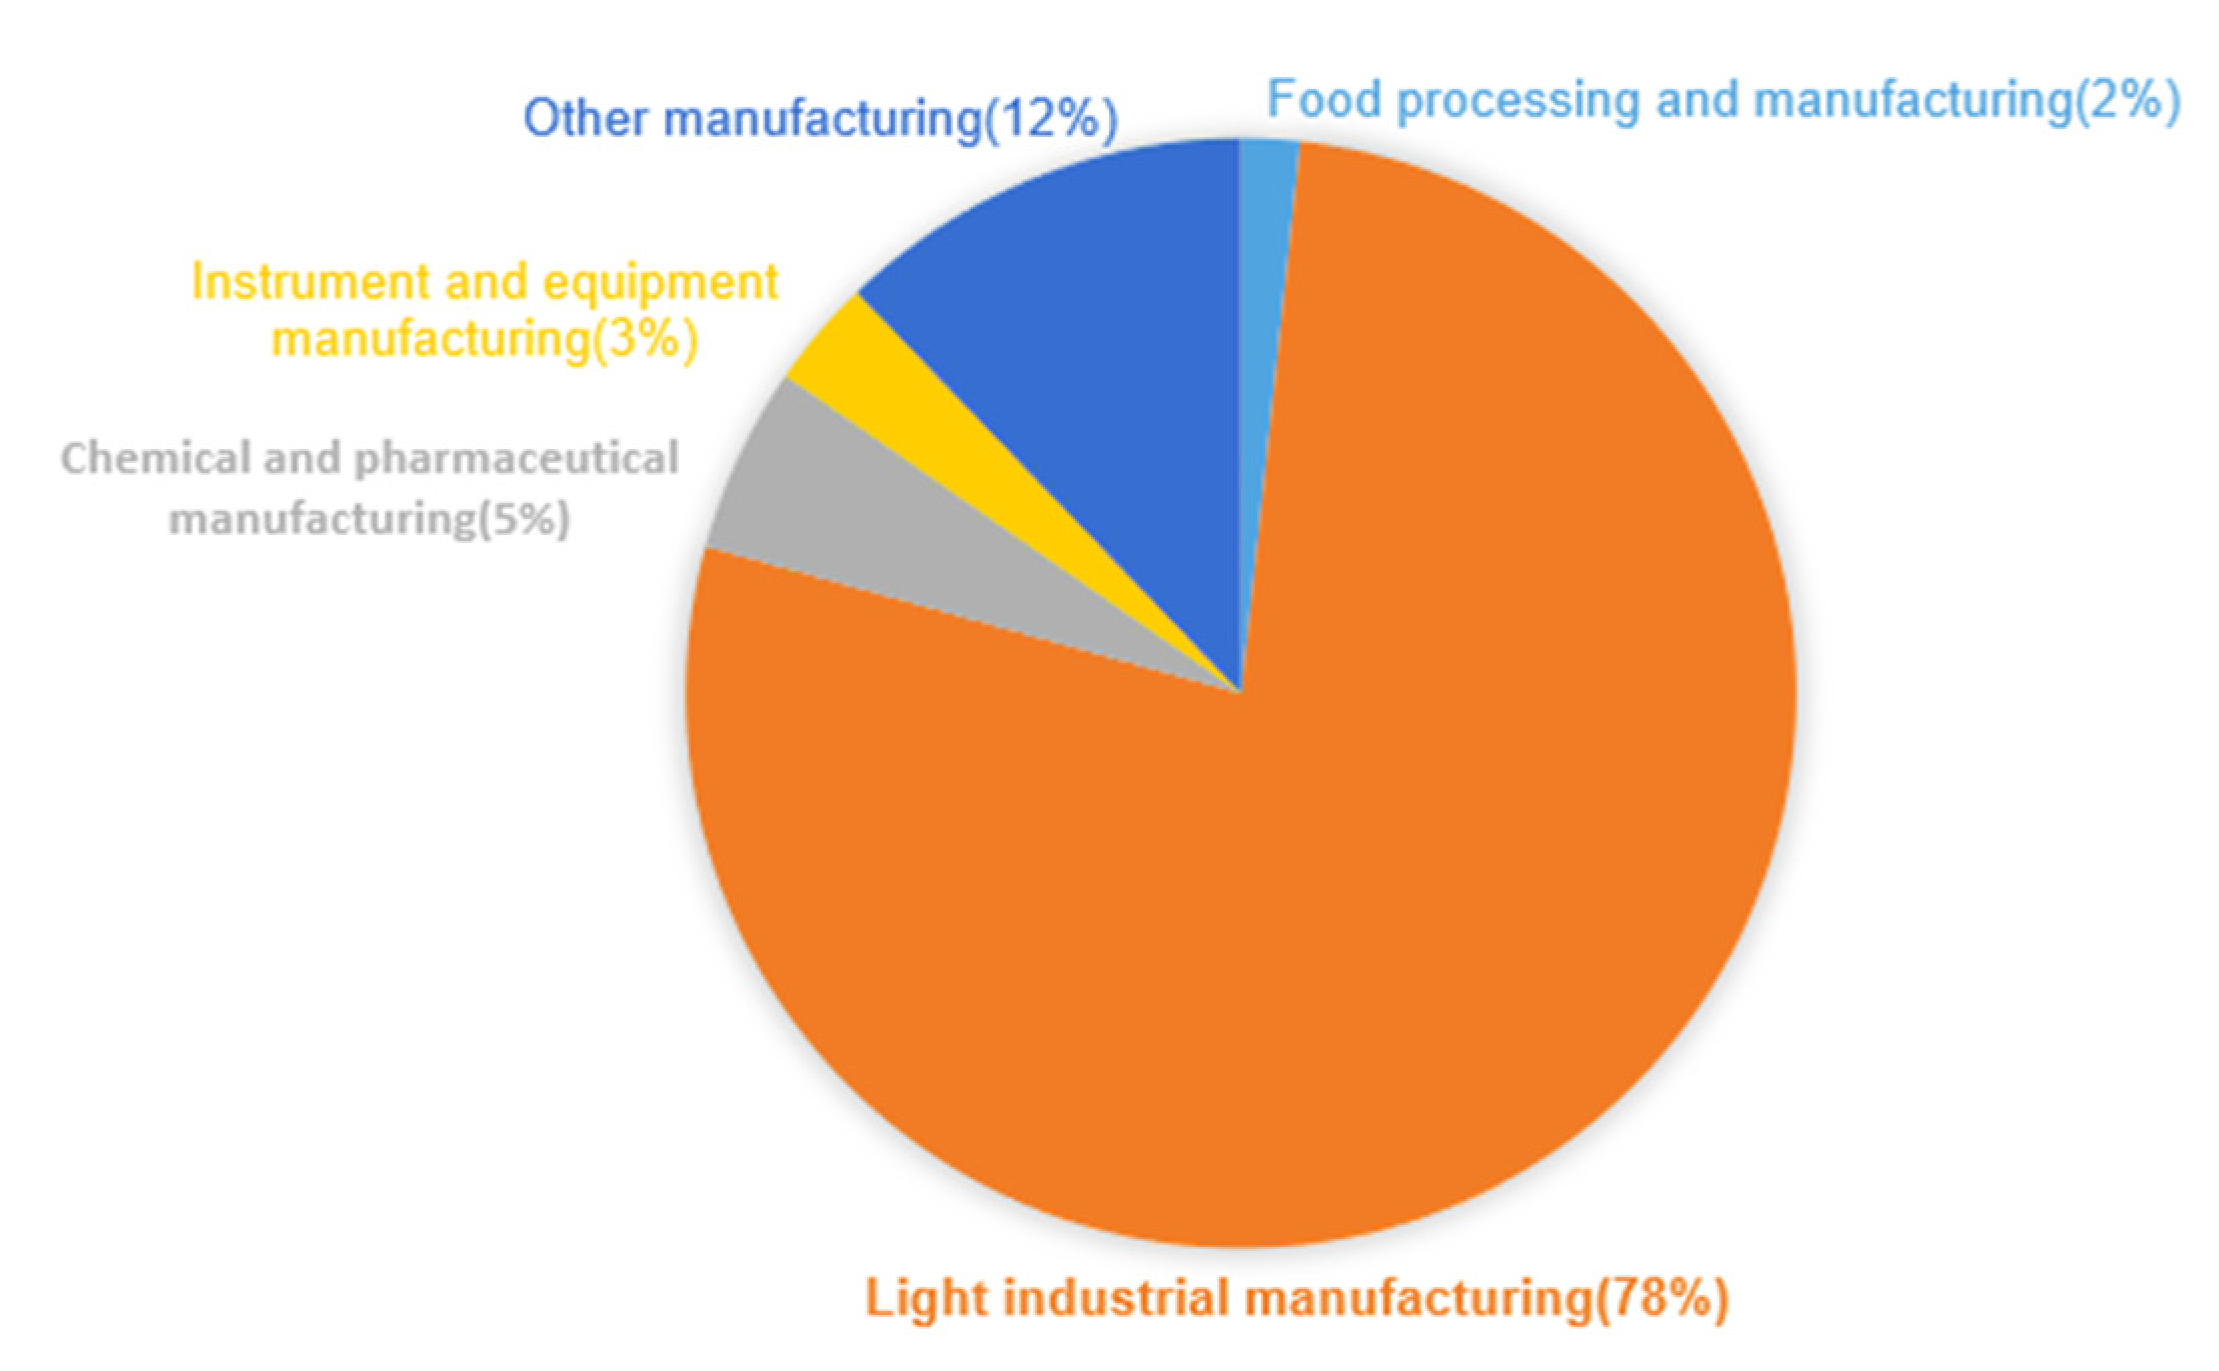
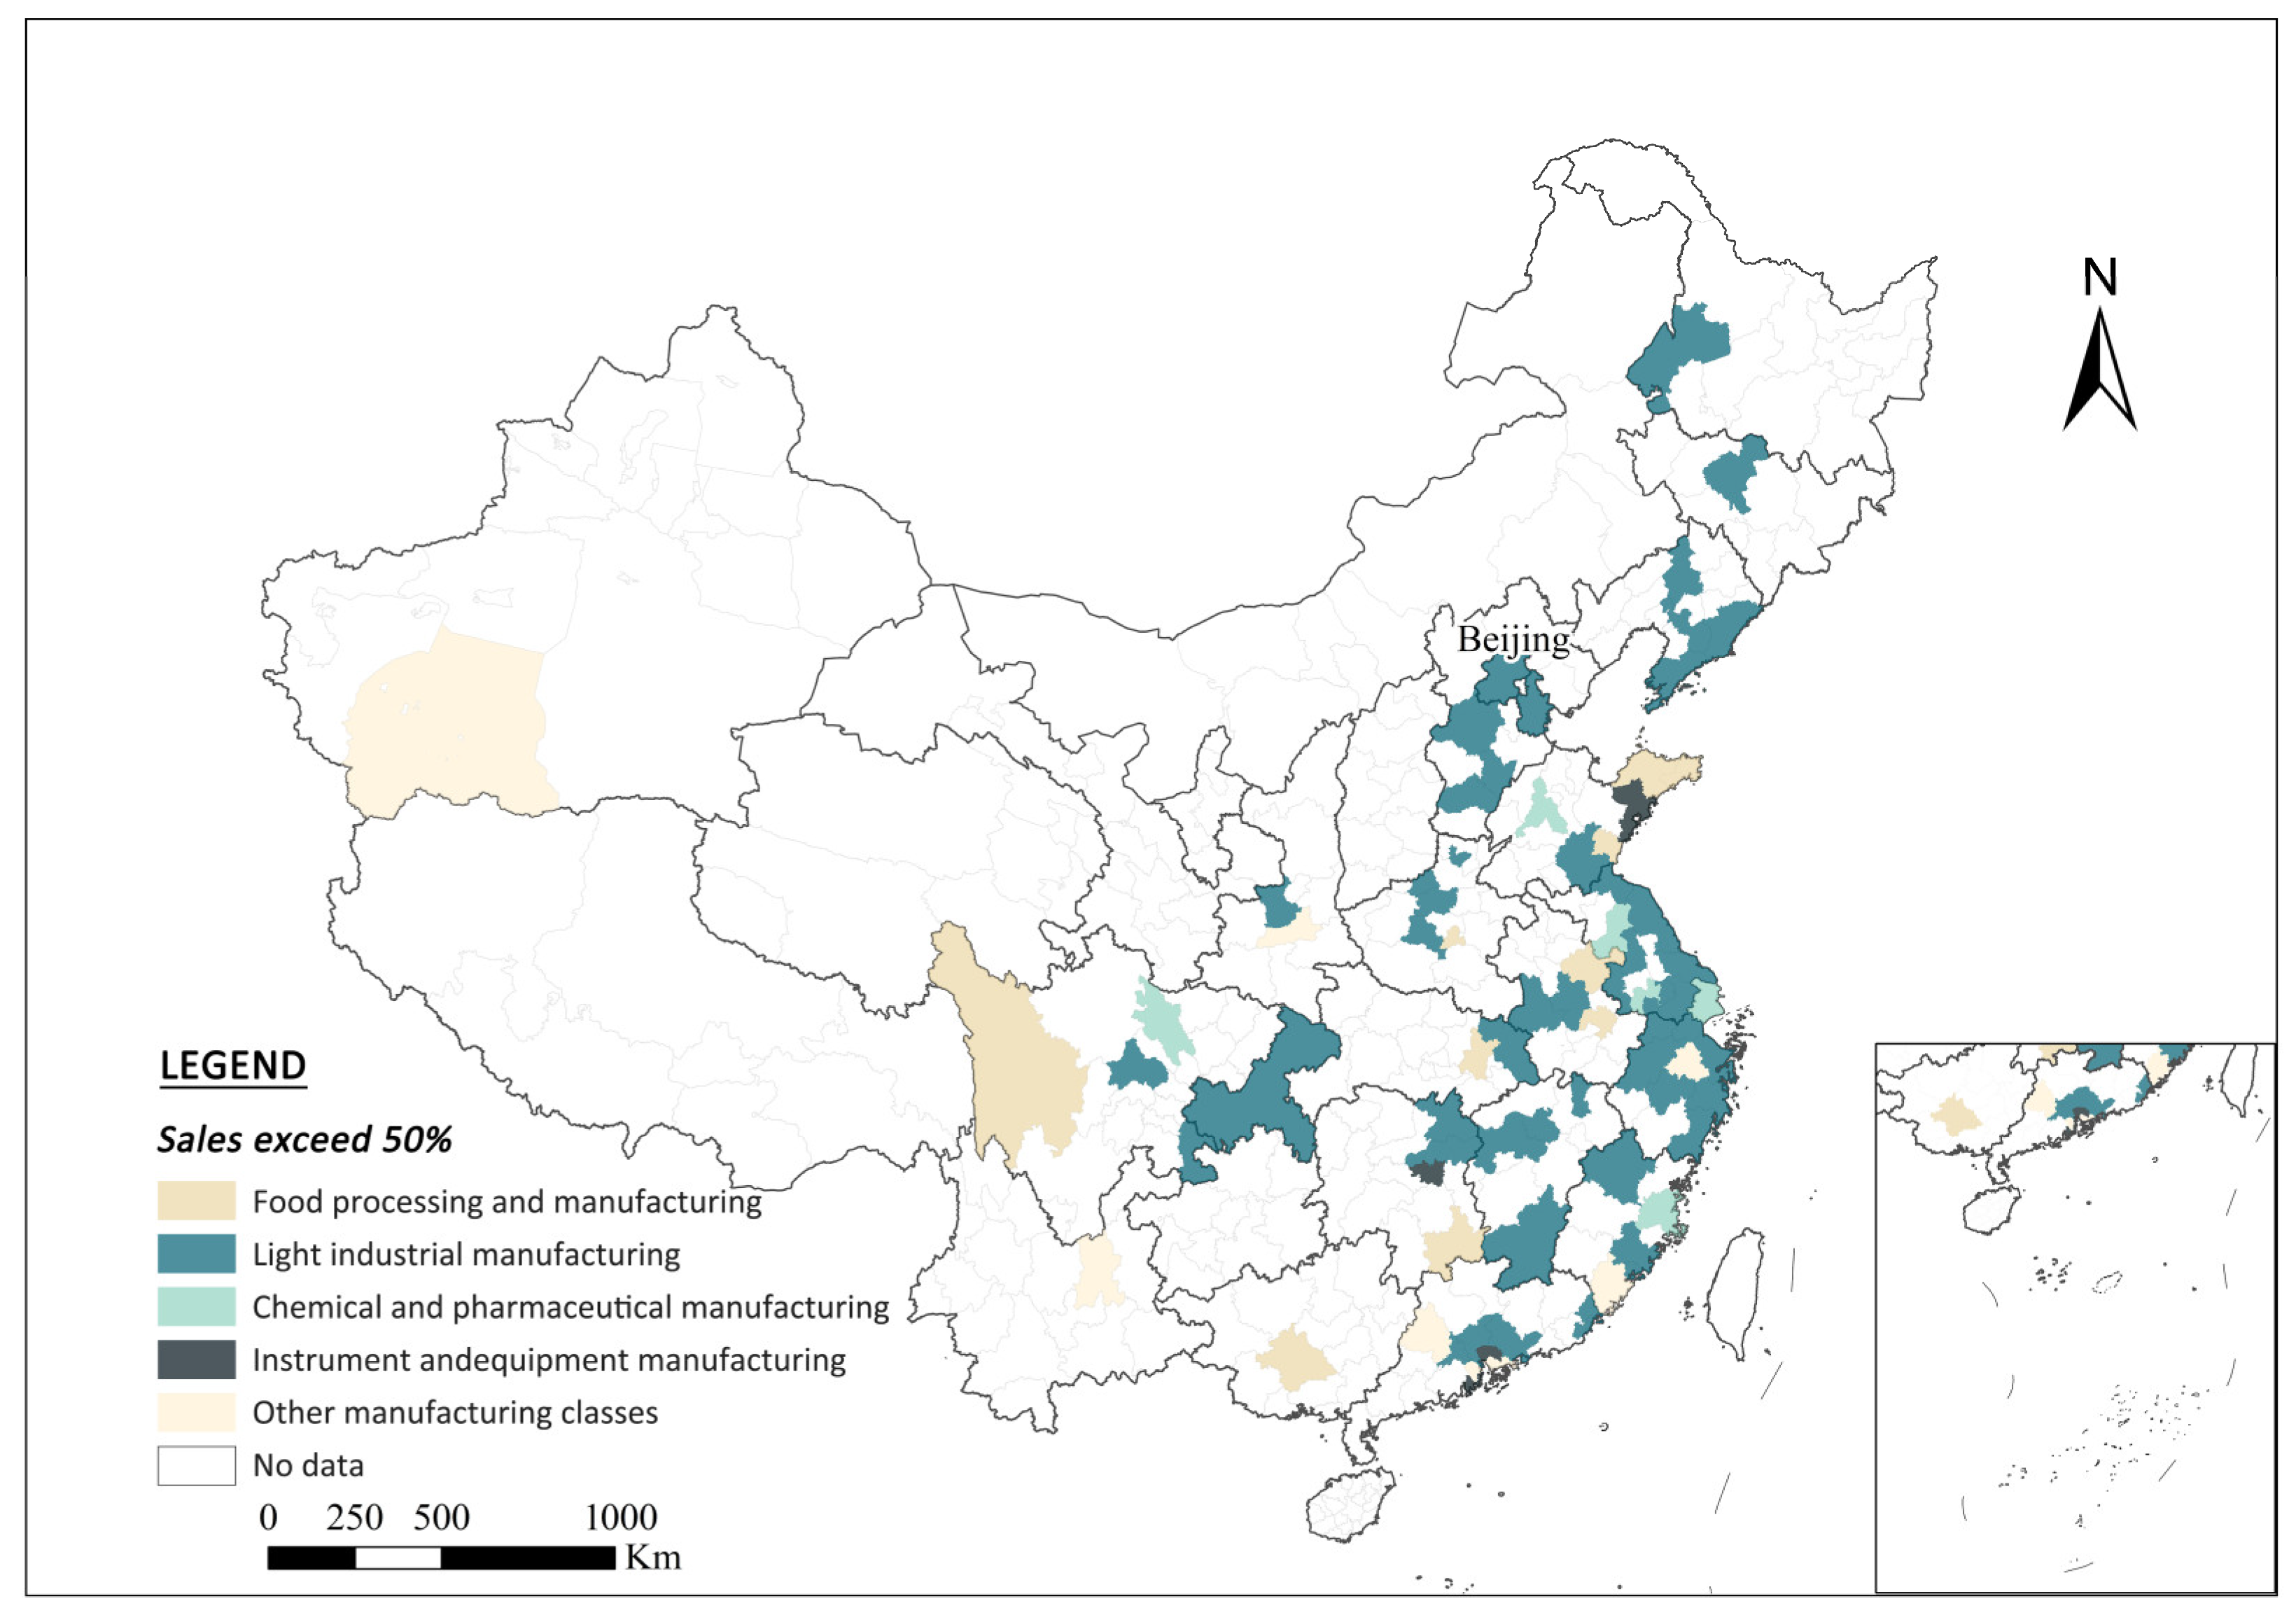
4.2. The Role of LSC in Different Types of Industries

To further distinguish the role of LSC in different types of industries, we screened and analyzed 600,000 Taobao streamers’ sales data. After combining the explanatory notes for each type of industry listed in the National Economic Classification GB/T 4754-2017, we classified 113 products in the database into 5 manufacturing categories, namely food processing and manufacturing, light industrial manufacturing, chemical and pharmaceutical manufacturing, instrument and equipment manufacturing, and other manufacturing classes (see Appendix A, Table A1).
In terms of the regional distribution of suppliers of LSC, distinct product variation can be found in east–west China (Figure 6). The eastern region is mainly characterized by light industrial manufacturing and chemical and pharmaceutical manufacturing industries, especially in the southeastern coastal areas. The central region has a higher mix of product categories, while the western and northeastern regions are focused on food processing and manufacturing products, and there are few suppliers with light industrial and chemical products as their main products. It is evident that the current geographical characteristics of supplier categories in China’s LSC are very distinctive, with the upstream section of the value chain and value-added products being kept in the eastern and central regions, especially in leading agglomerations (e.g., YRD and PRD, see Appendix B, Table A2), which is relevant to their local industrial infrastructure, technical personnel, and logistics conditions. In contrast, products based on raw materials and with lower technical difficulties can be produced and supplied across a broader territory, providing development opportunities for remote and underdeveloped regions.
Furthermore, we focused on industry disparities in the leading role of streamers as online and offline intermediaries in the LSC supply chain. Firstly, in terms of the proportion of the number of streamers in different industries, streamers in light industrial manufacturing, including the textile industry, clothing, apparel industry, leather, fur, feathers, and footwear, account for the highest share (78%). This class is followed by other manufacturing products, such as raw material or metal processing-related industries (12%). The live streaming of food processing (2%), chemical and pharmaceutical (5%) and equipment manufacturing (3%) industries have low market share. The proportion of those streamers engaged in chemical and pharmaceutical (5%), equipment manufacturing (3%), and food processing industries (2%) is also relatively small (Figure 7).
Secondly, in terms of the spatial distribution of streamers by industry (Figure 8), the spatial distribution of streamers by industry is shrinking compared to suppliers. The driving forces behind streamers in working different industries are related to the local industrial base and market demand in nearby regions. Streamers’ wide-ranging intermediary roles can effectively promote the economic upgrading of both firms and the region [17]. Streamers selling mainly light industrial products have the largest distribution, especially in the eastern coastal regions. For example, cities where streamers are concentrated in electronic equipment and furniture industries include Dongguan, Qingdao, Zhuhai, Xiangtan, and Nanjing. These places are the manufacturing bases of electronic and electrical equipment in China, being home to many famous Chinese brands, such as Haier and Hisense in Qingdao, as well as OPPO and VIVO in Dongguan. This is a process that benefits all sides. Streamers close to the industrial base may have some preferences in terms of product selection. The prestige of local companies not only increased customer acceptance of the streamer, but also achieved a breakthrough in sales, with consumers using the streamer as an intermediary. It trend is not an exception: Jinan and Mianyang, where streamers mainly sell beauty products, benefited from the flower industry foundation and market demand in underdeveloped regions. Supported by the supply of roses from the neighboring city of Pingyin (the hometown of roses in Shandong), Jinan continues to expand its diversified beauty products, while Mianyang mainly serves strong market demand in central and western China. Similar cases are the luggage and accessories industry in Dalian, Lianyungang, Shiyan, Shaoxing, and Baoding, and the adult garment industry in Hangzhou, Dandong, Chongqing, and Shenyang.
It should be emphasized that most of the manufacturing companies in the light industries, such as garment, bag, shoes, and household good manufacturing, are small- and medium-sized enterprises or family businesses. The live broadcasting of streamers with an industrial focus provides opportunities for craftsmen and cities with better craft skills to develop rapidly. For example, streamers mainly selling shoes are highly concentrated in the southeastern coastal region (90%) and have even more detailed differences based on their region’s industrial base. Streamers in coastal metropolises, such as Shanghai and Guangzhou, mainly sell various international and domestic footwear brands, whereas streamers in Wenzhou (China’s footwear city) rely on the network relationships with local leather product SMEs to gain cost advantages. Guangdong, on the other hand, relies on the international spillover effect of industrial OEM and ODM production and enjoys a high reputation in the industry.
Some industry-specific streamers completed the effective expansion of local supply chains through LSC, which is particularly evident in agriculture. This trend occurs because most suppliers of fresh produce are located in central or western China, and the product is highly dependent on the cold chain due to the long distance between the supplier and the market. This type of product has a high demand for timeliness and is constrained by high transportation costs. It is difficult for most traders, especially farmers, to break their business radius under the traditional marketing model. This issue is also why many agricultural products are unsellable in the central and western regions. Live streamers, especially the original traders, became part-time grassroots streamers, mobilizing network traffic data from various provinces and cities across the country, especially facilitating the accessibility of the remote market. Therefore, the trade barriers hindering certain industries in underdeveloped areas were broken, and their commercial service radius effectively expanded, spurring economic growth in underdeveloped areas. Through the LSP, streamers introduced the growing environment of crops or economic plants (e.g., flowers), publicized the production and processing process of agricultural and sideline products (e.g., white tea), and showed the creation process for some artistic products processed using raw materials (e.g., wood carving) for potential customers watching the webcast. Live streaming not only raises awareness of local specialities, but also forms local industries marked by their sources of origin, such as fresh-cut flowers from Dounan town, which is located in Yunan Province; jade from Hetian city in Xinjiang Province; and stinky rice noodles from Liuzhou city in Guangxi Province. Live streaming even drives the development of local agricultural tourism and related service industries. In co-operation with TikTok (China), the first national flower industry LSC demonstration town—Dou in Flower Town (Jinhua gov. 2022, http://www.jinhua.gov.cn/art/2022/5/6/art_1229159969_60237635.html, accessed on 28 February 2023)—was set up in Yunan Province in 2020. Through Taobao Live, the noodle products from Liuzhou city achieved a turnover equivalent to three-to-five times the usual amount during a Chinese e-commerce festival in 2022. Simultaneously, the local government issued the “Liuzhou Stinky Rice Noodles E-commerce Industrial Park Support Policy Provisions (2022–2024)”, which implemented rent subsidies for enterprises that settled in the park.
Gaps in LSC sales across cities were also related to their industry types, since some industries are suitable for live broadcast sales, while others are not. For example, cities such as Dalian and Jiaozuo developed longstanding large-scale heavy industries, such as ship manufacturing and coal, which are difficult to sell online. In contrast, for cities that focus on light industries, such as textile industry and food processing industries, the co-operation with live streamers can expand the scale of production and sales considerably. In general, the convenience of transportation, the difficulty of combining the original industrial base and live streaming mode, and supportive policies are all important factors affecting the development of the live streaming economy in cities.

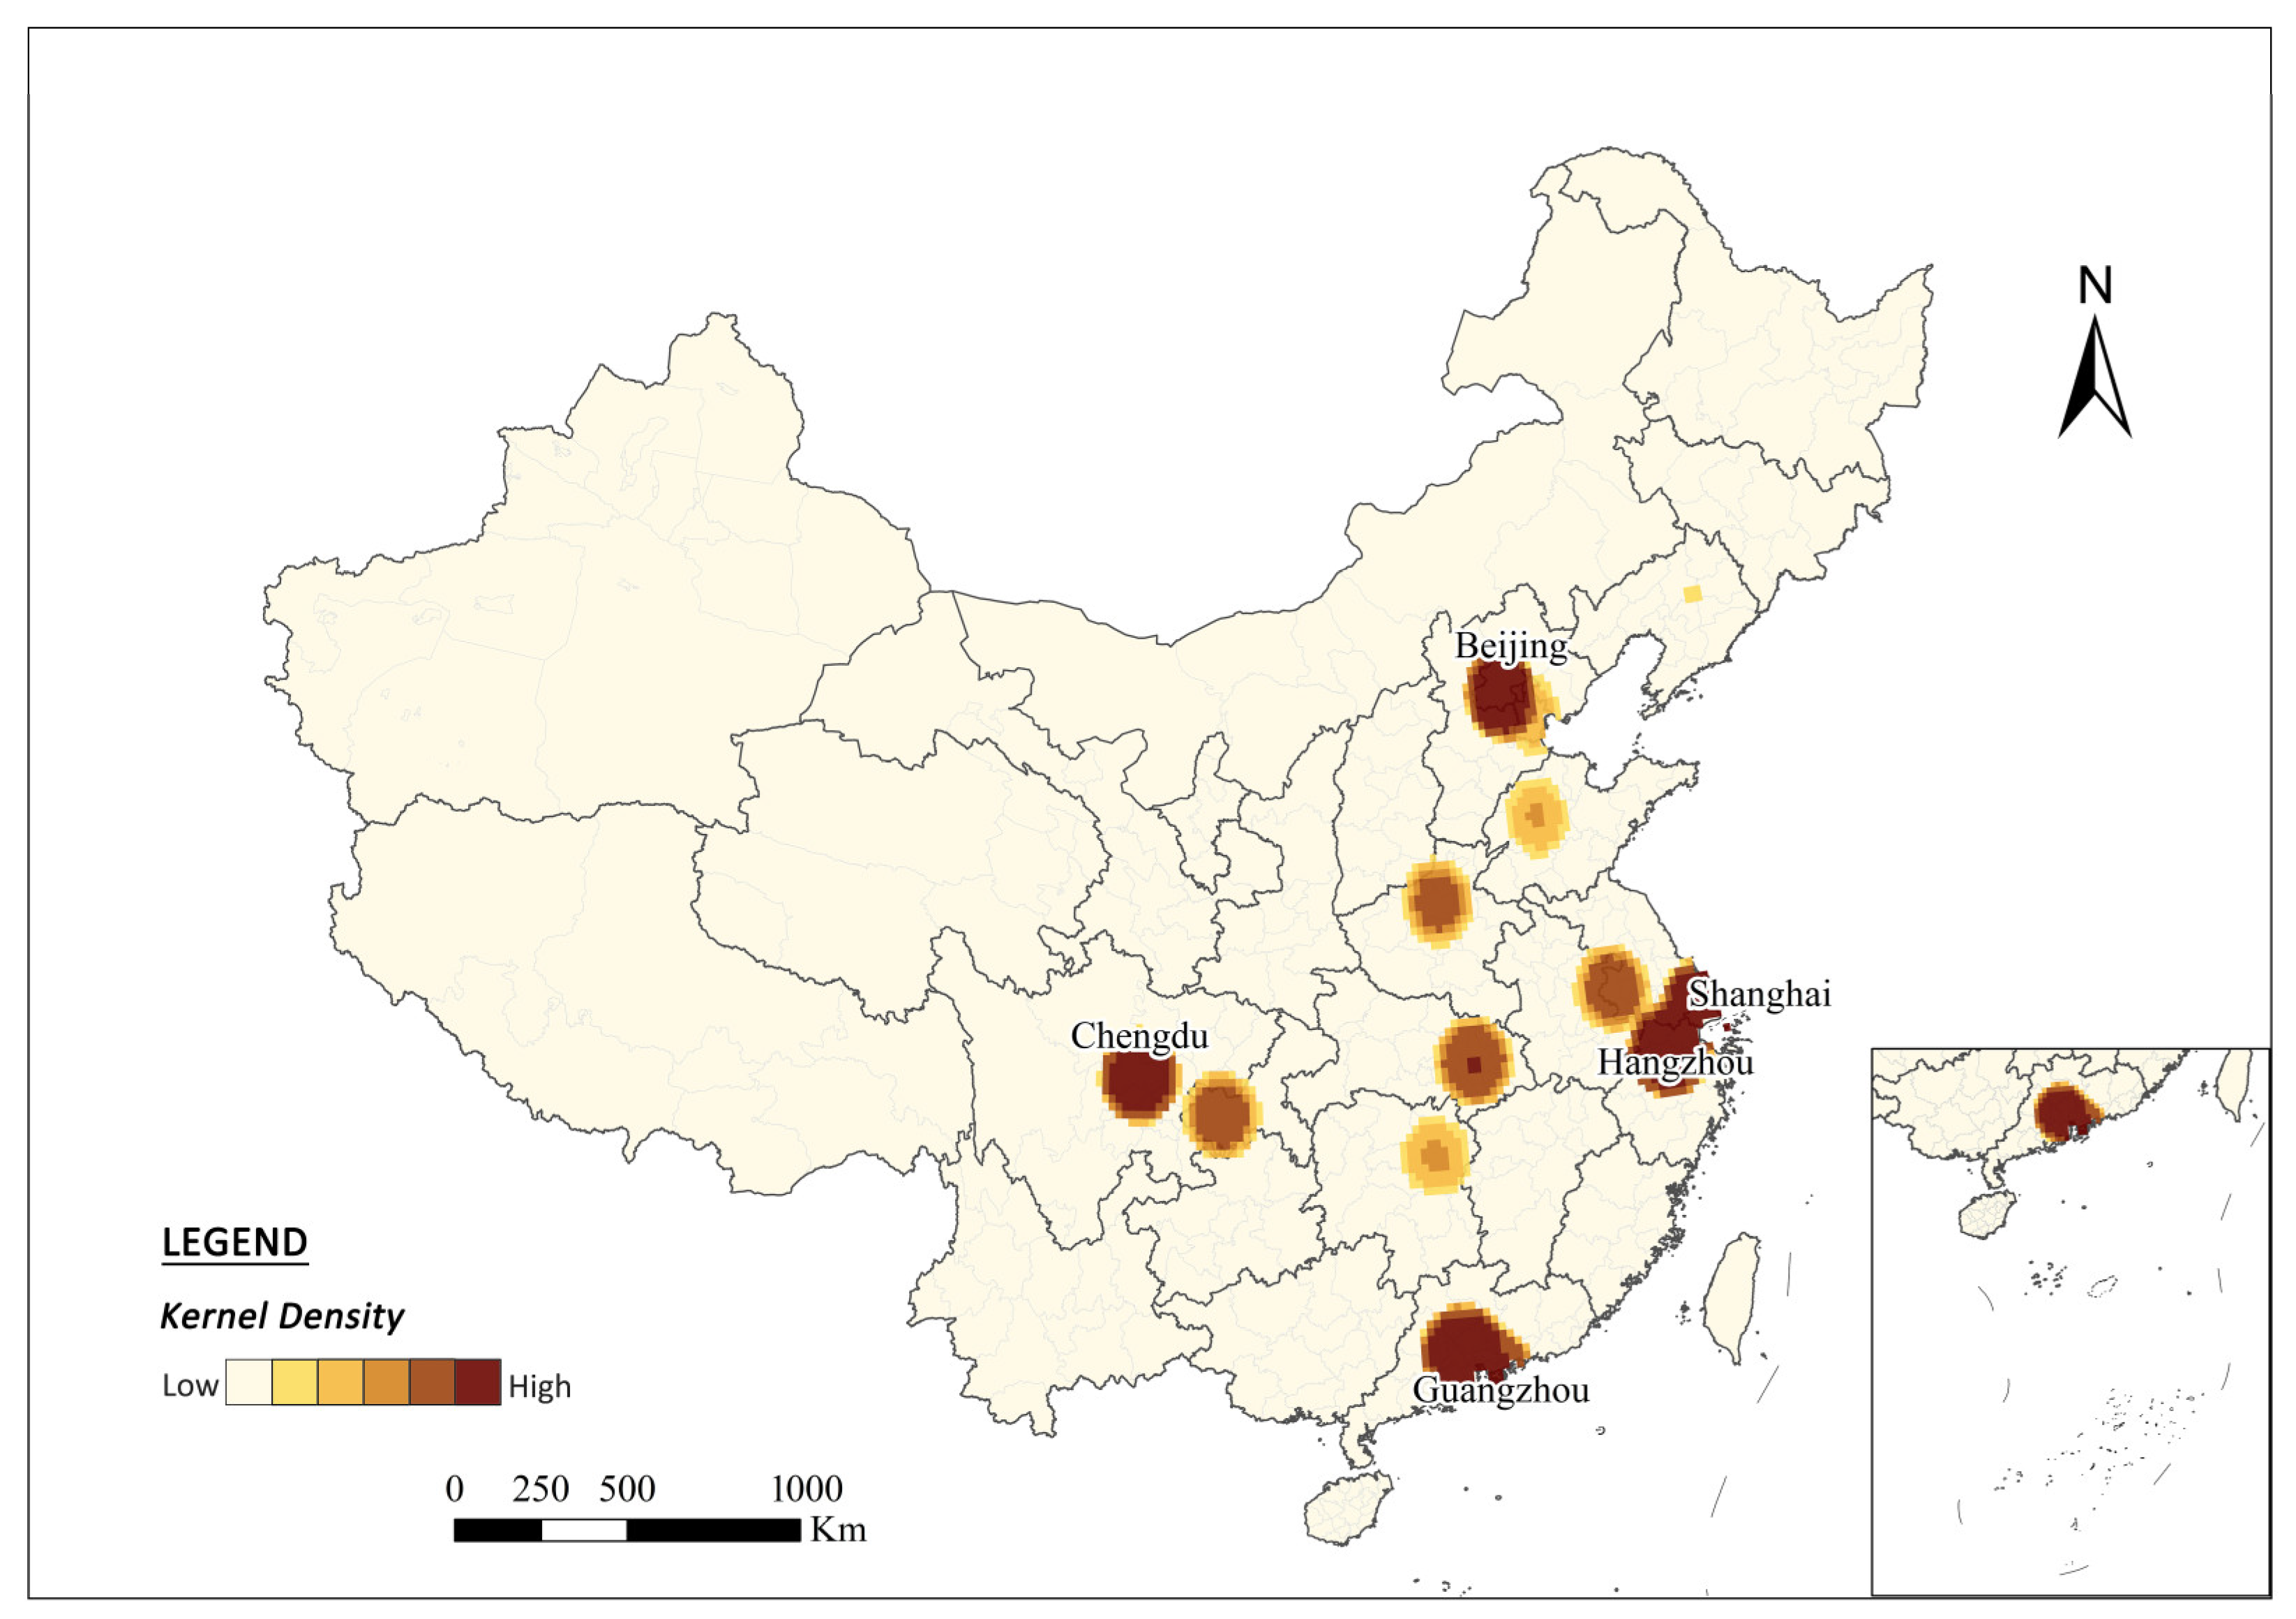
4.3. The Role of Different Types of Live Streamers on the Regional-Local Supply Chain

The urban hierarchy created by the LSC does not match our traditional understanding of China’s urban system [17]. Cities with specific conditions, especially those geographical areas that can attract live streaming talents, are proliferating in this emerging urban competition. Although live streamers achieved impressive sales records in recent years in China, we found a noticeable Matthew effect in the live streaming industry. This effect means that a minority of top streamers use a large share of industry resources, while grass-roots streamers often lack competitiveness and need further attention.
To further explore the differences in how various types of live streamers perform in the supply chain, as well as the distributions of their suppliers and customers, we divided Taobao live streamers into three groups—top streamers, middle streamers, and bottom streamers. The entire streamer industry in China constitutes a pyramid structure. According to the existing classification of streamers on Taobao, the top streamers are mainly star streamers (1.67%) who already have an influential social reputation in China; the middle group are influencers (9.92%), who usually attract specific customers and have a large transaction volume. The bottom group is usually represented by store-based streamers, who make up more than 50% of the products sold by the same store and whose product category is not diversified (88.41%).
Top streamers are characterized by high popularity and many followers. They need to maintain their exposure and brand influence by attending many online and offline events (e.g., product launches, e-commerce galas, and fashion ceremonies). The analysis found that top streamers (large-sized pink dots, Figure 9) only clustered in gateway cities, such as Beijing, Shanghai, and Hangzhou, which have international airports and regional hubs that can serve convenient and frequent business travel. More importantly, these cities are China’s political and economic centers, providing advanced production services (APS) for national and even global markets [70,71]. With a huge number of headquarters, brands, and advertisers clustered in such cities, top streamers choose to relocate there even if incurring high operating costs (e.g., rent).
Moreover, the top streamers mainly undertake cross-regional connections. Statistically, the top streamers have 3017 cross-regional suppliers, accounting for 90.7% of all suppliers, and 311 intra-regional suppliers, accounting for 9.3% of all suppliers, demonstrating the strong ability of the top group to leverage supply and demand resources across the country, thus creating real hubs in the LSC supply chain. Overall, the small top group (large-sized pink dots, 16 streamers) is connected to a large range of suppliers (small-sized blue dots) and consumers (medium-sized orange dots), albeit with a clear geographical orientation: blue lines (the connection of suppliers to streamers) and orange lines (the connection of streamers to consumers) are concentrated among major urban agglomerations in China, especially the YRD, the PRD, and the Beijing–Tianjin–Hebei region. The suppliers in these three regions (for top streamers) make up to a share of 73.08%, and consumers comprise over 90% share (Figure 10). Changsha, which is a city located in interior China, is an exception: it is recognized worldwide as the Creative City of Media Arts (in 2017, Changsha became the first Chinese city to be recognized as a UNESCO Creative City in Media Arts, https://en.unesco.org/creative-cities/changsha, accessed on 7 March 2023). With its rich cultural industry base (e.g., film, TV, publishing, performing arts, and animation), Changsha has attracted many celebrities, influencers, and KOLs to work and settle there, thus accumulating talents for developing its LSC.
Middle streamers are those individuals who have stable followers and certain influence. They mainly interact with fans through virtual, rather than physical, platforms. Compared to the distribution of top streamers and their connection strength with suppliers and consumers, the middle group presents a similar spatial structure; however, they have a more decentralized and sparser network (Figure 11). The main supply and sales connections via middle streamers also concentrate among major urban agglomerations; however, the links between the PRD and Beijing–Tianjin–Hebei are weaker. For the middle group, its share of cross-regional suppliers is reduced to almost 10% compared to this share for the top group, which is 82.60%; correspondingly, there are more intra-regional suppliers, with a combined share of 17.40%. This result indicates that the middle streamers are not as capable of mobilizing resources across regions (especially over long distances) as the top streamers. In addition, the YRD is still the hub for live streaming transactions via middle streamers: the share of suppliers here is close to 50%, and the share of customers is close to 40% (Figure 10). In particular, Hangzhou, where Alibaba is headquartered, hosts more than half of the middle group (50 streamers). Currently, Hangzhou and its base province—Zhejiang—has formed a favorable co-operative relationship between merchants and streamers, and the training of streamers has become more mature, gradually constituting a benign live streaming ecosystem. Interestingly, the second largest share of consumers for the middle group is gathered in the Chengdu–Chongqing urban agglomeration, which accounts for 21% of consumers. Meanwhile, this share for the top group is only half, reflecting the fact that middle streamers have formed a consumer group and marketplace distinct from top streamers.
In recent years, ever-more cities joined the “war for talent”, with preferential policies devised to attract top and middle streamers to relocate. We also observed middle streamers located in peripheral (but within the metropolitan regions) cities, such as Jinhua, Taizhou, Hefei, and Quanzhou, where clusters formed. The main reasons that middle streamers choose to move out of the core cities are cheaper rents, better services, being closer to suppliers, and being not too far from their market.
Unlike in Figure 9 and Figure 11, the distribution of anchors at the bottom is highly scattered, and the long-distance, cross-region supply connections are markedly reduced (Figure 12). The cross-regional suppliers of the bottom group accounted for only 33.70% (1313), while the share of intra-regional suppliers reached 66.30% (2584); these two ratios are about one-third and seven times the corresponding figures for the top group, respectively. Other than in the YRD and PRD regions, bottom streamers and their suppliers are almost evenly distributed throughout the central and eastern regions. Compared with top and middle streamers, bottom streamers are limited in influence and followers and, therefore, restricted in their ability to integrate resources across regions. Most of the bottom streamers sell only one or a related class of products and are mostly physical/virtual store owners or even product producers; hence, their distribution is closely related to the location of their stores or product origins. This trend explains why Figure 12 shows a lot of overlapping supply places and streaming locations (orange and blue double-layered dots). Self-production and self-marketing through LSPs require local resource endowment and personal live streaming talents; thus, being close to production sites and saving operational costs are preferable for such streamers.
In addition, we observe a greater increase in the share of consumers for bottom streamers in other regions than other groups: this group has a total share of 3%, and as much as 17% share for the Chengdu–Chongqing region. It demonstrates the potential for bottom streamers to tap into markets in other regions, including those with lower levels of consumption (Figure 10).
Although the Internet and e-commerce platforms provide new channels for self-employment and entrepreneurship, the logistics, finance, and insurance issues involved in LSC still prevent many individuals who need knowledge and skills from participating in this new industry. Here, we call for greater attention to the bottom streamers since they are expected to positively drive local industries and enrich product sources and categories sold on stream. We valued the vital roles of bottom streamers in resource mobilization within the region (short distance), since they can reduce the price difference earned by brokers, thus maximizing the benefits of staying local. Recently, many governments in underdeveloped and remote areas saw the live economy as a significant opportunity to alleviate poverty, encouraging farmers, artisans, and other self-employed individuals to produce and sell their services through LSPs. More targeted technical support, financial subsidies, and tax incentives need to be allocated to achieve such goals.

5. Conclusions and Discussion

Digital platforms are profoundly reshaping the modern business pattern. LSC is one of the most important forms of platform capitalism [8,10], influencing the online and offline activities of suppliers and customers, as well as regional development. Based on more than half a million unique GIS data values on LSC activities on Taobao (Alibaba), we analyzed the spatial characteristics of key players in the supply chain, including streamers, suppliers, and customers on LSC, which contributes to a better understanding of the rapidly emerging and changing economic activity, while also providing both insights into the characteristics of LSC and a reference for various regional industrial planning efforts.
The application of geographic big data benefits, on one hand, makes it easier to present the spatial characteristics of real economic activities from the suppliers’ perspectives; on the other hand, geo-data from certain LSP (Taobao live, in our case) can support our further analysis by capturing the virtual commercial behaviors and their spatial distribution and connection from customers’ perspectives. With the rapid development of digital platforms, ever-more studies are expected to employ such approaches to describe and explain emerging geo-economic networks between new media economic activities and real economic activities, including the resulting regional system changes. For example, combined with other geographic big data (e.g., stream data), the correlation between different influencing factors (e.g., infrastructure, transportation, and public attention) and the development of LSC, related platforms, or a specific insider is worth exploring.
Our research helps us understand the relationship between platforms, capital, and urban systems in the new digital commerce model of LSC. We emphasize that streamers act as intermediaries between online and offline suppliers and customers, while also exhibiting the characteristics of geographic agglomeration in some metropolitan areas. For example, in the YRD and the PRD metropolitan regions, the three main elements of “people, commodities, and markets” are clustered. The live stream supply chain is complete within the region and has obvious advantages. Therefore, streamers can communicate as an intermediary with suppliers in a larger geographical area, especially in the peripheral economic areas. We also confirmed that the inter-regional industry effect is mainly concentrated in light industries and related to the industrial base and nearby market demand. It is worth emphasizing that industry-oriented live streaming helps some industries and crafts in underdeveloped regions to break through their inherent business radius and provide opportunities for rapid development.
We further reflect on the LSC regulation, which was continuously updated in China recently, emphasizing the comprehensive management of MCN streamers. This outcome is partly due to the pyramid structure of China’s LSC, which has a considerable oligopoly effect, but also due to the rapid growth of the bottom streamer group. For example, 55% of the more than 1000 live streaming studios with sales exceeding 100 million yuan in 2020 were store-based streamers [19]. They are the key to overcoming the differences between urban and rural areas and between core and peripheral areas, as well as to promoting economic benefits for small- and medium-sized enterprises or family businesses. In particular, the top anchors are highly clustered in Beijing and Shanghai, and it is easier to cooperate with well-known brands; the streamers in the middle group are heavily concentrated in Hangzhou and Guangzhou, with this trend being closely related to the maturity of the live broadcasting base and the streamer training system. Finally, the bottom group tend to be more widely dispersed due to the different types of businesses or products involved.
As for the practical meaning, LSC in the eastern coastal areas differs significantly from some central or western areas. The middle region still has a better industrial foundation, while the western region has greater potential for development; there are multiple possibilities of achieving catch up based on inter-regional cooperation. The thriving LSC reflects China’s dual-cycle economic strategy based on both domestic and international cooperation. Therefore, we expect to contribute more to LSC governance by paying attention to the players in LSC, especially the streamers, as physical and virtual economic intermediaries.

Author Contributions

Conceptualization, Yiwen Zhu; methodology, Yiwen Zhu and Xumin Zhang; software, Xumin Zhang and Lin Zou; validation, Simin Yan and Lin Zou; formal analysis, Simin Yan and Lin Zou; resources, Yiwen Zhu and Simin Yan; data curation, Xumin Zhang and Lin Zou; writing—original draft preparation, Simin Yan and Lin Zou; writing—review and editing, Simin Yan and Yiwen Zhu; visualization, Xumin Zhang and Lin Zou; supervision, Yiwen Zhu and Lin Zou; project administration, Yiwen Zhu and Lin Zou; funding acquisition, Yiwen Zhu and Lin Zou. All authors have read and agreed to the published version of the manuscript.

Funding

This research was funded by the National Nature Science Foundation of China, grant number 42101175; the Shanghai Soft Science Research Project of Science and Technological Innovation Plan, grant number 23692110300; and the Fundamental Research Funds for the Central Universities, grant number 2020ECNU-HWFW005.

Data Availability Statement

Not applicable.

Conflicts of Interest

The authors declare no conflict of interest.

Appendix A

Table A1. Explanation of main LSC product categories.
(No.) Industry Categories (No.) Specific Industries
(1) Food processing and manufacturing (13) Agricultural by-product processing industry
(14) Food manufacturing
(15) Wine, beverage, and refined tea manufacturing
(16) Tobacco manufacturing industry
(2) Light industrial manufacturing(17) Textile industry
(18) Clothing and apparel industry
(19) Leather, fur, feathers, and their associated products and footwear
(20) Wood processing and wood, bamboo, rattan, palm, and grass products industry
(21) Furniture manufacturing
(22) Paper and paper products industry
(23) Printing and recording media reproduction industry
(24) Education, arts and crafts, sports, and recreational goods manufacturing
(28) Chemical fiber manufacturing
(29) Rubber and plastic manufacturing
(3) Chemical and pharmaceutical manufacturing (26) Chemical raw materials and products manufacturing
(27) Pharmaceutical manufacturing
(4) Instrument and equipment manufacturing (34) General equipment manufacturing
(35) Special equipment manufacturing (36) Automotive manufacturing
(37) Railroad, ship, aerospace, and other transportation equipment manufacturing
(38) Electrical machinery and equipment manufacturing
(39) Computer, communications, and other electronic equipment manufacturing
(40) Instrumentation manufacturing data processing
(5) Other manufacturing classes(25) Petroleum, coal, and other fuel processing industry
(30) Non-metallic mineral products industry
(31) Ferrous metal smelting and rolling processing industry
(32) Non-ferrous metal smelting and rolling processing industry
(33) Metal products industry
(41) Other manufacturing industries
(42) Comprehensive utilization of waste resources industry
(43) Metal products, machinery, and equipment repair industry

Appendix B

Table A2. Top 10 cities of the main LSC product categories.
Food Processing and ManufacturingSupplier No. (%) Light Industrial ManufacturingSupplier No. (%)Other ManufacturingSupplier No. (%)
Shanghai361 (10.90%)Hangzhou1077 (18.89%)Shanghai217 (14.23%)
Hangzhou178 (5.38%)Guangzhou810 (14.20%)Hangzhou177 (11.61%)
Guangzhou150 (4.53)Shanghai506 (8.87%)Guangzhou155 (10.16%)
Ningbo135 (4.08%)Jiaxing314 (5.51%)Shenzhen105 (6.89%)
Beijing124 (3.75%)Jinhua296 (5.19%)Jinhua95 (6.23%)
Chengdu124 (3.75%)Shenzhen255 (4.47%)Suzhou63 (4.13%)
Changsha88(2.66%)Suzhou195 (3.42%)Jiaxing46 (3.02%)
Chongqing84 (2.54%)Nantong135 (2.37%)Foshan42 (2.75%)
Suzhou64 (1.93%)Shantou134 (2.35%)Ningbo35 (2.30%)
Jinhua/Shenzhen58 (1.75%)Ningbo133 (2.33%)Beijing32 (1.51%)
Chemical and pharmaceutical manufacturingSupplier No. (%)Instrument and equipment manufacturingSupplier No. (%)
Guangzhou387 (24.54%)Shenzhen117 (11.55%)
Shanghai233 (14.77%)Shanghai101 (9.97%)
Hangzhou178 (11.29%)Guangzhou98 (9.67%)
Ningbo102 (6.47%)Hangzhou89 (8.79%)
Suzhou72 (4.57%)Foshan75 (7.40%)
Zhengzhou58 (3.68%)Jinhua65 (6.42%)
Jinhua54 (3.42%)Ningbo55 (5.43%)
Shenzhen42 (2.66%)Beijing41 (4.05%)
Beijing38 (2.41%)Suzhou31 (3.06%)
Jiaxing36 (2.28%)Zhongshan31 (3.06%)
Note: The table shows information on cities located in the Yangtze River Delta (YRD) in blue, cities in the Pearl River Delta (PRD) in gray, cities in the Chengdu-Chongqing urban agglomeration in yellow, cities in the Beijing-Tianjin-Hebei region in orange, and white represents cities located in other regions.

References

  1. Wongkitrungrueng, A.; Dehouche, N.; Assarut, N. Live Streaming Commerce from the Sellers’ Perspective: Implications for Online Relationship Marketing. J. Mark. Manag. 2020, 36, 488–518. [Google Scholar] [CrossRef]
  2. CNNIC. The 48th Statistical Report on Internet Development in China; China Internet Network Information Center: Beijing, China, 2021. [Google Scholar]
  3. Guo, Y.; Zhang, K.; Wang, C. Way to Success: Understanding Top Streamer’s Popularity and Influence from the Perspective of Source Characteristics. J. Retail. Consum. Serv. 2022, 64, 102786. [Google Scholar] [CrossRef]
  4. Nguyen, L.V.; Jung, J.J.; Hwang, M. OurPlaces: Cross-Cultural Crowdsourcing Platform for Location Recommendation Services. ISPRS Int. J. Geo-Inf. 2020, 9, 711. [Google Scholar] [CrossRef]
  5. Prahalad, C.K.; Ramaswamy, V. Co-Opting Customer Competence. Harv. Bus. Rev. 2000, 78, 79–90. [Google Scholar]
  6. Bratton, B.H. The Stack: On Software and Sovereignty; MIT Press: Cambridge, MA, USA, 2016. [Google Scholar]
  7. Rochet, J.-C.; Tirole, J. Two-Sided Markets: A Progress Report. RAND J. Econ. 2006, 37, 645–667. [Google Scholar] [CrossRef] [Green Version]
  8. Srnicek, N. Platform Capitalism; John Wiley & Sons: Hoboken, NJ, USA, 2017. [Google Scholar]
  9. Elwood, S.; Leszczynski, A. Privacy, Reconsidered: New Representations, Data Practices, and the Geoweb. Geoforum 2011, 42, 6–15. [Google Scholar] [CrossRef]
  10. Langley, P.; Leyshon, A. Platform Capitalism: The Intermediation and Capitalization of Digital Economic Circulation. Financ. Soc. 2017, 3, 11–31. [Google Scholar] [CrossRef] [Green Version]
  11. Pasquale, F. Two Narratives of Platform Capitalism. Yale Law Policy Rev. 2016, 35, 309. [Google Scholar]
  12. Lu, Z.; Xia, H.; Heo, S.; Wigdor, D. You Watch, You Give, and You Engage: A Study of Live Streaming Practices in China. In Proceedings of the 2018 CHI Conference on Human Factors in Computing Systems, Montreal, QC, Canada, 21–26 April 2018; pp. 1–13. [Google Scholar]
  13. Zhang, Y.; Wang, M.; Wang, F. Spatial Differences in the Development of Livestreaming E-Commerce and Influence in China. Sci. Geogr. Sin. 2022, 42, 1555–1565. (In Chinese) [Google Scholar]
  14. Wang, F.; Wang, M. Spatial Aggregation Characteristics and Influencing Factors of Taobao Village Based on Grid in China. Sci. Geogr. Sin. 2020, 40, 229–237. (In Chinese) [Google Scholar] [CrossRef]
  15. Ma, F.; Ding, Z. Spatial Differentiation and Influencing Factors of the Development of China’s Tiktok Live Broadcast Cargo Industryw. Econ. Geogr. 2021, 41, 22–32. (In Chinese) [Google Scholar]
  16. Peng, J.; He, J. Spatial differentiation and influencing factors of fan economy in China: Taking TikTok livestreaming commerce host as an example. Prog. Geogr. 2021, 40, 1098–1112. (In Chinese) [Google Scholar] [CrossRef]
  17. Zou, L.; Lyu, G.; Zhu, Y.; Yan, S.; Zhang, X. Spatializing the Emerging Geography of Urban System in China: Based on Live Streaming E-Commerce. Cent. Mod. Chin. City Stud. East China Norm. Univ. Shanghai China 2023. submitted. [Google Scholar]
  18. Luo, Z. Research on Countermeasures for the Development of China’s Live Broadcast Economy under the New Development Pattern. Econ. Forum 2021, 9, 83–91. [Google Scholar]
  19. Liu, Y.; Li, Z. Taobao Live 2021 Annual Report; Taobao Live: Beijing, China, 2021. [Google Scholar]
  20. Guo, J.; Wang, L. Scientifically Understand the Technical-Economic Characteristics and Market Attributes of Data Elements. Theory Pract. 2021, 05, 12–14+26. [Google Scholar]
  21. Su, X.; Li, X.; Liu, L.; Zhou, X. Analysis of Regional Distribution and Influence Characteristics of Live Broadcast Economy in the Era of New Media: Taking Taobao Live Broadcast as an Example. In Proceedings of the 2021 Annual China Urban Planning Conference, Chengdu, China, 25–30 September 2021. [Google Scholar]
  22. Chavez, R.; Yu, W.; Jacobs, M.A.; Feng, M. Data-Driven Supply Chains, Manufacturing Capability and Customer Satisfaction. Prod. Plan. Control 2017, 28, 906–918. [Google Scholar] [CrossRef] [Green Version]
  23. CASS. Live Commerce White Book; Taobao Live, National Academy of Economic Strategy (CASS): Beijing, China, 2022. [Google Scholar]
  24. Li, F.; Frederick, S.; Gereffi, G. E-Commerce and Industrial Upgrading in the Chinese Apparel Value Chain. J. Contemp. Asia 2019, 49, 24–53. [Google Scholar] [CrossRef]
  25. Cai, J.; Wohn, D.Y. Live Streaming Commerce: Uses and Gratifications Approach to Understanding Consumers’ Motivations. In Proceedings of the 52nd Hawaii International Conference on System Sciences, Maui, HI, USA, 8–11 January 2019. [Google Scholar]
  26. Deshpande, S.G.; Hwang, J.-N. A Real-Time Interactive Virtual Classroom Multimedia Distance Learning System. IEEE Trans. Multimed. 2001, 3, 432–444. [Google Scholar] [CrossRef]
  27. Bründl, S.; Matt, C.; Hess, T. Consumer Use of Social Live Streaming Services: The Influence of Co-Experience and Effectance on Enjoyment. In Proceedings of the 25th European Conference on Information Systems (ECIS), Guimarães, Portugal, 5 June 2017; pp. 1775–1791. [Google Scholar]
  28. Haimson, O.L.; Tang, J.C. What Makes Live Events Engaging on Facebook Live, Periscope, and Snapchat. In Proceedings of the 2017 CHI Conference on Human Factors in Computing Systems, Denver, CO, USA, 6–11 May 2017; pp. 48–60. [Google Scholar]
  29. Meyrowitz, J. No Sense of Place: The Impact of Electronic Media on Social Behavior; Oxford University Press: Oxford, UK, 1986. [Google Scholar]
  30. Collins, R. Interaction Ritual Chains. In Interaction Ritual Chains; Princeton University Press: Princeton, NJ, USA, 2014. [Google Scholar]
  31. Jenkins, H. Textual Poachers: Television Fans and Participatory Culture; Routledge: New York, NY, USA, 2012. [Google Scholar]
  32. Kang, K.; Lu, J.; Guo, L.; Li, W. The Dynamic Effect of Interactivity on Customer Engagement Behavior through Tie Strength: Evidence from Live Streaming Commerce Platforms. Int. J. Inf. Manag. 2021, 56, 102251. [Google Scholar] [CrossRef]
  33. iiMedia Researc 2020 H1 China Live E-Commerce Industry Streamer Career Development Status and Trends Research Report. Available online: https://www.iimedia.cn/c400/71682.html (accessed on 20 March 2023).
  34. Massey, D. Regionalism: Some Current Issues. Cap. Cl. 1978, 2, 106–125. [Google Scholar] [CrossRef]
  35. Zhang, F.; Wu, F. “Fostering Indigenous Innovation Capacities”: The Development of Biotechnology in Shanghai’s Zhangjiang High-Tech Park. Urban Geogr. 2012, 33, 728–755. [Google Scholar] [CrossRef]
  36. Krugman, P. First Nature, Second Nature, and Metropolitan Location. J. Reg. Sci. 1993, 33, 129–144. [Google Scholar] [CrossRef] [Green Version]
  37. Glaeser, E.L.; Rosenthal, S.S.; Strange, W.C. Urban Economics and Entrepreneurship. J. Urban Econ. 2010, 67, 1–14. [Google Scholar] [CrossRef] [Green Version]
  38. Marshall, A. Principles of Economics, 8th ed.; Macmillan & Co., Ltd.: London, UK, 1920. [Google Scholar]
  39. World Bank; Development Research Center of the State Council, the People’s Republic of China. Urban China: Toward Efficient, Inclusive and Sustainable Urbanization; World Bank Publications: Washington, DC, USA, 2014. [Google Scholar]
  40. Wu, A.; Sun, T.; Li, G. Spatial Agglomeration and Regional Shift of Textile and Garment Industry in China. Acta Geogr. Sin. 2013, 68, 775–790. [Google Scholar]
  41. Lin, Y. E-Urbanism: E-Commerce, Migration, and the Transformation of Taobao Villages in Urban China. Cities 2019, 91, 202–212. [Google Scholar] [CrossRef]
  42. Wang, C.C.; Miao, J.T.; Phelps, N.A.; Zhang, J. E-Commerce and the Transformation of the Rural: The Taobao Village Phenomenon in Zhejiang Province, China. J. Rural Stud. 2021, 81, 159–169. [Google Scholar] [CrossRef]
  43. Castells, M.; Blackwell, C. The Information Age: Economy, Society and Culture. Volume 1. The Rise of the Network Society. Environ. Plan. B Plan. Des. 1998, 25, 631–636. [Google Scholar]
  44. Graham, M. Time Machines and Virtual Portals: The Spatialities of the Digital Divide. Prog. Dev. Stud. 2011, 11, 211–227. [Google Scholar] [CrossRef] [Green Version]
  45. Zheng, N. Influencing Factors of the Layout of the ICT Industry—Based on Empirical Research from 30 Provinces and Municipalities in China. Econ. Forum 2016, 10, 72–79. [Google Scholar]
  46. Ash, J.; Kitchin, R.; Leszczynski, A. Digital Turn, Digital Geographies? Prog. Hum. Geogr. 2018, 42, 25–43. [Google Scholar] [CrossRef] [Green Version]
  47. Forman, C.; Goldfarb, A.; Greenstein, S. How Geography Shapes—And Is Shaped by—The Internet. In The New Oxford Handbook of Economic Geography; Oxford University Press: Oxford, UK, 2018; pp. 269–285. [Google Scholar]
  48. Qian, Q.; Chen, Y.; Liu, S.; Zhang, J.; Chen, C. Development Characteristics and Formation Mechanism of Taobao Town: Taking Xintang Town in Guangzhou as an Example. Sci. Geogr. Sin. 2017, 37, 1040–1048. (In Chinese) [Google Scholar]
  49. Zhang, Y.N.; Long, H.L.; Tu, S.S.; Li, Y.R.; Ma, L.; Ge, D.Z. A Multidimensional Analysis of Rural Restructuring Driven by E-Commerce: A Case of Xiaying Village in Central China. Sci. Geogr. Sin. 2019, 39, 947–956. (In Chinese) [Google Scholar]
  50. Caputo, A.; Pizzi, S.; Pellegrini, M.M.; Dabić, M. Digitalization and Business Models: Where Are We Going? A Science Map of the Field. J. Bus. Res. 2021, 123, 489–501. [Google Scholar] [CrossRef]
  51. Sadowski, J. Cyberspace and Cityscapes: On the Emergence of Platform Urbanism. Urban Geogr. 2020, 41, 448–452. [Google Scholar] [CrossRef]
  52. Nooren, P.; van Gorp, N.; van Eijk, N.; Fathaigh, R.Ó. Should We Regulate Digital Platforms? A New Framework for Evaluating Policy Options. Policy Internet 2018, 10, 264–301. [Google Scholar] [CrossRef]
  53. Caprotti, F.; Chang, I.-C.C.; Joss, S. Beyond the Smart City: A Typology of Platform Urbanism. Urban Transform. 2022, 4, 4. [Google Scholar] [CrossRef]
  54. Barns, S. Smart Cities and Urban Data Platforms: Designing Interfaces for Smart Governance. City Cult. Soc. 2018, 12, 5–12. [Google Scholar] [CrossRef]
  55. Kitchin, R.M. Towards Geographies of Cyberspace. Prog. Hum. Geogr. 1998, 22, 385–406. [Google Scholar] [CrossRef] [Green Version]
  56. Castells, M. The Internet Galaxy: Reflections on the Internet, Business, and Society; Oxford University Press: New York, NY, USA, 2002. [Google Scholar]
  57. Dodge, M.; Kitchin, R. Atlas of Cyberspace; Addison-Wesley: London, UK, 2001. [Google Scholar]
  58. Townsend, A.M. Network Cities and the Global Structure of the Internet. Am. Behav. Sci. 2001, 44, 1697–1716. [Google Scholar] [CrossRef]
  59. Zook, M.A. The Web of Production: The Economic Geography of Commercial Internet Content Production in the United States. Environ. Plan. A 2000, 32, 411–426. [Google Scholar] [CrossRef] [Green Version]
  60. Brunn, S.D.; Dodge, M. Mapping the “Worlds” of the World Wide Web: (Re) Structuring Global Commerce through Hyperlinks. Am. Behav. Sci. 2001, 44, 1717–1739. [Google Scholar] [CrossRef]
  61. Zook, M. The Geographies of the Internet. Annu. Rev. Inf. Sci. Technol. 2006, 40, 53–78. [Google Scholar] [CrossRef]
  62. World Bank. The Taobao Villages as an Instrument for Poverty Reduction and Shared Prosperity. Available online: https://www.worldbank.org/en/news/speech/2016/10/29/the-taobao-villages-as-an-instrument-for-poverty-reduction-and-shared-prosperity (accessed on 7 October 2022).
  63. Zhou, J.; Yu, L.; Choguill, C.L. Co-Evolution of Technology and Rural Society: The Blossoming of Taobao Villages in the Information Era, China. J. Rural Stud. 2021, 83, 81–87. [Google Scholar] [CrossRef]
  64. Berke, O. Exploratory Disease Mapping: Kriging the Spatial Risk Function from Regional Count Data. Int. J. Health Geogr. 2004, 3, 18. [Google Scholar] [CrossRef] [PubMed] [Green Version]
  65. Wang, T.; Wang, L.; Ning, Z.-Z. Spatial Pattern of Tourist Attractions and Its Influencing Factors in China. J. Spat. Sci. 2020, 65, 327–344. [Google Scholar] [CrossRef]
  66. Chen, D.; He, Z.; Hong, X.; Ni, X.; Ma, R. Green and Low-Carbon Commuting Evaluation and Optimization of a Cross-Border Metropolitan Region by the Subway Network: The Case of Shenzhen and Hong Kong, China. Land 2022, 11, 1127. [Google Scholar] [CrossRef]
  67. Zhang, X.; Huang, X.; Li, J. The Evolution of Green Development, Spatial Differentiation Pattern and Its Influencing Factors in Characteristic Chinese Towns. Sustainability 2023, 15, 5079. [Google Scholar] [CrossRef]
  68. Silverman, B.W. Density Estimation for Statistics and Data Analysis; CRC Press: Boca Raton, FL, USA, 1986; Volume 26. [Google Scholar]
  69. Arribas-Bel, D. Accidental, Open and Everywhere: Emerging Data Sources for the Understanding of Cities. Appl. Geogr. 2014, 49, 45–53. [Google Scholar] [CrossRef] [Green Version]
  70. Derudder, B.; Taylor, P.J.; Hoyler, M.; Ni, P.; Liu, X.; Zhao, M.; Shen, W.; Witlox, F. Measurement and Interpretation of Connectivity of Chinese Cities in World City Network, 2010. Chin. Geogr. Sci. 2013, 23, 261–273. [Google Scholar] [CrossRef] [Green Version]
  71. Taylor, P.J.; Derudder, B.; Faulconbridge, J.; Hoyler, M.; Ni, P. Advanced Producer Service Firms as Strategic Networks, Global Cities as Strategic Places. Econ. Geogr. 2014, 90, 267–291. [Google Scholar] [CrossRef] [Green Version]
Figure 1. Three categories of participants in supply chains for live streaming commerce (LSC). Source: authors.
Ijgi 12 00229 g001
Figure 2. Spatial distribution and agglomeration of suppliers of LSC (Taobao) in China. Source: authors. Note: This map is based on standard map with review number GS (2019)1822 downloaded from standard map service website of Ministry of Natural Resources, and base map is hereinafter unmodified.
Ijgi 12 00229 g002
Figure 3. Agglomeration of suppliers, streamers, and customers by cities in China (top 20 cities are listed). Source: authors.
Ijgi 12 00229 g003
Figure 4. Spatial distribution and agglomeration of streamers of LSC (Taobao) in China. Source: authors.
Ijgi 12 00229 g004
Figure 5. Spatial distribution and agglomeration of consumers of LSC (Taobao) in China. Source: authors.
Ijgi 12 00229 g005
Figure 6. Spatial distribution of suppliers in LSC by their leading product categories. Source: authors.
Ijgi 12 00229 g006
Figure 7. Proportion of streamers in LSC by their leading product categories.
Ijgi 12 00229 g007
Figure 8. Spatial distribution of streamers in LSC by their leading product categories. Source: authors.
Ijgi 12 00229 g008
Figure 9. Spatial distribution of top streamers in Taobao and their connection strength with suppliers and consumers. Source: authors.
Ijgi 12 00229 g009
Figure 10. Percentage distribution of Taobao streamers among suppliers and consumers in major urban agglomerations in China. Source: authors.
Ijgi 12 00229 g010
Figure 11. Spatial distribution of middle streamers and their connection strength with suppliers and consumers. Source: authors.
Ijgi 12 00229 g011
Figure 12. Spatial distribution of bottom streamers and their connection strength with suppliers and consumers. Source: authors.
Ijgi 12 00229 g012
Table 1. Main information of database.
ActorsIndicatorsExplanation/Number
SupplierNo.11,713
Cities no.266
Supplier–streamer ties2102
StreamerNo.999
Cities no.77
Streamer typeTop/middle/bottom;
Production typeFood processing and manufacturing (2%)
Light industrial manufacturing (78%)
Chemical and pharmaceutical manufacturing (5%)
Instrument and equipment manufacturing (3%)
Other manufacturing classes (12%)
CustomerNo.623,218,349
Streamer–customer ties539
Disclaimer/Publisher’s Note: The statements, opinions and data contained in all publications are solely those of the individual author(s) and contributor(s) and not of MDPI and/or the editor(s). MDPI and/or the editor(s) disclaim responsibility for any injury to people or property resulting from any ideas, methods, instructions or products referred to in the content.

