Article

Analysis of Walkable Street Networks by Using the Space Syntax and GIS Techniques: A Case Study of Çankırı City

by
Pelin Şahin Körmeçli
Department of Landscape Architecture, Faculty of Forestry, Çankırı Karatekin University, Çankırı 18200, Turkey
ISPRS Int. J. Geo-Inf. 2023, 12(6), 216; https://doi.org/10.3390/ijgi12060216
Submission received: 5 March 2023 / Revised: 5 May 2023 / Accepted: 24 May 2023 / Published: 26 May 2023

Abstract

:
Nowadays, city forms are changing due to rapid urbanization and increasing population. In urban morphology studies, walkable street network is examined through the city form to create sustainable cities. This study aims to examine accessibility of street network that shapes the city form by using central street line retrieved from OSM. Accessibility of the street network, one of the criteria of walkability, was evaluated in Çankırı, a micro city in Turkey. The space syntax and GIS methods were used to examine the physical accessibility of the street network. As differences in the topography are not taken into consideration in the space syntax, it was integrated with the GIS in this study. With this method, spatial accessibility, the correlation between integration and choice values of street network, was examined at first. Secondly, land slope was classified according to the standards of pedestrian accessibility and the study area was analyzed using the GIS. Finally, streets with low slope percentage and high integration value were overlaid. The results revealed that the longest, continuous, and main axes located in the area with low slope and high integration values are accessible. The accessible streets obtained by a collaborative integration of the space syntax and GIS methods are lower than the area obtained just from the space syntax method. The use of a combination of these methods is beneficial in terms of understanding the land in three dimensions, but focusing on land surface slopes is only one of the possible synergies between the two tools. The walkable street network obtained by using this method gives an idea about urban mobility. While this method works with hilly lands, other GIS data may be needed for different land types. However, it should also be extended to multi-source information and quantitative analysis methods in bigger cities, as urban walkability is at the core of the 15-minute city model, which is of high actuality of the agenda of urban planning and sustainable urban development.

1. Introduction

With the rapid population growth and uncontrolled urbanization, cities are undergoing changes in terms of their physical structure. Recent studies focus on sustainable and accessible living spaces by creating smart cities due to the increasing population. In order to evaluate accessibility in cities, the space syntax technique is used to represent pedestrian movement pattern. There are many studies that use street networks as an important parameter in understanding urban morphology [1,2,3,4,5].
Accessibility means that no person’s right to access public space should be restricted and its usability should be ensured, and that everyone should be able to go wherever they go in daily life and participate in every public activity [6]. Accessibility refers to the ease or convenience of reaching a particular destination [7]. Analytical methods for evaluating accessibility shape mobility and urban form through the process of locational and travel decision-making.
One of the most important criteria for improving accessibility in cities is the walkability. As a determinant of livability in public spaces, walkability provides convenience to pedestrians with factors such as road conditions, land use pattern, safety and comfort [8]. The walkability is a wider and more complex concept, based on indicators such as the presence of obstacles along pedestrian paths, sidewalks’ surface, road slope, sense of safety and security, presence of pedestrian-oriented lighting, benches, shelters, sidewalk width, road equipment, land mix, vehicular traffic, building context, green space etc. [9]. The concept of walkability has qualitative and quantitative aspects. Walkability is evaluated according to the criteria of attractiveness, safety, connections between transportation types, street pattern, connectivity of the street network, open space systems, quality of pedestrian roads and access to desired destinations [10]. Access to desired destinations is divided into three types: to daily destinations, to public transit stations, and to green areas [11]. According to Time Saver Accessibility Standards, 400–800 m, which takes between 5 and 10 min, are shown as walkable [12]. Walkability assessment has several dimensions and different urban scales such as macro, meso, and micro. At the macro level, walkability assessment considers whether all street networks are accessed efficiently to create walkable urban spaces [8]. The accessibility of street networks is one of the important quantitative criteria for the evaluation of walkability at a macro scale.
Street networks, enabling social life in cities, are widely used in the analysis of pedestrian movement. There are many studies on pedestrian movement in cities. Monokrousou and Giannopoulou [13] examined the correlation analysis of integration and choice values in order to explain pedestrian movement and predict the future state of Athens. In addition, Öztürk Hacar et al. [14] evaluated space syntax measures with ordinal logistic regression analysis in the university campus, revealing that some environmental characteristics such as the land use and topography of the region are factors affecting the pedestrian density and walkability on the walkways. Andrakakou et al. [15], on the other hand, examined the configurational centralities in the Copenhagen metropolitan area created by the street network based on space syntax analysis and land-use patterns with a geographical technique using data from OSM (Open Street Map). Bill Hillier and Iida [16] investigated the correlation between graphical measurements of the street network in axes graph and observed movement patterns in space syntax studies, answering how people navigate urban grids. Jabbari et al. [17] investigated the correlation between connectivity and pedestrian movement via Angular Segment Analysis by Metric Distance (ASAMeD) analysis, and assessment of the results were showed through digital maps within GIS-based environments. Studies revealed that the result of the ASAMeD analysis is largely related to the pedestrian movement pattern [18,19,20,21]. ASAMeD determines potential streets that pedestrians use for walking [17]. Özer [22] defined the relationship of urban space with pedestrian movement in Galata, İstanbul, and the results showed the importance of using the space syntax method as a tool in urban design studies.
The space syntax method was used to determine accessibility. The accessibility is defined as the correlation between the degree of integration and choice [23]. The space syntax method helps us to understand the relationship between pedestrian movements and physical space by transforming it into a mathematical model. This mathematical model evaluates the accessibility of streets in the system by calculating and averaging the changes in direction required to reach from one place to another in urban open spaces. The Space syntax theory and techniques suggest that urban configuration affects human spatial movement patterns in the city, enabling to determine which paths will be used more than others [24]. The space syntax method, which works like a virtual brain in the analysis of urban areas, is used as a design tool. The method is useful in identifying and solving problems that occur in or after design by analyzing urban spaces with different characteristics. In the space syntax method, it is generally ignored that the view axes can be blocked due to the differences in the topography. On the other hand, land surface elevation can be integrated into the expanded Space Syntax model by use of weighted mathematical graphs and/or employment of the directed graph. In this case, visibility becomes a secondary argument for the use of data on elevation with movement speed, while walking up and down hill becomes more important. Building on the space syntax theory, Zaleckis et al. [25] introduced a four spatial indicator-designed tool, which are Gravity (Gr), Reach (Re), Straightness (St), and Population density (Pop), for city walkability assessment and comparison. Walkability comparative methods are still under development in urban studies. In this context, it is necessary to consider the land slope values by integrating the GIS technique into the space syntax method.
In many researches, it is seen that the space syntax method is generally used in the assessment of street network accessibility. Lamíqui et al. [26] calculated the accessibility of street network using the space syntax method, and their findings showed the idea that the configuration of the urban grid can affect the rate of pedestrians. Since the movement pattern of space syntax in the city, regardless of all other factors, is mostly shaped only by the topology of the road network, the space syntax method has been integrated with the GIS in order to provide good data support in recent studies. There are many studies that evaluate accessibility of street networks by integrating the GIS with space syntax at different scales of the city [24,27] In recent years, many studies have been carried out to include topographic parameters in space syntax analyses. Jiang [28] used the theory of space syntax with the GIS for the first time, and suggested that space syntax can be applied to urban road structure analysis, traffic flow prediction, and pedestrian prediction. Despite extensive studies on pedestrian behavior, studies conducted to investigate the link between pedestrian route choice and the built environment are inadequate [29,30]. Asami, Kubat, Kitaqawa, and Iida [31] developed the elevation difference of the axial lines used in the space syntax method in order to analyze the city form on a three-dimensional plan. The space syntax method evaluates the spatial organization of city plans on a two-dimensional plan. When the studies are examined, it is seen that there is a need for researches that will integrate the land slope and integration values to ensure walkable streets for pedestrians. Unlike most previous studies that employed the GIS or space syntax, this study integrated the GIS and space syntax to provide good data support for the perception of the street network.
The space syntax and the GIS-based methods are used together to contribute to the database for the development of urban morphology. Srivanit et al. [32] stated that the measurement of the integration value points will be a key factor to understand the basics of the morphological approaches and accessibility patterns within the spatial configuration of streets, and can be used for activity prediction in the area where the network has been placed. In order to understand how the pedestrian movements are integrated into urban spaces, there is a need for studies that use a combination of the space syntax and GIS methods. A collaboration of these two methods helped us to understand interaction between pedestrian mobility and land use in cities. Xing and Guo [33] also indicated that the data analysis and integration methods such as regression analysis, space syntax, and the GIS have provided essential technical and theoretical support for the analysis of urban space. Combining space syntax analysis in one model using the Geographical Information System (GIS) enabled quantitative tools to contribute to great advances in the spatial analysis of urban morphology [32].
The method was applied in Çankırı, one of the smallest cities in Turkey. Being a small city, the city has the potential to examine the walkability of urban areas. It is easy to evaluate the walkable street model in a micro city, as small cities have an impact area at walking distance from the center. This study evaluated walkability on the macro scale. At the macro level, the accessibility of street networks is one of the important parameters to evaluate walkability. The study hypothesis considers that accessibility of street networks, which is a criteria of walkability at the macro level, as an important factor in predicting the urban mobility. The aim of the study is to evaluate the accessibility of the street network in the city to create pedestrian movement model by using the morphological space syntax and GIS methods. The study suggests that there is a relationship between physical features of urban form and walkability. Walkability was evaluated in three dimensions based on the physical accessibility of street networks in the study area. The physical design characteristics that determine the accessibility of the street fabric were revealed. The space syntax method was used to evaluate the accessibility of street networks, and the Geographic Information System was used to evaluate land slope. The study explores the space syntax and GIS methods to provide evaluation tools for pedestrian-oriented environment. The research proposes the hypothesis that the sustainability of cities requires adaptation to walkability. Walkability is suitable for sustainable development, not only because of the speed of movement, but also because of lower pollution, catalyzation of interaction between buildings and streets spaces, etc. The findings of the study may be practical in terms of using measurement data in planning and design practices to improve the accessibility of the city.

2. Study Area

The study focused on Çankırı, one of the smallest cities in Turkey, making it easy to assess street networks and its impacts on walkability. This city’s population in 2022 was 195,766 [34]. The city center is located on a low slope area and surrounded by mountains. As a small city, it is in a state of development, which gives the opportunity to easily examine the walkability on streets that shape up the city form. Open Street Map data were used for the analysis of the space syntax method. Elevation groups of the area were evaluated from the Digital Elevation Model data created using raster data for slope analysis in the GIS. Literature reviews, field studies, and analyses regarding the landscape characteristic of the research area, as well as satellite images are among the other materials used in the study. The current location of the city and its street network are shown in Figure 1.
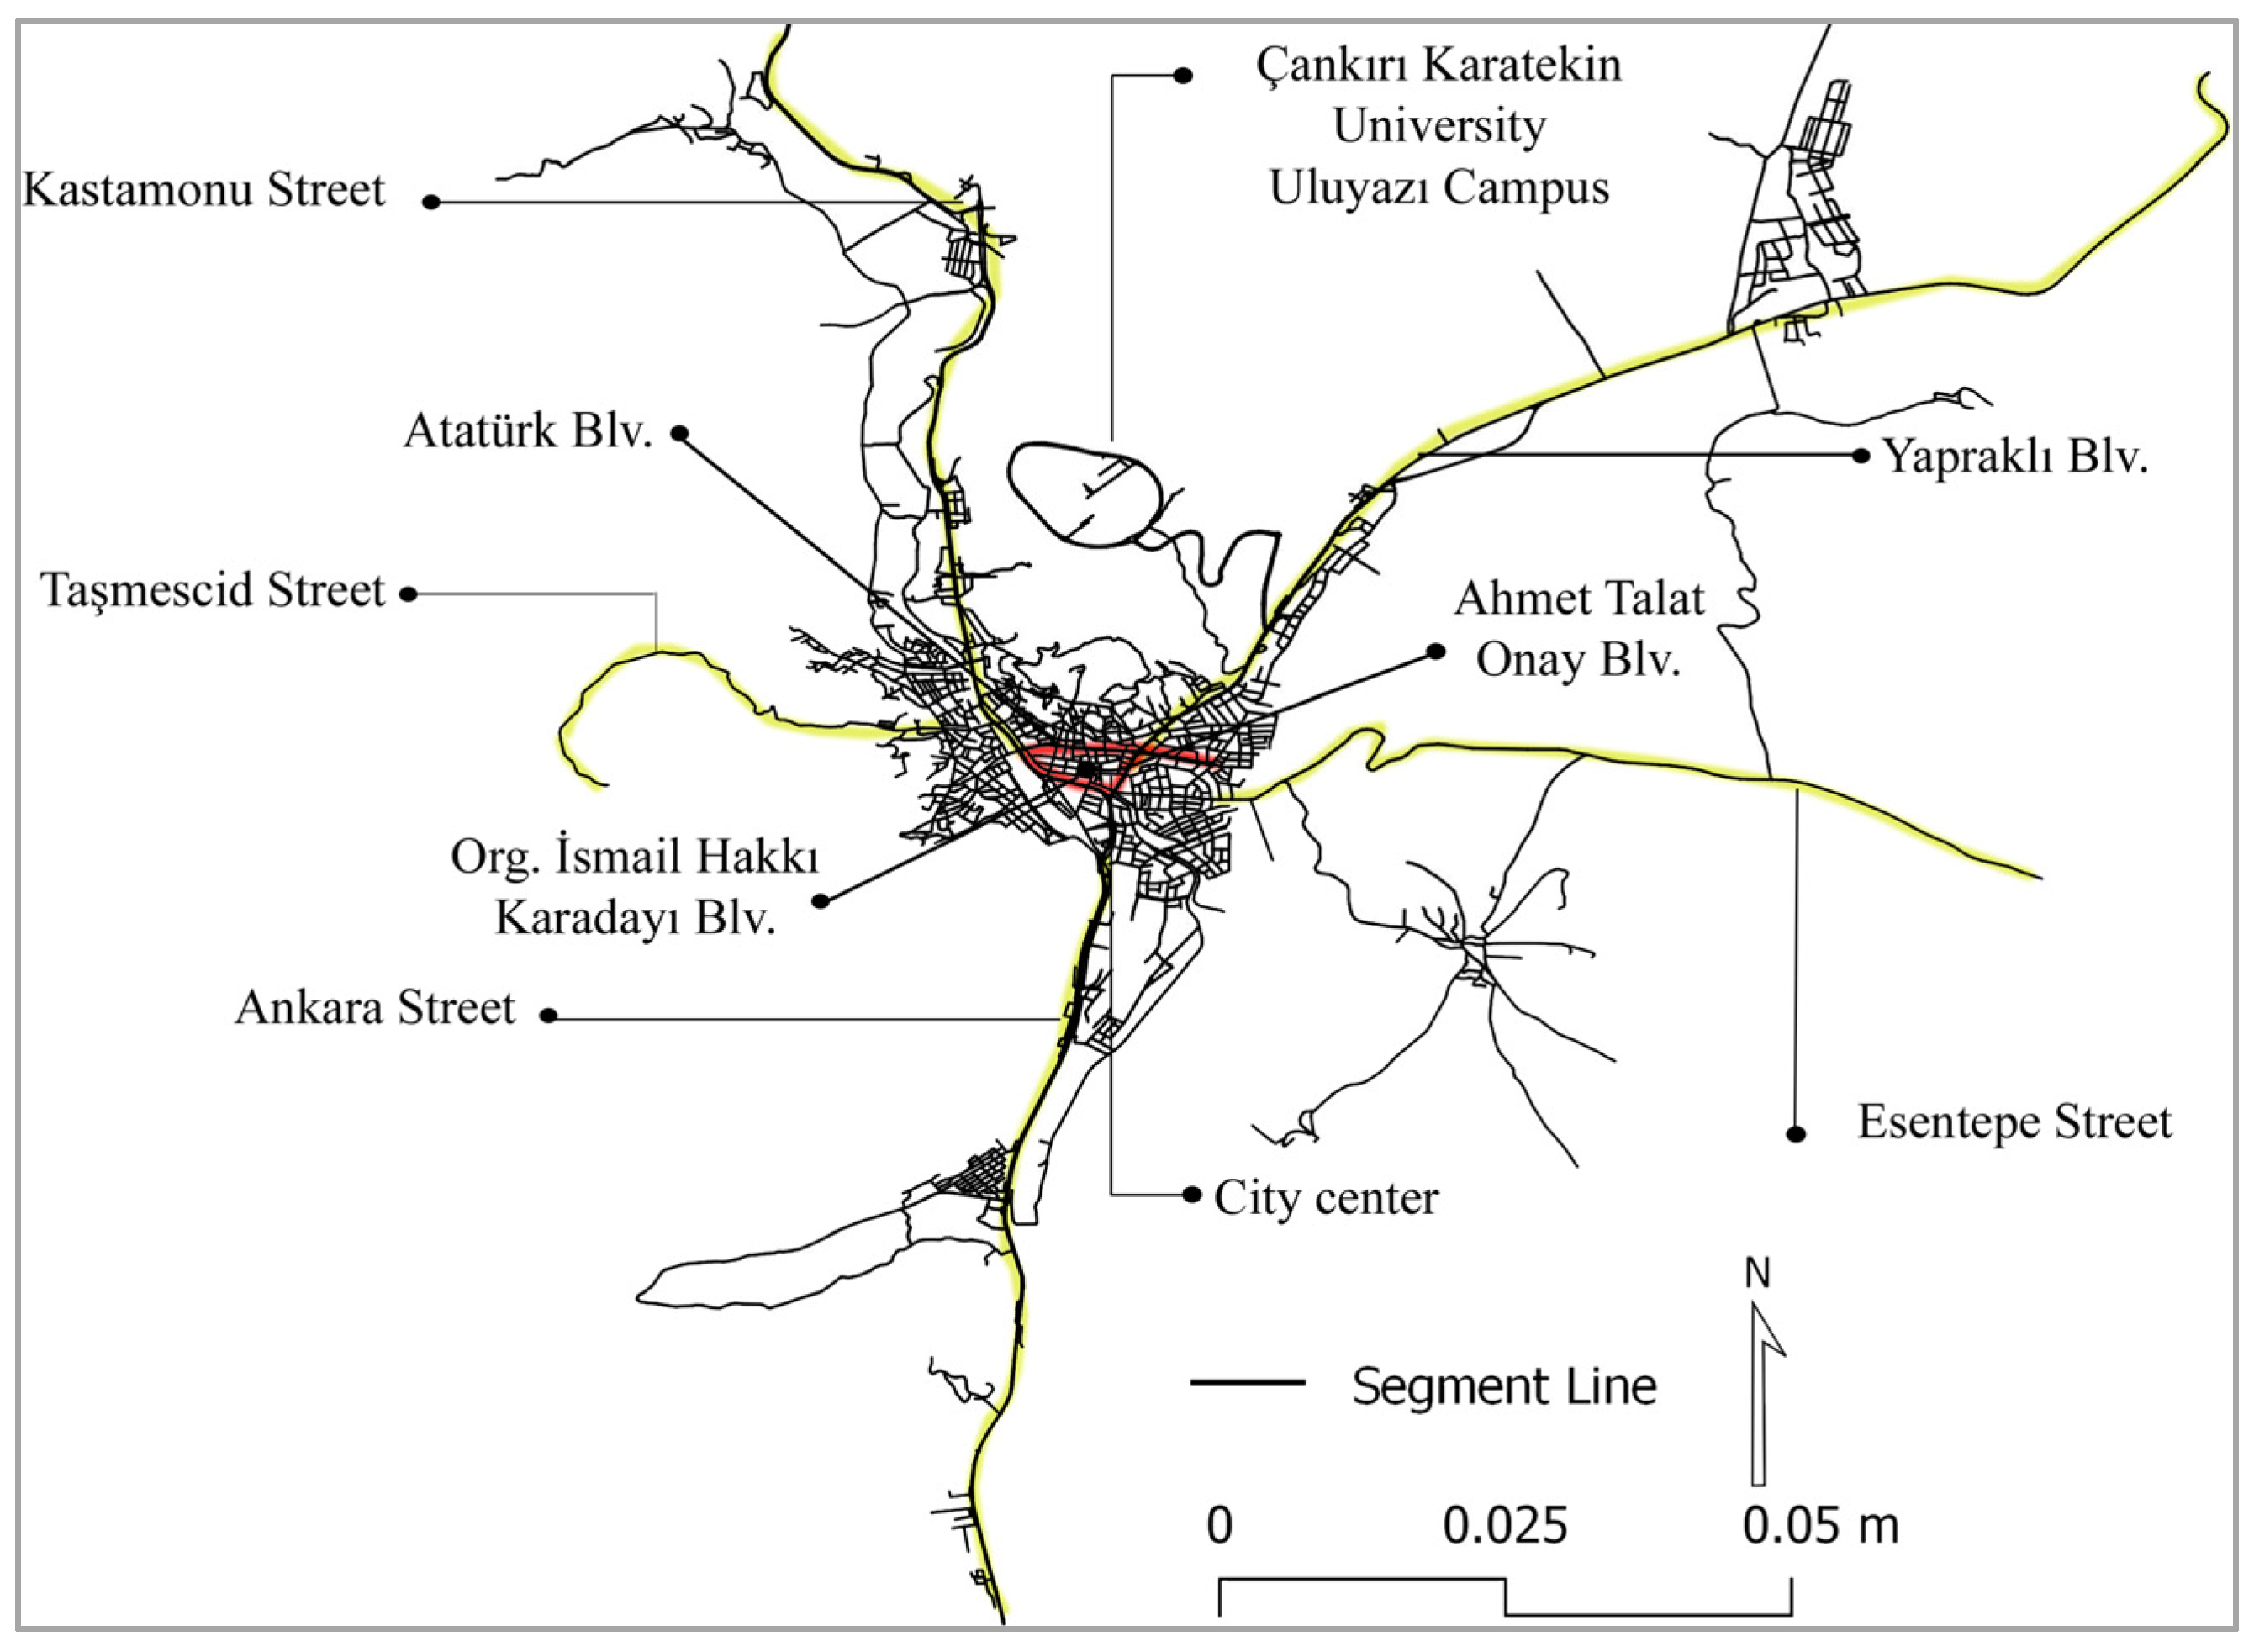
The city is growing in three directions. In the current map of the study area, the city center is located northeast of Yapraklı Boulevard, south of Ankara Street, and northwest of Kastamonu Street. The urban form and the Çankırı city segment map are shown in Figure 2.

3. Materials and Methods

3.1. Space Syntax

The space syntax theory reflects urban morphology and evaluates the accessibility of street networks. A series of primary or baseline analysis informs the design process from the outset by finding the potentials and problems that are determined via the analysis of spatial configuration in the space syntax approach [35]. Space syntax is a method that defines the relations between the formal structure of the spatial dimension extending from the building scale to the city scale and the way of use or the actions in that area; and evaluates these relations with a numerical method, allowing new formations in the organization of space by associating the social structure with the approaches it presents [36]. The space syntax method developed by Hillier and Hanson [18] analyzes how spatial pattern develops at the scale of the city and the building. This method is about defining the spatial configuration of the city and understanding its relationship with movement. The organization of the street network makes movement, and while shaping movements, it also creates a distribution of land uses [37]. Movement directions, gathering places, and directions of human communities living in a settlement are determined according to the system formed by the geometry of that settlement [38]. The space syntax method allows to analyze pedestrian mobility in urban areas that promote social interaction. In order to determine the movement areas in the urban areas, the program creates axial lines in spaces. Axial maps are obtained by combining the longest lines in open spaces. Axial maps form the urban street network. At the points where the axes intersect, each axis is segmented at a certain angle to form the angular segment map.
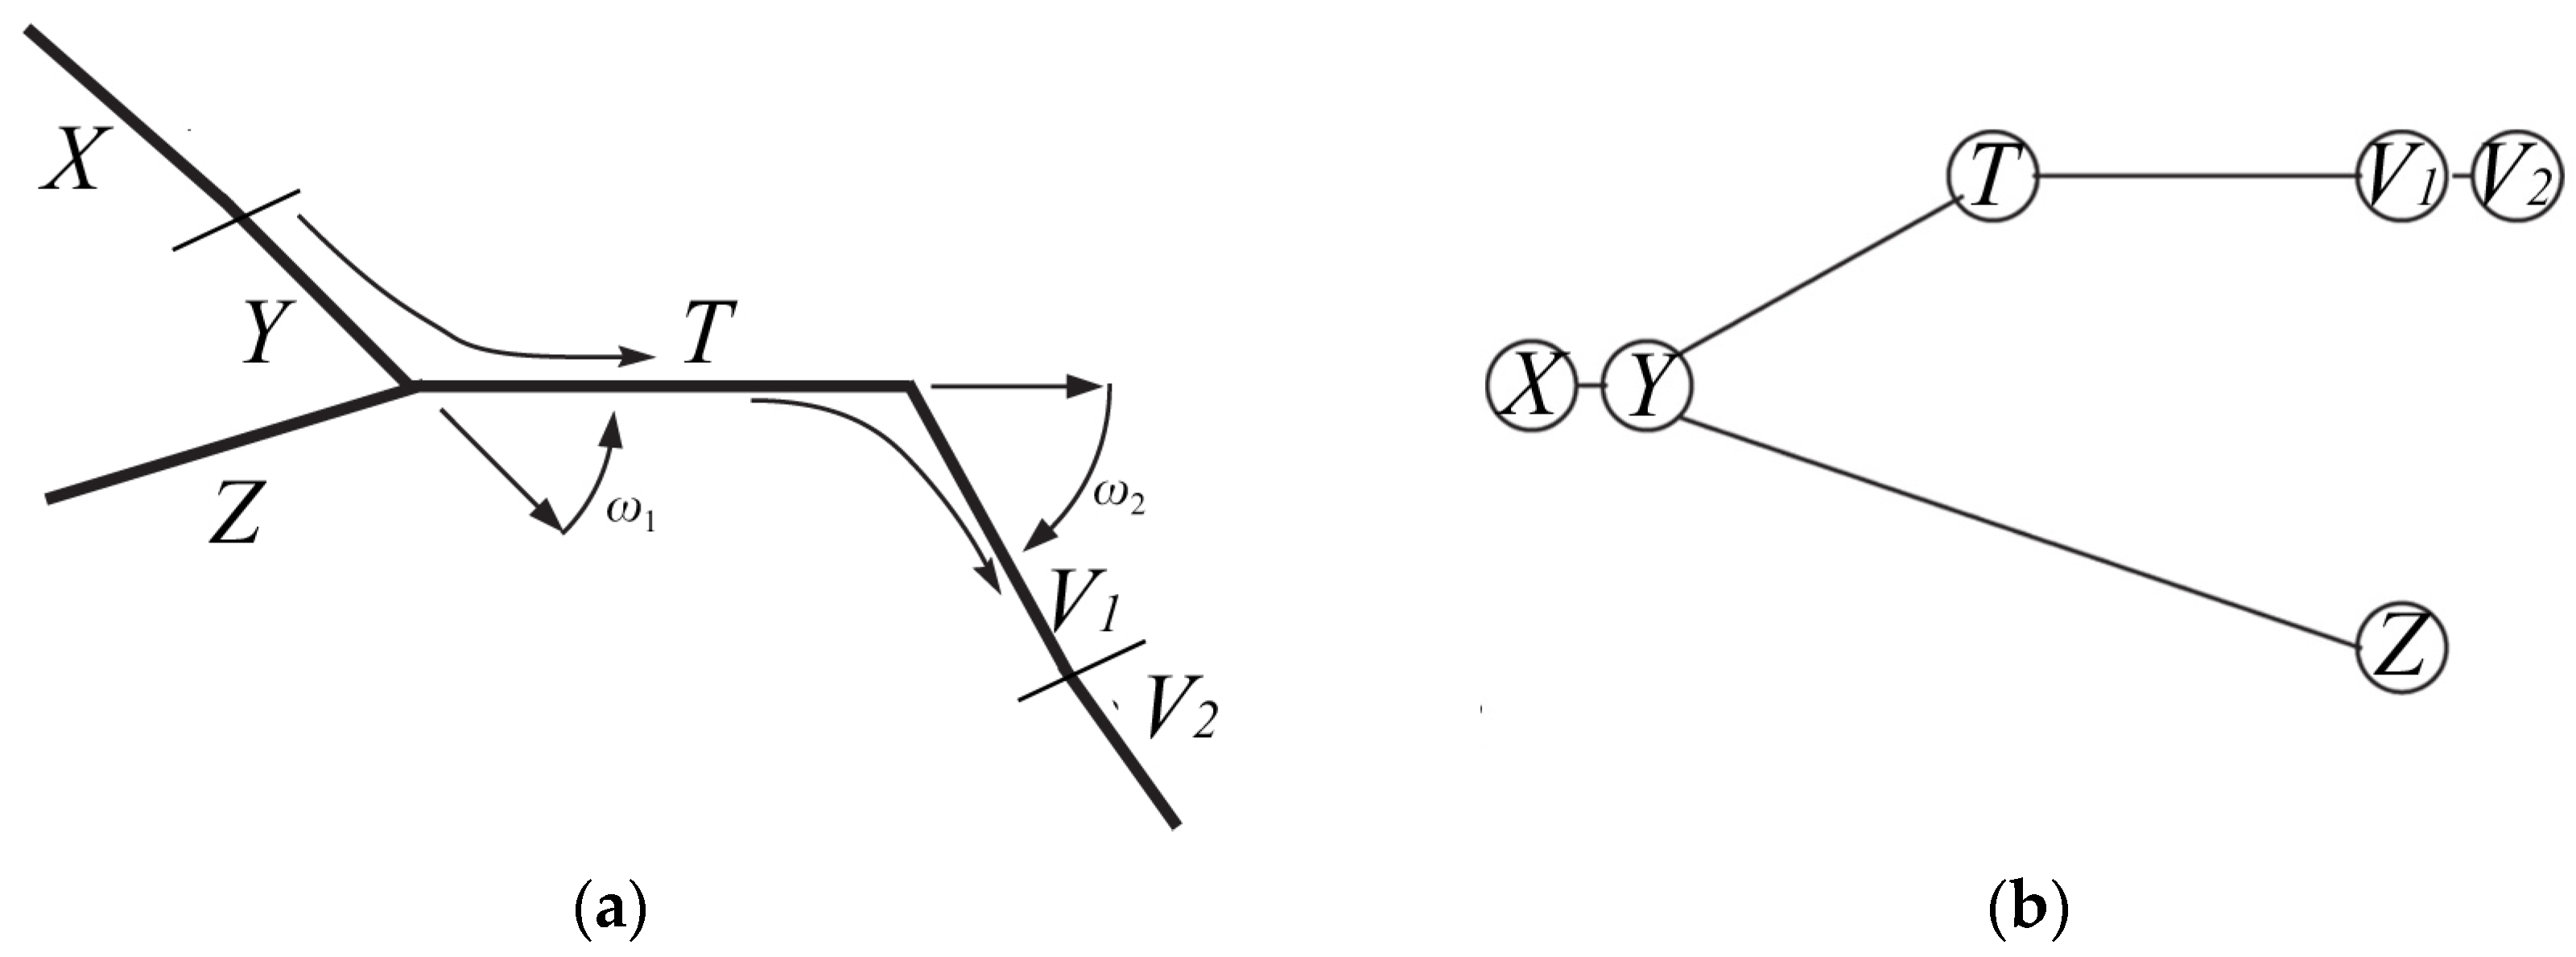
As one of the basic analysis of space syntax method, Angular Segment Analysis (ASA) is used to compensate the need for geometric information [39,40,41]. ASA calculates these measurements by applying values weighted between 0 “no turn” to 2 “180_ turn” by the turning angle from one segment to another [42]. Figure 3 shows the street network and corrected graph example of a part of the segment analysis symbolized by Turner [41].
This study applied angular segment analysis based on the metric radius type. The metric description of distance shows a structure of the shortest paths for integration and choice [43]. In the space syntax method, the most important factor determining the mobility in the area is the integration value [44]. Studies showed that there is a relationship between movement and the integration value [16,45,46,47]. Integration maps are important to understand how often public spaces are used and describe how both vehicle and pedestrian movements work within the urban system [48]. The value of the integration line is defined as the shortest path between one line in the segment or axial map and others in the network [48]. The integration value is calculated by averaging the changes in direction required to reach from one place to another, and how much this line is used in the system. To find the number of nodes in a radius to be analyzed, we look at the integration value. The formula for calculating the integration value is as follows [49]:
Ix = NC2/TDx (Ix: integration value of space x, NC: node counts, (TDx): total depth- the depths by each of the shortest paths between one segment and all others in a street network).
Integration is one of the important measures in space syntax, known as “closeness”. The formula calculates how likely one is to pass through a street and how easy it is to get to a street [50]. The use of the segment length and the metric radius contributes to the solution of the edge effect problem from the classic axial analyses with a radius n [51]. The global integration value at radius n was calculated to ensure that all segments are reached by using pedestrian and vehicle axes in the entire urban system. The global integration is an indicator of spatial accessibility [50]. Global integration value (R = n) defines the connection intensity of a node with all the other nodes in the system [52].
Choice value indicates the degree to which a line placed on the network’s shortest paths from one line to another [24]. The choice value of a segment is calculated by substituting the shortest paths with paths with the lowest angular cost for each potential origin and destination pair of the given segment [41]. It sets a route for how a person can get from one place to another. Choice is calculated by counting the number of times each street segment falls on the least angular change path between all pairs of segments within a selected distance in angular segment analysis [16].
Integration indicates the probability of a street segment being the destination of a route, while choice assesses the potential of movements passing through a segment [49]. In order to provide a better understanding of the syntactic properties of the measures between cities of different sizes, Hillier, Yang and Turner [53] proposed the standardization of two of the main measures of the Space Syntax: the Integration (Normalized Angular Integration-NAIN) and the Choice (Normalized Angular Choice-NACH). The values NAIN and NACH are calculated with formulas. The formulas for integration and choice values are presented in Table 1 [53].
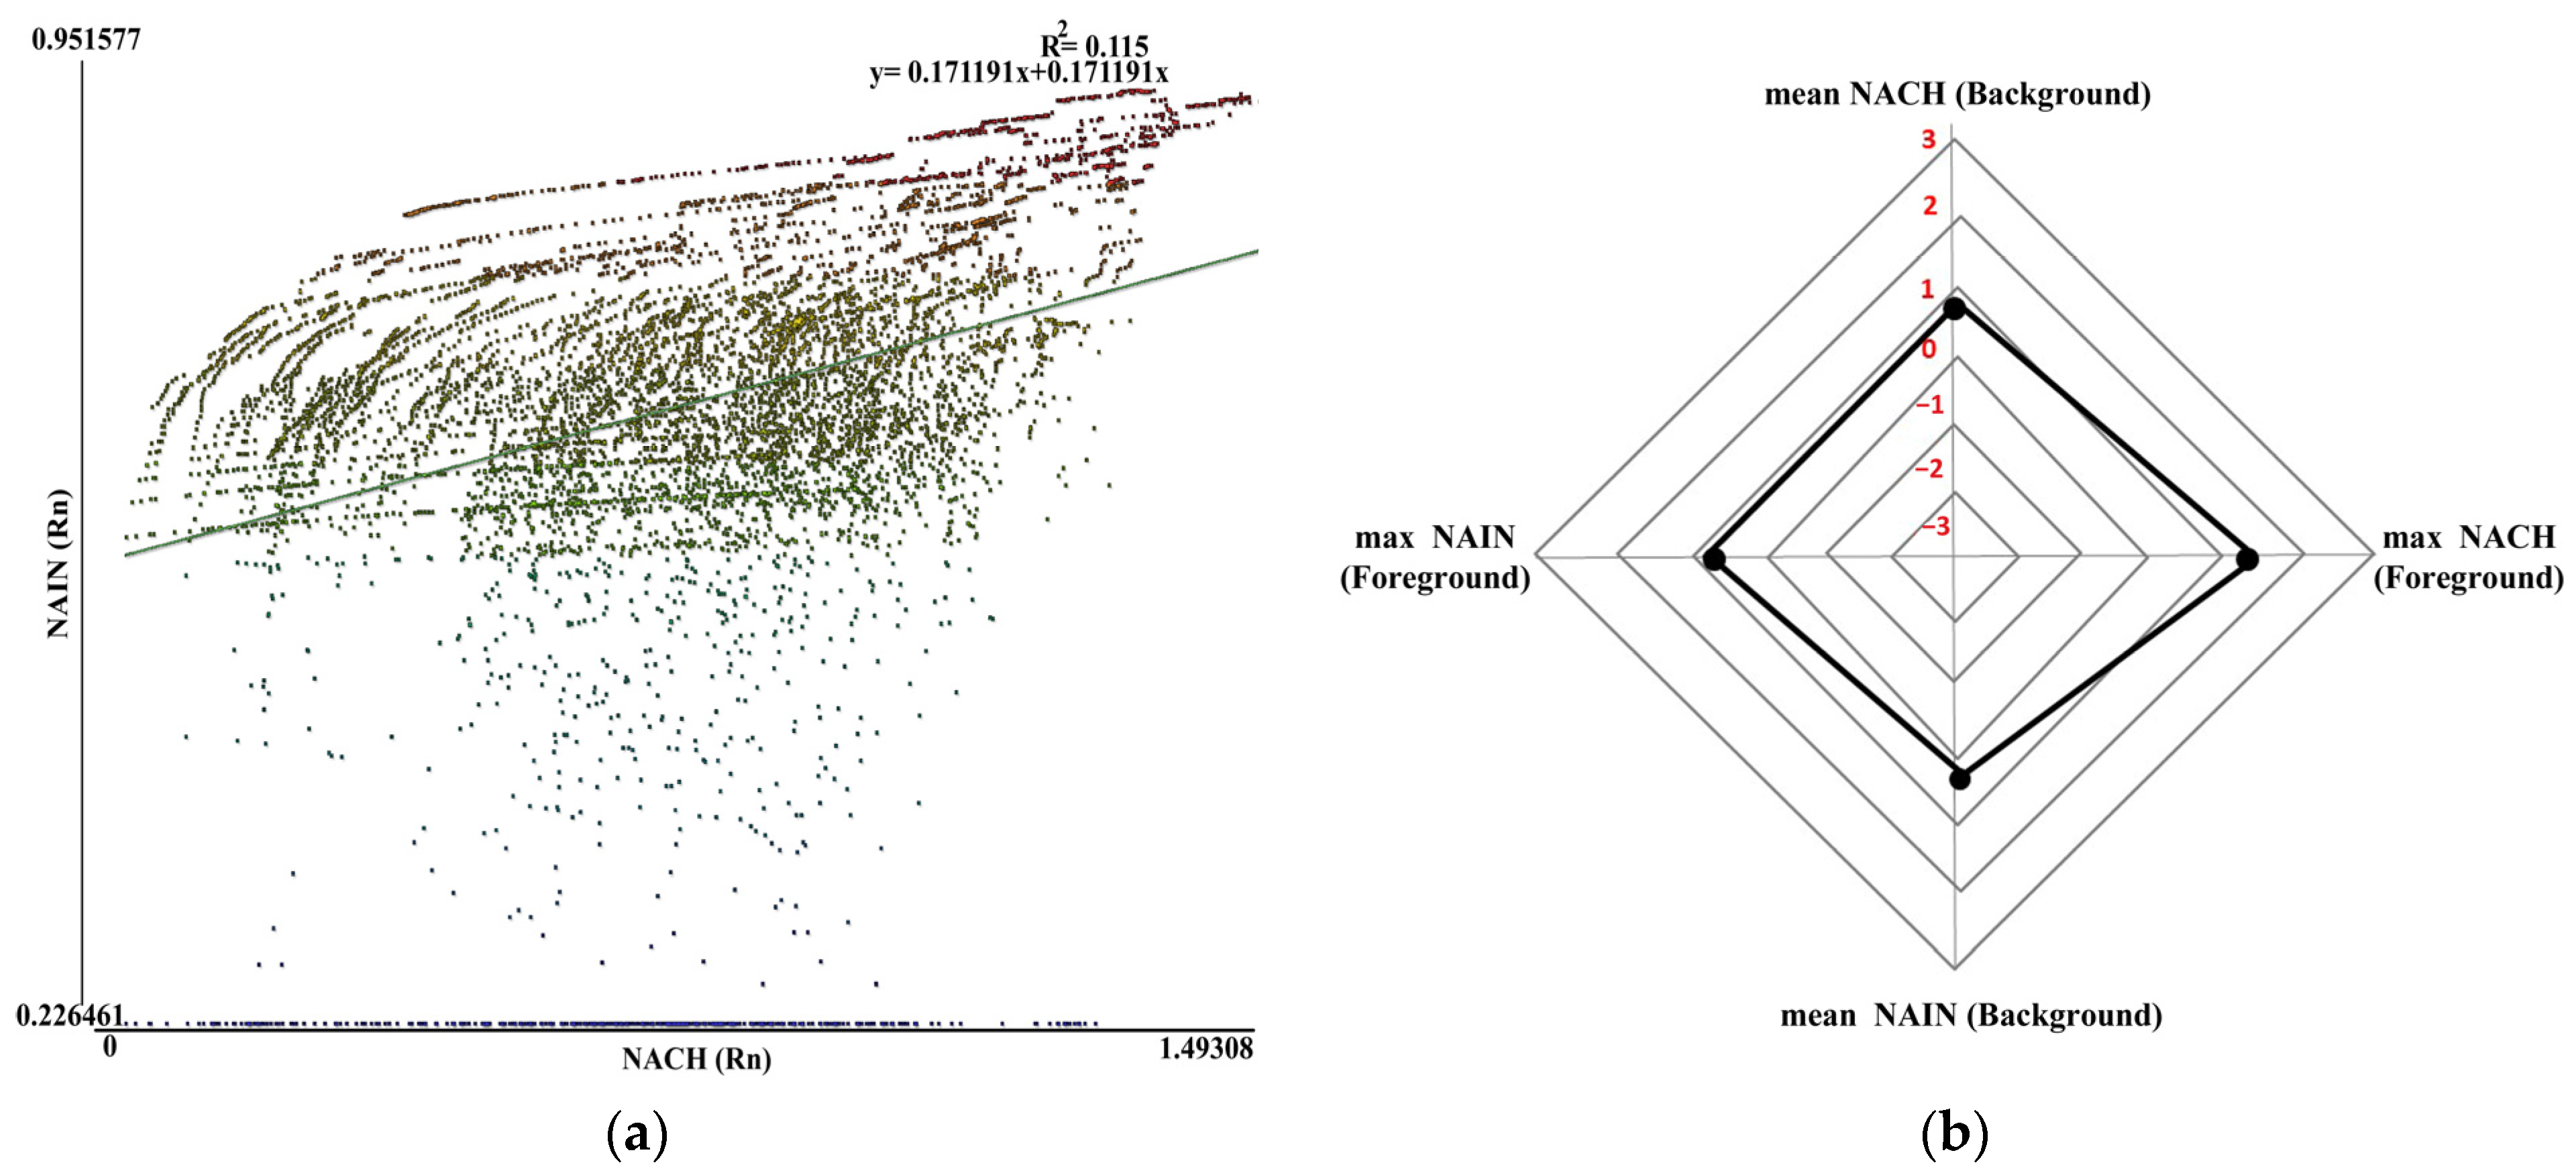
According to Hillier et al. [23]; “The correlation between degree of the global state measure (integration) and global dynamic measure (choice) variables will indicate the degree to which the accessibility of a space as a destination from all others is a reliable guide to its likely popularity as a space to be passed through on shortest routes from all points to all other points in the layout”. The correlation between choice and integration presents accessibility, which means spaces that are likely to be the desired destination have also higher movement potentiality [54]. In order to measure accessibility, the study analyzed the correlation between Integration and Choice (INCH). A Spatial Accessibility measure, the INCH is an expression of the potential for human movement within urban spaces, resulting from the combination of two measures of centrality, NAIN and NACH [16]. NAIN and NACH provide us a better understanding of the spatial morphology of cities [53]. The maximum/mean values of NAIN and NACH describe characteristics of street networks to understand urban spatial structure from star models. The vertical points are the mean NACH (top) and mean NAIN (bottom), and the left and right points on the horizontal axis are their maximum NACH (right) and maximum NAIN (left) at the star model. The mean/max NAIN show the ease of accessibility, while the mean/max NACH index shows the degree of structure in the system [53]. The mean values are related with the background network and the maximum values related with background network for both NAIN ana NACH. The mean values represent the to-and through-movement potential of the background network, while the maximum values represent to- and through-movement potentials of the foreground network [53]. These concepts and ‘Star Model’ can be used to discuss potential movement of street networks by using the Radius n value. Therefore, the study evaluated the accessibility street network in the city system at radius n value. The spatial accessibility of the street network is analyzed with respect to the correlation (R2) of NAIN and NACH. Scatter plots, which are known as a correlation matrix, are generated in the DepthmapX software.
The evaluation of the street network accessibility can be developed with the collaboration of the space syntax and geographic information system methods. A geographic information system (GIS) can be used to promote facility management and planning of public facility spaces [27]. The GIS technology makes it technically possible to integrate large amounts of data collected from different sources into a single georeferenced model for analysis [55]. The GIS provides data for the perception of the three-dimensional evaluation of the land use. The GIS and space syntax data can be used to evaluate the accessibility of street networks on a macro city form. The space syntax method theories have contributed to the capabilities of the GIS modelling offering a different perspective to planning and design studies. With the development of information technology, more new GIS tools and other new computational techniques are used in the spatial analysis of urban studies [56]. This new research practice provides a methodological reference by using a collaboration of the space syntax and GIS methods.

3.2. Methodology

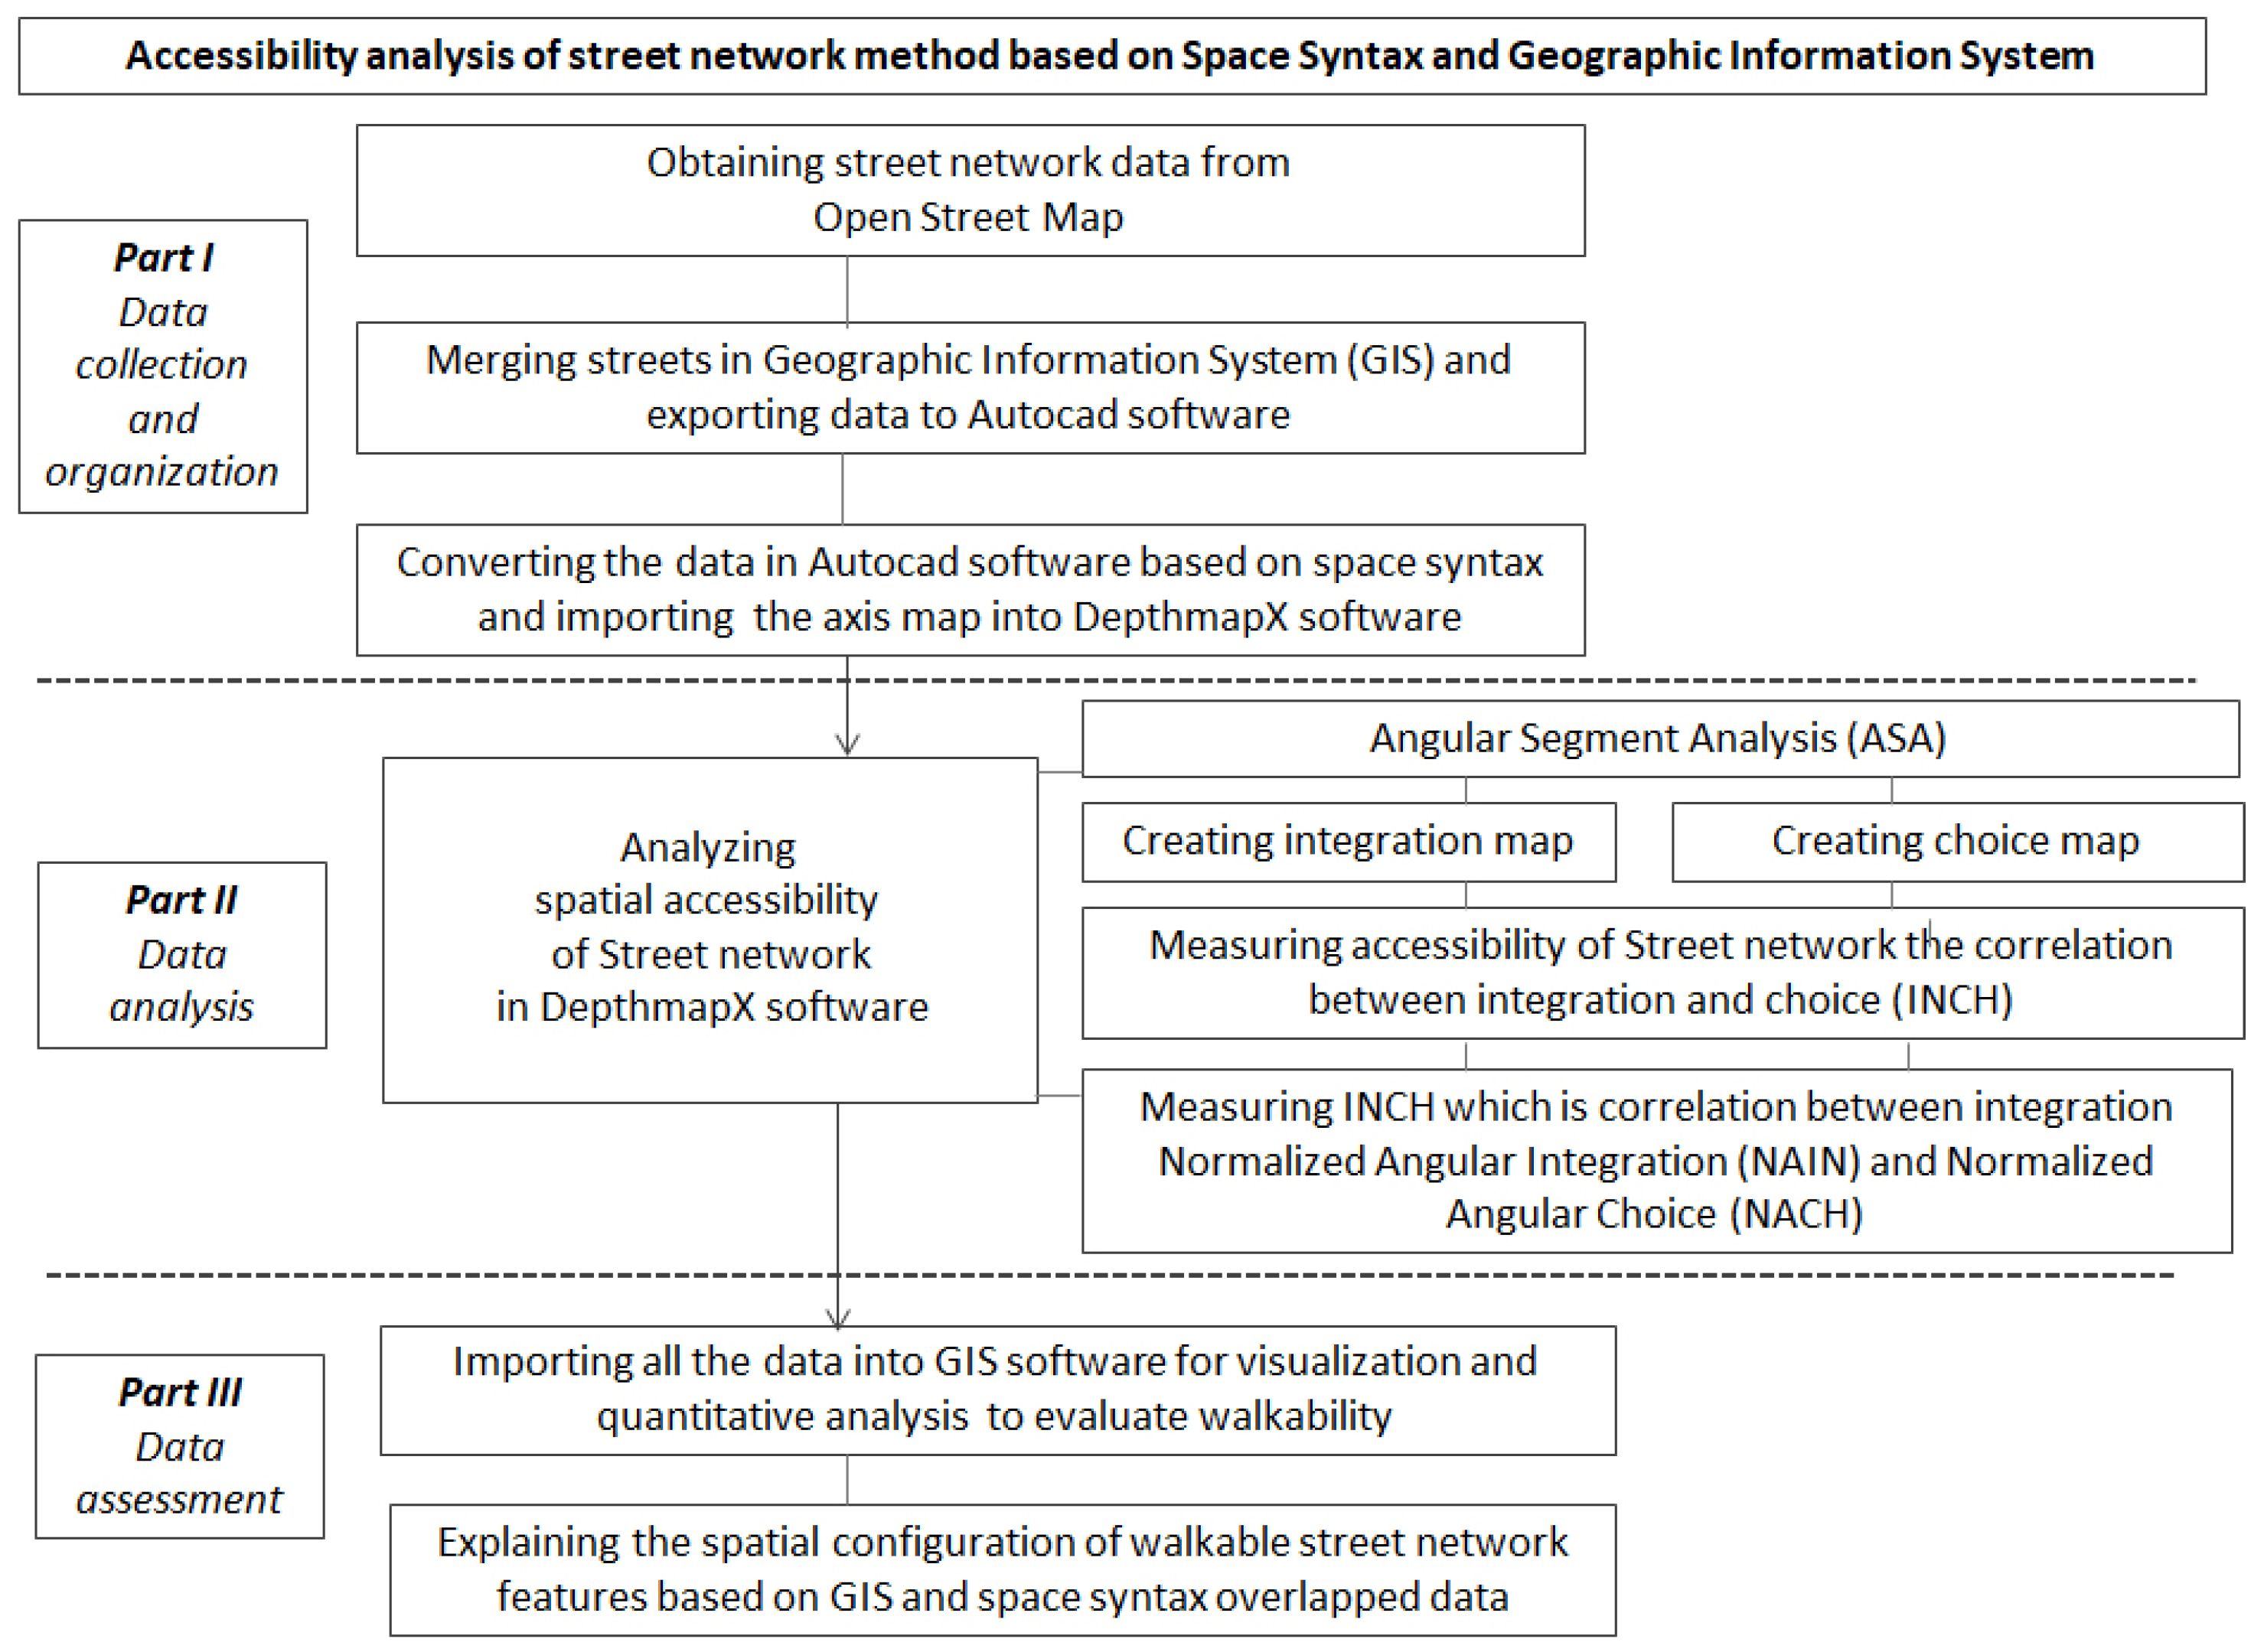
This study evaluates the spatial configuration of street networks in Çankırı city center using the space syntax and GIS methods for quantitative assessment. The 2022-year 1/5000 scale master plan was used to reveal the current state of the study area. In the first part of the study, street network data were downloaded through the Open Street Map Website (https://www.openstreetmap.org (accessed on 14 December 2022)) and used as input in a Geographic Information System (GIS) software. Street network data, which were used for pedestrians and vehicles, were imported into the ArcMap 10.5 software and merged for all streets. The two-dimensional street network was digitized and converted into ‘dxf’ format in the Autocad 2017 software, then it was imported into the DepthmapX 0.80 software.
In the second part of the study, the street network of the city was analyzed using the space syntax method. The accessibility of street networks was analyzed using DeptmapX for evaluating degree of spatial integration. Axial map was converted into the segment map. Segment map shows the length of each of all line. Angular Segment Analysis (ASA) was used in the study. Angular segment map was created in DepthmapX over the master plan of the study area and “integration” and “choice” values were examined. Angular segment analysis basically calculates the potential of movement of an axial segment map based on its configurational properties. It runs this evaluation from one segment to all other segments. As a result of Angular segment analysis, maps with integration and choice maps were created. The software classifies the analysis results from the highest level to the lowest level in five groups: red, orange, green, blue and purple. The correlation of integration and choice values gives accessibility. In order to evaluate the accessibility of street networks, the correlation between integration and choice (INCH) was calculated with NACH and NAIN formulas. The correlation of NACH and NAIN was examined on scatter plots and star model graphs. These analyses provided an understanding of the accessibility level of the street network at the macro level.
In the third part of the study, the land slope was analyzed by using a GIS-based methodology to examine the walkability of streets. The slope percentages of the streets were calculated using the GIS technique for the evaluation of pedestrian accessibility. The land slope was analyzed using the ArcMap 10.5 software over the obtained study area of raster data. Considering the accessibility standards in which pedestrians can move comfortably, slope groups were evaluated in 5 classes as 0–4, 4–7, 7–9, 9–12, >12 percent. In order to compare the values obtained as a result of the spatial syntax analysis and the results of the slope analysis in the GIS, a Likert scale classification was adapted to the study. All data were gathered in the GIS platform. A walkable street network was obtained from the intersection of high integration and low slope value. The characteristics of this accessible pedestrian movement model were examined and its contributions to urban walkability were discussed. The spatial characteristics of streets that provide walkability were assessed on the result map. The data processing flow chart is shown in Figure 4.

4. Results

4.1. Space Syntax Analysis

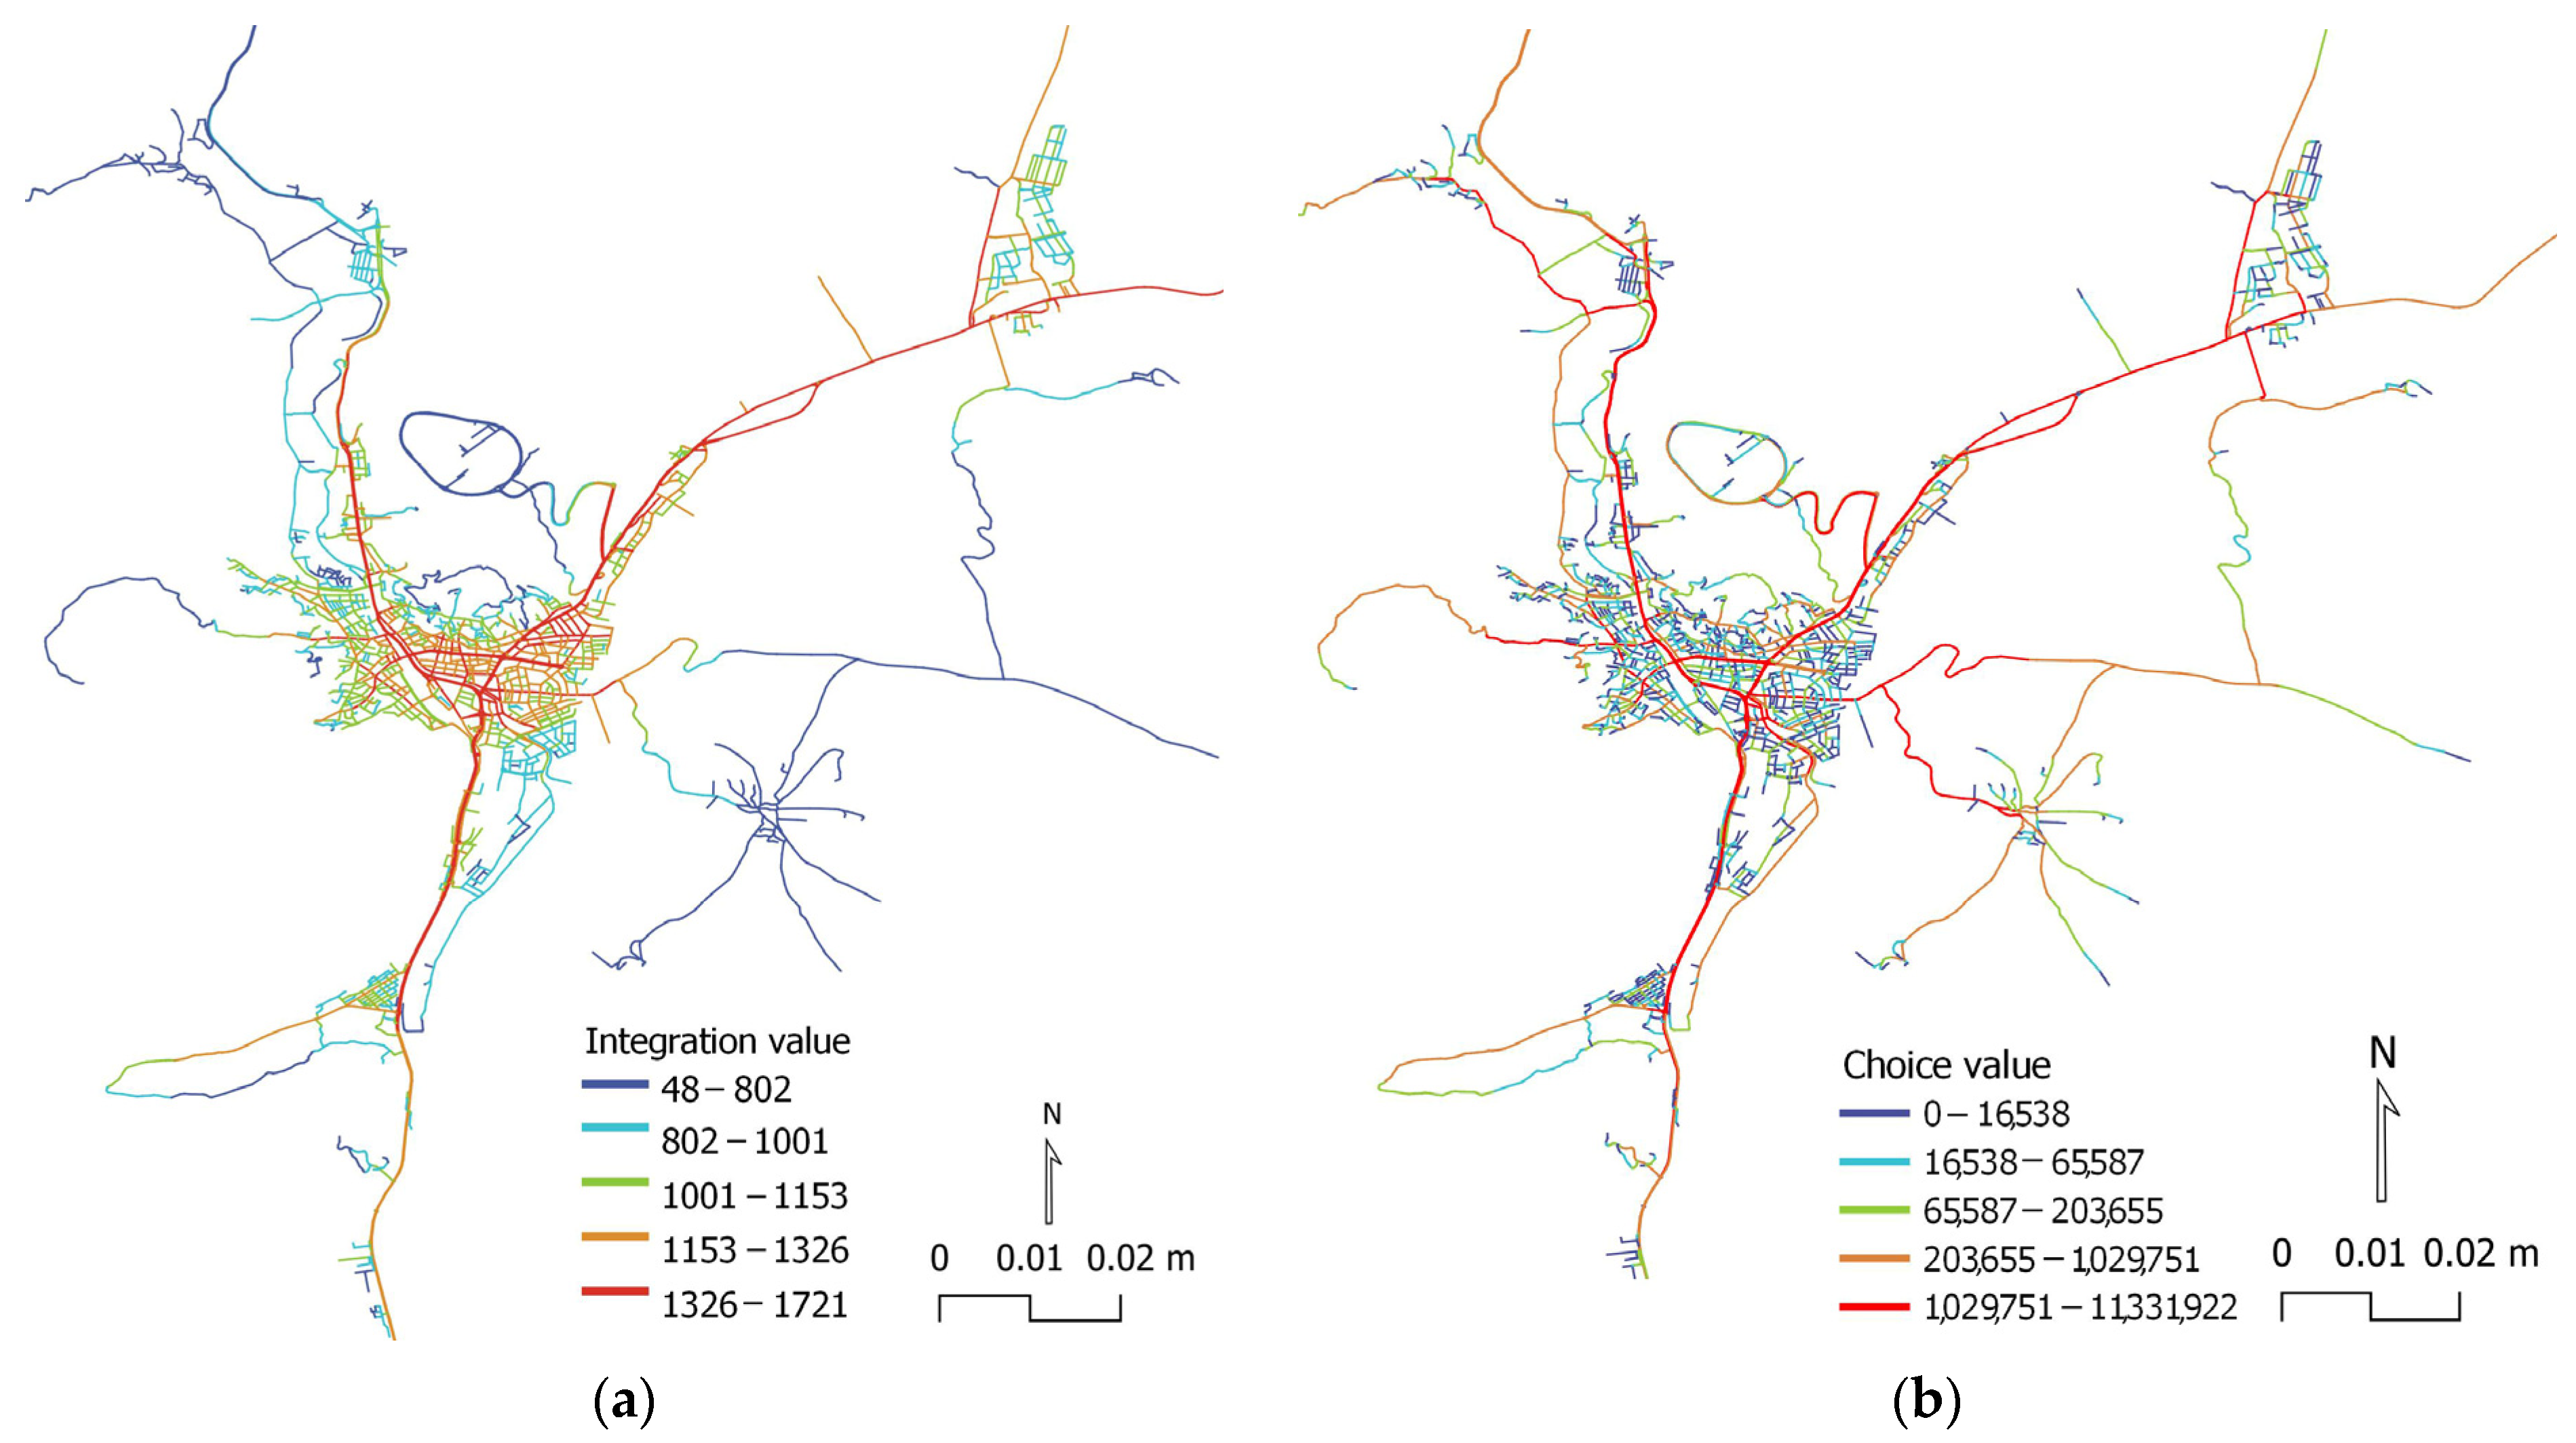
Integration and choice values were calculated by analyzing the metric segment map in the radius of Rn. It is seen that these values are located in the city center where public spaces are concentrated. The integration value is the highest 1721, the average 1064 and the lowest 48. The choice value is the highest 11,331,922, the average 945,561, and the lowest 0. There are 7916 line strings and 7884 node counts in the study area. The maps created according to the integration and choice values of the street network of the city of Çankırı are given in Figure 5.
According to the maps above, the integration values are high in the city center of Çankırı. On the city’s primary routes such as boulevards, both integration and choice values are high in red color. It was observed that the axes with high integration value were primary and secondary routes, while the axes with low integration value were tertiary, service, crossing, track way, etc. The main roads have very high level of accessibility in residential areas. Ankara, Kastamonu streets and Yapraklı, Org. İsmail Hakkı Karadayı, Ahmet Talat Onay and Atatürk Boulevard are the axes with red color, where the choice and integration values are at the highest level. Streets with a high integration value indicate main streets with higher density of use and activity areas in the city.
As mentioned before, the correlation integration and choice values give the accessibility level of a street network. In order to understand the accessibility level in Çankırı city, the correlation of NACH (Rn) and NAIN (Rn) were examined with scatter plots, also known as a correlation matrix showing the intelligence value (R2) in the DepthmapX program Scatter. It was determined as a result of the formula given as y = ax + b with the coefficient and the constant b. The range of intelligence value R2 is 0–0.5, showing that the spatial identifiability is weak in general [57]. The study revealed that the R2 value is 0.115. Although there is a positive relationship between choice and integration, it is seen that the accessibility value is low. The plot included in Figure 6a shows that the city is with a low degree of spatial accessibility. There is a weak correlation that defines a low use of space and movement of people in the city. The Star Model graph for Çankırı city is shown in Figure 6b.
The calculated values of the NAIN and NACH variables are given in Table 2. They represent the NAIN and NACH values of maximum, minimum, mean and standard deviation.
The values of NACH and NAIN can be scaled from −3 to +3 for comparison in a star model graph. The mean/max NAIN, which shows the ease of access, and mean/max NACH, which shows the degree of structure system, are not high level in the graph. The mean NACH index is the degree to which the background network forms a continuous grid with direct connections rather than being broken up into discontinuous sub-areas; whereas the max NACH is the degree to which the foreground grid structures the system by deformations and interruptions of the grid [51]. The system is not highly integrated in the background network and it is not strongly structured in the foreground network.

4.2. GIS Analysis

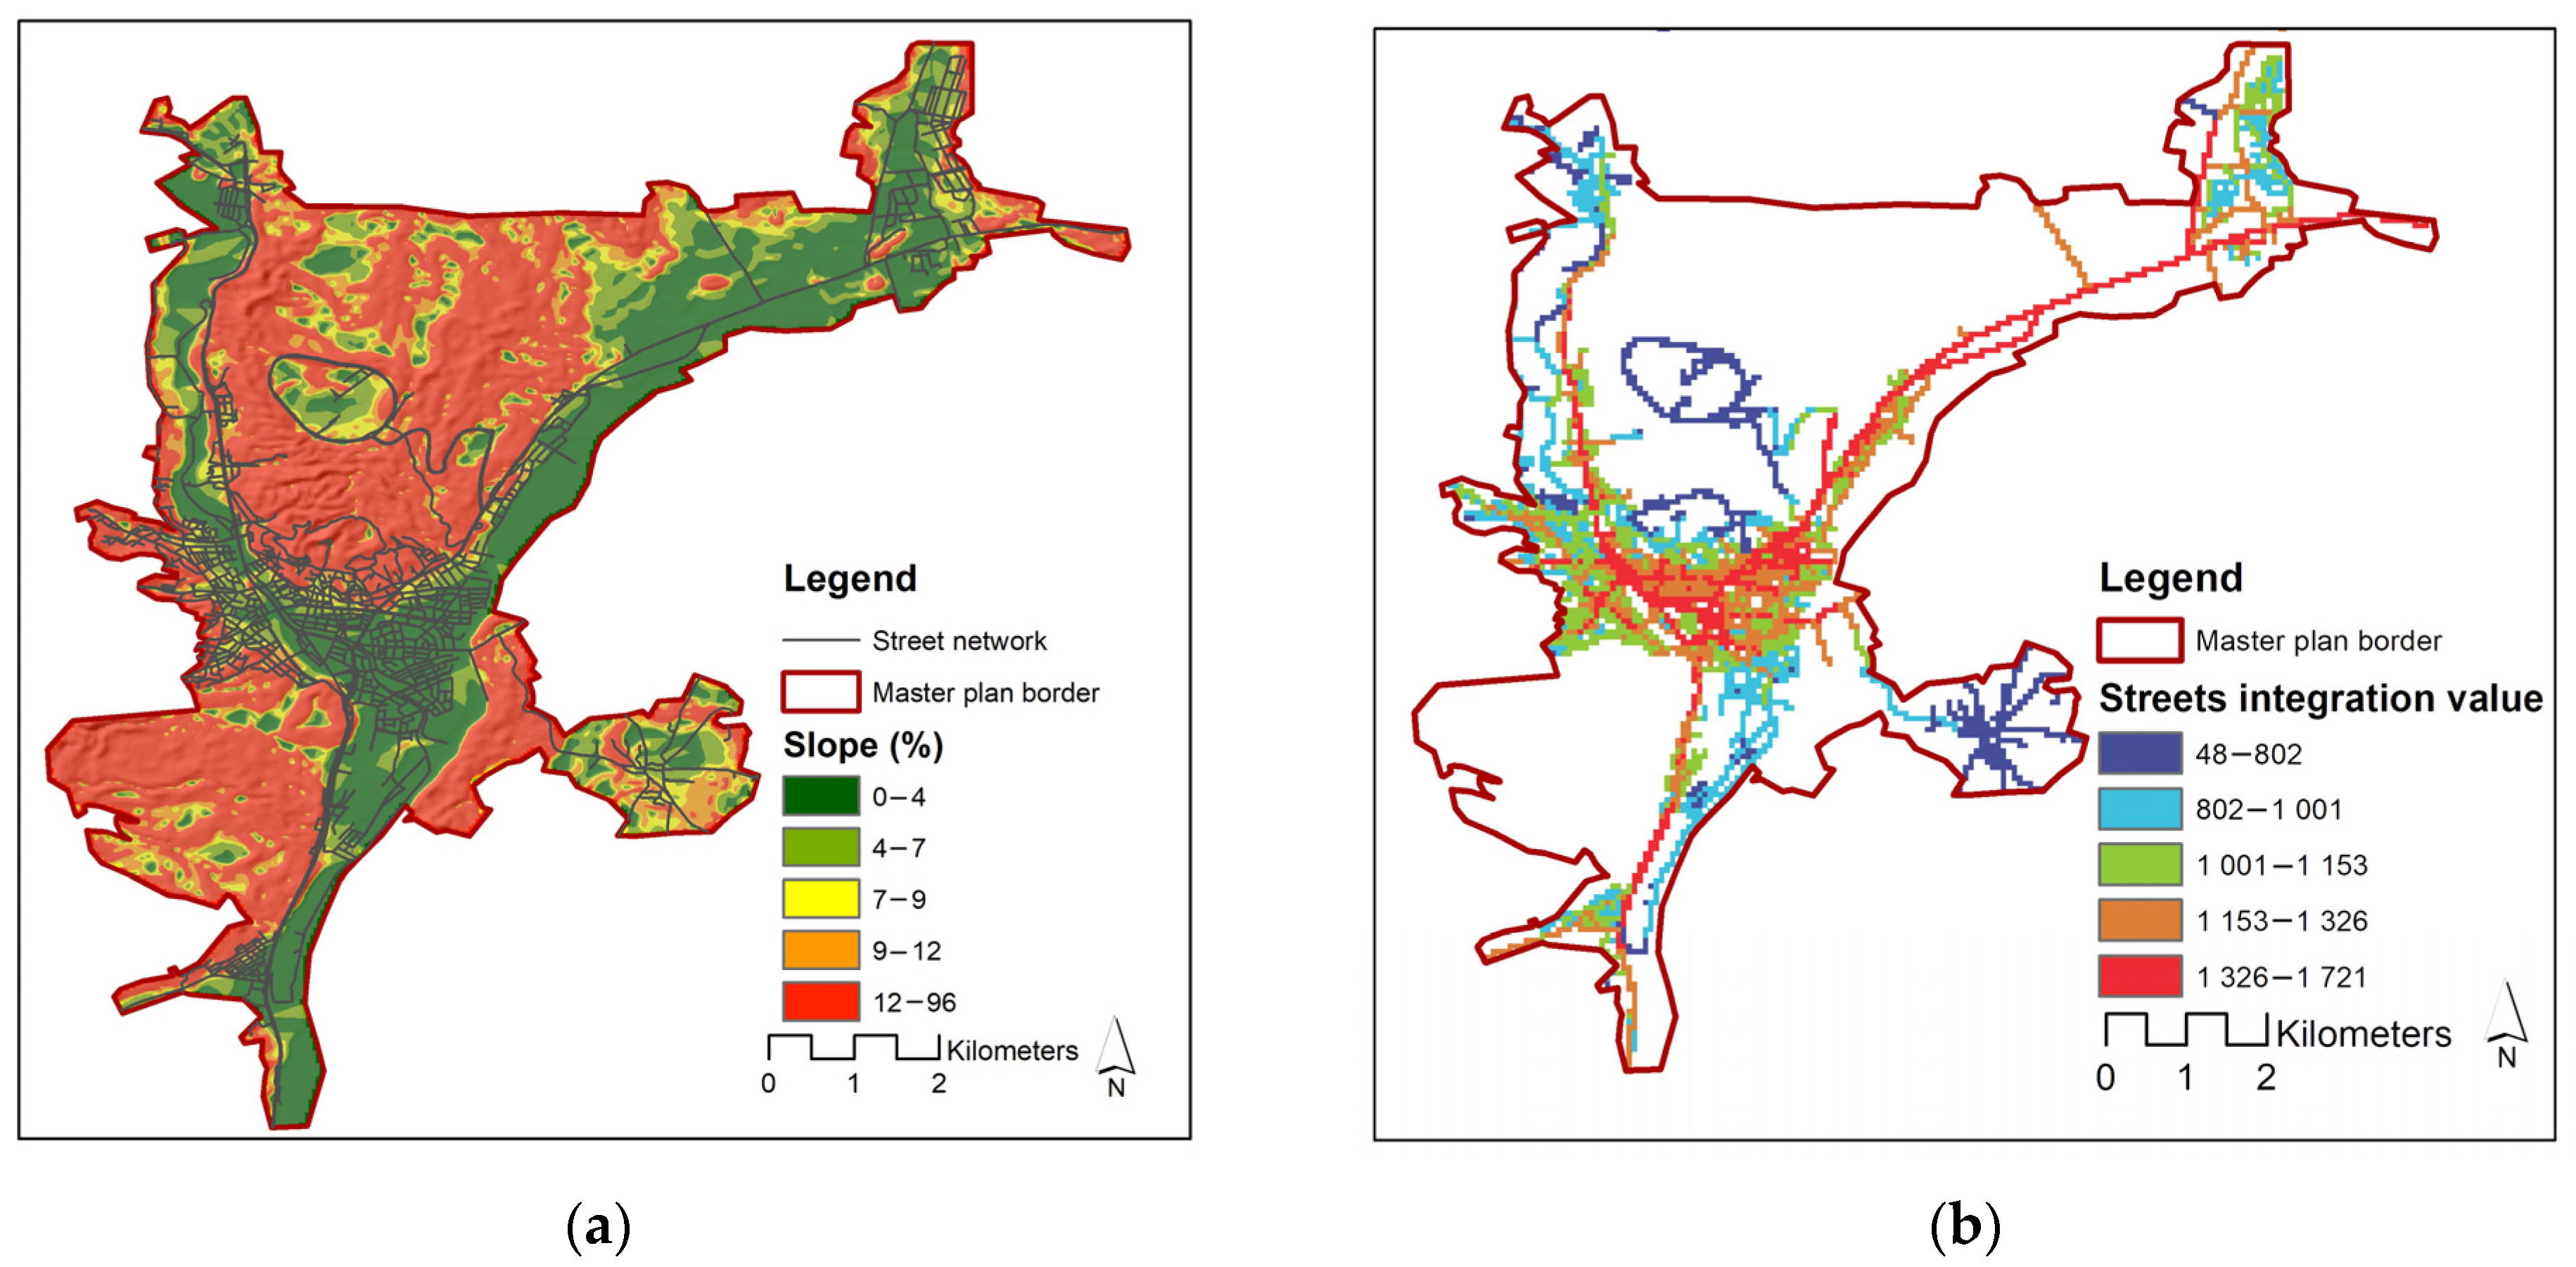
The land slope was analyzed using elevation data for the city of Çankırı. The slope is given as a percentage by calculating the angle that the topographic surfaces make with the horizontal surface. The data were analyzed, and the slope groups were classified in the ArcGIS software. One of the most important factors affecting the accessibility and walkability of roads is slope. To ensure safe use on walkways such as ramps and pedestrian crossings, slope standards for pedestrian walkability must be complied with. It is stated that if the safe slope percentage on the ramp is less than 7%, it is an accessible pathway, up to 10% can be accessed with assistance, and more than 10% is a hazard in terms of access [58]. According to the accessibility standards of the Provincial Directorate of Environment, Urbanization and Climate Change in Turkey [59], accessibility is comfortable if the slope is less than 4%, suitable if it is 5%, assistance is required if it is 8%, and hazardous if it is more than 12%. Considering these standards, slope groups were classified into five groups as 0–4, 4–7, 7–9, 10–12 and above 12. Slope values and integration values adapted to a Likert scale from the accessibility assessment chart have accessibility levels ranging from very low (1) to very high (5) in different colors (Table 3).
The accessibility of the street network and land slope were analyzed based on this chart. According to the classification of the slope groups, the slope analysis of Çankırı city with the GIS is presented in Figure 7a and the integration map of street network is presented in Figure 7b.
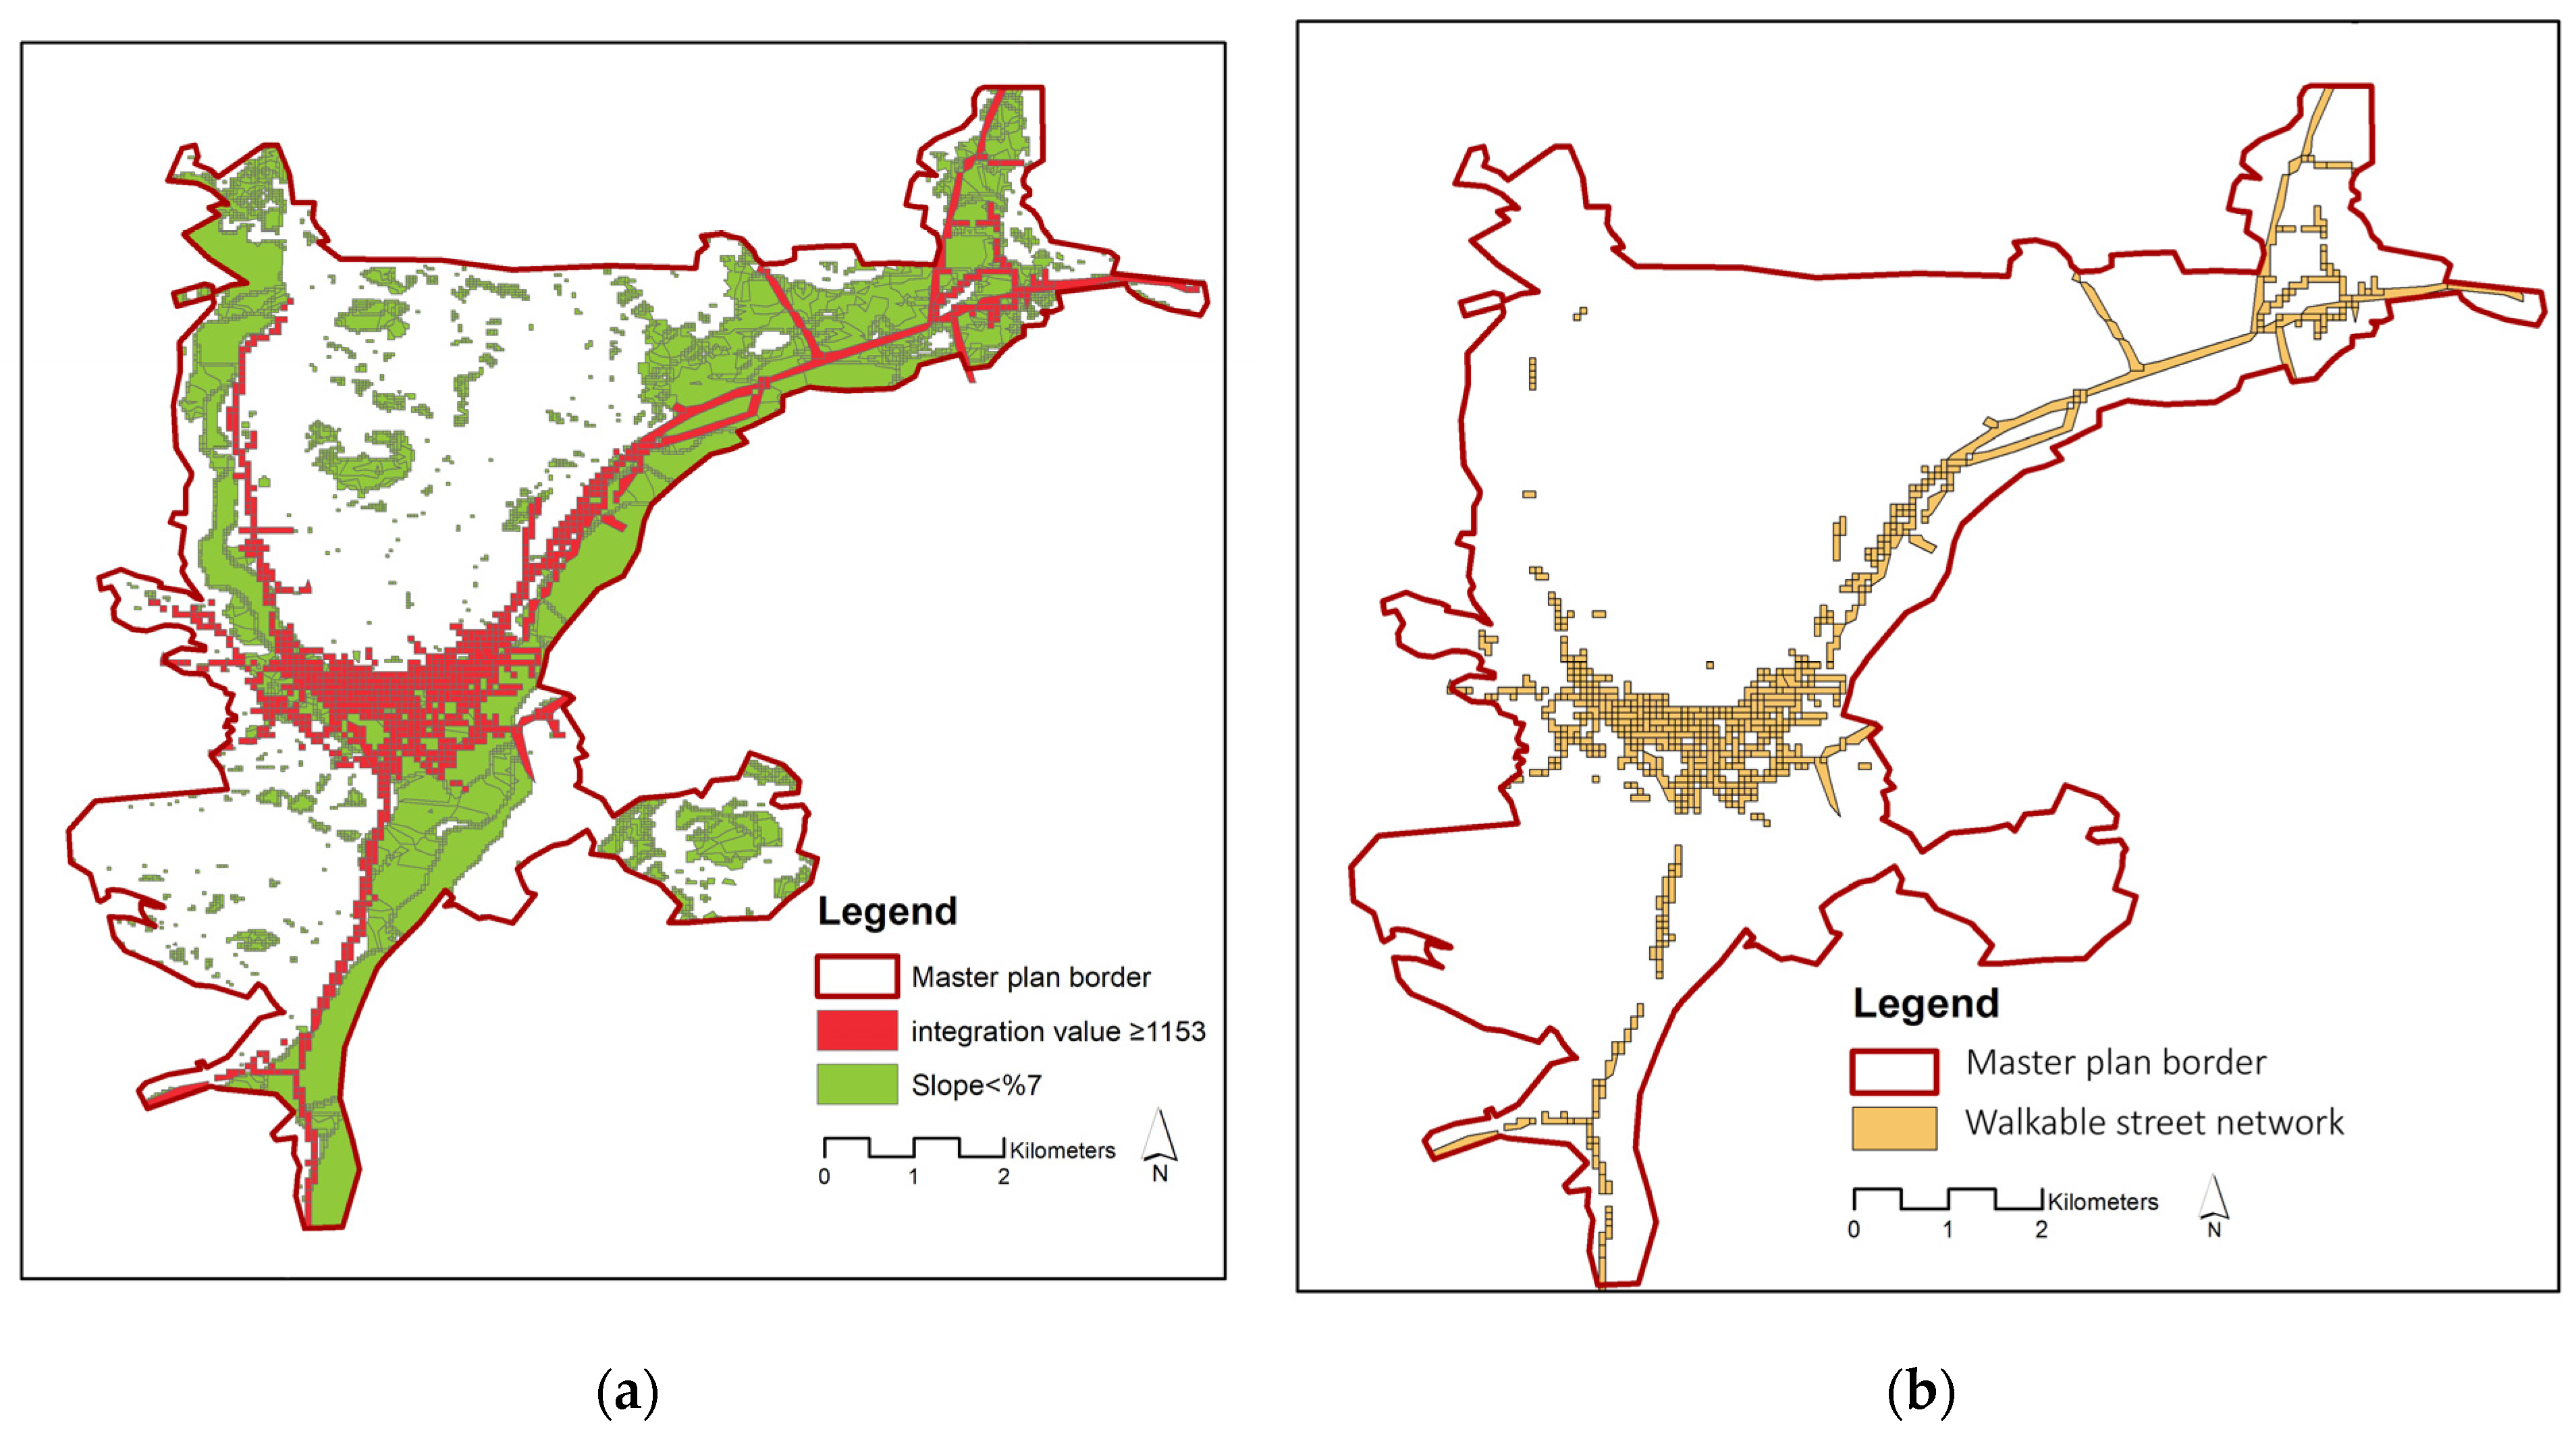
According to the slope analysis, the city center is at a low value with 0–7% slope. In the integration map of the streets, Ankara, Kastamonu streets, Yapraklı Boulevard, leading to the city from the city center to three separate axes, have a high integration value in the range of 1326–1721 with red color. The long and continuous streets in the city have high accessibility levels. In the other stage of the study, it was investigated whether the axes with high integration value (greater than 1153) in the area also have low slope grade (less than 7%). As a result of this evaluation, a map where the streets with an integration value greater than 1153 and a slope percentage less than 7% were overlaid (Figure 8a). The overlaid areas of the regions with high (4) and very high (5) accessibility levels in slope percentages were identified and are shown on the map in Figure 8b.
According to the results of the space syntax analysis, the street network, which has an integration value greater than 1153 or 4 (high) and 5 (very high) levels of accessibility level, constitutes 14.2% of the study area with 587 hectares. On the other hand, the land slope analysis results of the GIS, the streets, which provide easy access with less than 7% slope in the study area, is 1033 hectares, constituting 25% of the study area. When the space syntax and GIS data are overlaid, the walkable street network is 405 hectares in the master plan of the study area. The walkable street pattern is 9.8% of the city’s master plan. While the results obtained from the space syntax analysis were 14.2%, the accessible street network decreased to 9.8% by integrating the space syntax into the GIS results. When the space syntax and GIS data were overlaid, there was a 4.4% decrease in the accessible area. The results of the walkability assessment with the space syntax and GIS techniques produce more verifying data. The table of percentages and areas of walkable street network in the study area are shown in Figure 9a, and the graph of walkability assessment on a Likert scale is shown in Figure 9b.
In the assessment of street networks, it is seen that Kastamonu Avenue, Ankara Avenue Yapraklı Street and Org İsmail Hakkı Karadayı, Ahmet Talat Onay and Atatürk Boulevard are accessible. Yapraklı Boulevard has high levels of accessibility in terms of both integration and slope values. By calculating the integration and slope value, the urban form is analyzed, and urban mobility can be predicted. The axis extending to the northeast of the city also gives an idea about the development of the city. The low percentage of slope areas in the city have been effective in the formation of settlements. The city center provides high topological accessibility, as the maximum slope for people to walk is 6%. The areas on the common street texture obtained from the spatial syntax and GIS results are also shown in the pedestrian movement model. It has been observed that accessibility is also restricted in the city directions on the streets where the slope increases. In order for the urban structure to function well, the activity centers must be located on the accessible street pattern. Defining the accessible pedestrian movement model is an important factor for urban development. Based on the hypothesis that pedestrian mobility has an intense relationship with urban activity areas, a combined space syntax and GIS analysis shows areas where there is a relationship between movement and land slope. Pedestrian movement pattern offers an idea about how intensively the space is used. The analyses indicate a contrary relationship between pedestrian mobility and land slope in the city. In addition, the fact that Çankırı is surrounded by mountains is an important obstacle to the development of the city. In order to ensure the growth of the city, it is necessary to develop a pedestrian movement model in regions where the land slope is suitable.

5. Discussion

This research is about the assessment of walkability at the macro scale in the street network that forms the city form. There are many studies showing the effect of urban morphology on walking [41,60,61,62]. Walkability is a wider and more complex concept, involving more factors rather than those assessed in this study. The factors in assessing walkability on a macro scale are transportation system characteristics and land development variables [11]. Ak [8] emphasized that transportation systems indicate the street network of a city and its design, and the main value of transportation system is accessibility. Potentially, the study area analysis provides a macro level analysis of street networks while the walkability is a complex concept that is reliant on other factors such as zoning, use, attraction, open frontages, quality of sidewalks etc. High connectivity of the network provides high levels of accessibility and walkability [63].
A walkable street network was evaluated according to the integration and choice value with the space syntax method and the land slope values obtained from the GIS method in this study. It was seen that there are places where the data obtained in the slope analysis and the maps produced by the space syntax analysis method matched. The accessible areas where the data obtained by using the space syntax and the GIS method matched, are lower than the data obtained using the space syntax method. When more criteria (integration and slope) are taken into account, we have a smaller accessible area than the one obtained considering a single criterion (integration). However, this study method overcomes the limitations of other methods in terms of understanding the land in three dimensions. The space syntax method evaluates the accessibility of streets on a two-dimensional plan. Calculating the intersection points of the data obtained from both methods is also important in terms of producing more accurate results. By developing assessment chart in a Likert scale that evaluates the accessibility of the street network and the data obtained from the GIS and space syntax method in the same platform, the study proposes evaluating methods. However, it should be developed with different methods consisting of multi-source information and quantitative analysis. On the other hand, the findings show that the common results of integration and slope analysis give correct results in terms of pedestrian accessibility. The study revealed that the factors that determine the pedestrian movement model are not only dependent on the integration and choice values of the streets but also affected by the topography. Özbil et al. [46] revealed that the main factor affecting the pedestrian distribution is the angular level of the street network. This study showed that the main factor affecting pedestrian movement model is the angular level of the street network as well as the land slope values. The results of the study showed that the accessibility features of the street network can be determined, and the urban form can be developed by using this method model. The correlation of integration and choice values (INCH) showed that the accessibility level of street network is low. Calculating the choice value in the study not only allowed us to understand the accessibility level, but also helped us to make comparisons with the walkable street area. The study revealed that the accessibility level of the street texture is low, and the walkable street area percentage is low as well. Integration and choice with radius n are not the best indicators for walkability analysis in the selected case. There is a need to validate the comparison of syntactic data with other available information that could be either directly or indirectly related to walkability. The use of radius n was the reason for choosing a small city but, if angular segment analysis with local metric radius is used, then even walkability of a big city can be successfully examined. Even though small cities are more suitable for the evaluation of urban walkability, the method should be applied to bigger cities as it has more actuality.
The assessment of accessibility levels also provides insights into improving city accessibility in the future. The fact that there is a positive and significant relationship between the choice and integration values showing that the accessibility of the city is open to development. If these values work well in one city, they may not automatically apply to situations. Additional validation of the model would be needed as the predictability of a city may differ from case to case. On the other hand, determining the potential level of accessibility provides an idea for developing suggestions for proposals. It can also contribute to determining the change before and after a design work that will be carried out in the city in the future.
The space syntax approach provides an alternative understanding to examine the relationship between pedestrian movement and spatial configuration through the analysis of how spaces are integrated or connected within an urban space [64]. Bielik et al. [65] measured how street network configuration affects the way people move in space in a case study in Weimar, Germany, and they found that street network configuration alone is significant and is the strongest predictor of accessibility to walking attractors. In their Lanzhou, China case study, Li et al. [66] explored the influence of street network accessibility and its structure on spatial vitality via space syntax and hotspot analysis. When we look at the development of methods examining the accessibility of the street network, we see that space syntax, the GIS and quantitative analyses (regression, hotspot etc.) are evaluated together. Unlike other studies, this study integrated the GIS with space syntax to provide multisource data support but it needs visual and quantitative analysis of walkability-related spatial information data. To define an indicator for walkability that integrates space syntax in the macro scale, land use and transportation system parameters could use a weighted index approach based on their relative importance in the modelling process. The space syntax analysis can be used as a component of the index, providing insight into the spatial configuration of the area and how it affects pedestrian movement and accessibility. The space syntax method was designed to understand the potential of the settlement layout to bring people together [67]. Areas where people come together in the cities will be a guide in the choice of the land uses in open spaces in the development of city plans. The development of the transportation system such as the creation of public transport stops or bicycle paths in the streets and practices that will reduce vehicle traffic will benefit the city. The research method can evaluate the effectiveness of different interventions designed to improve walkability and cycling. It can test practices from other cities or regions that have successfully implemented walkability and cycling initiatives. The research findings can also contribute further to walkability and cycling planning by engaging stakeholders and providing evidence-based recommendations for planners. It is also important to integrate technologies in street network design. Developing street walkability will create livable spaces in cities. It is necessary to create an inclusive public space with high accessibility values in street patterns. New concepts of urban planning have been developing 15-minute city models, which allow city dwellers to access their vital needs in about a quarter of an hour by walking, cycling, using public transport or a shared micro-mobility service [68]. Carra et al. [69] indicated that a space-time and GIS-based methodology, which was applied to evaluate walkability scenarios in public open spaces, underlines how urban design produces different spatial–temporal effects on pedestrian accessibility and proximity connection in 15 min. Since the 15-minute city model is one of the priorities of urban planning and sustainable urban development, the study is of high actuality. By using a collaboration of these methods, a 15 min city model should be designed in cities. Evaluating street accessibility at the neighborhood scale in big cities and developing design guides can contribute to urban sustainability as another option.

6. Conclusions

This study found that streets with low slope and high integration values were the most accessible in the walkability assessment with a combination of the space syntax and GIS methods. The areas where geographical and topological measurements of the street have high level of accessibility in Çankırı city. It has been revealed that the longest, continuous and main roads located in the study areas with low slope values have high accessibility. The spatial configuration variables of the pedestrian movement model give an idea about the urban mobility of the city. Increasing integration and choice values in the northeast of Çankırı city showed that the level of accessibility also increased in this direction. In this study, the relationship between spatial structure and functions is explained by combining the results of space syntax analysis and the data in the GIS. In addition, using ArcMap, the three-dimensional perception of the land and the potential for change of the street network were examined from OSM. It is seen that the space syntax method, which is an assessment tool in the creation of social and accessible spaces, remains only at the plan scale. Although it is seen that the space syntax results give correct results in many areas, the accessible areas decrease when they are integrated with the GIS method. It is thought that the combination of the GIS and the space syntax methods will guide many studies in the future. This method will also benefit urban studies in understanding the relationship between urban form and walkability. In order to obtain objective results other than observation or user opinions in identifying areas with high usage potential in cities, it is essential to evaluate the mathematical structure of the streets that shapes the urban form.
As a result, since the space syntax method provide us to find the areas with the most intensive use at the plan scale, it is seen that there is a need to associate it with the land slope, which allows three-dimensional evaluation. The inability to use multi-source information and quantitative analysis methods with the space syntax and GIS applications is the limitations of this research. The evaluation of the results of the two methods (GIS and space syntax) on the same program is a suggestion, while this method needs to be developed with quantitative and qualitative analyses in other studies. The use of different methods can effectively improve the systematicity and scientificity of the research, ensuring that urban space research is no longer limited to field research and qualitative analysis. Because of limitations of the study method that evaluates walkability in line with parameters of a small city, its scope should be expanded in future studies on the street network of bigger cities. The analytical data obtained contribute to foreseeing the possible effects of design proposals in cities, solving transportation problems or urban design guides produced by local governments.

Funding

This research received no external funding.

Data Availability Statement

The study did not report any data.

Conflicts of Interest

The author declares no conflict of interest.

References

  1. Barthelemy, M. From Paths to Blocks: New Measures for Street Patterns. Environ. Plan. B Urban Anal. City Sci. 2017, 44, 256–271. [Google Scholar] [CrossRef]
  2. Chan, S.H.Y.; Donner, R.V.; Lämmer, S. Urban Road Networks—Spatial Networks with Universal Geometric Features? A Case Study on Germany’s Largest Cities. Eur. Phys. J. B. 2011, 84, 563–577. [Google Scholar] [CrossRef]
  3. Gudmundsson, A.; Mohajeri, N. Entropy and Order in Urban Street Networks. Sci. Rep. 2013, 3, 1–8. [Google Scholar] [CrossRef] [PubMed]
  4. Jiang, B.; Claramunt, C. A Structural Approach to the Model Generalization of an Urban Street Network. GeoInformatica 2004, 8, 157–171. [Google Scholar] [CrossRef]
  5. Louf, R.; Barthelemy, M. A typology of Street Patterns. J. R. Soc. Interface 2014, 11, 20140924. [Google Scholar] [CrossRef]
  6. Evcil, N.A. Herkes için Tasarım Evrensel Tasarım; Boğaziçi Yayınları: İstanbul, Turkey, 2014. [Google Scholar]
  7. Kaplan, H. Kentsel Ulaşım Planlamasında Erişilebilirlik Yeri ve Önemi. Plan. Derg. 1989, 89, 8–14. [Google Scholar]
  8. Ak, A. Urban Form and Walkability: The Assesment of Walkability Capacity of Ankara. Ph.D. Thesis, City and Regional Planning, ODTÜ, Ankara, Turkey, 2018. [Google Scholar]
  9. D’Alessandro, D.; Appolloni, L.; Capasso, L. How walkable is the city? Application of the Walking Suitability Index of the Territory (T-WSI) to the city of Rieti (Lazio Region, Central Italy). Epidemiol. Prev. 2016, 40, 237–242. [Google Scholar]
  10. Ercan, M.A.; Belge, Z.S. Daha Yaşanabilir Kentler İçin Mikro Ölçek Bir Yürünebilirlik Modeli (1). Metu Jfa 2017, 34, 231–265. [Google Scholar] [CrossRef]
  11. Lawrence, D.; Engelke, P. How Land Use and Transportation Systems Impact Public Health. A Literature Review of the Relationship between Physical Activity and Built Form; City and Regional Planning Program College of Arhitecture, Georgia Institute of Tehnology: Atlanta, GA, USA, 2000. [Google Scholar]
  12. Harris, C.W.; Dines, N.T. Time-Saver Standards for Landscape Architecure; McGraw-Hill Publishing: New York, NY, USA, 1998. [Google Scholar]
  13. Monokrousou, K.; Giannopoulou, M. Interpreting and Predicting Pedestrian Movement in Public Space Through Space Syntax Analysis. Procedia-Soc. Behav. Sci. 2016, 223, 509–514. [Google Scholar] [CrossRef]
  14. Öztürk Hacar, Ö.; Gülgen, F.; Bilgi, S. Evaluation of the Space Syntax Measures Affecting Pedestrian Density through Ordinal Logistic Regression Analysis. ISPRS Int. J. Geo-Inf. 2020, 9, 589. [Google Scholar] [CrossRef]
  15. Andrakakou, M.; Keßler, C. Investigating Configurational and Active Centralities: The Example of Metropolitan Copenhagen. Environ. Plan. B Urban Anal. City Sci. 2022, 49, 1949–1966. [Google Scholar] [CrossRef]
  16. Hillier, B.; Iida, S. Network and Psychological Effects in Urban Movement. Spatial Information Theory: International Conference, COSIT 2005, Ellicottville, NY, USA, 14–18 September 2005. Proceedings 7; Springer: Berlin/Heidelberg, Germany, 2005; pp. 475–490. [Google Scholar]
  17. Jabbari, M.; Fonseca, F.; Ramos, R. Accessibility and Connectivity Criteria for Assessing Walkability: An application in Qazvin, Iran. Sustainability 2021, 13, 3648. [Google Scholar] [CrossRef]
  18. Hillier, B.; Hanson, J. The Social Logic of Space; Cambridge University Press (CUP): Cambridge, UK, 1989. [Google Scholar]
  19. Peponis, J.; Ross, C.; Rashid, M. The Structure of Urban Space, Movement and Co-presence: The case of Atlanta. Geoforum 1997, 28, 341–358. [Google Scholar] [CrossRef]
  20. Hillier, B.; Burdett, R.; Penn, A. Creating Life: Or, Does Architecture Determine Anything? Archit. Comport. Archit. Behav. 1986, 3, 233–250. [Google Scholar]
  21. Hillier, B.; Hanson, J. Space Syntax as a Research Programme. Urban Morphol. 1998, 2, 108–110. [Google Scholar]
  22. Özer, Ö. Relation between Pedestrian Movement and Space–İstanbul Galata Region. Master Thesis, İstanbul Technical University, İstanbul, Turkey, 2006. Available online: http://hdl.handle.net/11527/2297 (accessed on 8 February 2023).
  23. Hillier, B.; Burdett, R.; Peponis, J.; Penn, A. Creating life: Or, does architecture determine anything? Arch. 8 Comport./Arch. Behav. 1987, 3, 233–250. [Google Scholar]
  24. Atakara, C.; Allahmoradi, M. Investigating the Urban Spatial Growth by Using Space Syntax and GIS—A Case Study of Famagusta City. ISPRS Int. J. Geo-Inf. 2021, 10, 638. [Google Scholar] [CrossRef]
  25. Zaleckis, K.; Chmielewski, S.; Kamičaitytė, J.; Grazuleviciute-Vileniske, I.; Lipińska, H. Walkability Compass—A Space Syntax Solution for Comparative Studies. Sustainability 2022, 14, 2033. [Google Scholar] [CrossRef]
  26. Lamíquiz, P.J.; López-Domínguez, J. Effects of built environment on walking at the neighbourhood scale. A new role for street networks by modelling their configurational accessibility? Transp. Res. Part A Policy Pract. 2015, 74, 148–163. [Google Scholar] [CrossRef]
  27. Huang, B.X.; Chiou, S.C.; Li, W.Y. Accessibility and street network characteristics of urban public facility spaces: Equity research on parks in Fuzhou city based on GIS and space syntax model. Sustainability 2020, 12, 3618. [Google Scholar] [CrossRef]
  28. Jiang, B. Axwoman 6.3: An ArcGIS 10.2 Extension for Urban Morphological Analysis; University of Gävle: Geneva, Sweden, 2015; Available online: http://giscience.hig.se/binjiang/Axwoman/ (accessed on 8 February 2023).
  29. Guo, Z.; Loo, B.P.Y. Pedestrian Environment and Route Choice: Evidence From New York City and Hong Kong. J. Transp. Geogr. 2013, 28, 124–136. [Google Scholar] [CrossRef]
  30. Ewing, R.; Cervero, R. Travel and The Built Environment: A Meta-Analysis. J. Am. Plan. Assoc. 2010, 76, 265–294. [Google Scholar] [CrossRef]
  31. Asami, Y.; Kubat, A.S.; Kitagawa, K.; Iida, S.I. Introducing the Third Dimension on Space Syntax: Application on The Historical Istanbul. In Proceedings of the 4th International Space Syntax Symposium, London, UK, 17–19 June 2003; pp. 48.1–48.18. [Google Scholar]
  32. Srivanit, M.; Kongphunphin, C.; Rinchumphu, D. Exploring the Association of Spatial Capital and Economic Diversity in the Tourist City of Surat Thani, Thailand. ISPRS Int. J. Geo-Inf. 2022, 11, 507. [Google Scholar] [CrossRef]
  33. Xing, Z.; Guo, W. A New Urban Space Analysis Method Based on Space Syntax and Geographic Information System Using Multisource Data. ISPRS Int. J. Geo-Inf. 2022, 11, 297. [Google Scholar] [CrossRef]
  34. Türkiye İstatistik Kurumu (TÜİK) Adrese Dayalı Nüfus Kayıt Sistemi Sonuçları. 2022. Available online: https://biruni.tuik.gov.tr/medas/?kn=95&locale=tr (accessed on 20 February 2023).
  35. Karimi, K. A Configurational Approach to Analytical Urban Design: Space syntax’ methodology. Urban Des. Int. 2012, 17, 297–318. [Google Scholar] [CrossRef]
  36. Özyılmaz, P. Kentsel Açık Alan Tasarımının Değerlendirilmesi için Mekân Dizimi Yaklaşımı. Master’s Thesis, Gebze Teknik Üniversitesi, Gebze, Turkey, 2009. [Google Scholar]
  37. Hillier, B.; Penn, A.; Hanson, J.; Grajewski, T.; Xu, J. Natural Movement: Or, Configuration and Attraction in Urban Pedestrian Movement. Environ. Plan. B Plan. Des. 1993, 20, 29–66. [Google Scholar] [CrossRef]
  38. Alemdar, Ö.; Özkan Özbek, M. Mekân Dizimi ve Yol Bulma Metotları ile Yaya Hareketliliği ve Arazi Kullanımı İlişkisinin Kadıköy Tarihi Merkezi’nde İrdelenmesi. J. Archit. Sci. Appl. 2021, 6, 77–96. [Google Scholar] [CrossRef]
  39. Dalton, N. Fractional Configurational Analysis and a Solution to the Manhattan Problem. In Proceedings of the Space Syntax 3rd International Symposium, Atlanta, GA, USA, 7–11 May 2001; p. 26. [Google Scholar]
  40. Turner, A. Angular analysis. In Proceedings of the 3rd international symposium on space syntax, Georgia Institute of Technology, Atlanta, GA, USA, 7–11 May 2001; Volume 30, pp. 30.1–30.12. [Google Scholar]
  41. Turner, A. From Axial to Road-centre Lines: A New Representation for Space Syntax and a New Model of Route Choice for Transport Network Analysis. Environ. Plan. B Plan. Des. 2007, 34, 539–555. [Google Scholar] [CrossRef]
  42. Jeong, S.K.; Lee, T.H.; Ban, Y.U. Characteristics of spatial configurations in Pyongyang, North Korea. Habitat Int. 2015, 47, 148–157. [Google Scholar] [CrossRef]
  43. Xu, Y.; Rollo, J.; Esteban, Y. Evaluating Experiential Qualities of Historical Streets in Nanxun Canal Town through a Space Syntax Approach. Buildings 2021, 11, 544. [Google Scholar] [CrossRef]
  44. Özbek, M. Fizik Mekân Kurgularının Sosyal İlişkiler Üzerinden Arnavutköy Yerleşimi Bütününde Mekân Dizimi (Space Syntax) Yöntemi ile İncelenmesi. Ph.D. Thesis, Mimar Sinan Güzel Sanatlar Üniversitesi, İstanbul, Turkey, 2007. Available online: https://hdl.handle.net/20.500.14124/2165 (accessed on 8 February 2023).
  45. Hillier, B. The Hidden Geometry of Deformed Grids: Or, Why Space Syntax Works, When it Looks as Though it Shouldn’t. Environ. Plan. B Plan. Des. 1999, 26, 169–191. [Google Scholar] [CrossRef]
  46. Özbil, A.; Özer, Ö.; Kubat, A.S. Sultanahmet Meydanı’nda Hareket ve Algı Esaslı Kentsel Tasarım Analizi. Mimarlık 2013, 371, 63–67. Available online: http://www.mimarlikdergisi.com/index.cfm?sayfa=mimarlik&DergiSayi=385&RecID=3158 (accessed on 20 February 2023).
  47. Li, Y.; Xiao, L.; Ye, Y.; Xu, W.; Law, A. Understanding tourist space at a historic site through space syntax analysis: The case of Gulangyu, China. Tour. Manag. 2016, 52, 30–43. [Google Scholar] [CrossRef]
  48. Hillier, B. Space is the Machine; Cambridge University Press: Cambridge, UK, 1996. [Google Scholar]
  49. de Koning, R.; Tan, W.G.Z.; van Nes, A. Assessing spatial configurations and transport energy usage for planning sustainable communities. Sustainability 2020, 12, 8146. [Google Scholar] [CrossRef]
  50. Hillier, B. Between Social Physics and Phenomenology: Explorations towards an urban synthesis? In Proceedings of the 5th International Space Syntax Symposium, Delft, The Netherlands, 13–17 June 2005; Techne Press: Amsterdam, The Netherlands; pp. 1–23. [Google Scholar]
  51. Djenaihi, W.-M.; Zemmouri, N.; Djenane, M.; van Nes, A. Noise and Spatial Configuration in Biskra, Algeria—A Space Syntax Approach to Understand the Built Environment for Visually Impaired People. Sustainability 2021, 13, 11009. [Google Scholar] [CrossRef]
  52. Gann, D.W. Spatial Integration: A Space Sntax Analysis of the Villages of the Homol’ovi Cluster. Ph.D. Thesis, University of Arizona, Tucson, AZ, USA, 2023. Available online: https://repository.arizona.edu/handle/10150/280412 (accessed on 8 February 2023).
  53. Hillier, B.; Yang, T.; Turner, A. Normalising least angle choice in Depthmap-and how it opens up new perspectives on the global and local analysis of city space. J. Space Syntax. 2012, 3, 155–193. [Google Scholar]
  54. Mohammed, A.M.; Ukai, T. The impact of university campuses on city urbanization: A syntactic and socio-spatial analysis of Kyushu university campuses in Japan. Int. J. Sustain. Dev. Plan. 2021, 16, 1209–1220. [Google Scholar] [CrossRef]
  55. Maliene, V.; Grigonis, V.; Palevičius, V.; Griffiths, S. Geographic information system: Old principles with new capabilities. Urban Des. Int. 2011, 16, 1–6. [Google Scholar] [CrossRef]
  56. Li, X.; Lv, Z.; Zheng, Z.; Zhong, C.; Hijazi, I.H.; Cheng, S. Assessment of lively street network based on geographic information system and space syntax. Multimed. Tools Appl. 2017, 76, 17801–17819. [Google Scholar] [CrossRef]
  57. Usui, H. Statistical Distribution of Building Lot Depth: Theoretical and Empirical Investigation of Downtown Districts in Tokyo. Environ. Plan. B Urban Anal. City Sci. 2019, 46, 1499–1516. [Google Scholar] [CrossRef]
  58. United Nations (UN). Accessibility for the Disabled a Design Manual for a Barrier Free Environment, United Nations, Department of Economic and Social Affairs, Division for Social Policy and Development. 2004. Available online: https://www.un.org/esa/socdev/enable/designm/index.html (accessed on 1 January 2023).
  59. Türkiye Çevre, Şehircilik ve İklim Değişikliği İl Müdürlüğü Erişilebilirlik Standartları. 2018. Available online: https://yalova.csb.gov.tr/bina-girisleri-icin-erisilebilirlik-standartlari-haber-231920 (accessed on 1 January 2023).
  60. Mondada, L. Emergent Focused Interactions in Public Places: A Systematic Analysis of The Multimodal Achievement of A Common Interactional Space. J. Pragmat. 2009, 41, 1977–1997. [Google Scholar] [CrossRef]
  61. Kerr, J.; Frank, L.; Sallis, J.F.; Chapman, J. Urban Form Correlates of Pedestrian Travel in Youth: Differences by Gender, Race-Ethnicity and Household Attributes. Transp. Res. Part D Transp. Environ. 2007, 12, 177–182. [Google Scholar] [CrossRef]
  62. Song, G.-S.; Jeong, M.-A. Morphology of Pedestrian Roads and Thermal Responses During Summer, In The Urban Area of Bucheon City, Korea. Int. J. Biometeorol. 2016, 60, 999–1014. [Google Scholar] [CrossRef] [PubMed]
  63. Southworth, M. Designing the Walkable City. J. Urban Plan. Dev.-Asce 2005, 131, 246–257. [Google Scholar] [CrossRef]
  64. Van Nes, A. Applied mathematics on urban space. In The Mathematics of Urban Morphology: Modeling and Simulation in Science, Engineering and Technology; D’Acci, L., Ed.; Springer: Berlin/Heidelberg, Germany, 2019; pp. 253–270. [Google Scholar]
  65. Bielik, M.; König, R.; Schneider, S.; Varoudis, T. Measuring the impact of street network configuration on the accessibility to people and walking attractors. Netw. Spat. Econ. 2018, 18, 657–676. [Google Scholar] [CrossRef]
  66. Li, X.; Qian, Y.; Zeng, J.; Wei, X.; Guang, X. The influence of Strip-City street network structure on spatial vitality: Case studies in Lanzhou, China. Land 2021, 10, 1107. [Google Scholar] [CrossRef]
  67. Çil, E. Kula Tarihsel Kentinin Yirminci Yüzyıldaki Fiziksel Dönüşümünün Mekân Dizim Analiziyle İncelenmesi. Gazi Üniversitesi Mühendislik ve Mimarlık Fakültesi Dergisi 2008, 23, 283–293. Available online: https://dergipark.org.tr/tr/download/article-file/75702 (accessed on 31 January 2022).
  68. Papas, T.; Basbas, S.; Campisi, T. Urban mobility evolution and the 15-minute city model: From holistic to bottom-up approach. Transp. Res. Procedia 2023, 69, 544–551. [Google Scholar] [CrossRef]
  69. Carra, M.; Rossetti, S.; Tiboni, M.; Vetturi, D. Urban regeneration effects on walkability scenarios. TeMA-J. Land Use Mobil. Environ. 2022, 1, 101–114. [Google Scholar] [CrossRef]
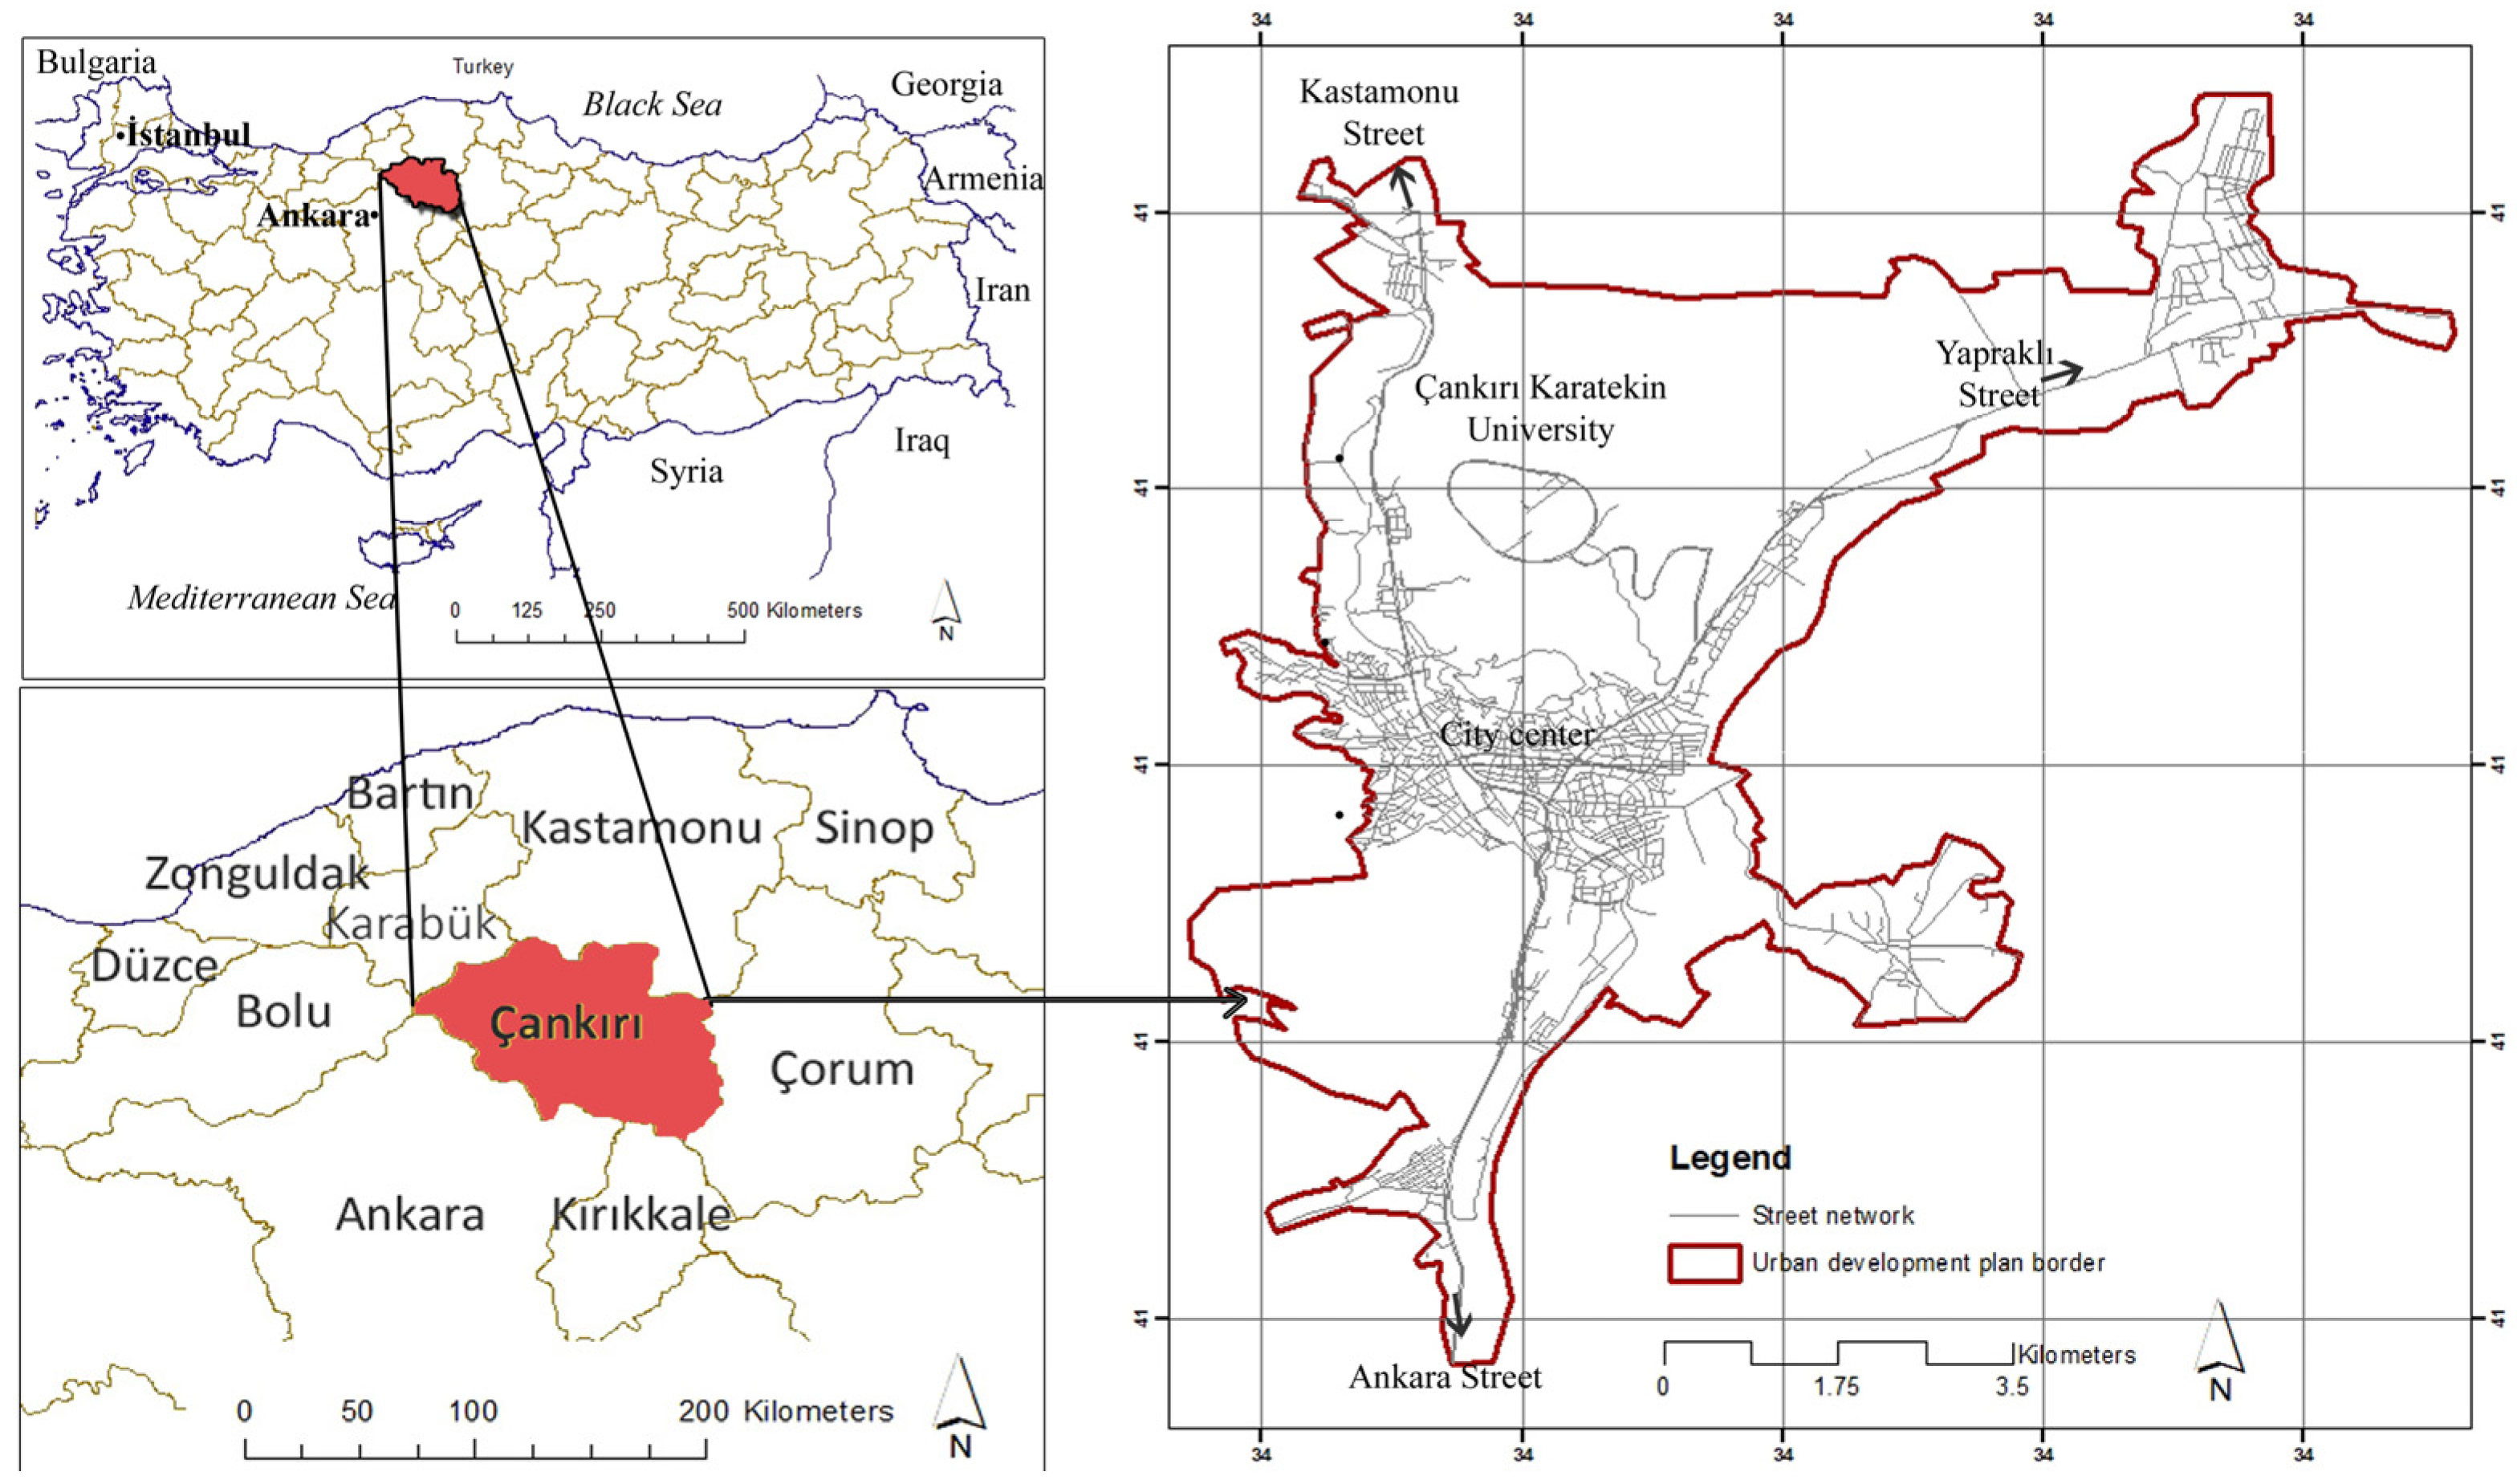
Figure 1. The geographical location of the study area.
Ijgi 12 00216 g001
Figure 2. Çankırı City Segment Map.
Ijgi 12 00216 g002
Figure 3. (a): Angular segment analysis of streets, (b): streets justified graph sample [41].
Ijgi 12 00216 g003
Figure 4. Data processing flow chart.
Ijgi 12 00216 g004
Figure 5. (a) Integration map (Rn), (b) choice map (Rn).
Ijgi 12 00216 g005
Figure 6. (a) Correlation between NAIN (Rn) and NACH (Rn) (b) Star model graph.
Ijgi 12 00216 g006
Figure 7. (a) Slope analysis in study area, (b) Integration map of street network in study area.
Ijgi 12 00216 g007
Figure 8. (a) Streets with high integration and low slope values in study area (b) Walkable Street network in the study area.
Ijgi 12 00216 g008
Figure 9. (a) Percentages and areas of walkable street network (b) Accessibility assessment graph.
Ijgi 12 00216 g009
Table 1. Formulas of the NACH and NAIN.
ParametersIntegrationChoice
The values of the normalized segment integration (NAIN) are calculated as follows:
          NAIN = NC 1.2   TD + 2
The values of the normalized angular choice (NACH) are calculated as:
          NACH = log   ( CH + 1 ) log ( TD + 3 )
DescriptionNC: T1024 Node Count Rn metric
TD: T1024 Total depth Rn metric
CH: T1024 Choice Rn metric
TD: T1024 Total depth Rn metric
Table 2. The values of NACH and NAIN variables (R = n).
RadiusValueMeanMinimumMaximumStd. Dev.
nNAIN0.5970570.2264610.9515770.152991
NACH0.99688501.493080.303643
Table 3. Accessibility assessment chart for study areas.
Likert ScaleColorAccessibility LevelSlope (%)Integration Value
1purpleVery low>1248–802
2bluelow10–12802–1001
3greenmedium7–91001–1153
4yellowhigh4–71153–1326
5redVery high0–41326–1721
Disclaimer/Publisher’s Note: The statements, opinions and data contained in all publications are solely those of the individual author(s) and contributor(s) and not of MDPI and/or the editor(s). MDPI and/or the editor(s) disclaim responsibility for any injury to people or property resulting from any ideas, methods, instructions or products referred to in the content.