
Interaction of Crime Risk across Crime Types in Hotspot Areas

Abstract
1. Introduction
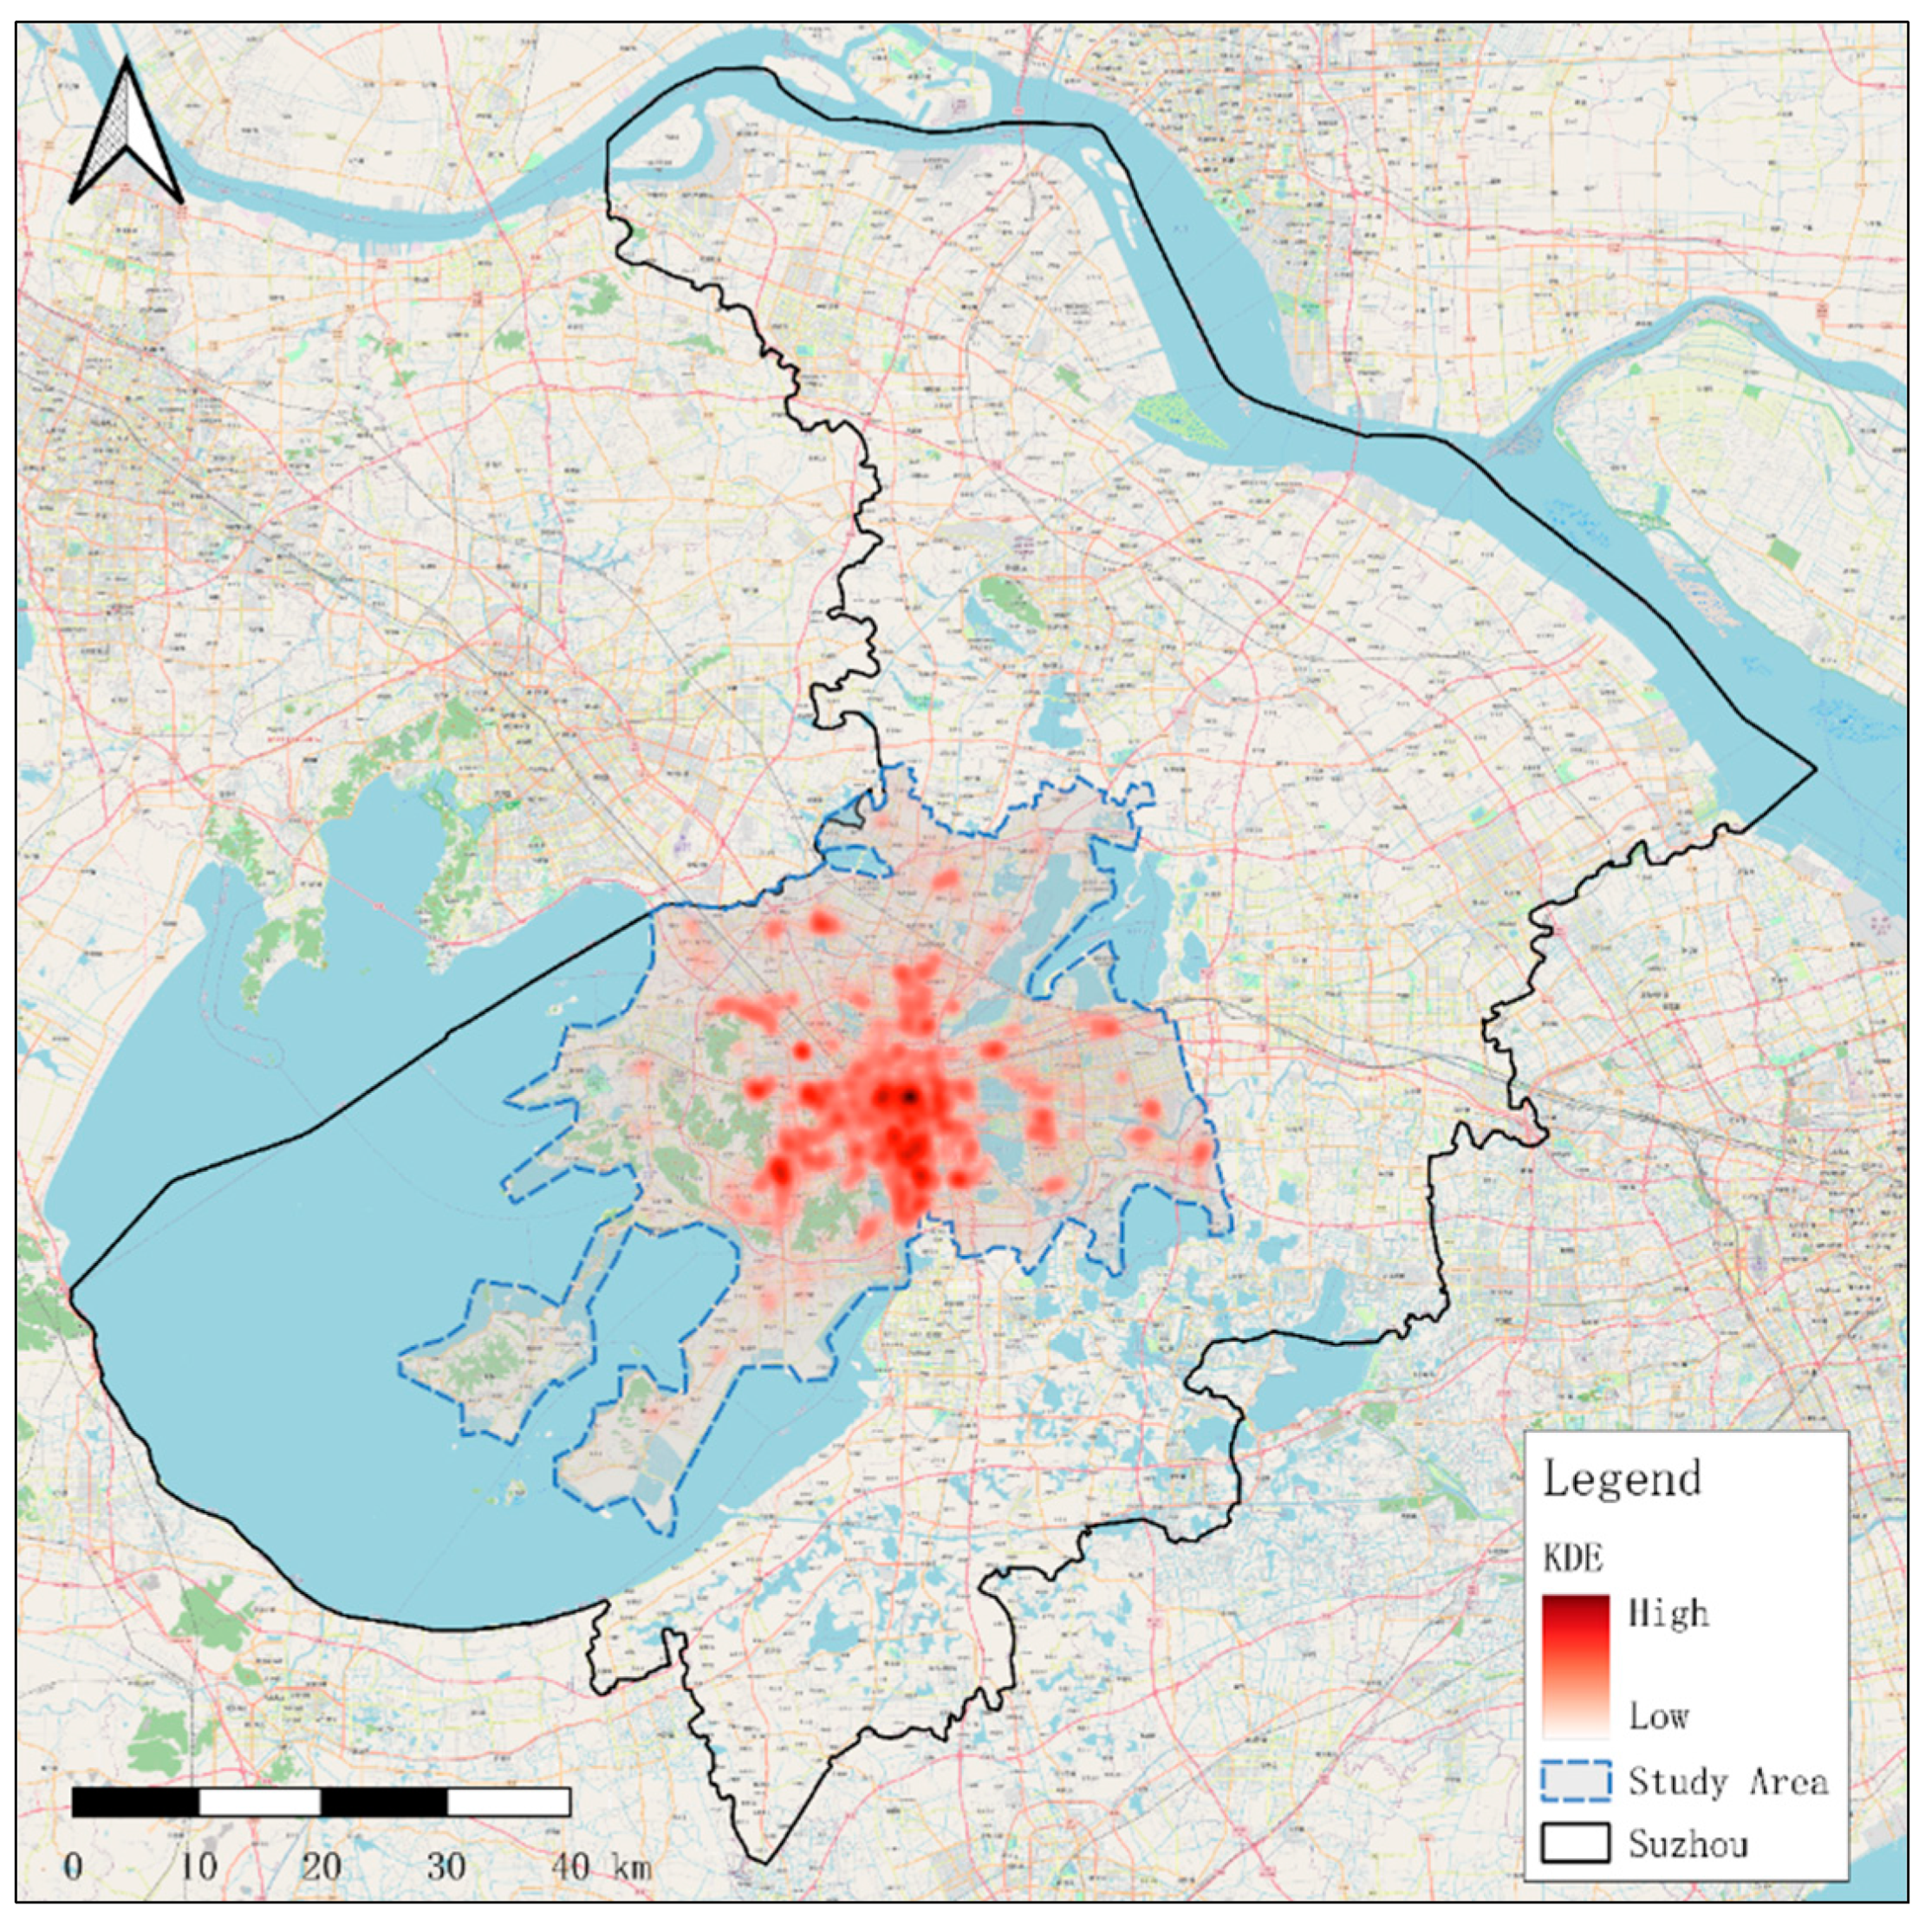
2. Study Area and Crime Data
3. Hotspot Extraction
4. Crime Risk Interaction Analysis
5. Discussion
- (1)
- There was a strong, positive correlation between vehicle property theft and home burglary. In many small areas, motor vehicle theft and home burglary had a strong correlation, such as that found for hotspot 9, which was likely because neighborhoods with a high concentration of residents may have a higher concentration of vehicles. For criminals to commit burglary or steal vehicles, potential targets must be marked in advance. Thieves share information about potential victims’ locations and habits and may provide this information to other criminals to carry out other possible crimes. However, in areas with a high concentration of only one type of target, the correlation between these crime types was weak.
- (2)
- There was a strong, positive correlation between pickpocketing and theft of property from cars. Pickpocketing and theft usually occur in crowded public places. Dense crowds provide a lot of goods for potential pickpockets and other thieves. Most public areas are crowded with people and vehicles, providing a large number of targets for potential offenders. For instance, with regard to bus stations, many people take the bus every day, and a large number of these people drive from home to the bus station. Therefore, bus stations have become gathering places for a large number of passengers and their different means of transportation. Spatially overlapping objects can lead to strong interactions between potential offenders and the emergence of crime hotspots. Space-limited interactions may increase the levels of interaction and transformation between the above two types of crime. Since the targets of the two types of crime are similar, information can be easily transferred from one crime to another crime. Other potential offenders commit crimes when obtaining information, as found for hotspot 3 and hotspot 9.
- (3)
- Home burglary was highly related to internet fraud or telecom fraud. Regarding internet fraud and telecom fraud, according to the age analysis of the victims of telecommunications fraud, it was found that there are more victims in the 20–50 age range. The victims of telecom fraud are generally unemployed freelancers, housewives, and some young people who often surf the internet. As victims may be marked by criminals as a group with low levels of vigilance, this information could be disseminated to other criminals to carry out crimes. Due to the high consistency in terms of the crime locations, there was a highly positive correlation between home burglary and internet fraud, such as that found for hotspot 3.
- (4)
- There was a positive correlation between robbery and home burglary or shoplifting. Robbery and burglary are different types of crime, but there are commonalties of crime risk between them. For example, a skilled robber might observe and stalk a target inside a store, learn about the security situation in the area by familiarizing themself with the area, and then commit the robbery upon the target’s departure. In addition, there may be an overlap between robbery and burglary victims, meaning that the same person may be a victim of both crimes. This is because the criminal targets and victims of robbery and burglary have some things in common, such as their residences and the commercial buildings they visit. These places may have some similar security weaknesses, such as doors and windows that remain unlocked, faulty alarm systems, and so on. In addition, robbery and burglary share some similarities in terms of criminal methods, such as breaking and entering, the use of weapons, and so on. These phenomena in hotspots 2, 5, and 8 also provide proof of the “flag” concept.
- (5)
- There was a negative correlation between shoplifting and office creeper activity. Shoplifting and office creeper activity are crimes entailing burglary, so they share a similar selection structure. Such crimes require the absence of people. According to the “Routine activities theory”, the opening and closing times of shops and offices are roughly the same, and the mobility of the staff is consistent, resulting in the reverse flow of burglars committing crimes. Many hotspots are entirely composed of commercial or residential addresses. After a crime occurs, the risk in the area increases. Offenders may not commit crimes in the same area within a short time. Therefore, there is a negative correlation between them, such as that found for hotspot 5.
6. Conclusions
Supplementary Materials
Author Contributions
Funding
Data Availability Statement
Acknowledgments
Conflicts of Interest
References
- Hashim, H.; Wan Mohd, W.M.N.; Sadek, E.S.S.M.; Dimyati, K.M. Modeling urban crime patterns using spatial space time and regression analysis. Int. Arch. Photogramm. Remote Sens. Spat. Inf. Sci. 2019, 4, 247–254. [Google Scholar] [CrossRef]
- Brantingham, P.L.; Brantingham, P.J. Nodes, Paths and Edges: Consideration on the Complexity of Crime and the Physical Environment. J. Environ. Psychol. 1993, 13, 3–28. [Google Scholar] [CrossRef]
- Ronald, V.C.; John, E.E. Crime Analysis for Problem Solvers in 60 Small Steps; U.S. Department of Justice: Washington, DC, USA, 2005.
- Clarke, R. “Situational” Crime Prevention: Theory and Practice. Br. J. Criminol. 1980, 20, 136–147. [Google Scholar] [CrossRef]
- Kinney, J.B.; Brantingham, P.L.; Wuschke, K.; Kirk, M.G.; Brantingham, P.J. Crime Attractors, Generators and Detractors: Land Use and Urban Crime Opportunities. Built Environ. 2008, 34, 62–74. [Google Scholar] [CrossRef]
- Weisburd, D.; Bushway, S.; Lum, C.; Yang, S.-M. Trajectories of Crime at Places: A Longitudinal Study of Street Segments in the City of Seattle. Criminology 2004, 42, 283–322. [Google Scholar] [CrossRef]
- Felson, M.; Clarke, R. Opportunity Makes the Thief: Practical Theory for Crime Prevention; RDS: London, UK, 1998; p. 98. [Google Scholar]
- Cohen, L.E.; Felson, M. Social change and crime rate trends: A routine activity approach. Am. Sociol. Rev. 1979, 44, 588–608. [Google Scholar] [CrossRef]
- Cornish, D.B.; Clarke, R.V. Opportunities, precipitators and criminal decisions: A reply to Wortley’s critique of situational crime prevention. Crime Prev. Stud. 2003, 16, 41–96. [Google Scholar]
- Wang, Z.; Liu, X. Analysis of burglary hot spots and near-repeat victimization in a large Chinese city. ISPRS Int. J. Geo-Inf. 2017, 6, 148. [Google Scholar] [CrossRef]
- Johnson, S.D.; Bowers, K.J.; Pease, K. Predicting the future or summarising the past?: Crime mapping as anticipation. In Crime Science; Willan: London, UK, 2013; pp. 145–163. [Google Scholar]
- Johnson, S.D.; Summers, L.; Pease, K. Offender as forager? A direct test of the boost account of victimization. J. Quant. Criminol. 2009, 25, 181–200. [Google Scholar] [CrossRef]
- Ashton, J.; Brown, I.; Senior, B.; Pease, K. Repeat victimisation: Offenders accounts. Int. J. Risk Secur. Crime Prev. 1998, 3, 269–279. [Google Scholar]
- Roach, J.; Cartwright, A.; Weir, K.; Richards, S.; Weir, M. Reducing student burglary ictimization using the Nudge approach. Crime Prev. Community Saf. 2020, 22, 364–380. [Google Scholar] [CrossRef]
- Bowers, K.J.; Johnson, S.D. Who Commits Near Repeats? A Test of the Boost Explanation. West. Criminol. Rev. 2004, 5, 12–24. [Google Scholar]
- Bowers, K.J.; Johnson, S.D. Domestic burglary repeats and space-time clusters: The dimensions of risk. Eur. J. Criminol. 2005, 2, 67–92. [Google Scholar] [CrossRef]
- Nepomuceno, T.C.C.; de Carvalho, V.D.H.; Silva, L.C.E.; de Moura, J.A.; Costa, A.P.C.S. Exploring the Bedouin syndrome in the football fan culture: Addressing the hooliganism phenomena through networks of violent behavior. Int. J. Environ. Res. Public Health 2022, 19, 9711. [Google Scholar] [CrossRef] [PubMed]
- Wortley, R.; Townsley, M. Environmental criminology and crime analysis: Situating the theory, analytic approach and application. In Environmental Criminology and Crime Analysis; Routledge: Abingdon, UK, 2016; pp. 20–45. [Google Scholar]
- Crime Opportunity Theories: Routine Activity, Rational Choice and Their Variants; Routledge: Abingdon, UK, 2017.
- Wang, Z.; Zhang, H. Could Crime Risk Be Propagated across Crime Type? ISPRS Int. J. Geo-Inf. 2018, 8, 203. [Google Scholar] [CrossRef]
- Saraiva, M.; Matijošaitienė, I.; Mishra, S.; Amante, A. Crime Prediction and Monitoring in Porto, Portugal, Using Machine Learning, Spatial and Text Analytics. ISPRS Int. J. Geo-Inf. 2022, 11, 400. [Google Scholar] [CrossRef]
- Sherman, L.W.; Gartin, P.R.; Buerger, M.E. Hot spots of predatory crime: Routine activities and the criminology of place. Criminology 1989, 27, 27–56. [Google Scholar] [CrossRef]
- Hardyns, W.; Snaphaan, T.; Pauwels, L.J. Crime concentrations and micro places: An empirical test of the “law of crime concentration at places” in Belgium. Aust. N. Z. J. Criminol. 2019, 52, 390–410. [Google Scholar] [CrossRef]
- David, W.; Telep, C.W.; Lawton, B.A. Could Innovations in Policing have Contributed to the New York City Crime Drop even in a Period of Declining Police Strength?: The Case of Stop, Question and Frisk as a Hot Spots Policing Strategy. Justice Q. 2014, 31, 142. [Google Scholar]
- Groff, E.R.; Weisburd, D.; Yang, S.M. Is it Important to Examine Crime Trends at a Local “Micro” Level?: A Longitudinal Analysis of Street to Street Variability in Crime Trajectories. J. Quant. Criminol. 2010, 26, 7–32. [Google Scholar] [CrossRef]
- Andresen, M.A.; Malleson, N. Testing the stability of crime patterns: Implications for theory and policy. J. Res. Crime Delinq. 2011, 48, 58–82. [Google Scholar] [CrossRef]
- Curman, A.S.; Andresen, M.A.; Brantingham, P.J. Crime and place: A longitudinal examination of street segment patterns in Vancouver, BC. J. Quant. Criminol. 2015, 31, 127–147. [Google Scholar] [CrossRef]
- de Melo, S.N.; Matias, L.F.; Andresen, M.A. Crime concentrations and similarities in spatial crime patterns in a Brazilian context. Appl. Geogr. 2015, 62, 314–324. [Google Scholar] [CrossRef]
- Vandeviver, C.; Steenbeek, W. The (In)Stability of Residential Burglary Patterns on Street Segments: The Case of Antwerp, Belgium 2005–2016. J. Quant. Criminol. 2019, 35, 111–133. [Google Scholar] [CrossRef]
- Eck, J.E.; Weisburd, D.L. Crime and Place: Crime Prevention Studies; Criminal Justice Press: Monsey, NY, USA, 1995; Volume 4. [Google Scholar]
- Braga, A.A.; Weisburd, D.L.; Waring, E.J.; Mazerolle, L.G.; Spelman, W.; Gajewski, F. Problem-oriented policing in violent crime places: A randomized controlled experiment. Criminology 1999, 37, 541–580. [Google Scholar] [CrossRef]
- Ratcliffe, T.J.H. Crime Mapping and the Training Needs of Law Enforcement; Springer: Cham, The Netherlands, 2004. [Google Scholar]
- Wong, C. Clifford R. Shaw and Henry D. McKay, The Social Disorganization Theory. CSISS Class. 2002. Available online: https://escholarship.org/uc/item/47j411pr (accessed on 10 April 2023).
- Eck, J.E.; Clarke, R.V.; Guerette, R.T. Risky facilities: Crime concentration in homogeneous sets of establishments and facilities. Crime Prev. Stud. 2007, 21, 225. [Google Scholar]
- Oscar, N. Defensible Space: Crime Prevention through Urban Design; Macmillan: New York, NY, USA, 1972; pp. 163–245. [Google Scholar]
- Jeffery, C.R. Crime Prevention through Environmental Design; Sage: Beverly Hills, CA, USA, 1971; pp. 11–63. [Google Scholar]
- Yu, K.; Liu, L.; Li, J.; Ding, W.; Le, T.D. Multi-Source Causal Feature Selection. IEEE Trans. Pattern Anal. Mach. Intell. 2019, 42, 2240–2256. [Google Scholar] [CrossRef]
- Li, Y.; Yang, Z.; Jiao, S.; Li, Y. Partition KMNN-DBSCAN Algorithm and Its Application in Extraction of Rail Damage Data. Math. Probl. Eng. 2022, 2022, 4699573. [Google Scholar] [CrossRef]
- Cummings, A.R.; Markandey, N.; Das, H.; Arredondo, C.; Wehenkel, A.; Tiemann, B.L.; Lee, G. The spill over of crime from urban centers: An account of the changing spatial distribution of violent crime in Guyana. ISPRS Int. J. Geo-Inf. 2019, 8, 481. [Google Scholar] [CrossRef]
- Cabrera-Barona, P.F.; Jimenez, G.; Melo, P. Types of crime, poverty, population density and presence of police in the metropolitan district of Quito. ISPRS Int. J. Geo-Inf. 2019, 8, 558. [Google Scholar] [CrossRef]
- Nepomuceno, T.C.C.; Costa, A.P.C.S. Spatial visualization on patterns of disaggregate robberies. Oper. Res. 2019, 19, 857–886. [Google Scholar] [CrossRef]
- Nepomuceno, T.C.C.; Santiago, K.T.M.; Daraio, C.; Costa, A.P.C.S. Exogenous crimes and the assessment of public safety efficiency and effectiveness. Ann. Oper. Res. 2020, 316, 1349–1382. [Google Scholar] [CrossRef]
- Borba, B.F.D.C.; de Gusmão, A.P.H.; Clemente, T.R.N.; Nepomuceno, T.C.C. Optimizing Police Facility Locations Based on Cluster Analysis and the Maximal Covering Location Problem. Appl. Syst. Innov. 2022, 5, 74. [Google Scholar] [CrossRef]


| Crime Type | Description | Quantity |
|---|---|---|
| Pickpocketing | The theft of money, wallets, etc., from the pockets of people, which often occurs in crowded public places. | 6274 |
| Vehicle property theft | The theft of goods from motor vehicles. | 4251 |
| Office creeper | A person who sneaks into an office building to steal items and equipment. | 5388 |
| Vehicle theft | The theft of motor vehicles. | 21,246 |
| Shoplifting | The theft of goods from a shop. | 6102 |
| Telecom fraud | A person who uses telecom to deceive another to gain profit. | 3085 |
| Robbery | The act of robbing. | 1545 |
| Home burglary | Breaking into and entering the house of another at night with the intent of stealing. | 35,612 |
| Internet fraud | A person who uses the internet to deceive another in order to gain profit. | 7913 |
| Delict | Other illegal acts. | 9748 |
| Hotspot | Crime Number | Geographical Location |
|---|---|---|
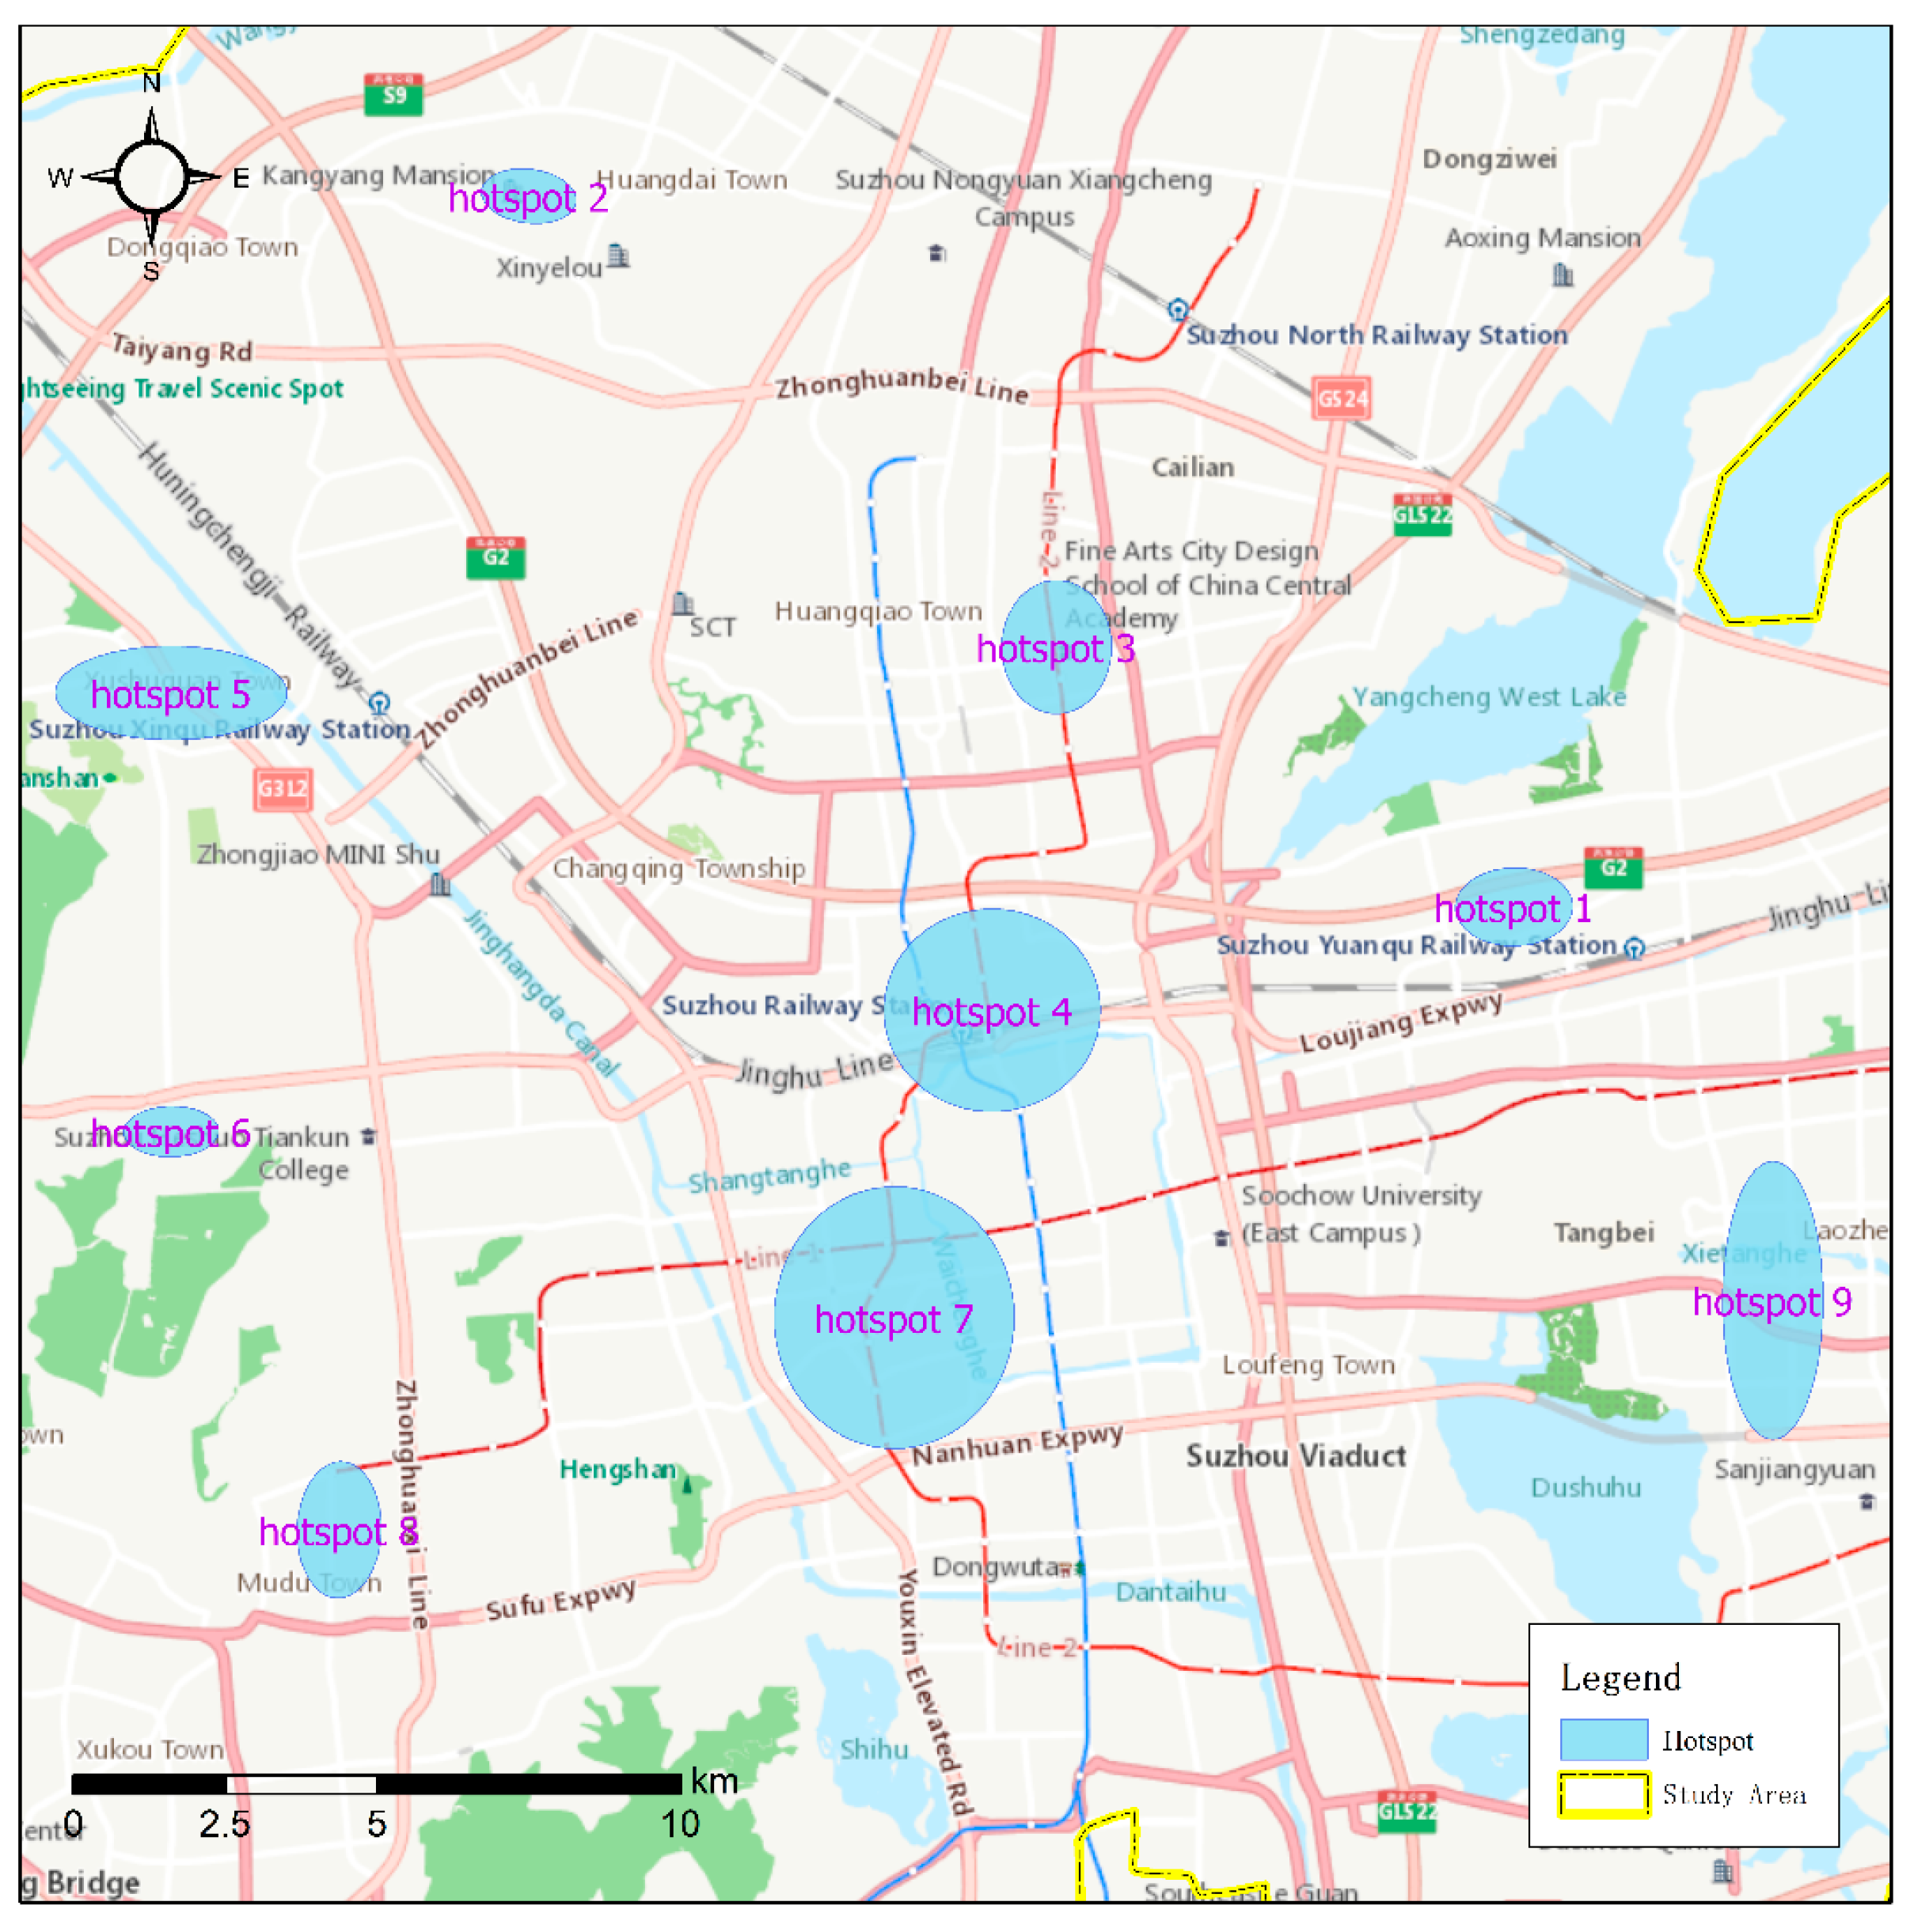
| Hotspot 1 | 715 | Hotspot 1 included Fengting Avenue in Wuzhong District, which is a mainly residential area. Areas near this hotspot include Suzhou Park Station, Suzhou Yuanqu Railway Station, the local railway, and the local expressway. |
| Hotspot 2 | 529 | Hotspot 2 included Chunfeng Road, in Huangdai Town, and Xiangcheng District, which are dominated by residential areas and a relatively large agricultural market. |
| Hotspot 3 | 562 | Hotspot 3 included Chunshen Lake Road, Huayuan Road and Jianyuan Road in Huangdai Town, and Xiangcheng District, which contain large residential areas, hospitals, and squares. |
| Hotspot 4 | 1538 | Hotspot 4, the largest hotspot area, included Sujin Street, Suzhan Road, and North-East Ring Road in Gusu District, which mainly consist of residential areas, commercial areas, and tourist attractions. The large-scale Suzhou Railway Station is in this area. |
| Hotspot 5 | 947 | Hotspot 5 included the Huqiu high-tech zone viaduct, which is located near mainly residential areas. |
| Hotspot 6 | 644 | Hotspot 6 included Majian Road in Huqiu District, mainly consisting of residential areas and primary schools. Fengqiao Street is nearby. |
| Hotspot 7 | 4387 | Hotspot 7 included Wumenqiao Street and Canglang Street in Gusu District, which contain large shopping malls, schools, hospitals, and large residential areas. |
| Hotspot 8 | 536 | Hotspot 8 included Huayuan East Road in Wuzhong District, which mainly consist of markets and residential areas. |
| Hotspot 9 | 1085 | Hotspot 9 included Jinjihu Avenue, Songjiang Road, and Dongyan Road in Wuzhong District, which mainly contain residential areas, industrial parks, schools, and commercial buildings. |
| Monday | Crime Type 1 | Next Monday | Crime Type 2 | Number of Type 1 Cases | Number of Type 2 Cases | Hotspot |
|---|---|---|---|---|---|---|
| 19 December 2011 | Home burglary | 26 December 2011 | Vehicle theft | 1 | 2 | 1 |
| 19 December 2011 | Vehicle theft | 26 December 2011 | Home burglary | 3 | 7 | 2 |
| 19 December 2011 | Robbery | 26 December 2011 | Vehicle theft | 3 | 2 | 2 |
| 19 December 2011 | Shoplifting | 26 December 2011 | Home burglary | 2 | 1 | 3 |
| 2 January 2012 | Pickpocketing | 9 January 2012 | Internet fraud | 6 | 4 | 4 |
| 19 March 2012 | Internet fraud | 26 March 2012 | Robbery | 5 | 2 | 5 |
| 16 September 2013 | Office creeper | 23 September 2013 | Pickpocketing | 8 | 5 | 6 |
| 12 August 2013 | Pickpocketing | 19 August 2013 | Office creeper | 4 | 7 | 8 |
| 9 September 2013 | Telecom fraud | 16 September 2013 | Delict | 1 | 2 | 7 |
| 14 October 2013 | Home burglary | 21 October 2013 | Delict | 5 | 7 | 9 |
| Hotspot | Correlation Description |
|---|---|
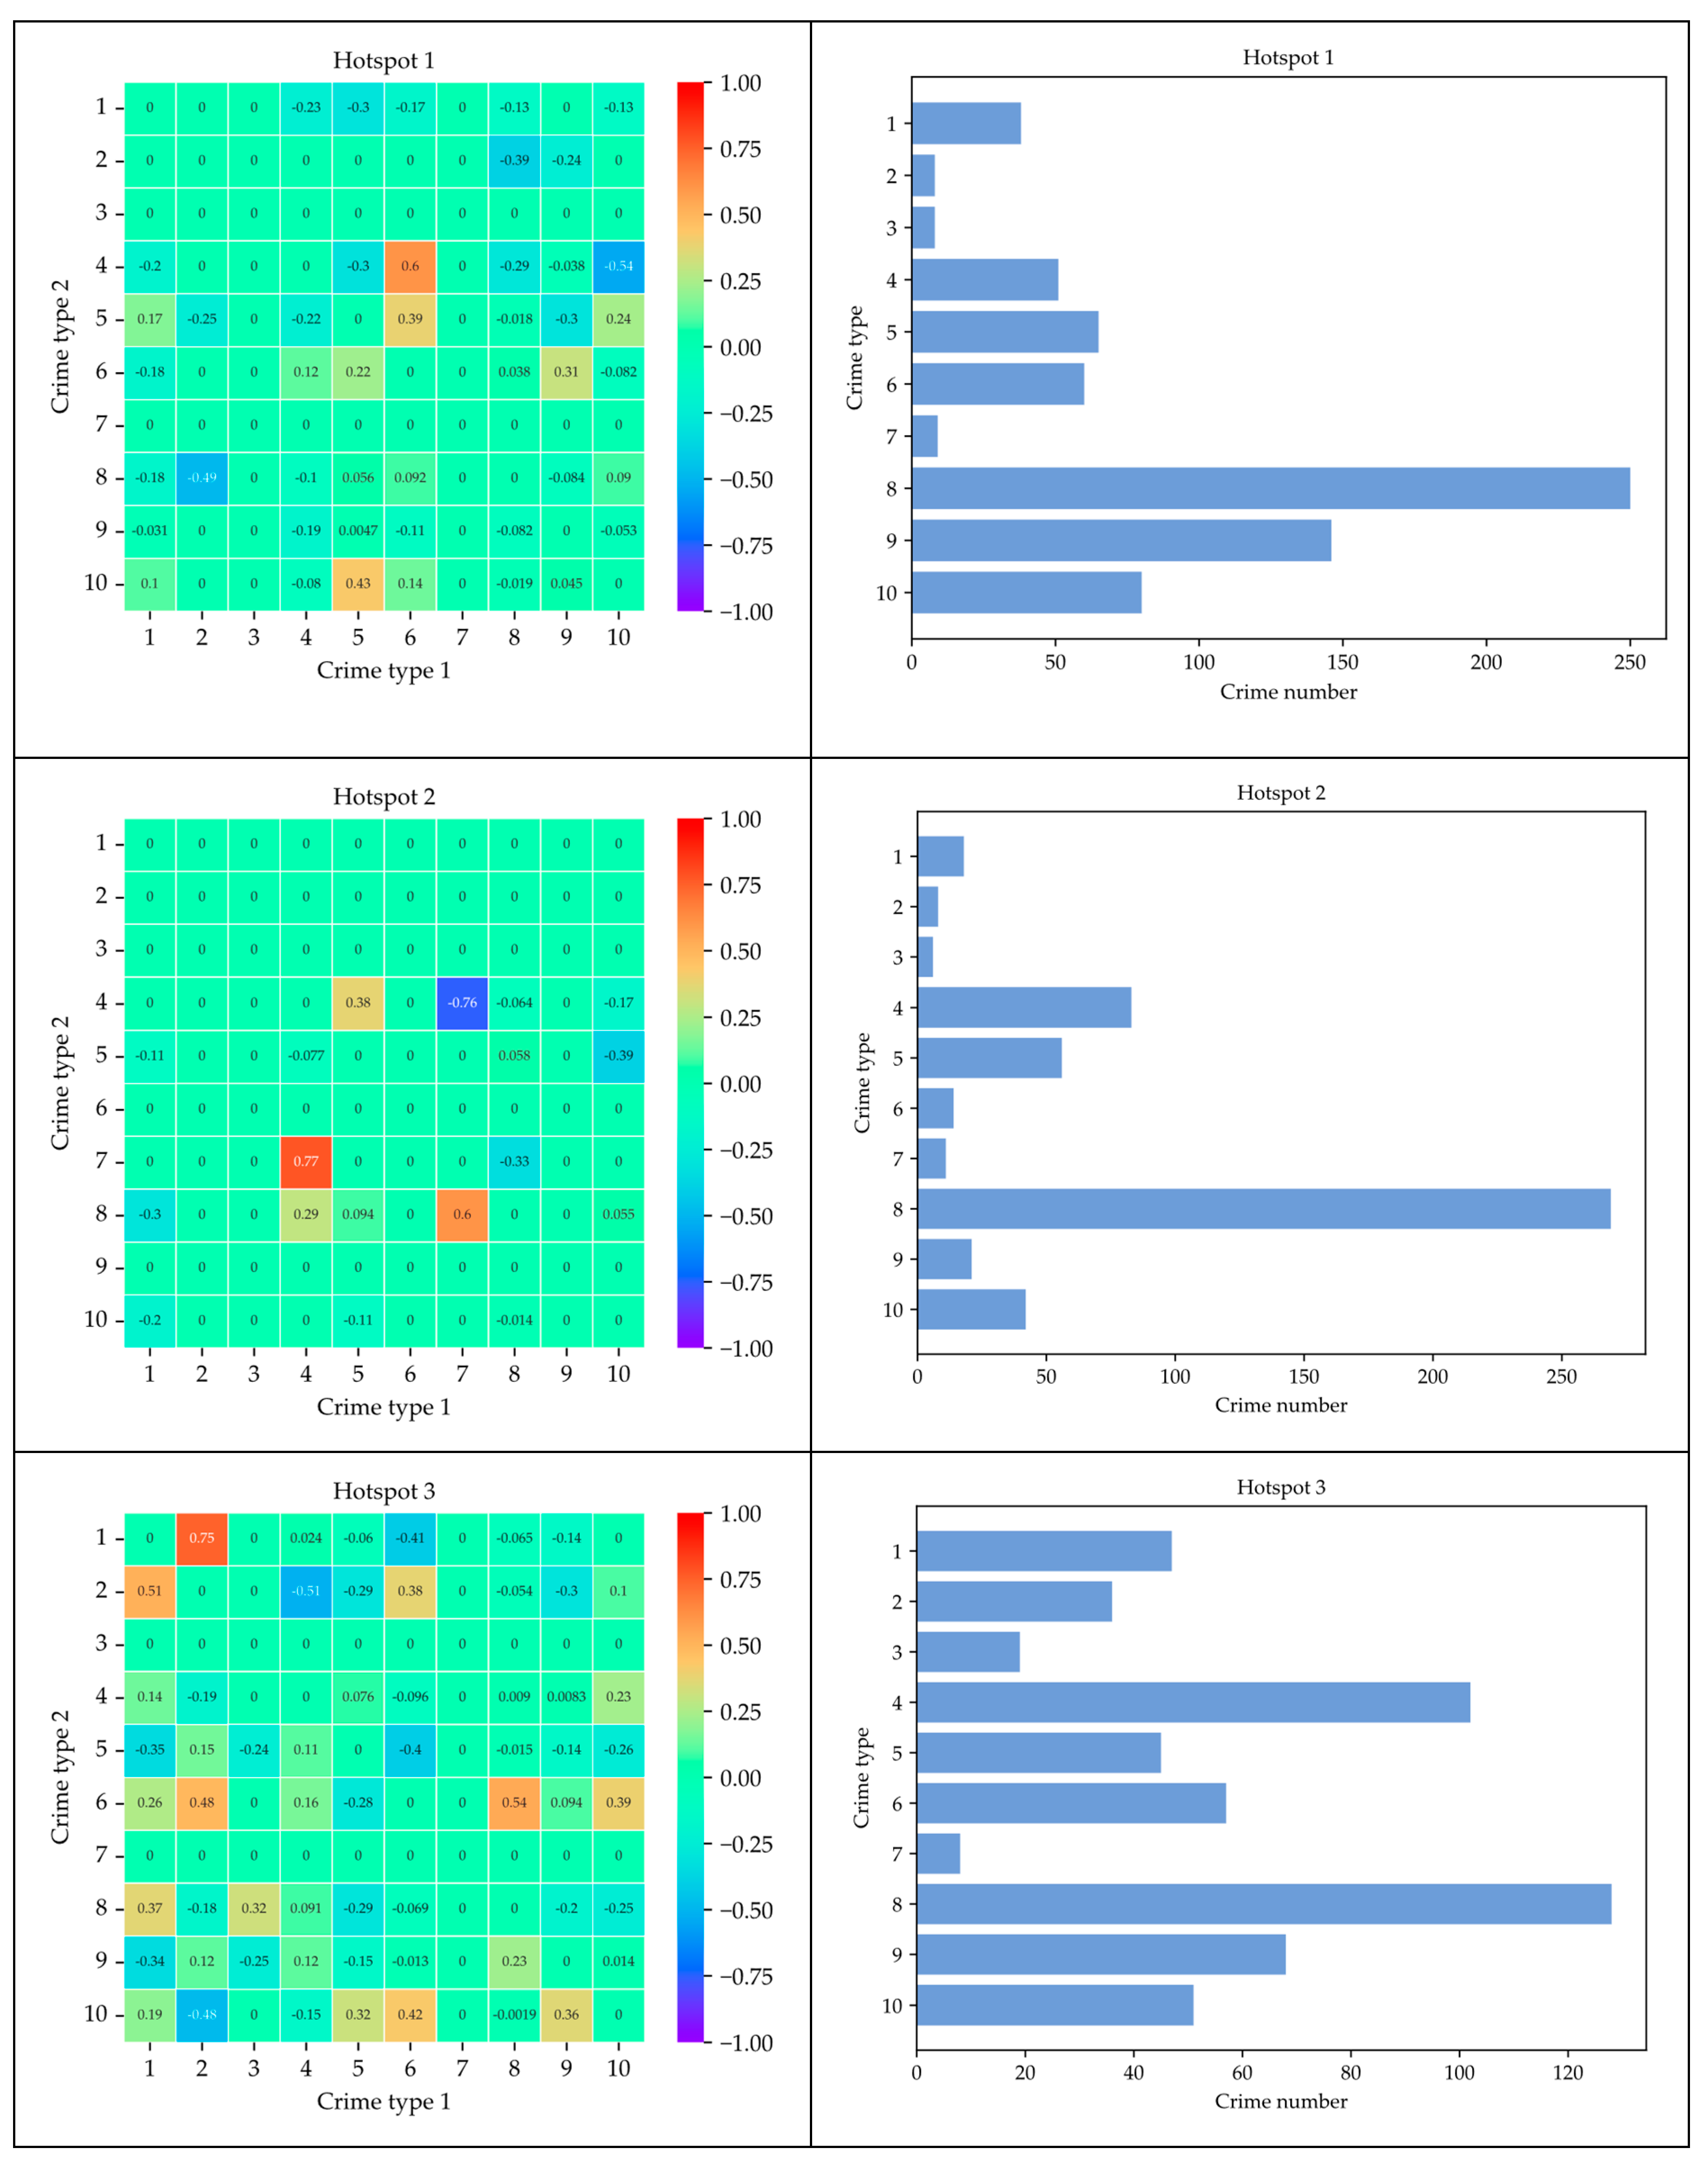
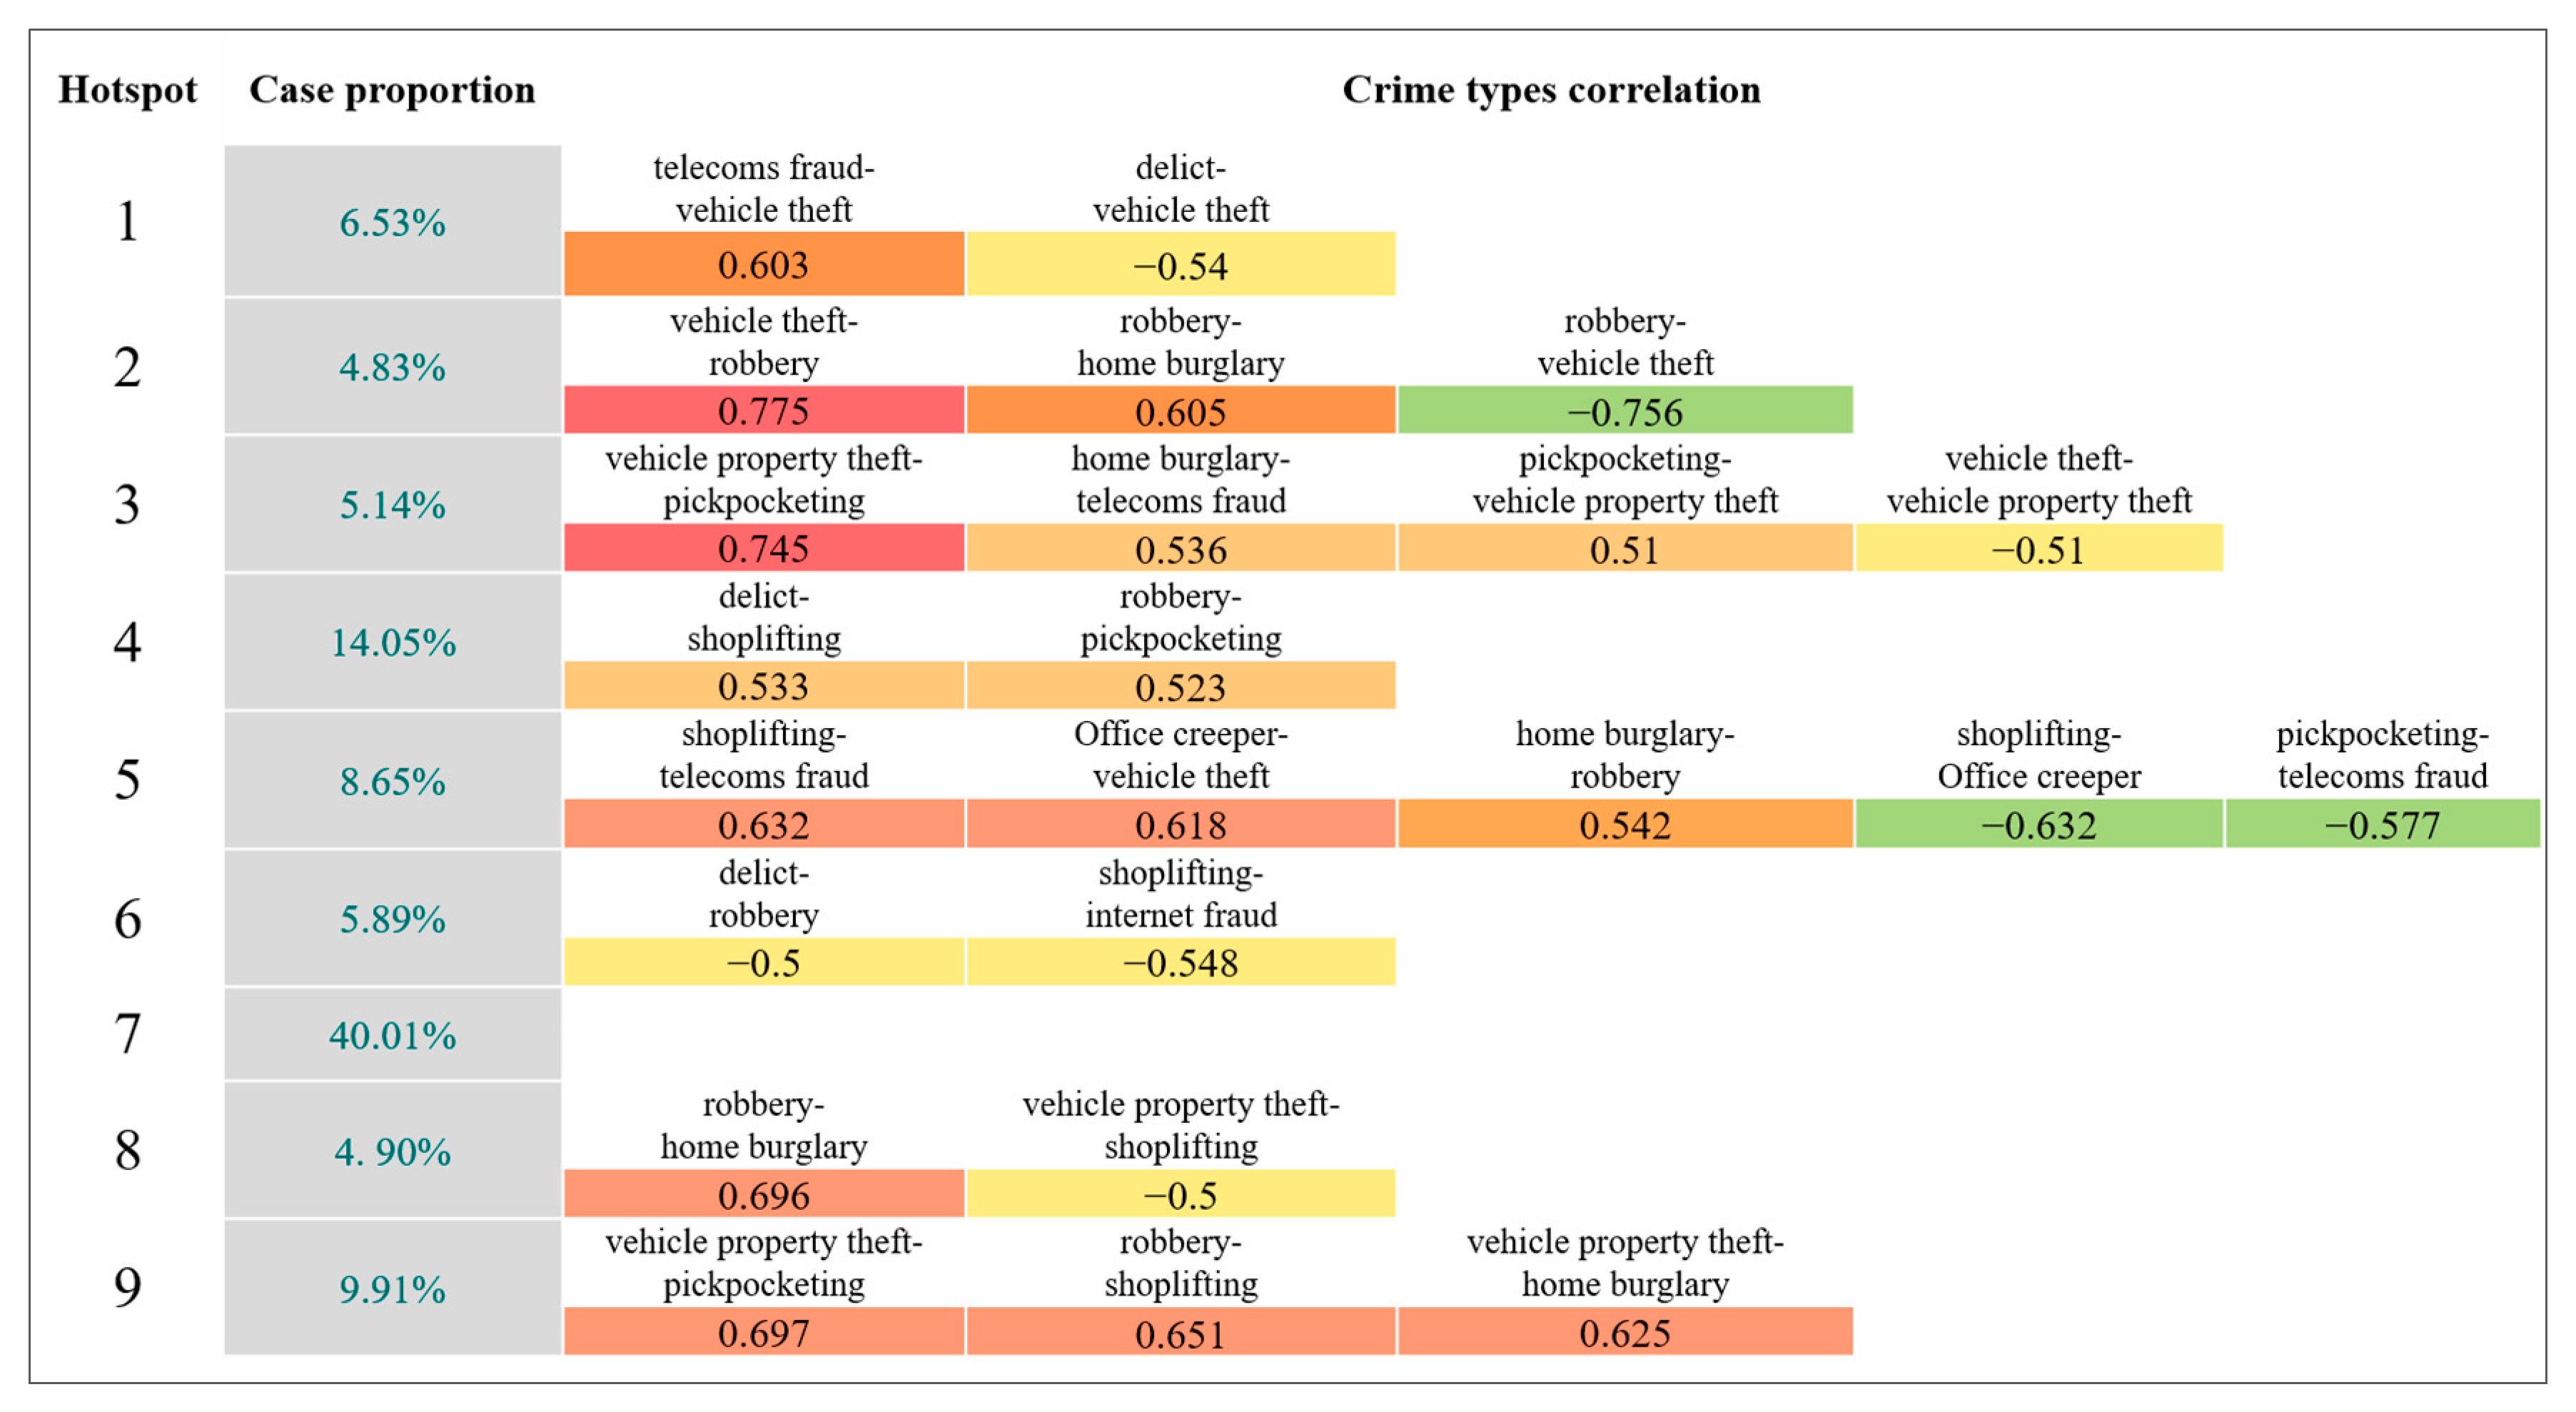
| Hotspot 1 | Telecom fraud and vehicle theft (0.603) showed a strong correlation, while delict and vehicle theft (−0.54) showed a moderate, negative correlation. |
| Hotspot 2 | Vehicle theft and robbery (0.775) showed a strong correlation; robbery and home burglary (0.605) showed a strong correlation; and robbery and vehicle theft (−0.756) showed a strong, negative correlation. |
| Hotspot 3 | Pickpocketing and vehicle property theft (0.51) showed a moderate correlation; vehicle property theft and pickpocketing (0.745) showed a strong correlation; home burglary and telecom fraud (0.536) showed a moderate correlation; and vehicle theft and vehicle property theft (−0.51) showed a moderate, negative correlation. |
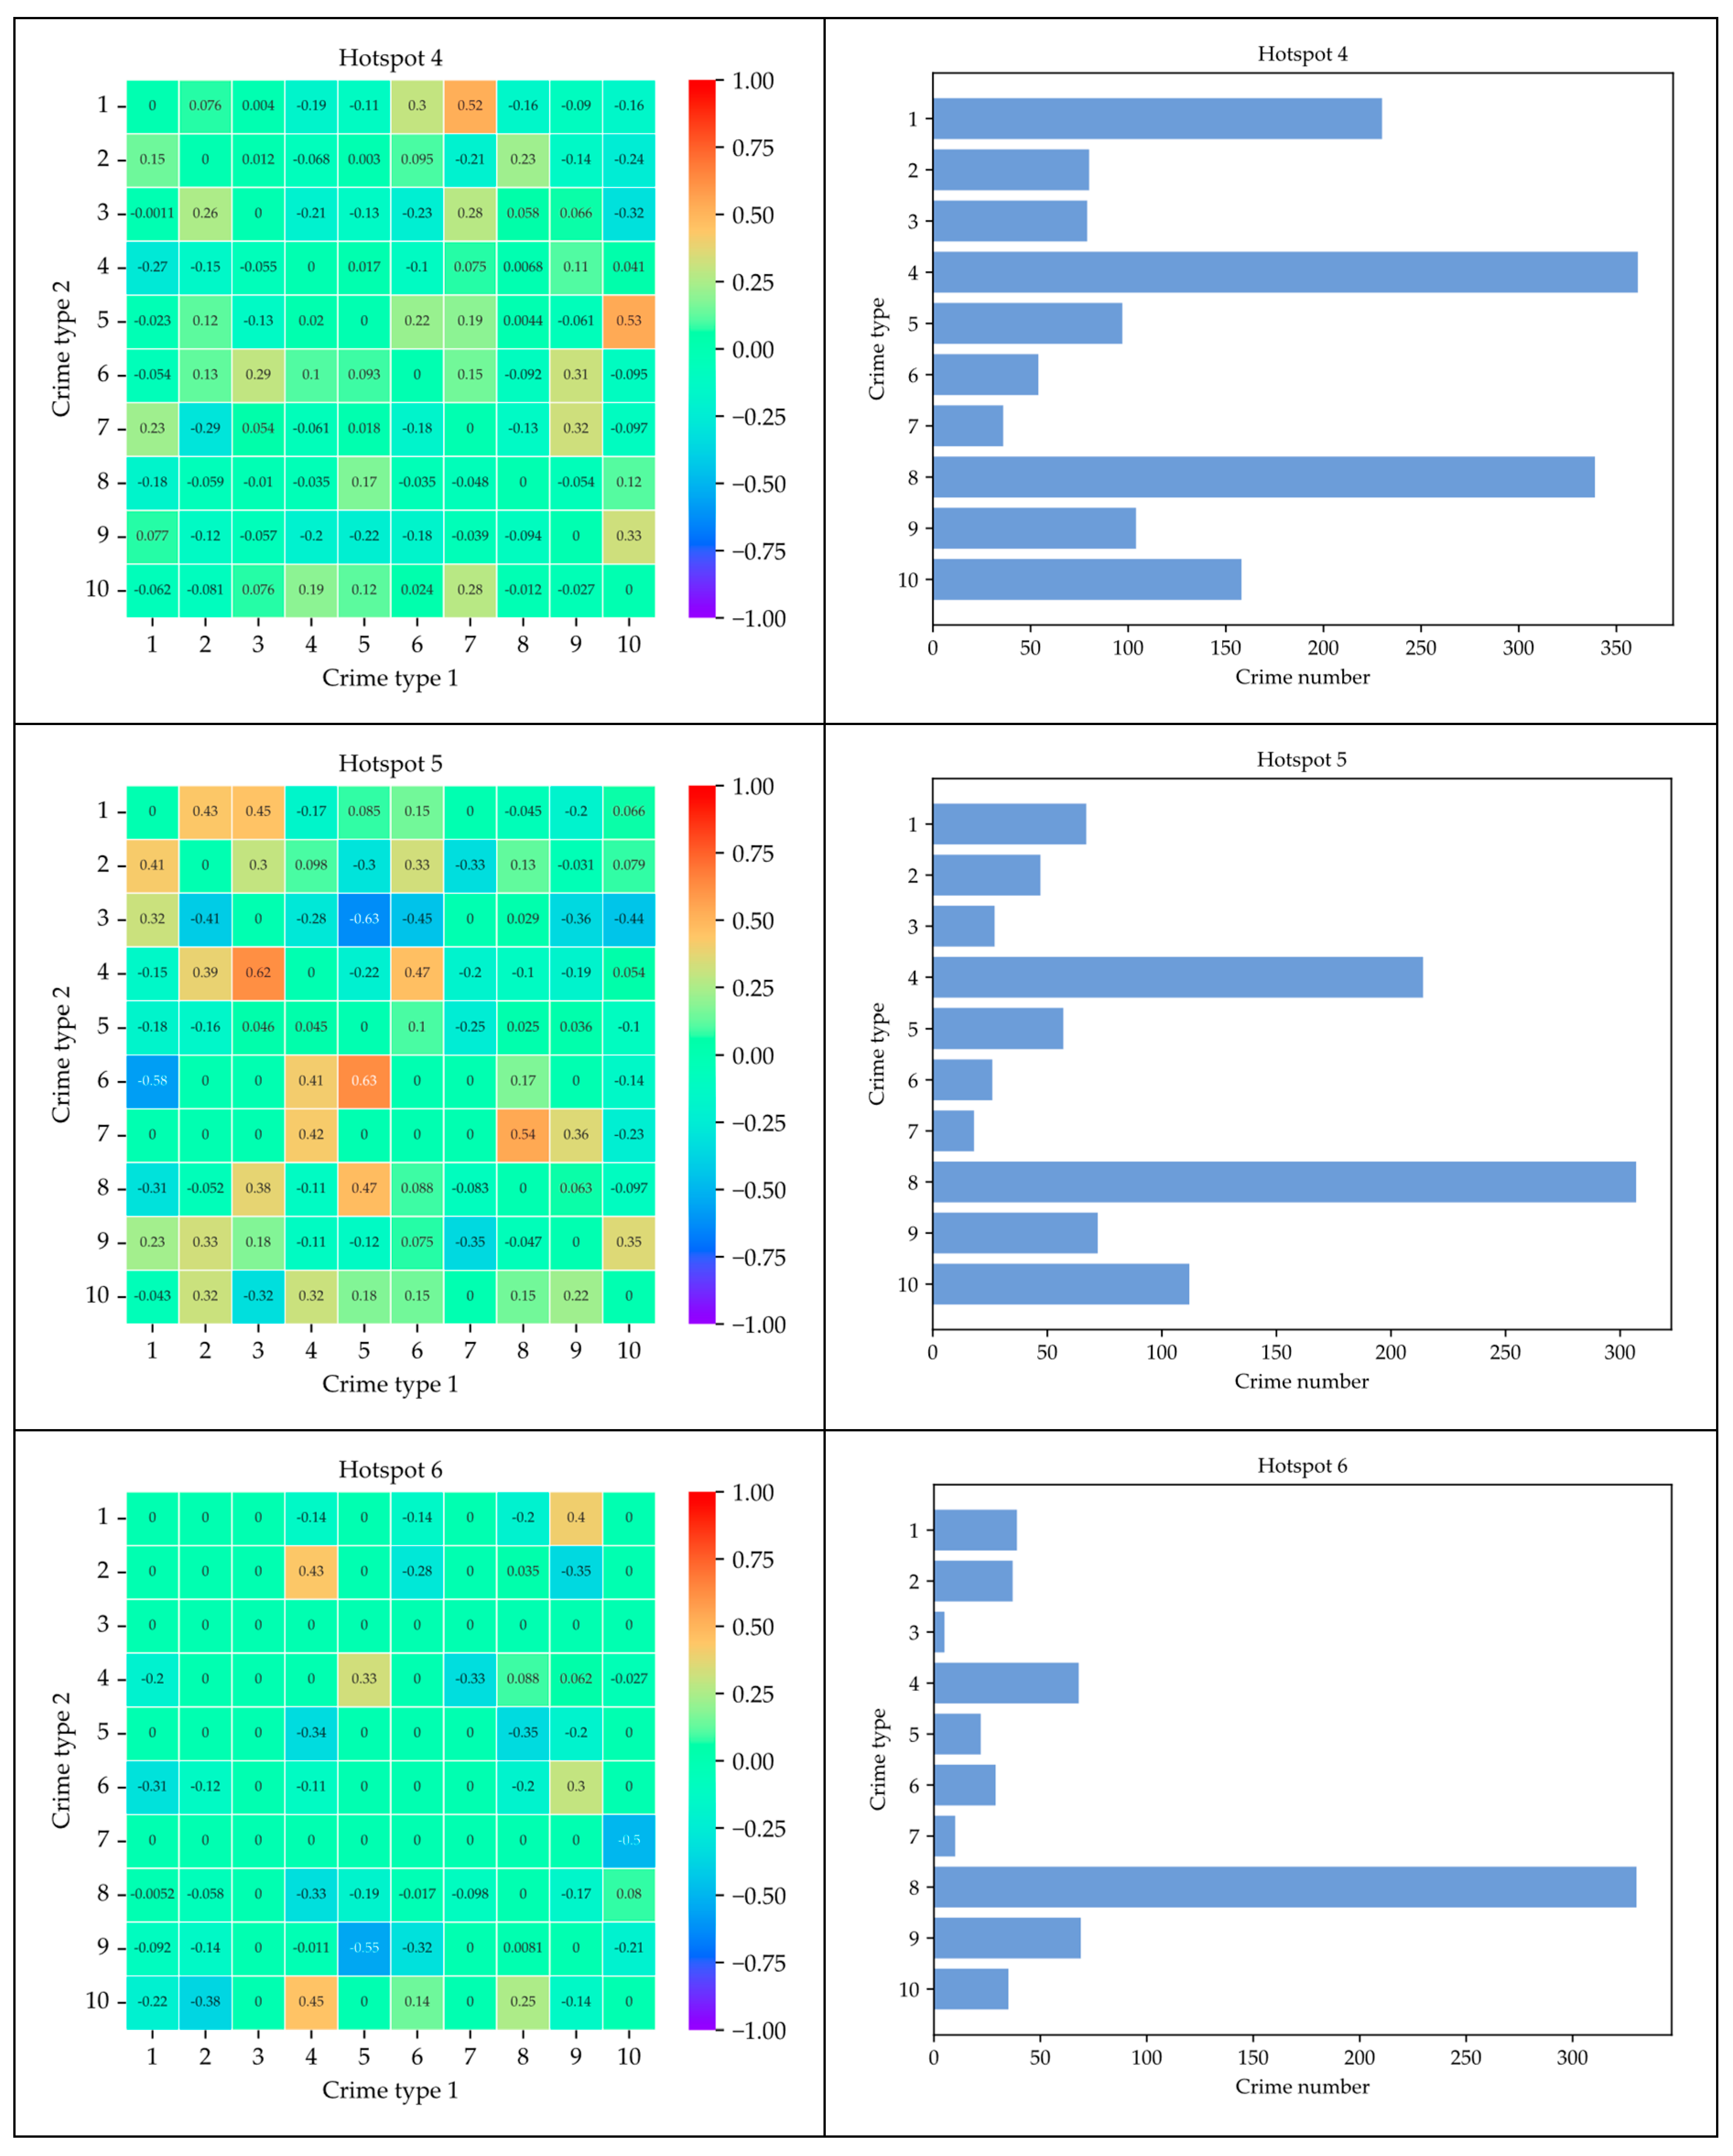
| Hotspot 4 | Robbery and pickpocketing (0.523) showed a moderate correlation, while delict and shoplifting (0.533) also showed a moderate correlation. |
| Hotspot 5 | Office creeper activity and vehicle theft showed a strong correlation (0.618); shoplifting and telecom fraud showed a strong correlation (0.632); home burglary and robbery were moderately correlated (0.542); pickpocketing and telecom fraud were moderately negatively correlated (−0.577); and shoplifting and office creeper activity were strongly negatively correlated (−0.632). |
| Hotspot 6 | Shoplifting and internet fraud (−0.548) showed a moderate, negative correlation, and delict and robbery (−0.5) also showed a moderate, negative correlation. |
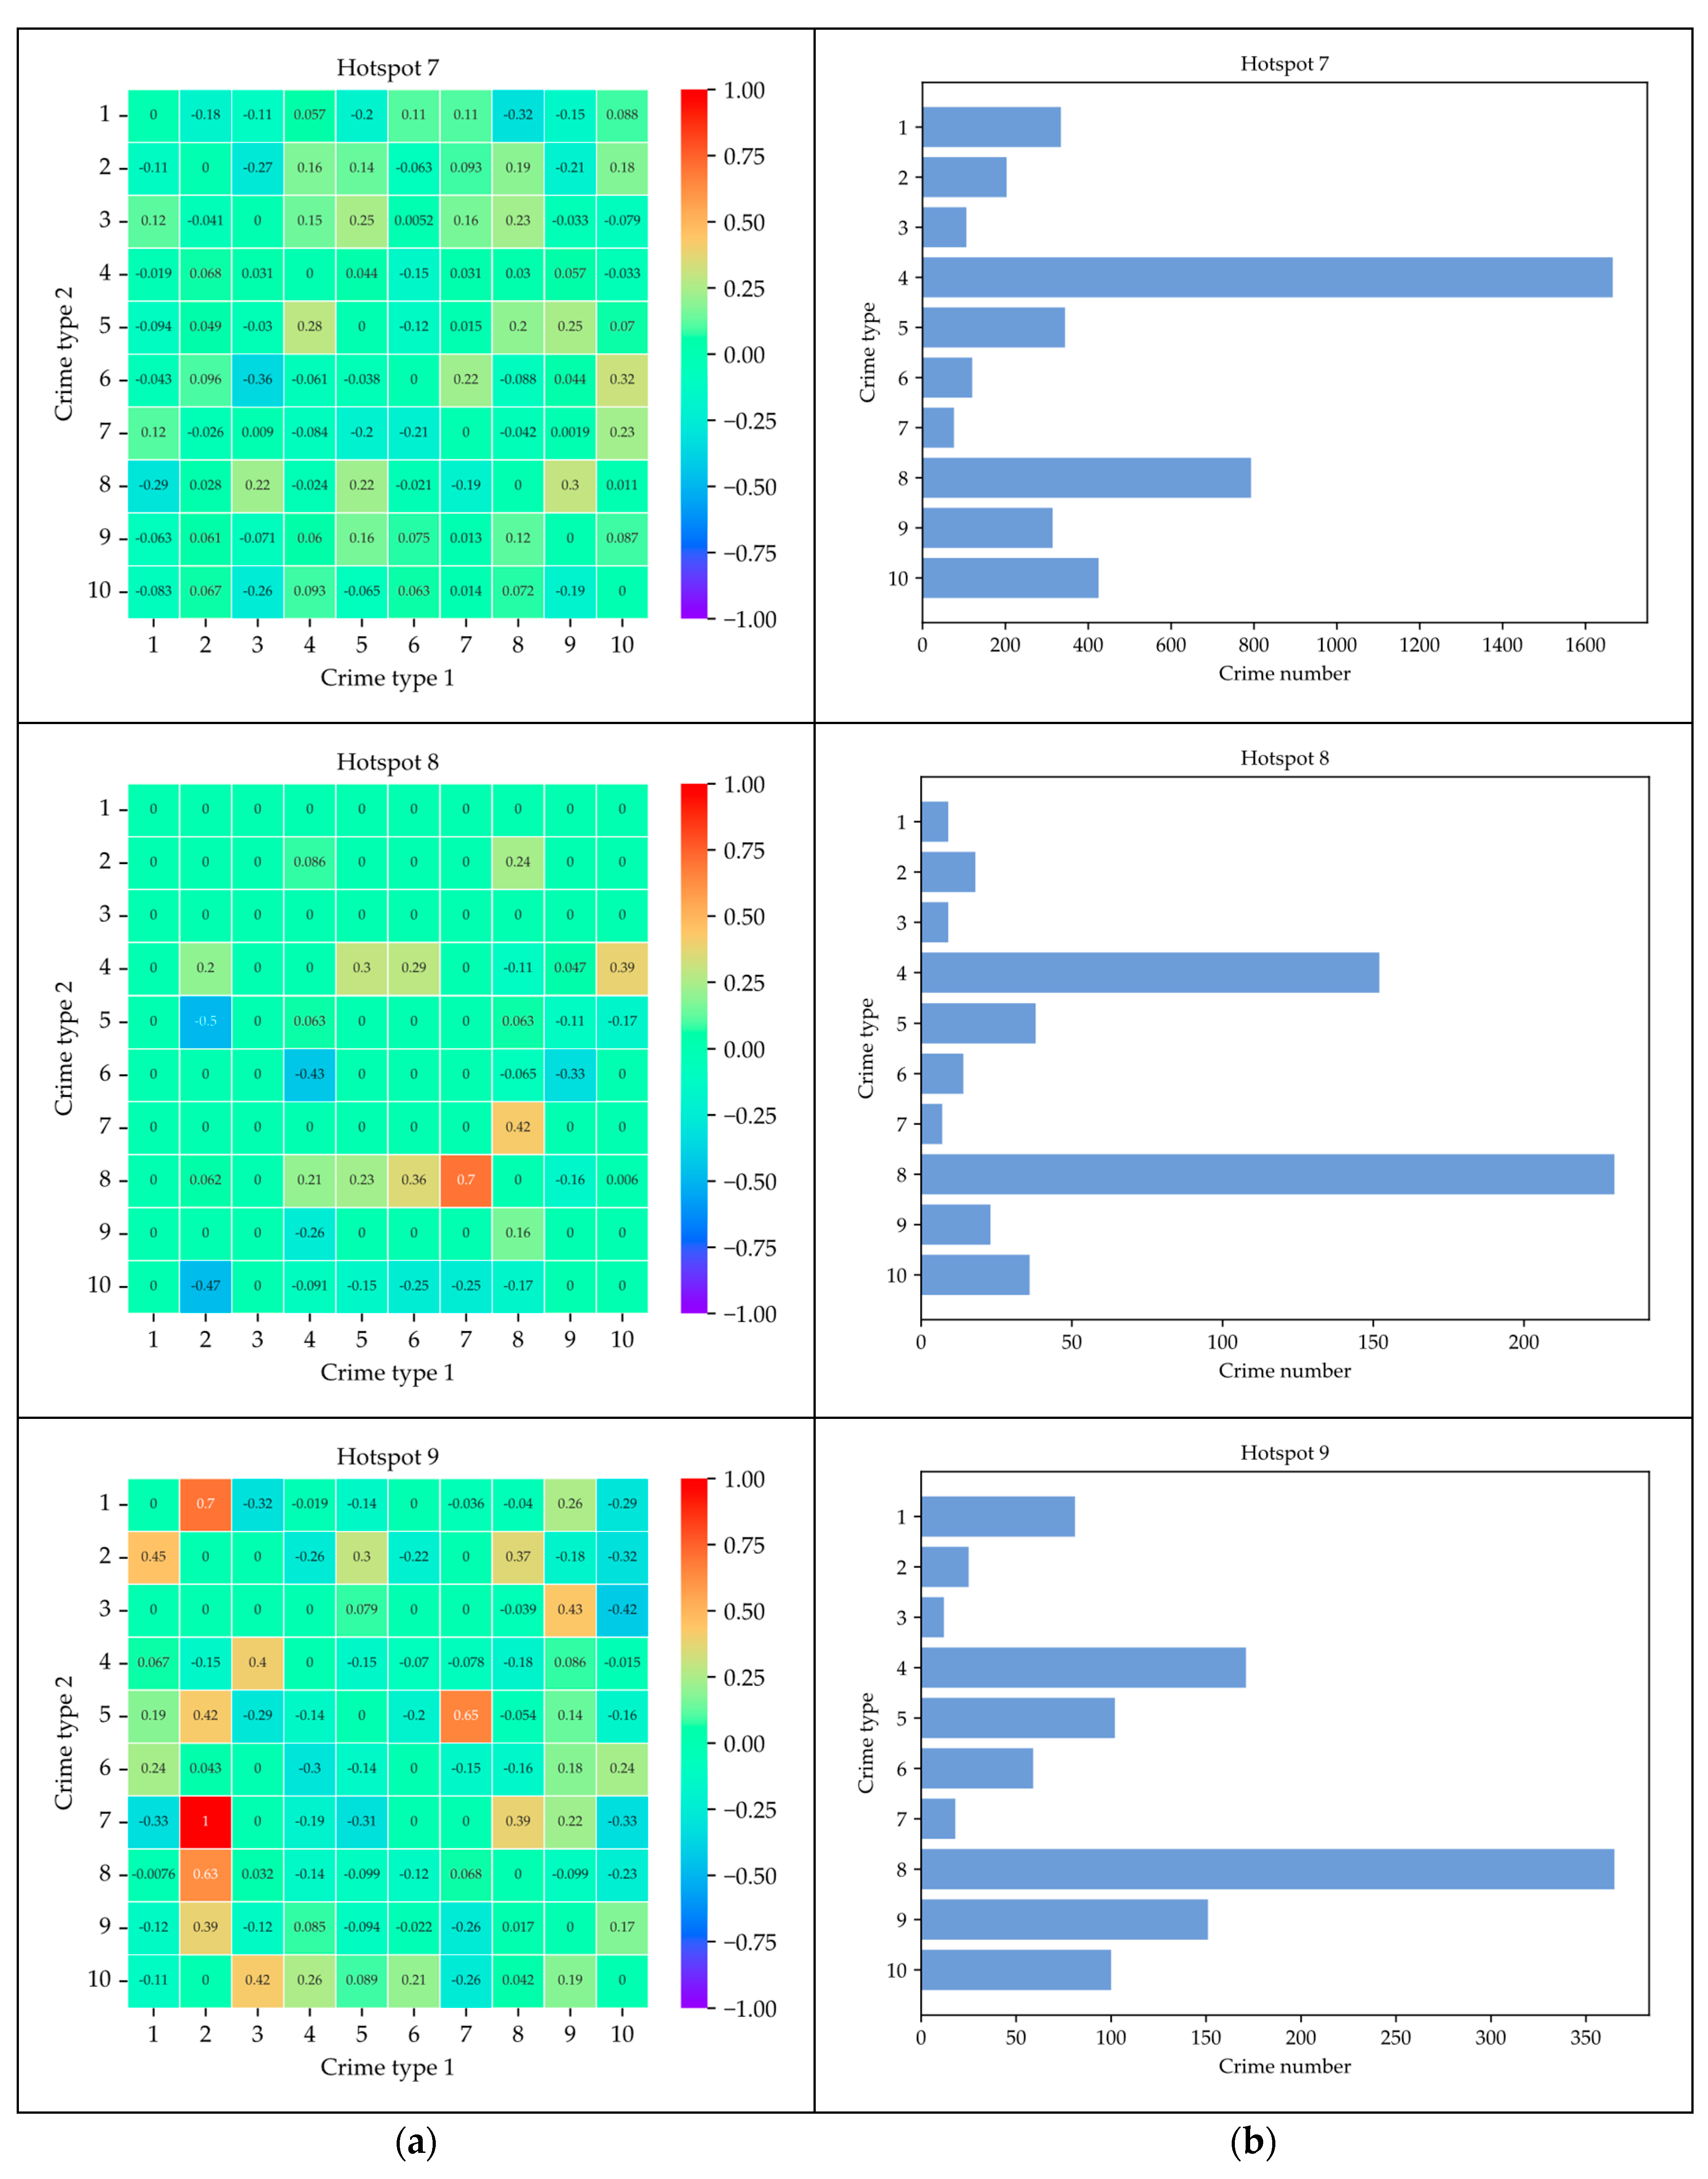
| Hotspot 7 | There were no obviously strongly related crime types. |
| Hotspot 8 | Robbery and home burglary (0.696) showed a strong correlation, while vehicle property theft and shoplifting (−0.5) showed a moderate, negative correlation. |
| Hotspot 9 | Vehicle property theft and pickpocketing showed a strong correlation (0.697); vehicle property theft and burglary were strongly correlated (0.625); and robbery and shoplifting showed a strong correlation (0.651). |
Disclaimer/Publisher’s Note: The statements, opinions and data contained in all publications are solely those of the individual author(s) and contributor(s) and not of MDPI and/or the editor(s). MDPI and/or the editor(s) disclaim responsibility for any injury to people or property resulting from any ideas, methods, instructions or products referred to in the content. |
© 2023 by the authors. Licensee MDPI, Basel, Switzerland. This article is an open access article distributed under the terms and conditions of the Creative Commons Attribution (CC BY) license (https://creativecommons.org/licenses/by/4.0/).
Share and Cite
Zhang, H.; Gao, Y.; Yao, D.; Zhang, J. Interaction of Crime Risk across Crime Types in Hotspot Areas. ISPRS Int. J. Geo-Inf. 2023, 12, 176. https://doi.org/10.3390/ijgi12040176
Zhang H, Gao Y, Yao D, Zhang J. Interaction of Crime Risk across Crime Types in Hotspot Areas. ISPRS International Journal of Geo-Information. 2023; 12(4):176. https://doi.org/10.3390/ijgi12040176
Chicago/Turabian StyleZhang, Hong, Yongping Gao, Dizhao Yao, and Jie Zhang. 2023. "Interaction of Crime Risk across Crime Types in Hotspot Areas" ISPRS International Journal of Geo-Information 12, no. 4: 176. https://doi.org/10.3390/ijgi12040176
APA StyleZhang, H., Gao, Y., Yao, D., & Zhang, J. (2023). Interaction of Crime Risk across Crime Types in Hotspot Areas. ISPRS International Journal of Geo-Information, 12(4), 176. https://doi.org/10.3390/ijgi12040176