

The Think-Aloud Method for Evaluating the Usability of a Regional Atlas


Abstract
1. Introduction
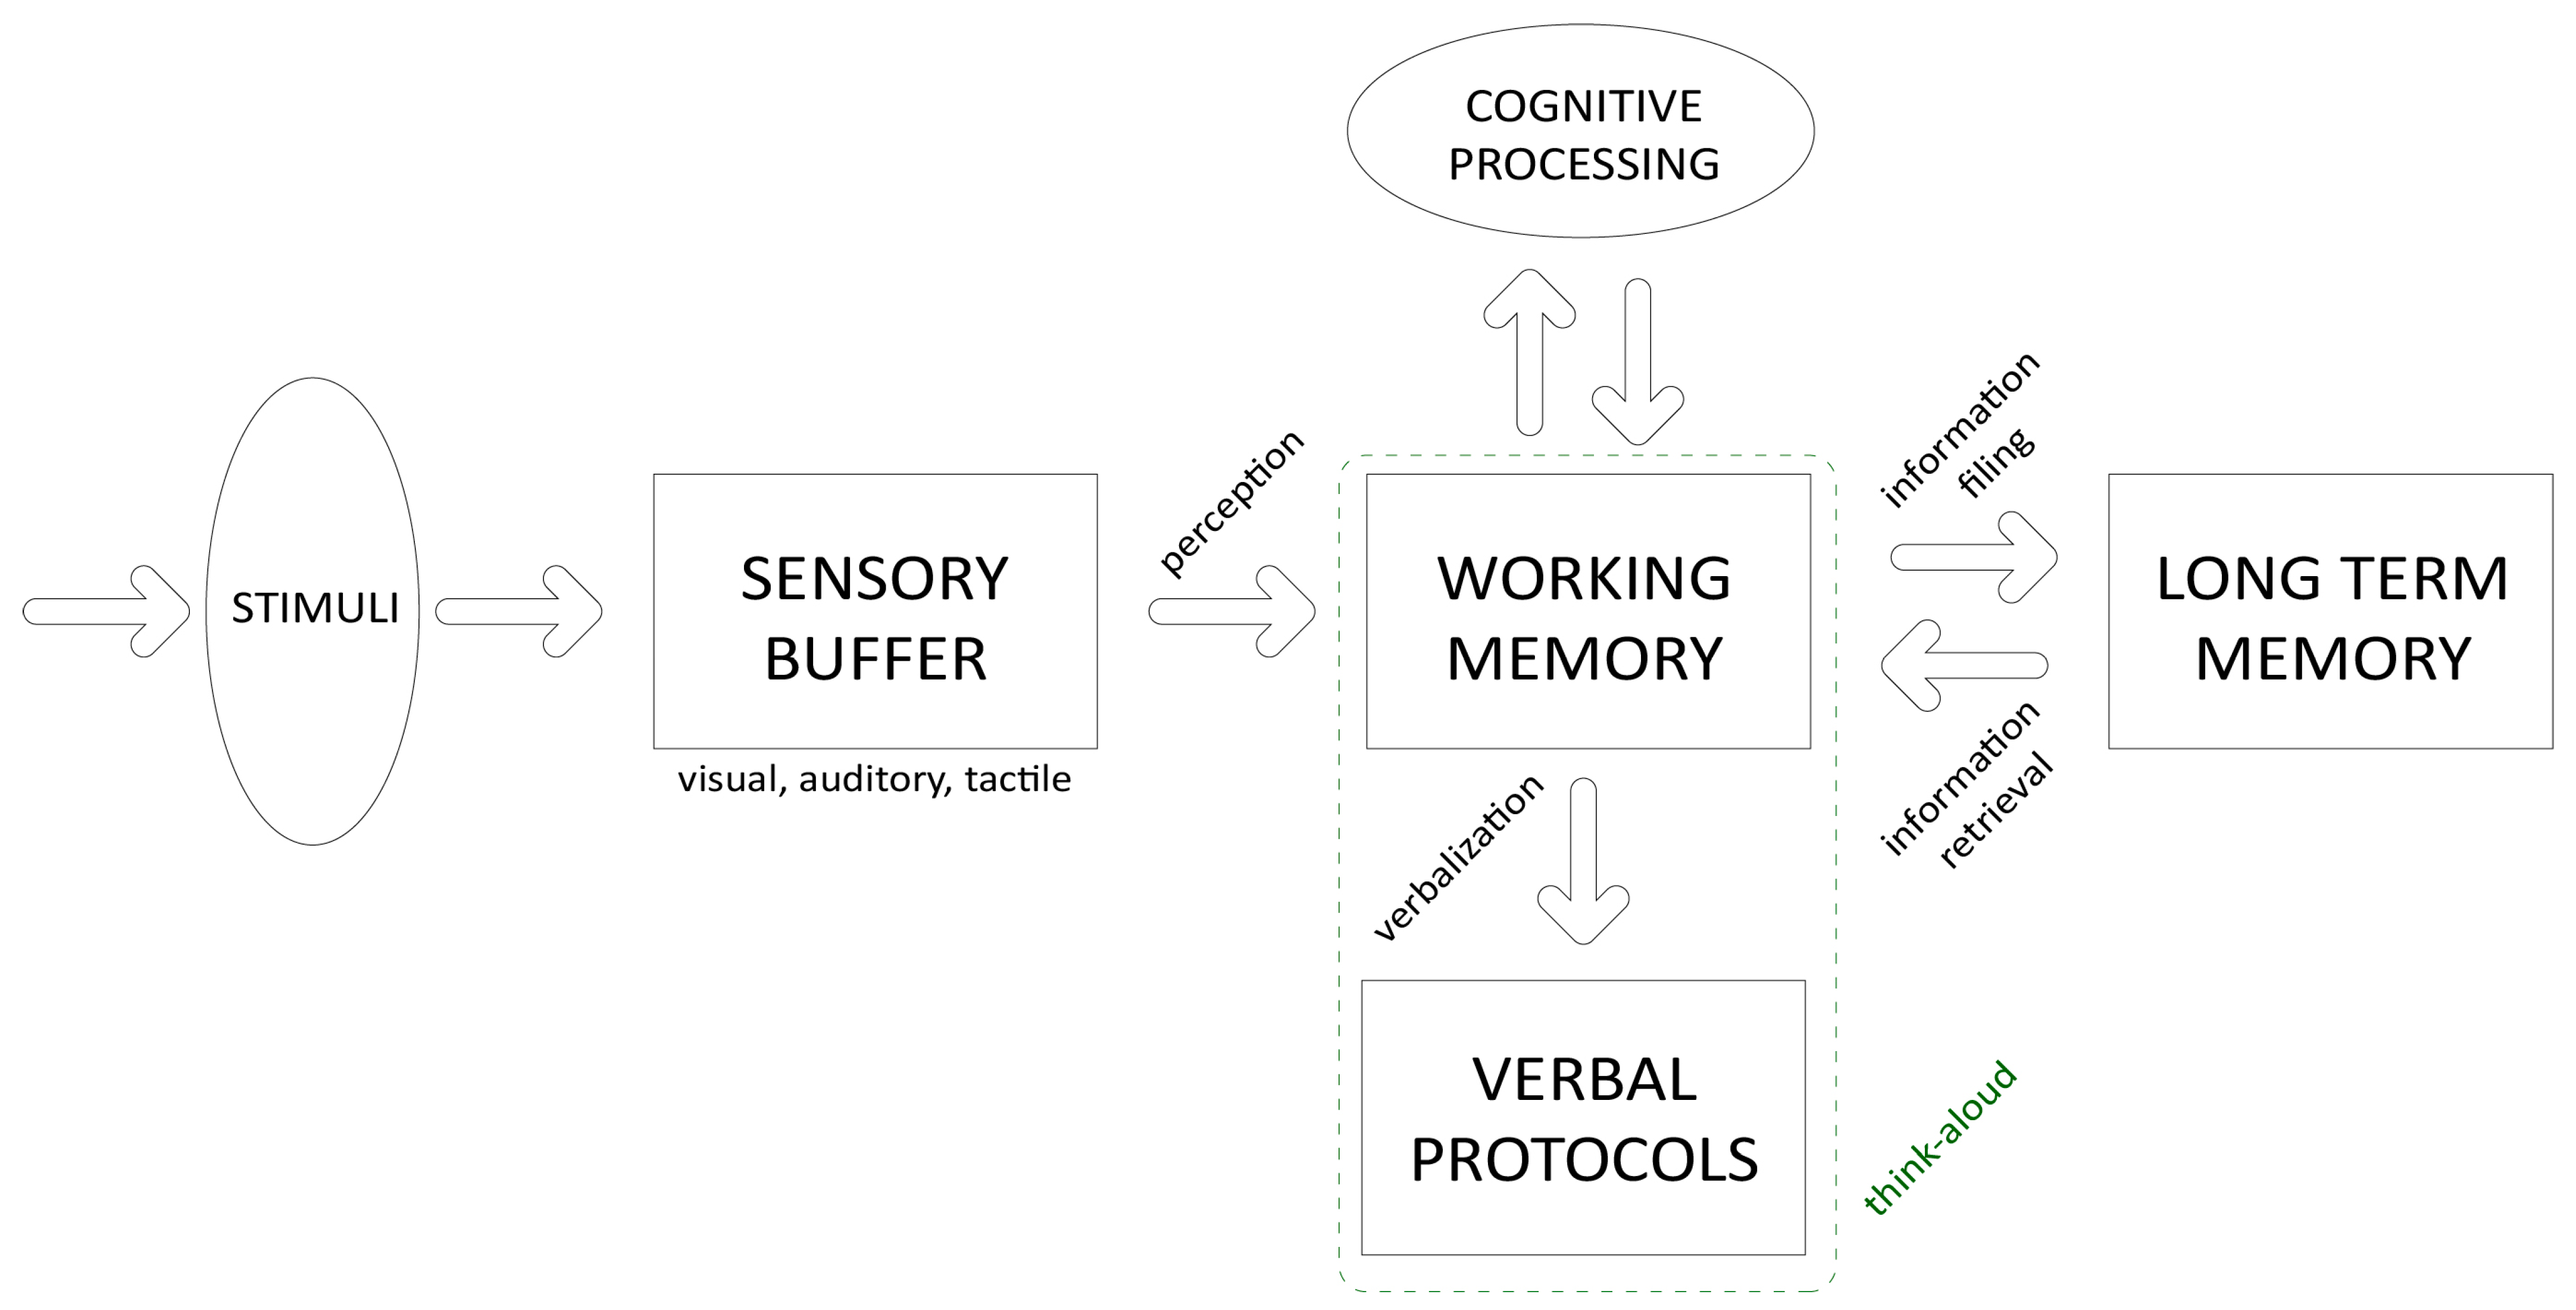
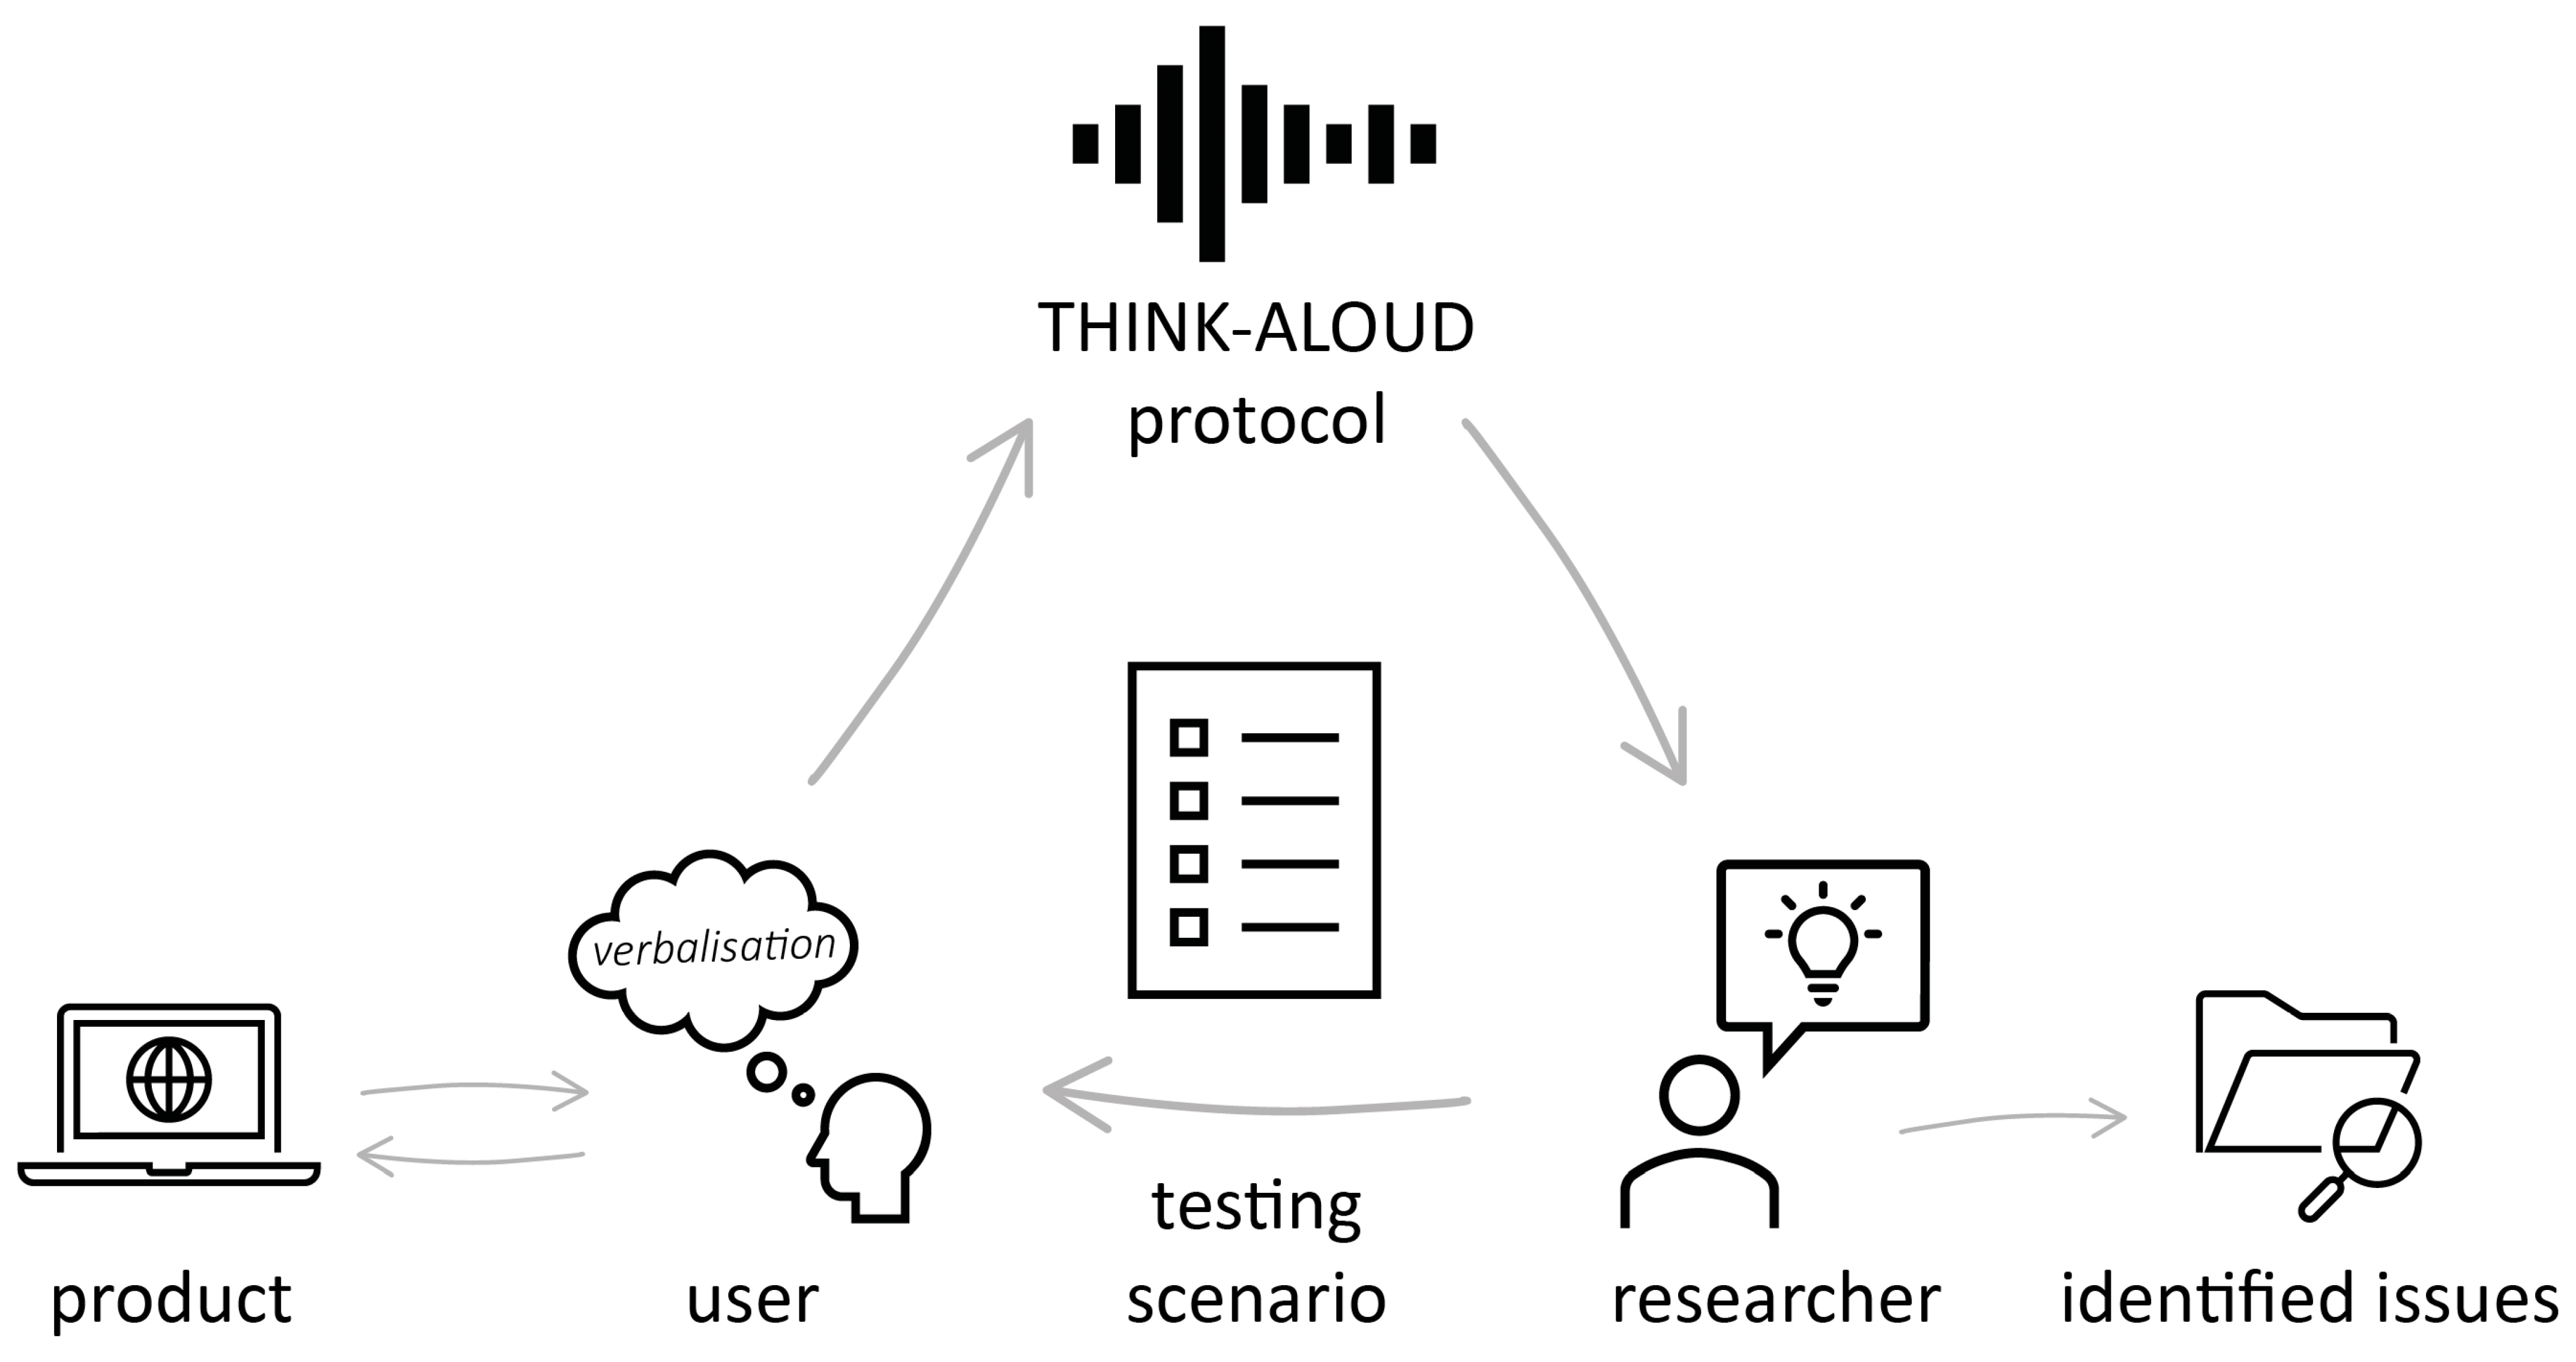
1.1. Principle of the Think-Aloud Method
1.2. General Origins of the Think-Aloud Method
1.3. Applications in Cartography
1.4. Objectives of the Study
2. Materials and Methods
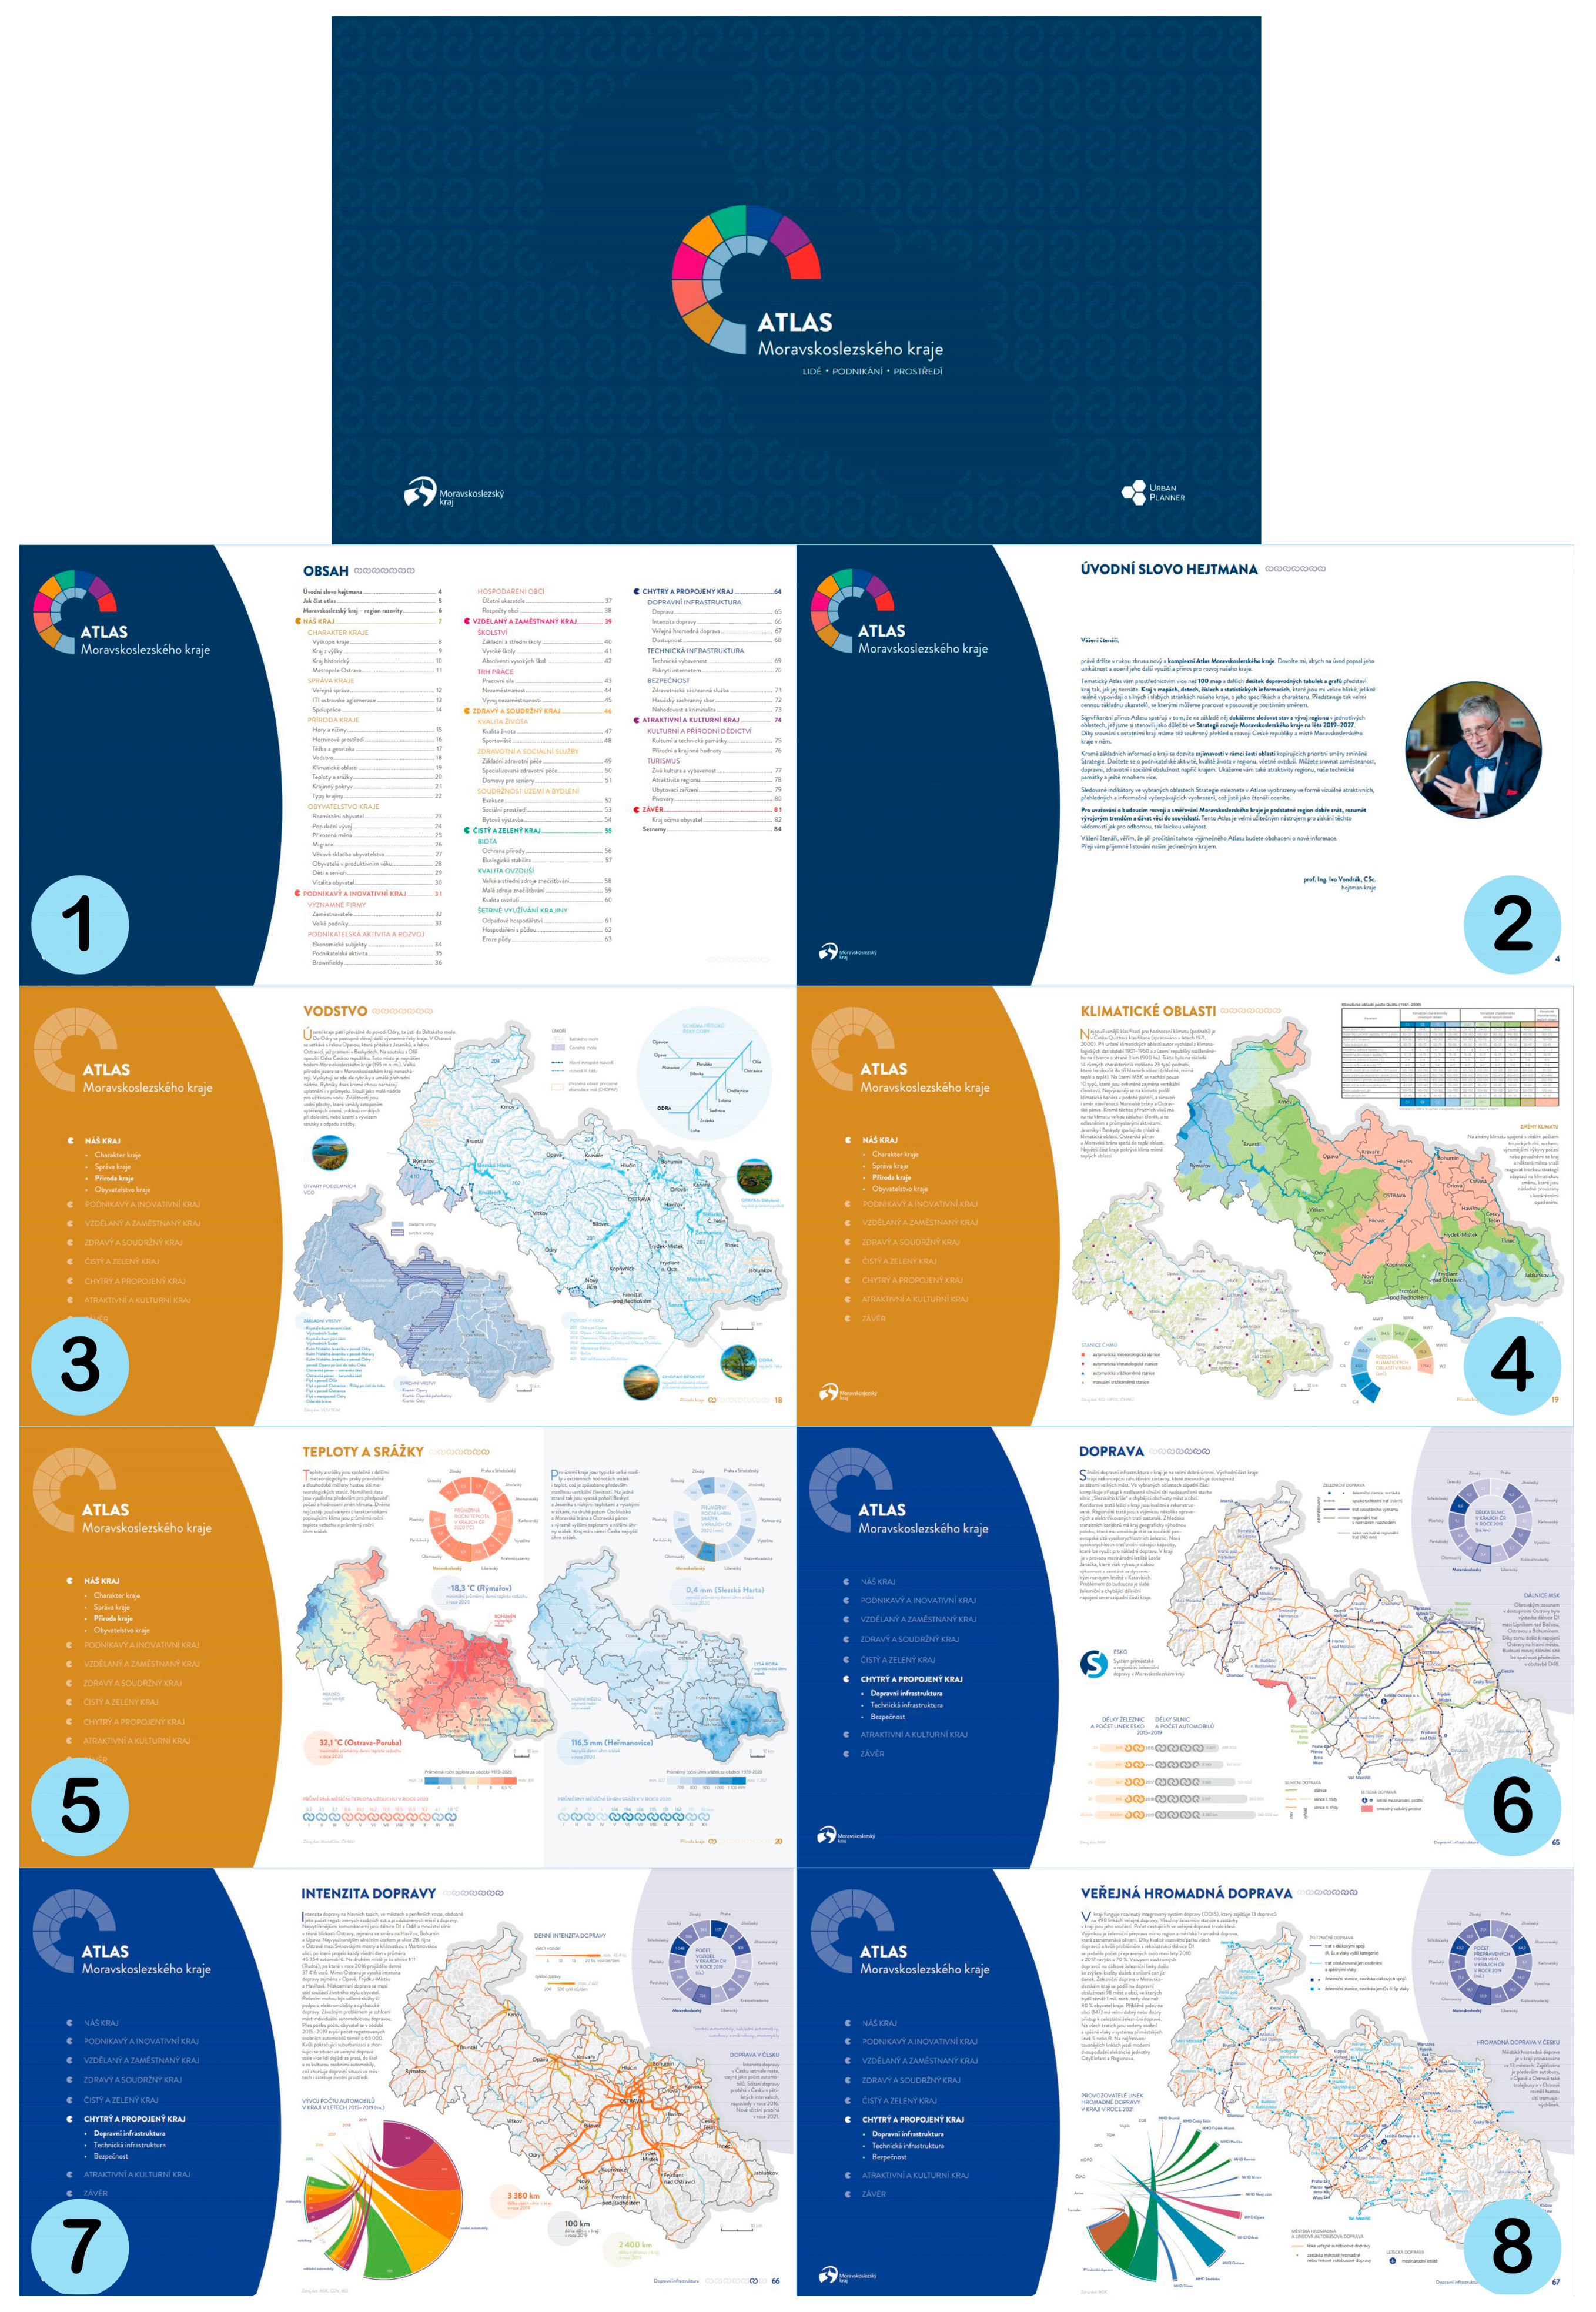
2.1. Evaluated Product
2.2. Testing Scenario
2.3. Participants
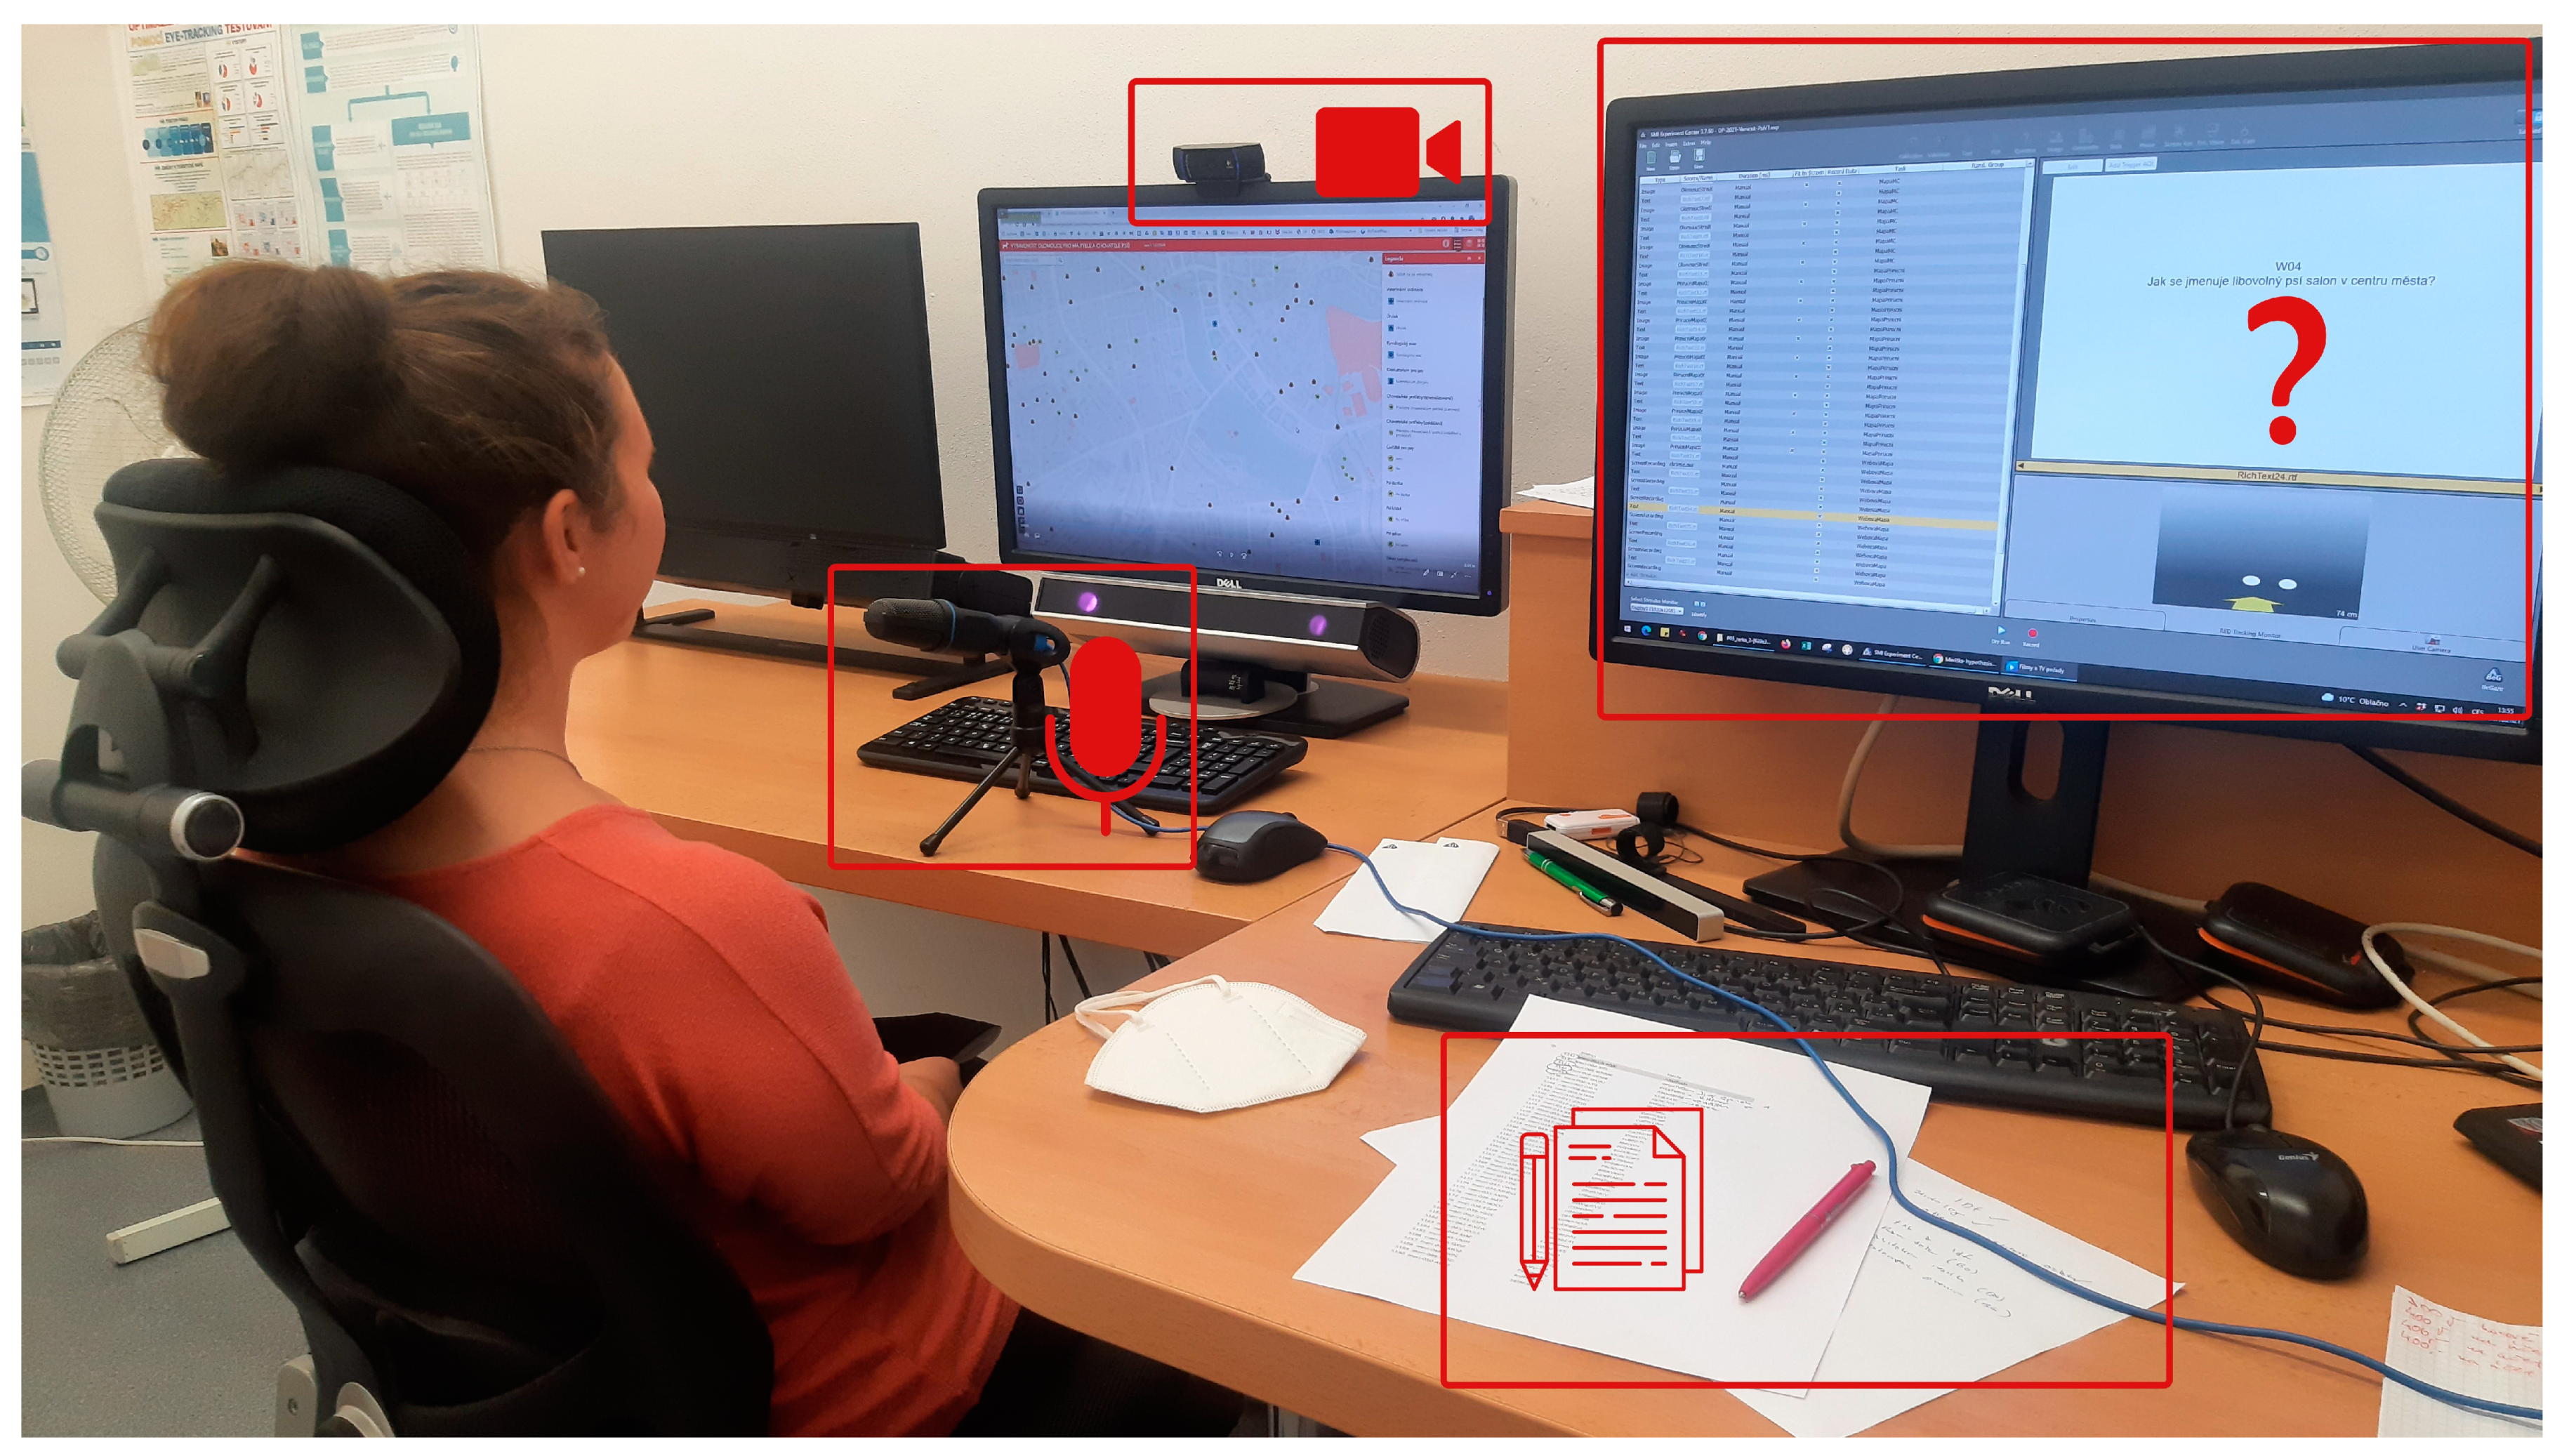
2.4. Experiment Design
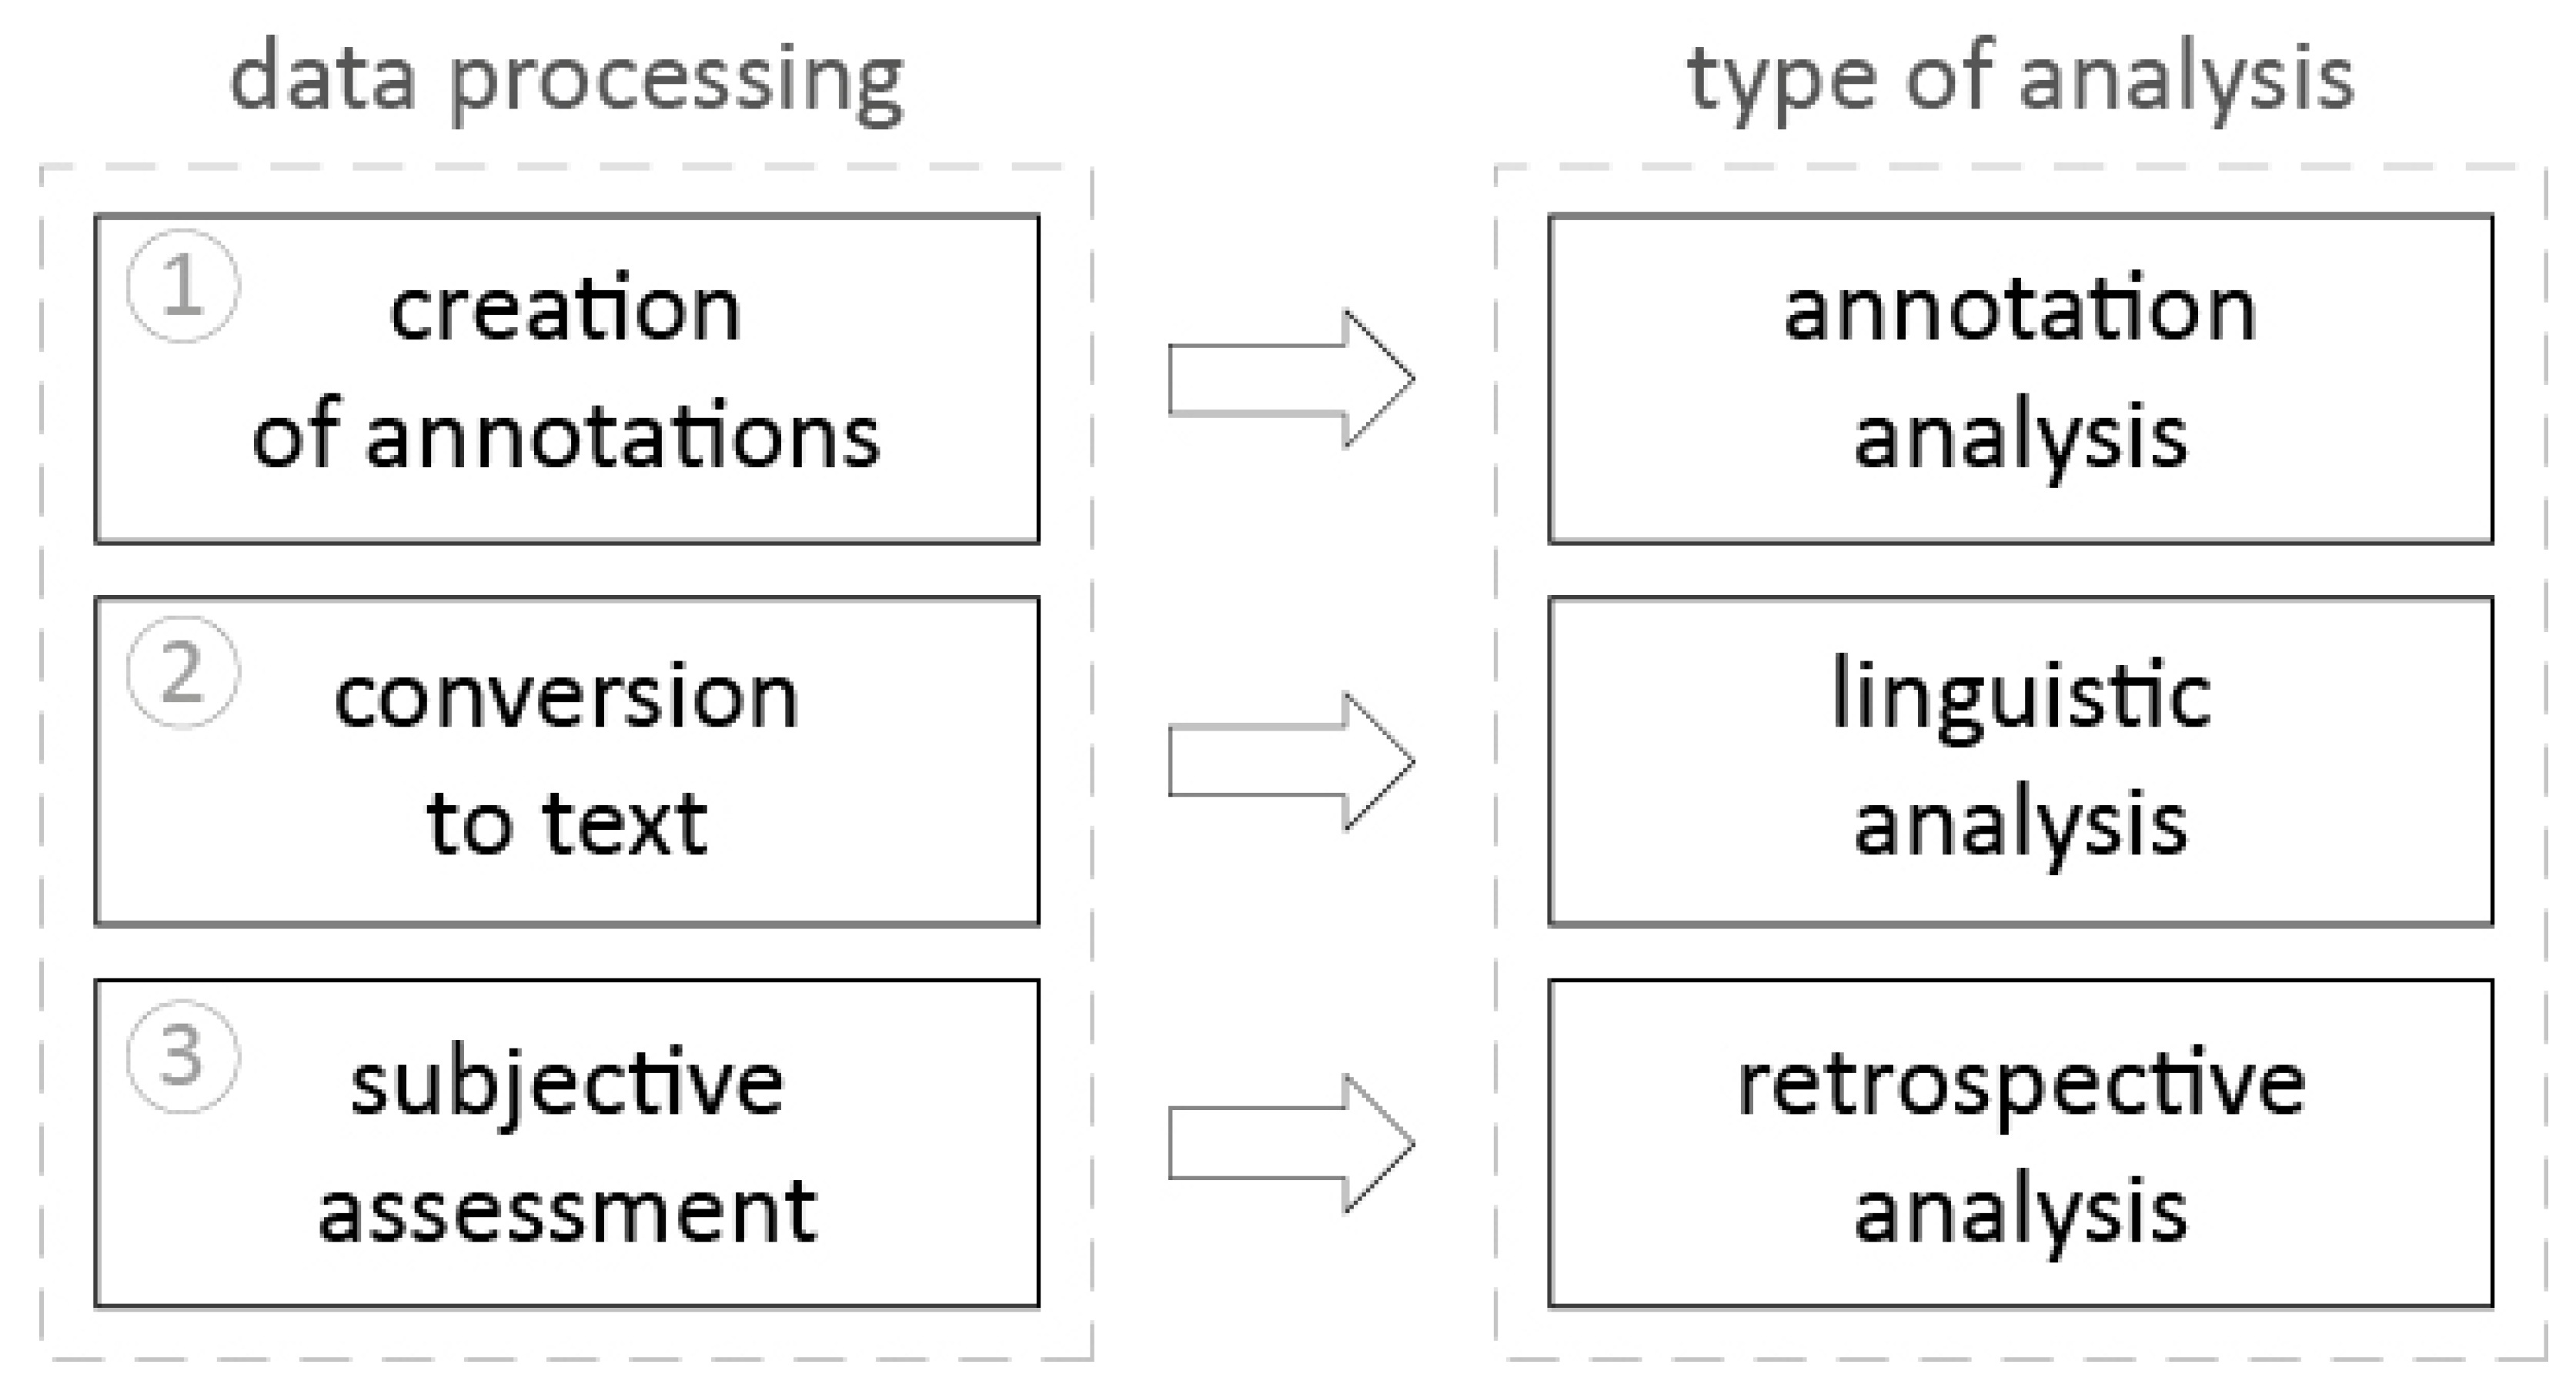
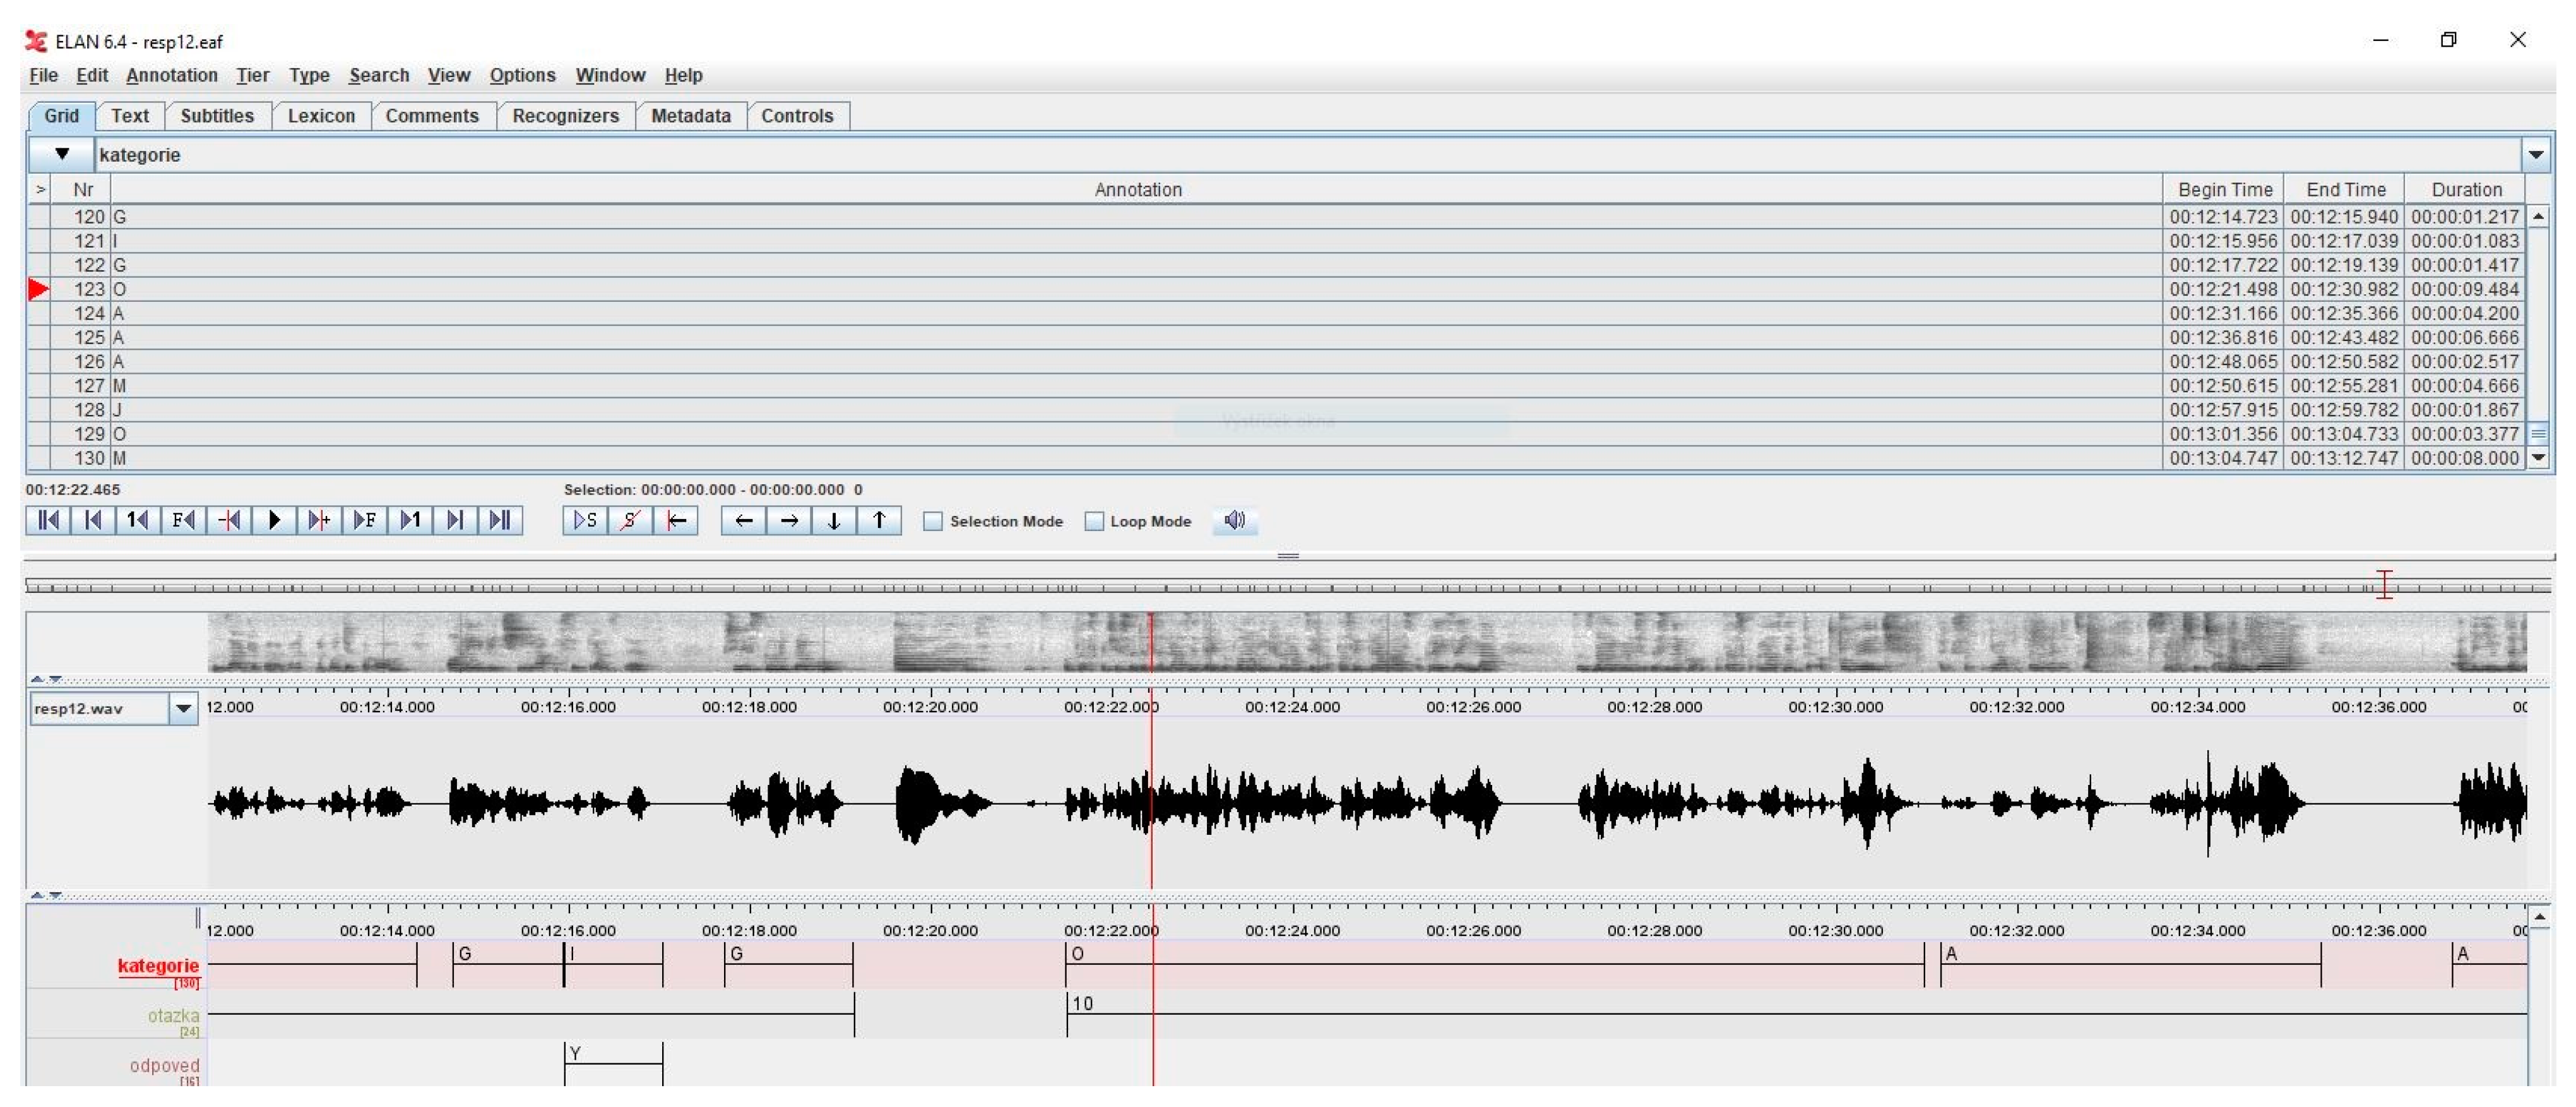
2.5. Data Analysis
2.5.1. Evaluation: Annotation Analysis
2.5.2. Evaluation: A Linguistic Analysis
2.5.3. Evaluation: A Retrospective Analysis
3. Results
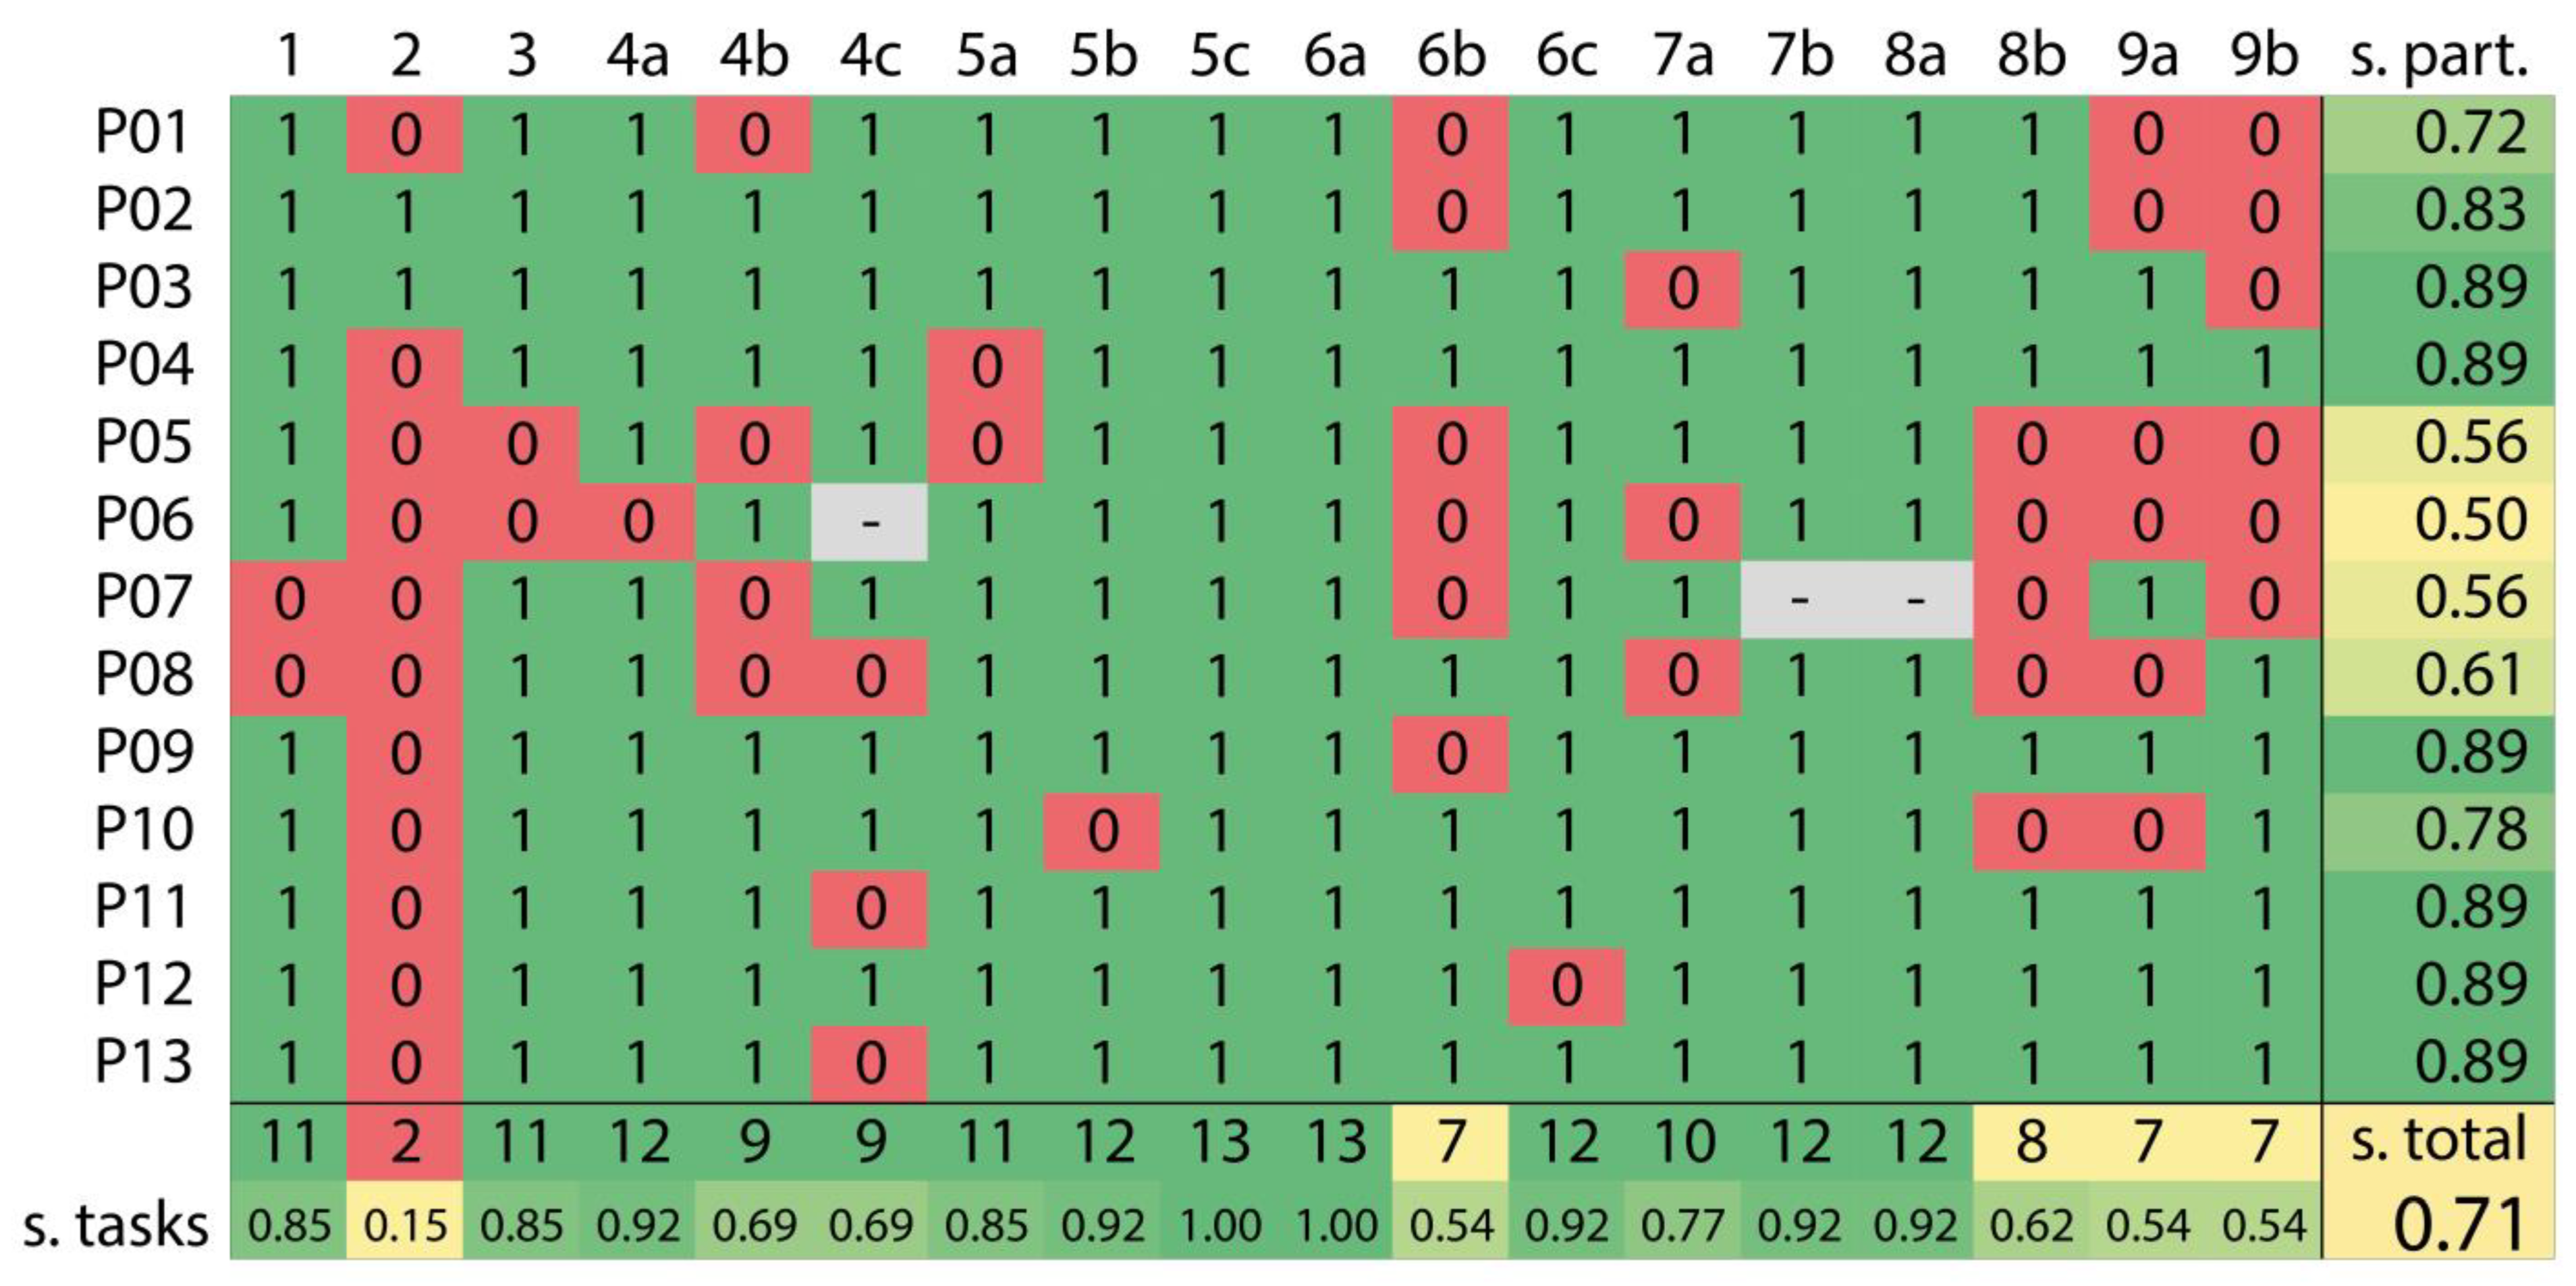
3.1. Effectiveness
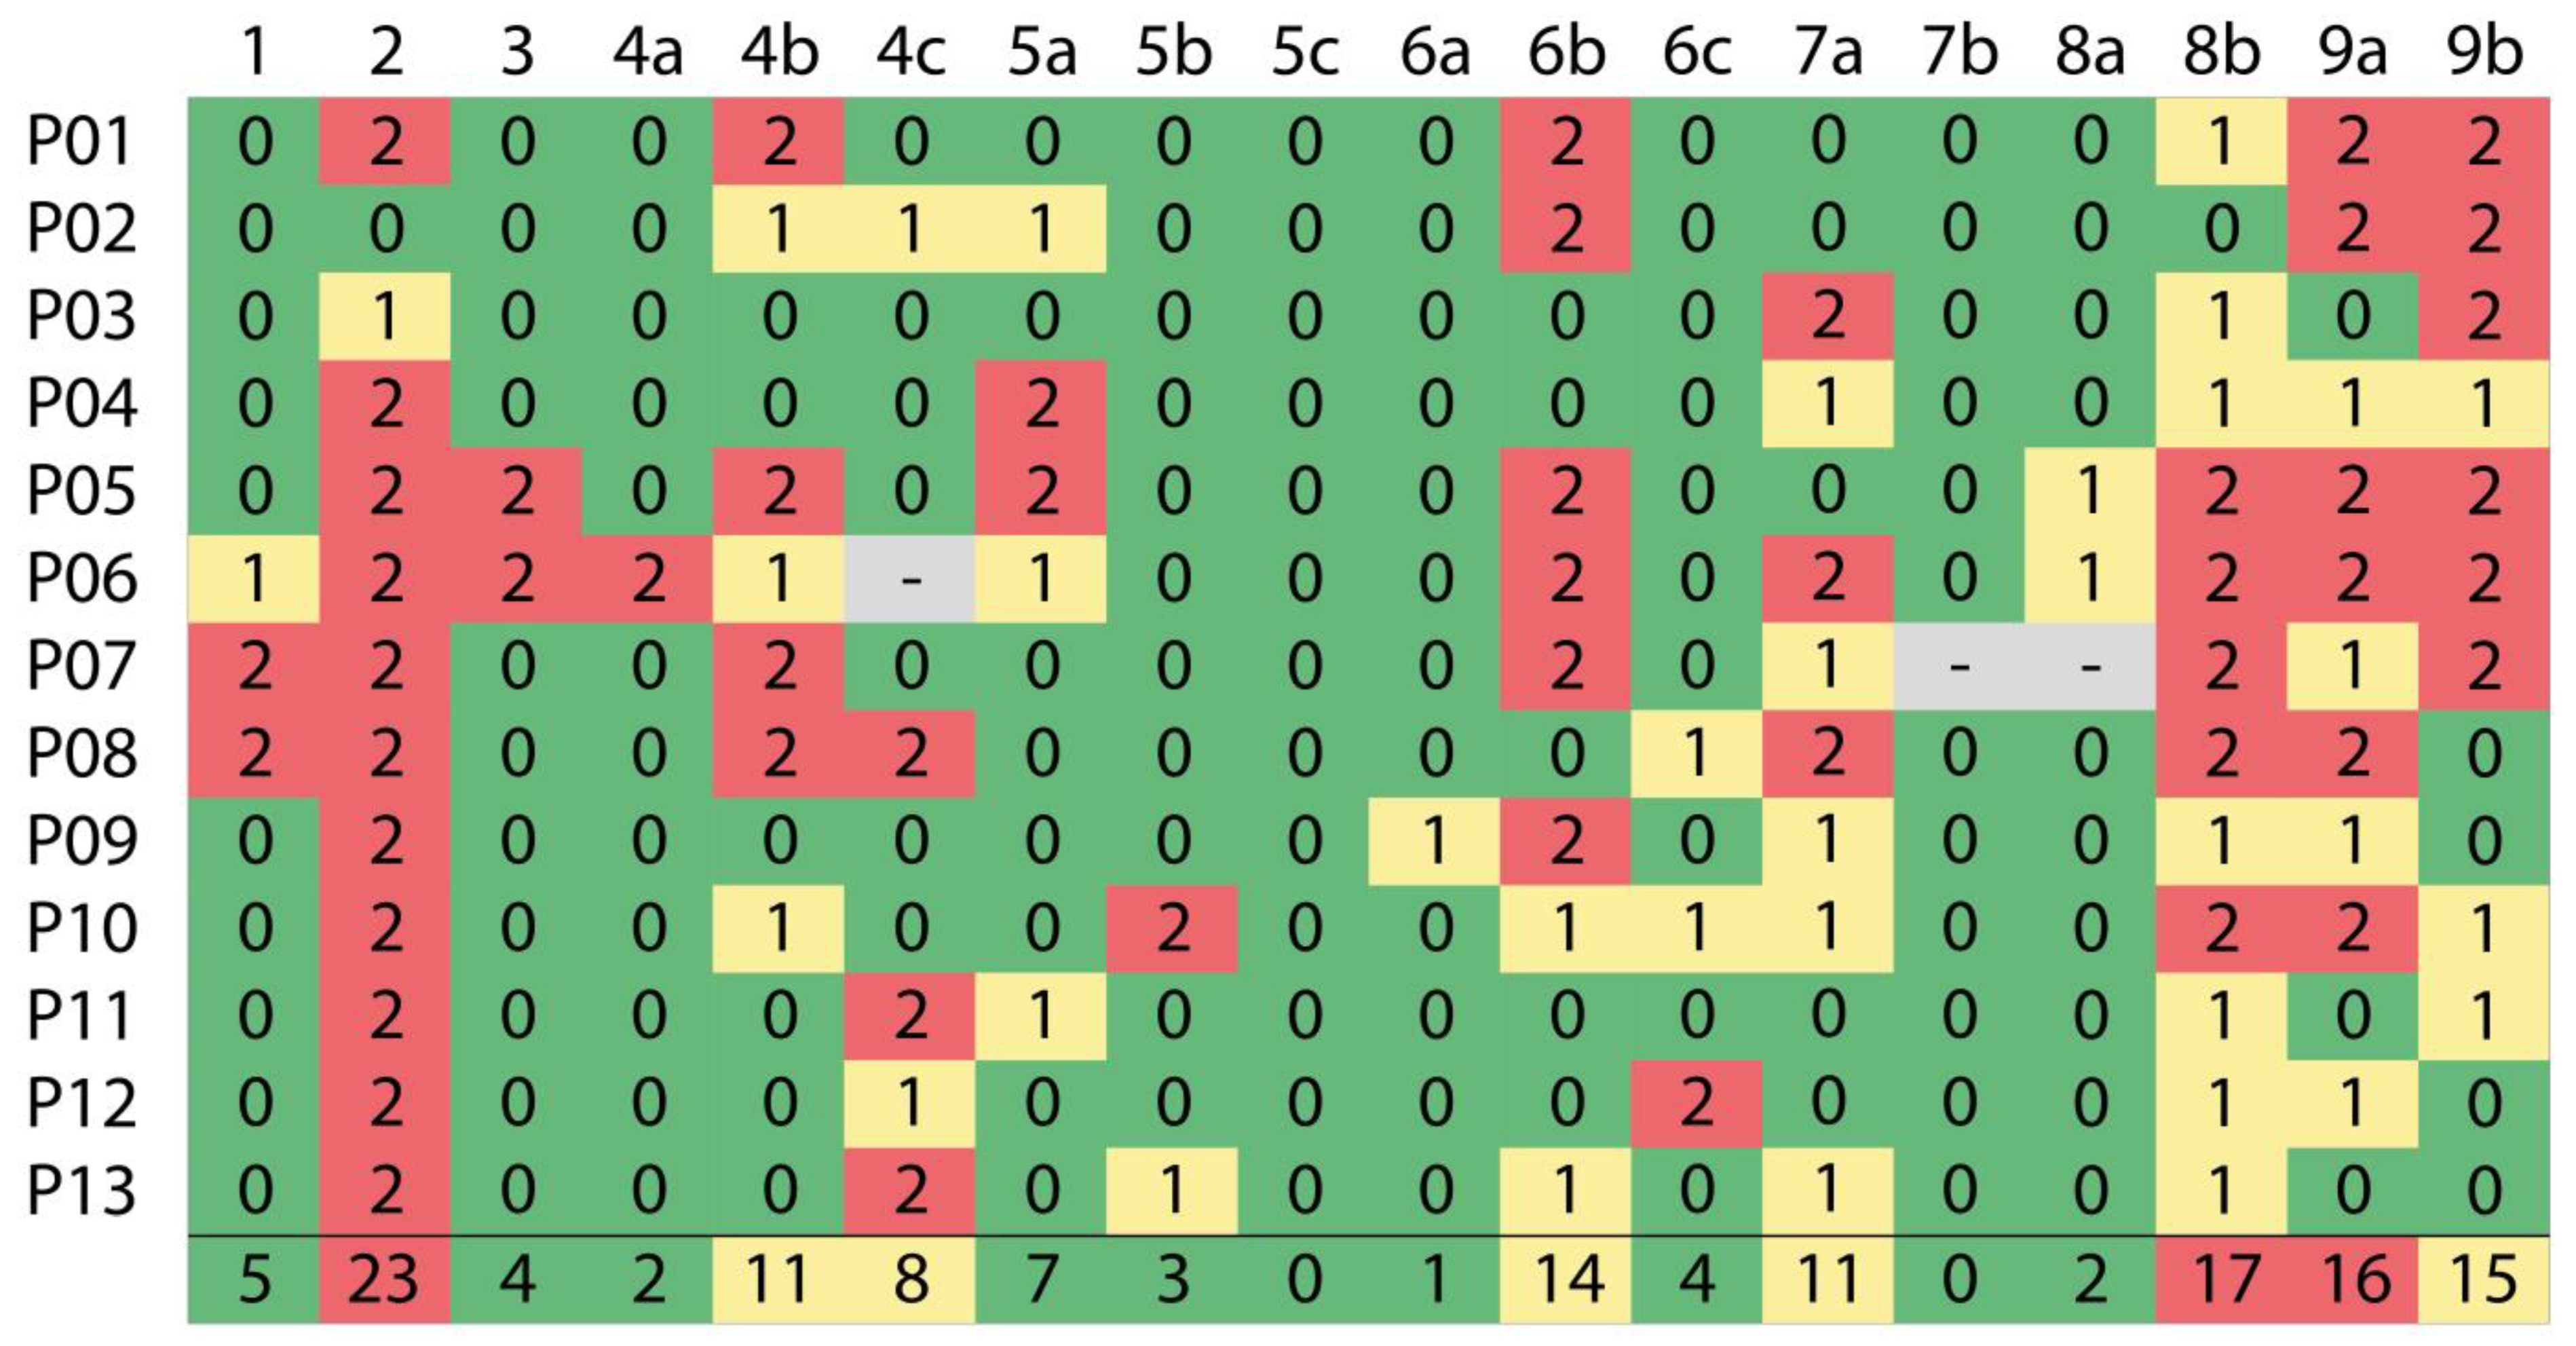
3.2. Efficiency
3.3. Satisfaction
4. Discussion
5. Conclusions
Author Contributions
Funding
Data Availability Statement
Acknowledgments
Conflicts of Interest
References
- I.O.f. ISO 9241-11; 2018—Ergonomics of Human-System Interaction—Part 11: Usability: Definitions and Concepts. HCI International: Los Angeles, CA, USA, 2018.
- Dumas, J.S.; Redish, J. A Practical Guide to Usability Testing; Intellect Books: Bristol, UK, 1999. [Google Scholar]
- Nielsen, J. Usability Engineering; Morgan Kaufmann: Burlington, MA, USA, 1994. [Google Scholar]
- Chen, W.P.; Lin, T.; Chen, L.; Yuan, P.S. Automated comprehensive evaluation approach for user interface satisfaction based on concurrent think-aloud method. Univers. Access Inf. Soc. 2018, 17, 635–647. [Google Scholar] [CrossRef]
- Heller, D. Thinking aloud as a research method. Ceskoslovenska Psychol. 2005, 49, 554–562. [Google Scholar]
- Duarte, N.P.; Korelo, J.C. The use of the think aloud verbal protocol for tracking processes in research on the consumer decision-making. Rev. Bras. De Mark. 2017, 16, 317–333. [Google Scholar] [CrossRef]
- Habibi, M.R.M.; Khajouei, R.; Eslami, S.; Jangi, M.; Ghalibaf, A.K.; Zangouei, S. Usability testing of bed information management system: A think-aloud method. J. Adv. Pharm. Technol. Res. 2018, 9, 153–157. [Google Scholar] [CrossRef]
- Chang, C.C.; Johnson, T. Integrating heuristics and think-aloud approach to evaluate the usability of game-based learning material. J. Comput. Educ. 2021, 8, 137–157. [Google Scholar] [CrossRef]
- Smith, J.G.; Alamiri, N.S.; Biegger, G.; Frederick, C.; Halbert, J.P.; Ingersoll, K.S. Think-Aloud Testing of a Novel Safer Drinking App for College Students During COVID-19: Usability Study. JMIR Form. Res. 2022, 6, e32716. [Google Scholar] [CrossRef]
- Ishaq, K.; Rosdi, F.; Zin, N.A.M.; Abid, A. heuristics and think-aloud method for evaluating the usability of game-based language learning. Int. J. Adv. Comput. Sci. Appl. 2021, 12, 311–324. [Google Scholar] [CrossRef]
- Fan, M.M.; Li, Y.; Truong, K.N. Automatic Detection of Usability Problem Encounters in Think-Aloud Sessions. Acm Trans. Interact. Intell. Syst. 2020, 10, 1–24. [Google Scholar] [CrossRef]
- Jaspers, M.W.; Steen, T.; Van Den Bos, C.; Geenen, M. The think aloud method: A guide to user interface design. Int. J. Med. Inform. 2004, 73, 781–795. [Google Scholar] [CrossRef]
- Charters, E. The use of think-aloud methods in qualitative research an introduction to think-aloud methods. Brock Educ. J. 2003, 12. [Google Scholar] [CrossRef]
- Ericsson, K.A.; Simon, H.A. Verbal reports on thinking. In Introspection inSecond Language Research; Faerch, C., Kasper, G., Eds.; Multilingual Matters: Bristol, UK, 1987. [Google Scholar]
- Van Someren, M.; Barnard, Y.F.; Sandberg, J. The think aloud method: A practical approach to modelling cognitive. Lond. Acad. 1994, 11, 29–41. [Google Scholar]
- Bláha, D. Vliv Kognitivní Zátěže Na Použitelnost Uživatelských Rozhraní Vybraných Internetových Bankovnictví. Master Thesis, Masarykova univerzita, Filozofická fakulta, Brno, 2015. [Google Scholar]
- Ericsson, K.A.; Simon, H.A. Verbal reports as data. Psychol. Rev. 1980, 87, 215–251. [Google Scholar] [CrossRef]
- Kuusela, H.; Paul, P. A comparison of concurrent and retrospective verbal protocol analysis. Am. J. Psychol. 2000, 113, 387–404. [Google Scholar] [CrossRef] [PubMed]
- Guan, Z.; Lee, S.; Cuddihy, E.; Ramey, J. The validity of the stimulated retrospective think-aloud method as measured by eye tracking. In Proceedings of the Conference on Human Factors in Computing Systems, New Orleans, LA, USA, 22–27 April 2006; pp. 1253–1262. [Google Scholar] [CrossRef]
- Alnashri, A.; Alhadreti, O.; Mayhew, P.J. The Influence of Participant Personality in Usability Tests. Int. J. Hum. Comput. Interact. 2016, 7. [Google Scholar]
- Ericsson, K.A.; Simon, H.A. Protocol Analysis: Verbal Reports as Data; The MIT Press: Cambridge, MA, USA, 1993. [Google Scholar]
- Boren, T.; Ramey, J. Thinking aloud: Reconciling theory and practice. IEEE Trans. Prof. Commun. 2000, 43, 261–278. [Google Scholar] [CrossRef]
- May, J. YouTube Gamers and Think-Aloud Protocols: Introducing Usability Testing. IEEE Trans. Prof. Commun. 2019, 62, 94–103. [Google Scholar] [CrossRef]
- Fan, M.M.; Lin, J.L.; Chung, C.; Truong, K.N. Concurrent Think-Aloud Verbalizations and Usability Problems. Acm Trans. Comput. -Hum. Interact. 2019, 26, 1–35. [Google Scholar] [CrossRef]
- Fan, M.M.; Shi, S.; Truong, K.N. Practices and Challenges of Using Think-Aloud Protocols in Industry: An International Survey. J. Usability Stud. 2020, 15, 85–102. [Google Scholar]
- Fan, M.M.; Tibdewal, V.; Zhao, Q.W.; Cao, L.Z.; Peng, C.; Shu, R.X.; Shan, Y.J. Older Adults’ Concurrent and Retrospective Think-Aloud Verbalizations for Identifying User Experience Problems of VR Games. Interact. Comput. 2023, iwac039. [Google Scholar] [CrossRef]
- Alhadreti, O. Comparing Two Methods of Usability Testing in Saudi Arabia: Concurrent Think-Aloud vs. Co-Discovery. Int. J. Hum.-Comput. Interact. 2021, 37, 118–130. [Google Scholar] [CrossRef]
- Carter-Roberts, H.; Antbring, R.; Angioi, M.; Pugh, G. Usability testing of an e-learning resource designed to improve medical students’ physical activity prescription skills: A qualitative think-aloud study. BMJ Open 2021, 11, e042983. [Google Scholar] [CrossRef] [PubMed]
- Crawford, N.D.; Josma, D.; Harrington, K.R.V.; Morris, J.; Quamina, A.; Birkett, M.; Phillips, G. Using the Think-Aloud Method to Assess the Feasibility and Acceptability of Network Canvas Among Black Men Who Have Sex With Men and Transgender Persons: Qualitative Analysis. JMIR Form. Res. 2021, 5, e30237. [Google Scholar] [CrossRef]
- Doi, T. Usability Textual Data Analysis: A Formulaic Coding Think-Aloud Protocol Method for Usability Evaluation. Appl. Sci.-Basel 2021, 11, 7047. [Google Scholar] [CrossRef]
- Giang, W.C.W.; Bland, E.; Chen, J.; Colon-Morales, C.M.; Alvarado, M.M. User Interactions With Health Insurance Decision Aids: User Study With Retrospective Think-Aloud Interviews. JMIR Hum. Factors 2021, 8, e27628. [Google Scholar] [CrossRef]
- Hanghoj, S.; Boisen, K.A.; Hjerming, M.; Elsbernd, A.; Pappot, H. Usability of a Mobile Phone App Aimed at Adolescents and Young Adults During and After Cancer Treatment: Qualitative Study. JMIR Cancer 2020, 6, e15008. [Google Scholar] [CrossRef]
- Hendradewa, A.P.; Yassierli. A Comparison of Usability Testing Methods in Smartphone Evaluation. Ind. Eng. Manag. Syst. 2019, 18, 154–162. [Google Scholar] [CrossRef]
- Irlitti, A.; Hoang, T.; Vetere, F.; Acm. Surrogate-Aloud: A Human Surrogate Method for Remote Usability Evaluation and Ideation in Virtual Reality. In Proceedings of the CHI Conference on Human Factors in Computing Systems, Electr Network, Hamburg, Germany, 8–13 May 2021. [Google Scholar]
- Jabbour, J.; Dhillon, H.M.; Shepherd, H.L.; Sundaresan, P.; Milross, C.; Clark, J.R. A web-based comprehensive head and neck cancer patient education and support needs program: Usability testing. Health Inform. J. 2022, 28. [Google Scholar] [CrossRef]
- Khajouei, R.; Farahani, F. A combination of two methods for evaluating the usability of a hospital information system. BMC Med. Inform. Decis. Mak. 2020, 20, 14604582221087128. [Google Scholar] [CrossRef] [PubMed]
- Knura, M.; Schiewe, J. Map Evaluation under COVID-19 restrictions: A new visual approach based on think aloud interviews. Proc. ICA 2021, 4, 60. [Google Scholar] [CrossRef]
- Kusumawati, R.E.; Muslim, E.; Nugroho, D. Usability Testing on Touchscreen Based Electronic Kiosk Machine in Convenience Store. In Proceedings of the 16th International Conference on Quality in Research (QiR)/International Symposium on Advances in Mechanical Engineering (ISAME), Padang, Indonesia, 21–24 July 2019. [Google Scholar]
- Nielsen, L.; Salminen, J.; Jung, S.G.; Jansen, B.J. Think-Aloud Surveys A Method for Eliciting Enhanced Insights During User Studies. In Proceedings of the 18th IFIP TC 13 International Conference on Human-Computer Interaction (INTERACT), Bari, Italy, 30 August–3 September 2021; pp. 504–508. [Google Scholar]
- Sin, J.; Woodham, L.A.; Henderson, C.; Williams, E.; Hernandez, A.S.; Gillard, S. Usability evaluation of an eHealth intervention for family carers of individuals affected by psychosis: A mixed-method study. Digit. Health 2019, 5. [Google Scholar] [CrossRef]
- Soure, E.J.; Kuang, E.; Fan, M.M.; Zhao, J. CoUX: Collaborative Visual Analysis of Think-Aloud Usability Test Videos for Digital Interfaces. IEEE Trans. Vis. Comput. Graph. 2022, 28, 643–653. [Google Scholar] [CrossRef]
- Steeb, T.; Brutting, J.; Reinhardt, L.; Hoffmann, J.; Weiler, N.; Heppt, M.V.; Erdmann, M.; Doppler, A.; Weber, C.; Schadendorf, D.; et al. One Website to Gather them All: Usability Testing of the New German SKin Cancer INFOrmation (SKINFO) Website-A Mixed-methods Approach. J. Cancer Education. 2022, 1–7. [Google Scholar] [CrossRef]
- Taylor, S.; Allsop, M.J.; Bennett, M.I.; Bewick, B.M. Usability testing of an electronic pain monitoring system for palliative cancer patients: A think-aloud study. Health Inform. J. 2019, 25, 1133–1147. [Google Scholar] [CrossRef]
- Sucha, L.Z.; Bartosova, E.; Novotny, R.; Svitakova, J.B.; Stefek, T.; Vichova, E. Stimulators and barriers towards social innovations in public libraries: Qualitative research study. Libr. Inf. Sci. Res. 2021, 43, 101068. [Google Scholar] [CrossRef]
- Špriňarová, K.; Juřík, V.; Šašinka, Č.; Herman, L.; Štěrba, Z.; Stachoň, Z.; Chmelík, J.; Kozlíková, B. Human-Computer Interaction in Real-3D and Pseudo-3D Cartographic Visualization: A Comparative Study. In Cartography-Maps Connecting the World, Proceedings of the 27th International Cartographic Conference 2015-ICC2015, Rio de Janeiro, Brazil, 23–28 August 2015; Robbi Sluter, C., Madureira Cruz, C.B., Leal de Menezes, P.M., Eds.; Springer International Publishing: Midtown Manhattan, NY, USA, 2015; pp. 59–73. [Google Scholar]
- Šašinka, Č.; Stachoň, Z.; Sedlák, M.; Chmelík, J.; Herman, L.; Kubíček, P.; Šašinková, A.; Doležal, M.; Tejkl, H.; Urbánek, T.; et al. Collaborative Immersive Virtual Environments for Education in Geography. ISPRS Int. J. Geo-Inf. 2019, 8, 3. [Google Scholar] [CrossRef]
- Popelka, S.; Vondrakova, A.; Hujnakova, P. Eye-tracking Evaluation of Weather Web Maps. ISPRS Int. J. Geo-Inf. 2019, 8, 256. [Google Scholar] [CrossRef]
- Nivala, A.-M.; Brewster, S.; Sarjakoski, T.L. Usability Evaluation of Web Mapping Sites. Cartogr. J. 2008, 45, 129–138. [Google Scholar] [CrossRef]
- Ooms, K.; De Maeyer, P.; Fack, V. Listen to the Map User: Cognition, Memory, and Expertise. Cartogr. J. 2015, 52, 3–19. [Google Scholar] [CrossRef]
- Kulhavy, R.W.; Pridemore, D.R.; Stock, W.A. Cartographic Experience And Thinking Aloud About Thematic Maps. Cartogr.: Int. J. Geogr. Inf. Geovisualization 1992, 29, 1–9. [Google Scholar] [CrossRef]
- Gołębiowska, I. Legend Layouts for Thematic Maps: A Case Study Integrating Usability Metrics with the Thinking Aloud Method. Cartogr. J. 2015, 52, 28–40. [Google Scholar] [CrossRef]
- Viaene, P.; Vanclooster, A.; Ooms, K.; De Maeyer, P. Thinking Aloud in Search of landmark characteristics in an Indoor Environment. In Proceedings of the 2014 Ubiquitous Positioning Indoor Navigation and Location Based Service (UPINLBS), Corpus Christi, TX, USA, 20–21 November 2014; pp. 103–110. [Google Scholar]
- Kettunen, P.; Irvankoski, K.; Krause, C.M.; Sarjakoski, L.T. Landmarks in nature to support wayfinding: The effects of seasons and experimental methods. Cogn. Process. 2013, 14, 245–253. [Google Scholar] [CrossRef]
- Quaye-Ballard, J. Usability testing: Using “think aloud” method in testing cartographic product. J. Sci. Technol. 2007, 27, 141–149. [Google Scholar] [CrossRef]
- Burian, J. Atlas Moravskoslezského Kraje: Lidé, Podnikání, Prostředí; Moravskoslezský kraj: Ostrava, Czech Republic, 2021. [Google Scholar]
- Lloyd, R.; Patton, D.; Cammack, R. Basic-Level Geographic Categories. Prof. Geogr. 1996, 48, 181–194. [Google Scholar] [CrossRef]
- Burnett, G.; Ditsikas, D. Personality as A-Criterion for Selecting Usability Testing Participants. In Proceedings of the IEEE 4th International Conference on Information and Communications Technologie, Cairo, Egypt, 10–12 December 2006. [Google Scholar] [CrossRef]
- Meier, M.; Mason, C.; Putze, F.; Schultz, T. Comparative Analysis of Think-Aloud Methods for Everyday Activities in the Context of Cognitive Robotics. In Proceedings of the 20th Annual Conference of the International Speech Communication Association, Graz, Austria, 15–19 September 2019; pp. 559–563. [Google Scholar]
- Wittenburg, P.; Brugman, H.; Russel, A.; Klassmann, A.; Sloetjes, H. ELAN: A Professional Framework for Multimodality Research. In Proceedings of the 5th International Conference on Language Resources and Evaluation, Genoa, Italy, 24–26 May 2006. [Google Scholar]
- Buhajová, L. Ověření Využitelnosti Softwaru ATLAS. Ti Pro Literární Vědu. Diploma Thesis, Palacký University, Olomouc, Czech Republic, 2010. [Google Scholar]
- Cvrček, V.; Čech, R.; Kubát, M. QuitaUp-Nástroj Pro Kvantitativní Stylometrickou Analýzu. Available online: https://korpus.cz/quitaup (accessed on 1 October 2022).
- Kilgarriff, A.; Baisa, V.; Bušta, J.; Jakubíček, M.; Kovář, V.; Michelfeit, J.; Rychlý, P.; Suchomel, V. The Sketch Engine: Ten years on. Lexicography 2014, 1, 7–36. [Google Scholar] [CrossRef]
- Beitlova, M.; Popelka, S.; Voženílek, V.; Fačevicová, K.; Janečková, B.A.; Matlach, V. The Importance of School World Atlases According to Czech Geography Teachers. ISPRS Int. J. Geo-Inf. 2021, 10, 504. [Google Scholar] [CrossRef]
- Nielsen, J. How Many Test Users in a Usability Study? Nielsen Norman Group 2012, 1. Available online: https://www.nngroup.com/articles/how-many-test-users/ (accessed on 1 October 2022).
- Federici, S.; Borsci, S.; Stamerra, G. Web usability evaluation with screen reader users: Implementation of the Partial Concurrent Thinking Aloud technique. Cogn. Process. 2010, 11, 263–272. [Google Scholar] [CrossRef]
- Nielsen, J. Usability 101: Introduction to Usability. Nielsen Norman Group 2012, 1, 3246–3252. [Google Scholar]
- Prokop, M.; Pilař, L.; Tichá, I. Impact of Think-Aloud on Eye-Tracking: A Comparison of Concurrent and Retrospective Think-Aloud for Research on Decision-Making in the Game Environment. Sensors 2020, 20, 2750. [Google Scholar] [CrossRef] [PubMed]


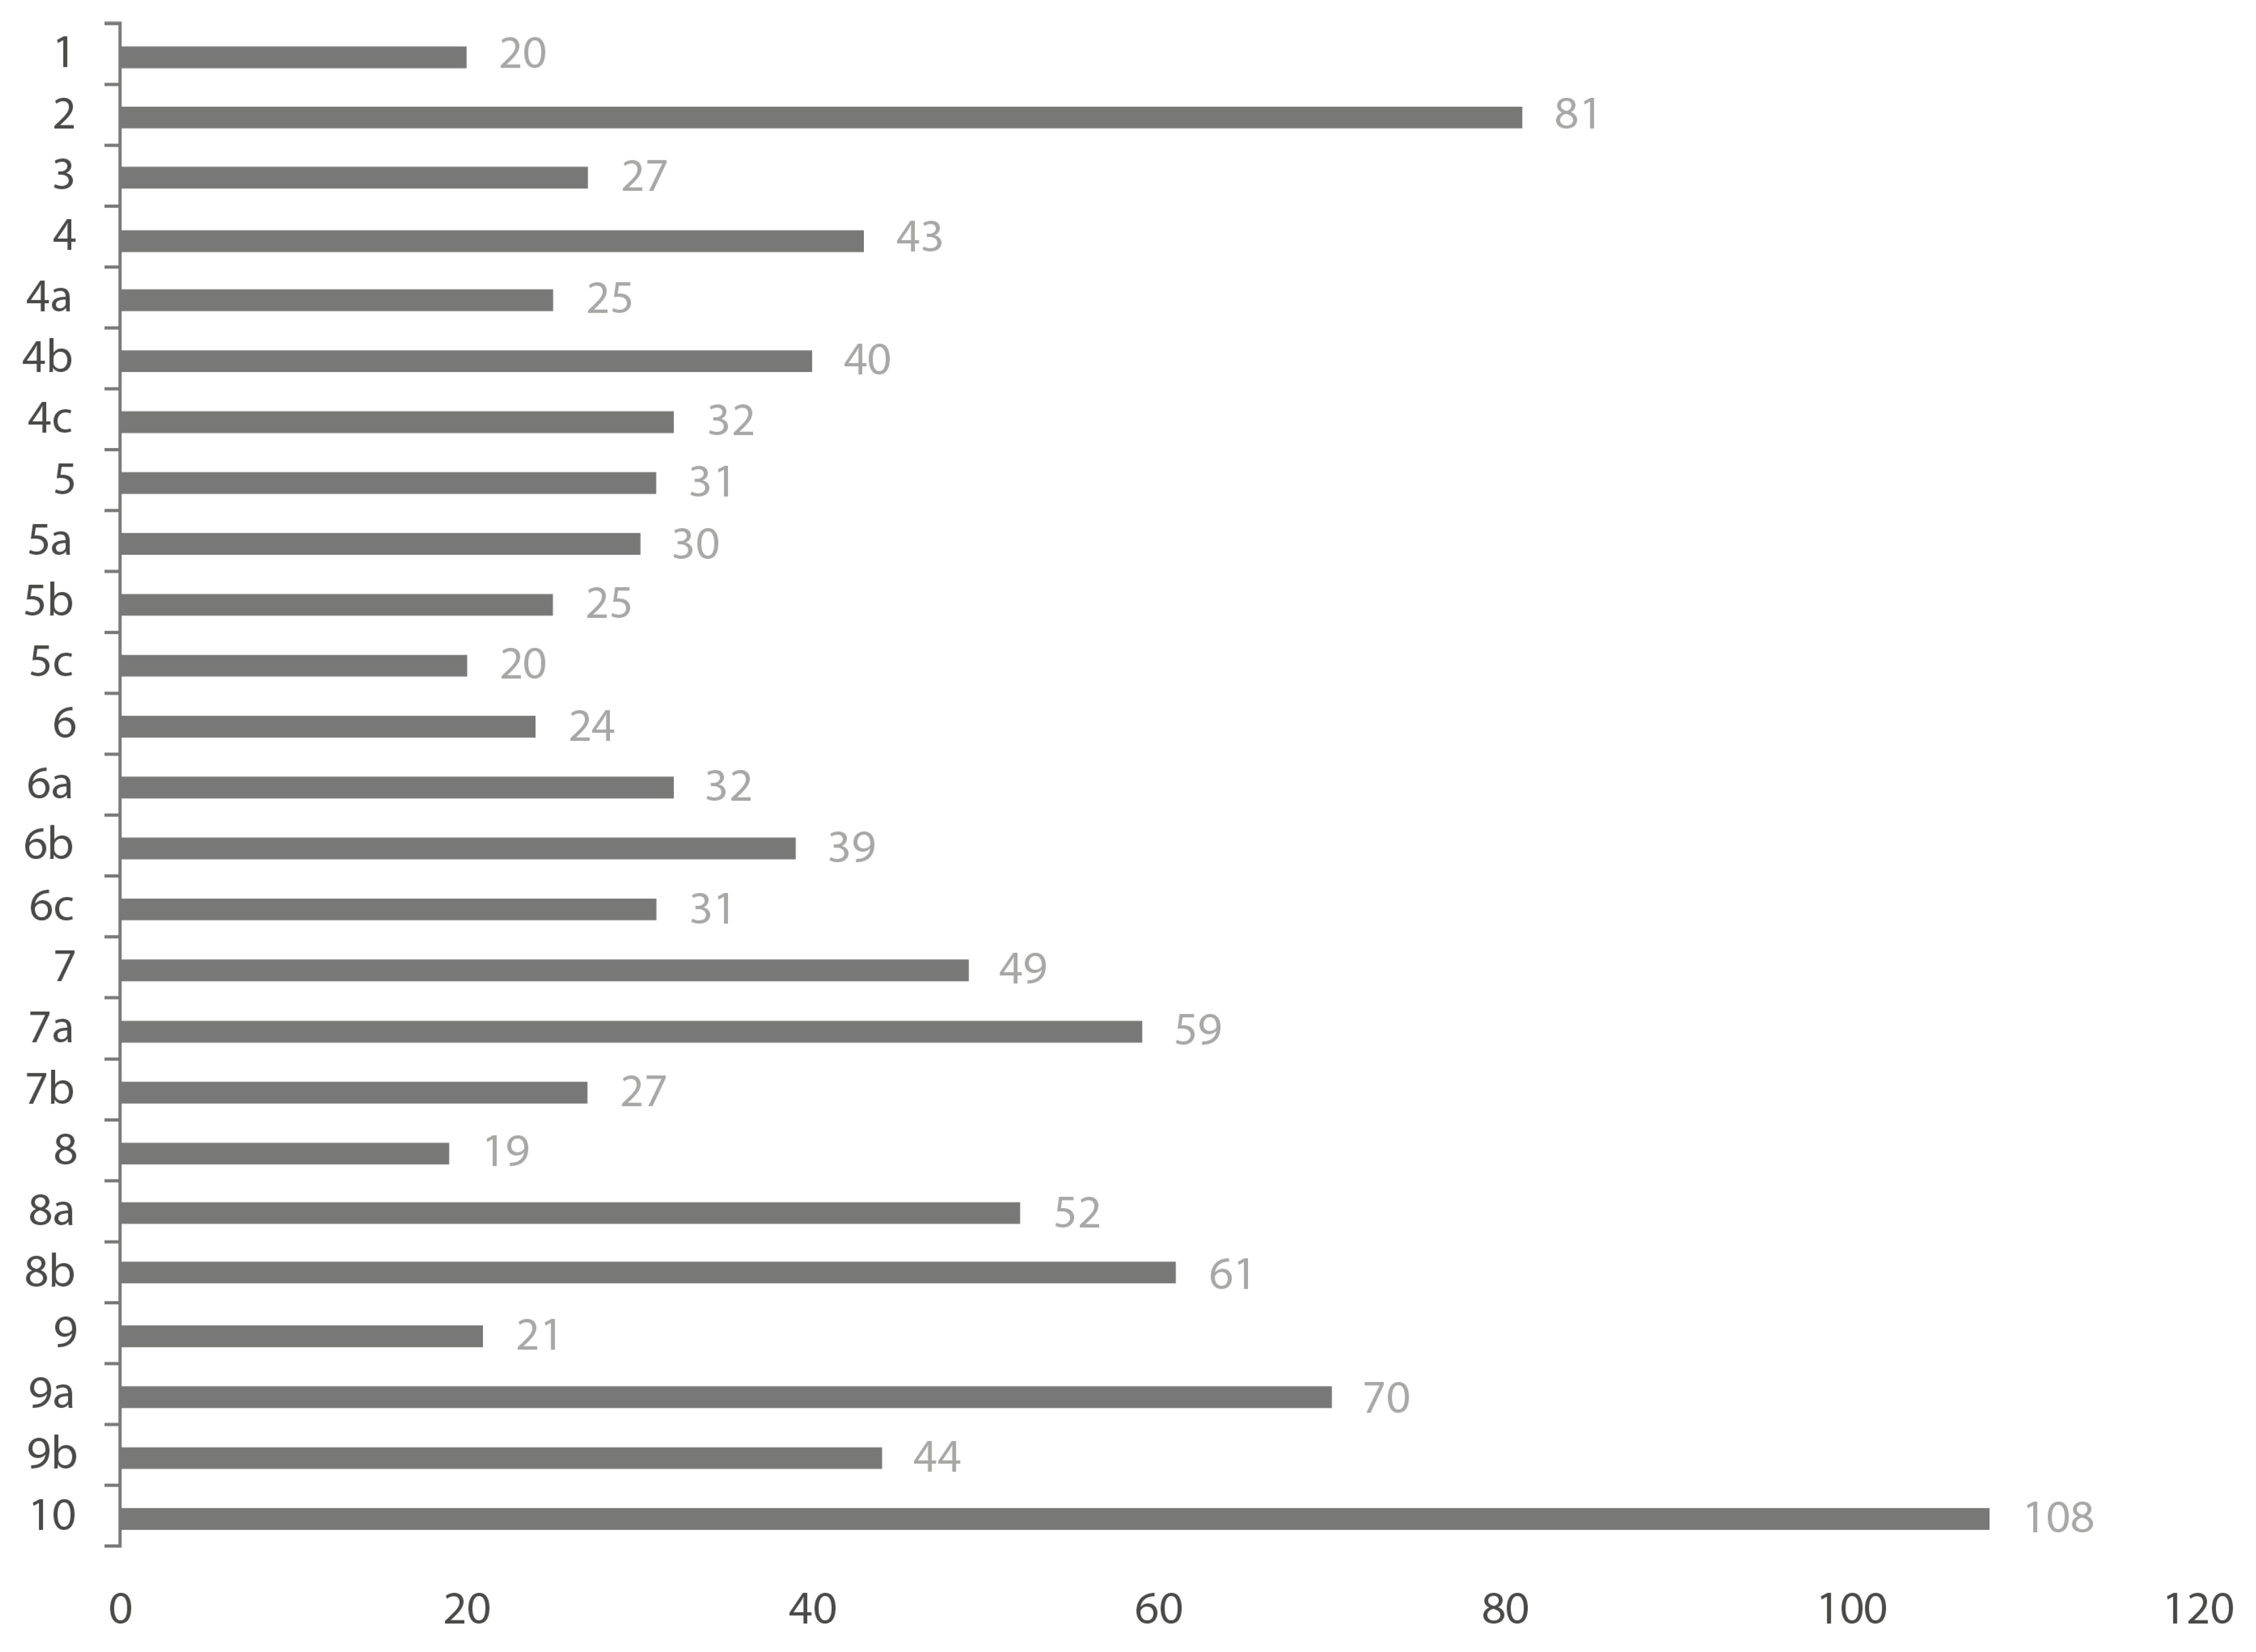
| Mark | Task | Image Number (see Figure 3) |
|---|---|---|
| 1 | What page is the CONTENTS of the atlas on? | 1 |
| 2 | How many maps does the atlas contain in total? | 2 |
| 3 | What topic is marked in brown? | 2 |
| 4 | Find the topic WATER in the atlas and describe the maps in this section. | 3 |
| 4a | Which basin is numbered 411? | 3 |
| 4b | Which sea do most of the rivers in the Moravian-Silesian Region flow into? | 3 |
| 4c | What is the longest river in the Moravian-Silesian Region? | 3 |
| 5 | Find the topic CLIMATE AREAS in the atlas and describe the maps in this section. | 4 |
| 5a | What do the colours indicate on the main climate map? | 4 |
| 5b | What type of climate area has the largest area in the county? | 4 |
| 5c | What type of climate can be found around Rýmařov? | 4 |
| 6 | In the atlas, find the topic TEMPERATURES AND RAINFALL and describe the maps in this section. | 5 |
| 6a | Which parts of the region are the warmest and where are the coldest? | 5 |
| 6b | What was the AVERAGE ANNUAL TEMPERATURE in the Moravian-Silesian Region in 2020? | 5 |
| 6c | In which part of the territory can you see the highest annual rainfall? | 5 |
| 7 | Find the topic TRANSPORTATION in the atlas and describe the map in this section. | 6 |
| 7a | What is the predominant mode of transport in the region? | 6 |
| 7b | In what part can we find the NORTHEAST track? | 6 |
| 8 | Go to the topic TRANSPORT INTENSITY and describe the map in this section. | 7 |
| 8a | What parts of the region have the highest and lowest traffic volumes? | 7 |
| 8b | What is the rate of growth in the NUMBER OF PASSENGER CARS in the region? | 7 |
| 9 | Go to the topic PUBLIC TRANSPORTATION and describe the map in this section. | 8 |
| 9a | What types of transport can I use to get to Ostrava Airport? | 8 |
| 9b | Which company is the largest operator of public transport lines in the region? | 8 |
| 10 | Find any information in the atlas that interests you about the region (i.e., think of a question and find the answer). | X |
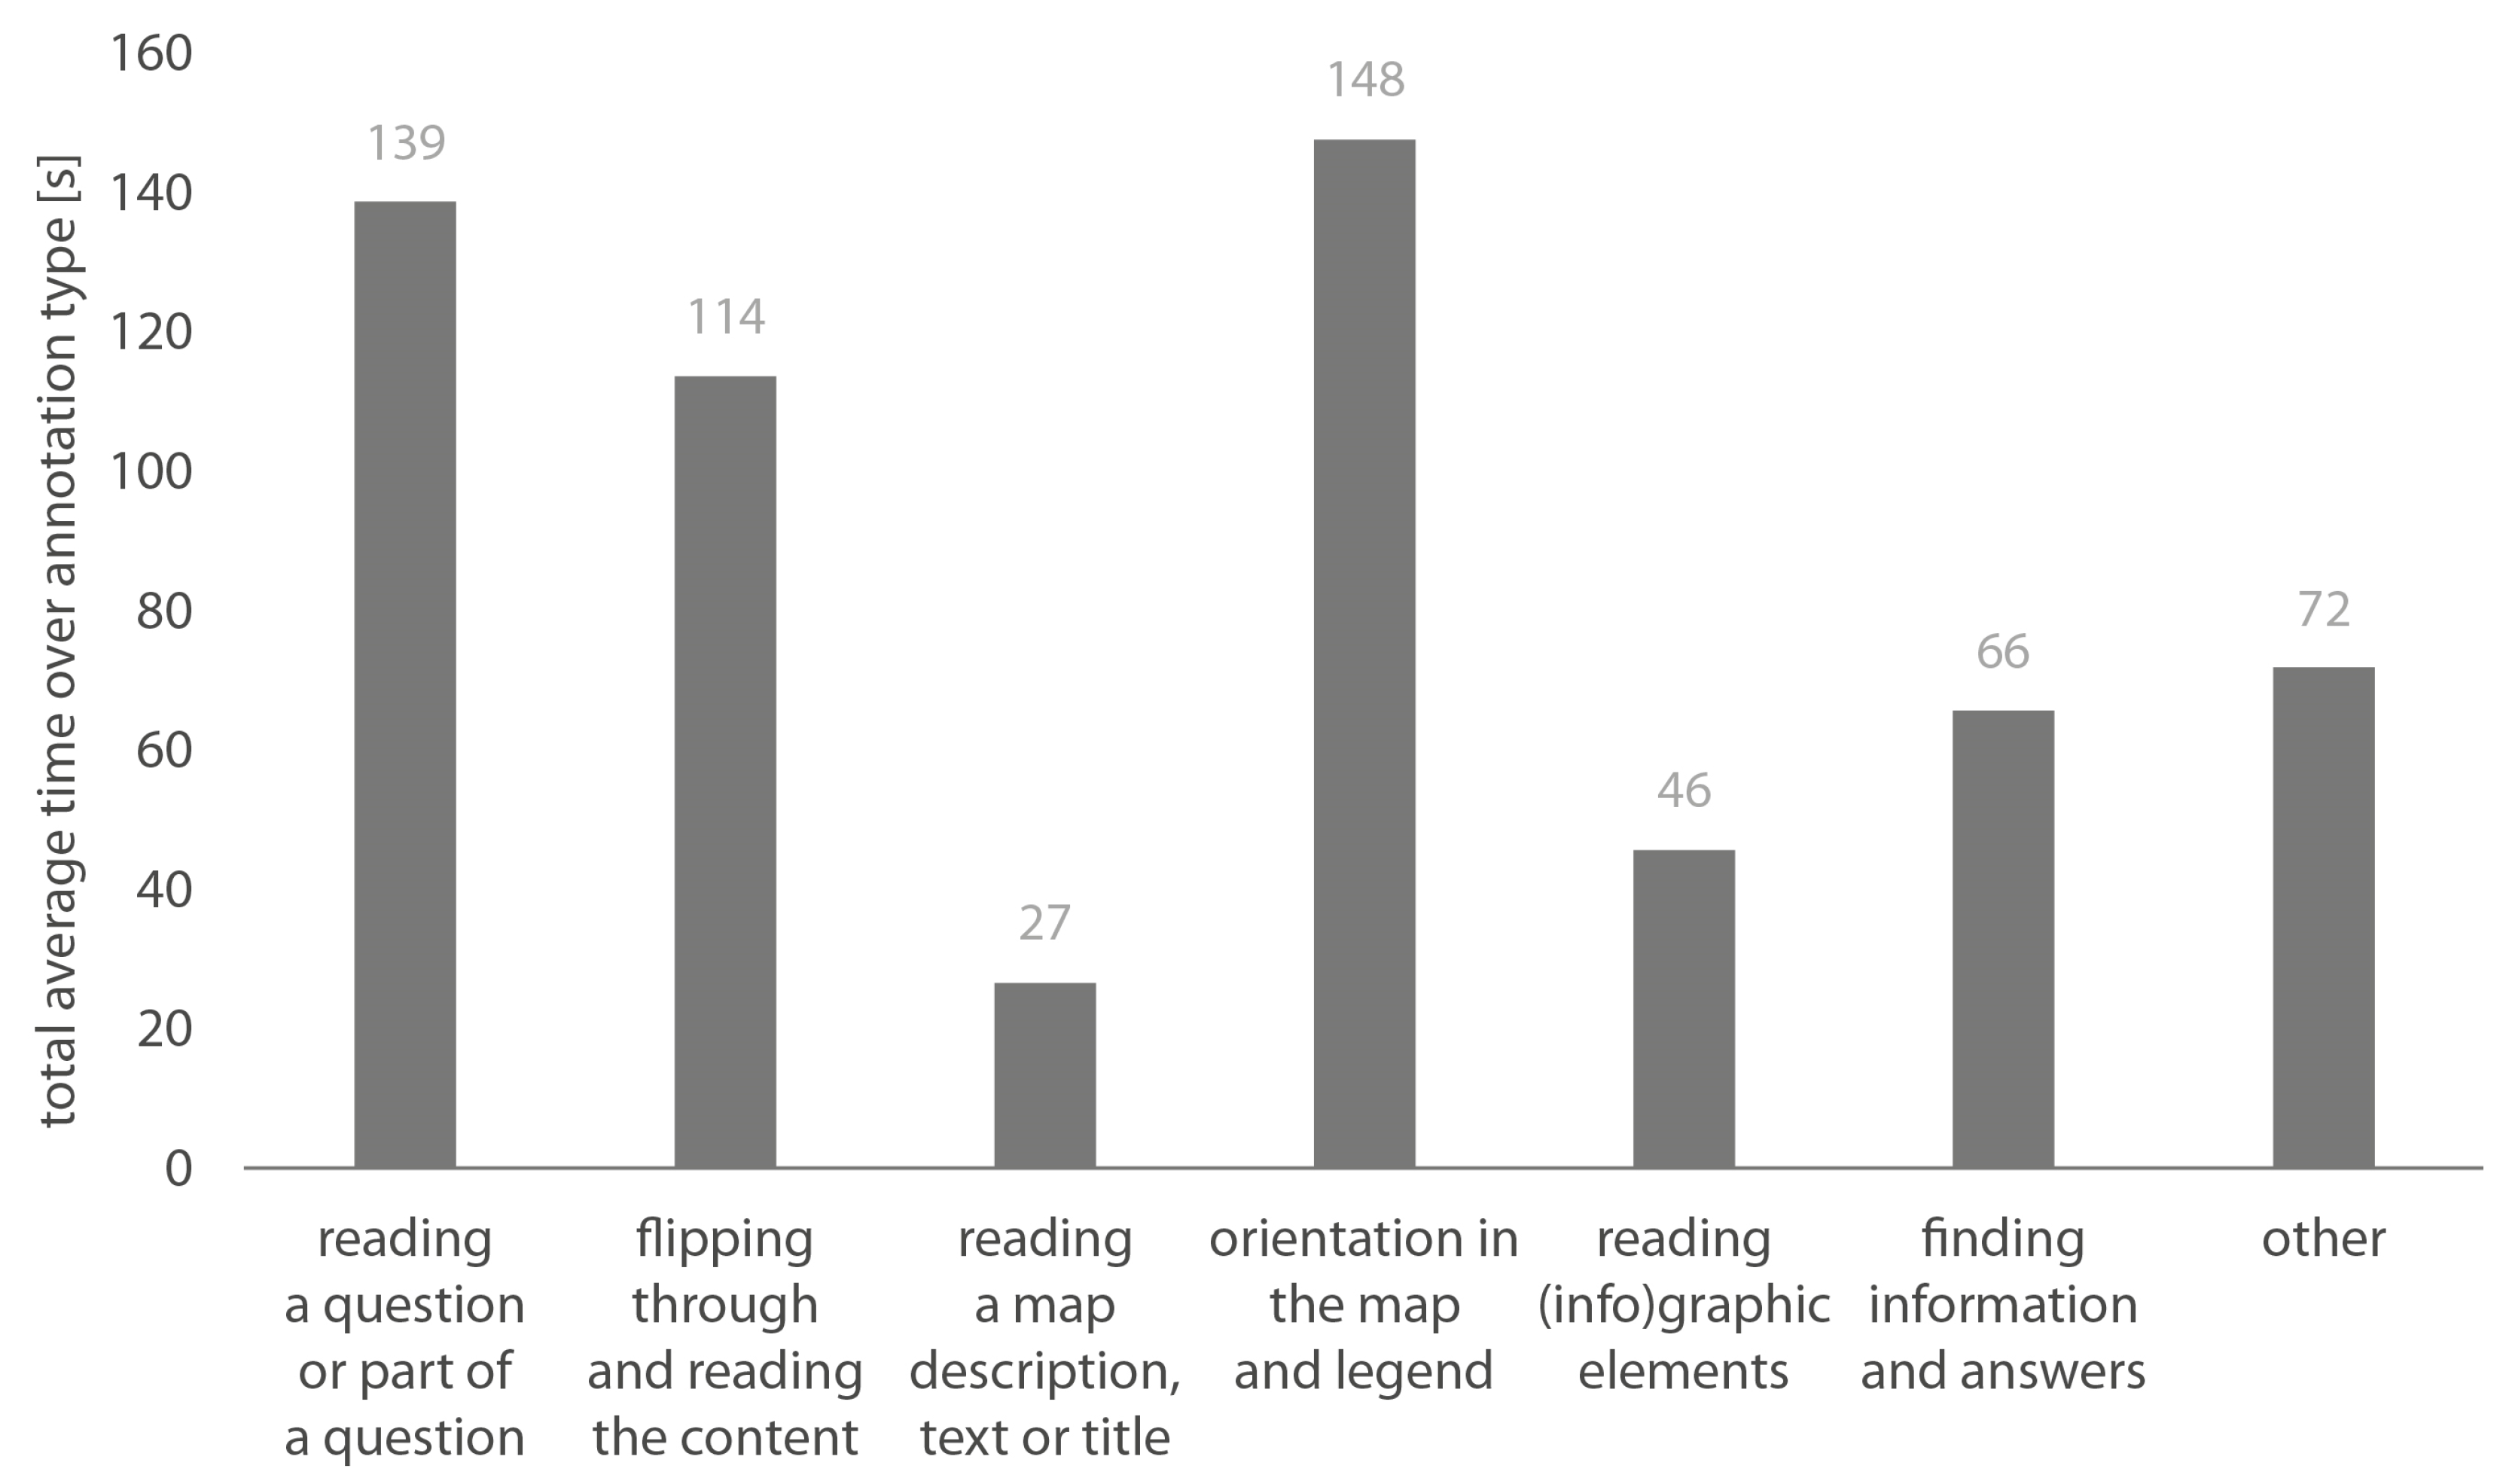
| Category | Description | Example |
|---|---|---|
| Reading the question/task | The participant is reading the question or parts of it | “Find the water theme in the atlas and describe the maps in this section.” “…water theme and describe…” |
| Handling the atlas, reading the contents | The participant scrolls through the atlas, searches for relevant topics, reads the content | “…I’m going back to the content, topic to the right, I’m going back to the top. To the right, I am looking for. To the right it is page 127, I’m going to page 127.” |
| Reading a map description, text, or title | The participant reads the description around the map | “Public transport is operated in 13 cities in the region.” |
| Orientation in the map and legend | The participant searches for information and navigates in the given thematic map | “…the narrow-gauge regional line is marked with dashed lines and it is on the map between Osoblaha and Třemešná…” |
| Reading graphic and infographic elements | The participant searches for information in additional infographics, graphs, and images | “…here’s an infographic on that, with it, directly broken down into auto bike buses and trucks…” |
| Finding information and answers | The participant has found the requested information | “…so, it’s probably the Oder River, just by pure reasoning from the map.” |
| Other | Other comments and actions of the participant when thinking aloud and the participant’s opinion | “Might be a good idea to check the list to see if there’s anything there.” “I see I was wrong…” |
Disclaimer/Publisher’s Note: The statements, opinions and data contained in all publications are solely those of the individual author(s) and contributor(s) and not of MDPI and/or the editor(s). MDPI and/or the editor(s) disclaim responsibility for any injury to people or property resulting from any ideas, methods, instructions or products referred to in the content. |
© 2023 by the authors. Licensee MDPI, Basel, Switzerland. This article is an open access article distributed under the terms and conditions of the Creative Commons Attribution (CC BY) license (https://creativecommons.org/licenses/by/4.0/).
Share and Cite
Vanicek, T.; Popelka, S. The Think-Aloud Method for Evaluating the Usability of a Regional Atlas. ISPRS Int. J. Geo-Inf. 2023, 12, 95. https://doi.org/10.3390/ijgi12030095
Vanicek T, Popelka S. The Think-Aloud Method for Evaluating the Usability of a Regional Atlas. ISPRS International Journal of Geo-Information. 2023; 12(3):95. https://doi.org/10.3390/ijgi12030095
Chicago/Turabian StyleVanicek, Tomas, and Stanislav Popelka. 2023. "The Think-Aloud Method for Evaluating the Usability of a Regional Atlas" ISPRS International Journal of Geo-Information 12, no. 3: 95. https://doi.org/10.3390/ijgi12030095
APA StyleVanicek, T., & Popelka, S. (2023). The Think-Aloud Method for Evaluating the Usability of a Regional Atlas. ISPRS International Journal of Geo-Information, 12(3), 95. https://doi.org/10.3390/ijgi12030095