Measuring and Mapping Physical Activity Disparity (PAD) Index Based on Physical Activity Environment for Children
Abstract
1. Introduction
2. Background
2.1. Children’s PA Environment
2.2. The 5 As of Access to Children PA Environment
3. Data and Method
3.1. Designing a Children’s PAD Index
3.2. Environment Measures Selection
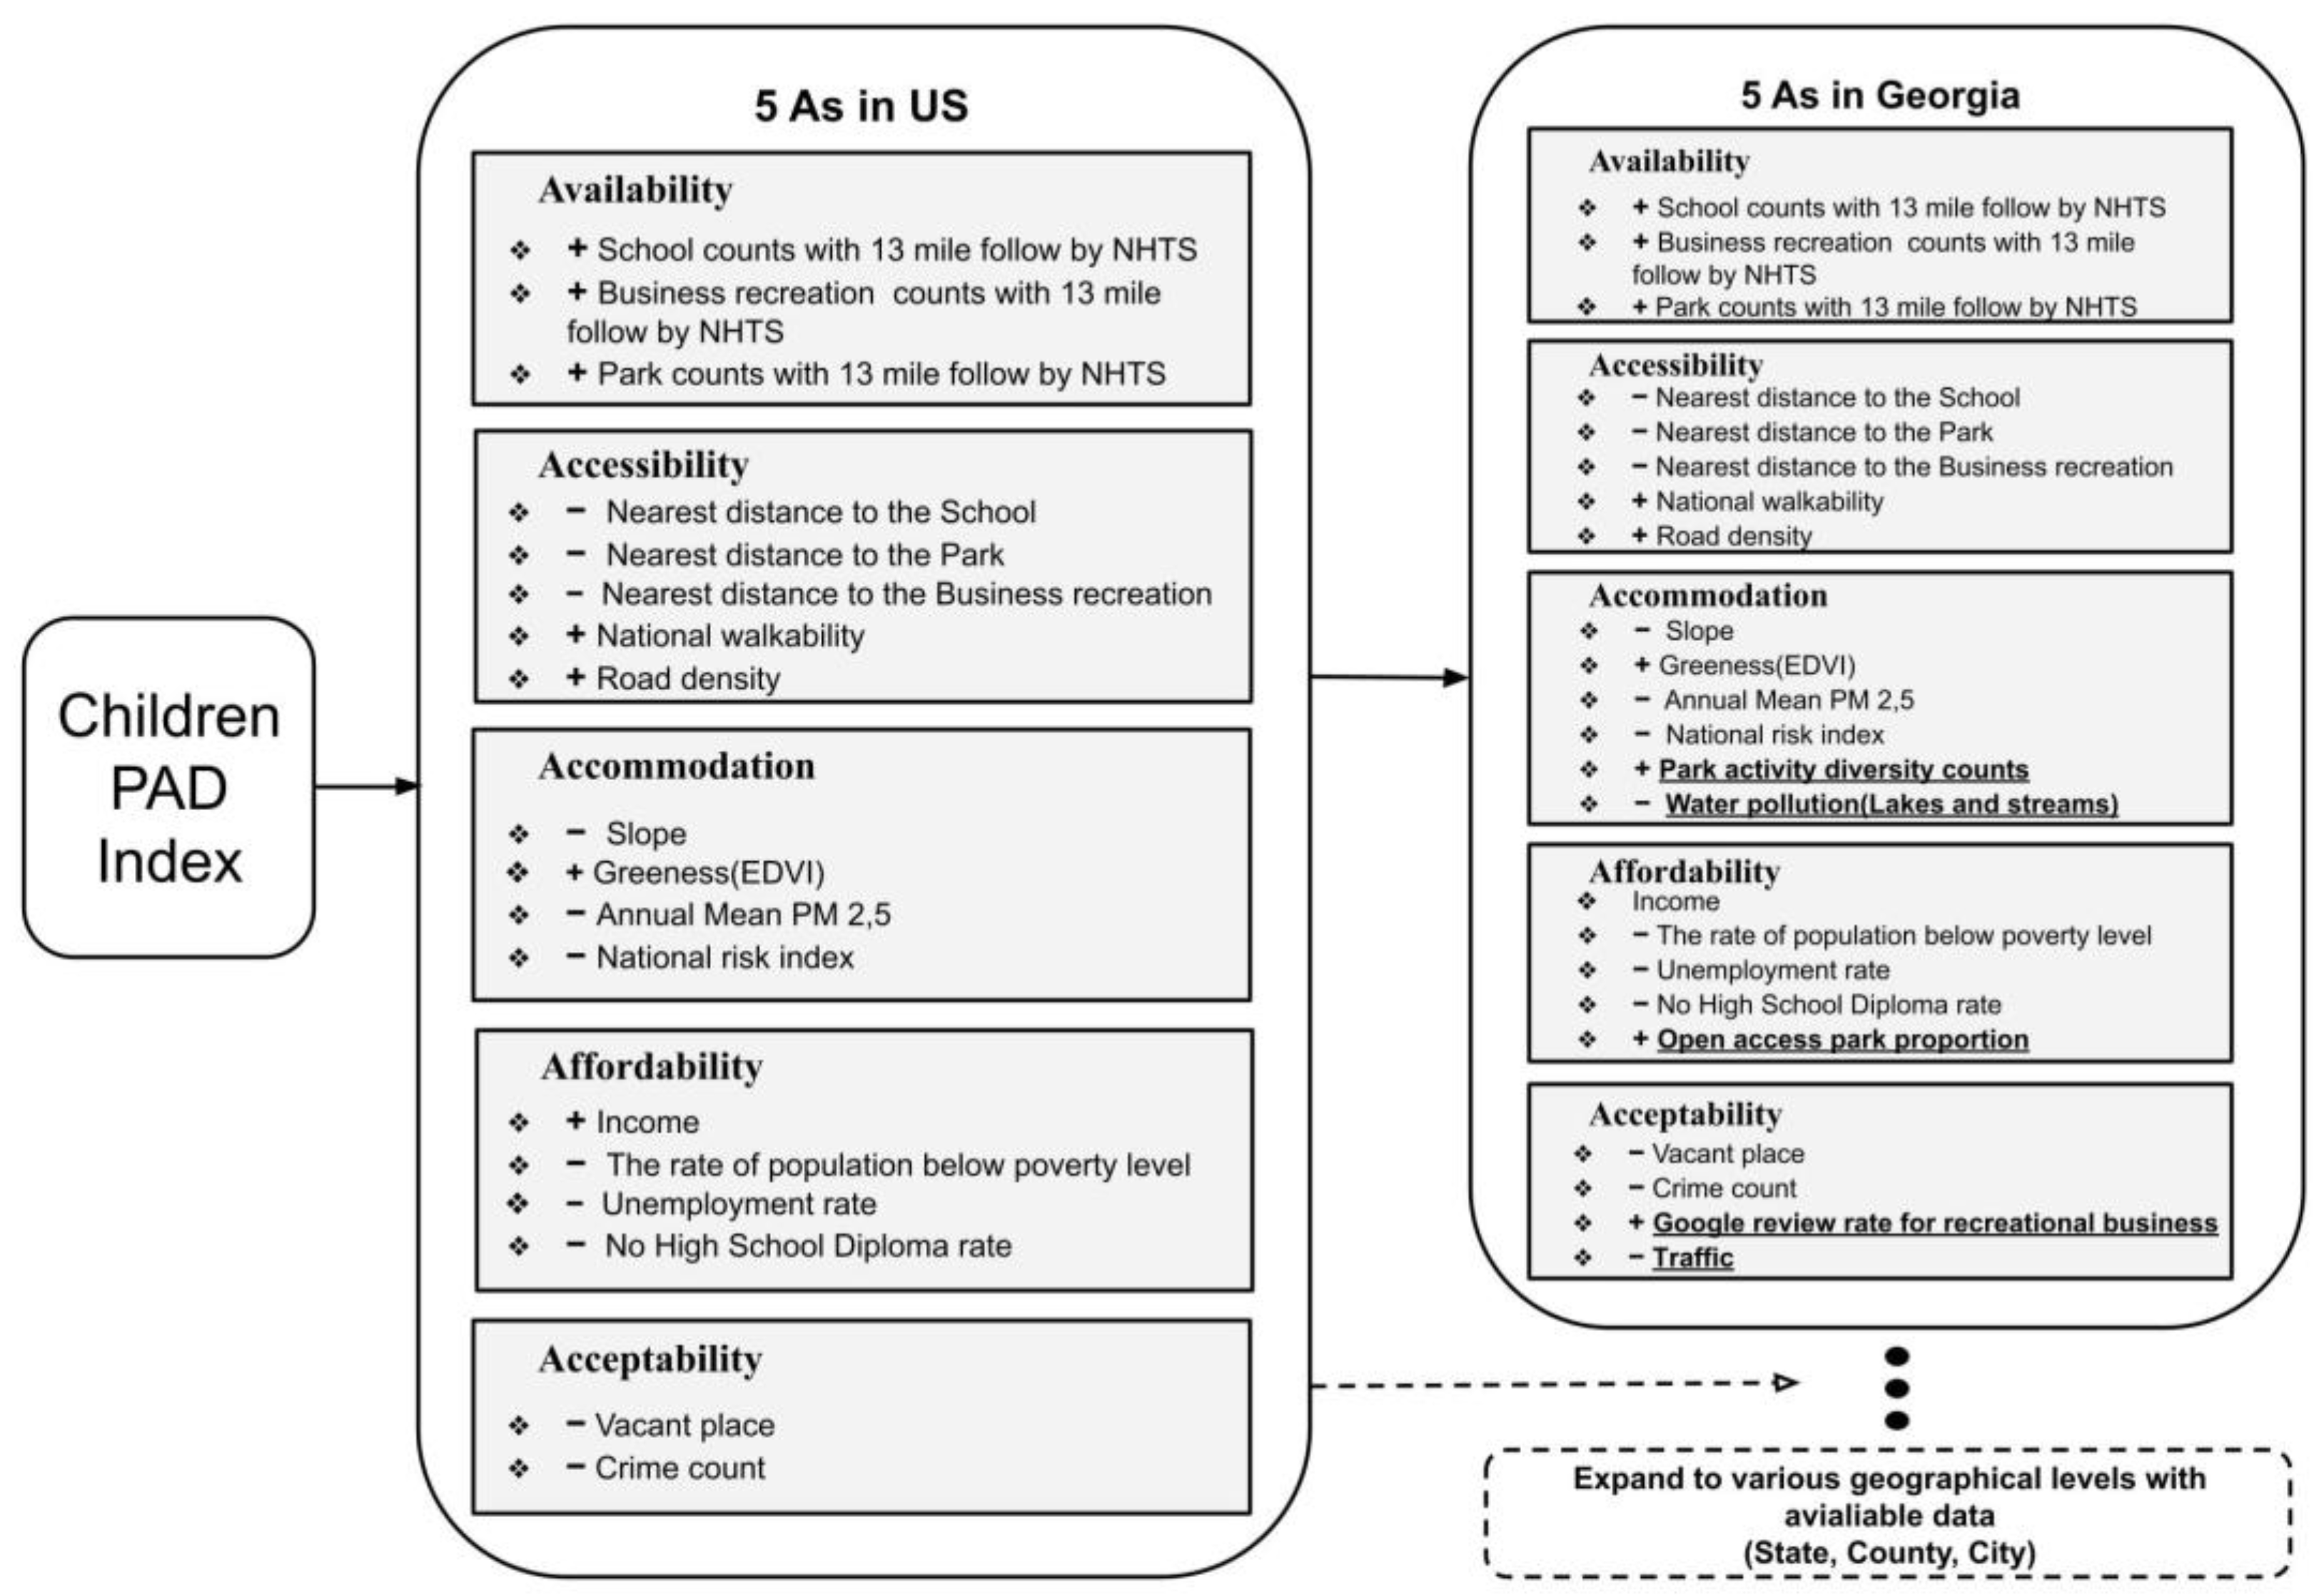
3.3. Environmental Measures’ Variables for 5 As in the US and Georgia
3.4. As Index Measurement
3.5. Self-Organizing Map (SOM)
- The 5 As were considered as five-dimensional within each county as an input vector (5 × 159 matrix for 5 As and 159 counties) in an “input space”.
- Due to the elbow method, four-node weight vectors were randomly put in the space.
- The Euclidean distance was used to calculate the best matching unit (BMU), which is the smallest distance between the node weight vectors and the input vector.
- Update the node weight vectors and nodes’ neighborhood with the BMU by pulling them closer to the input vector.where s is the current iteration, v is the node weight vector, u is the best-matching unit (BMU), θ(u,v,s) is the neighborhood function from BMU, a(s) is the learning rate, and D(t) is the input data vector.
- Repeat steps 3 and 4 for N iterations.
4. Result
5. Discussion
5.1. Summary Findings
5.2. Data Collection for Children’s PAD Index
5.3. PAD Index Contributions and Future Work
5.4. Limitations
6. Conclusions
Supplementary Materials
Author Contributions
Funding
Data Availability Statement
Conflicts of Interest
References
- WHO. Physical Activity. Available online: https://www.who.int/news-room/fact-sheets/detail/physical-activity (accessed on 2 October 2022).
- CDC. Lack of Physical Activity. Available online: https://www.cdc.gov/chronicdisease/resources/publications/factsheets/physical-activity.htm#:~:text=Low%20levels%20of%20physical%20activity,annually%20in%20health%20care%20costs (accessed on 15 May 2022).
- UN. Convention on the Rights of the Child. United Nations Treaty Ser. 1989, 1577, 1–23. [Google Scholar]
- CDC. Benefits of Physical Activity. Available online: https://www.cdc.gov/physicalactivity/basics/pa-health/index.htm (accessed on 2 May 2022).
- Sallis, J.F.; Glanz, K. The role of built environments in physical activity, eating, and obesity in childhood. Future Child. 2006, 16, 89–108. [Google Scholar]
- Kosowan, L.; Shannon, S.; Rothney, J.; Halas, G.; Enns, J.; Holmqvist, M.; Wener, P.; Goertzen, L.; Katz, A. Informing the Physical Activity Evaluation Framework: A Scoping Review of Reviews. Am. J. Health Promot. 2022, 36, 340–366. [Google Scholar]
- Smith, M.; Mavoa, S.; Ikeda, E.; Hasanzadeh, K.; Zhao, J.; Rinne, T.E.; Donnellan, N.; Kyttä, M.; Cui, J. Associations between Children’s Physical Activity and Neighborhood Environments Using GIS: A Secondary Analysis from a Systematic Scoping Review. Int. J. Environ. Res. Public Health 2022, 19, 1033. [Google Scholar] [CrossRef]
- Brownson, R.C.; Hoehner, C.M.; Day, K.; Forsyth, A.; Sallis, J.F. Measuring the built environment for physical activity: State of the science. Am. J. Prev. Med. 2009, 36, S99–S123.e112. [Google Scholar]
- Witten, K.; Pearce, J.; Day, P. Neighbourhood Destination Accessibility Index: A GIS tool for measuring infrastructure support for neighbourhood physical activity. Environ. Plan. A 2011, 43, 205–223. [Google Scholar] [CrossRef]
- McGinn, A.P.; Evenson, K.R.; Herring, A.H.; Huston, S.L. The relationship between leisure, walking, and transportation activity with the natural environment. Health Place 2007, 13, 588–602. [Google Scholar] [CrossRef] [PubMed]
- Edwards, N.; Hooper, P.; Knuiman, M.; Foster, S.; Giles-Corti, B. Associations between park features and adolescent park use for physical activity. Int. J. Behav. Nutr. Phys. Act. 2015, 12, 21. [Google Scholar]
- Molina-García, J.; Menescardi, C.; Estevan, I.; Queralt, A. Associations between Park and Playground Availability and Proximity and Children’s Physical Activity and Body Mass Index: The BEACH Study. Int. J. Environ. Res. Public Health 2022, 19, 250. [Google Scholar] [CrossRef]
- Sallis, J.F. Measuring physical activity environments: A brief history. Am. J. Prev. Med. 2009, 36, S86–S92. [Google Scholar] [CrossRef] [PubMed]
- Pontin, F.; Lomax, N.; Clarke, G.; Morris, M.A. Socio-demographic determinants of physical activity and app usage from smartphone data. Soc. Sci. Med. 2021, 284, 114235. [Google Scholar] [PubMed]
- Mitchell, R. Is physical activity in natural environments better for mental health than physical activity in other environments? Soc. Sci. Med. 2013, 91, 130–134. [Google Scholar] [PubMed]
- Pendergrast, C.; Miles, S.; Choe, Y.; Errett, N. Fitness, Parks, and Active Transportation Organizations Support Community Recovery and Physical Activity After Disasters; Syracuse University Lerner Center for Public Health Promotion: Syracuse, NY, USA, 2022. [Google Scholar]
- Alliott, O.; Ryan, M.; Fairbrother, H.; Van Sluijs, E. Do adolescents’ experiences of the barriers to and facilitators of physical activity differ by socioeconomic position? A systematic review of qualitative evidence. Obes. Rev. 2022, 23, e13374. [Google Scholar] [PubMed]
- Flaes, S.A.B.; Chinapaw, M.J.; Koolhaas, C.M.; van Mechelen, W.; Verhagen, E.A. More children more active: Tailored playgrounds positively affect physical activity levels amongst youth. J. Sci. Med. Sport 2016, 19, 250–254. [Google Scholar]
- Cain, K.L.; Salmon, J.; Conway, T.L.; Cerin, E.; Hinckson, E.; Mitáš, J.; Schipperijn, J.; Frank, L.D.; Anjana, R.M.; Barnett, A. International Physical Activity and Built Environment Study of adolescents: IPEN Adolescent design, protocol and measures. BMJ Open 2021, 11, e046636. [Google Scholar]
- Penchansky, R.; Thomas, J.W. The concept of access: Definition and relationship to consumer satisfaction. Med. Care 1981, 19, 127–140. [Google Scholar] [CrossRef]
- Cromley, E.K.; McLafferty, S.L. GIS and Public Health; Guilford Press: New York, NY, USA, 2011. [Google Scholar]
- Yang, J.; Mao, L. Understanding temporal change of spatial accessibility to healthcare: An analytic framework for local factor impacts. Health Place 2018, 51, 118–124. [Google Scholar]
- Perez, D.; Thalken, J.K.; Ughelu, N.E.; Knight, C.J.; Massey, W.V. Nowhere to go: Parents’ descriptions of children’s physical activity during a global pandemic. Front. Public Health 2021, 9, 642932. [Google Scholar]
- Li, X.; Zhang, C.; Li, W.; Kuzovkina, Y.A.; Weiner, D. Who lives in greener neighborhoods? The distribution of street greenery and its association with residents’ socioeconomic conditions in Hartford, Connecticut, USA. Urban For. Urban Green. 2015, 14, 751–759. [Google Scholar]
- Page, A.S.; Cooper, A.R.; Griew, P.; Jago, R. Independent mobility, perceptions of the built environment and children’s participation in play, active travel and structured exercise and sport: The PEACH Project. Int. J. Behav. Nutr. Phys. Act. 2010, 7, 17. [Google Scholar]
- Butler, E.N.; Ambs, A.M.; Reedy, J.; Bowles, H.R. Identifying GIS measures of the physical activity built environment through a review of the literature. J. Phys. Act. Health 2011, 8, S91–S97. [Google Scholar] [CrossRef]
- Shashank, A.; Schuurman, N.; Copley, R.; Lear, S. Creation of a rough runnability index using an affordance-based framework. Environ. Plan. B Urban Anal. City Sci. 2021, 49, 321–334. [Google Scholar] [CrossRef]
- Mitra, R.; Buliung, R.N. Exploring differences in school travel mode choice behaviour between children and youth. Transp. Policy 2015, 42, 4–11. [Google Scholar] [CrossRef]
- Panter, J.R.; Jones, A.P.; Van Sluijs, E.M. Environmental determinants of active travel in youth: A review and framework for future research. Int. J. Behav. Nutr. Phys. Act. 2008, 5, 34. [Google Scholar] [CrossRef]
- Davison, K.K.; Lawson, C.T. Do attributes in the physical environment influence children’s physical activity? A review of the literature. Int. J. Behav. Nutr. Phys. Act. 2006, 3, 19. [Google Scholar] [CrossRef] [PubMed]
- Ding, D.; Sallis, J.F.; Kerr, J.; Lee, S.; Rosenberg, D.E. Neighborhood environment and physical activity among youth: A review. Am. J. Prev. Med. 2011, 41, 442–455. [Google Scholar] [CrossRef] [PubMed]
- McCrorie, P.R.; Fenton, C.; Ellaway, A. Combining GPS, GIS, and accelerometry to explore the physical activity and environment relationship in children and young people-a review. Int. J. Behav. Nutr. Phys. Act. 2014, 11, 93. [Google Scholar] [CrossRef]
- Malacarne, D.; Handakas, E.; Robinson, O.; Pineda, E.; Saez, M.; Chatzi, L.; Fecht, D. The built environment as determinant of childhood obesity: A systematic literature review. Obes. Rev. 2022, 23, e13385. [Google Scholar] [CrossRef]
- McGrath, L.J.; Hopkins, W.G.; Hinckson, E.A. Associations of objectively measured built-environment attributes with youth moderate–vigorous physical activity: A systematic review and meta-analysis. Sport. Med. 2015, 45, 841–865. [Google Scholar] [CrossRef]
- Coleman, C.J.; Yeager, R.A.; Pond, Z.A.; Riggs, D.W.; Bhatnagar, A.; Pope, C.A., III. Mortality risk associated with greenness, air pollution, and physical activity in a representative US cohort. Sci. Total Environ. 2022, 824, 153848. [Google Scholar] [CrossRef]
- SafeGraph. SafeGraph POI. Available online: https://www.safegraph.com (accessed on 15 December 2021).
- NCES. School Attendance Boundary Survey (SABS). Available online: https://nces.ed.gov/programs/edge/SABS (accessed on 4 May 2021).
- USEPA. National Walkability Index. Available online: https://www.epa.gov/smartgrowth/smart-location-mapping (accessed on 12 December 2021).
- ESRI. USA Road Density. Available online: https://www.arcgis.com/home/item.html?id=64a95b092457466388f09136e331ff09 (accessed on 10 January 2022).
- USFBI. Uniform Crime Reporting Program Data: Arrests by Age, Sex, and Race, United States. 2016. Available online: https://www.icpsr.umich.edu/web/NACJD/studies/37057 (accessed on 10 January 2022).
- USCensus. TIGER/Line with Selected Demographic and Economic Data. Available online: https://www.census.gov/geographies/mapping-files/time-series/geo/tiger-data.html (accessed on 20 December 2021).
- GDPR. Georgia Parks Edition. Available online: http://www.mapcollaborator.org/georgia/ (accessed on 20 December 2021).
- Google. Google Maps API. Available online: https://developers.google.com/maps (accessed on 15 February 2021).
- GDOT. Traffic Analysis & Data Application. Available online: https://www.dot.ga.gov/GDOT/Pages/RoadTrafficData.aspx (accessed on 15 January 2022).
- USGS. North America Elevation 1-Kilometer Resolution Raster. 2007. Available online: https://www.sciencebase.gov/catalog/item/4fb5495ee4b04cb937751d6d (accessed on 23 May 2022).
- EARTHDATA. MODIS/Terra Vegetation Indices Monthly L3 Global 1 km SIN Grid V061. Available online: https://search.earthdata.nasa.gov/search (accessed on 18 January 2022).
- USEPA. Air Quality—Cities and Counties. Available online: https://www.epa.gov/air-trends/air-quality-cities-and-counties (accessed on 30 January 2022).
- FEMA. National Risk Index. Available online: https://www.fema.gov/flood-maps/products-tools/national-risk-index (accessed on 25 January 2022).
- GAEPD. Water Quality in Georgia Report. Available online: https://epd.georgia.gov/geographic-information-systems-gis-databases-and-documentation (accessed on 25 January 2022).
- NHTS. National Household Travel Survey. Available online: https://nhts.ornl.gov/2017 (accessed on 23 May 2022).
- Greene, R.; Devillers, R.; Luther, J.E.; Eddy, B.G. GIS-based multiple-criteria decision analysis. Geogr. Compass. 2011, 5, 412–432. [Google Scholar] [CrossRef]
- Oh, Y.; Kim, Y. A resource recommendation method based on dynamic cluster analysis of application characteristics. Clust. Comput. 2019, 22, 175–184. [Google Scholar] [CrossRef]
- Wehrens, R.; Buydens, L.M. Self-and super-organizing maps in R: The Kohonen package. J. Stat. Softw. 2007, 21, 1–19. [Google Scholar] [CrossRef]
- Simon, H. Neural Networks: A Comprehensive Foundation; Prentice Hall: Hoboken, NJ, USA, 1999. [Google Scholar]
- Lynn, S. Self-Organising Maps for Customer Segmentation Using R. Available online: https://www.shanelynn.ie/self-organising-maps-for-customer-segmentation-using-r/ (accessed on 6 October 2022).
- Census. 2010 Census Regions and Divisions of the United States. Available online: https://www2.census.gov/geo/pdfs/maps-data/maps/reference/us_regdiv.pdf (accessed on 14 October 2022).
- Martin, S.L.; Kirkner, G.J.; Mayo, K.; Matthews, C.E.; Durstine, J.L.; Hebert, J.R. Urban, rural, and regional variations in physical activity. J. Rural. Health 2005, 21, 239–244. [Google Scholar] [CrossRef]
- Wang, X.; Liu, Y.; Zhu, C.; Yao, Y.; Helbich, M. Associations between the streetscape built environment and walking to school among primary schoolchildren in Beijing, China. J. Transp. Geogr. 2022, 99, 103303. [Google Scholar] [CrossRef]
- Wang, Y.; Liu, Y.; Song, S.; Gittelsohn, J.; Ouellette, M.; Ma, Y.; Wen, D. Individual, parental and built environmental features as influencing factors of active travel to school in northeast China: Findings from a cross-sectional study. BMJ Open 2022, 12, e047816. [Google Scholar] [CrossRef]
- Squillacioti, G.; Carsin, A.-E.; Bellisario, V.; Bono, R.; Garcia-Aymerich, J. Multisite greenness exposure and oxidative stress in children. The potential mediating role of physical activity. Environ. Res. 2022, 209, 112857. [Google Scholar] [CrossRef]
- CDC. CDC/ATSDR Social Vulnerability Index (SVI). Available online: https://www.atsdr.cdc.gov/placeandhealth/svi/index.html (accessed on 6 March 2023).
- UWPHI. County Health Rankings & Roadmaps. Available online: https://www.countyhealthrankings.org/ (accessed on 6 March 2023).
- Wicks, C.; Barton, J.; Orbell, S.; Andrews, L. Psychological benefits of outdoor physical activity in natural versus urban environments: A systematic review and meta-analysis of experimental studies. Appl. Psychol. Health Well-Being 2022, 14, 1037–1061. [Google Scholar] [CrossRef]
- Huertas-Delgado, F.J.; Queralt, A.; Chillón, P.; Molina-García, J. Associations between parental reasons for choosing a neighborhood and adolescents’ physical activity and commuting behaviors. J. Transp. Health 2022, 24, 101259. [Google Scholar] [CrossRef]
- Brussoni, M.; Gibbons, R.; Gray, C.; Ishikawa, T.; Sandseter, E.B.H.; Bienenstock, A.; Chabot, G.; Fuselli, P.; Herrington, S.; Janssen, I. What is the relationship between risky outdoor play and health in children? A systematic review. Int. J. Environ. Res. Public Health 2015, 12, 6423–6454. [Google Scholar] [CrossRef]

| No. | Measures | Data Source | Description |
|---|---|---|---|
| Built Environment | |||
| 1 | Business Recreation | Safegraph [36] | The total count of the following NAICS business locations refers to the business recreation points related to the children’s activity. The business locations include Recreational and Vacation Camps; Fitness and Recreational Sports Centers; All Other Amusement and Recreation Industries; Zoos and Botanical Gardens; Amusement and Theme Parks; Sports and Recreation Instruction (under education); Museums; Amusement Arcades; and Historical Sites. |
| 2 | School | National Center for Education Statistics [37] | Public Elementary, Middle, and High Schools locations |
| 3 | National walkability Index | US Environmental Protection Agency [38] | National Walkability Index score To determine the walkability scores, the intersection density, land use mix, and proximity to transit were integrated into the score calculation. |
| 4 | Road density | ArcGIS Online [39] | Roads, highways, bike trails, and footpaths. |
| 5 | Crime Rate | United States Department of Justice [40] | Uniform Crime Reporting Program Data |
| 6 | Vacant place | Census American Community Survey (ACS) [41] | Vacant housing units |
| 7 | Park | ArcGIS Online | Public parks, gardens, and forest polygons |
| Georgia Department of Parks & Recreation (GDPR) [42] | Park points with a set of 13 core activities desired and park status by GDPR | ||
| 8 | Business Review Rate | Google Maps reviews [43] | Average Google map review Rate for Business Recreation point |
| 9 | Traffic | Georgia Department of Transportation (GDOT) [44] | GDOT Traffic count point |
| Natural Environment | |||
| 10 | Slope | US Geological Survey [45] | North America elevation 1 km resolution raster |
| 11 | Greenness (NDVI) | MOD13A2 Version 6 [46] | The average NDVI raster from 2021 May to 2021 October |
| 12 | Air pollution (PM 2.5) | US Environmental Protection Agency [47] | PM 2.5: the values shown are the highest among the sites in each county and the weighted annual mean concentration. |
| 13 | National Risk Index | Federal Emergency Management Agency [48] | The index illustrates the US communities most at risk for 18 natural hazards at the county level. It includes avalanches, coastal flooding, cold wave, drought, earthquake, hail, heatwaves, hurricanes, ice storms, landslides, lightning, riverine flooding, strong wind, tornado, tsunami, volcanic eruption activity, wildfires, and winter weather. |
| 14 | Water pollution | Environmental Protection Division of Georgia (GA) [49] | Water pollution point (Water pollution categories: 4a, 4b, 4c, 5 and 5R) |
| Socio-demographic Environment | |||
| 15 | Income | Census ACS [41] | Household income |
| 16 | Below Poverty | Census ACS [41] | Population below the poverty level |
| 17 | Unemployment Rate | Census ACS [41] | Unemployment rate |
| 18 | No High School Diploma | Census ACS [41] | Completion or high school which is equivalent to the not completing post-secondary non tertiary education according to the international standard of education |
Disclaimer/Publisher’s Note: The statements, opinions and data contained in all publications are solely those of the individual author(s) and contributor(s) and not of MDPI and/or the editor(s). MDPI and/or the editor(s) disclaim responsibility for any injury to people or property resulting from any ideas, methods, instructions or products referred to in the content. |
© 2023 by the authors. Licensee MDPI, Basel, Switzerland. This article is an open access article distributed under the terms and conditions of the Creative Commons Attribution (CC BY) license (https://creativecommons.org/licenses/by/4.0/).
Share and Cite
Yang, J.; Mu, L.; Rajbhandari-Thapa, J. Measuring and Mapping Physical Activity Disparity (PAD) Index Based on Physical Activity Environment for Children. ISPRS Int. J. Geo-Inf. 2023, 12, 134. https://doi.org/10.3390/ijgi12030134
Yang J, Mu L, Rajbhandari-Thapa J. Measuring and Mapping Physical Activity Disparity (PAD) Index Based on Physical Activity Environment for Children. ISPRS International Journal of Geo-Information. 2023; 12(3):134. https://doi.org/10.3390/ijgi12030134
Chicago/Turabian StyleYang, Jue, Lan Mu, and Janani Rajbhandari-Thapa. 2023. "Measuring and Mapping Physical Activity Disparity (PAD) Index Based on Physical Activity Environment for Children" ISPRS International Journal of Geo-Information 12, no. 3: 134. https://doi.org/10.3390/ijgi12030134
APA StyleYang, J., Mu, L., & Rajbhandari-Thapa, J. (2023). Measuring and Mapping Physical Activity Disparity (PAD) Index Based on Physical Activity Environment for Children. ISPRS International Journal of Geo-Information, 12(3), 134. https://doi.org/10.3390/ijgi12030134


