

What Drives the Spatial Heterogeneity of Urban Leisure Activity Participation? A Multisource Big Data-Based Metrics in Nanjing, China
Abstract
:1. Introduction
2. Related Works
2.1. Quantifying Urban Leisure Space and Leisure Activity
2.2. What Impacts Urban Leisure Activity Participation and Its Distribution?
3. Study Area and Data Description
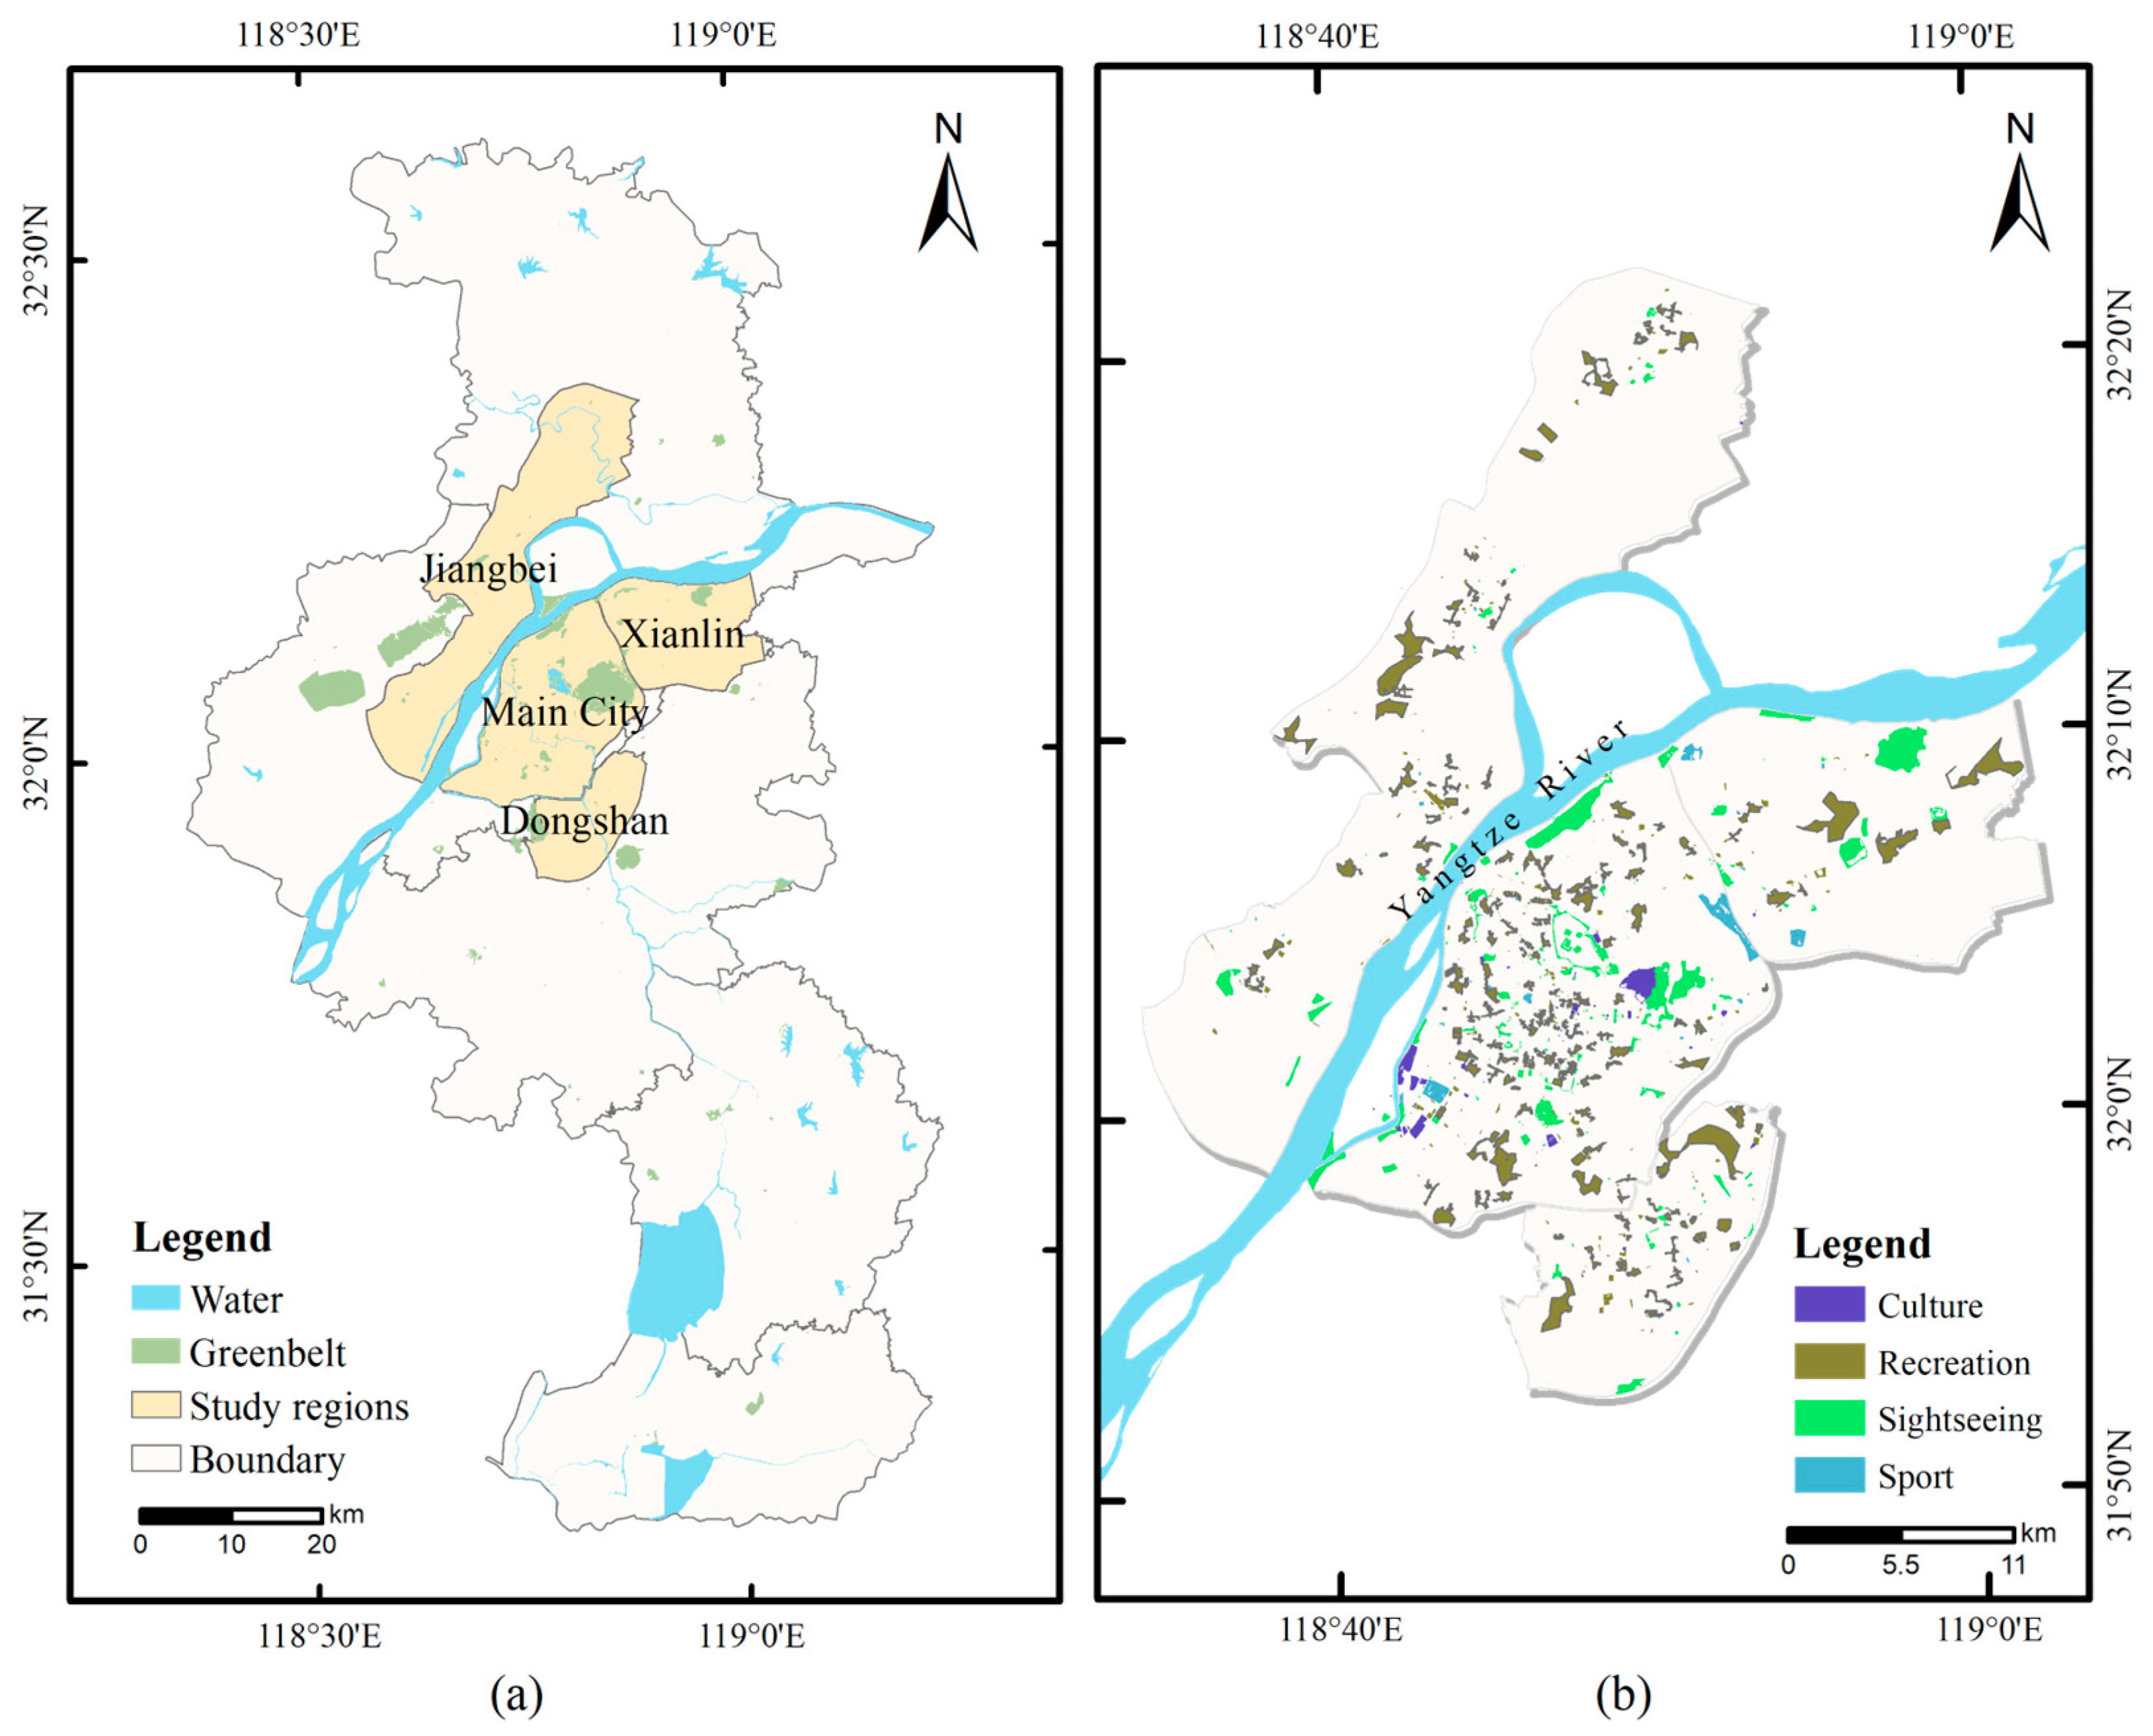
3.1. Study Area
3.2. Data
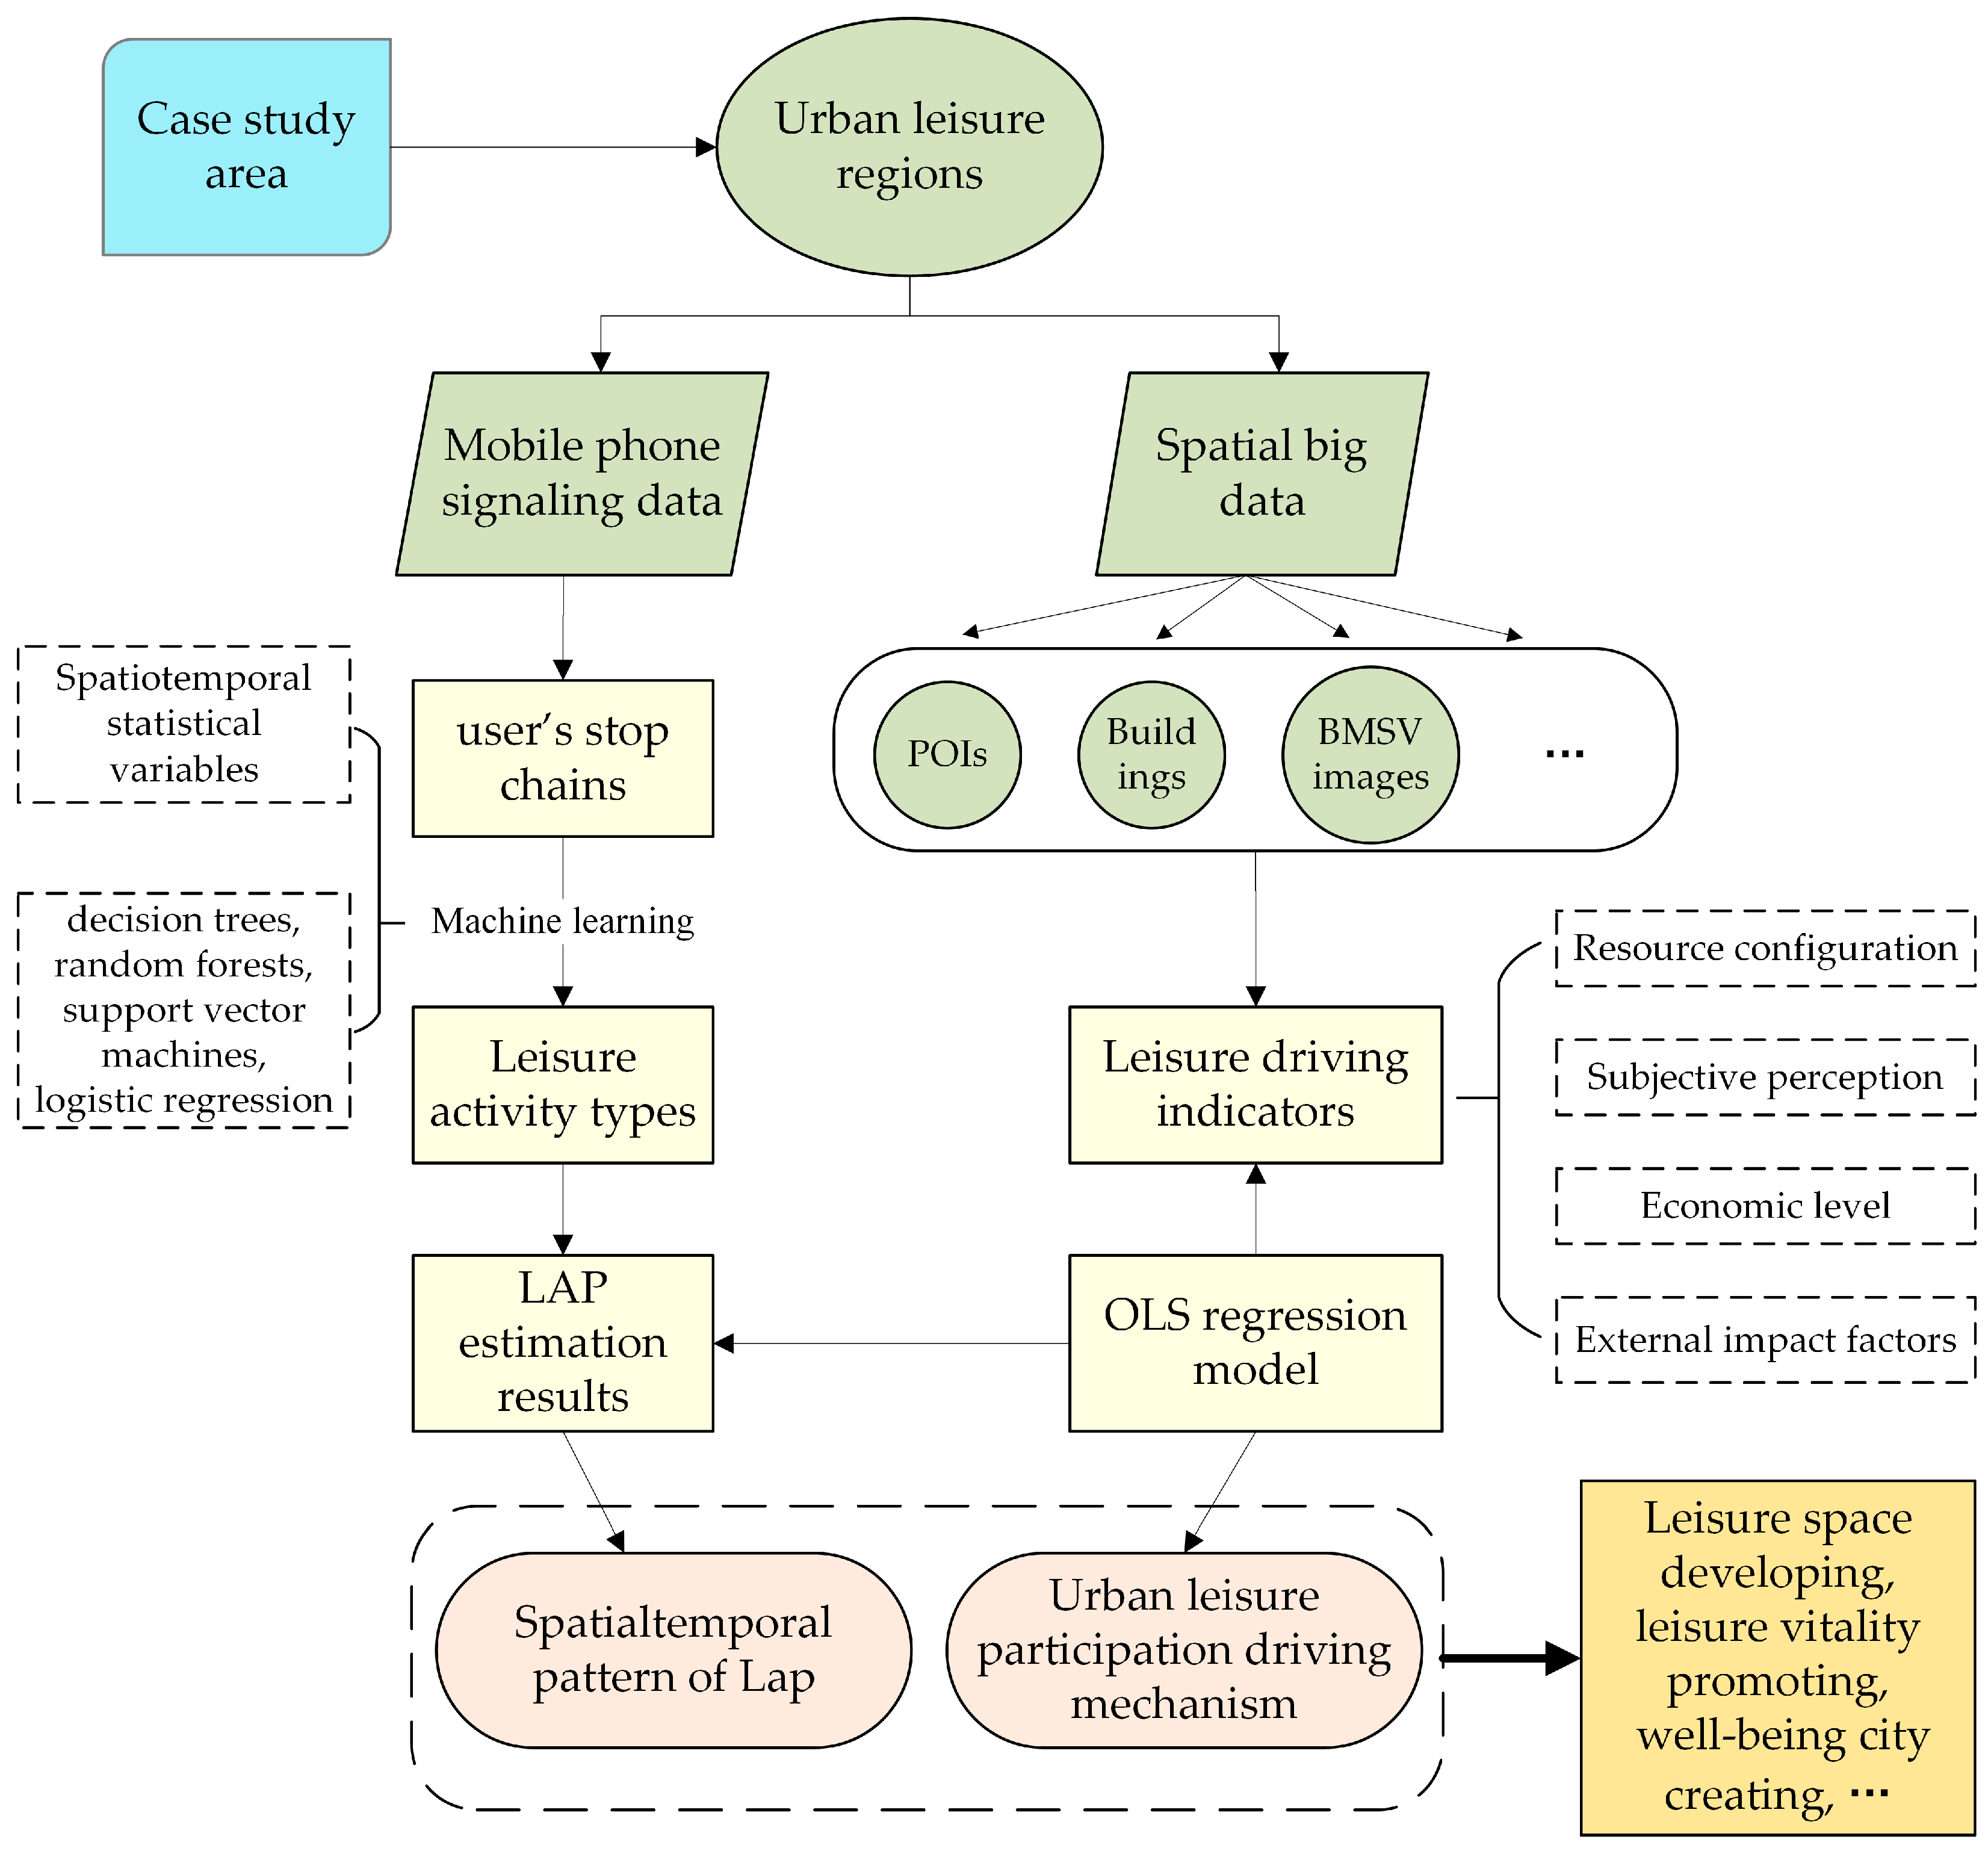
4. Methods
4.1. Estimation of Urban Leisure Activity Participation Using MPS Data
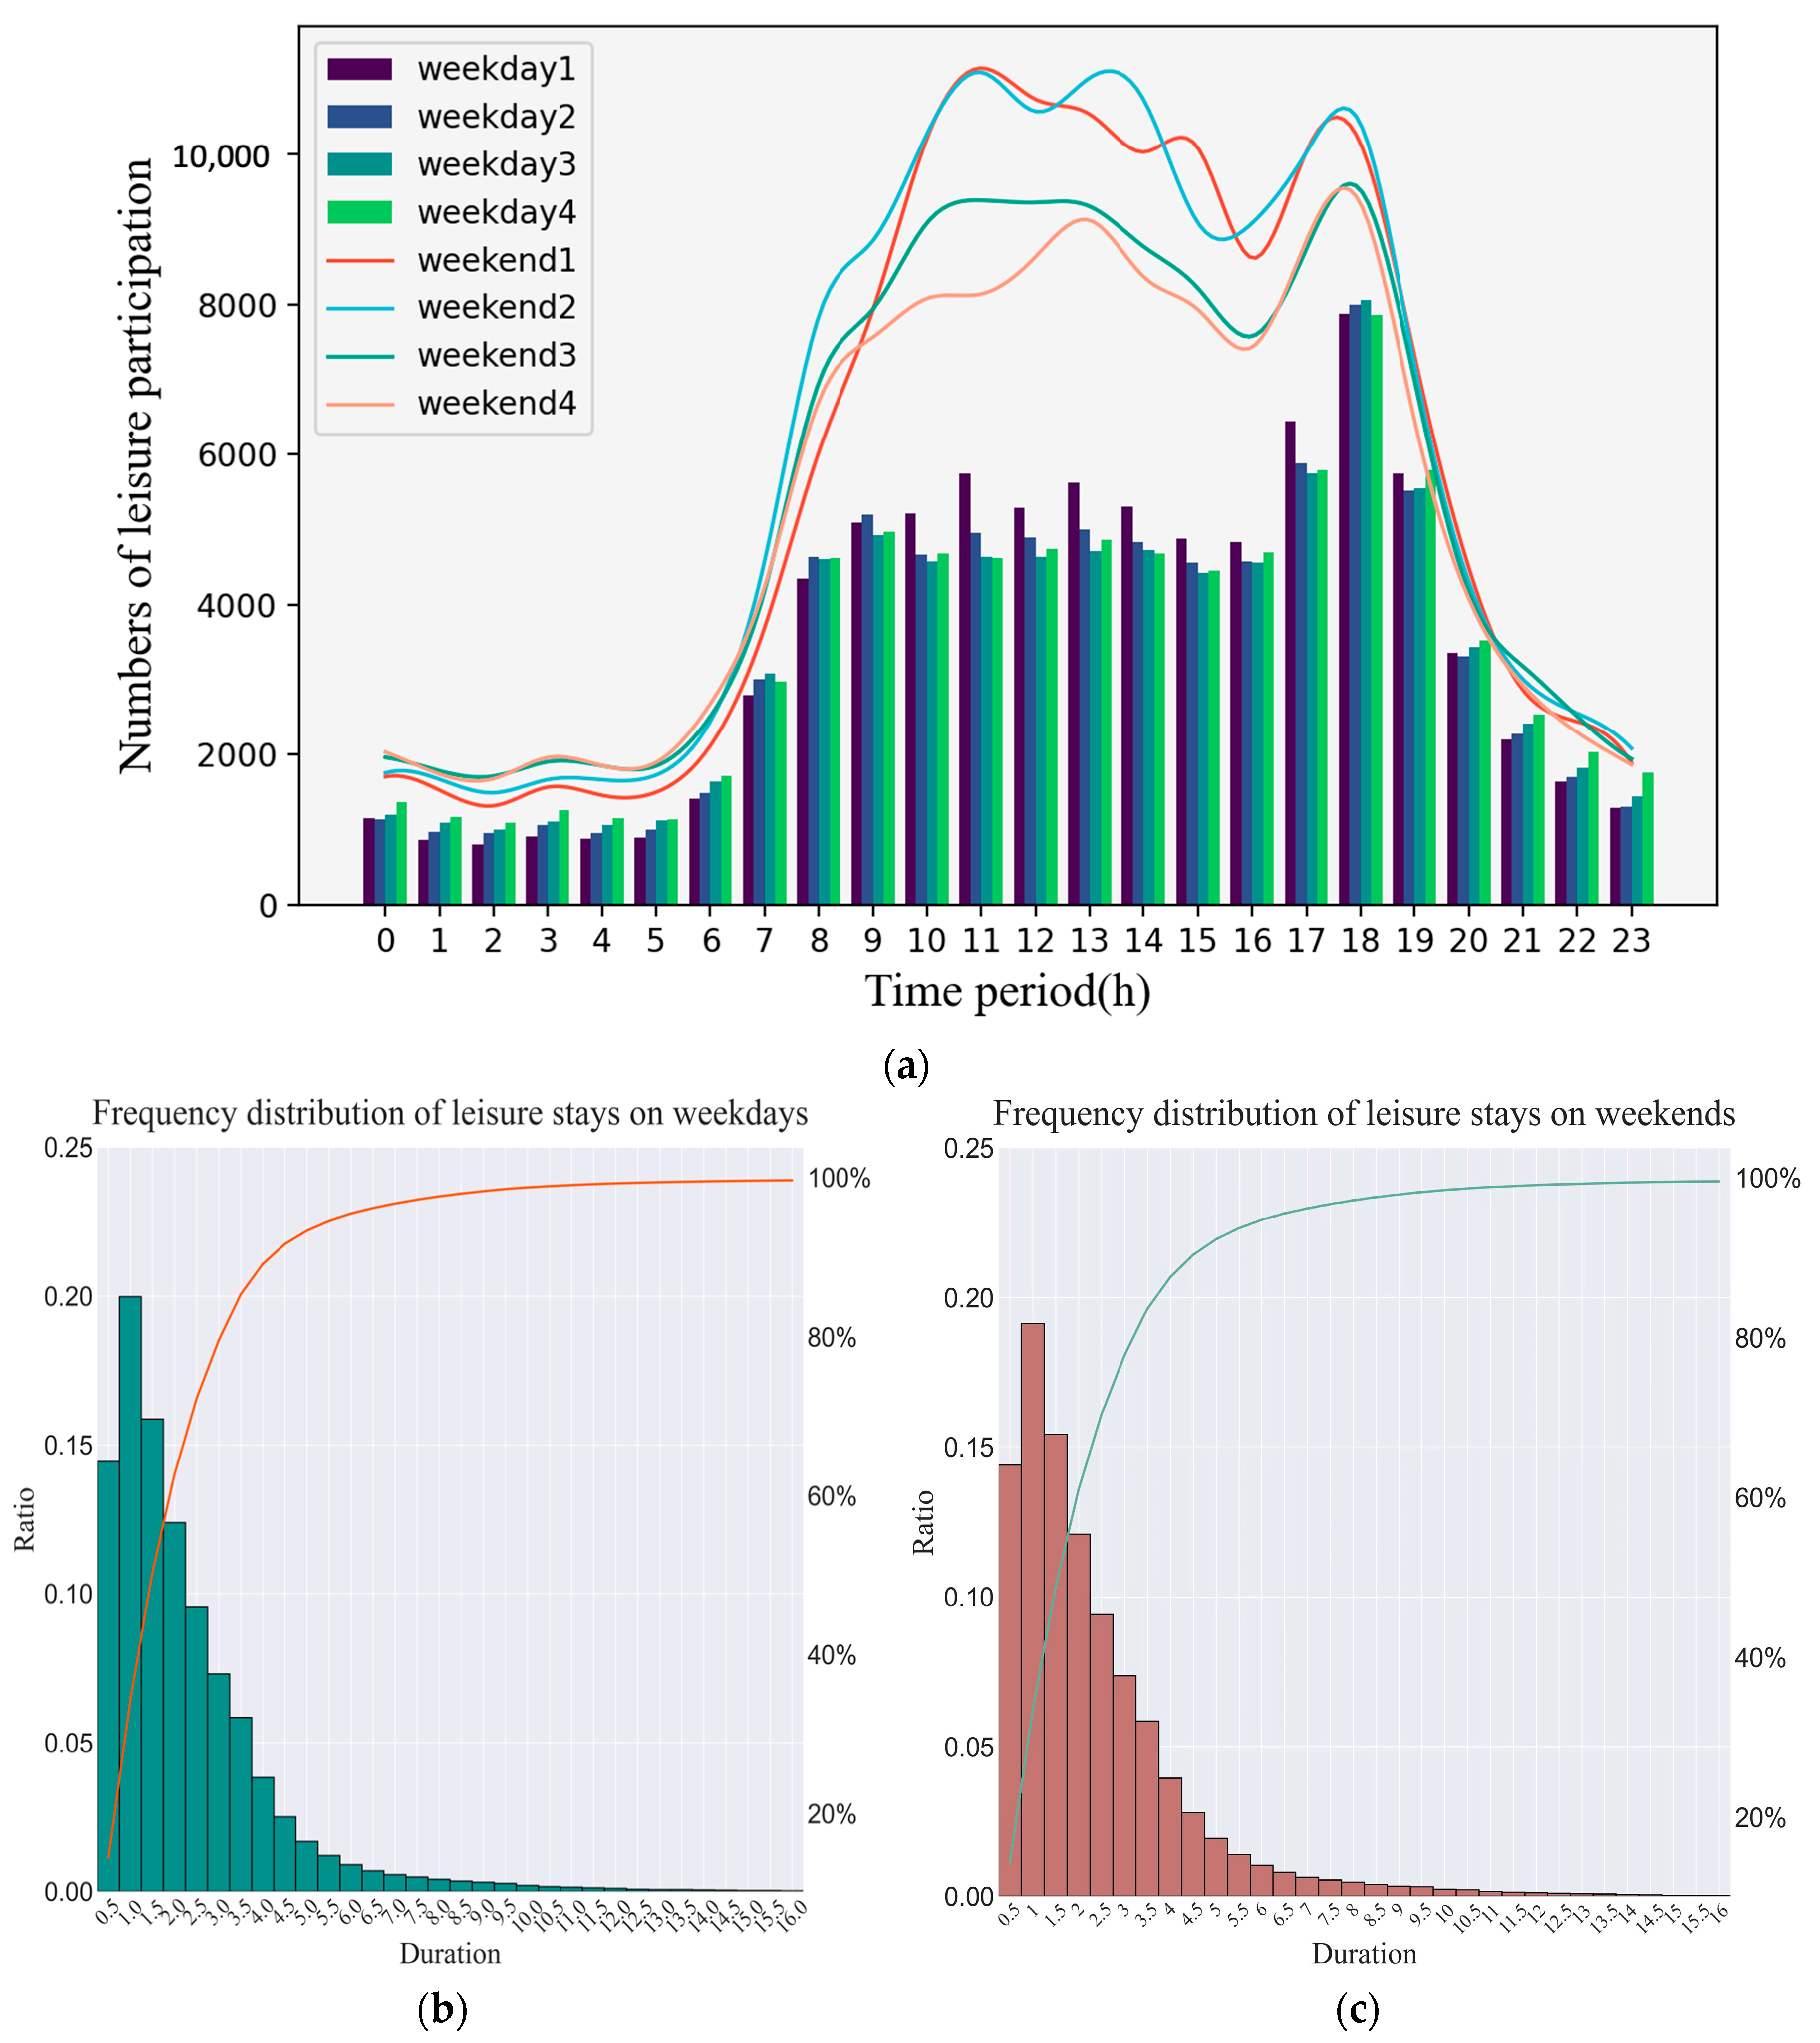
4.1.1. Construction of Stop Chains and Activity Types Labeling for Sample Data
- The land use of the stop area;
- Time range of stop times (morning, afternoon, night, etc.) and the duration of each stop;
- Frequency of visiting different places;
- Whether it is a day of rest;
- Distance from the usual point of residence (home/place of work).
4.1.2. Estimation of LAP Using Machine Learning Methods
- (1)
- Machine learning model and feature vector construction
- (2)
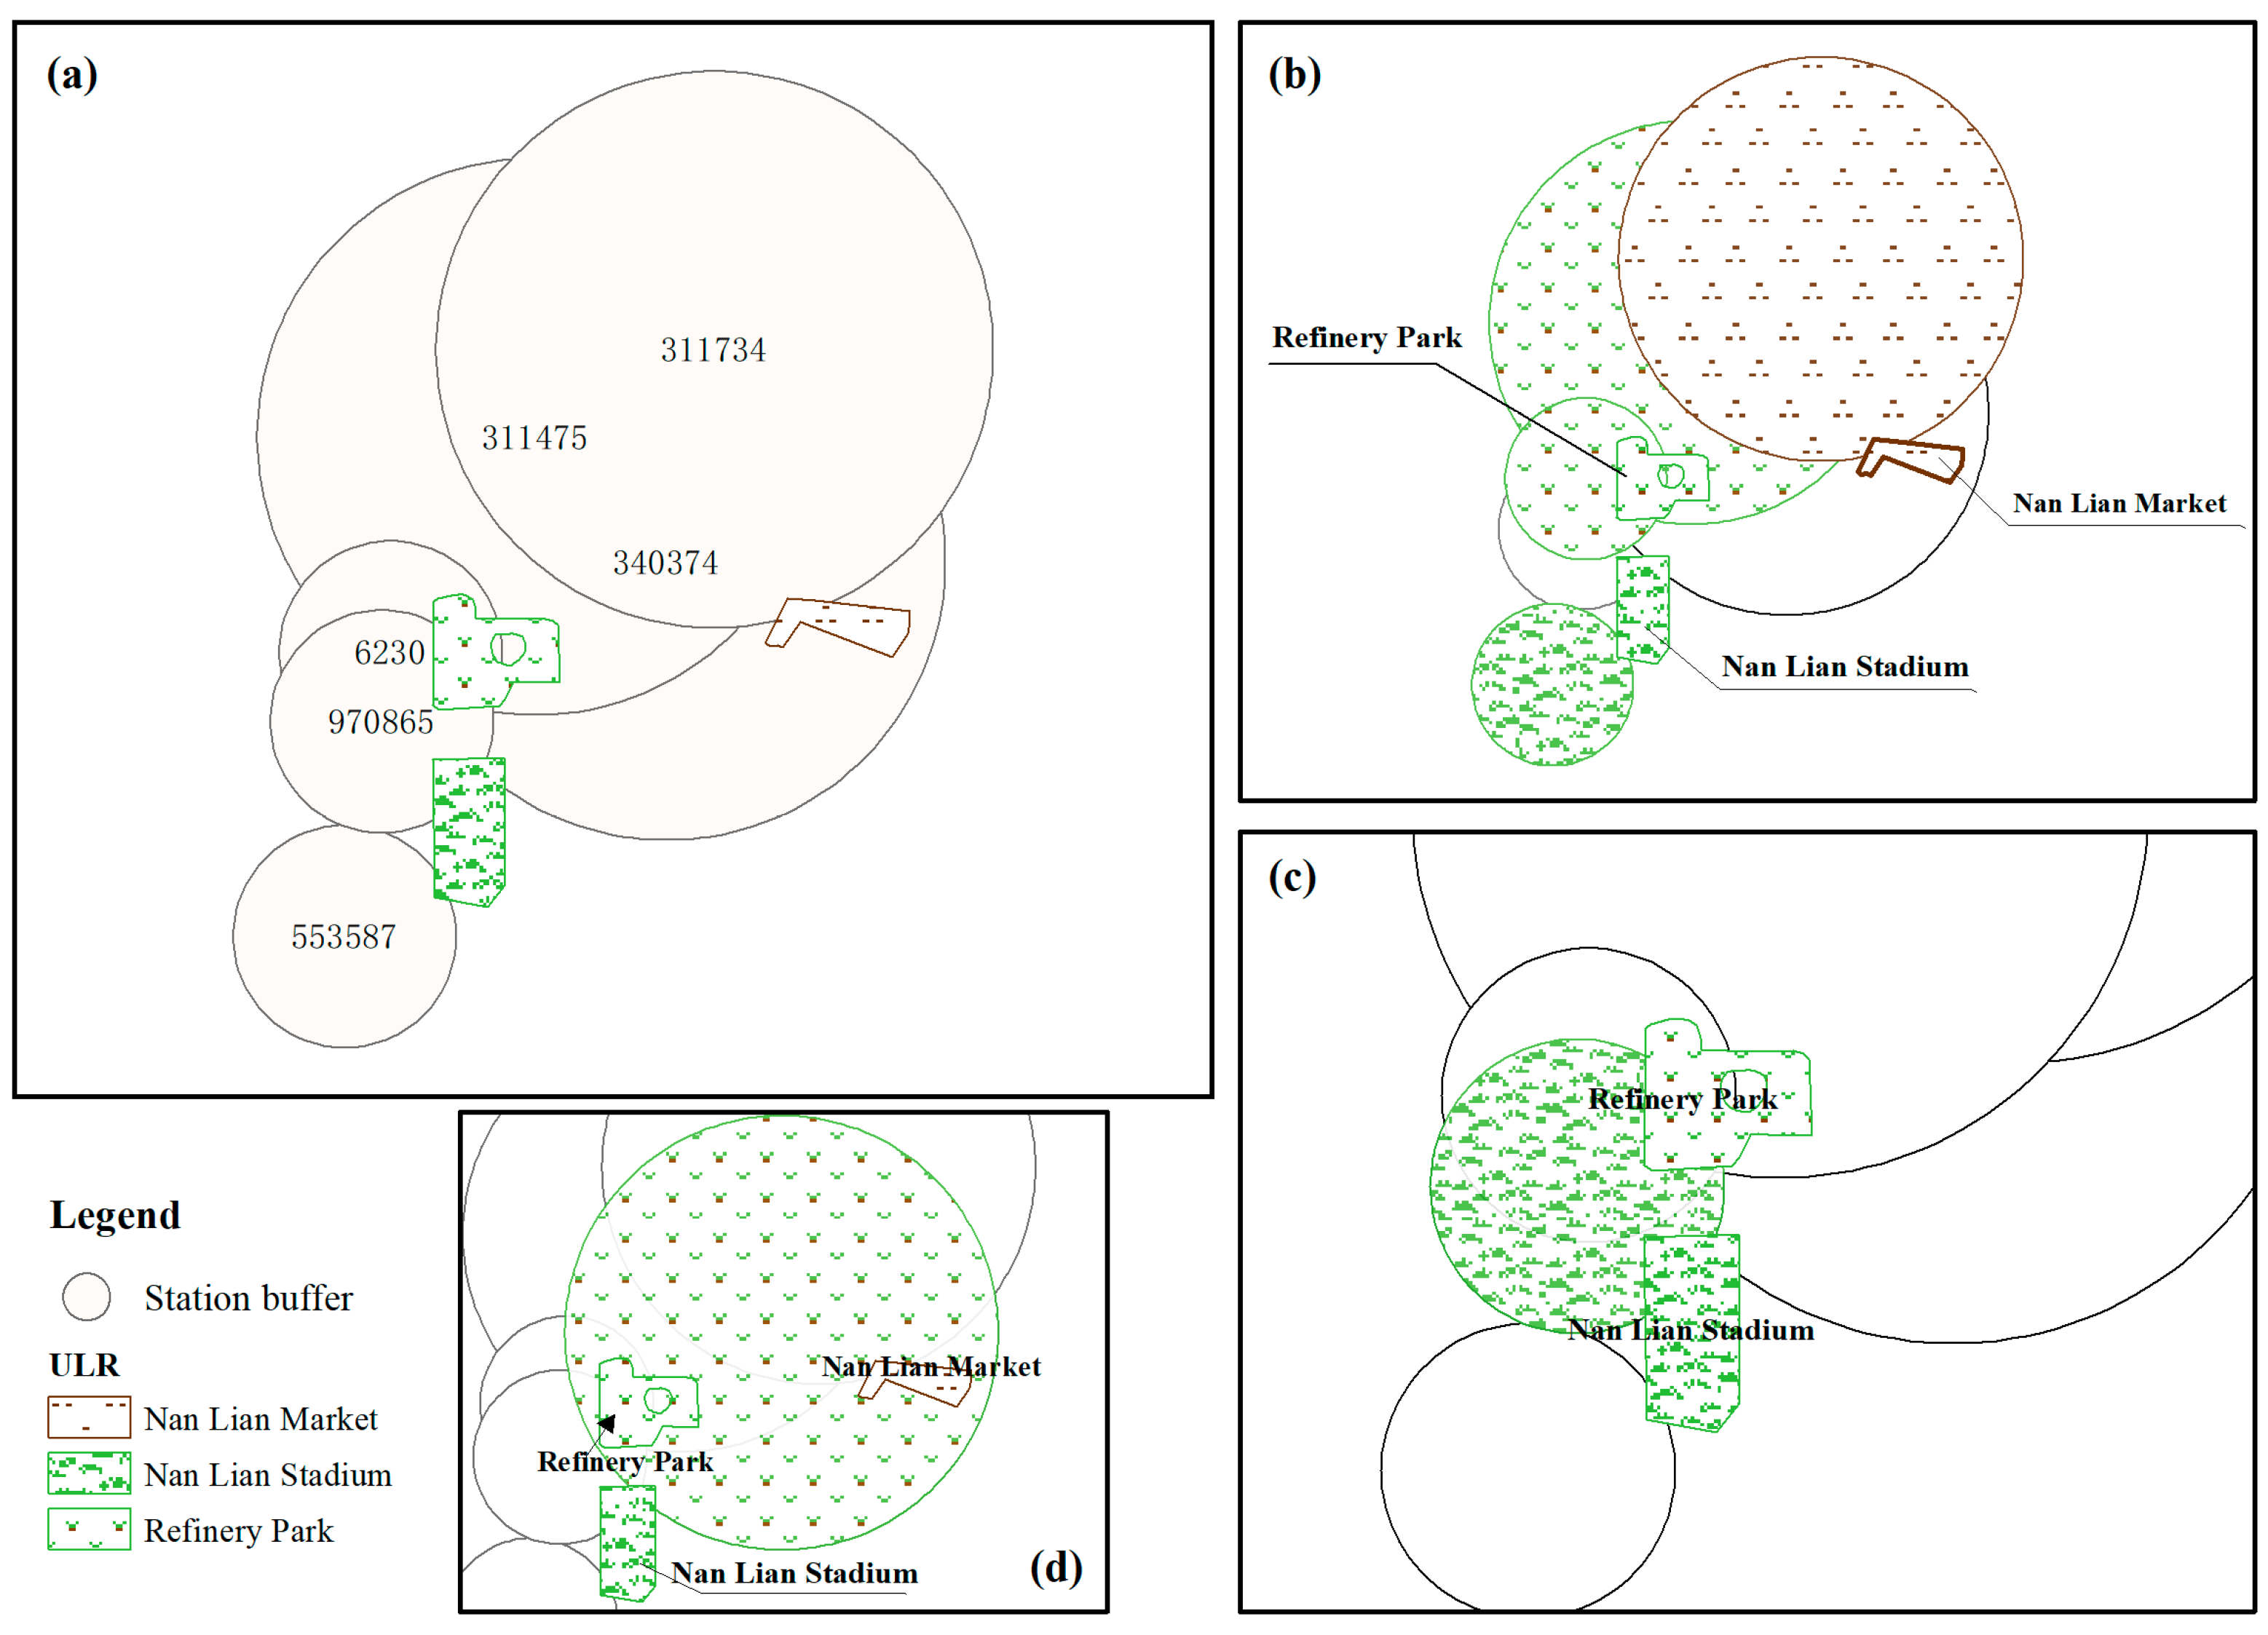
- Estimation of LAP based on spatial association
4.2. Construction and Quantification Driving Indicators System
4.2.1. Evaluation of Internal Impact Factors
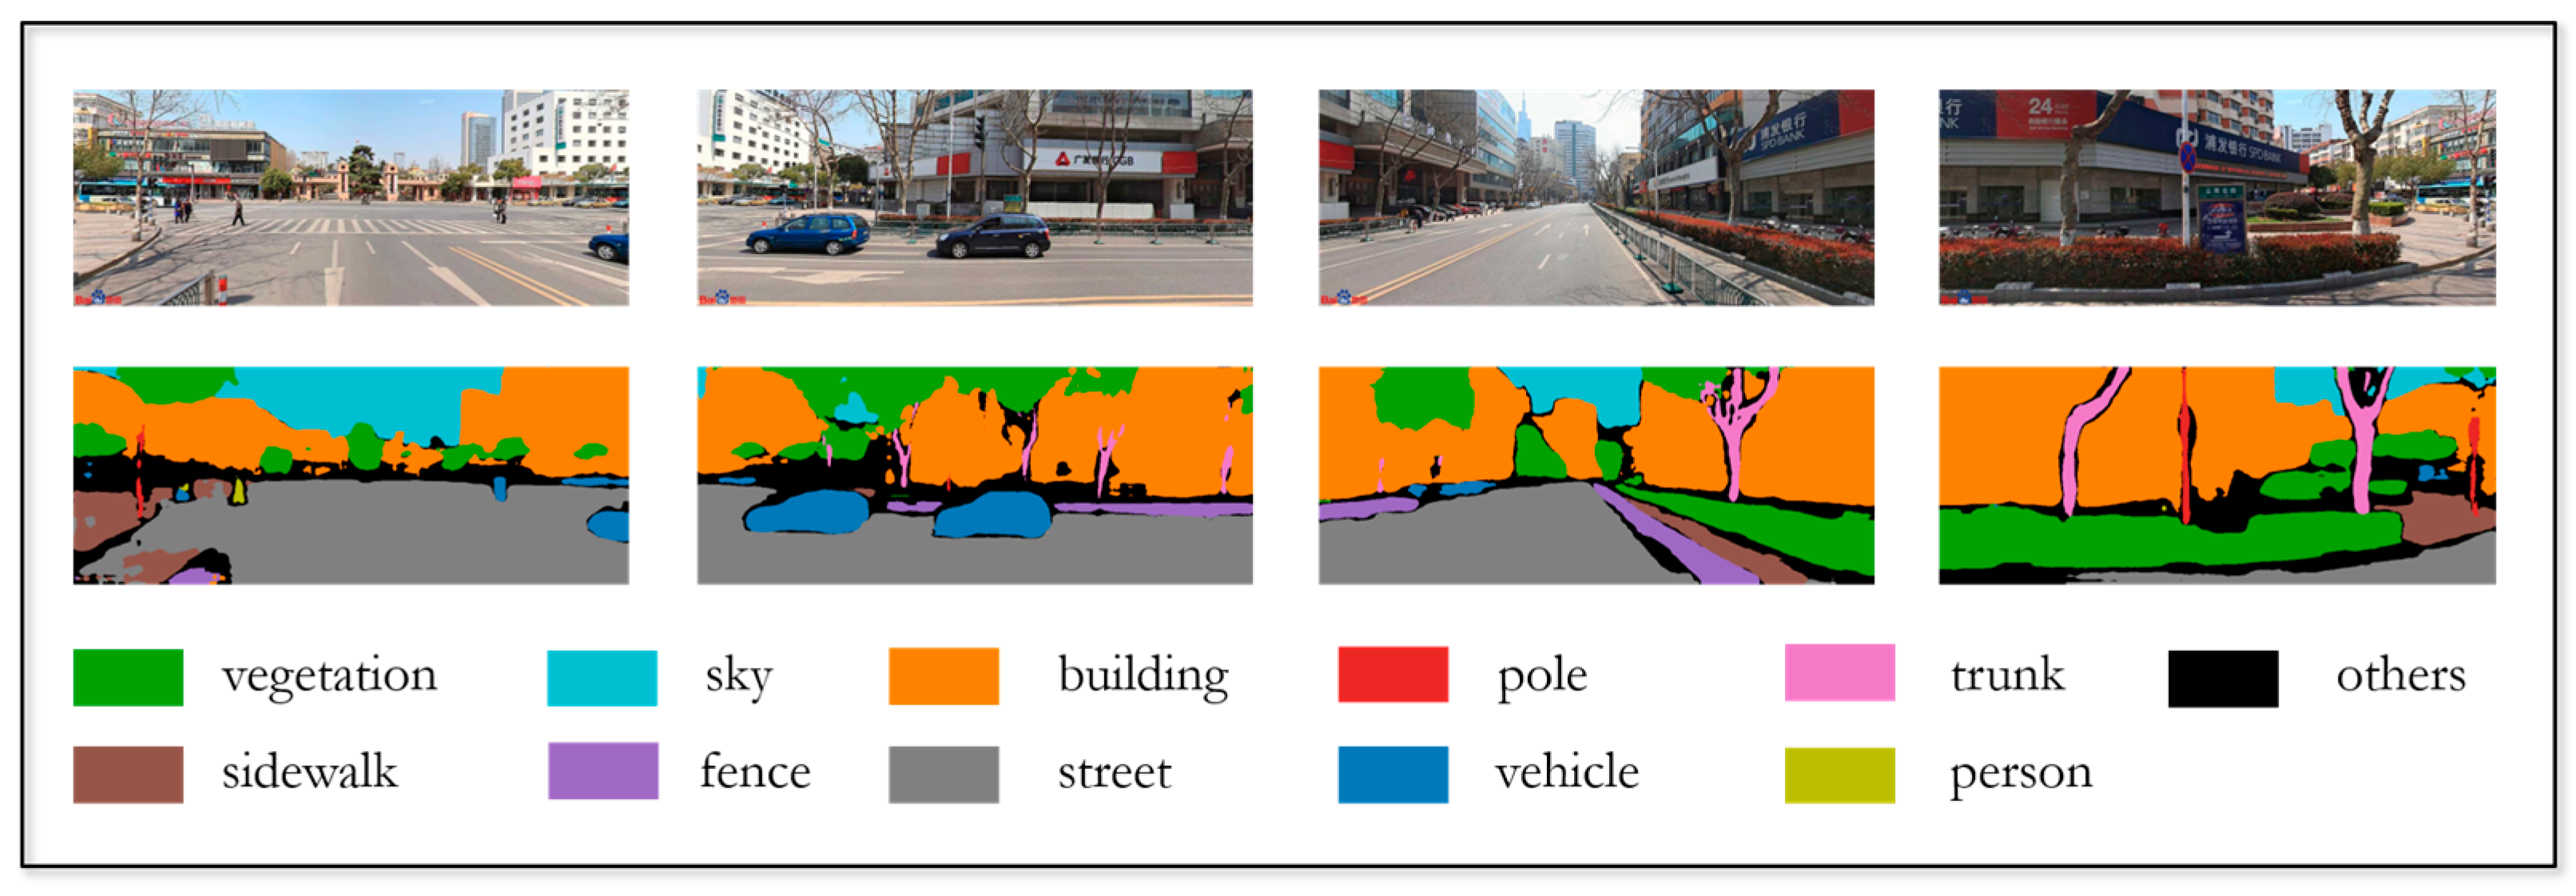
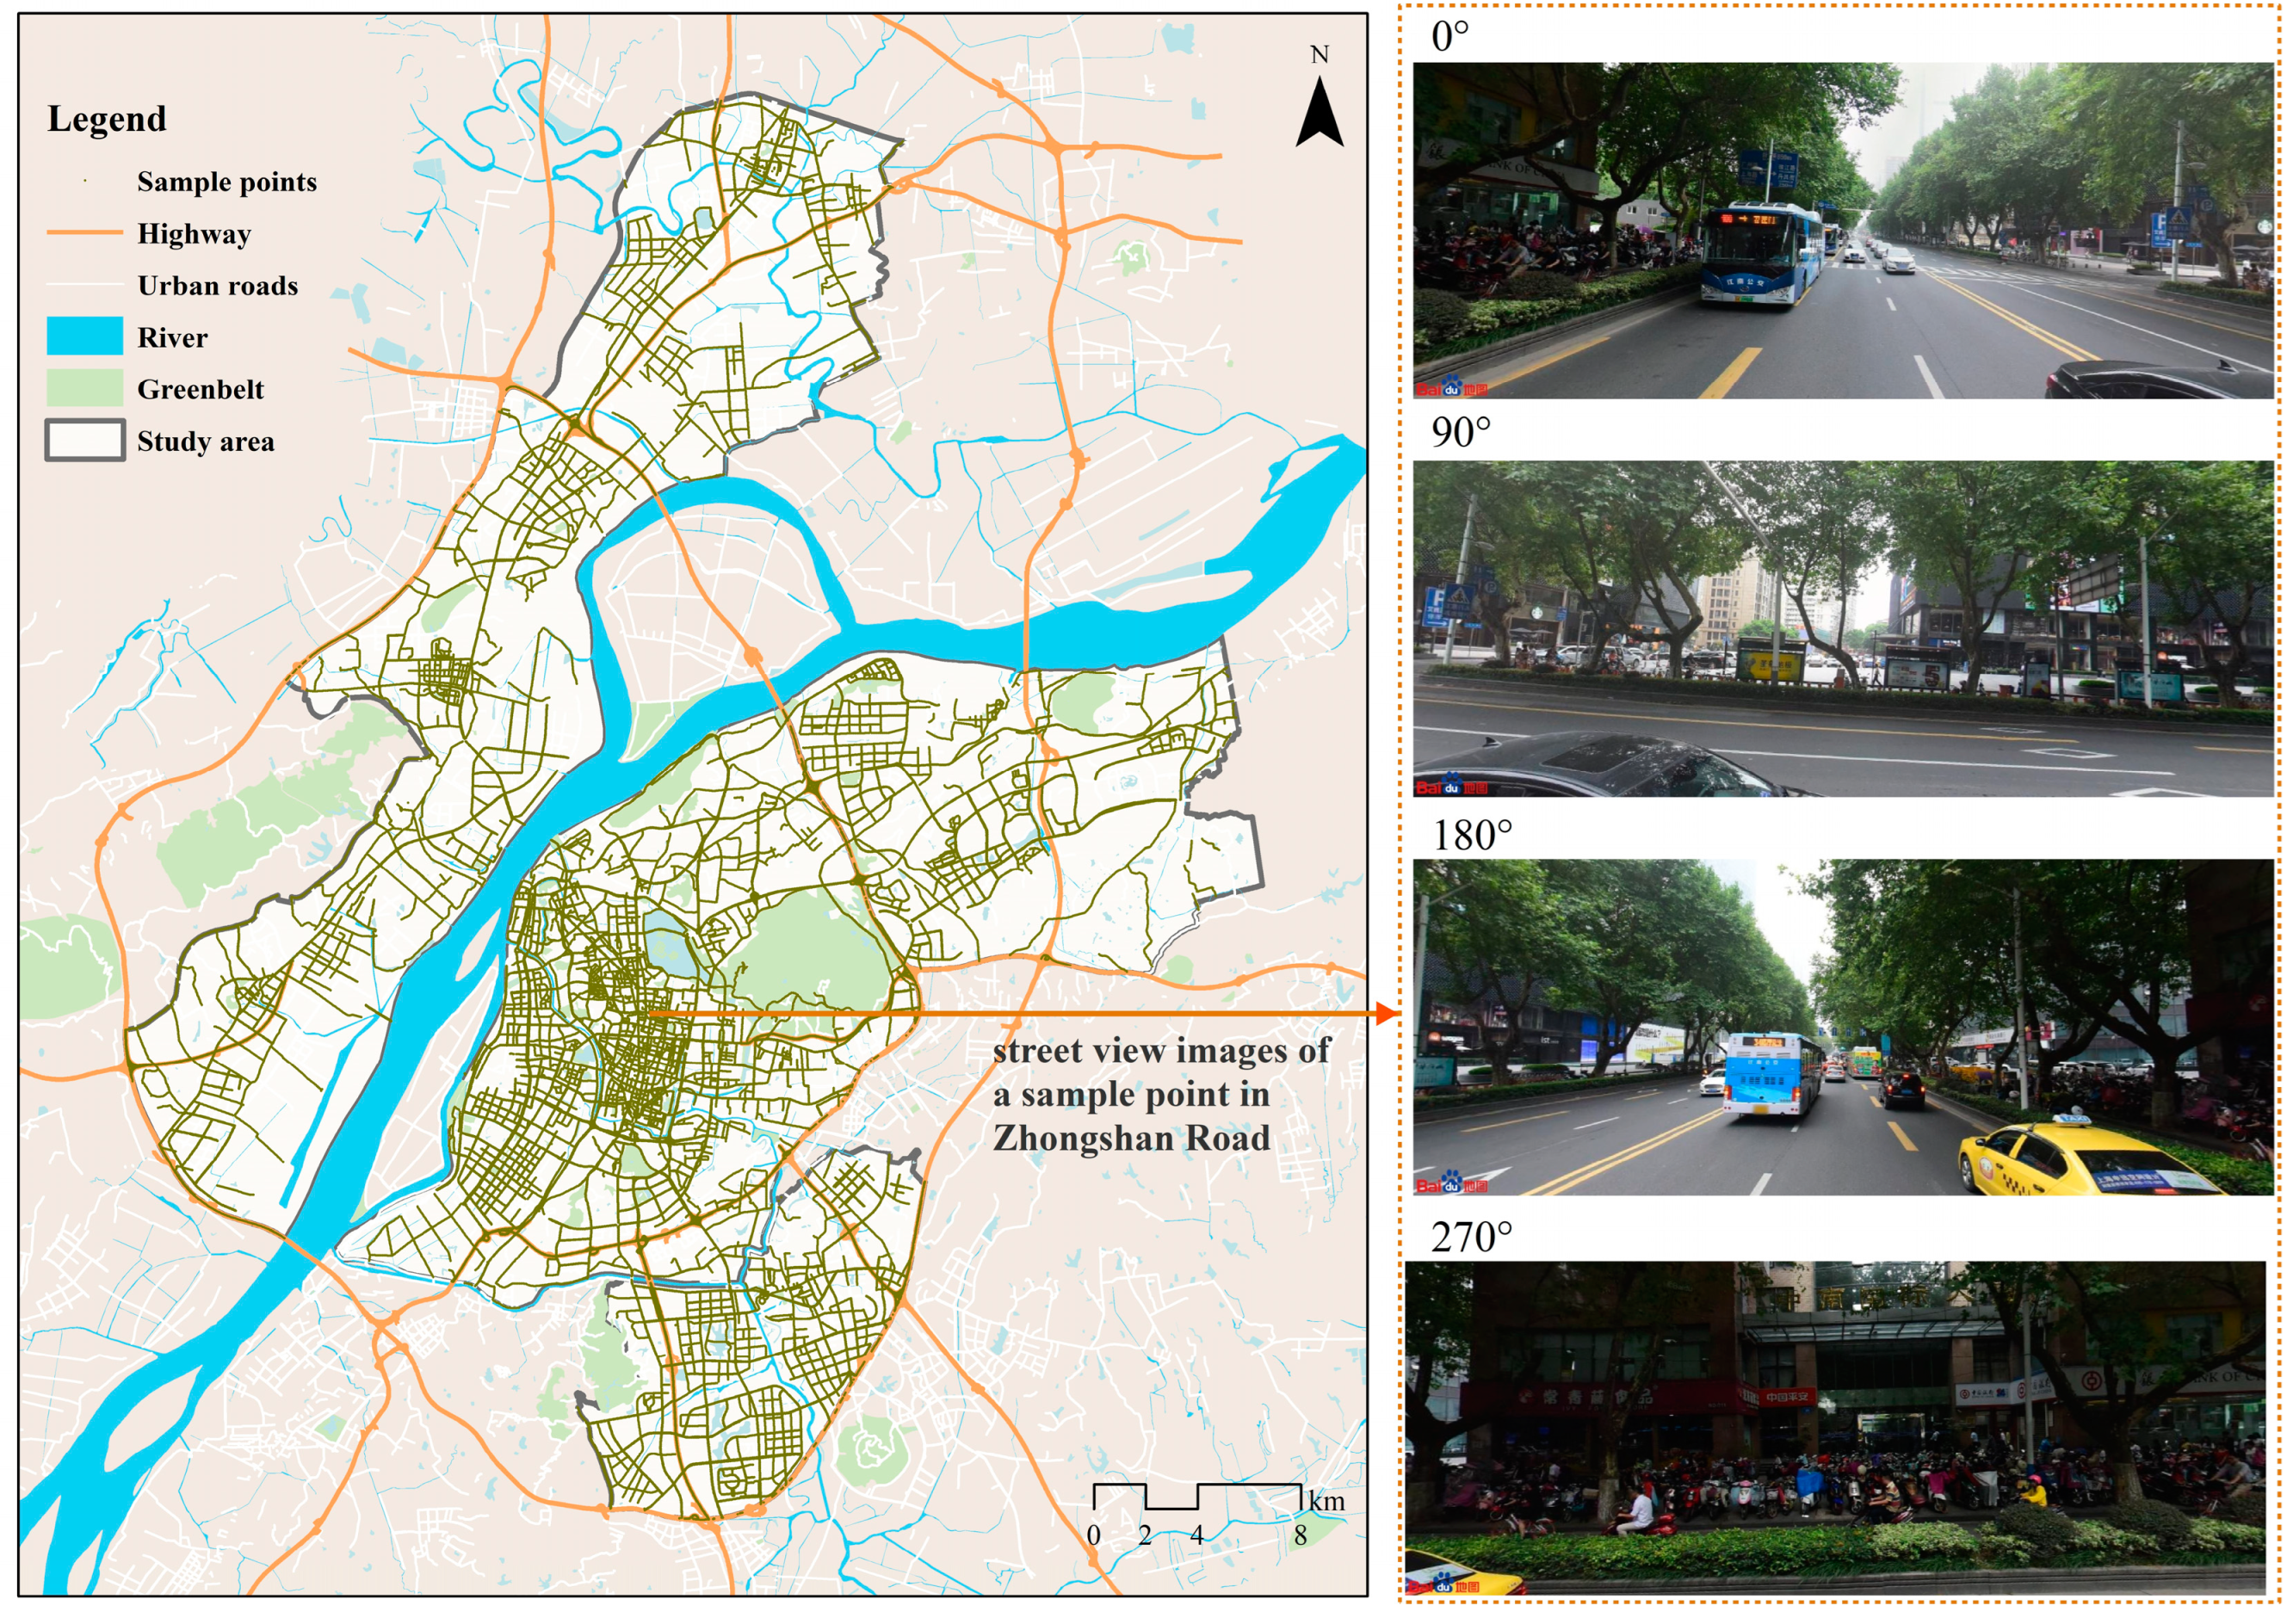
4.2.2. Evaluation of External Impact Factors
4.3. Spatial Correlation Regression Modeling of LAP
5. Results and Discussion
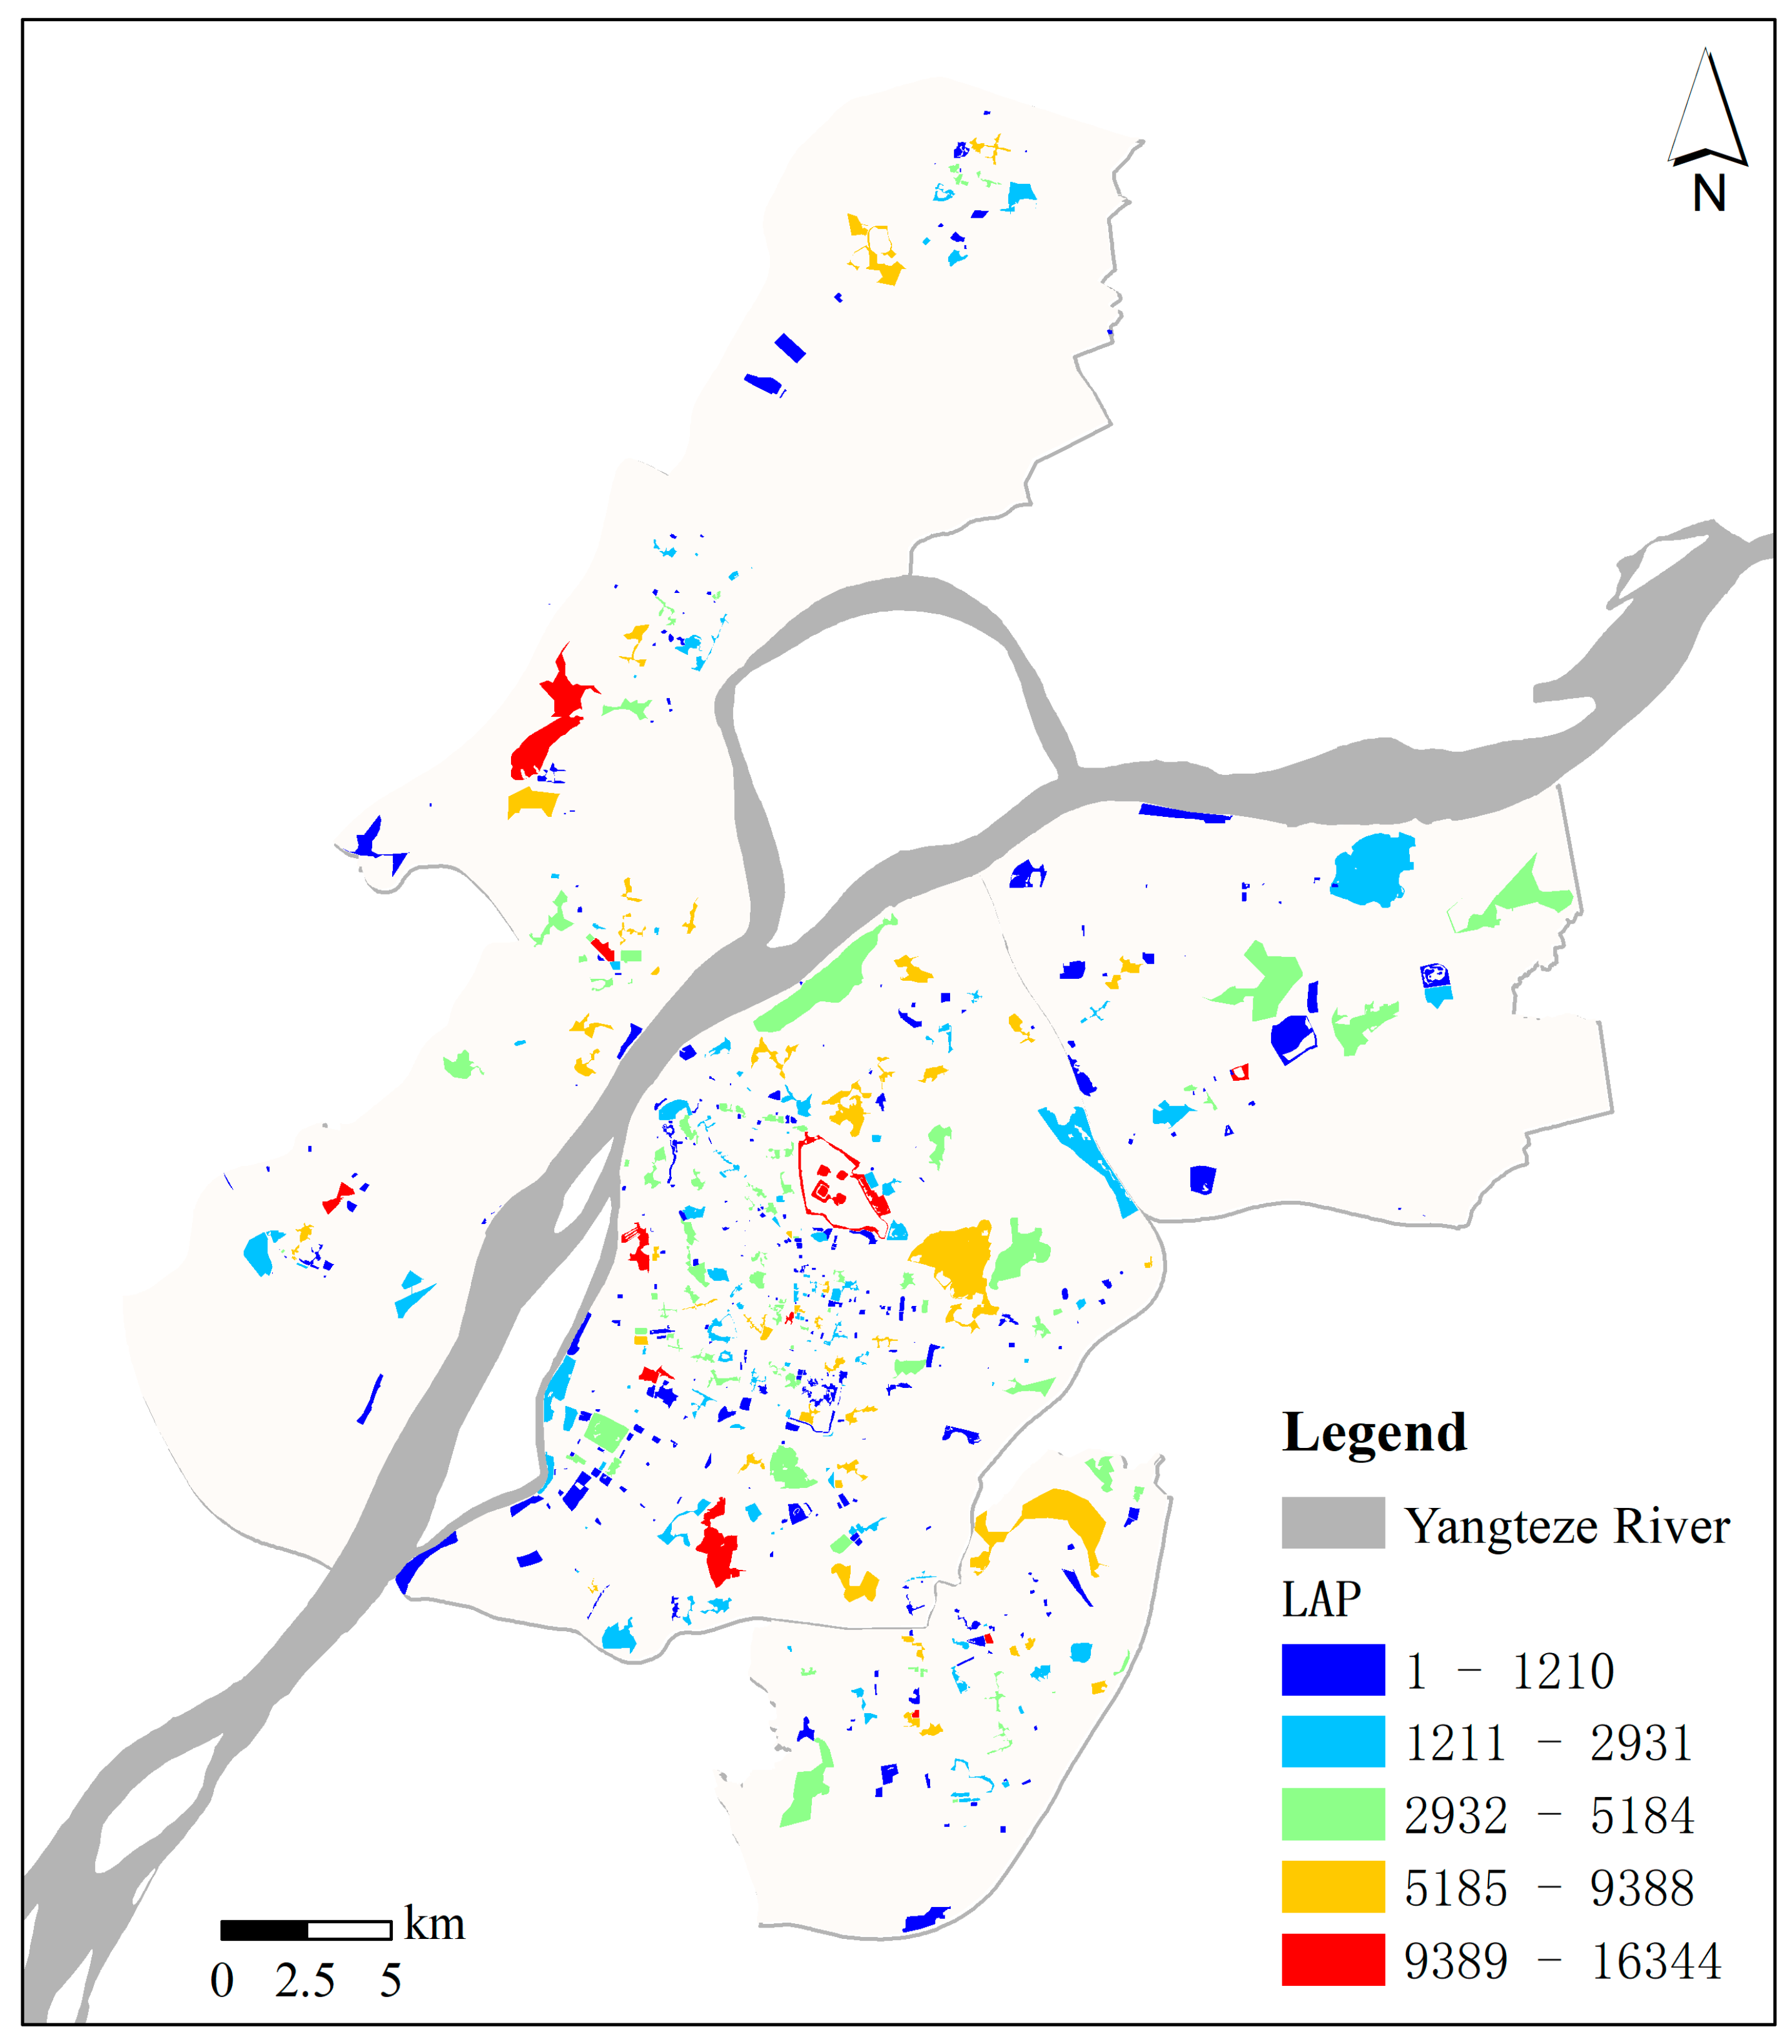
5.1. What Is the Distribution Pattern of Urban Leisure Activity Participation in the Study Area?
5.2. What Are the Impact Factors for the Distribution of LAP in the Study Area?
5.3. What Shapes the Distribution of LAP for Various Types of Leisure Activities?
- The identified factors have demonstrated a significant level of explanatory power for sports and sightseeing activities, reaching 85% and 67%, respectively. However, measuring the influence mechanism of recreational activities poses more challenges.
- The resource conditions of ULRs are associated with sports, sightseeing, and recreation activities. Sports activities require a balanced allocation of service resources, whereas tourism and recreation emphasize the abundance of resources.
- Participation in sports and cultural activities is influenced by the subjectively perceived of the environment created within the recreational area.
- The LAP of recreation activities is strongly linked to the density of the surrounding population and the concentrated distribution of recreation and leisure areas.
5.4. Limitations
- By incorporating other cities for comparisons, we will analyze the similarities and differences of urban LAP across different cities and evaluate the adaptability of the proposed indicator systems.
- The evaluation of subjective perceptual characteristics of indoor and outdoor environments within each leisure area (subjective perception assessment based on real pictures) will be integrated into the analysis system to further enhance the understanding of leisure-driven mechanisms.
6. Conclusions
Author Contributions
Funding
Data Availability Statement
Acknowledgments
Conflicts of Interest
References
- Bhatti, S.S.; Tripathi, N.K.; Nagai, M.; Nitivattananon, V. Spatial Interrelationships of Quality of Life with Land Use/Land Cover, Demography and Urbanization. Soc. Indic. Res. 2017, 132, 1193–1216. [Google Scholar] [CrossRef]
- Shaker, R.R. The Well-Being of Nations: An Empirical Assessment of Sustainable Urbanization for Europe. Int. J. Sustain. Dev. World Ecol. 2015, 22, 375–387. [Google Scholar] [CrossRef]
- Mohan, M.; Pathan, S.K.; Narendrareddy, K.; Kandya, A.; Pandey, S. Dynamics of Urbanization and Its Impact on Land-Use/Land-Cover: A Case Study of Megacity Delhi. J. Environ. Prot. 2011, 2, 1274. [Google Scholar] [CrossRef]
- Ragheb, M.G.; Griffith, C.A. The Contribution of Leisure Participation and Leisure Satisfaction to Life Satisfaction of Older Persons. J. Leis. Res. 1982, 14, 295–306. [Google Scholar] [CrossRef]
- Diener, E.; Suh, E.M.; Lucas, R.E.; Smith, H.L. Subjective Well-Being: Three Decades of Progress. Psychol. Bull. 1999, 125, 276. [Google Scholar] [CrossRef]
- Rodríguez, A.; Látková, P.; Sun, Y.Y. The Relationship between Leisure and Life Satisfaction: Application of Activity and Need Theory. Soc. Indic. Res. 2008, 86, 163–175. [Google Scholar] [CrossRef]
- Iwasaki, Y. Leisure and Quality of Life in an International and Multicultural Context: What Are Major Pathways Linking Leisure to Quality of Life? Soc. Indic. Res. 2007, 82, 233–264. [Google Scholar] [CrossRef]
- Beck, H. Linking the Quality of Public Spaces to Quality of Life. J. Place Manag. Dev. 2009, 2, 240–248. [Google Scholar] [CrossRef]
- Williams, K.; Burton, E.; Jenks, M. Achieving Sustainable Urban Form: An Introduction. Achiev. Sustain. Urban Form 2000, 2000, 1–5. [Google Scholar]
- Uysal, M.; Sirgy, M.J.; Woo, E.; Kim, H.L. Quality of Life (QOL) and Well-Being Research in Tourism. Tour. Manag. 2016, 53, 244–261. [Google Scholar] [CrossRef]
- Deng, Y.; Liu, J.; Luo, A.; Wang, Y.; Xu, S.; Ren, F.; Su, F. Spatial Mismatch between the Supply and Demand of Urban Leisure Services with Multisource Open Data. ISPRS Int. J. Geo-Inf. 2020, 9, 466. [Google Scholar] [CrossRef]
- Lopes, M.N.; Camanho, A.S. Public Green Space Use and Consequences on Urban Vitality: An Assessment of European Cities. Soc. Indic. Res. 2013, 113, 751–767. [Google Scholar] [CrossRef]
- Wei, S.; Wang, L. Examining Transportation Network Structures through Mobile Signaling Data in Urban China: A Case Study of Yixing. J. Spat. Sci. 2020, 67, 219–236. [Google Scholar] [CrossRef]
- Ahas, R.; Aasa, A.; Yuan, Y.; Raubal, M.; Smoreda, Z.; Liu, Y.; Ziemlicki, C.; Tiru, M.; Zook, M. Everyday Space–Time Geographies: Using Mobile Phone-Based Sensor Data to Monitor Urban Activity in Harbin, Paris, and Tallinn. Int. J. Geogr. Inf. Sci. 2015, 29, 2017–2039. [Google Scholar] [CrossRef]
- García-Palomares, J.C.; Salas-Olmedo, M.H.; Moya-Gómez, B.; Condeço-Melhorado, A.; Gutiérrez, J. City Dynamics through Twitter: Relationships between Land Use and Spatiotemporal Demographics. Cities 2018, 72, 310–319. [Google Scholar] [CrossRef]
- Vu, H.Q.; Li, G.; Law, R.; Zhang, Y. Tourist Activity Analysis by Leveraging Mobile Social Media Data. J. Travel Res. 2018, 57, 883–898. [Google Scholar] [CrossRef]
- Li, F.; Li, F.; Li, S.; Long, Y. Deciphering the Recreational Use of Urban Parks: Experiments Using Multi-Source Big Data for All Chinese Cities. Sci. Total Environ. 2020, 701, 134896. [Google Scholar] [CrossRef]
- van Weerdenburg, D.; Scheider, S.; Adams, B.; Spierings, B.; van der Zee, E. Where to Go and What to Do: Extracting Leisure Activity Potentials from Web Data on Urban Space. Comput. Environ. Urban Syst. 2019, 73, 143–156. [Google Scholar] [CrossRef]
- Jing, Y.; Liu, Y.; Cai, E.; Yi, L.; Zhang, Y. Quantifying the Spatiality of Urban Leisure Venues in Wuhan, Central China—GIS-Based Spatial Pattern Metrics. Sustain. Cities Soc. 2018, 40, 638–647. [Google Scholar] [CrossRef]
- Liu, J.; Deng, Y.; Wang, Y.; Huang, H.; Du, Q.; Ren, F. Urban Nighttime Leisure Space Mapping with Nighttime Light Images and POI Data. Remote Sens. 2020, 12, 541. [Google Scholar] [CrossRef]
- Liu, Y.; Zhang, Y.; Jin, S.T.; Liu, Y. Spatial Pattern of Leisure Activities among Residents in Beijing, China: Exploring the Impacts of Urban Environment. Sustain. Cities Soc. 2020, 52, 101806. [Google Scholar] [CrossRef]
- He, S.; Yu, S.; Wei, P.; Fang, C. A Spatial Design Network Analysis of Street Networks and the Locations of Leisure Entertainment Activities: A Case Study of Wuhan, China. Sustain. Cities Soc. 2019, 44, 880–887. [Google Scholar] [CrossRef]
- Kelly, J.R.; Ross, J. Later-life Leisure: Beginning a New Agenda. Leis. Sci. 1989, 11, 47–59. [Google Scholar] [CrossRef]
- Trenberth, L.; Dewe, P. The Importance of Leisure as a Means of Coping with Work Related Stress: An Exploratory Study. Couns. Psychol. Q. 2002, 15, 59–72. [Google Scholar] [CrossRef]
- Zhang, X.Q. The Trends, Promises and Challenges of Urbanisation in the World. Habitat Int. 2016, 54, 241–252. [Google Scholar] [CrossRef]
- Kent, J.L.; Thompson, S. The Three Domains of Urban Planning for Health and Well-Being. J. Plan. Lit. 2014, 29, 239–256. [Google Scholar] [CrossRef]
- Yu, B.; Che, S.; Xie, C.; Tian, S. Understanding Shanghai Residents’ Perception of Leisure Impact and Experience Satisfaction of Urban Community Parks: An Integrated and IPA Method. Sustainability 2018, 4, 1067. [Google Scholar] [CrossRef]
- Chun, S.; Lee, Y.; Kim, B.; Heo, J. The Contribution of Leisure Participation and Leisure Satisfaction to Stress-Related Growth. Leis. Sci. 2012, 34, 436–449. [Google Scholar] [CrossRef]
- Akar, G.; Clifton, K.J.; Doherty, S.T. Redefining Activity Types: Who Participates in Which Leisure Activity? Transp. Res. Part Policy Pract. 2012, 46, 1194–1204. [Google Scholar] [CrossRef]
- Liu, Y.; Jing, Y.; Cai, E.; Cui, J.; Zhang, Y.; Chen, Y. How Leisure Venues Are and Why? A Geospatial Perspective in Wuhan, Central China. Sustain. Switz. 2017, 9, 1865. [Google Scholar] [CrossRef]
- Calabrese, F.; Diao, M.; Di Lorenzo, G.; Ferreira, J.; Ratti, C. Understanding Individual Mobility Patterns from Urban Sensing Data: A Mobile Phone Trace Example. Transp. Res. Part C Emerg. Technol. 2013, 26, 301–313. [Google Scholar] [CrossRef]
- Wang, Z.; He, S.Y.; Leung, Y. Applying Mobile Phone Data to Travel Behaviour Research: A Literature Review. Travel Behav. Soc. 2018, 11, 141–155. [Google Scholar] [CrossRef]
- Noulas, A.; Mascolo, C.; Frias-Martinez, E. Exploiting Foursquare and Cellular Data to Infer User Activity in Urban Environments. In Proceedings of the IEEE International Conference on Mobile Data Management, Milan, Italy, 3–6 June 2013; Volume 1, pp. 167–176. [Google Scholar]
- Diao, M.; Zhu, Y.; Ferreira, J.; Ratti, C. Inferring Individual Daily Activities from Mobile Phone Traces: A Boston Example. Environ. Plan. B Plan. Des. 2016, 43, 920–940. [Google Scholar] [CrossRef]
- Widhalm, P.; Yang, Y.; Ulm, M.; Athavale, S.; González, M.C. Discovering Urban Activity Patterns in Cell Phone Data. Transportation 2015, 42, 597–623. [Google Scholar] [CrossRef]
- Kemperman, A.D.A.M.; Timmermans, H.J.P. Influence of Socio-Demographics and Residential Environment on Leisure Activity Participation. Leis. Sci. 2008, 30, 306–324. [Google Scholar] [CrossRef]
- Ambrey, C.L. Urban Greenspace, Physical Activity and Wellbeing: The Moderating Role of Perceptions of Neighbourhood Affability and Incivility. Land Use Policy 2016, 57, 638–644. [Google Scholar] [CrossRef]
- Cerin, E.; Sit, C.H.P.; Barnett, A.; Cheung, M.C.; Chan, W.M. Walking for Recreation and Perceptions of the Neighborhood Environment in Older Chinese Urban Dwellers. J. Urban Health 2013, 90, 56–66. [Google Scholar] [CrossRef]
- Mallett, W.J.; McGuckin, N. Driving to Distractions: Recreational Trips in Private Vehicles. Transp. Res. Rec. 2000, 1719, 267–272. [Google Scholar] [CrossRef]
- Akar, G.; Clifton, K.J.; Doherty, S.T. Discretionary Activity Location Choice: In-Home or out-of-Home? Transportation 2011, 38, 101–122. [Google Scholar] [CrossRef]
- Cerin, E.; Leslie, E. How Socio-Economic Status Contributes to Participation in Leisure-Time Physical Activity. Soc. Sci. Med. 2008, 66, 2596–2609. [Google Scholar] [CrossRef]
- Dargay, J.M.; Clark, S. The Determinants of Long Distance Travel in Great Britain. Transp. Res. Part Policy Pract. 2012, 46, 576–587. [Google Scholar] [CrossRef]
- Giles-Corti, B.; Broomhall, M.H.; Knuiman, M.; Collins, C.; Douglas, K.; Ng, K.; Lange, A.; Donovan, R.J. Increasing Walking: How Important Is Distance to, Attractiveness, and Size of Public Open Space? Am. J. Prev. Med. 2005, 28, 169–176. [Google Scholar] [CrossRef]
- Phan, M.M.; Stodolska, M. What Impacts Leisure Activity and Diet among Immigrants? Mexican Immigrants’ Leisure Participation and Food Patterns in the Midwestern US. Leis. Sci. 2021, 43, 494–511. [Google Scholar] [CrossRef]
- Gul, Y.; Sultan, Z.; Moeinaddini, M.; Jokhio, G.A. The Effects of Physical Activity Facilities on Vigorous Physical Activity in Gated and Non-Gated Neighborhoods. Land Use Policy 2018, 77, 155–162. [Google Scholar] [CrossRef]
- Cui, C.; Wang, J.; Wu, Z.; Ni, J.; Qian, T. The Socio-Spatial Distribution of Leisure Venues: A Case Study of Karaoke Bars in Nanjing, China. ISPRS Int. J. Geo-Inf. 2016, 5, 150. [Google Scholar] [CrossRef]
- McGinn, A.P.; Evenson, K.R.; Herring, A.H.; Huston, S.L. The Relationship between Leisure, Walking, and Transportation Activity with the Natural Environment. Health Place 2007, 13, 588–602. [Google Scholar] [CrossRef] [PubMed]
- Song, R.; Jin, Z.; Li, W.; Wu, J.; He, D.; Yan, K.; Xia, J.; Liu, D. Annual Report on China’s Leisure Development (2019–2020); Chinese Academy of Social Sciences: Beijing, China, 2020. [Google Scholar]
- Jiang, S.; Fiore, G.A.; Yang, Y.; Ferreira, J.; Frazzoli, E.; González, M.C. A Review of Urban Computing for Mobile Phone Traces: Current Methods, Challenges and Opportunities. In Proceedings of the ACM SIGKDD International Conference on Knowledge Discovery and Data Mining, Chicago, IL, USA, 11–14 August 2013. [Google Scholar]
- Kubíček, P.; Konečný, M.; Stachoň, Z.; Shen, J.; Herman, L.; Řezník, T.; Staněk, K.; Štampach, R.; Leitgeb, Š. Population Distribution Modelling at Fine Spatio-Temporal Scale Based on Mobile Phone Data. Int. J. Digit. Earth 2019, 12, 1319–1340. [Google Scholar] [CrossRef]
- Aspelin, K.; Carey, N. Establishing Pedestrian Walking Speeds. Portland State Univ. 2005, 3, 5–25. [Google Scholar]
- Spissu, E.; Pinjari, A.R.; Bhat, C.R.; Pendyala, R.M.; Axhausen, K.W. An Analysis of Weekly Out-of-Home Discretionary Activity Participation and Time-Use Behavior. Transportation 2009, 36, 483–510. [Google Scholar] [CrossRef]
- Jiang, S.; Ferreira, J.; González, M.C. Clustering Daily Patterns of Human Activities in the City. Data Min. Knowl. Discov. 2012, 25, 478–510. [Google Scholar] [CrossRef]
- Xu, Y.; Shaw, S.L.; Zhao, Z.; Yin, L.; Fang, Z.; Li, Q. Understanding Aggregate Human Mobility Patterns Using Passive Mobile Phone Location Data: A Home-Based Approach. Transportation 2015, 42, 625–646. [Google Scholar] [CrossRef]
- Phithakkitnukoon, S.; Horanont, T.; Di Lorenzo, G.; Shibasaki, R.; Ratti, C. Activity-Aware Map: Identifying Human Daily Activity Pattern Using Mobile Phone Data. In Proceedings of the Lecture Notes in Computer Science (including Subseries Lecture Notes in Artificial Intelligence and Lecture Notes in Bioinformatics), Istanbul, Turkey, 22 August 2010; Volume 6219, pp. 14–25. [Google Scholar]
- Liu, F.; Janssens, D.; Wets, G.; Cools, M. Annotating Mobile Phone Location Data with Activity Purposes Using Machine Learning Algorithms. Expert Syst. Appl. 2013, 40, 3299–3311. [Google Scholar] [CrossRef]
- Yue, Y.; Zhuang, Y.; Yeh, A.G.O.; Xie, J.Y.; Ma, C.L.; Li, Q.Q. Measurements of POI-Based Mixed Use and Their Relationships with Neighbourhood Vibrancy. Int. J. Geogr. Inf. Sci. 2017, 31, 658–675. [Google Scholar] [CrossRef]
- Melis, G.; Gelormino, E.; Marra, G.; Ferracin, E.; Costa, G. The Effects of the Urban Built Environment on Mental Health: A Cohort Study in a Large Northern Italian City. Int. J. Environ. Res. Public Health 2015, 12, 14898–14915. [Google Scholar] [CrossRef] [PubMed]
- Meng, L.; Wen, K.H.; Zeng, Z.; Brewin, R.; Fan, X. The Impact of Street Space Perception Factors on Elderly Health in High-Density Cities in Macau—Analysis Based on Street View Images and Deep Learning Technology. Sustainability 2020, 12, 1799. [Google Scholar] [CrossRef]
- Dai, L.; Zheng, C.; Dong, Z.; Yao, Y.; Wang, R.; Zhang, X.; Ren, S.; Zhang, J.; Song, X.; Guan, Q. Analyzing the Correlation between Visual Space and Residents’ Psychology in Wuhan, China Using Street-View Images and Deep-Learning Technique. City Environ. Interact. 2021, 11, 100069. [Google Scholar] [CrossRef]
- Urban, P.; Chadwick, G.F.; Consultant, P.; Planning, C.; Diamond, D.R.; Faludi, A.K.F.; Gill, D.C.; Council, H.C.; Goodey, G.; Design, U.; et al. Human Aspects of Urban Form Towards a Man—Environment Approach to Urban Form and Design; Elsevier: Berkeley, CA, USA, 2016; ISBN 0080179746. [Google Scholar]
- Hao, Y.; Liu, Y.; Wu, Z.; Han, L.; Chen, Y.; Chen, G.; Chu, L.; Tang, S.; Yu, Z.; Chen, Z. Edgeflow: Achieving Practical Interactive Segmentation with Edge-Guided Flow. In Proceedings of the IEEE/CVF International Conference on Computer Vision, Montreal, QC, Canada, 10 March 2021; pp. 1551–1560. [Google Scholar]
- Rietveld, P.; Bruinsma, F.R. Is Transport Infrastructure Effective? : Transport Infrastructure and Accessibility: Impacts on the Space Economy. Adv. Spat. Sci. 1998, 47, 37–49. [Google Scholar]
- Francisco, L. Rivera-Batiz Increasing Returns, Monopolistic Competition, and Agglomeration Economies in Consumption and Production—ScienceDirect. Reg. Sci. Urban Econ. 1988, 18, 125–153. [Google Scholar]
- Hutcheson, G.D. Ordinary Least-Squares Regression. In The SAGE Dictionary of Quantitative Management Research; Moutinho, L., Hutcheson, G.D., Eds.; Sage: London, UK; pp. 224–228.


| Data | Content | Usage 1 | Source | Time |
|---|---|---|---|---|
| MPS | 4.39 TB original MPS records | 1 | A Chinese telecommunications operator with a high subscriber market share | April 2019 |
| POI | 119,267 points’ coordinates and their attributes | 2 | Gaode Maps, a Chinese map service platform (https://www.amap.com, accessed on 1 April 2020) | April 2020 |
| AOI | 9079 polygons with different functional attributes | 1, 2 | ||
| Buildings | Building profiles with a height attribute | 2 | ||
| Roads | 4 levels of urban road traffic network | 2 | ||
| Merchant POI | 22,659 merchant information, including average spending and ratings | 2 | Dianping website, China’s most popular lifestyle service review site | |
| BMSV images | 65,996 street sampling spots along with the transportation network | 2 | Baidu Maps, another Chinese map service platform (https://www.map.baidu.com, accessed on 1 April 2020) |
| Variable | Dimension | Description |
|---|---|---|
| Visit Frequency | Spatial | The frequency of visits to this stop point is divided by the frequency of visits to all stop points |
| Visit Frequency Week | The frequency of visits to this stop point on a workday is divided by the frequency of visits to all locations | |
| Land Use | Land use structure of this stop point | |
| Visit Frequency Weekend | The frequency of visits to this stop on weekends is divided by the frequency of visits to all locations | |
| Duration | Temporal | Dwell time of current stop point |
| Total Visit Duration | The total time spent visiting the stop point is divided by the length of all dwell times | |
| Earliest Visit Time | The earliest appearance of the stop point | |
| Latest Visit Time | The most recent appearance of this dwell point | |
| Average Visit Duration | The average duration of visits to this dwell point | |
| Variance Visit Duration | The variance of the average duration of visits to this stop point | |
| Longest Visit Duration | Maximum time to visit the stop point | |
| Total Visit Duration Week | Total hours of visits to the stop on weekdays divided by the entire length of stay | |
| Total Visit Duration Weekend | Total hours of visits to the stop on weekends divided by the entire length of stay | |
| Week | 0-Workday, 1-Weekend | |
| Day or Night | 0-Night, 1-Day |
| Evaluation Dimension | Evaluation Indicators | Data Sources | Quantitative Methods |
|---|---|---|---|
| Internal impact factors | Resource configuration | ||
| Density of leisure resources (Density) | Leisure POI | ||
| Diversity of leisure resources (Diversity) | |||
| Richness of leisure resources (Richness) | |||
| Subjective perception | |||
| Greenness | Street Map View Images | ||
| Openness | |||
| Walkability | |||
| Enclosure | |||
| Economic level | |||
| Consumption level (CL) | Dianping POI | ||
| Consumption balance (CB) | |||
| External impact factors | Traffic accessibility (TA) | Traffic network | |
| Surrounding population density (SPD) | AOI, building outline | ||
| Homogeneous Competition Index (HCI) | POI | ||
| Parameters | Values |
|---|---|
| Initial learning rate | 0.001 |
| Max-iter | 30,000 |
| Epoch | 200 |
| Batch | 4 |
| Model | Title 2 | Title 3 |
|---|---|---|
| Decision trees | Criterion = gini min samples split = 10 min samples leaf = 5 max depth = 90 | 0.904 |
| Random forest | n_estimators = 800 criterion = gini max depth = 30 bootstrap = true min samples split = 2 min samples leaf = 50 | 0.923 |
| Logistic Regression | solver = liblinear penalty = l2 C = 1.0 | 0.665 |
| Support Vector Machine | default parameters | 0.709 |
| Diagnostics of OLS Modeling | ||||||||
|---|---|---|---|---|---|---|---|---|
| Multiple -Squared | 0.5234 | |||||||
| Adjusted -Squared | 0.5106 | |||||||
| Joint F-Statistic | 41.003 *** | |||||||
| Joint chi-squared Statistic | 367.354 *** | |||||||
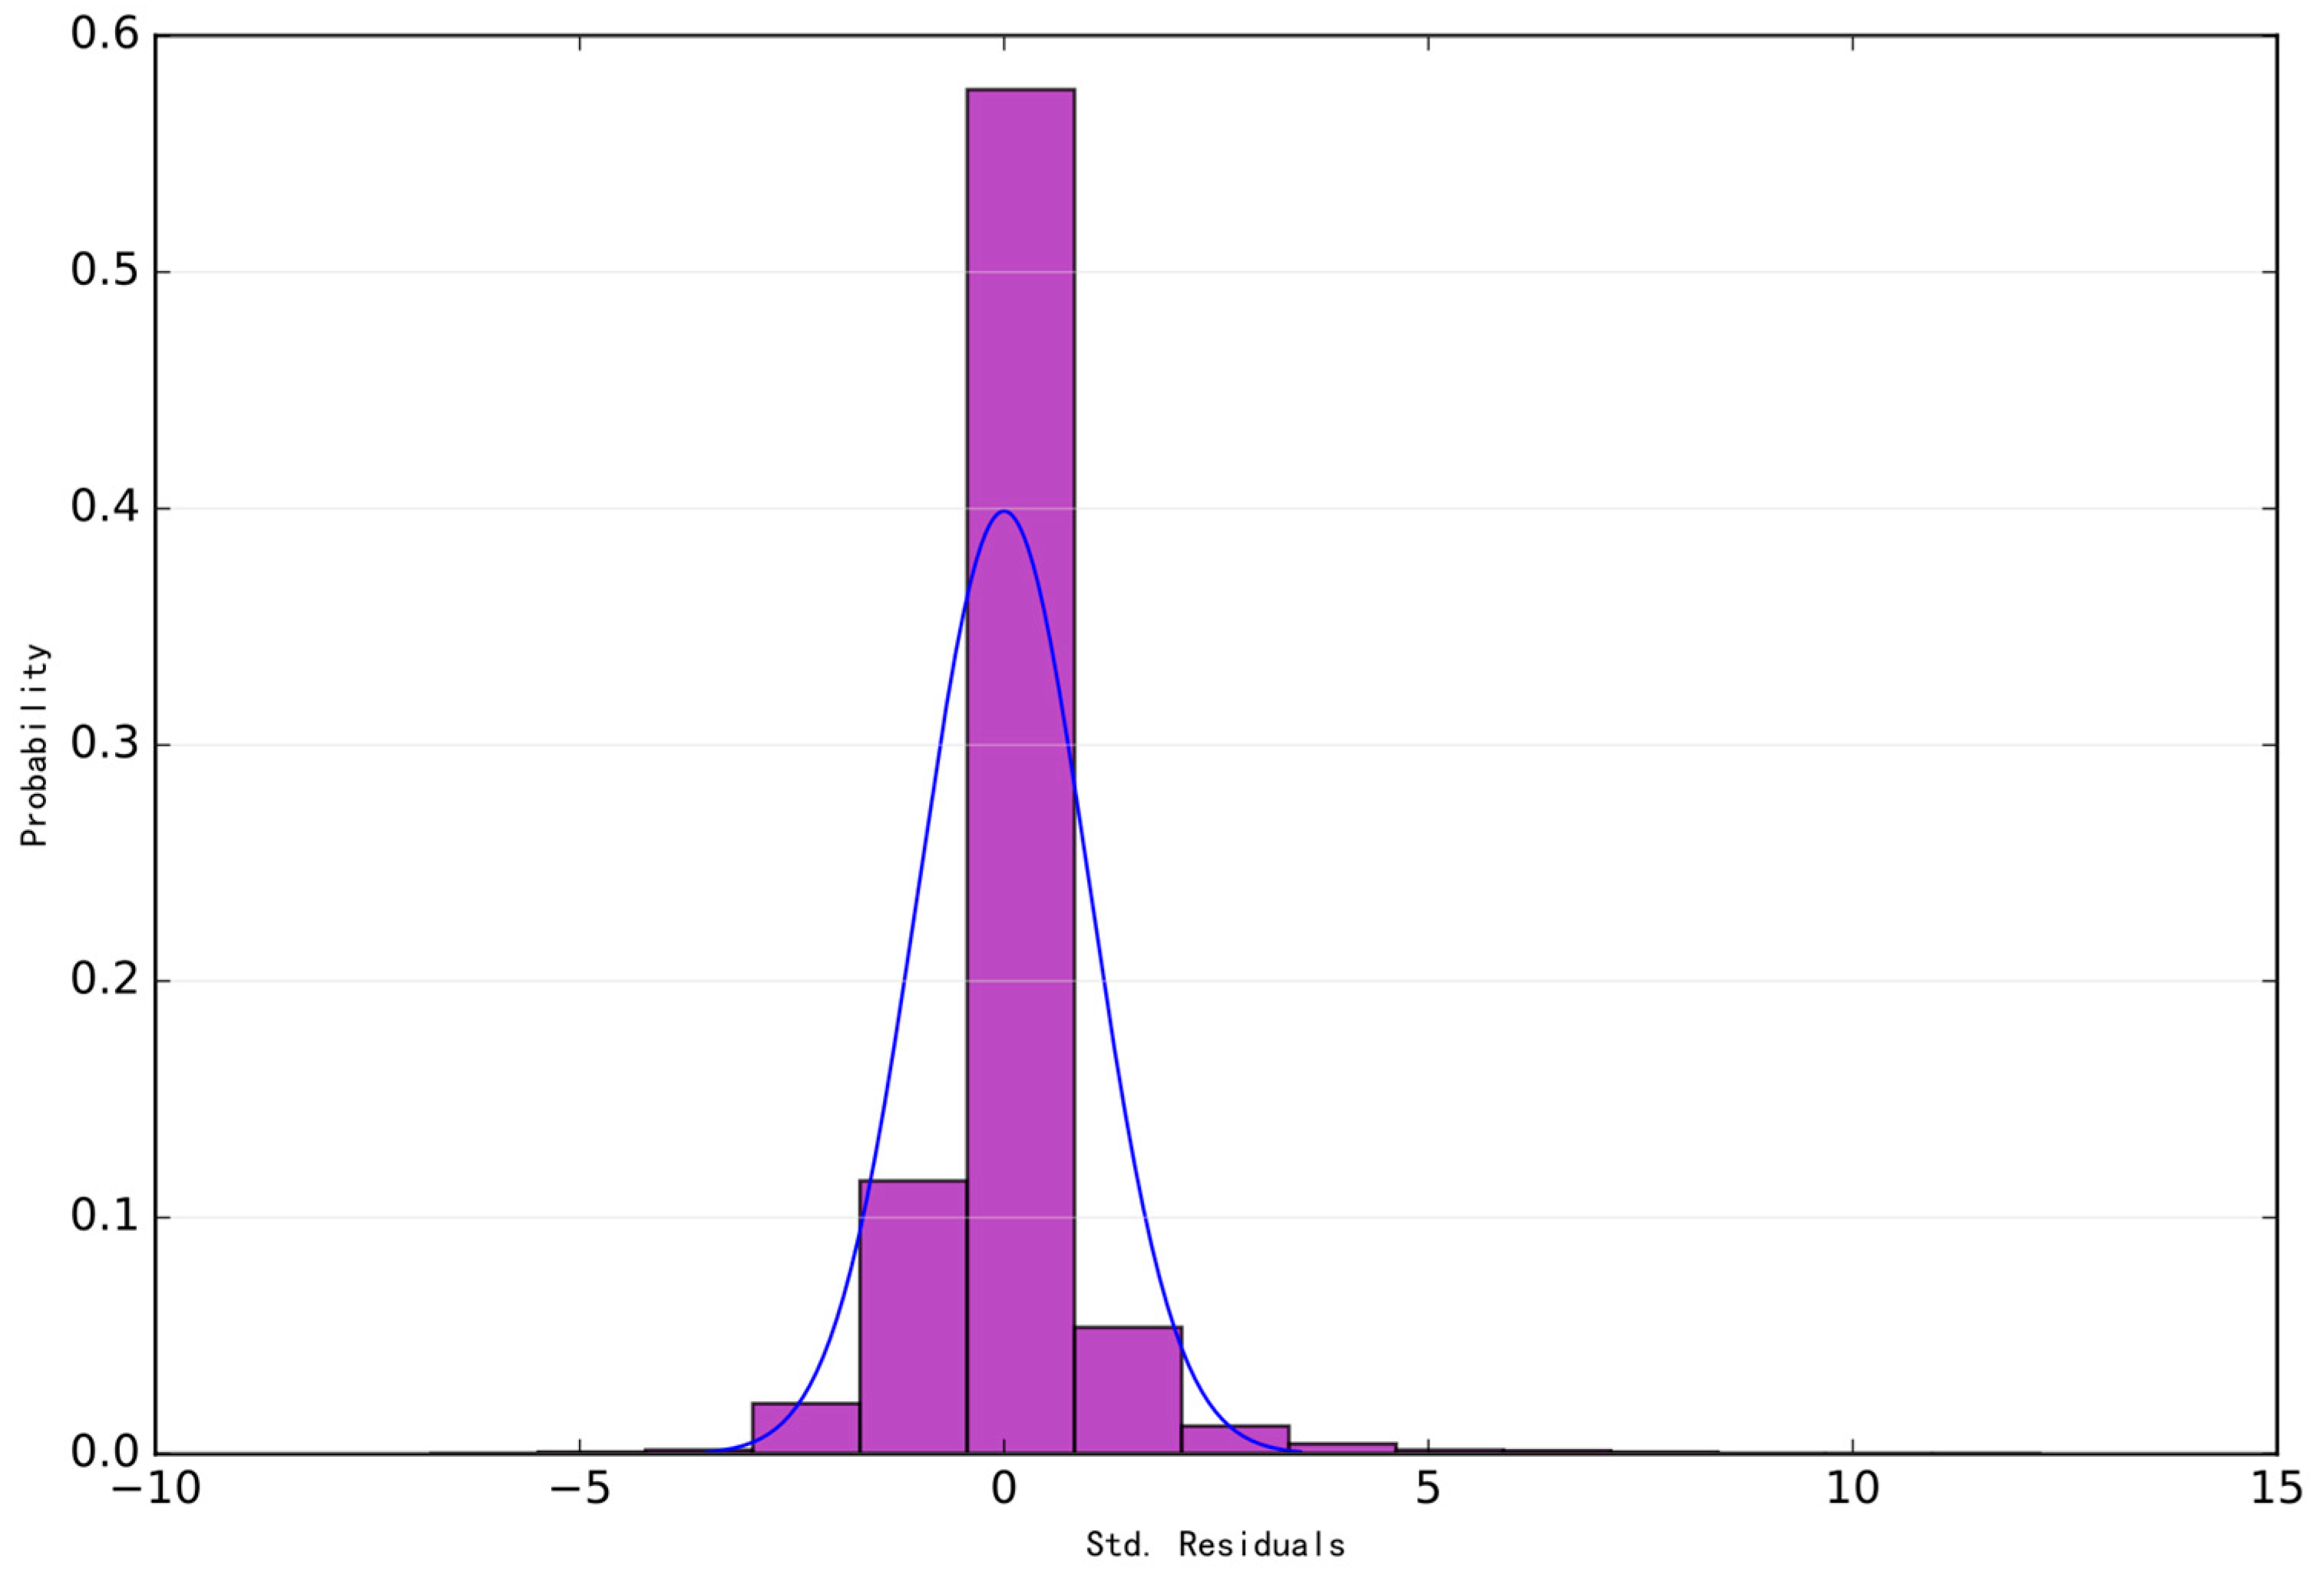
| Jarque-Bera Static | 524.155 *** | |||||||
| Summary of each explanatory variable | ||||||||
| Evaluation dimension | Indicator | Min | Max | Mean | Standard deviations | Coefficient | Probability | VIF |
| Independent variable | 1 | 15,450 | 2160.540 | 2422.495 | \ | \ | \ | |
| Internal | Density of leisure resources | 0 | 3.523 | 0.228 | 0.387 | −588.290 | 0.013 ** | 1.355 |
| Diversity of leisure resources | 0 | 3.525 | 1.821 | 1.243 | −347.177 | 0.001 *** | 3.293 | |
| Richness of leisure resources | 0 | 83 | 21.355 | 21.169 | 93.962 | 0.000 *** | 5.263 | |
| Consumption level | 9.378 | 525.687 | 69.016 | 53.701 | 1.921 | 0.427 | 2.703 | |
| Consumption balance | 0 | 438.817 | 25.214 | 39.887 | −2.372 | 0.469 | 2.730 | |
| Greenness | 0.004 | 0.734 | 0.263 | 0.117 | 73.629 | 0.946 | 2.668 | |
| Openness | 0.001 | 0.513 | 0.112 | 0.072 | 346.093 | 0.833 | 2.247 | |
| Walkability | 0 | 0.124 | 0.018 | 0.015 | −3611.870 | 0.515 | 1.161 | |
| Enclosure | 0.006 | 0.637 | 0.190 | 0.117 | 218.155 | 0.170 | 3.613 | |
| External | Traffic accessibility | 3 | 795 | 161.557 | 102.775 | 2.285 | 0.012 ** | 1.405 |
| Surrounding population density | 0 | 55,760 | 2774.141 | 6503.236 | 0.029 | 0.051 * | 1.511 | |
| Homogeneous Competition Index | 0 | 30.723 | 0.102 | 1.446 | −18.789 | 0.742 | 1.095 | |
| Indicator | Summary of Sports Activity Regression Analysis | Summary of Sightseeing Activity Regression Analysis | Summary of Cultural Activity Regression Analysis | Summary of Recreation Activity Regression Analysis | ||||||||
|---|---|---|---|---|---|---|---|---|---|---|---|---|
| Coefficient | Probability | VIF | Coefficient | Probability | VIF | Coefficient | Probability | VIF | Coefficient | Probability | VIF | |
| Density | −9489.563 | 0.234 | 2.231 | −672.657 | 0.147 | 1.194 | −6674.508 | 0.063 | 2.665 | −496.207 | 0.096 | 1.317 |
| Diversity | 796.860 | 0.023 * | 3.580 | −703.496 | 0.000 *** | 3.450 | 576.951 | 0.098 | 7.891 | −549.905 | 0.010 ** | 4.529 |
| Richness | 176.350 | 0.000 *** | 6.249 | 43.073 | 0.562 | 8.492 | 105.178 | 0.000 *** | 4.906 | |||
| CL | −0.585 | 0.798 | 1.220 | −5.056 | 0.040 * | 1.934 | 4.657 | 0.238 | 3.860 | |||
| CB | −7.497 | 0.245 | 1.365 | 12.572 | 0.069 | 2.542 | −4.686 | 0.329 | 3.804 | |||
| Greenness | 9822.498 | 0.038 * | 8.674 | 170.535 | 0.860 | 2.084 | −1790.725 | 0.059 | 1.758 | −174.452 | 0.927 | 2.905 |
| Openness | 7287.396 | 0.211 | 3.482 | 1112.127 | 0.438 | 1.869 | −4659.151 | 0.033 * | 1.782 | 204.247 | 0.942 | 2.767 |
| Walkability | 24,708.954 | 0.151 | 1.946 | 631.312 | 0.905 | 1.373 | 8896.126 | 0.436 | 2.270 | −9955.606 | 0.276 | 1.109 |
| Enclosure | 14,401.253 | 0.049 * | 9.328 | −505.827 | 0.679 | 2.236 | 1317.330 | 0.520 | 4.155 | |||
| TA | 2.989 | 0.221 | 3.278 | 4.604 | 0.000 *** | 1.650 | −0.875 | 0.727 | 2.237 | −0.011 | 0.993 | 1.607 |
| SPD | −0.915 | 0.285 | 1.792 | −0.105 | 0.478 | 2.508 | −0.771 | 0.183 | 1.108 | 0.050 | 0.005 ** | 1.505 |
| HCI | −45.982 | 0.196 | 1.271 | −4652.870 | 0.106 | 1.554 | 4646.075 | 0.014 * | 1.043 | |||
Disclaimer/Publisher’s Note: The statements, opinions and data contained in all publications are solely those of the individual author(s) and contributor(s) and not of MDPI and/or the editor(s). MDPI and/or the editor(s) disclaim responsibility for any injury to people or property resulting from any ideas, methods, instructions or products referred to in the content. |
© 2023 by the authors. Licensee MDPI, Basel, Switzerland. This article is an open access article distributed under the terms and conditions of the Creative Commons Attribution (CC BY) license (https://creativecommons.org/licenses/by/4.0/).
Share and Cite
Liu, S.; Chen, X.; Zhang, F.; Liu, Y.; Ge, J. What Drives the Spatial Heterogeneity of Urban Leisure Activity Participation? A Multisource Big Data-Based Metrics in Nanjing, China. ISPRS Int. J. Geo-Inf. 2023, 12, 499. https://doi.org/10.3390/ijgi12120499
Liu S, Chen X, Zhang F, Liu Y, Ge J. What Drives the Spatial Heterogeneity of Urban Leisure Activity Participation? A Multisource Big Data-Based Metrics in Nanjing, China. ISPRS International Journal of Geo-Information. 2023; 12(12):499. https://doi.org/10.3390/ijgi12120499
Chicago/Turabian StyleLiu, Shaojun, Xiawei Chen, Fengji Zhang, Yiyan Liu, and Junlian Ge. 2023. "What Drives the Spatial Heterogeneity of Urban Leisure Activity Participation? A Multisource Big Data-Based Metrics in Nanjing, China" ISPRS International Journal of Geo-Information 12, no. 12: 499. https://doi.org/10.3390/ijgi12120499
APA StyleLiu, S., Chen, X., Zhang, F., Liu, Y., & Ge, J. (2023). What Drives the Spatial Heterogeneity of Urban Leisure Activity Participation? A Multisource Big Data-Based Metrics in Nanjing, China. ISPRS International Journal of Geo-Information, 12(12), 499. https://doi.org/10.3390/ijgi12120499