Article

Landscape Sensitivity Assessment of Historic Districts Using a GIS-Based Method: A Case Study of Beishan Street in Hangzhou, China

1
College of Civil Engineering and Architecture, Zhejiang University, Hangzhou 310058, China
2
The Architectural Design and Research Institute of Zhejiang University Co., Ltd., Hangzhou 310058, China
3
Center for Balance Architecture, Zhejiang University, Hangzhou 310058, China
*
Author to whom correspondence should be addressed.
ISPRS Int. J. Geo-Inf. 2023, 12(11), 462; https://doi.org/10.3390/ijgi12110462
Submission received: 16 August 2023 / Revised: 31 October 2023 / Accepted: 9 November 2023 / Published: 12 November 2023

Abstract

:
Historic districts may be damaged during urban renewal. Landscape sensitivity can be used as a method to judge the ability of a landscape to resist change. This study proposes an improved method for assessing landscape sensitivity based on a geographic information system (GIS) according to the characteristics of historic districts. Based on a previous method, this study adds POI big data for comprehensive evaluation and uses objective criteria importance through intercriteria correlation (CRITIC) statistics instead of subjective methods to determine the weights. The assessment framework uses ecological, visual, and cultural sensitivity as primary criteria, which are further defined by several sub-criteria. The Beishan Street Historic District in Hangzhou, China, is used as a case study, and the results of the assessment are shown in the form of sensitivity maps. The results show that the maps can identify buildings in areas of high sensitivity and provide objective indicators for future conservation. Based on the sensitivity maps, this study innovatively used correlation analysis to reveal important interrelationships between ecological, visual, and cultural sensitivity. Assessment factors such as land use type need to be prioritized because they are more closely linked to other factors.

1. Introduction

Cities are expanding, urban growth demands large amounts of space, and most communities emphasize economic development over the preservation of historic structures [1]; therefore, there is a progressive shrinkage of available space for historic buildings. Sustainable conservation of historic districts can preserve historical–cultural heritage to a large extent without affecting urban and economic development [1].
Sustainable development requires historic districts to adapt to changes in the landscape since urban landscapes are continually changing due to urban growth. The architectural heritage in historic districts faces risks from both the natural environment and human activities [2]. Landscape sensitivity can be used as a metric to judge the ability of a landscape to resist change and can help us reduce the risk of destroying the landscape character of an area [3]. The definition of “landscape” according to the European Landscape Convention (ELC) is “an area, as perceived by people, whose character is the result of the action and interaction of natural and/or human factors” [4]. Landscape sensitivity refers to the sensitivity, stability, and resistivity of a landscape to human disturbance [5]. “The sensitivity of a landscape to change is expressed as the likelihood that a given change in the controls of a system will produce a sensible, recognizable, and persistent response. The issue involves two aspects: the propensity for change and the capacity of the system to absorb the change” [6]. This description from 1979 is now recognized as the basic definition of “landscape sensitivity”. A landscape sensitivity assessment is not a definitive approach, and different methods can be used depending on the needs. Nowadays, expert evaluation and geographic information system (GIS) analysis are used to determine landscape sensitivity [7], and the high-sensitivity zones identified by each technique are essentially the same [8]. Landscape sensitivity has been applied to landscape management in some countries. For example, Historic Landscape Characterisation (HLC), an approach to landscape management in the UK, uses the results of landscape sensitivity assessments as a basis. In the HLC approach, one indicator of landscape-type sensitivity is the value of the capacity to absorb change multiplied by the value of historical significance [9]. The HLC technique can be used to compare how a projected development might impact the current landscape while urban development and regeneration are underway [10].
Landscape sensitivity analysis can also be used in studies of cultural heritage. For example, Mamat et al. [11] analyzed the ecological sensitivity of cultural heritage sites in Turpan, China. In this study, we improved the landscape sensitivity method and applied it to the assessment of historic districts. According to Landscape Character Assessment (LCA), “Landscape occurs at all scales and the process of landscape assessment can be undertaken at any scale [12]. Most of the time, landscape sensitivity analysis is done at the urban scale, or even at the national scale. Fang et al. [13] conducted a visual sensitivity analysis at the district scale. In this study, the most evident alteration in the application of landscape sensitivity analysis to the historic district was the use of polygonal plot boundaries. Functional regions are separated from one another by general roadways at the urban scale [14]. By determining the archaeological, historical, and other environmental characteristics associated with each land plot, the HLC technique determines the borders of individual land parcels [15]. However, these boundaries are not evident in historic districts, so in this study, we improved the method of plot segmentation by abstracting buildings as central points and using Thiessen polygons.
Most of the previous quantitative studies on landscape sensitivity in historic districts have been about one aspect, such as ecological [16] or visual [13] sensitivity. This study proposes a more comprehensive landscape sensitivity assessment framework. The main criteria of the assessment framework were determined with reference to classical theories. According to LCA, the landscape is made up of three basic elements: the natural, the cultural/social, and the perceptual and aesthetic [12]. Warnock and Griffiths [17] created the Living Landscapes Project (LLP) based on LCA by classifying the landscape into natural, cultural, and visual dimensions. Bogovac et al. [8] modeled landscape vulnerability by categorizing the landscape into natural, cultural–historical, and visual experiences. Manolaki et al. [18] categorized the landscape as ecological, cultural, and visual to assess the landscape sensitivity of Cyprus. Zheng et al. [19] used visual and ecological sensitivity maps to provide a basis for decision-making in forest park planning and management. Overall, those studies divided the first-level criteria for analysis into three categories: ecological, visual, and cultural sensitivity.
After identifying the main assessment factors, we identified the analytical basis for each of the main criteria through the urban element. The landscape is a superimposition of multiple urban elements. Sik et al. [20] divided the components of the landscape into material and non-material. Material refers to the environment, artificial, and complex elements, and non-material refers to artificial and behavioral elements. In this study, we extracted five basic elements of an urban landscape: topography, landscape, street, building, and culture. These elements of the urban landscape were superimposed and then used as a basis for ecological, visual, and cultural sensitivity analysis (Figure 1). This landscape is narrowly defined and refers to the land cover, such as vegetation. Based on GIS, each sensitivity assessment factor was analyzed using a 3D model [21]. In this way, sensitivity maps of multiple assessment factors could be drawn.
The Beishan Street Historic District, part of the West Lake scenic spot in Hangzhou, China, is known as a “museum without walls”. Since 1961, some buildings in Beishan Street have been identified as heritage buildings. The policy of the Heritage Conservation Department is that these buildings should not be altered in any way, but the conservation should be dynamic. The quantitative assessment results of landscape sensitivity analysis can be used as a basis for dynamic conservation and to help avoid the risk of damaging historic structures [22]. One benefit of sensitivity maps is that they can be used to screen out historic structures located in high-sensitivity landscape regions. These structures will need to be handled with greater care in the future. For example, buildings located in areas of very high sensitivity cannot undergo any alterations and buildings located in areas of high sensitivity can have their use changed, while buildings located in areas of medium sensitivity can undergo minor alterations. Notably, there are interactions between the landscape’s ecological, visual, and cultural components. Culture is a human adaptation to ecology [23], and ecology affects culture [24]. Cultural development can trigger ecological and visual changes in a landscape [25]. The impact of human activities on ecology includes climatic as well as geomorphological effects [26,27]. Different ecological environments and cultures produce different visual environments [23]. There are positive and negative interactions between landscape and human culture [27]. We should pay attention to these influences and try to avoid the negative impacts of human activities on the landscape. In this study, correlation analysis by SPSS was used to determine the strength of correlations among the assessment factors. The assessment factors that are strongly correlated with other assessment factors should be prioritized in the future.

2. Materials and Methods
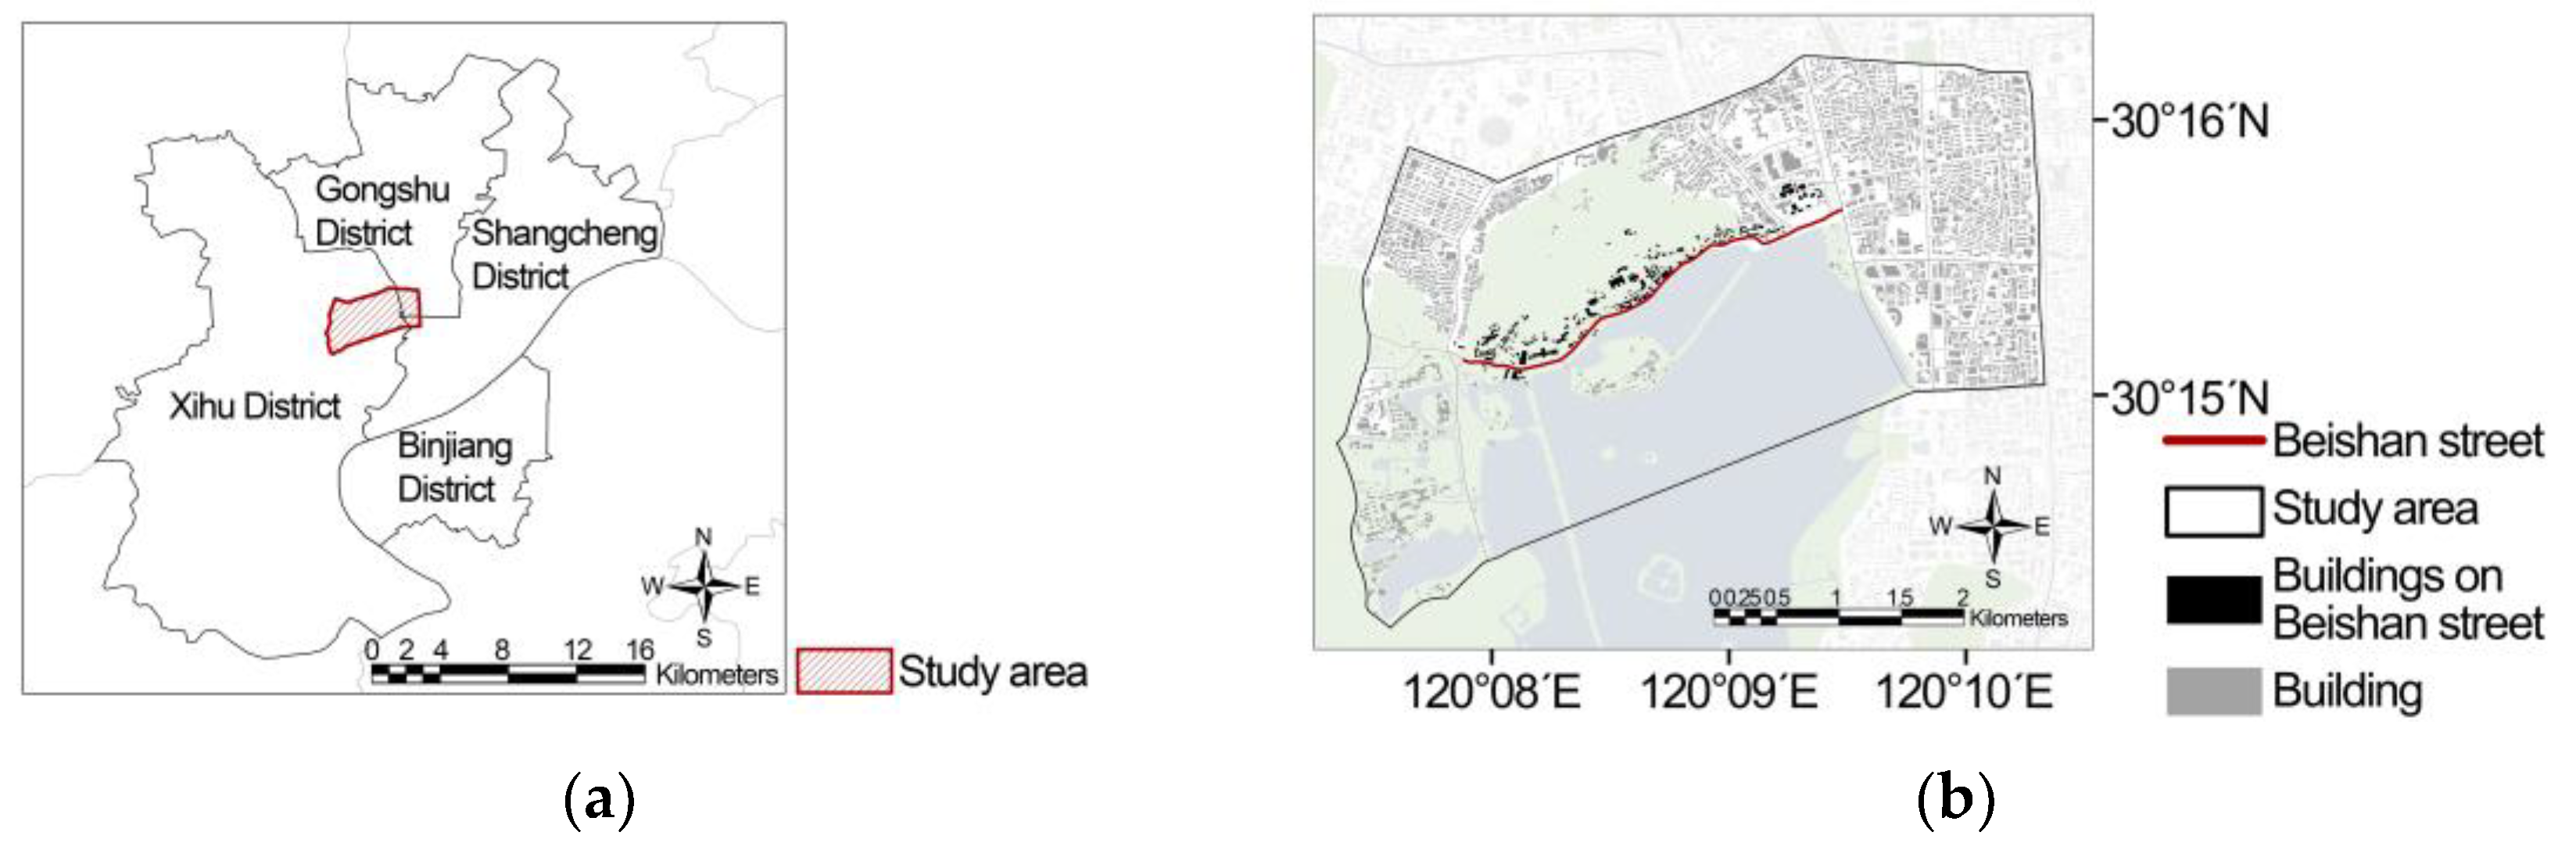
2.1. Study Area

Hangzhou is among the first batches of historical–cultural cities in China, with several historical–cultural districts. West Lake, a representative attraction in Hangzhou, became a World Heritage Site in 2011. The Beishan Street Historic District, located on the north side of West Lake, was chosen as the study area because the density of cultural tourism resources in Beishan Street, including natural and cultural resources, is significantly higher than in other areas [28]. It became a historical–cultural district of Zhejiang Province in 2016 and is the only provincial-level historical–cultural district in the West Lake scenic area [29]. Large-scale construction of Beishan Street began during the Wu-Yue period of the Five Dynasties (907–978), and many temples were built during this period. Among them, the Baojiao Pagoda, built by the king of Wu-Yue, and the Giant Buddhist Temple are preserved to this day. West Lake gained popularity as a tourist destination during the Southern Song Dynasty (1127–1279) when Hangzhou served as the capital and experienced rapid population growth. At that time, a significant number of private gardens were constructed on Beishan Street. In 1913, the parapet that separated West Lake from Hangzhou was demolished, making transportation between them convenient. Due to its excellent location, Beishan Street attracted many government officials and wealthy merchants to build villas in the area. The existing buildings on Beishan Street are mainly from 1912–1949; most of them are the former residences of famous people, and some are temples and tombs of famous people.
This study collated the conservation heritage and historical buildings listed on the websites of the State Administration of Cultural Heritage (http://gl.ncha.gov.cn; accessed on 19 December 2022), national government services (http://gjzwfw.www.gov.cn; accessed on 19 December 2022), Zhejiang Provincial Bureau of Cultural Heritage (http://wwj.zj.gov.cn; accessed on 19 December 2022), and Zhejiang government services (https://www.zjzwfw.gov.cn; accessed on 19 December 2022). In the present day, there are 1077 heritage buildings at all levels in Hangzhou, which are divided into five protection levels. Among them, there are 44 historical buildings at all protection levels in the Beishan Street Historic District. The numbers of historic buildings at each protection level in the historic district are shown in Table 1.
Beishan Street goes from Baojiao Road in the east to Shuguang Road in the west, borders West Lake in the south, and is adjacent to Jewel Hill, Geling, and Qixialing in the north, with a total length of 3381 m. The study area was determined by referring to the radius of a residential circle of 800 to 1100 m [30], encompassing the streets that can be reached within around 15 min along each road, starting from Beishan Street with the junctions on the east and west sides, and these roads were utilized as the border of the study area. The study area was finally determined to be located at the junction of Hangzhou’s Xihu District, Gongshu District, and Shangcheng District (Figure 2a). It is south of Qiushi Road, Shuguang Road, and Stadium Road, north of Longjing Branch Road, Yanggong Riverbank, and Jiefang Road, east of Yugu Road, Lingyin Road, and Longjing Road, and west of Zhonghe North Road (Figure 2b). The study area covers a total area of 15.2324 square kilometers and has 2936 structures, including 243 in the Beishan Street Historic District.

2.2. Data Sources and Data Preparation

We obtained the list of conservation heritage and historical buildings at all levels (as described in Section 2.1) from official government websites, and the map and model data from open source data.
This study used a GIS-based 3D model, including location and attribute information as well as urban terrain elevation and building height [21]. The ecological sensitivity of the study area was analyzed using a digital elevation model (DEM) obtained from the Geospatial Data Cloud (https://www.gscloud.cn (accessed on 19 December 2022)). The visual sensitivity analysis was based on the topography as well as the location and height of buildings. Unlike ecological sensitivity analysis, visual sensitivity analysis is based on the urban digital elevation model (UDEM) superimposed by urban topography and buildings [31]. Plans with building height information were obtained from the Baidu Maps open platform (https://lbsyun.baidu.com (accessed on 5 April 2022)), and the plans were converted into 3D models in ArcScene. The 3D building block was attached to the surface of the 3D DEM model (Figure 3a) to draw the UDEM superimposed by DEM and building blocks (Figure 3b) [32]. In addition, street data from OpenStreetMap (OSM) (https://www.openstreetmap.org (accessed on 19 December 2022)) were added to the model to obtain the final UDEM with streets.
This study also used land use data obtained from the European Space Agency (ESA) WorldCover (https://viewer.esa-worldcover.org/worldcover (accessed on 8 February 2023)), Landsat 8 data obtained from the Geospatial Data Cloud (https://viewer.esa-worldcover.org/worldcover (accessed on 12 January 2023)), and point of interest (POI) data obtained from Baidu Maps (https://lbsyun.baidu.com (accessed on 19 December 2022)).

2.3. Methods and Steps

2.3.1. Methods

  • Thiessen polygons
A general landscape sensitivity assessment applies to large-scale areas, such as a city. This study translates the landscape sensitivity assessment methodology into an approach that is applicable at the district scale. Methods of defining boundaries at the urban scale using streets as boundaries or landscape characteristics are not applicable to the neighborhoods in this study. This study uses a new approach to plot the segmentation of historic districts. There are many historic buildings in the study area and targeted conservation measures should be developed for each building. Therefore, sensitivity needs to be analyzed with the building as the smallest unit. Simply using the building plan projection as the analysis plot and excluding greenery around the building, etc., will lead to bias in some of the assessment factors. For example, in the sensitivity analysis of land use type, all the land within the building plan projection is considered construction land, but the greenery around it as part of the landscape is ignored. There are no clear boundaries separating the plots between buildings in the study area. Therefore, this study relies on Thiessen polygons, proposed by climatologist A. H. Thiessen, to separate the land. The Thiessen polygon method for separating plots was originally used by discrete weather stations to calculate rainfall [33]. It was also used to analyze urban non-physical elements, such as real estate prices and cab fares in different areas of the city [34,35]. The assessment model in this study, which is proposed for historic districts, focuses on the history and culture of non-physical elements. Therefore, the buildings in the historic district can be abstracted as center points, and the plots can be separated by using Thiessen polygons (Figure 4). Thiessen polygons are divided into parcels of inconsistent size. For example, plots located on sparsely built hillsides and around the lake are much larger than those in other locations. These sparsely built locations have open views, so the buildings reach farther into the surrounding landscape.
The overall sensitivity level of a plot is calculated by calculating the weighted average of sensitivity levels inside the separated polygon plot with the area as the weight (Figure 5).
L v = r o u n d i = 1 n S i L v i i = 1 n S i     i = 1 ,   2 ,     ,   n
where Lv is the sensitivity level score of the whole plot; Lvi is the score of the ith sensitivity level (low = 1, moderate = 2, high = 3, very high = 4); Si is the area of the plot at the ith sensitivity level and round means rounded to the nearest whole number.
This calculation is illustrated using the polygon plots in the red-edged in Figure 5 as an example. The polygon plot in the red-edged figure contains three different levels of sensitivity areas: moderate sensitivity, high sensitivity, and very high sensitivity. As can be seen from the figure, this polygon contains two areas of moderate sensitivity with an area of 123 m2 and 951 m2, two areas of high sensitivity with an area of 19 m2 and 2449 m2, and one area of very high sensitivity with an area of 284 m2 (Figure 5). According to Equation (1), the sensitivity score of the polygon plot in the red-edged can be calculated as “3” (Equation (2)), which means that this polygon is a highly sensitive area.
L v = r o u n d i = 1 n S i L v i i = 1 n S i = r o u n d S 1 × L v 1 + ( S 21 + S 22 ) × L v 2 + ( S 31 + S 32 ) × L v 3 + S 4 × L v 4 S 1 + ( S 21 + S 22 ) + ( S 31 + S 32 ) + S 4 = r o u n d 0 m 2 × 1 + ( 123 m 2 + 951 m 2 ) × 2 + ( 19 m 2 + 2449 m 2 ) × 3 + 284 m 2 × 4 0 m 2 + ( 123 m 2 + 951 m 2 ) + ( 19 m 2 + 2449 m 2 ) + 284 m 2 = r o u n d 2.79 = 3
The sensitivities for all polygon plots in the study area were calculated using this weighted formula.
2.
Criteria importance through intercriteria correlation (CRITIC)
Historic district assessment focuses on history and culture, so landscape sensitivity analysis generally uses expert evaluation to determine the weights, a method based on subjective judgment. This study determines the weights of assessment factors based on the CRITIC method in statistics. This objective assessment method was used as a complement to the subjective assessment method used in the previous study. CRITIC weights were determined by the variability of indicators and conflict between indicators [36]. The variability of indicators is expressed using standard deviation, and if a higher standard deviation of the data indicates greater fluctuation, the weights will be higher. The conflict between indicators is expressed using the correlation coefficient; a larger value of the correlation coefficient between indicators means the conflict is smaller, and its weight will be lower. The weights are calculated by multiplying the intensity of comparison with the conflictedness indicator and normalized to get the final weights [37].
3.
Shannon–Wiener index (SHDI)
The SHDI is a classical method of determining the functional mixing degree of land use. The more functional types there are within a plot, the higher the degree of mixing. In this study, the functional mixing degree of urban land use was calculated using POI data based on the SHDI calculation method [38]:
S H D I i = k K i p i k L n ( p i k )     i = 1 ,   2 ,   . . .   ,   n
where i is the plot index, k is the POI category index, Ki is the total number of POI categories in the ith grid, and pik is the ratio of the number of the kth POI category to the total number of POI categories in the ith grid.
When there is only one POI category in the local grid, the value of SHDIi is 0; the value will be larger if the grid contains multiple POI categories.
4.
Kernel density analysis
Kernel density can be used to reflect the aggregation of geographic elements in the study area; the higher the value, the denser the element points. This study used kernel density to analyze the aggregation of heritage buildings and tourist attractions.
f n ( x ) = 1 n h i = 1 n k x x i h
where k(x) is the kernel density function; h is the bandwidth, also called the search radius, which is greater than 0; xxi is the distance from estimated point x to sample point xi and n is the number of points in space.

2.3.2. Steps

In this study, we created a three-step process for assessing the sensitivity of a landscape. First, we created a modeling framework for assessing landscape sensitivity. Then we created landscape sensitivity maps in ArcGIS. Finally, we provided objective indicators for the preservation of Beishan Street and other historic districts.
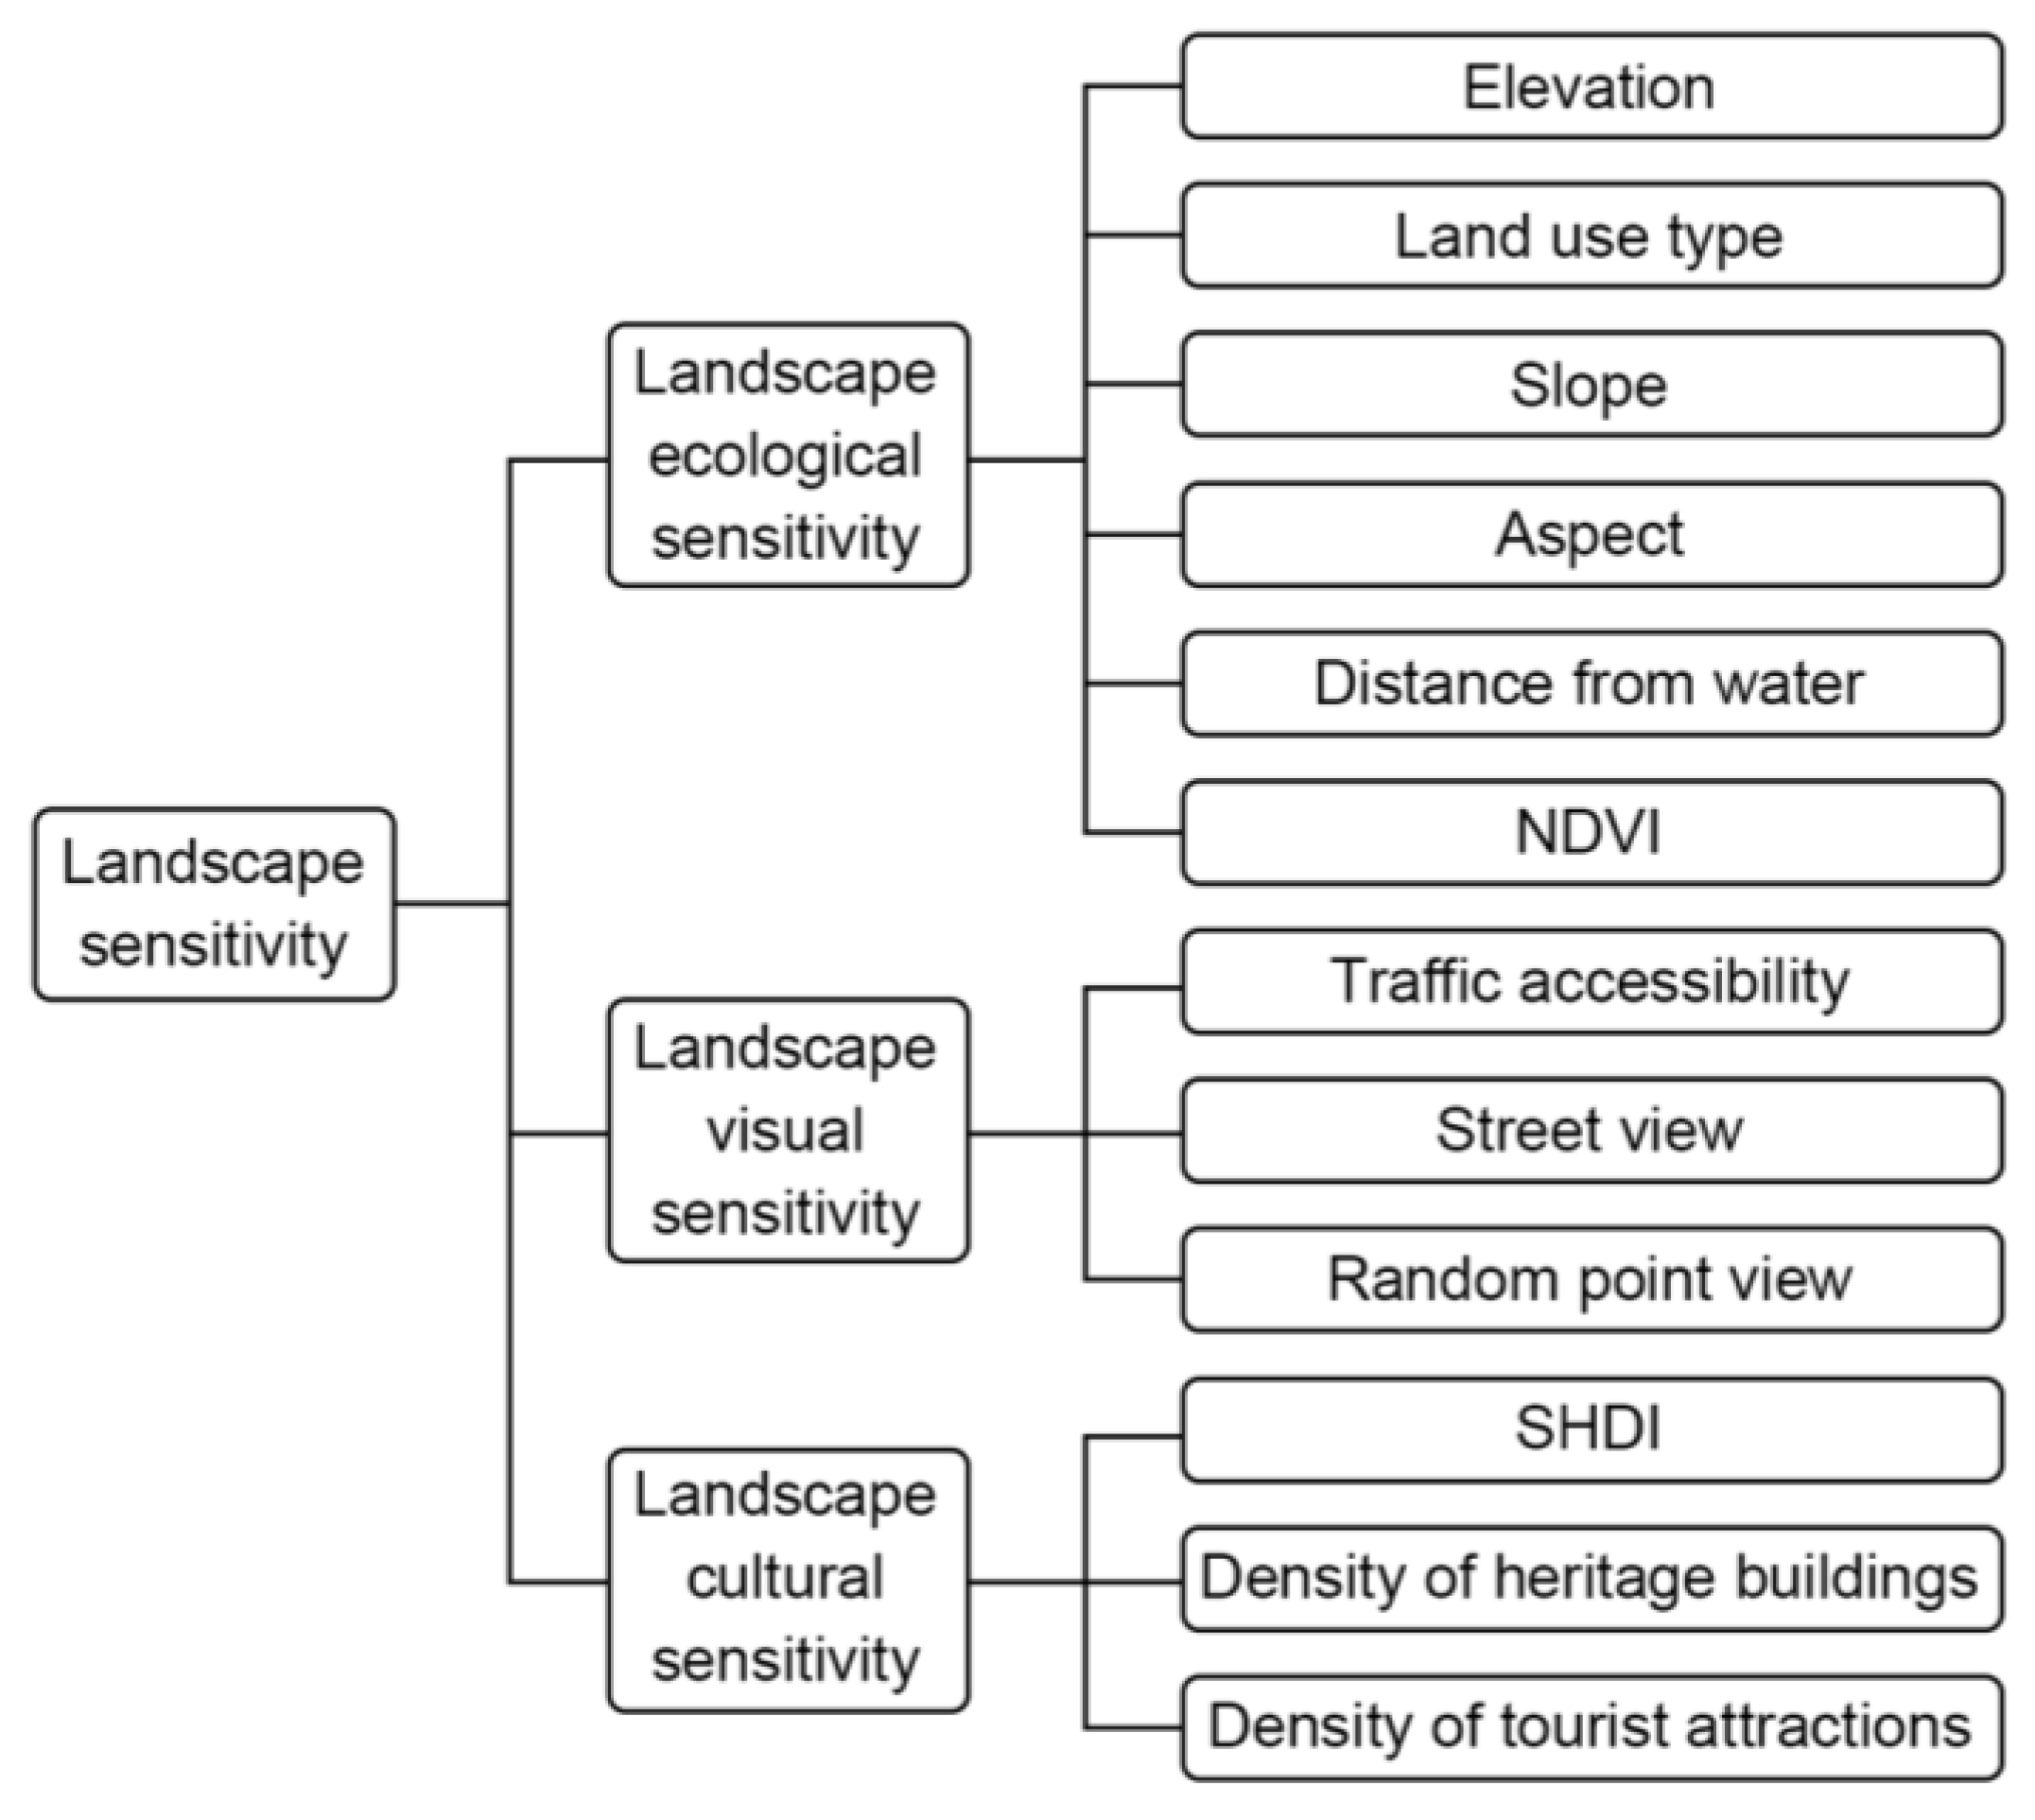
  • Create landscape sensitivity assessment model: The assessment framework for landscape sensitivity is not fixed, and different assessment factors can be identified depending on the characteristics of the study area. Beishan Street Historic District has a characteristic landscape. First, Beishan Street is bordered by mountains on the north side and water on the south side, with a complex ecological environment. Second, Beishan Street belongs to the famous West Lake scenic area and attracts many tourists, so management needs to focus on the visual perception of tourists. Finally, there are many conservation buildings with high historical value located on Beishan Street, and they are important carriers of the city’s cultural memory. In summary, the assessment factors of this study were determined based on the urban elements and landscape characteristics of the Beishan Street Historic District. The primary assessment factors were identified as ecological, visual, and cultural sensitivity, and 12 secondary assessment factors were further identified (Figure 6).
2.
Draw sensitivity maps: Sensitivity maps of the study area for each secondary assessment factor were drawn in ArcGIS. The weights were determined by the CRITIC method, which can reflect the variability of indicators and the conflict between indicators [36]. The weighted overlay was used on all sensitivity maps of single assessment factors to draw a total sensitivity map.
3.
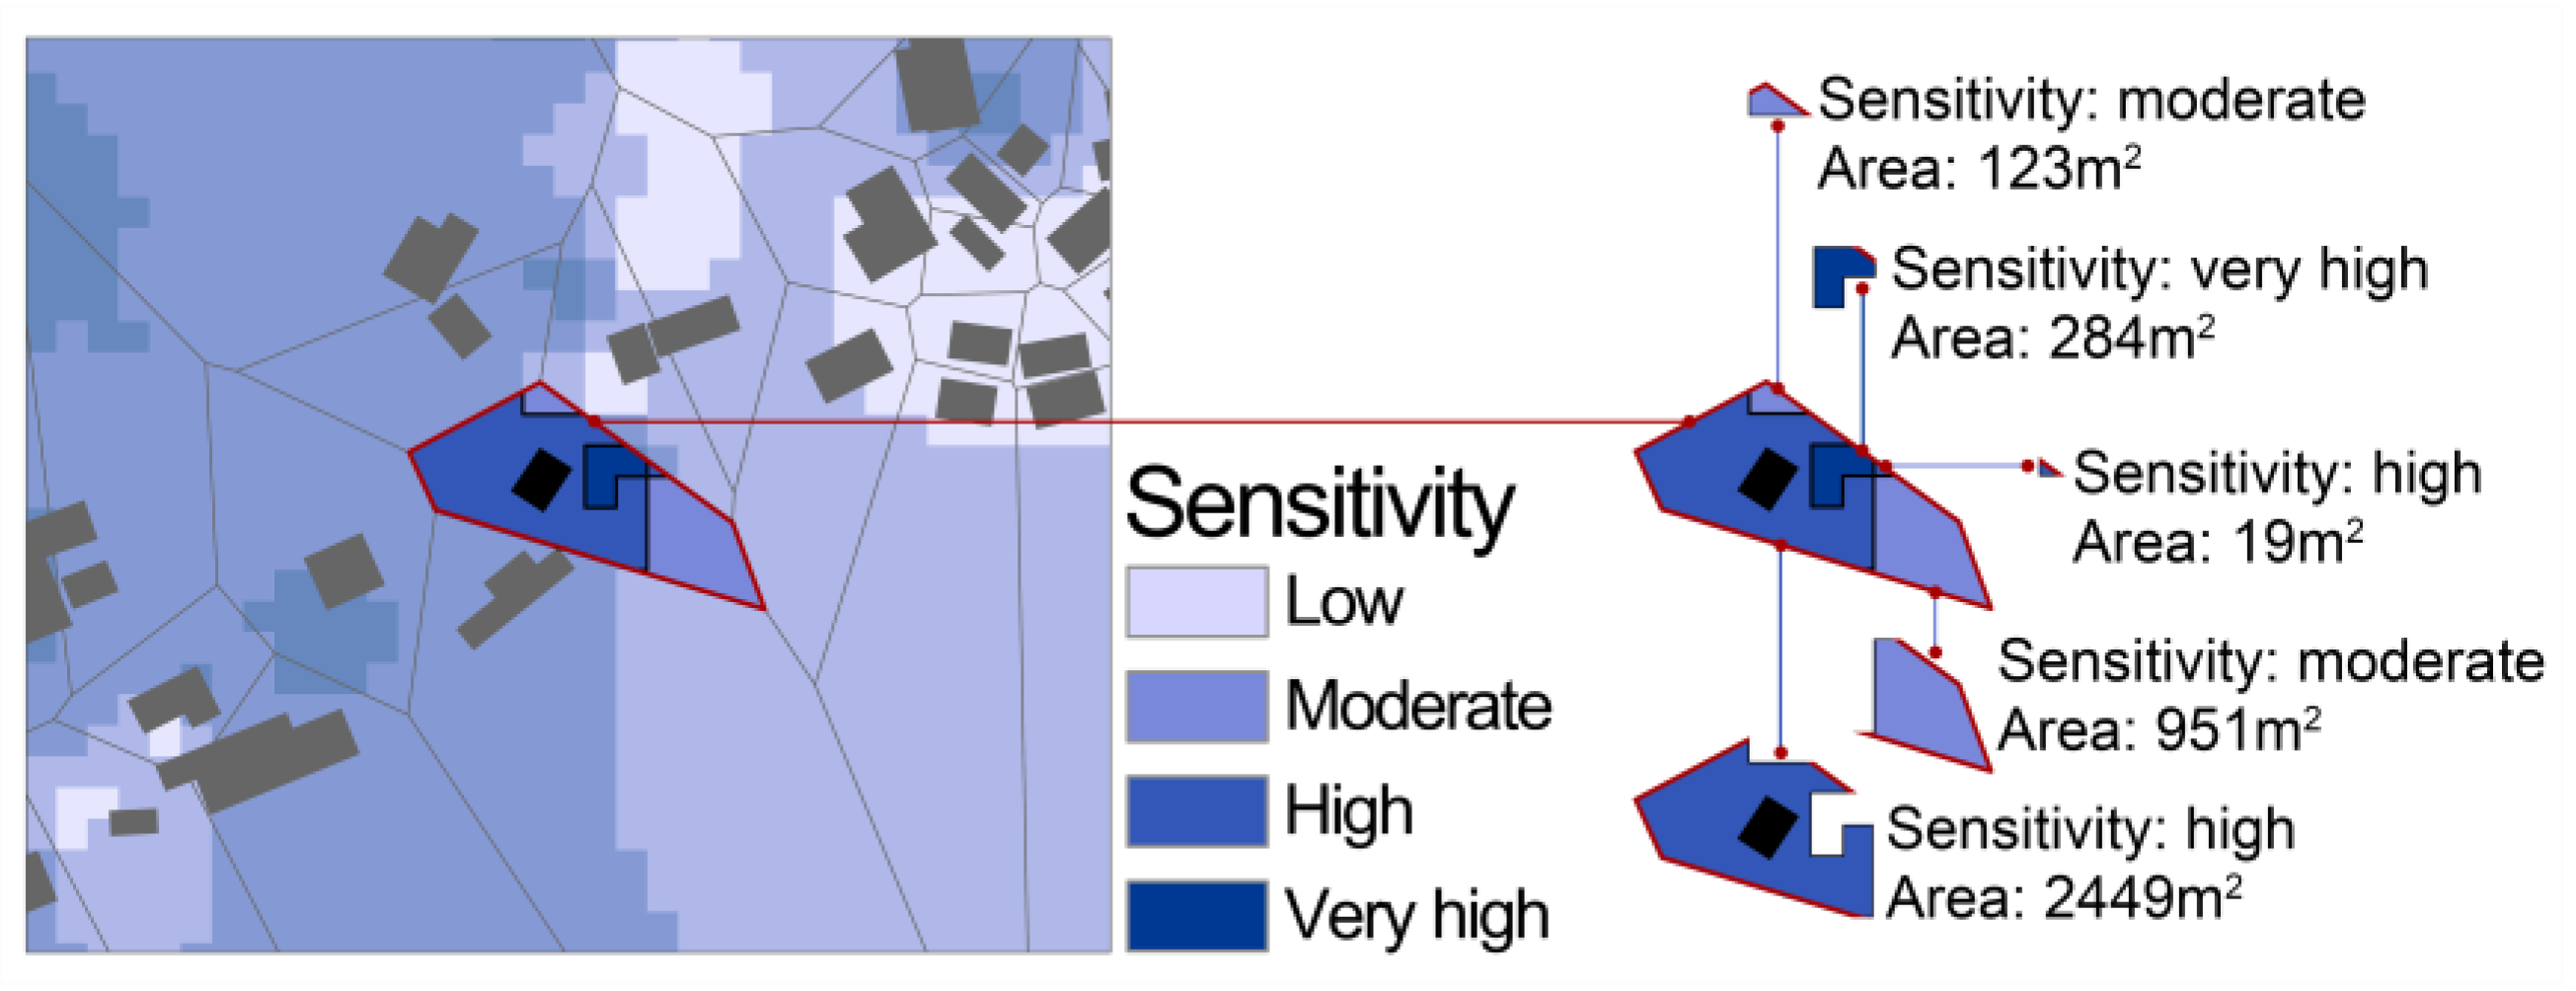
Provide a basis for preservation decisions: The sensitivity maps are used to analyze the current state of landscape sensitivity and predict landscape changes that may be caused by conservation decisions. At the same time, the correlations between assessment factors are analyzed by statistical methods in order to find the assessment factors with greater impact. The above two analyses show what needs to be focused on in future conservation decisions.

3. Results

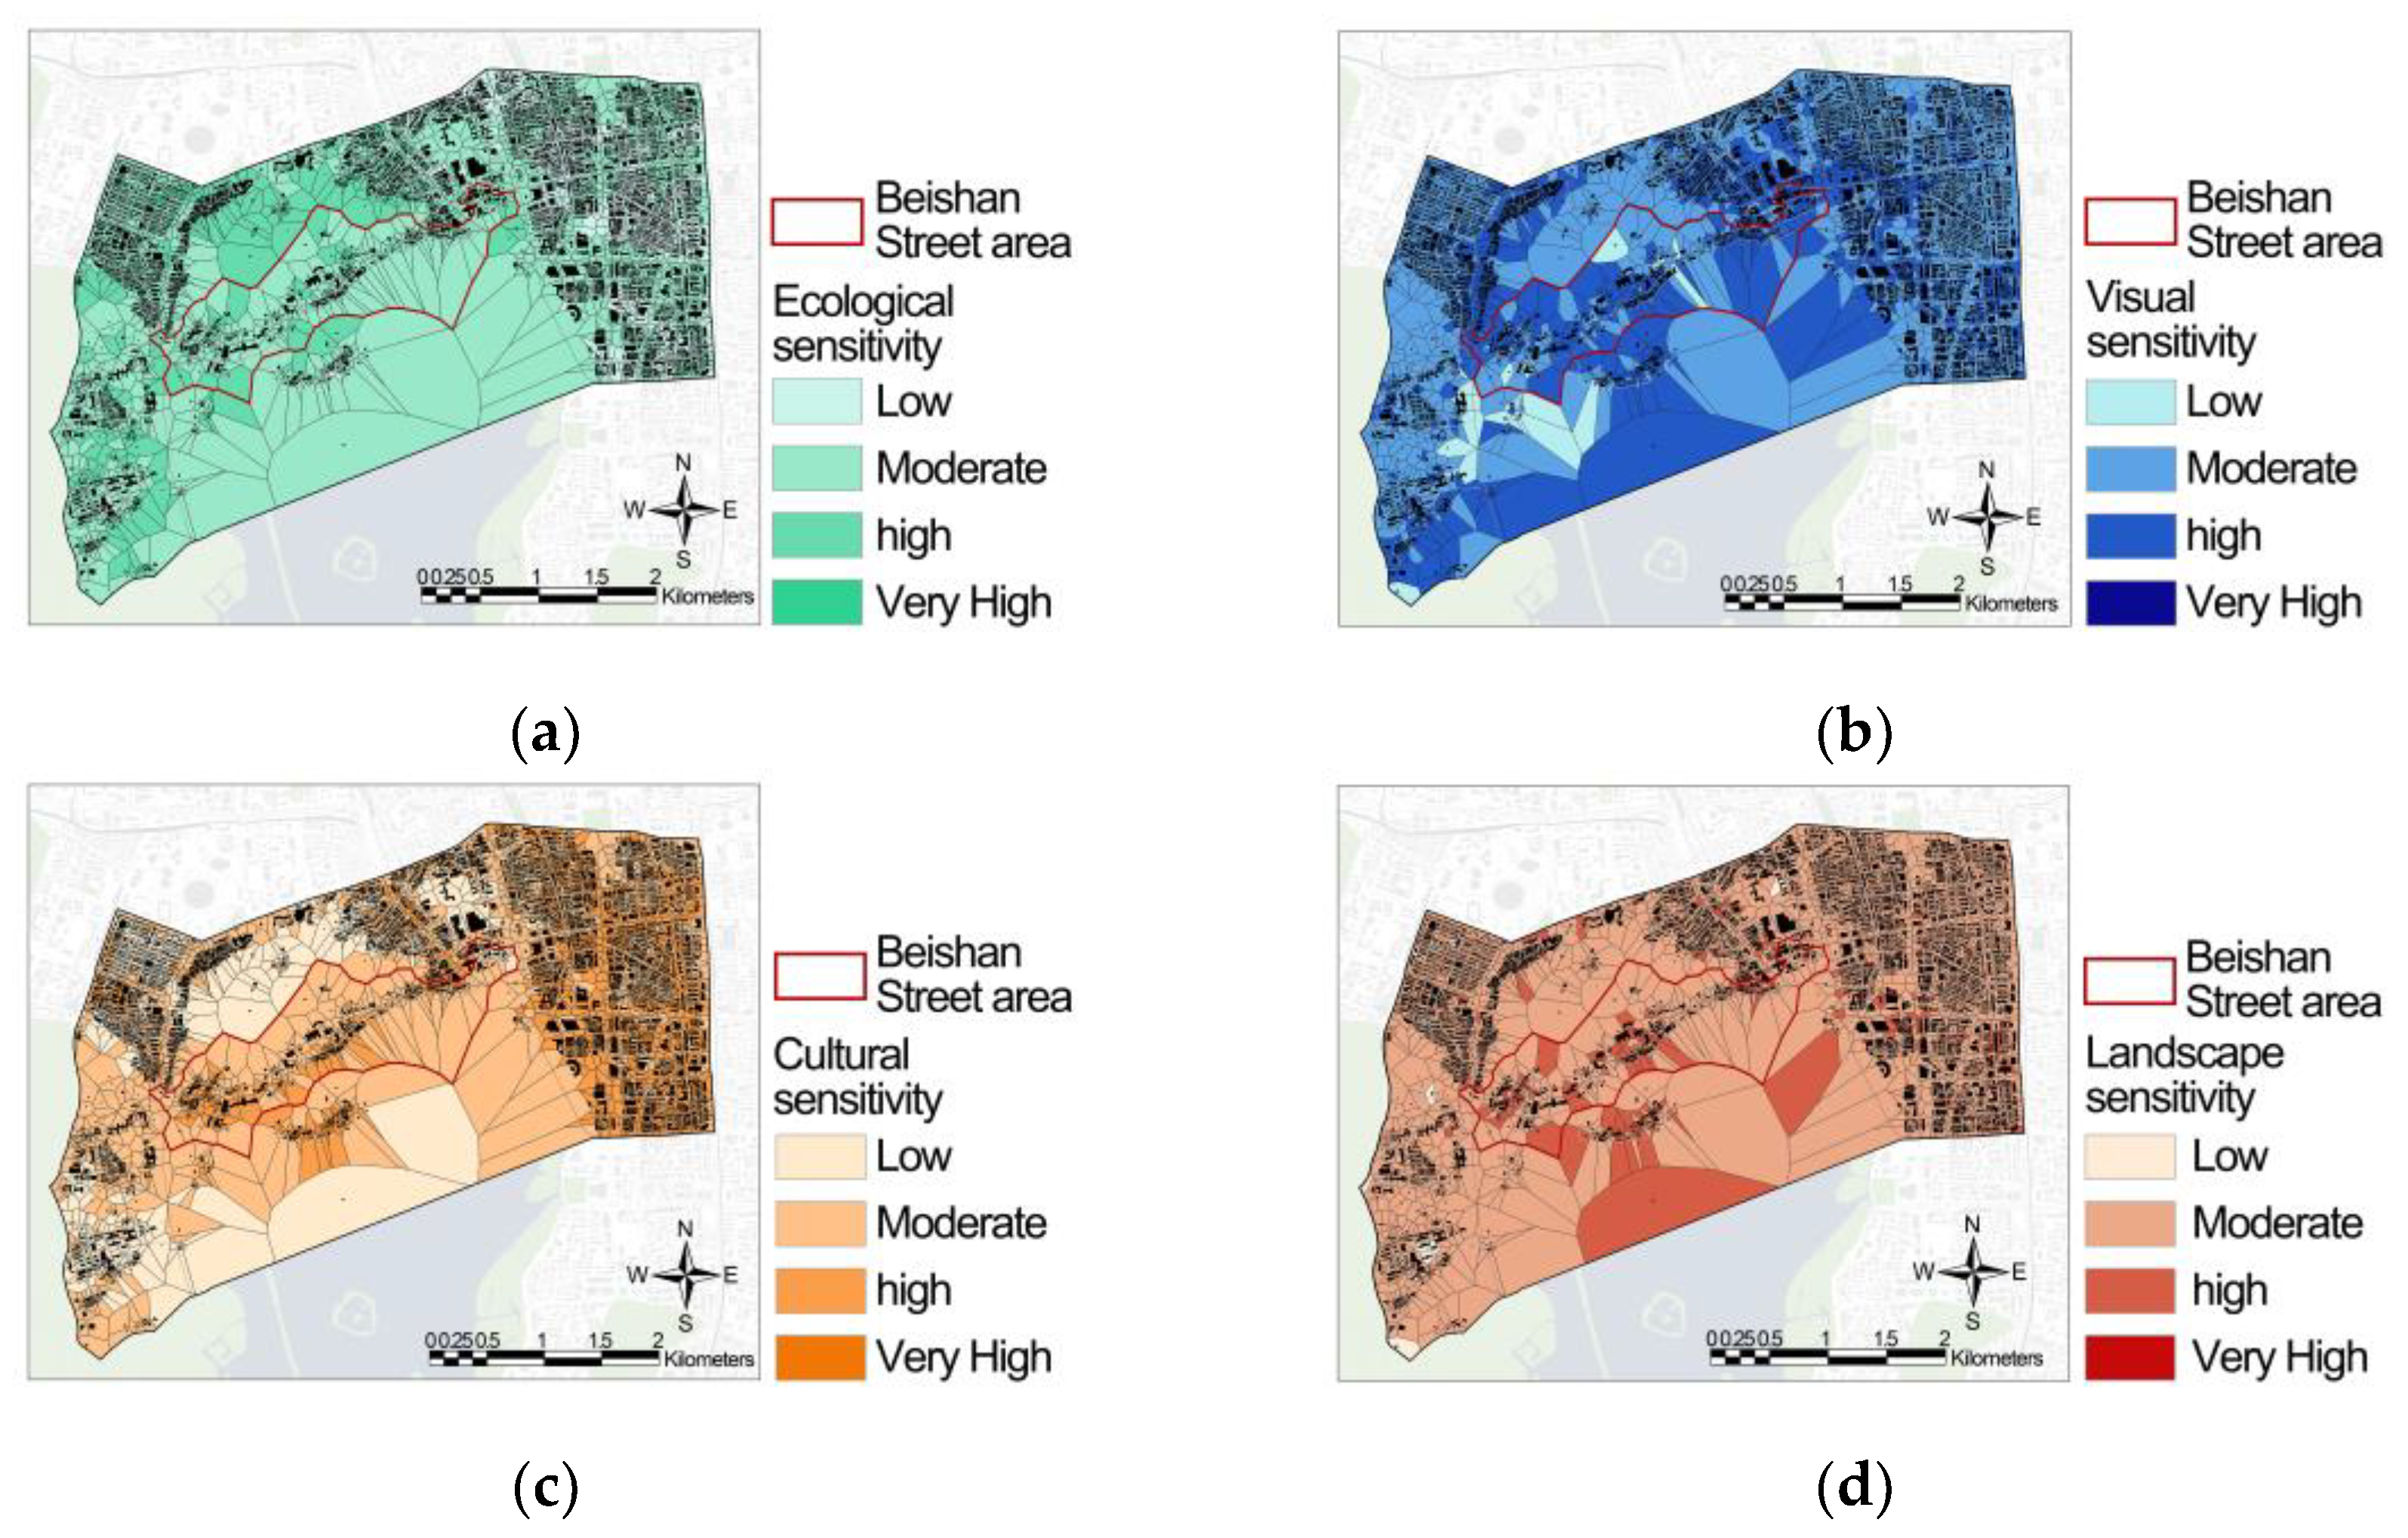
3.1. Landscape Sensitivity Analysis

According to the National Ecological Function Zoning, the landscape is divided into four levels: very highly sensitive, highly sensitive, moderately sensitive, and low sensitive areas [39]. Then, each sensitivity level is classified according to the appropriate assessment criteria.

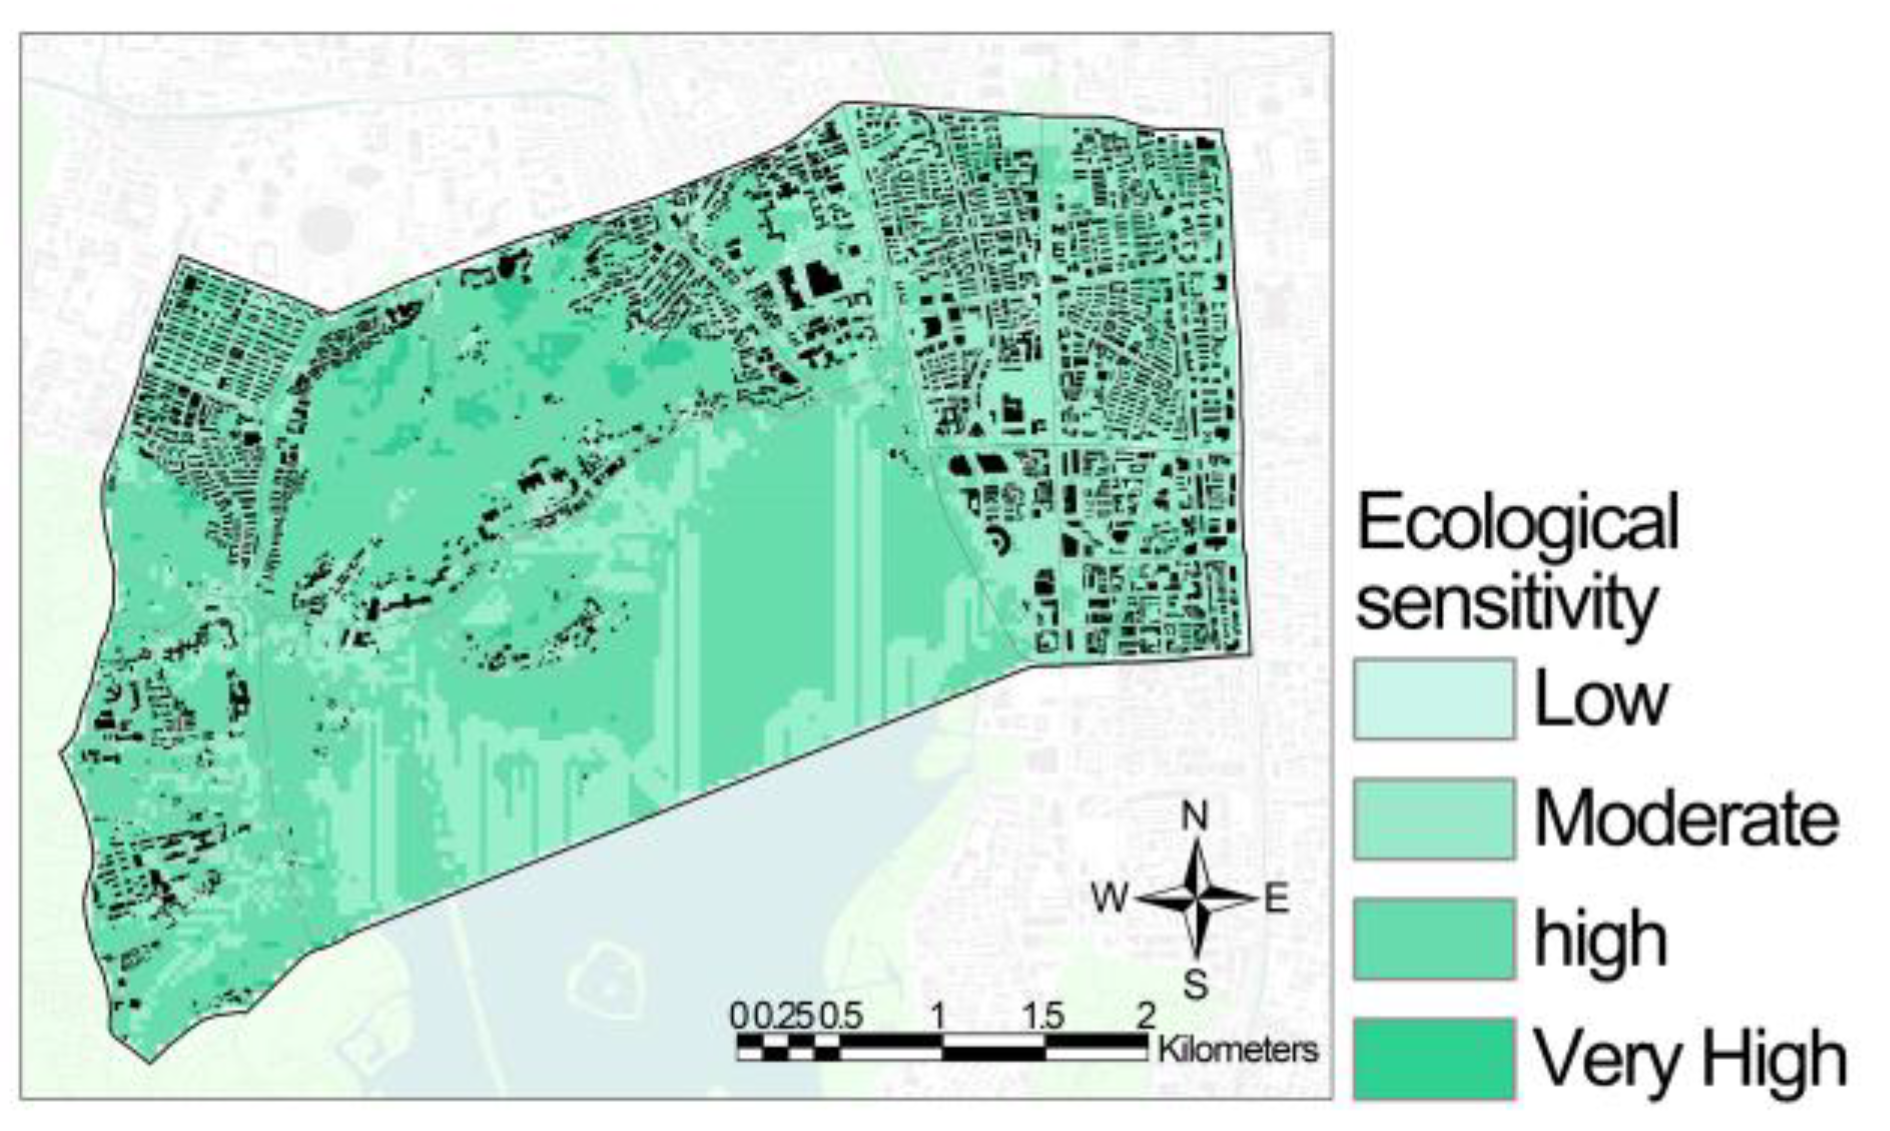
3.1.1. Landscape Ecological Sensitivity Analysis

Buildings do not exist independently from their environment, and the landscape environment surrounding them is an important part of conservation. In this study, ecological sensitivity was analyzed for topographic and landscape elements (Figure 1). Referring to the land sensitivity assessment methods in previous studies, such as those by Tsou et al. [40], Yilmaz et al. [41], and Özhanci and Yilmaz [42], ecological sensitivity analysis selects evaluation factors based on the characteristics of the study area. Previous studies of land sensitivity included both landscape elements (slope, waterfront distance, etc.) and ecological changes (erosion, landslides, desertification, etc.). In this study, the study area is small and located in the city, so landscape elements were chosen to evaluate ecological sensitivity instead of ecological changes. First, land use type was chosen as the assessment factor because the study area includes a variety of land types such as building land, forest land, grassland, and water. Second, elevation, slope, and slope direction were selected because the northern side of the study area is a gently sloping mountainous area. Third, normalized difference vegetation index (NDVI) was selected because the northern side of the study area is mountainous with large areas of vegetation cover. Lastly, distance from water was selected because there are large areas of water on the south side of the study area. In summary, the ecological sensitivity of the landscape in this study was assessed by six factors: elevation, land use type, slope, aspect, distance from water, and NDVI. The higher the ecological sensitivity of the building’s surroundings, the more vulnerable the ecological environment around the building is to damage from human activities.
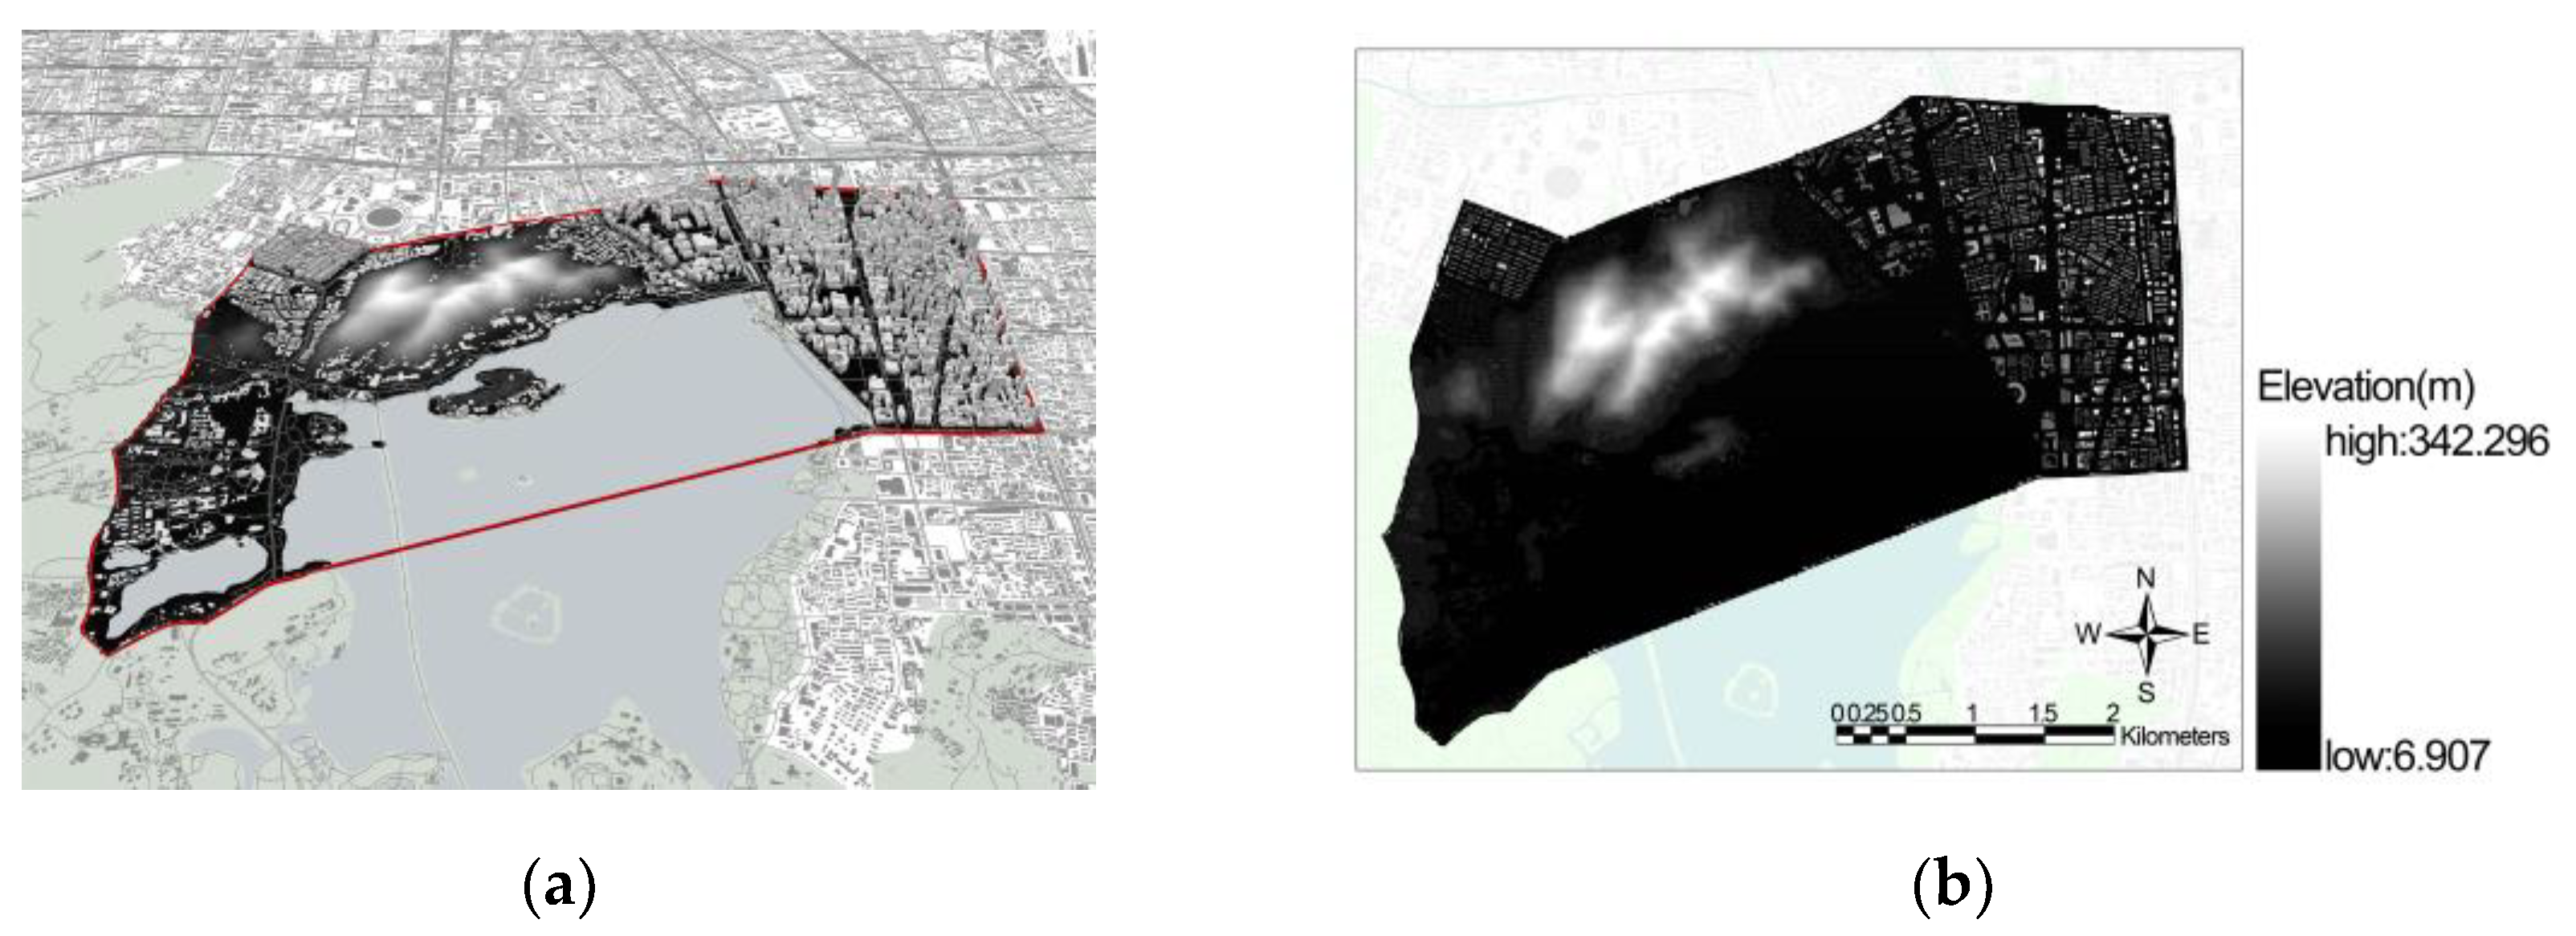
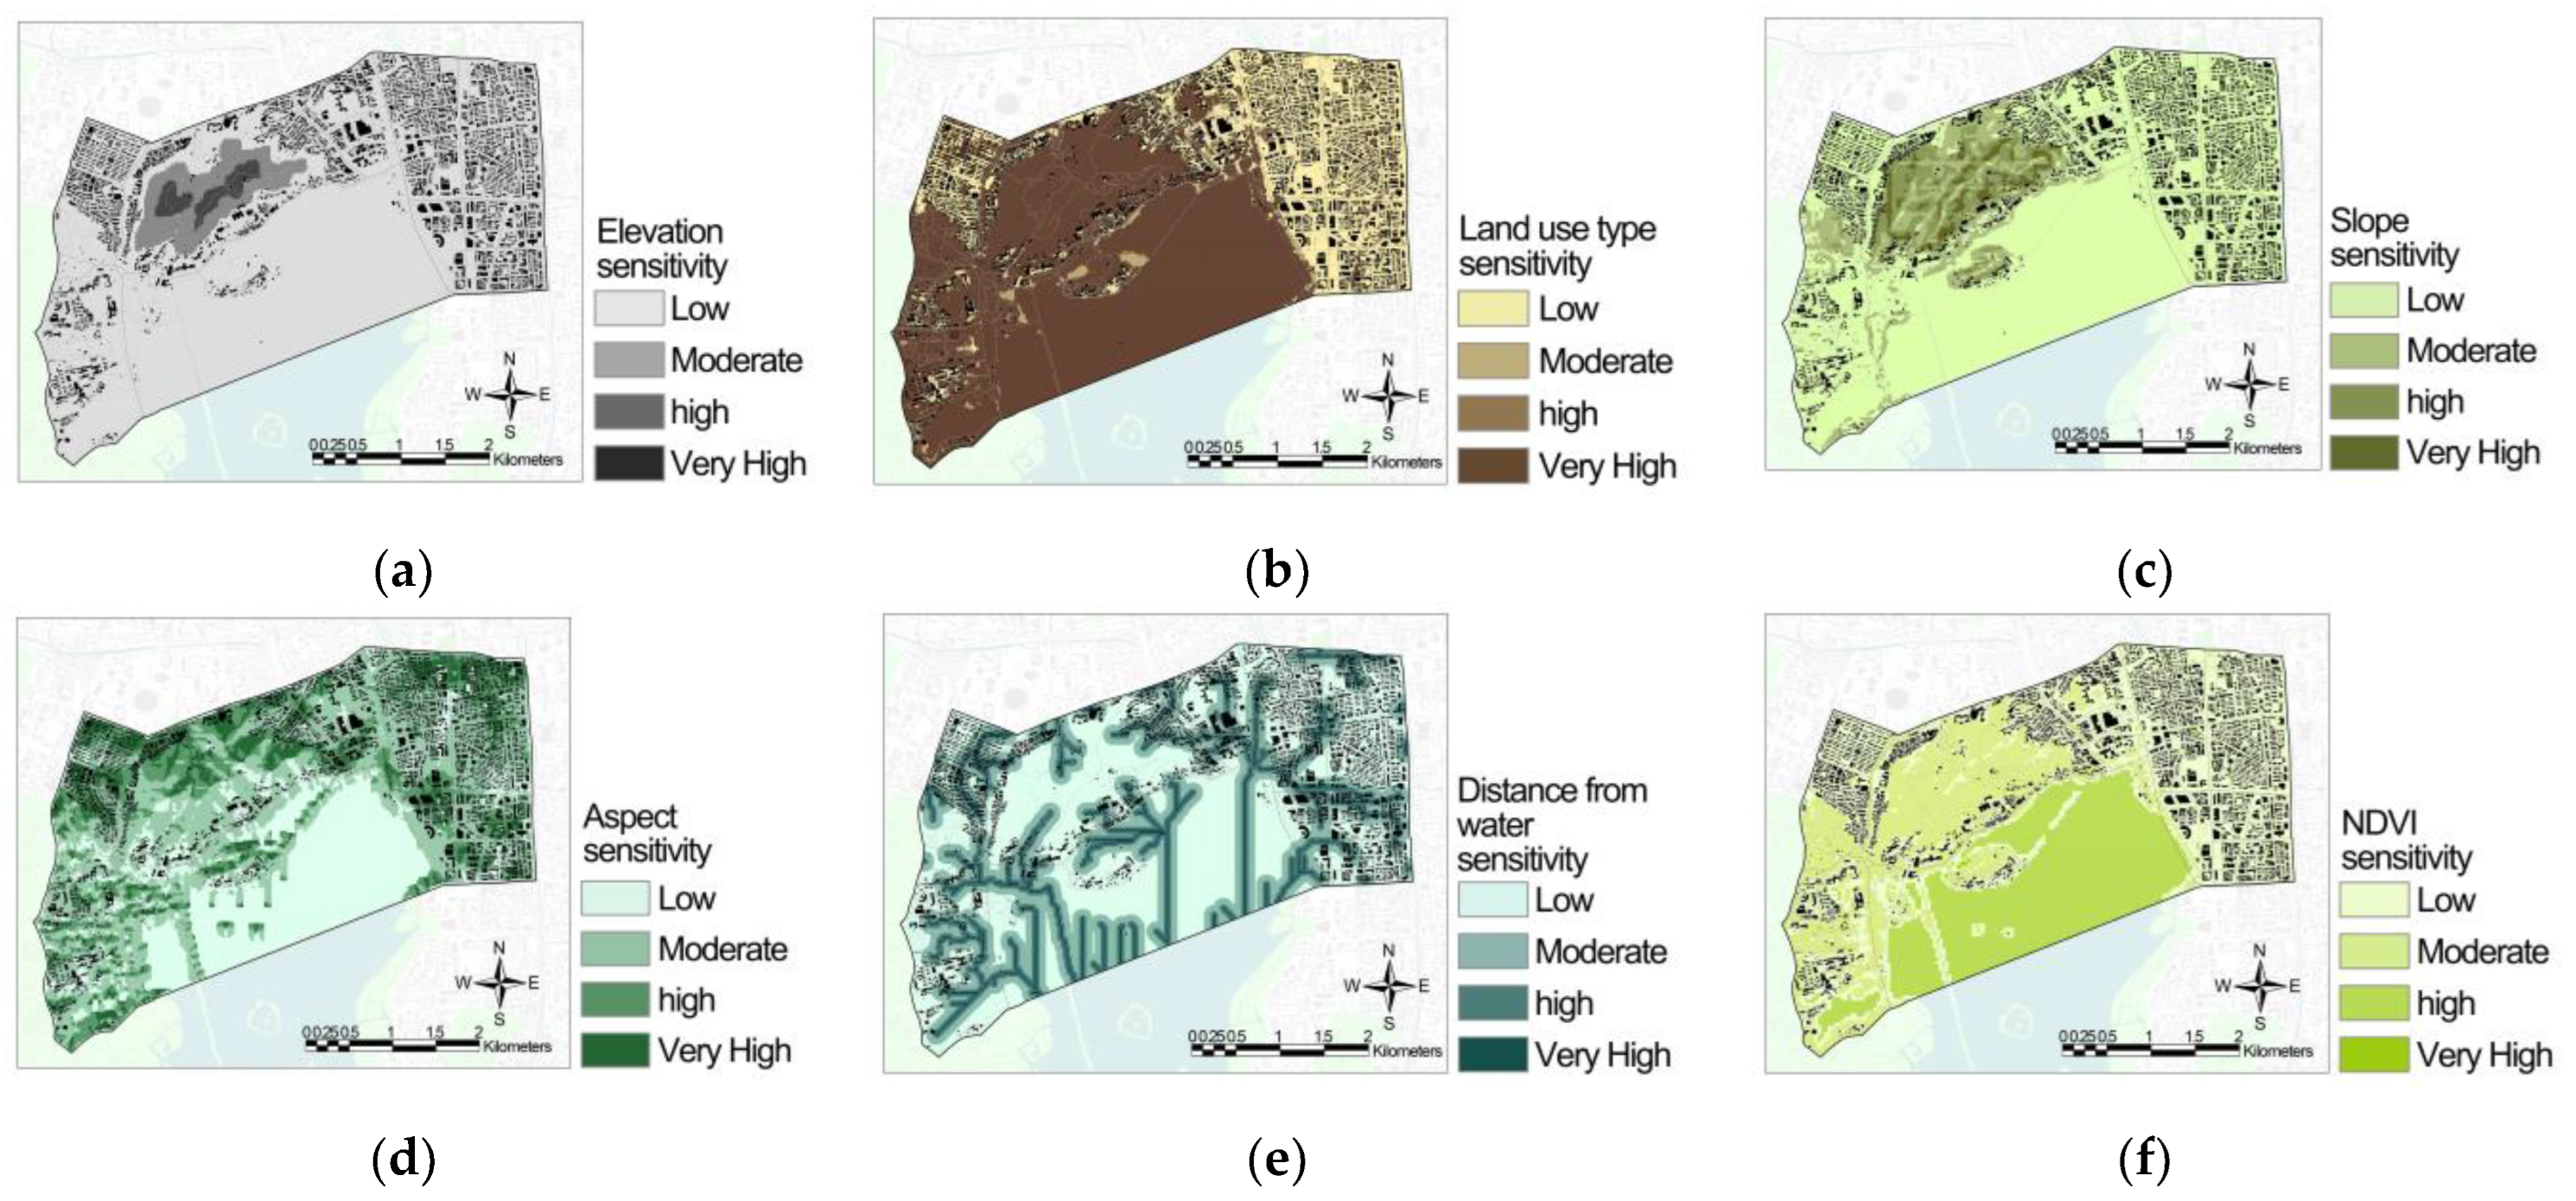
  • Elevation: The higher the elevation, the weaker the renewal capacity of nature, the higher the number of vulnerable species, and the higher the level of sensitivity [42]. DEM data directly display the elevation. Considering the topographic and climatic characteristics of the study location, the reference standard was taken from other studies that covered areas near the subject location in Hangzhou, China [40]. In this way, the assessment criteria for the sensitivity levels could be determined, and an elevation sensitivity map was drawn (Figure 7a).
  • Land use type: Land use types were classified using ESA WorldCover data. There is a wide variety of land use types in the study area, eight in total. The land use types in the southern, northwestern, and eastern areas of Beishan Street are mainly permanent water bodies, tree-covered areas, and built-up areas, respectively. Meanwhile, these tree-covered hills, building complexes, and the lake are the most attractive scenery in the West Lake Scenic Spot where Beishan Street is located (Figure 8). In addition, the study area is scattered with small areas of shrubland, grassland, cropland, bare/sparse vegetation, and herbaceous wetland. Sensitivity levels were determined by referring to the assessment criteria of Hangzhou, China [40], Bayburt, Turkey [42], and Denizli, Turkey [41]. In this way, a sensitivity map of land use types was drawn (Figure 7b).
  • Slope: As the slope increases, the probability of natural hazards increases and the level of ecological sensitivity is higher [40]. Slope analysis was performed using DEM data. Sensitivity levels were determined by referring to the assessment criteria of Hangzhou, China [40], and Bayburt, Turkey [42]. In this way, a slope sensitivity map was drawn (Figure 7c).
  • Aspect: The study area is located in a temperate zone of the Northern Hemisphere, so the south-facing position is more favorable for plant growth and is less sensitive. Aspect analysis was performed using DEM data. The sensitivity level was determined by referring to the assessment criteria of Denizli, Turkey [41]. In this way, an aspect sensitivity map was drawn (Figure 7d).
  • Distance from water: The closer to water, the richer the biological species, the more complex the ecological environment, and the higher the level of ecological sensitivity. Flow direction and Euclidean distance analyses were performed sequentially using the DEM data. The sensitivity level was determined by referring to the assessment criteria of Denizli and Bayburt, Turkey [42]. In this way, a sensitivity map of distance from water was drawn (Figure 7e).
  • NDVI: NDVI is used to quantify vegetation greenness and is useful for showing vegetation density and assessing changes in plant health. NDVI is calculated as a ratio between the red (R) and near-infrared (NIR) values in traditional fashion: (NIR − R) / (NIR + R) [43].
N D V I = N I R R N I R + R
where NIR is the reflection value in the near-infrared band, which in a Landsat 8 map is Band5, and R is the reflection value in the red band, which in a Landsat 8 map is Band4.
The NDVI results are always between −1 and 1. A result below 0 indicates that the area is covered by water.
NDVI was calculated using Landsat 8 plots with the formula [Float(Band5) − Float(Band4)] / [Float(Band5) + Float(Band4)]. Sensitivity levels were determined by referring to the assessment criteria of Jilin, China [43]. In this way, an NDVI sensitivity map was drawn (Figure 7f).
The sensitivity levels of elevation, land use type, slope, aspect, distance from water, and NDVI of 2936 plots in the study area were calculated by using the weighted-average method in Section 2.3.1, list item 1. The CRITIC method was used to calculate the weights of the six assessment factors (Table 2), and a weighted overlay was used on the six sensitivity maps of assessment factors (described in Section 2.3.1, list item 2). In this way, an ecological sensitivity map of the study area was drawn (Figure 9).
As can be seen in Figure 7a–f, the sensitivity levels of elevation, slope, and NDVI in the study area are not obvious, while those of land use type, aspect, and distance from water are obvious. This intuitive result is consistent with the weights calculated by the CRITIC method. The areas with higher elevation and slope sensitivity are concentrated in the hilly areas north of Beishan Street, where fewer buildings are located. More than half of the buildings on Beishan Street are located on sites with slopes less than 25°, and not at high elevations, with most below 50 m. The NDVI and land use type maps show clear similarities, with higher-sensitivity areas concentrated in the watershed to the south, mountains to the north, and scenic areas to the west. As can be seen in Figure 9, the ecological sensitivity of most of the study area is high. The ecological sensitivity of some areas in the watershed and the densely built-up areas on the east side is moderate.

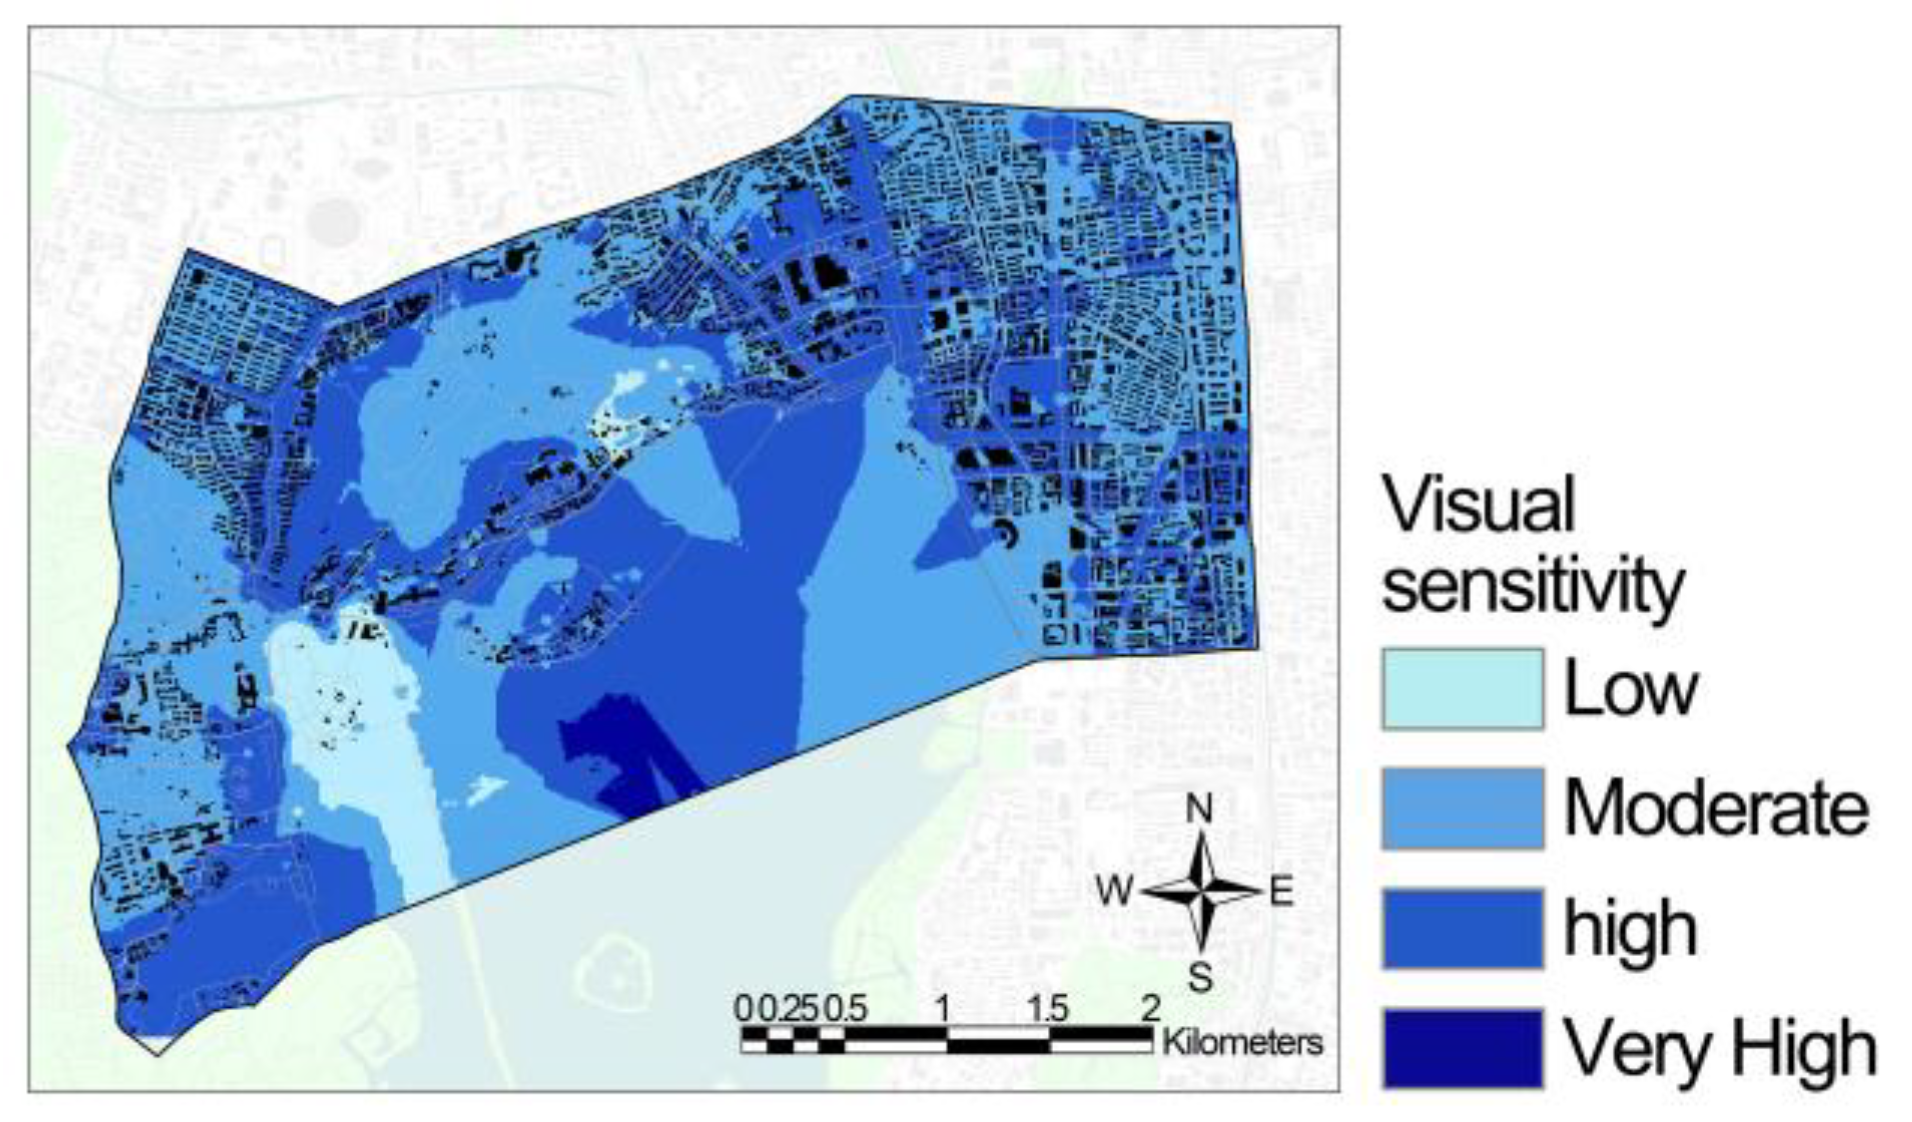
3.1.2. Landscape Visual Sensitivity Analysis

The urban visual environment affects the city’s image and residents’ lives [44]. It is worth noting that visual sensitivity is analyzed differently than ecological sensitivity. Ecological sensitivity is analyzed with respect to terrain and landscape elements, so it is analyzed with DEM. Visual sensitivity is analyzed for the overlay of terrain, landscape, streets, and buildings, so it is analyzed with the UDEM. The UDEM adds buildings with height information to the DEM (as described in Section 2.2). The visual environment of a landscape is affected by two main aspects: visual occlusion of the topography and buildings, and the number of potential viewers who can see the landscape [13]. Visual occlusion can be reflected in street view and random point view, and the number of potential viewers at different locations can be reflected in traffic accessibility. The visual sensitivity of the landscape in this study comprises three superimposed assessment factors: traffic accessibility, street view, and random point view. The more visually sensitive the location, the more vulnerable the landscape is to change as a result of human activity.
  • Traffic accessibility: The traffic network of a city affects the visual environment [45]. According to the “highway” attribute of OSM data, streets are classified into four types: primary, secondary, tertiary, and others. We created a new element dataset named “traffic network” in ArcGIS. The transport network was built in ArcMap. The speed of primary streets was set to 60 km/h, secondary streets to 40 km/h, tertiary streets to 20 km/h, other streets to 10 km/h, and the walking speed of all streets to 1.5 m/s. The speed of the subway was set to 40 km/h, and the subway cannot be connected to the roads. The straight-through intersection time was set to 20 s, reverse time to 20 s, right turn time to 10 s, and left turn time to 30 s. The average travel time for each location in the study area was calculated using the transport network. The reference standard of traffic accessibility is 5 min average walking time, 15 min comfortable walking time, and 30 min extreme walking time [46]. In this way, the assessment criteria for the sensitivity levels were determined, and a sensitivity map of traffic accessibility was drawn (Figure 10a).
  • Street view: Urban visibility is calculated by UDEM [47]. The greater the exposure to the landscape, the more likely it is to be affected by human activities, and the higher the sensitivity will be [48]. Streets are locations of intense human activity in cities and are used as observation points for visual field analysis. After selecting the streets from the OSM data, 300 observation points were set up on the road for visual field analysis. The number of observation points was determined by the equidistant method. In this way, a sensitivity map of street view was drawn (Figure 10b).
  • Random point view: To calculate the probability of a landscape being seen, people randomly situated in other locations should be considered in addition to densely populated streets. A view analysis was conducted by generating 300 random points in the study area as observation points. The results show that all locations could be seen from up to 180 of the 300 observation points. The number of observations was determined by the equidistant method to draw a sensitivity map of a random point of view (Figure 10c).
We calculated the weights of the three assessment factors of visual sensitivity (Table 3) by using the same CRITIC weighting method as the ecological sensitivity analysis (described in Section 2.3.1, list item 2). We used a weighted overlay on three sensitivity maps of assessment factors to draw a visual sensitivity map of the study area (Figure 11).
As can be seen in Figure 10a–c, the street view and random point view sensitivity maps are similar, while traffic accessibility is different from them. Most areas in the study area have moderate street view and random point view sensitivity, highly sensitive areas are concentrated in the center of the watershed, and densely built-up areas have low sensitivity. Building-dense locations have a high density of roads, so traffic accessibility is higher in these locations. It is worth noting that traffic accessibility shows high sensitivity in the watershed, which may be different from intuition. The reason is that West Lake, a famous tourist attraction, has several rowboat routes for tourists to use. As shown in Figure 11, the weight of traffic accessibility in visual sensitivity is more than 50%. Both traffic accessibility and view sensitivity are high in the center of the watershed location, so the visual sensitivity is very high.

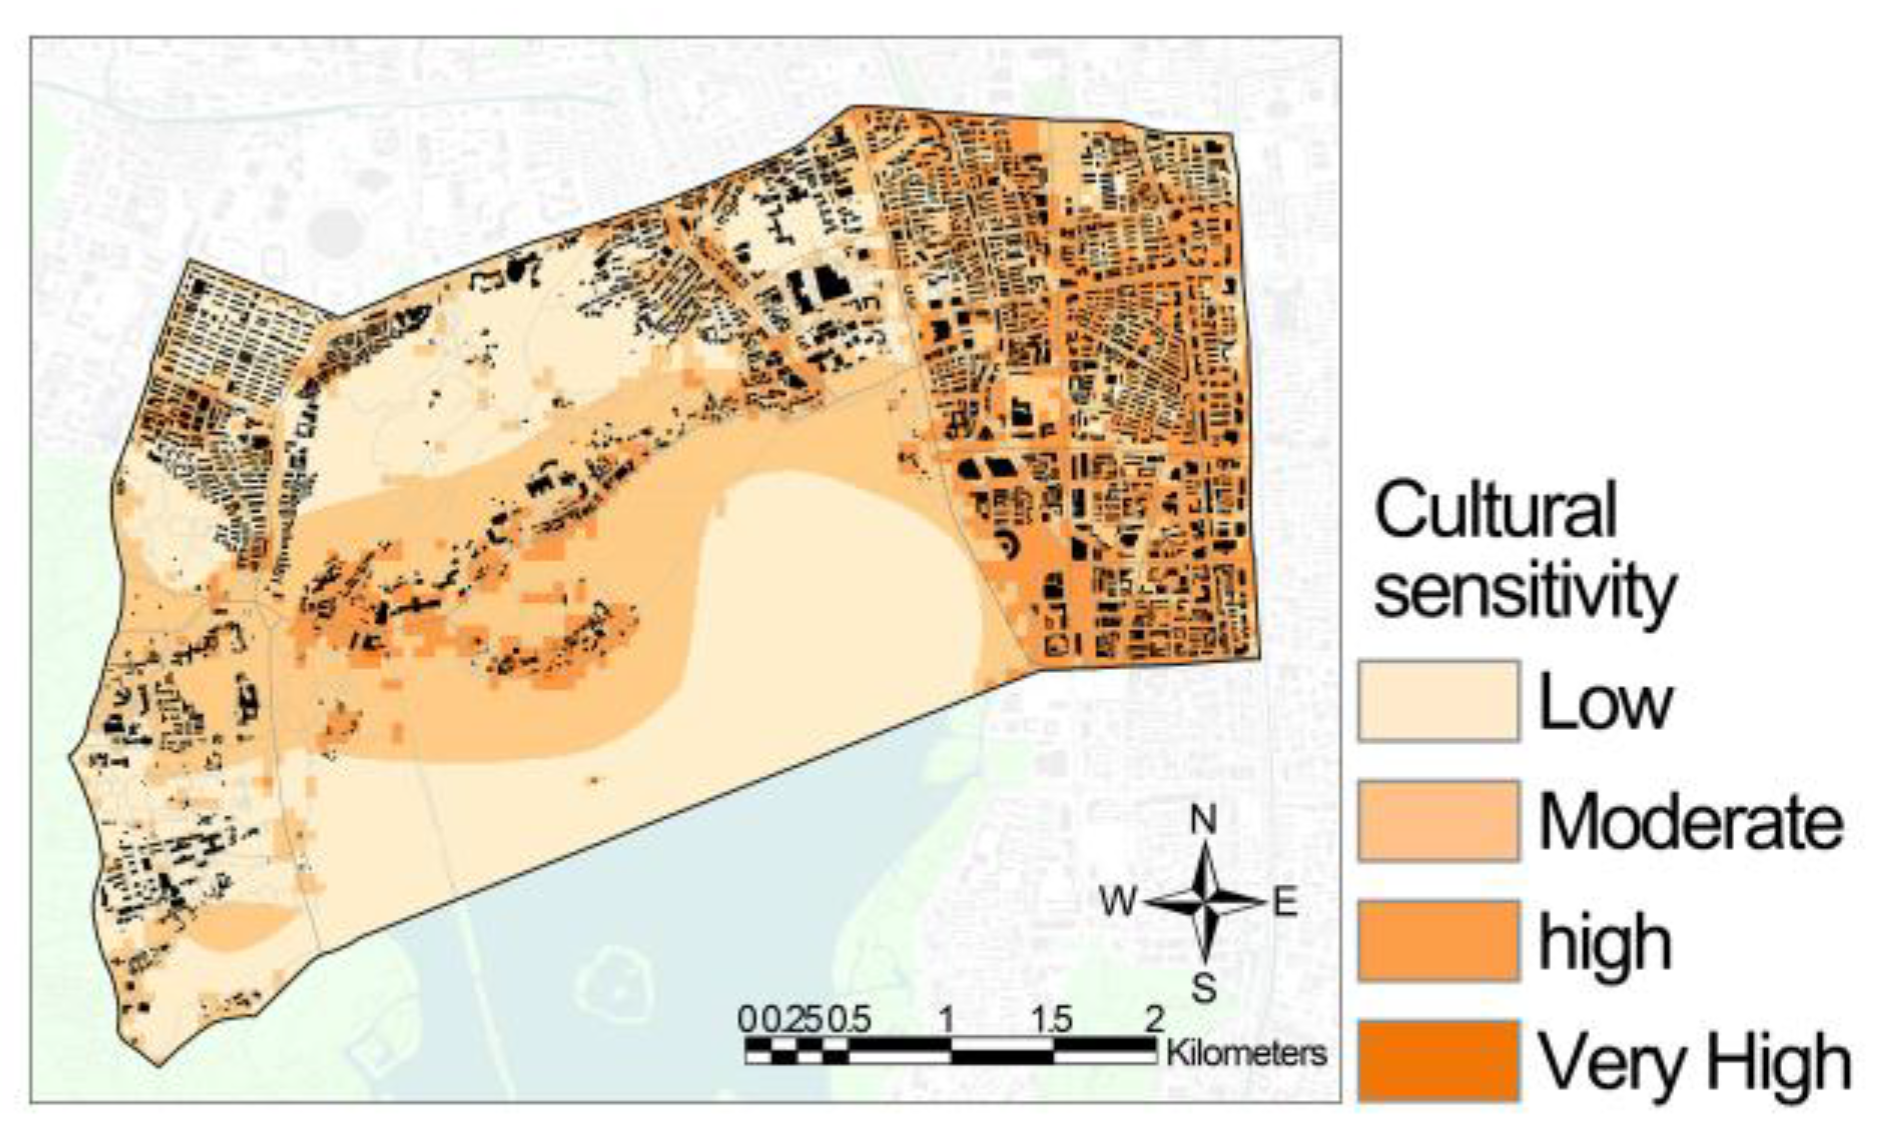
3.1.3. Landscape Cultural Sensitivity Analysis

Culture can be reflected by urban vitality and the locations where people gather. Residents and tourists are dense in the study area. Urban vitality can be reflected by SHDI, and the degree of population aggregation can be reflected by attraction density. In addition, the study area is a location where conservation heritage buildings are highly aggregated, so in this study, we chose the density of heritage buildings as one of the evaluation factors. In summary, the cultural sensitivity of landscape in this study comprises three superimposed assessment factors: SHDI, density of heritage buildings, and density of tourist attractions.
  • SHDI: Areas rich in points of interest in the city have better urban facilities. These areas are more prone to urban problems [49] and are more sensitive than areas with a single function. The study area was separated into 50 m × 50 m grid data. The number of POI types near each grid was calculated by using “Generate Near Table”, setting the search radius to 100 m. The SHDI value of each grid was calculated by the SHDI formula [38]. SHDI values were graded by the Jenks natural breaks classification method to draw an SHDI sensitivity map (Figure 12a).
  • The density of heritage buildings: Historical buildings are important carriers of urban history and culture, so the historical–cultural quality of the landscape is influenced by immovable cultural heritage such as buildings [8]. The higher the heritage building density, the higher the cultural sensitivity of the landscape. In this study, 1077 heritage buildings at all levels in Hangzhou were considered, as described in Section 2.1. Heritage buildings were analyzed by kernel density. Density was determined by the equidistant method to draw a sensitivity map of heritage building density (Figure 12b).
  • The density of tourist attractions: The higher the tourist attraction density, the greater the attractiveness to tourists and the higher the cultural sensitivity of the landscape. Points classified as tourist attractions were selected from the POI data, and the points of tourist attractions were exported. Tourist attractions were analyzed by kernel density. Density was determined by the equidistant method to draw a sensitivity map of tourist attraction density (Figure 12c).
The weights of the three assessment factors of cultural sensitivity (Table 4) were calculated by using the same CRITIC weighting method as the ecological sensitivity analysis (described in Section 2.3.1, list item 2). We used a weighted overlay on three sensitivity maps of assessment factors to draw a cultural sensitivity map of the study area (Figure 13).
As can be seen from Figure 12a–c, the high SHDI sensitivity areas are concentrated on the east side of the study area, where the buildings are densely packed. The sensitivity maps of heritage buildings and tourist attractions are similar. One reason is that most of the heritage buildings in Beishan Street were constructed in the 20th century, and because of the earlier construction and the fact that most of the villa owners were rich, they chose sites in better-landscaped locations and close to tourist attractions. Another reason is that as carriers of urban memory, many heritage buildings are famous tourist attractions in themselves. There are more restrictions on constructing new buildings around the conservation heritage buildings and tourist attractions, so the building density is low and the functional urban facilities are not as well developed as in other areas. Heritage building density sensitivity is extremely high in the southeast of the study area, as this is the location of two other famous Hangzhou historic districts with very densely built historic buildings.
Figure 13 shows that the center of the West Lake watershed exhibits high landscape sensitivity. From a lifestyle perspective, the lake itself is an important attraction with very high visual and cultural value for residents and visitors to Hangzhou, and to China in general (Figure 14a). Some of the buildings on the small islands in the lake are conservation heritage buildings. The view of the lake is wide enough that people sitting on boats can see the buildings in the center of the lake (Figure 14b). If these buildings were to be damaged, it would have an impact on the wider view of the lake, making the location in the center highly sensitive.

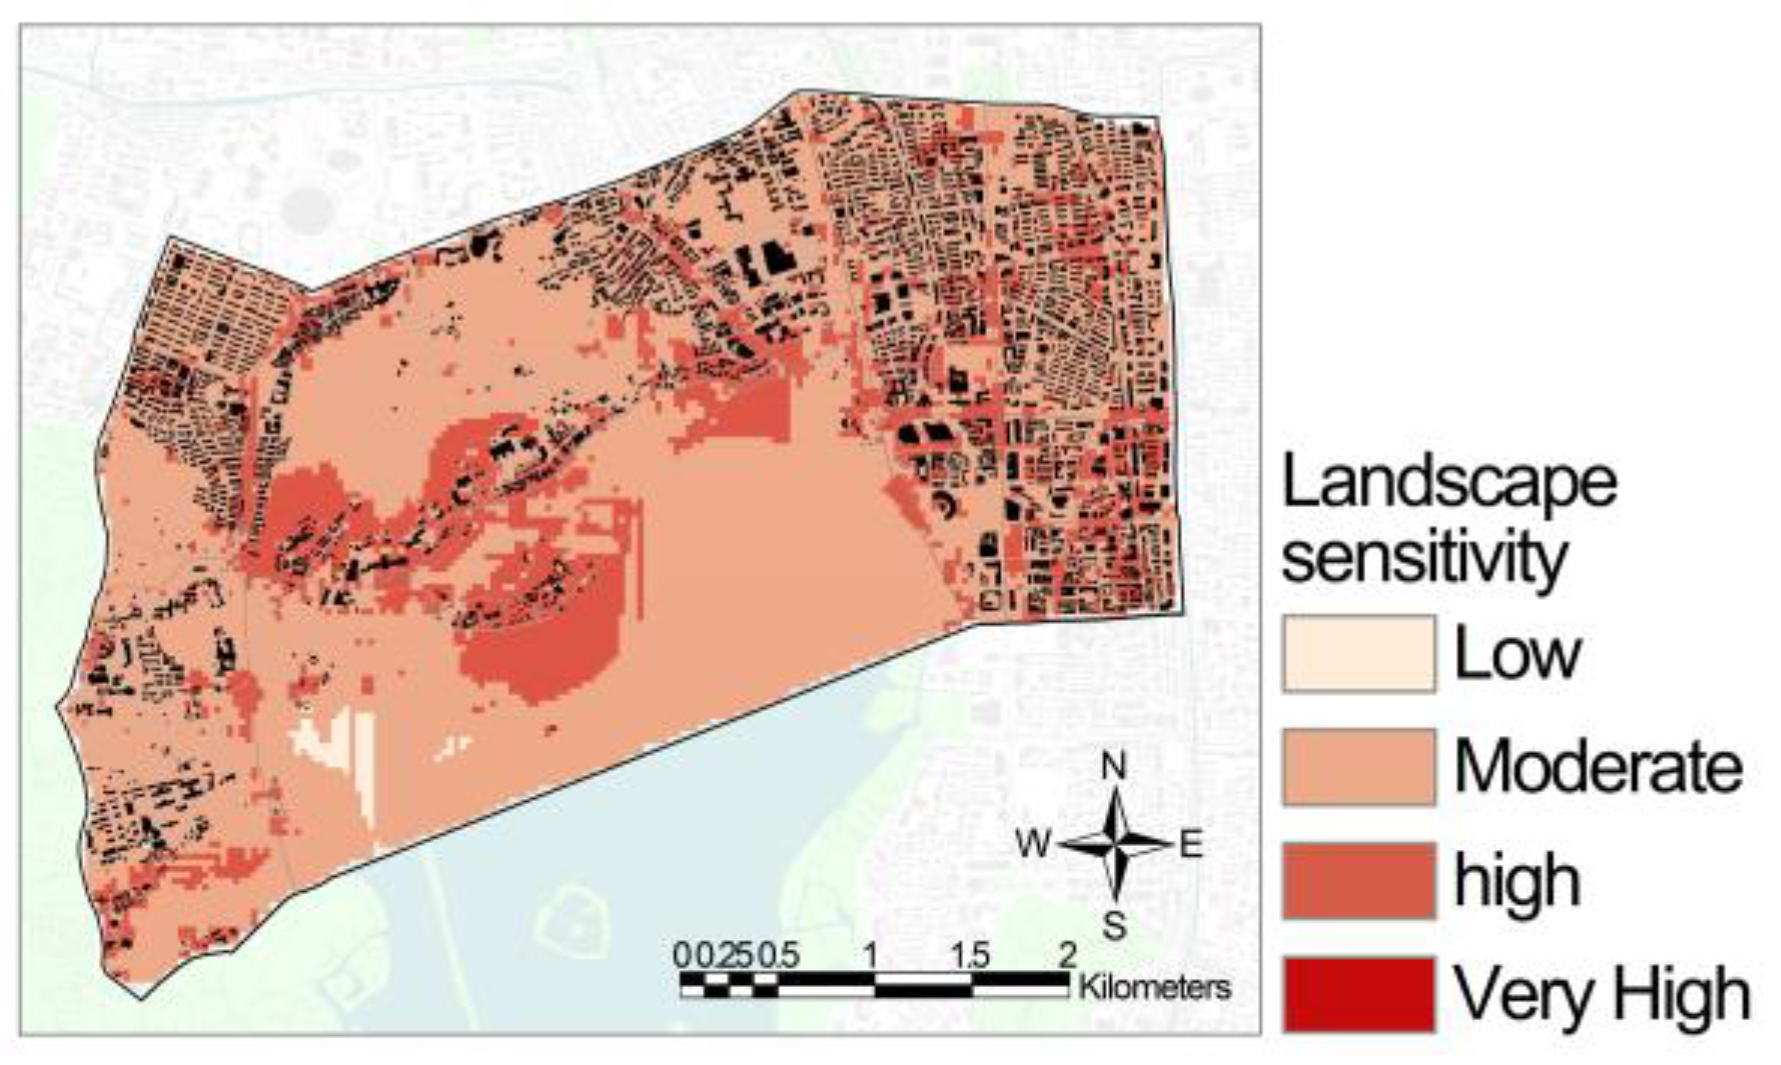
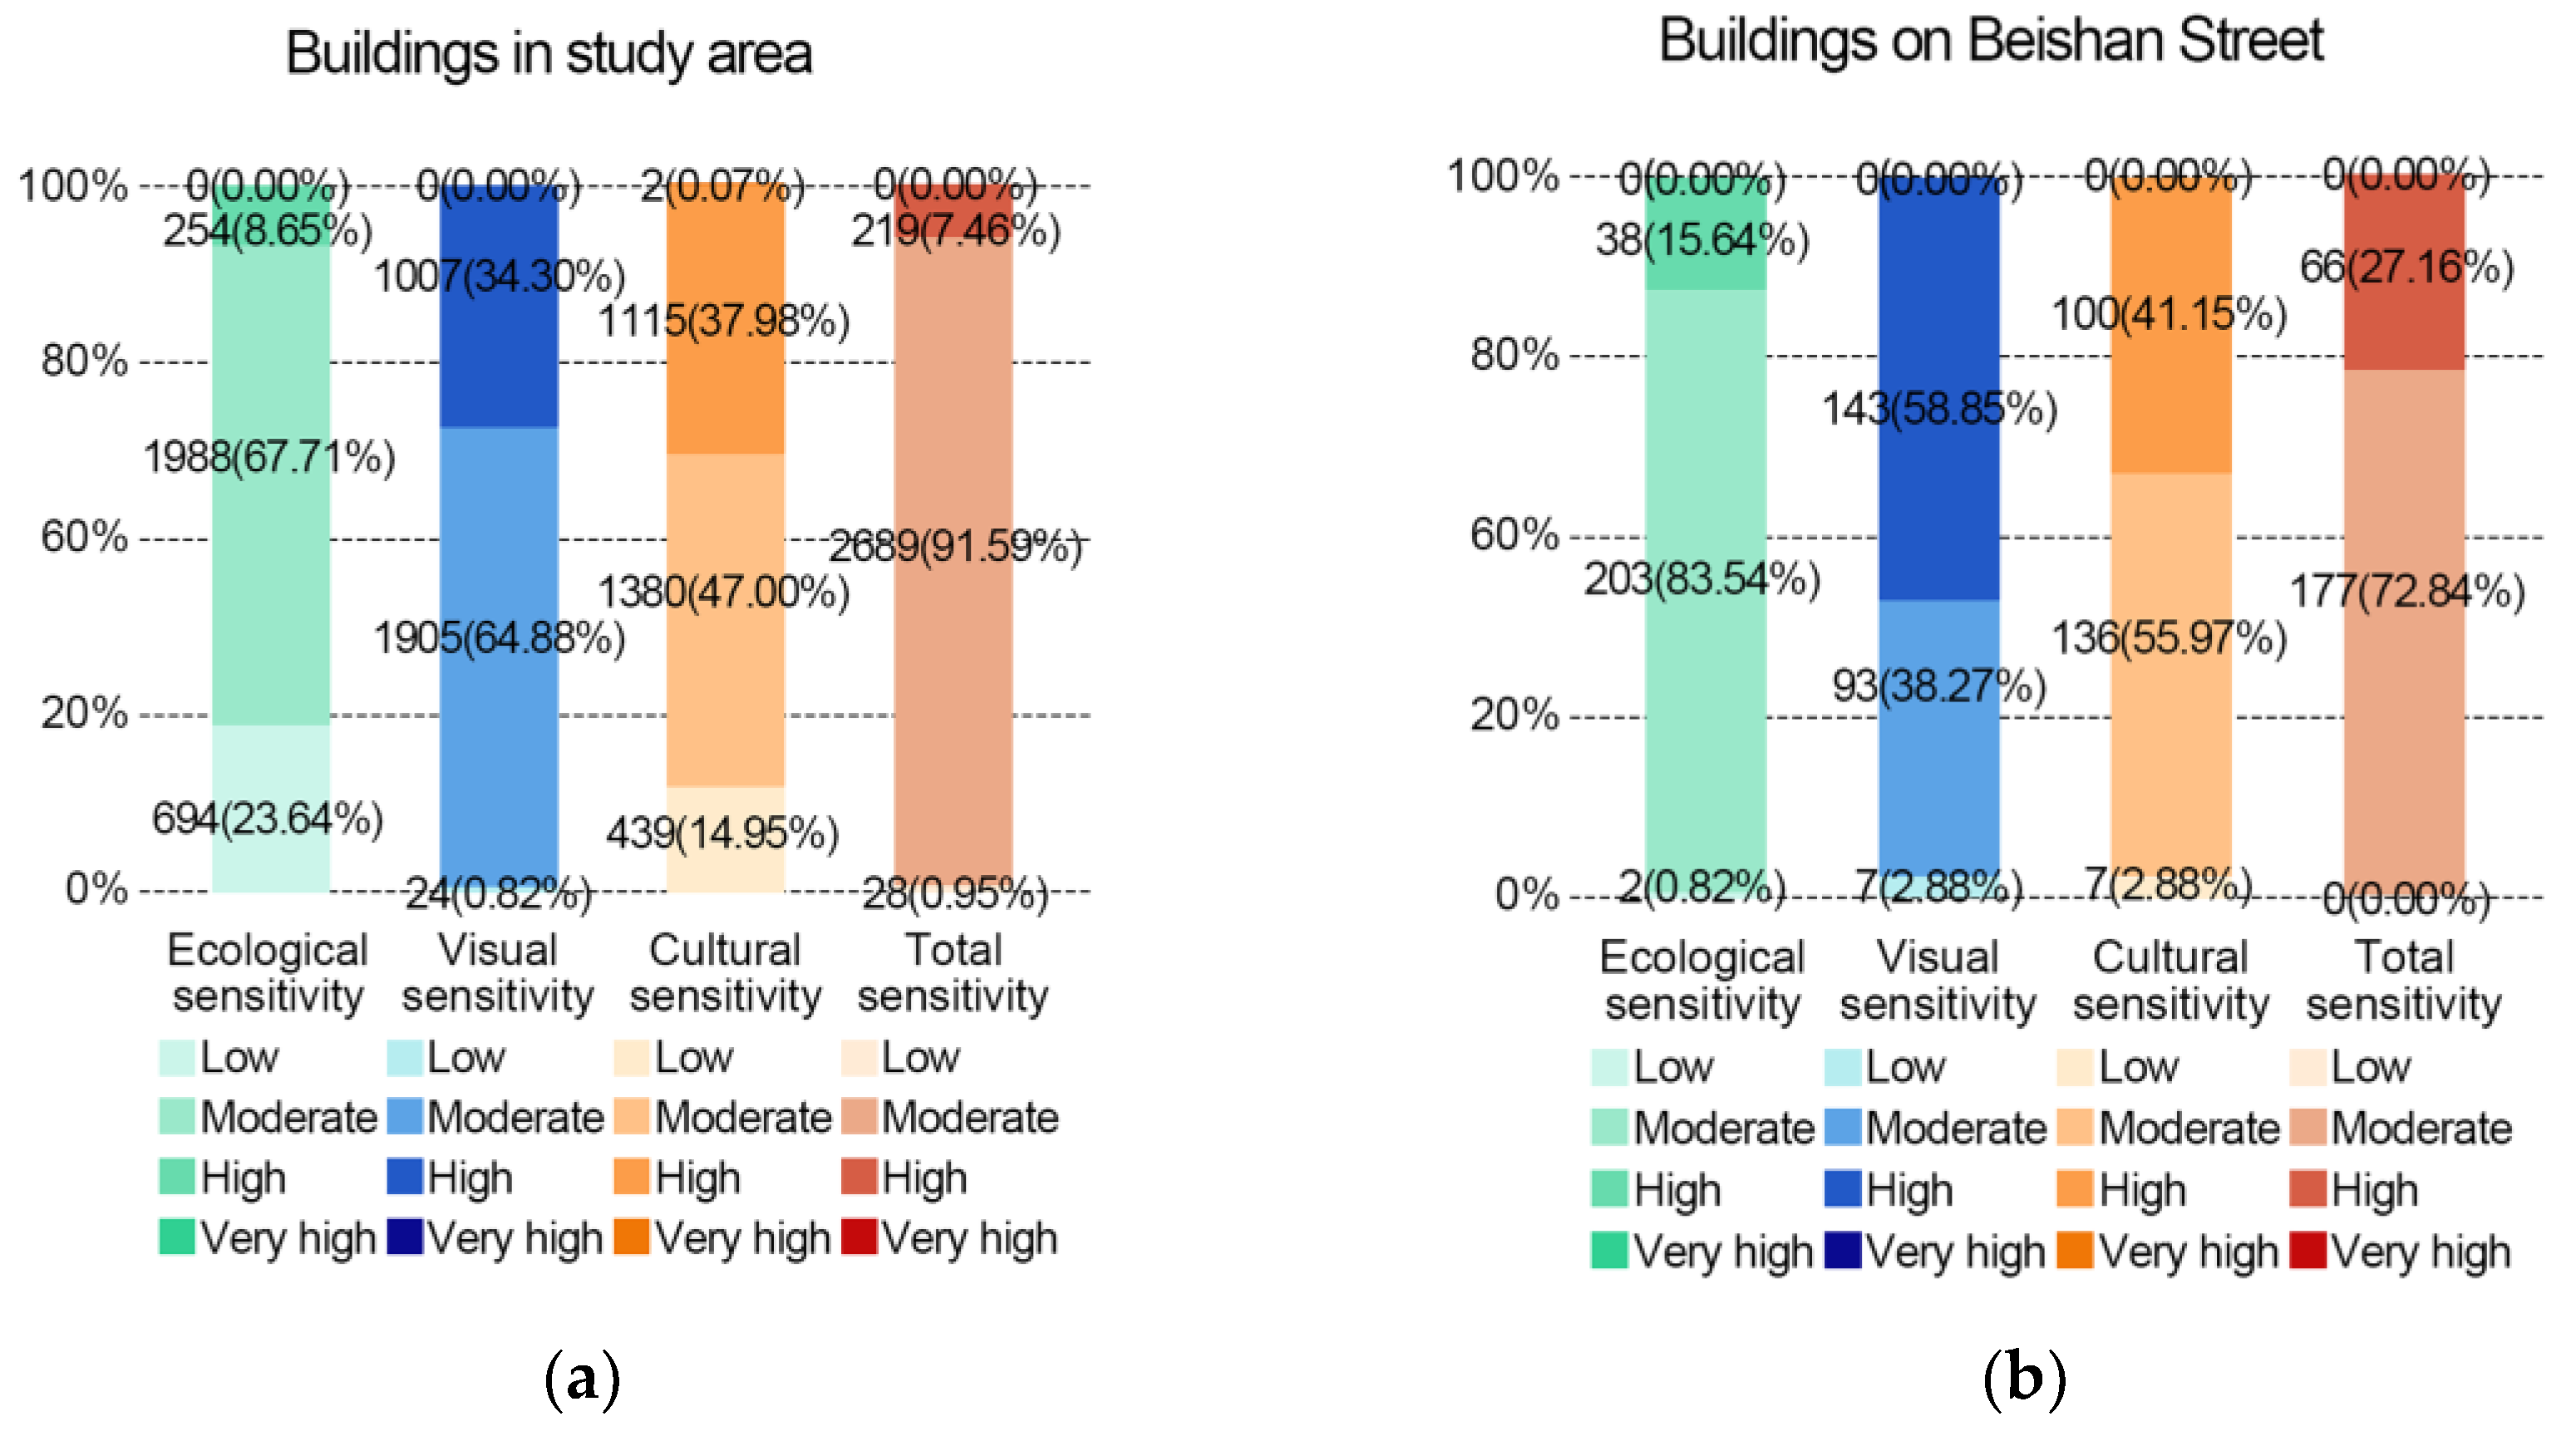
3.2. Total Landscape Sensitivity

The weights of ecological, visual, and cultural sensitivity (Figure 15) were calculated by using the same CRITIC weighting method as the ecological sensitivity analysis (described in Section 2.3.1, list item 2). The result shows that the weight of cultural sensitivity is nearly half (43.53%), and the weights of ecological sensitivity (31.90%) and visual sensitivity (24.57%) were similar. This result is consistent with the characteristics of the study area. As a conservation historic district, Beishan Street is best known for its cultural heritage, resulting in the highest percentage of cultural sensitivity. In the study area, the low percentage of visual sensitivity is attributed to the open view. Beishan Street features scattered buildings with low heights, while the hill slope is quite flat. It can be inferred that changes in human or non-physical elements have a greater impact on the landscape than changes in the ecological and visual environment.
We used a weighted overlay on three sensitivity maps of primary assessment factors to draw a total sensitivity map of the study area’s landscape (Figure 16).

4. Discussion

4.1. Sensitivity Map Analysis

In this analysis, the correspondence between sensitivity levels and building plots within the study area was examined one by one. In this way, ecological, visual, cultural, and superimposed total sensitivity maps (Figure 17a–d) of building plots were drawn.
Statistics on the proportion of plots at each sensitivity level in the ecological, visual, cultural, and total sensitivity maps of the study area (Figure 18a) and Beishan Street Historic District (Figure 18b) were calculated.

4.1.1. Suggestions for Conservation of Beishan Street Historic District

  • Higher landscape sensitivity of Beishan Street Historic District
Among the buildings in the Beishan Street Historic District, a significant proportion are located in areas rated highly sensitive or above. Specifically, 27.16% of the buildings are situated in such areas, which is almost four times more than the overall study area (7.46%). Further analysis shows that the percentage of buildings located in areas rated highly ecologically, visually, or culturally sensitive and above in the district is 15.64%, 58.85%, and 41.15%, respectively. In contrast, the corresponding percentages for the study area are 8.65%, 34.30%, and 37.98%. These results suggest that the Beishan Street Historic District is a critical area that requires special attention and protection in urban planning and construction.
More than half of the buildings in the historic district are located in areas rated highly visually sensitive or above. Beishan Street has a scenic view and many villas of low height have been constructed since the early 20th century. A large proportion of these buildings have been inhabited by celebrities or hosted memorable historical events, so they were gradually recognized as historic preservation buildings and have been better preserved. Later, due to the conservation policy of West Lake, the height of new buildings in the surrounding area was restricted. At the same time, there are several small islands in the center of West Lake and several rowboat routes, and visitors can see the buildings on Beishan Street from these locations. For these two reasons, the view of Beishan Street is very open. If there were any cluttered buildings or structures, it would greatly affect the visual experience of visitors and residents. Therefore, the renovation and protection of the visual environment of Beishan Street should be among the priorities of the relevant departments.
2.
Protected heritage and historical buildings in Beishan Street Historic District
There are 44 protected heritage and historical buildings at all levels in the Beishan Street Historic District. Only six (13.64%) are located in areas rated highly sensitive and above, and most are located in areas rated moderately sensitive and below. From an ecological perspective, these buildings are located at lower elevations or on gentler slopes. From a visual perspective, they are located farther from streets or in sheltered locations. From a cultural perspective, they are located in places that have fewer urban facilities or are less densely populated. These characteristics are conducive to the conservation of historical buildings; if some protective works need to be carried out in the future, the impact on urban ecology and the visual environment is limited.
3.
Key buildings that need attention in Beishan Street Historic District
Six protected heritage or historical buildings at all levels in the Beishan Street Historic District are located in highly sensitive plots, and some buildings not identified as protected heritage but have high historical value are located in highly sensitive plots (Table 5).
Since most buildings are located in moderately sensitive areas, the contrast is not obvious. Therefore, the grading of sensitivity map levels was further refined. As can be seen in Figure 19, some buildings scored very close to the high sensitivity score (>2.5) even though they are located on moderately sensitive plots. For example, among the buildings located on plots with a sensitivity score of 2.4–2.5, there are five protected heritage and historical buildings at all levels and two buildings of high historical value (Table 6).
These buildings have existed for nearly a century, or even a thousand years. Many famous historical events occurred in these buildings, which have high historical value. These buildings are located on more highly sensitive plots and are more vulnerable to landscape change and damage. These issues should receive focused attention in the subsequent conservation, and renovation decisions should be made more carefully.

4.1.2. Study Area Conservation Recommendations

The visual and cultural sensitivity levels of the study area are significantly higher than the ecological sensitivity level. As shown in Figure 18, only 8.65% of the buildings in the study area are situated in plots rated highly ecologically sensitive or above, whereas 34.30% and 38.05% of the buildings are located in plots rated highly visually and culturally sensitive and above, respectively. The comparison shows that the ecological environment within the study area is less affected by human activities, while the visual and cultural environments are more affected. From a visual perspective, the location of the study area has strict skyline control norms. No excessively tall buildings can be built here to cause serious obstruction, but attention should be paid to the impact of billboards and other objects on the urban visual environment. From a cultural perspective, the study area is located in a densely populated area, and controlling the number of visitors during peak periods such as holidays should be considered.

4.2. Correlation of Landscape Sensitivity Assessment Factors

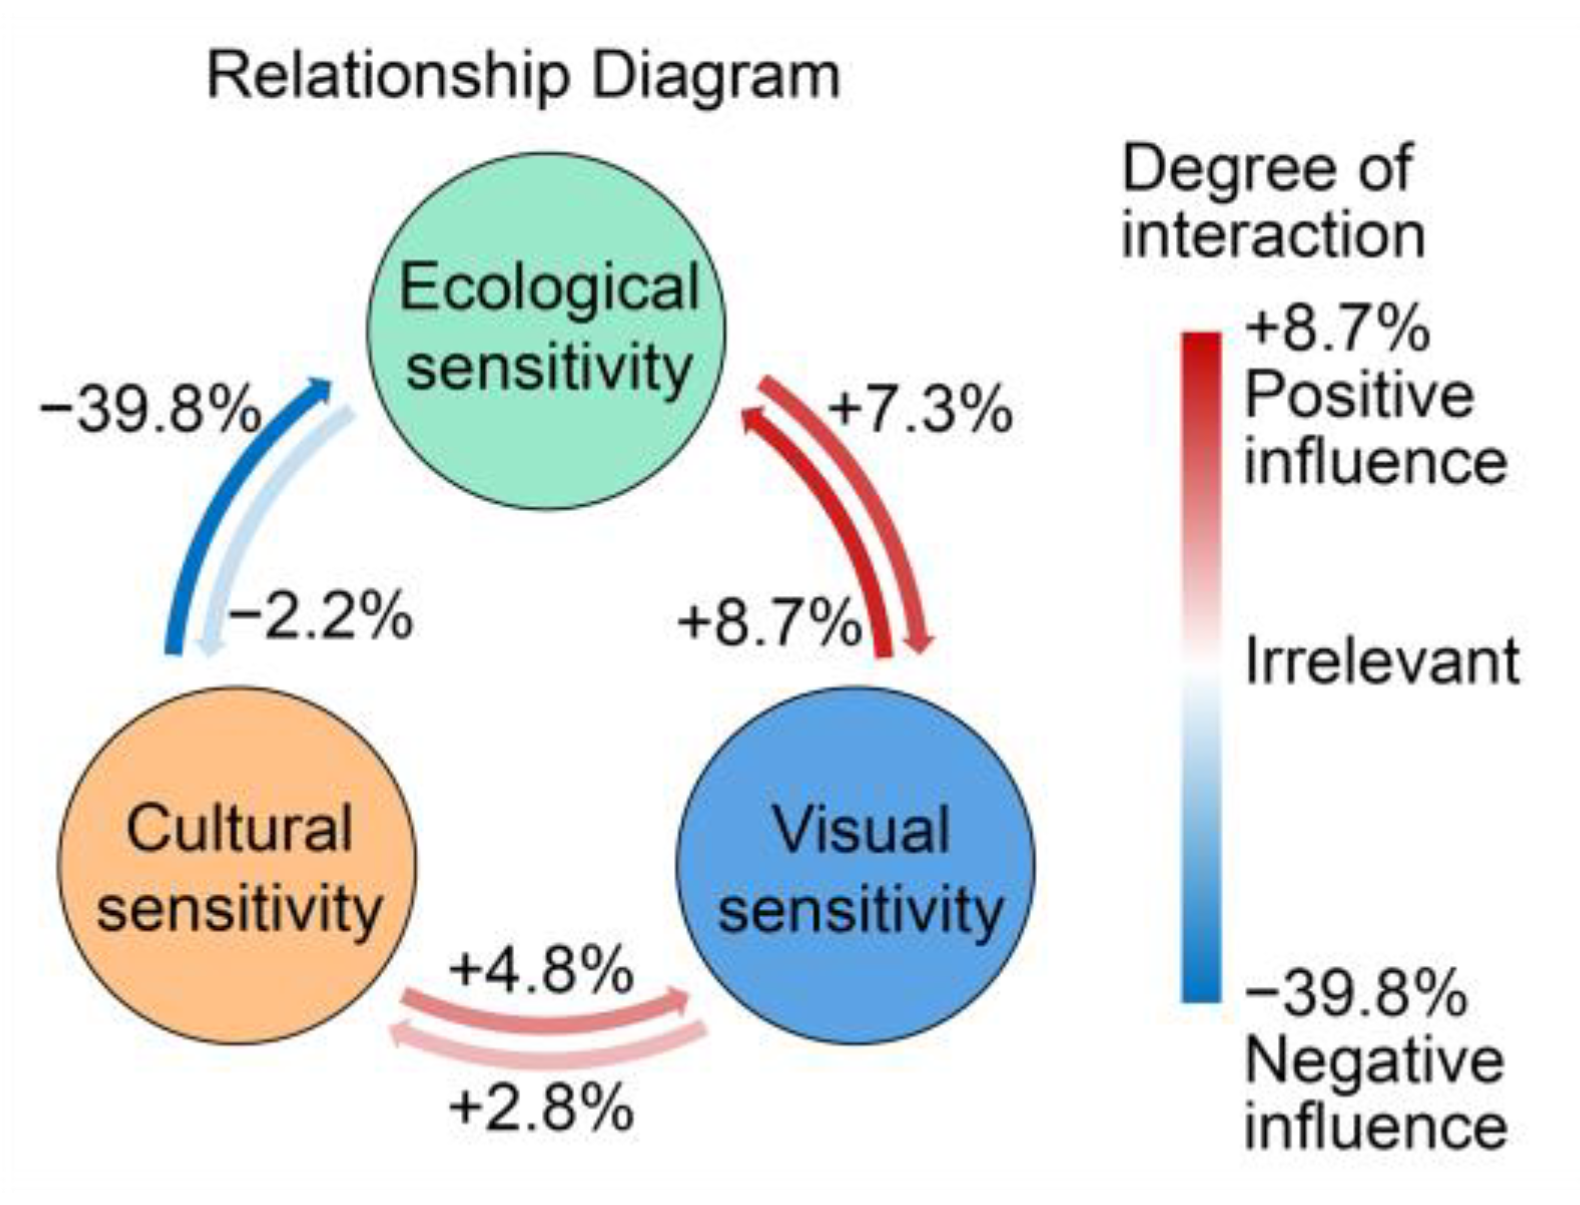
4.2.1. Relevance of Primary Assessment Factors

The ecological, visual, and cultural aspects of the landscape are mutually influential. We input the ecological, visual, and cultural sensitivity data of 2936 plots, and used path analysis in SPSS (Figure 20).
The results indicate that culture has the largest influence on ecology (−39.8%) among the six influence relationships and is significantly higher than the others. There is a significant negative correlation between ecological and cultural sensitivity, indicating that they have a significant negative influence on each other. Ecology is substantially more impacted by culture (−39.8%) than culture is by ecology (−2.2%). For example, objects produced by human activities such as buildings can cause ecological damage, but plant growth has little effect on buildings. Meanwhile, the impact of culture on ecology (−39.8%) is much greater than the impact of culture on vision (−4.8%). Therefore, before making decisions on urban construction, the focus should be on assessing the impact on ecology. Ecology and vision show a significant positive low correlation; little difference was found in the interaction between the two. This may be due to the fact that ecological and visual changes are almost synchronized. For example, when a building is constructed on land originally covered by vegetation, the land use type and ecological environment change, while the building shades the surrounding environment and the visual environment changes.
For areas with high ecological sensitivity and above, urban construction and renovation should take into consideration ecological environmental protection. Most of the buildings located in highly sensitive areas are close to the lake on slopes or within natural landscape attractions. These areas have a complex ecological environment, so they are also the most vulnerable to damage from human construction. Buildings in these areas should be maintained and protected without new construction. However, areas rated highly cultural sensitivity and above can be developed and constructed appropriately, because these areas deserve the attention of residents and visitors [16]. For example, the area west of Beishan Street has a concentration of highly culturally sensitive plots. This area was predominantly residential at the beginning of the 20th century, and with the construction of the West Lake scenic area, inns and restaurants have been renovated and built in recent years to meet the needs of tourists. The increasingly improved urban facilities attract more tourists and advertise the culture of the Beishan Street Historic District.

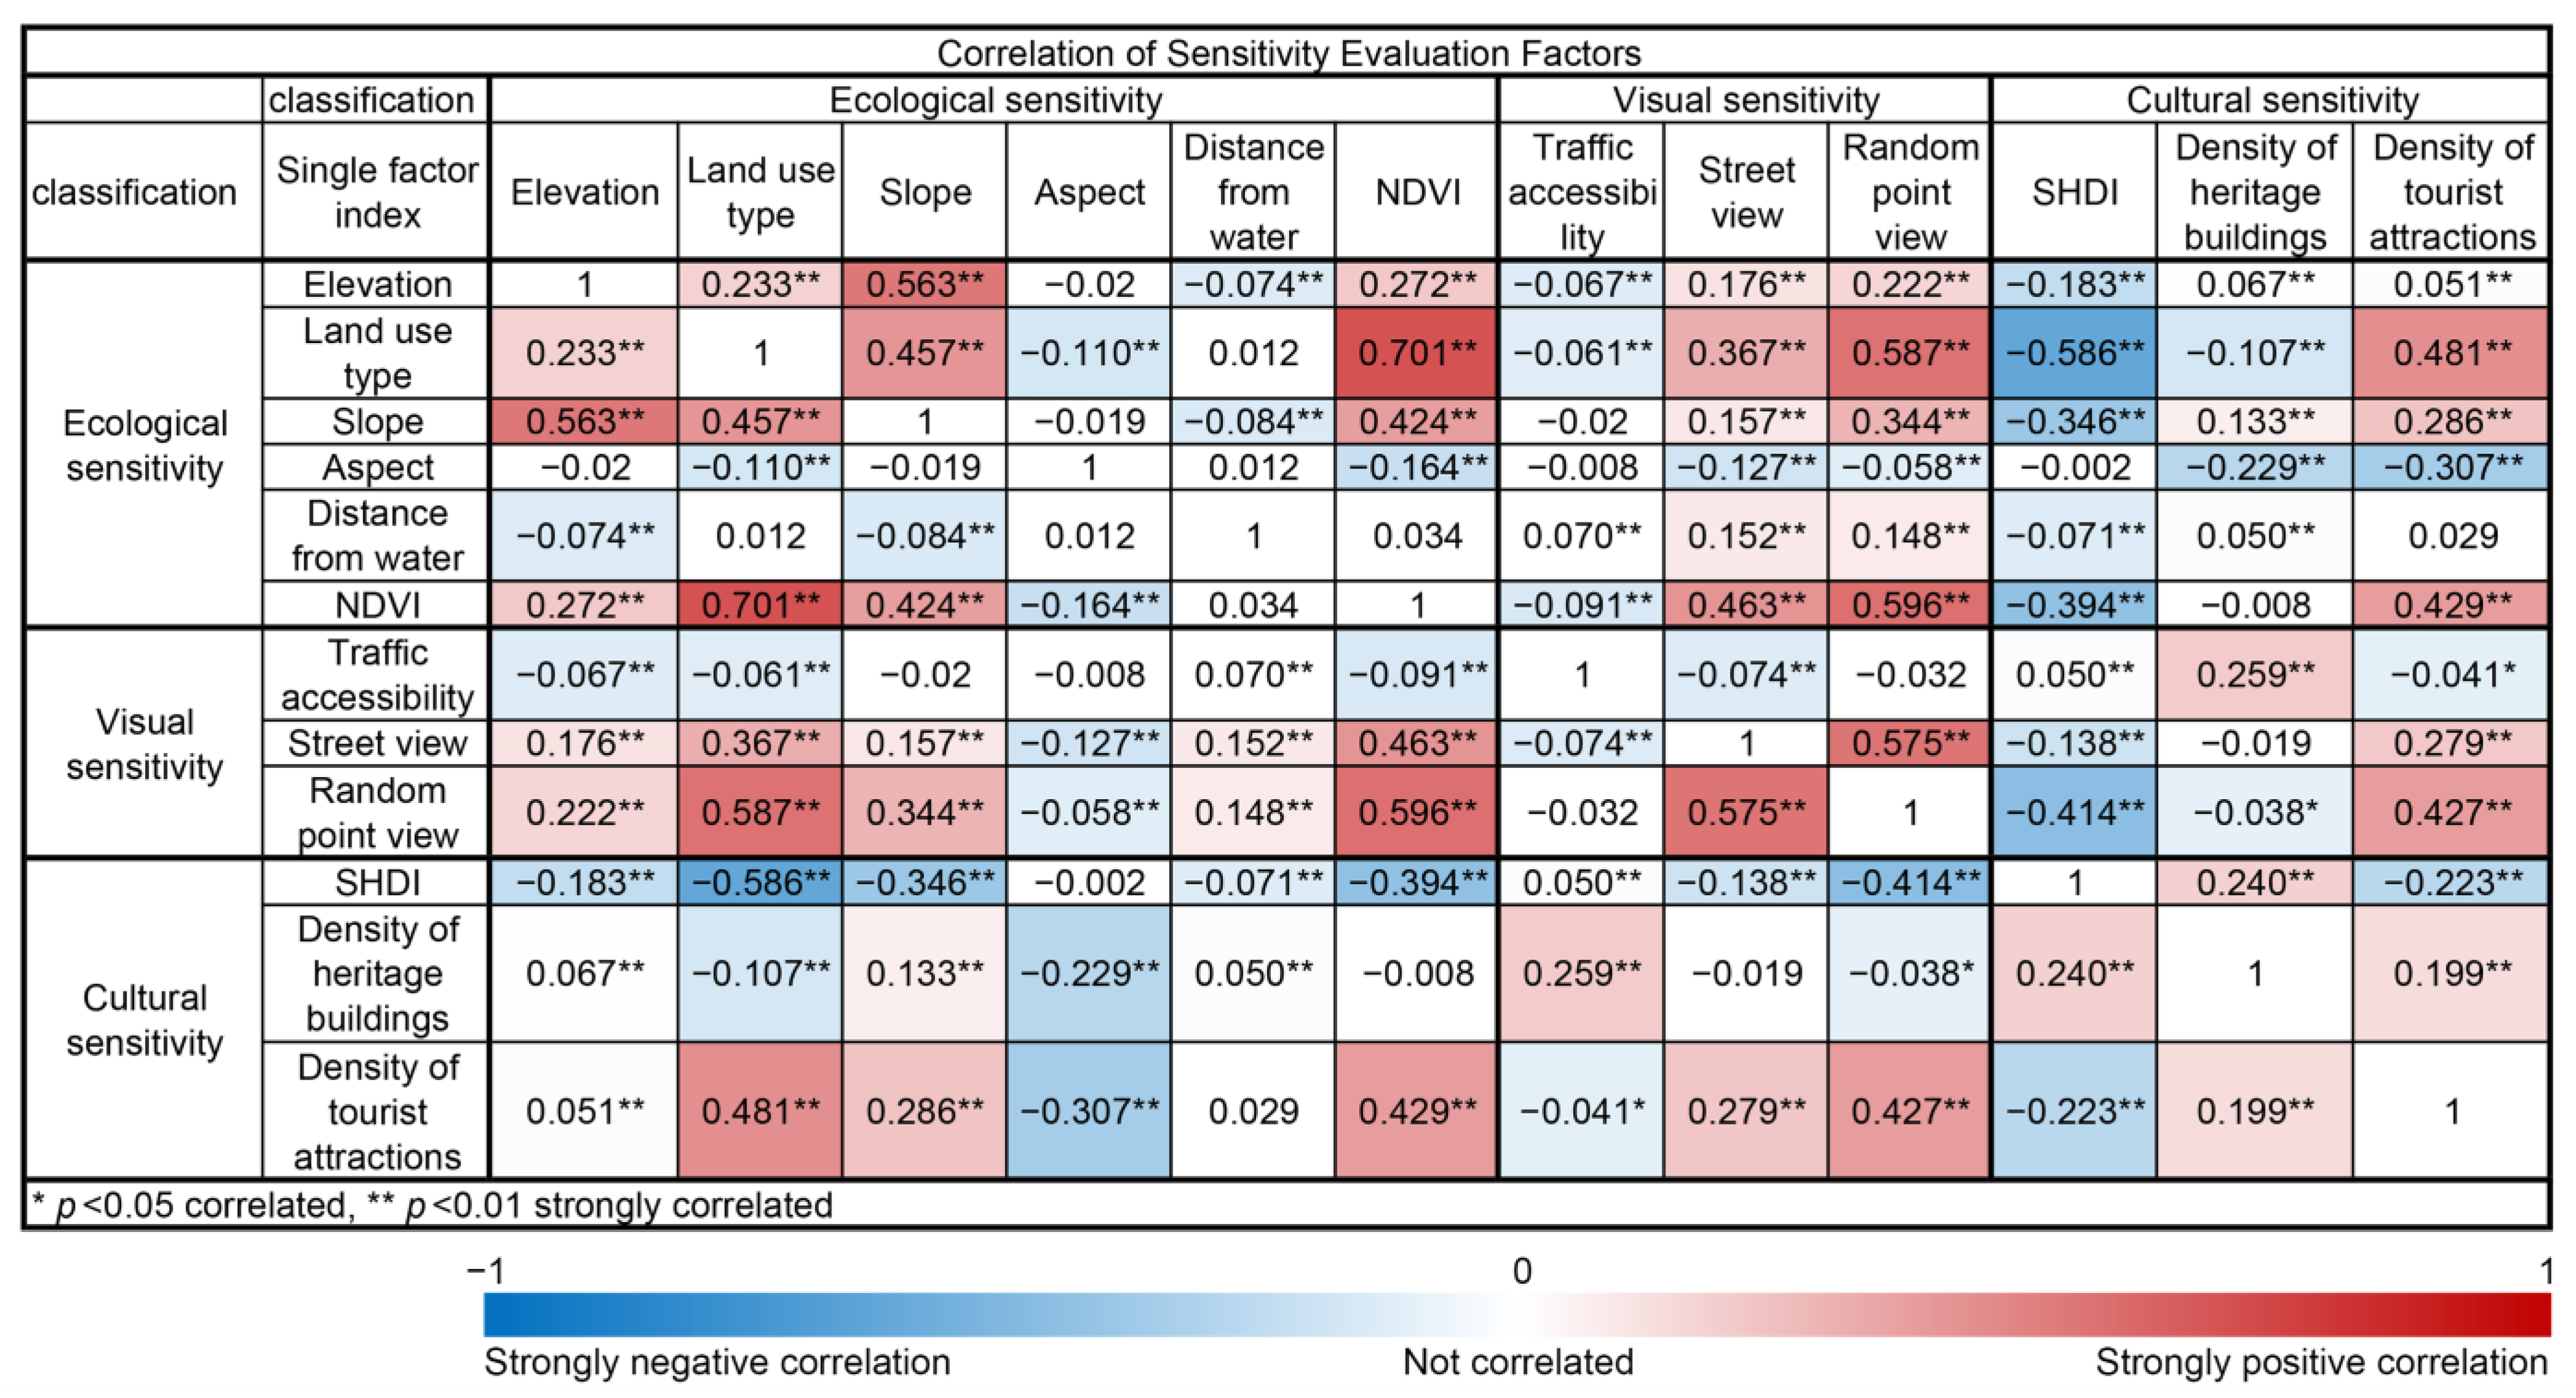
4.2.2. Correlation of Secondary Assessment Factors

The process of landscape change and landscape patterning feed into each other, and many of the assessment factors are highly correlated with each other [50]. A correlation analysis of secondary assessment factors can help us find which changes in assessment factors have more impact (Figure 21) [51].
Most secondary assessment factors were significantly correlated with the other nine assessment factors. Six assessment factors were correlated with eight of the other nine assessment factors: elevation, land use type, street view, random point view, SHDI, and density of tourist attractions. Some of these assessment factors (e.g., elevation) are hardly affected by human activities, so these were not the focus of our attention. Among all secondary assessment factors, three had the highest correlations with others: land use type, NDVI, and random point view, followed by street view and density of tourist attractions. These assessment factors should be taken into consideration in future preservation decisions. For example, if a new building were to be constructed on an existing wooded site, it would change the land use type and NDVI of the site, which would significantly alter the landscape, so new construction should not be allowed. However, changing an existing residential building to a commercial building would change the SHDI of the plot, which would not significantly alter the landscape, so renovation work should be allowed.
SHDI showed a clear negative correlation with most other assessment factors, with the highest negative correlation with land use type (−0.586) and random point view (−0.414). The reason may be that areas with highly sensitive land use types are generally natural landscapes such as planted areas, with fewer buildings. Therefore, urban facilities are not perfect and the SHDI is lower. Areas with higher SHDI have perfect urban facilities and dense buildings, so the visibility of these areas is lower. However, there is a significant positive correlation between SHDI and the density of heritage buildings (0.240). Densely built heritage buildings can drive the development of surrounding areas and make urban facilities perfect. SHDI shows a significant negative correlation with the density of tourist attractions (−0.223), which may be because tourist attractions generally occupy a larger area, which leads to a lack of nearby urban facilities.

5. Conclusions

This study presents a landscape sensitivity assessment framework applicable to historical districts, taking Beishan Street in Hangzhou, China, as an illustrative example. In this study, 12 assessment factors were selected based on the characteristics of the study area. It should be noted that this framework is open to modifications. That is to say, the assessment factors are selected according to the characteristics of the study area. For example, Shi et al. [52] used landscape diversity as an ecological sensitivity assessment factor, and Yang et al. [53] used vegetation uniformity/color diversity as a visual sensitivity assessment factor. These and any other influential indicators can be used as substitutes to replace the assessment factors in the framework of this study. Since the urban landscape is influenced by various factors, no single indicator can fully characterize it, and a comprehensive assessment requires more than 12 factors. However, the 12 assessment factors presented in this study provide a standardized basis for preservation decisions regarding historic districts. For future conservation studies of historical districts, alternative assessment frameworks could be devised by adding or eliminating factors as needed. For example, if the study area is a historic district surrounded by urban residential areas, the sensitivity assessment framework may need to be adjusted accordingly. On the one hand, urban residential areas are flat and not ecologically complex, so the framework would need to be adjusted by deleting assessment factors such as elevation and slope, which show little change, and by reducing the weight of ecological sensitivity in total sensitivity. On the other hand, urban centers have high concentrations of residents and tourists, so it is necessary to add population density and economic vitality as factors in the assessment framework.
Similar to the assessment framework, the method of plot segmentation is adaptable to the characteristics of other study areas. Most previous landscape sensitivity studies have focused on forested landscapes. Therefore, most of them segment plots according to the landscape characteristic categories. In this study, the landscape sensitivity assessment was applied to the historic district, and the Thiessen polygon was chosen to segment plots based on the characteristics of the Beishan Street Historic District. However, other methods of plot segmentation may be more appropriate for other historic districts. For example, a study area where neighboring buildings are naturally bounded by courtyard walls, but these walls may differ from the boundary lines of plots segmented by Thiessen polygons. To analyze this type of study area, the boundary walls can be used directly as plot boundaries, and this approach is generally appropriate for densely developed study areas. In the Beishan Street Historic District, where buildings are scattered and the study area includes larger areas of hill and water, this approach is not appropriate. As another example, if the individual building characters in the study area are not significant, it is not necessary to use each building as the minimum unit for sensitivity analysis. The building function can be used as a criterion to separate the plots so that several neighboring buildings with similar functions can be analyzed as a whole. For example, Xia et al. [54] segment plots based on architectural style, with neighboring buildings of the same architectural style as a whole polygon plot. This approach allows building functions to be quickly identified using POI data.
In recent years, some researchers in related fields have explored the use of open-source data. For example, Cheng et al. [44] used Street View imagery to study the visual perception of streets, and Li et al. [55] used environmental sensor data covering streets to assess urban street walkability. It is worth further exploring how to better use multi-source data to assess landscape sensitivity and provide a basis for conservation decision-making.
In previous studies, Liu and Li [16] and Zheng et al. [19] used the Analytic Hierarchy Process (AHP) method to research landscape resources and landscape sensitivity, and expert judgment to determine the weights of the assessment factors. This study used objective statistical methods to determine the weights of assessment factors, which supplements the subjective expert assessment method used in previous studies. However, cultural elements are an important part of the assessment of historic districts, and they can be subjectively assessed in a more comprehensive way. In this study, ecological and visual dimensions are material factors and the cultural dimension is a non-material factor. In further research, material and non-material factors should be superimposed by using a combination of subjective and objective weight calculation methods.
Most previous studies related to landscape sensitivity assessment produced sensitivity maps and comparisons of land plot sensitivity within the study area. Based on this, this study compares the correlation of assessment factors in another dimension with the help of correlation analysis in statistics. This study reveals the interrelationships among various assessment factors and recommends prioritizing those with strong correlations in the renovation and construction process of historic districts.

Author Contributions

Conceptualization, Jie Shen; methodology, Xueyan Yang and Jie Shen; software, Xueyan Yang; validation, Xueyan Yang; formal analysis, Xueyan Yang and Jie Shen; investigation, Xueyan Yang; resources, Xueyan Yang; data curation, Xueyan Yang; writing—original draft preparation, Xueyan Yang; writing—review and editing, Jie Shen and Xueyan Yang; visualization, Xueyan Yang; supervision, Jie Shen; project administration, Jie Shen; funding acquisition, Jie Shen. All authors have read and agreed to the published version of the manuscript.

Funding

This research was funded by Center for Balance Architecture, Zhejiang University (grant number K-20212936).

Data Availability Statement

Data are contained within the article.

Acknowledgments

We would like to acknowledge the support from Center for Balance Architecture, Zhejiang University.

Conflicts of Interest

The authors declare no conflict of interest. The funders had no role in the design of the study; in the collection, analyses, or interpretation of data; in the writing of the manuscript; or in the decision to publish the results.

References

  1. Loo, S. Urban conservation policy and the preservation of historical and cultural heritage. Cities 1996, 13, 399–409. [Google Scholar]
  2. Haddad, N.A.; Fakhoury, L.A.; Akasheh, T.S. Notes on anthropogenic risks mitigation management and recovery of ancient theatres’ heritage. J. Cult. Herit. Manag. Sustain. Dev. 2018, 8, 222–256. [Google Scholar] [CrossRef]
  3. Romana Lugeri, F.; Farabollini, P.; Lugeri, N. Landscape analysis as a tool for risk reduction. AIMS Geosci. 2019, 5, 617–630. [Google Scholar] [CrossRef]
  4. Council of Europe. European Landscape Convention; European Treaty Series; Council of Europe: Florence, Italy, 2000; Volume 176, p. 2. [Google Scholar]
  5. Bettoni, M.; Maerker, M.; Bosino, A.; Schillaci, C.; Vogel, S. Bibliometric Analysis of Soil and Landscape Stability, Sensitivity and Resistivity. Land 2022, 11, 1328. [Google Scholar] [CrossRef]
  6. Brunsden, D.; Thornes, J. Landscape sensitivity and change. Trans. Inst. Br. Geogr. 1979, 463–484. [Google Scholar] [CrossRef]
  7. Haara, A.; Store, R.; Leskinen, P. Analyzing uncertainties and estimating priorities of landscape sensitivity based on expert opinions. Landsc. Urban Plan. 2017, 163, 56–66. [Google Scholar] [CrossRef]
  8. Bogovac, L.; Butula, S.; Andlar, G.; Tomić Reljić, D. Approaches to landscape evaluation: Questioning examining landscape vulnerability and sensitivity of the Island of Rab. Geoadria 2021, 26, 35–58. [Google Scholar] [CrossRef]
  9. Tompkins, A. Oxfordshire Historic Landscape Characterisation Project; Archaeology Team Oxfordshire County Council: Oxford, UK, 2017; pp. 378–413. [Google Scholar]
  10. Collins, S.; Aldred, O.; Turner, S. Tyne and Wear Historic Landscape Characterisation Final Report; Number 4663; English Heritage Project: Tyne and Wear, UK, 2014; pp. 93–105. [Google Scholar]
  11. Mamat, K.; Du, P.; Ding, J. Ecological function regionalization of cultural heritage sites in Turpan, China, based on GIS. Arab. J. Geosci. 2017, 10, 90. [Google Scholar] [CrossRef]
  12. Natural England. An Approach to Landscape Character Assessment; Natural England: London, UK, 2014; p. 12. [Google Scholar]
  13. Fang, Y.-N.; Zeng, J.; Namaiti, A. Landscape Visual Sensitivity Assessment of Historic Districts—A Case Study of Wudadao Historic District in Tianjin, China. ISPRS Int. J. Geo-Inf. 2021, 10, 175. [Google Scholar] [CrossRef]
  14. Wang, Z.; Ma, D.; Sun, D.; Zhang, J. Identification and analysis of urban functional area in Hangzhou based on OSM and POI data. PLoS ONE 2021, 16, e0251988. [Google Scholar] [CrossRef]
  15. Fairclough, G. Historic Landscape Characterisation Template Project Design. In For EH-Supported County-Wide HLC Project; Characterisation Team English Heritage: London, UK, 2002; pp. 10–13. [Google Scholar]
  16. Liu, Y.; Li, L. Mountainous City Featured Landscape Planning Based on GIS-AHP Analytical Method. ISPRS Int. J. Geo-Inf. 2020, 9, 211. [Google Scholar] [CrossRef]
  17. Warnock, S.; Griffiths, G. Landscape Characterisation: The Living Landscapes Approach in the UK. Landsc. Res. 2014, 40, 261–278. [Google Scholar] [CrossRef]
  18. Manolaki, P.; Zotos, S.; Vogiatzakis, I.N. An integrated ecological and cultural framework for landscape sensitivity assessment in Cyprus. Land Use Policy 2020, 92, 104336. [Google Scholar] [CrossRef]
  19. Zheng, Y.; Lan, S.; Chen, W.Y.; Chen, X.; Xu, X.; Chen, Y.; Dong, J. Visual sensitivity versus ecological sensitivity: An application of GIS in urban forest park planning. Urban For. Urban Green. 2019, 41, 139–149. [Google Scholar] [CrossRef]
  20. Sik, Y.J.; Yoon, B.-D.; Kim, K.H.; Hoon, C. Comparative Study of View Point Types on Landscape Evaluation. Int. J. Civ. Environ. Eng. 2012, 6, 959–964. [Google Scholar]
  21. Lee, M.-C. Emerging Trends in Geospatial Technologies for Study of Urban Landscape. In Proceedings of the Council of Educators in Landscape Architecture, Blacksburg, VA, USA, 21–24 March 2018. [Google Scholar]
  22. Store, R.; Karjalainen, E.; Haara, A.; Leskinen, P.; Nivala, V. Producing a sensitivity assessment method for visual forest landscapes. Landsc. Urban Plan. 2015, 144, 128–141. [Google Scholar] [CrossRef]
  23. Llopis, J.; Torres, A.; Serra, J.; García, Á. The preservation of the chromatic image of historical cities as a cultural value. The old city of Valencia (Spain). J. Cult. Herit. 2015, 16, 611–622. [Google Scholar] [CrossRef]
  24. Johnson, C.E.; Germano, V. Evaluating the adaptive capacity of cultural landscapes to climate change: Incorporating site-specific knowledge in National Park Service vulnerability assessments. Parks Steward. Forum 2020, 36, 49–56. [Google Scholar] [CrossRef]
  25. Herring, P.C. Framing Perceptions of the Historic Landscape: Historic Landscape Characterisation (HLC) and Historic Land-Use Assessment (HLA). Scott. Geogr. J. 2009, 125, 61–77. [Google Scholar] [CrossRef]
  26. Field, C.B.; Barros, V.R.; Dokken, D.J.; Mach, K.J.; Mastrandrea, M.D. Climate Change 2014 Impacts, Adaptation, and Vulnerability Part A: Global and Sectoral Aspects; Intergovernmental Panel on Climate Change, Cambridge University: Cambridge, UK, 2014; pp. 709–754. [Google Scholar]
  27. Pierik, H.J. Landscape changes and human–landscape interaction during the first millennium AD in the Netherlands. Neth. J. Geosci. 2021, 100, e11. [Google Scholar] [CrossRef]
  28. Zhu, T.; Yu, K.; Wang, B. Spatial Distribution Characteristics and Influencing Factors of Cultural and Tourism Resources in Xihu District of Hangzhou. Sustainability 2023, 15, 10978. [Google Scholar] [CrossRef]
  29. The People’s Government of Zhejiang Province. Zhejiang Provincial People’s Government on the Announcement of the Fifth Batch of Zhejiang Province Historical and Cultural Towns and Villages Neighborhood List Notice. Available online: https://www.zj.gov.cn/art/2016/7/18/art_1229017138_64593.html (accessed on 28 March 2023).
  30. Ministry of Housing and Urban-Rural Development of the People’s Republic of China. GB50180-2018; Urban Residential Area Planning and Design Standards. Ministry of Housing and Urban-Rural Development of the People’s Republic of China: Beijing, China, 2018; p. 5.
  31. Wang, F.; Qu, X. The study of urban landscape visual sensitivity assessments: A case study in the Zhongshan District of Dalian. J. Spat. Sci. 2018, 63, 325–340. [Google Scholar] [CrossRef]
  32. Pedrinis, F.; Samuel, J.; Appert, M.; Jacquinod, F.; Gesquière, G. Exploring Landscape Composition Using 2D and 3D Open Urban Vectorial Data. ISPRS Int. J. Geo-Inf. 2022, 11, 479. [Google Scholar] [CrossRef]
  33. Luo, T.; Liu, X.; Zhang, J.; Wei, H. An Analysis Study of the Impact of Urbanization on Rainfall in Wuhan. IOP Conf. Ser. Earth Environ. Sci. 2020, 455, 012205. [Google Scholar] [CrossRef]
  34. Kryvobokov, M. Hedonic price model: Defining neighbourhoods with Thiessen polygons. Int. J. Hous. Mark. Anal. 2013, 6, 79–97. [Google Scholar] [CrossRef]
  35. Yuan, C.; Geng, X.; Mao, X. Taxi High-Income Region Recommendation and Spatial Correlation Analysis. IEEE Access 2020, 8, 139529–139545. [Google Scholar] [CrossRef]
  36. Diakoulaki, D.; Mavrotas§, G.; Papayannakis, L. Determining objective weights in multiple criteria problems: The CRITIC method. Comput. Oper. Res. 1995, 22, 763–770. [Google Scholar] [CrossRef]
  37. Mukhametzyanov, I. Specific character of objective methods for determining weights of criteria in MCDM problems: Entropy, CRITIC and SD. Decis. Mak. Appl. Manag. Eng. 2021, 4, 76–105. [Google Scholar] [CrossRef]
  38. Miaoyi, L.; Zhenjiang, S.; Tao, Y.; Jingyuan, W.; Fumihiko, K. Application of spatial and temporal entropy based on multivariate data for measuring the degree of urban function mix. China City Plan. Rev. 2015, 2015, 40–48. [Google Scholar] [CrossRef]
  39. Ministry of Ecology and Environment of the People’s Republic of China; Chinese Academy of Sciences. National Ecological Function Zoning; Ministry of Ecology and Environment of the People’s Republic of China; Chinese Academy of Sciences: Beijing, China, 2015; p. 12. [Google Scholar]
  40. Tsou, J.; Gao, Y.; Zhang, Y.; Genyun, S.; Ren, J.; Li, Y. Evaluating Urban Land Carrying Capacity Based on the Ecological Sensitivity Analysis: A Case Study in Hangzhou, China. Remote Sens. 2017, 9, 529. [Google Scholar] [CrossRef]
  41. Yilmaz, F.C.; Zengin, M.; Tekin Cure, C. Determination of ecologically sensitive areas in Denizli province using geographic information systems (GIS) and analytical hierarchy process (AHP). Environ. Monit. Assess. 2020, 192, 589. [Google Scholar] [CrossRef] [PubMed]
  42. Özhanci, E.; Yilmaz, H. Sensitivity analysis in landscape ecological planning; the sample of Bayburt. Bursa Uludağ Üniversitesi Ziraat Fakültesi Derg. 2018, 32, 77–98. [Google Scholar]
  43. Qi, J.; Zhang, Y.; Zhang, J.; Chen, Y.; Wu, C.; Duan, C.; Cheng, Z.; Pan, Z. Research on the Evaluation of Geological Environment Carrying Capacity Based on the AHP-CRITIC Empowerment Method. Land 2022, 11, 1196. [Google Scholar] [CrossRef]
  44. Cheng, L.; Chu, S.; Zong, W.; Li, S.; Wu, J.; Li, M. Use of Tencent Street View Imagery for Visual Perception of Streets. ISPRS Int. J. Geo-Inf. 2017, 6, 265. [Google Scholar] [CrossRef]
  45. MARTI, M.; José, M. Public space and the development of new city centers: The case of Hangzhou. In Proceedings of the International Conference on Urban Futures-Squaring Circles: Europe, China and the World in 2050, Lisbon, Portugal, 10 October 2014; pp. 10–11. [Google Scholar]
  46. Silitonga, S. Walkability; The Relationship of Walking Distance, Walking Time and Walking Speed. J. Rekayasa Konstr. Mek. Sipil (JRKMS) 2020, 3, 19–26. [Google Scholar] [CrossRef]
  47. Llobera, M. Extending GIS-based visual analysis: The concept of visualscapes. Int. J. Geogr. Inf. Sci. 2003, 17, 25–48. [Google Scholar] [CrossRef]
  48. Palmer, J.F. The contribution of a GIS-based landscape assessment model to a scientifically rigorous approach to visual impact assessment. Landsc. Urban Plan. 2019, 189, 80–90. [Google Scholar] [CrossRef]
  49. He, J.; Li, X.; Liu, P.; Wu, X.; Zhang, J.; Zhang, D.; Liu, X.; Yao, Y. Accurate Estimation of the Proportion of Mixed Land Use at the Street-Block Level by Integrating High Spatial Resolution Images and Geospatial Big Data. IEEE Trans. Geosci. Remote Sens. 2021, 59, 6357–6370. [Google Scholar] [CrossRef]
  50. Wang, Q.; Malanson, G.P. Patterns of Correlation Among Landscape Metrics. Phys. Geogr. 2013, 28, 170–182. [Google Scholar] [CrossRef]
  51. Hauke, J.; Kossowski, T. Comparison of Values of Pearson’s and Spearman’s Correlation Coefficients on the Same Sets of Data. Quageo 2011, 30, 87–93. [Google Scholar] [CrossRef]
  52. Shi, Y.; Wang, N.; Li, T.; Wang, H.; Kang, H.; Shi, X. Evaluation of Landscape Ecological Integrity in the Yulin Region, China. Sustainability 2018, 10, 4300. [Google Scholar] [CrossRef]
  53. Yang, H.; Li, Y.; Zhang, Z.; Xu, Z.; Huang, X. GIS-Based Multi-Criteria Assessment and Seasonal Impact on Plantation Forest Landscape Visual Sensitivity. Forests 2019, 10, 297. [Google Scholar] [CrossRef]
  54. Xia, S.; Liu, B.; Wang, H. Construction of a Sustainability-Based Building Attribute Conservation Assessment Model in Historic Areas. Buildings 2022, 12, 1346. [Google Scholar] [CrossRef]
  55. Li, Y.; Yabuki, N.; Fukuda, T. Integrating GIS, deep learning, and environmental sensors for multicriteria evaluation of urban street walkability. Landsc. Urban Plan. 2023, 230, 104603. [Google Scholar] [CrossRef]
Figure 1. Superposition of urban elements and basis of sensitivity analysis.
Ijgi 12 00462 g001
Figure 2. (a) Study area location; (b) study area.
Ijgi 12 00462 g002
Figure 3. (a) 3D model perspective and (b) 3D model plan of study area.
Ijgi 12 00462 g003
Figure 4. Plot separation by Thiessen polygons.
Ijgi 12 00462 g004
Figure 5. Weight averaging method for calculating total sensitivity level of a plot.
Ijgi 12 00462 g005
Figure 6. Landscape sensitivity assessment framework.
Ijgi 12 00462 g006
Figure 7. Sensitivity maps: (a) elevation; (b) land use type; (c) slope; (d) aspect; (e) distance from water; (f) NDVI.
Ijgi 12 00462 g007
Figure 8. Land use types and photos of major types.
Ijgi 12 00462 g008
Figure 9. Landscape ecological sensitivity map.
Ijgi 12 00462 g009
Figure 10. Sensitivity maps: (a) traffic accessibility; (b) street view; (c) random point view.
Ijgi 12 00462 g010
Figure 11. Landscape visual sensitivity map.
Ijgi 12 00462 g011
Figure 12. Sensitivity maps: (a) SHDI; (b) heritage building density; (c) tourist attraction density.
Ijgi 12 00462 g012
Figure 13. Landscape cultural sensitivity map.
Ijgi 12 00462 g013
Figure 14. (a) Tourist attractions map; (b) rowboat sighting analysis.
Ijgi 12 00462 g014
Figure 15. Sensitivity weight.
Ijgi 12 00462 g015
Figure 16. Landscape total sensitivity map.
Ijgi 12 00462 g016
Figure 17. Maps of landscape sensitivity levels of plots: (a) ecological (b) visual; (c) cultural; (d) total.
Ijgi 12 00462 g017
Figure 18. Proportion of plots at each sensitivity level in maps of (a) study area; (b) Beishan Street Historic District.
Ijgi 12 00462 g018
Figure 19. Detailed map of landscape total sensitivity levels of plots.
Ijgi 12 00462 g019
Figure 20. Influence relationship of primary assessment factors.
Ijgi 12 00462 g020
Figure 21. Correlation of secondary assessment factors.
Ijgi 12 00462 g021
Table 1. Numbers of historic buildings at each protection level in Beishan Street Historic District.
Protection LevelNumber of Historic Buildings
In HangzhouIn Beishan Street Historic District
National-level Key Cultural Relics Protection UnitHighest level464
Provincial-level Cultural Relics Protection UnitSecond highest level291
City-level Cultural Relics Protection UnitThird highest level3625
City-level Cultural Relics Protection SiteFourth highest level24114
City-level Historical BuildingLowest level39920
Total 107744
Table 2. Criteria and weights of ecological sensitivity.
Assessment FactorEvaluation StandardLevelScoreWeight
Elevation (m)(300, +∞)Very high43.17%
(100, 300]High3
(50, 100]Moderate2
[0, 50]Low1
Land use typePermanent water bodies, herbaceous wetland, tree coverVery high426.70%
Grassland, shrublandHigh3
Cropland, bare/sparse vegetationModerate2
Build-upLow1
Slope (°)(25°, 90°]Very high49.75%
(15°, 25°]High3
(5°, 15°]Moderate2
[0°, 5°]Low1
Aspect (°)North [0°, 22.5°] and [337.5°, 360°]Very high426.66%
Northeast (22.5°, 67.5°), northwest (292.5°, 337.5°)High3
East [67.5°, 112.5°], west [247.5°, 292.5°], southeast (112.5°, 157.5°), southwest (202.5°, 247.5°)Moderate2
Flat (= −1), South [157.5°, 202.5°]Low1
Distance from water (m)= 0Very high425.45%
(0, 30]High3
(30, 100]Moderate2
(100, +∞)Low1
NDVI(0.5, +∞)Very high48.28%
[−1, 0]High3
(0.3, 0.5]Moderate2
(0, 0.3]Low1
Table 3. Criteria and weights of visual sensitivity.
Assessment FactorEvaluation StandardLevelScoreWeight
Traffic accessibility (minutes)(0, 5]Very high458.40%
(5, 15]High3
(15, 30]Moderate2
(30, +∞]Low1
Street view (points/300 points)(200, 300]Very high419.83%
(100, 200]High3
(0, 100]Moderate2
= 0Low1
Random point view (points/300 points)(120, 180]Very high421.77%
(60, 120]High3
(0, 60]Moderate2
= 0Low1
Table 4. Criteria and weights of cultural sensitivity.
Assessment FactorEvaluation StandardLevelScoreWeight
SHDI(1.45, 2.35]Very high447.97%
(0.93, 1.45]High3
(0.32, 0.93]Moderate2
(0, 0.32]Low1
= 0No0
Density of heritage buildings (/square kilometers)(0.000017199, 0.000022932]Very high423.30%
(0.000011466, 0.000017199]High3
(0.000005733, 0.000011466]Moderate2
[0, 0.000005733]Low1
Density of tourist attractions (/square kilometers)(0.000099353, 0.000132471]Very high428.72%
(0.000066236, 0.000099353]High3
(0.000033118, 0.000066236]Moderate2
[0, 0.000033118]Low1
Table 5. Historic buildings located in highly sensitive plots.
Protection Level *NameTimeType
National-level Key Cultural Relics Protection UnitYue Fei TempleSouthern Song Dynasty (1127–1279)Celebrity cemetery
Former site of the May Fourth Constitution drafted1930sCelebrity home
City-level Cultural Relics Protection SiteJOBS TempleTang Dynasty (831)Religious building
Qiushui Villa1925sCelebrity home
City-level Historical BuildingBodhi Essence Temple1926Religious building
Huang Binhong’s former residence1948Celebrity home
OthersBaopu Taoist TempleEastern Jin Dynasty (317–420)Religious building
Curved Yard and Lotus Pool in SummerQing Dynasty (1636–1912)Stele
Chang Home1930sCelebrity home
No name Home1931Celebrity home
Ziyun Alley1920sResidential
Totsun Tower Courtyard1912–1949Residential
* Order of protection levels refers to the introduction of Table 1 in Section 2.1.
Table 6. Historic buildings mostly located on highly sensitive plots.
Protection Level *NameTimeType
City-level Cultural Relics Protection SiteZhejiang-Jiangxi Railway Bureau1948Government office
City-level Historical BuildingSui Cottage1922Celebrity home
Villa No. 95, Beishan Street
(Jiang Manfeng’s former residence)
1934Celebrity home
Jiyi Building1930sCelebrity home
Pan Home1930sCelebrity home
OthersYue Cottage1920sCelebrity home
Hangzhou Hotel1955Featured restaurant
* Order of protection levels refers to the introduction of Table 1 in Section 2.1.
Disclaimer/Publisher’s Note: The statements, opinions and data contained in all publications are solely those of the individual author(s) and contributor(s) and not of MDPI and/or the editor(s). MDPI and/or the editor(s) disclaim responsibility for any injury to people or property resulting from any ideas, methods, instructions or products referred to in the content.

