Article

Climate Change, Forest Fires, and Territorial Dynamics in the Amazon Rainforest: An Integrated Analysis for Mitigation Strategies

by
Nathalia Celis
1,*,
Alejandro Casallas
2,
Ellie Anne Lopez-Barrera
3,
Martina Felician
4,
Massimo De Marchi
1 and
Salvatore E. Pappalardo
1
1
Department of Civil, Environmental and Architectural Engineering, University of Padova, 35100 Padova, Italy
2
Earth System Physics, Abdus Salam International, Centre for Theoretical Physics, 34151 Trieste, Italy
3
School of Exact Sciences and Engineering, Sergio Arboleda University, Bogotá 110110, Colombia
4
World Wildlife Fund (WWF), 34151 Trieste, Italy
*
Author to whom correspondence should be addressed.
ISPRS Int. J. Geo-Inf. 2023, 12(10), 436; https://doi.org/10.3390/ijgi12100436
Submission received: 5 September 2023 / Revised: 12 October 2023 / Accepted: 20 October 2023 / Published: 23 October 2023

Abstract

:
Recent times have witnessed wildfires causing harm to both ecological communities and urban–rural regions, underscoring the necessity to comprehend wildfire triggers and assess measures for mitigation. This research hones in on Cartagena del Chairá, diving into the interplay between meteorological conditions and land cover/use that cultivates a conducive environment for wildfires. Meteorologically, the prevalence of wildfires is concentrated during boreal winter, characterized by warm and dry air, strong winds, and negligible precipitation. Additionally, wildfires gravitate toward river-adjacent locales housing agriculture-linked shrubs, notably in the northern part of the zone, where a confluence of land attributes and meteorological factors synergize to promote fire incidents. Employing climate scenarios, we deduced that elevated temperature and reduced humidity augment wildfire susceptibility, while wind speed and precipitation discourage their propagation across most scenarios. The trajectory toward a warmer climate could instigate fire-friendly conditions in boreal summer, indicating the potential for year-round fire susceptibility. Subsequently, via machine-learning-driven sensitivity analysis, we discerned that among the scrutinized socio-economic variables, GINI, low educational attainment, and displacement by armed groups wield the most substantial influence on wildfire occurrence. Ultimately, these findings converge to shape proposed wildfire mitigation strategies that amalgamate existing practices with enhancements or supplementary approaches.

1. Introduction

The Amazon Basin holds immense significance on a global scale due to its exceptional biodiversity, vital role as a carbon sink, and its contribution to climate regulation [1]. The Intergovernmental Panel on Climate Change (IPCC) has projected that temperatures in tropical forests could potentially rise by up to 4.8 °C by the end of this century [2], a change exacerbated by both direct and indirect drivers of deforestation influenced by a complex interplay of factors, including land use, demographics, economics, politics, and institutions [3]. In Colombia, approximately 40% of the land is covered by Amazonian rainforest, spanning an area of roughly 483,164 km2 divided into three sub-regions with distinct relief patterns [4]. The ecosystems and environment of the Colombian Amazon encompass various biomes, with the tropical rainforest biome being dominant at 64.9% [5], followed by Litobiomas at 14.5%, Helobiomas at 12%, and Peinobiomas at 12% [4]. The Peinobiomas cover an additional 3.4%, while the Orobiomas cover 4.7% across the low, medium, and high mountain areas of the three sub-regions [4].
The climate of the Colombian Amazon is shaped by the Intertropical Convergence Zone (ITCZ), as pointed out by [5]. Within this region, the typical temperature ranges between approximately 24 °C and 29 °C, accompanied by a relative humidity surpassing 85%. Sunlight exposure lasts around 4 h per day [6]. While the government has monitored the Amazon area as a protective buffer to safeguard national sovereignty, as highlighted by [7], challenges have arisen due to the considerable geographical separation between the central governing body and the obstructive mountainous terrain, resulting in inadvertent neglect of the zone in terms of governance. The aforementioned meteorological factors play an essential role in comprehending the underlying forces behind forest fires, which leads to enhanced policy-making and planning strategies. However, in isolation, they fall short of fully elucidating the genesis of wildfires. Their interpretation necessitates a synergistic consideration alongside land cover, land use, and, notably, socio-economic factors, as emphasized by [8]. The occurrence of fires is predominantly contingent upon the intricate interplay of these four dimensions, which is why wildfires should be studied in a framework that includes these four dimensions.
Understanding the meteorological factors that drive forest fires is of utmost importance for comprehending the origins, patterns, and dynamics of these catastrophic incidents. A myriad of factors can initiate forest fires, spanning from natural occurrences like lightning strikes to human actions, including negligence, deliberate ignition, and industrial operations. Meteorology plays a central role in shaping the behavior, progression, and intensity of forest fires. Weather elements like temperature, humidity, wind velocity, and atmospheric stability exert a direct influence on fire conduct, ignition potential, and the extent of fire spread [9]. The nature of the land’s covering significantly guides the course of forest fires by directly molding the conditions and mechanics of fire propagation. Certain attributes of land covering, such as thick vegetation, desiccated fuel loads, and proximity to human habitations, frequently exacerbate forest fires ([10,11]). Regions with copious fuel sources like fallen leaves, branches, and dense undergrowth supply ample material for fires to ignite and rapidly extend [12].
Furthermore, socio-economic aspects, encompassing population growth and Gross Domestic Product (GDP), are critical to incorporate, as they contribute to the expansion of human settlements into fire-prone areas, leading to what is termed the wildland–urban interface. This juncture amplifies the fire potential, as human structures intermingle with flammable vegetation. Additionally, economic incentives like timber demand, agricultural yields, and land requisition for diverse purposes can drive practices that escalate fire susceptibility, including subpar forest management and unsustainable land utilization ([13,14]). Factors like colonization trends, drug-related influences, and the aftermath of peace agreements also warrant consideration ([8,15]). All these facets assume significance because forest fires in the Amazon rainforest predominantly stem from both natural and human causes, forming a multi-layered process. The emergence and progression of uncontrollable fires disrupt the ecosystem [15], with far-reaching consequences for both the ecosystem and the global climate. In general, although natural forces, such as lightning strikes, can initiate fires in dense vegetation during arid periods, the majority of Amazon Forest fires are a consequence of human activities, particularly deforestation and the expansion of agriculture and livestock grazing (highlighting the importance of land cover). Practices like slash-and-burn land clearance, coupled with extended droughts and the use of fire for pasture management, intensify the susceptibility and dissemination of fires [16].
These factors would become more pronounced in a climate change context, as changes in atmospheric conditions might create a more conducive environment for the initiation and propagation of fires. This underscores the importance of comprehending the current triggers of wildfires to establish effective policies, develop strategies, and mitigate the occurrence of fires. Something that can be achieved by employing Machine Learning (ML) models offers a method to assess the significance of these triggers and appraise policy effectiveness. Ref. [13] designed three distinct land cover scenarios to gauge potential impacts on the Amazon Forest. These endeavors lay a foundation not only for evaluating diverse scenarios that encompass socio-economic factors, land cover characteristics, and meteorological conditions but also for discerning the potency of each variable in influencing the likelihood of wildfire ignition. On the other hand, Ref. [17] evaluated the incidence of spatial and temporal patterns of vegetation burning in Colombia with regional and climatic variations. The results indicated a strong climatic and fire seasonality, as well as a marked regional difference. In Amazonia, they established a high impact of small fires in the tropical rainforest present in this transition zone, and the Amazon rainforest deserves more attention in Colombia due to its lack of attention prior to its contribution to climate change.
Taking into account all the significant factors discussed earlier, our primary focus shifts towards (i) identifying the specific meteorological and land cover/use conditions prevailing during the onset of wildfires in Cartagena del Chairá, which is located in the Amazon and has one of the largest number of fires in the region. (ii) Recognizing the role of meteorology, it is imperative to assess its potential alterations in a warmer climate. This has driven us to undertake a climate change analysis aimed at quantifying the extent of meteorological deviations projected for 2049. This endeavor aims to provide a foundational understanding of governmental actions to mitigate fire-related risks. (iii) In tandem with the preceding analysis, we ascertain the most influential socio-economic variables (among those examined) that contribute to the propensity for fire ignition. By grasping the intricate interplay between meteorology, land cover/use, socio-economic factors, and climate dynamics, we then (iv) propose strategies that align with governmental plans. These strategies are designed either to enhance existing plans or to be synergistically combined with already established approaches.

2. Materials and Methods
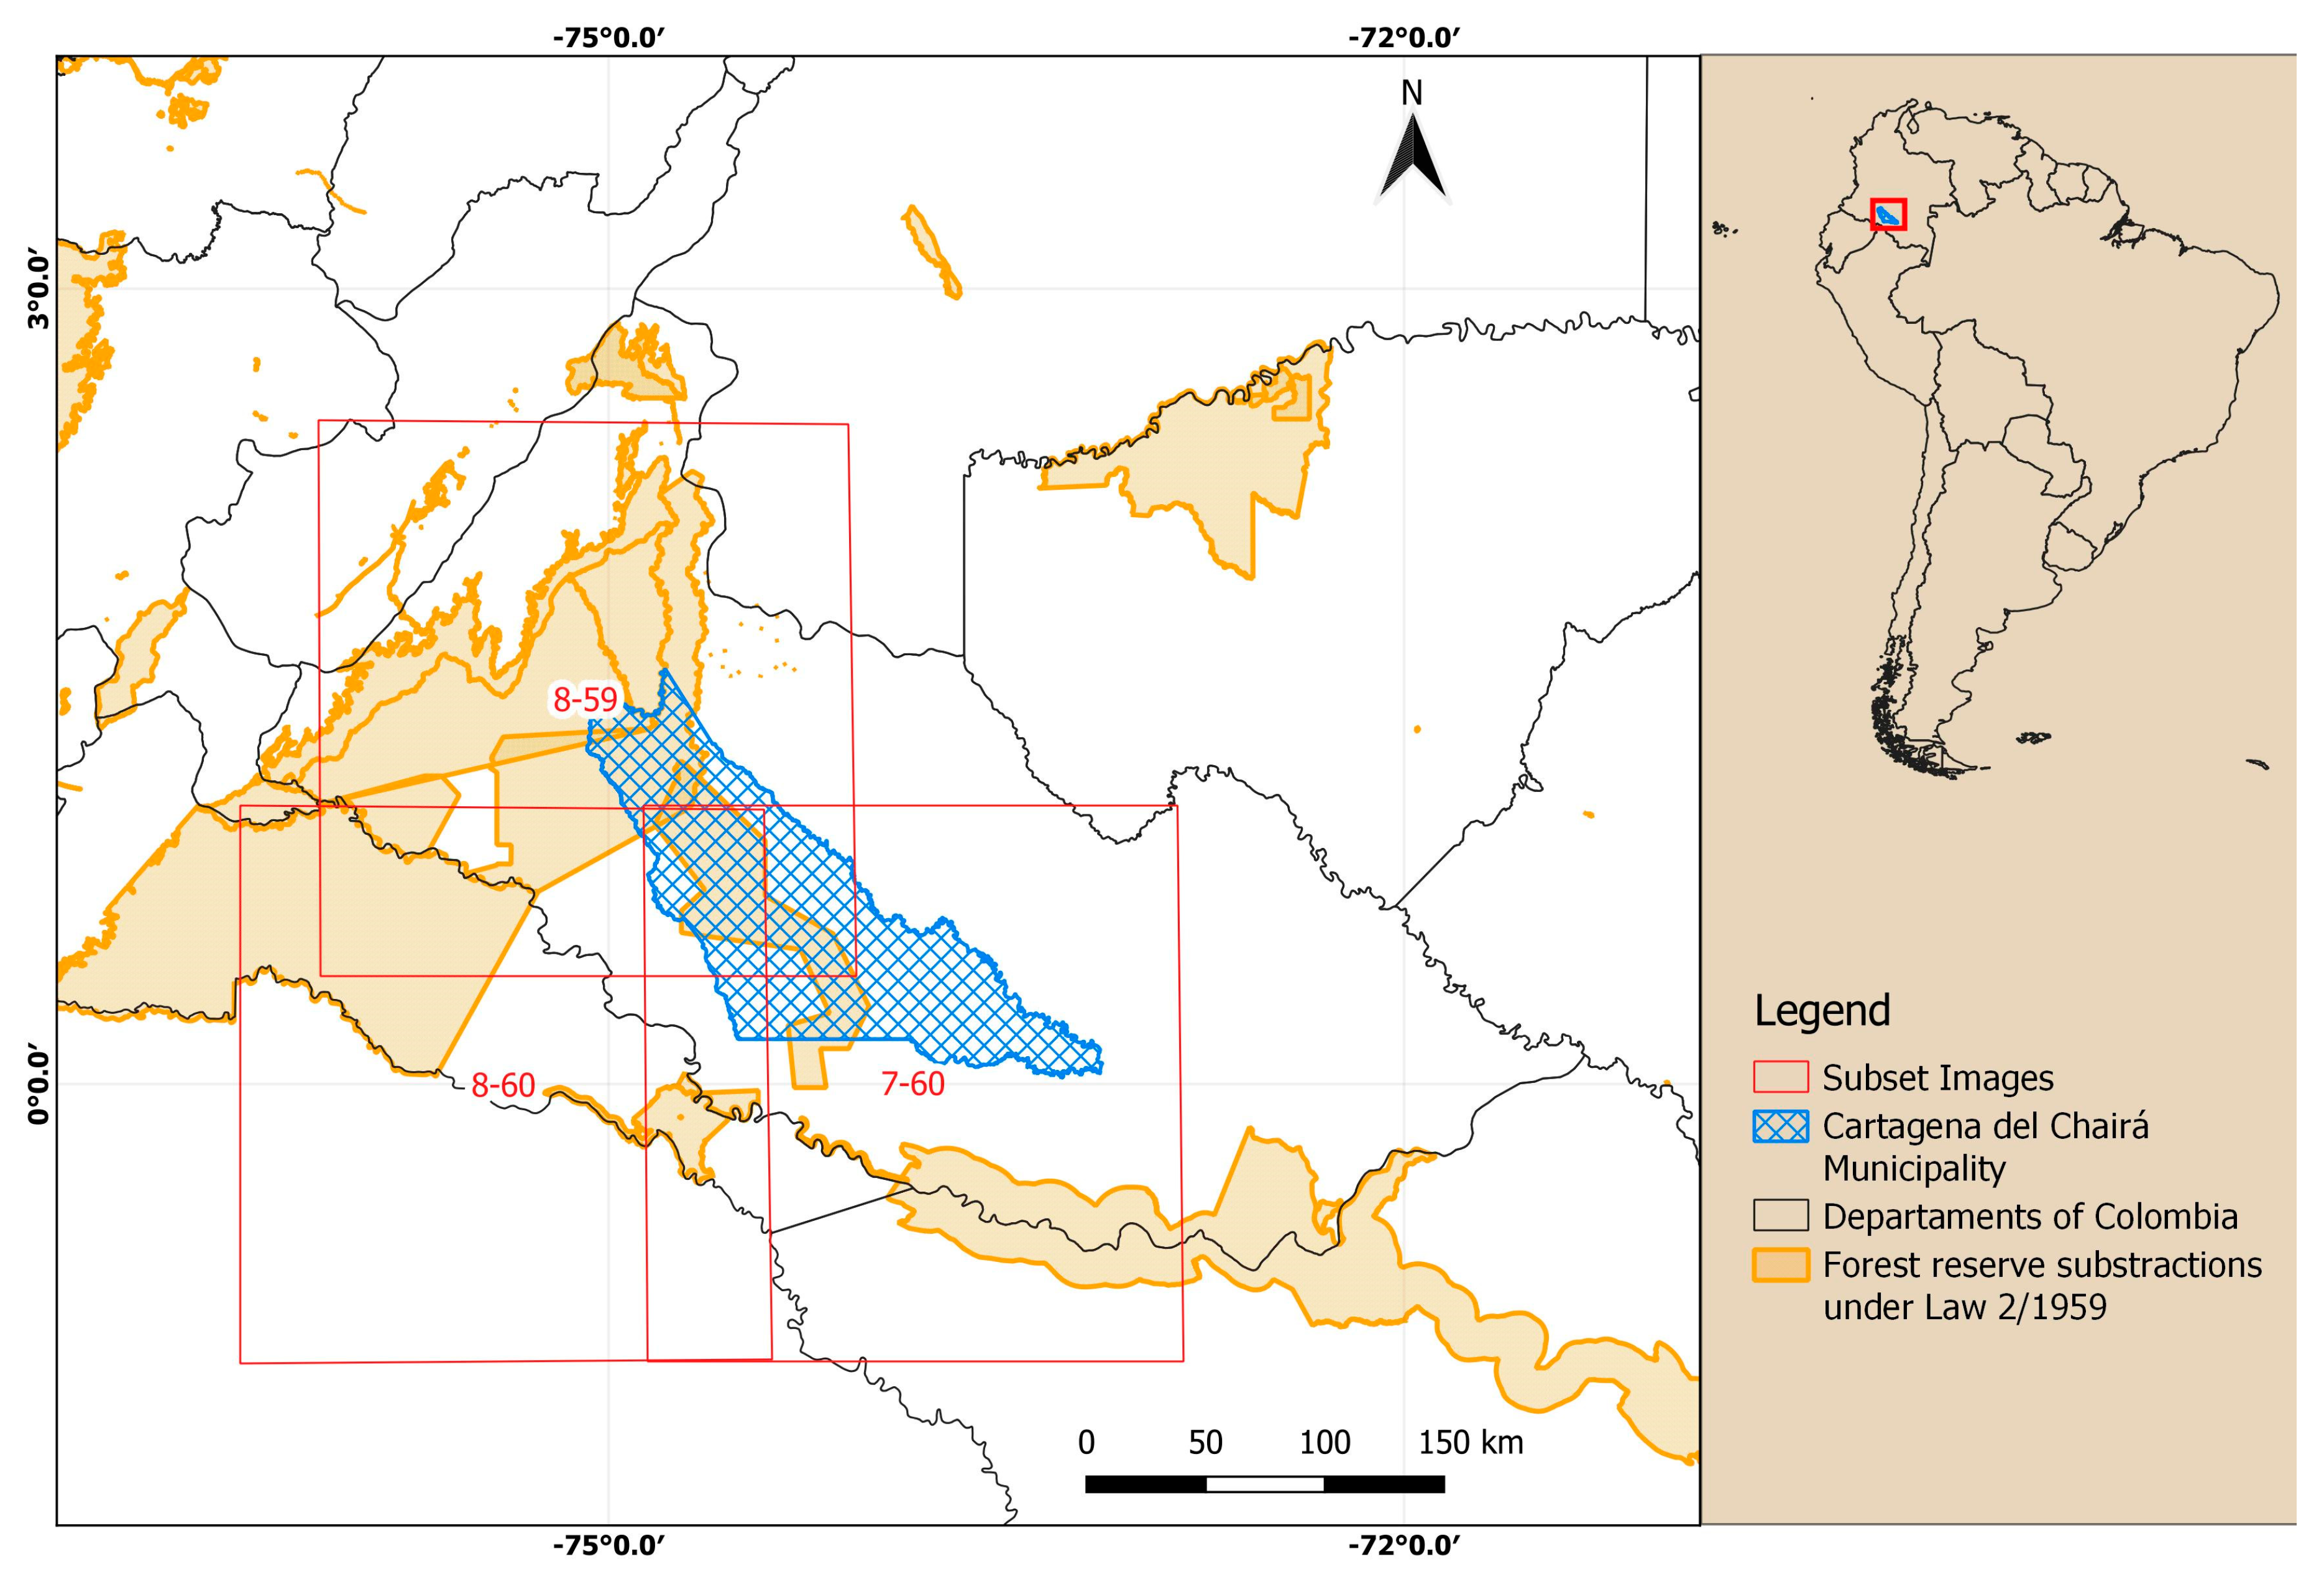
2.1. Study Area

Colombia, situated in Northern South America, as shown in Figure 1, stands as the second most populous country in its region, with an approximate population of 50.88 million residents. The nation encompasses the Andes Mountains across its expanse, spanning a wide range of altitudes from 0 to 5000 m above sea level (m.a.s.l.) These mountain ranges, referred to as cordilleras, in conjunction with the Inter-Tropical Convergence Zone (ITCZ), exert significant influence over the country’s weather and climatic patterns. The research by [18] illustrates the profound impact of the cordilleras and the extensive network of rivers and basins within the country on convective patterns and their spatial distribution. Colombia’s precipitation patterns are intricately linked to the ITCZ, which interacts with convection and shapes both its intensity and frequency.
In the capital city, Bogotá, convection appears to be primarily driven by local thermodynamics, with a majority of intense precipitation events occurring after noon, as noted by [19]. In contrast, in the northeastern region and along the Pacific coast, convection predominantly occurs during the night due to the interplay between the wind and the cordilleras [18]. Moving to the Amazonian area, weather patterns are primarily governed by radiative processes, similar to those in Bogotá. However, the considerable humidity generated by the forest amplifies the strength and duration of precipitation events, resulting in their prolonged nature [20].
Colombia comprises 1122 municipalities and spans an area of 1143 million square kilometers, according to data from the Instituto Nacional de los Recursos Naturales Renovables y del Ambiente in 1985. Among these municipalities lies Cartagena del Chairá, situated at coordinates Lat: 1.34 and Lon −74.85. This municipality falls within the Caquetá Department, situated in the southern part of Colombia within the broader Colombian Amazon region, as depicted in Figure 1. Within its confines, the region accommodates a population of 32,000 residents across an expanse of 12,826 km2. The Caquetá River courses through the municipality, while the Caguán River encircles it to the east. The area is characterized by three distinct morphological units: the eastern slopes of the Eastern Mountain Range, the foothills, and the Amazon plain, as elucidated by [21]. This diverse landscape fosters wetlands and tropical rainforests, serving as primary ecosystems that foster remarkable biodiversity and endemism, as attested by [22]. The climate in this area maintains an average temperature of 25 °C, coupled with an annual precipitation of 2500 mm. The precipitation pattern follows a unimodal regime attributed to the ITCZ and biological factors that drive elevated rates of evaporation and humidity. Notably, the dry season spans from December to February, while the wettest months are April, May, and June [23].
The Serranía del Chiribiquete National Natural Park holds a position of utmost importance within the realm of protected areas in the Colombian Amazon. In Cartagena del Chairá, a significant portion of land measuring 303,981 hectares (which constitutes 10% of the entire area) is encompassed by this park. Additionally, there are other ecologically significant zones within the region, lending exceptional importance to this specific area, as acknowledged by UNESCO [24]—United Nations Educational, Scientific and Cultural Organization. Nevertheless, there exists an allocated area within the municipality where settlement has been officially legalized, encompassing a vast expanse of 16,200,000 hectares within the forest reserve. This designated zone was initially intended for a thoughtful, balanced, and respectful engagement with the natural environment. The aim was to facilitate a productive coexistence with human settlements while maintaining ecological integrity. Consequently, there was contemplation of modifying the land usage within the forest reserve based on considerations of public necessity and social or economic interests [25].
This specific legal status opened the door to human colonization and the subsequent expansion of both legitimate and unlawful agricultural zones. As a result, this area gained significant relevance within the context of the armed conflict, and its role remained substantial during the period following the peace agreement. According to data from the DANE (National Administrative Department of Statistics), Cartagena del Chairá emerges as the second-largest contributor to the department’s economic activities. Its economy is predominantly anchored in the primary sector, encompassing activities such as agriculture, hunting, silviculture, fishing, and mining. Additionally, the tertiary sector, involving the generation of gas, electricity, water, and various services, also plays an important role. Impressively, these combined efforts contribute approximately 6% to the national Gross Domestic Product (GDP), as reported by [26]. Given this intricate interplay of factors, a complex web of socio-economic dynamics, land usage patterns, and forest fire occurrences take shape within this municipality. These dynamics hold the potential to serve as critical determinants of the drivers behind the incidence of forest fires in this region.

2.2. Datasets

2.2.1. Hotspots, Meteorological, and Climatological

Hotspot data were gathered from the Fire Information for Resource Management System (FIRMS), utilizing measurements from both the Moderate Resolution Imaging Spectroradiometer (MODIS) with a spatial resolution of 1 km2 and the Visible Infrared Imaging Radiometer Suite (VIIRS) spanning from 1 January 2013 to 31 December 2022 [27] and with a spatial resolution of 375 m2. The identification of a wildfire event required a measurement reliability surpassing 80% and a brightness temperature exceeding 360 K, following the criteria established by [28]. Additionally, alternative thresholds of 370 K, 350 K, and 340 K were tested and yielded comparable outcomes.
Meteorological data pertaining to the study region were procured from the European Centre for Medium-Range Weather Forecasts (ECMWF). The ERA5 dataset (Version 5 of the ECMWF ReAnalysis), featuring single-level variables [29], was acquired with a spatial resolution of 0.25° and an hourly temporal resolution for the period from 31 January 2013 to 31 December 2022. This encompassed parameters such as precipitation, 2 m air temperature, 2 m dew-point temperature, surface pressure, wind speed, and Total Column Water Vapor (TCWV). The relative humidity (RH) was subsequently calculated employing the surface pressure, 2 m air temperature, and 2 m dew-point temperature, adhering to the approach outlined by [30]. It is important to mention that no meteorological stations are available for these regions, which is why we use ERA5 and not weather stations for the analysis.
Furthermore, climate projections were also sourced from the Climate Data Store (CDS). These projections were derived from the Climate Model Intercomparison Project sixth version (CMIP6). Acknowledging the substantial uncertainties across various models as illustrated by the [31]—Intergovernmental Panel on Climate Change, an ensemble approach was adopted to mitigate errors. In this context, three models—CANESM5-CANOE [32], CNRM-ESM2-1 [33], and IPSL-CMGA-LR [34]—were employed as ensemble members (calculations presented in this research are based on the ensemble mean, not individual members). Four climatological scenarios were analyzed, which incorporated Representative Concentration Pathways (RCPs) and Shared Socioeconomic Pathways (SSPs): SSP1-RCP2.6, SSP2-RCP4.5, SSP3-RCP7.0, and SSP5-RCP8.5. These scenarios, as detailed by the [31], account for diverse radiative forcing and socio-economic contexts. RCPs signify end-of-century radiative forcing relative to pre-industrial conditions (e.g., RCP2.6 implies a 2.6 W m−2 increase). Meanwhile, the SSPs denote varying challenges for mitigation and adaptation, ranging from low (SSP1) to high (SSP5), based on the nomenclature described by [35].
The selection of models and scenarios was meticulous, considering data availability for key variables such as air temperature, relative humidity, wind speed, and surface precipitation. The chosen models and scenarios spanned two timeframes: the historical period (1984–2014) and the simulated future (2015–2049). These data were acquired with a monthly temporal resolution and a spatial resolution of 0.5 × 0.5.

2.2.2. Socio-Economic

Socio-economic variables were sourced from various data repositories. Table 1 provides an overview of the 12 studies encompassing socio-economic variables in Cartagena del Chairá (Table 1), along with their respective sources. All datasets are converted to a municipal spatiality so that they can be evaluated in the same way as the meteorology and land cover. Worth noting is the compilation of a comprehensive database encompassing all variables spanning the years 2013 to 2021, organized on a monthly basis, tailored for utilization in this research and shown in Table 1.

2.2.3. Land Cover

Landsat 8 images of Cartagena del Chairá were procured using the Google Earth Engine (GEE) API [36]. Within the time frame of 2013 to 2021, a multi-scene mosaic approach was adopted, focusing on yearly snapshots. These snapshots were confined to regions encompassed by red rectangles, as indicated in Figure 1 for spatial reference. Specific details regarding the satellite paths can be found in Table S1. The criterion for selection was a cloud cover of less than 20%. This choice of 20% as the cloud cover threshold is grounded in the fact that tropical areas frequently exhibit high cloud prevalence, rendering data selection challenging, regardless of satellite data resolution [21].
For our analysis, we employed Landsat 8 Level 2, Collection 2, Tier 1 images sourced from the United States Geological Survey [36]. These images offered atmospherically corrected surface reflectance and land surface temperature information derived from data acquired by the Landsat 8 OLI/TIRS sensors [36]. The primary goal of this data selection was to minimize cloud interference. The pertinent bands were selected, namely Blue (B2), Green (B3), Red (B4), Near Infrared (NIR) (B5), Shortwave Infrared bands SWIR1 (B6) and SWIR2 (B7), and the Normalized Difference Vegetation Index (NDVI). These data were procured at a resolution of 30 m, subsequently processed, and finally classified based on the land cover classification established by [37].

2.3. Data Processing

2.3.1. Meteorological and Climatological

Each of the meteorological variables was partitioned into two distinct categories: days characterized by the occurrence of wildfires (where a minimum of 5 hotspots manifested on that day) and days devoid of wildfire activity. This stratification aimed to facilitate the creation of box plots, allowing for a comparative analysis of the variable disparities across various seasons throughout the year. This approach is rooted in the recognition that Colombia’s rainfall and humidity patterns are intrinsically tied to the seasonal shifts, owing to the varying location of the ITCZ [23]. Furthermore, a statistical assessment was undertaken to ascertain the significance of differences in each variable when comparing days with and without wildfires. The Student’s t-test was employed for this purpose, encompassing all the meteorological variables, as outlined by [38]. However, it is worth noting that the variable of precipitation, being non-parametric in nature, was not treated in this way ([39,40]). In tandem with these analyses, a wildfire anomaly was computed. This anomaly was defined as the disparity in means for each meteorological variable, except for precipitation, between days featuring wildfires and those without. As for precipitation, it was daily accumulated for both categories of days (with and without wildfires). and then the average was determined, resulting in two distinct values. The difference between these values was then computed, mirroring the approach undertaken for other meteorological variables.
Climate projections were harnessed to compute disparities in selected variables between the historical and simulated future periods, referred to as anomalies henceforth. These anomalies are established as the distinction between the climatic patterns of the historical period and those of the future simulation period. This entails calculating temperature, RH, and wind speed anomalies through the subtraction of the mean values for each pixel across corresponding historical and simulated periods. Notably, this approach is adapted for all variables except for precipitation. In the case of precipitation, a seasonal accumulation is initially performed, followed by averaging for each respective period, before the subtraction procedure is executed [41]. These anomalies are then utilized as input to generate maps, enabling the examination of spatial disparities and the magnitudes of alterations that can be juxtaposed against the atmospheric conditions during wildfire occurrences. This facilitates insight into the potential future behavior of wildfires in the region of interest. It is important to mention that to be more certain in the climatological data, the historical period between 2010 and 2014 was compared with ERA5 data (not ground base stations since they are not available in the region—[41]), and the results are highly similar (R = 0.86 ± 0.16, RMSE for temp of 0.18 ± K, for RH of 5 ± 1.2%, and for precipitation of 7 ± 5 mm) on a monthly basis.

2.3.2. Land Cover

The subset images for each year underwent the mosaic classification process utilizing the Phenology-based Land Cover Classification (PBLCC) technique, as outlined in [37]. The choice of the PBLCC method stemmed from its proven efficacy in previous Landsat classification endeavors within tropical regions, particularly in Colombia, where it adeptly addresses seasonality considerations ([11,37]). This approach ensures accurate analysis, facilitating the precise identification of influential factors. Comprising thirteen distinct classes (as detailed in Table S2), the PBLCC was employed to pixel-wise classify each mosaic based on their respective values. Subsequent to the classification, a cross-tabulation analysis was conducted on an annual basis, quantifying percentage and area changes across categories, thus furnishing a comprehensive overview of “from-to” transitions.

2.4. Machine Learning

2.4.1. Feature Selection

Forest fires are difficult to simulate due to the large number of variables that are related to them. Several studies (e.g., [9,42]) have shown that fires are highly affected by meteorological conditions such as air temperature, humidity, and wind speed, with the former two being the most important since the amount of humidity and the temperature can produce favorable conditions for a fire to develop and start. In fact, in Colombia, seasonal changes are the ones that produce the largest modification to the number and location of wildfires since the humidity and temperature change depending on the ITCZ. This means that places far from the ITCZ develop a larger number of fires since there are not many moisture sources, the temperature is stronger, and not many convective events develop, leading to small amounts of precipitation [23]. This is the reason why we included the wind speed, air temperature, RH, and total column water vapor. The last two are included to account for the amount of moisture but also its relative value. The fires not only depend on meteorology but also fuel (land cover) and socio-economic variables.
On the one hand, land cover is important since the type of vegetation can be favorable to the development of forest fires (e.g., [1,21]), which is why we include the land cover categories in the model. On the other hand, fires in Colombia are highly related to socio-economic variables since the socio-economic dynamic could produce enormous changes in the dynamics of the fire ([43,44,45]). Socio-economic data were selected based on the monthly available data and representative ones for 2013–2021 from governmental agencies, taking into account those variables studied in previous studies related to land changes and forest fires ([43,44,45]). Various demographic variables have been used in distinct studies (e.g., [8,15,17,43]). These investigations were conducted in municipalities exhibiting socio-economic and political similarities, revealing a significant correlation between wildfires and population dynamics. In terms of population, Ref. [46] show that population can affect fires due to colonization or abandonment of the territory. Following this, Refs. [8,43] show that segregating populations into rural and urban categories is important for colonization and, subsequently, for fire dynamics. Refs. [47,48] studied the GDP as a proximate cause and underlying driving force of forest decline, which is tightly related to forest fires in the Amazon [49]. Regarding the GINI, Refs. [50,51] found a significant relationship between low GINI and an increase in wildfires in the Brazilian Amazon, so we decided to include it.
Long-term unemployment (e.g., [52,53,54,55]) has been shown to positively impact the occurrence, density, and average size of fires. Elevated unemployment rates in municipalities with frequent and recurrent fires further underscore the direct association between economically disadvantaged socio-economic contexts and fire occurrence. Additionally, factors such as informal work and low educational level, previously unexplored in isolation, are now considered in the context of their potential impact on wildfires. Refs. [47,56] identified vulnerabilities associated with wildfire governance, with a particular emphasis on reduced employee rates and limited monetary resources. In the Colombian context, armed conflict-related violence (e.g., [3,8,44]) introduces a complex interplay that affects the dynamics of management, monitoring, and enforcement. In tandem, there are variables that could have an incidence on wildfires that were not considered due to their high uncertainty and lack of data availability in Cartagena del Chairá.

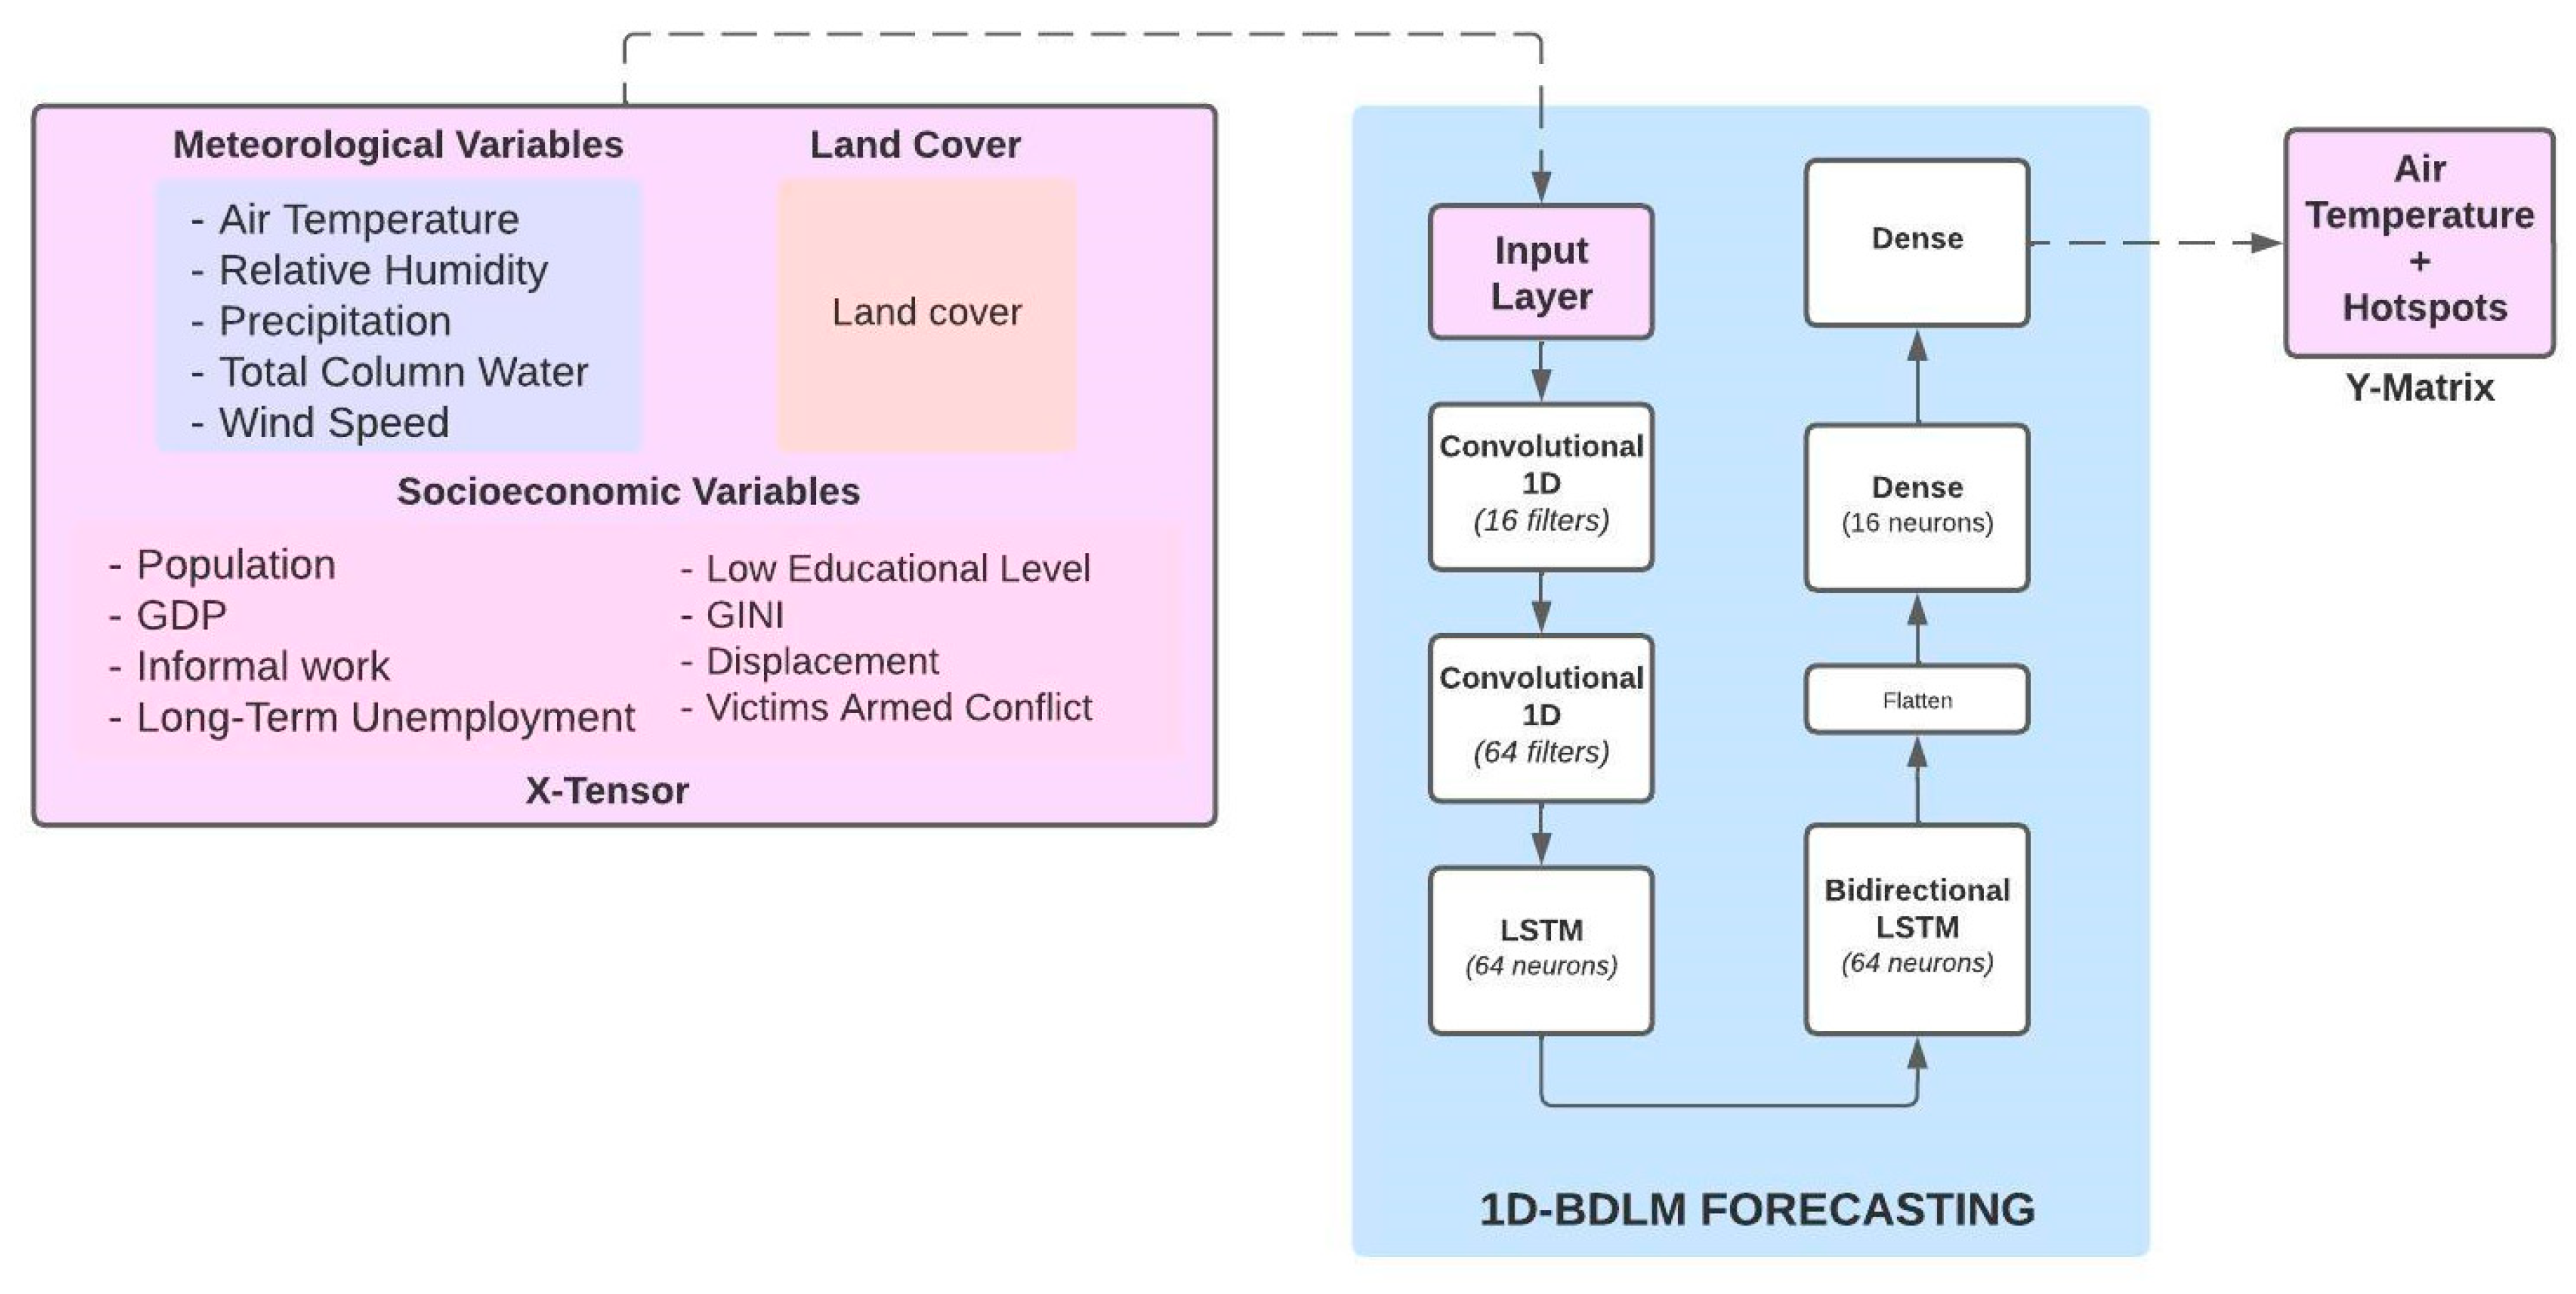
2.4.2. Input/Output Matrix Description

We perform the Variance Inflation Factor (VIF) (e.g., [57]) on the meteorological and socio-economic variables, with the idea of excluding the input variables with multicollinearity larger than 5, as proposed by [58,59], since multicollinearity can reduce ML precision (e.g., [60]). After the VIF method is performed, five meteorological variables (air temperature, relative humidity, precipitation, TCWV, and wind speed), eight socio-economic variables (population, GDP, informal work, long-term unemployment, low educational level, GINI, displacement, and victims of armed conflict), and the land cover are selected as inputs for the ML technique.
Meteorological variables are at an hourly resolution, unlike socio-economic data, which vary in temporal resolution. Within the model, meteorological variables change dynamically, while socio-economic variables remain static at an hourly level but adapt based on their specific temporal resolution. This approach aligns with the methodology by [13], where a variable remains constant until updated by new input data occurring monthly or annually, depending on the variable. Land cover data, available annually, remains static within the model, receiving yearly updates. Before integrating them into the model, all variables are adjusted to match the spatial resolution of ERA5 data, socio-economic variables remain spatially constant across the study area, and their temporal aspects shift according to their respective temporal resolutions. In summary, the X-tensor (input) contains meteorology—land cover variables, each maintaining its unique temporal and spatial resolution. This temporal flexibility offers a significant advantage, allowing variables to update independently based on their data sources without requiring simultaneous adjustments, as detailed in the described method. The Y-matrix (output) is created by the air temperature from the ERA5 data, including the brightness temperature from the hotspots of the MODIS dataset (Figure 2). In other words, we took the brightness temperature from the hotspot data and its position and replaced it with the same position of the ERA5 data to be sure that the output includes forest fires values for detection, meaning that, for the ML model analysis, the native resolution of the hotspots is changed to match the ERA5 grid.

2.4.3. Structure, Training, and Validation

The neural network model structure is shown in Figure 2 with its inputs and output. The model is constructed using Tensorflow-2.4.1 [61] and Keras-2.4.3 [62] Libraries from Python-3.9. Its structure and type of networks are shown in Figure 2 and were identified by using grid-search, and it is based on the convolution network structure by [38]. The loss selected is the Mean Square Error (MSE), Adam [63] is used as an optimizer, and for the activation, the dense layer used the Rectified Linear Unit (ReLU) [64]. Meanwhile, the Long-Short Term Memory (LSTM) layers [65] used sigmoidal [66]. To select these hyper-parameters, we use a grid-search technique [67] as in [38].
For the training, we use 100 epochs, and it is declared that the variables are semi- or fully- dynamic in order for the training to produce the best results, following the work of [13], which reported precise results. The training set consists of 80% of the data, and the remaining 20% is used for validation. From this 20%, we make sure to include days with and without wildfires and at least 5 days per month, with emphasis on days from DJF and MAM season. To prevent overfitting, we include dropouts but also an early stopping method [68]. To validate the model, we calculate the Root Mean Square Error (RMSE), the Mean Bias (MB), and the Pearson Correlation (r) from the domain mean so that we only have a time series of data in which the wildfires can be identified (the reader is referred to the Supplementary Material (hereafter SM) of [38] for a detailed description of the statistical parameters).
As a caveat, it is important to clarify that our analysis does not directly encompass human-induced fires (i.e., ignition events). Instead, we incorporate variables that have the potential to influence the likelihood of wildfires occurring. For instance, education can be a modifying factor in wildfire probability. Communities with higher levels of education are typically less likely to engage in illegal activities that could lead to fires. Moreover, they tend to be better prepared in terms of agricultural practices and soil management, which can serve as protective measures against wildfires. These collective actions effectively reduce the probability of wildfire development ([8,15]).

2.5. Proposing Strategies to Improve Wildfire Mitigation

ML models have been used for a large number of applications, some of which have focused on the prediction of meteorological variables [69], air quality [38], and wildfires (e.g., [70]), producing reliable forecasts and showing their potential to be used to understand the importance of several variables [71], and also to create sensitivity experiments that could be used to evaluate strategies or scenarios ([13,41]). Ref. [41] performed sensitivity analyses to understand the tropospheric ozone variations due to the COVID-19 lockdowns, showing the potential of ML to process understanding. Following this research road, Ref. [13] used an ML model to create scenarios of land cover change depending on possible future conditions and evaluate their possible impacts on the Amazon. Here, we use a hybrid of these two approaches to determine which meteorological and socio-economic variables must be measured, evaluated, and, in the case of the socio-economic variables, improved by, for example, enacting policies or creating employment.
In this sense, we modify all the input variables of the ML model (Figure 2) except the air temperature. To do this, we increase/decrease each input variable by 30% (other percentages lead to the same conclusions), then quantify the change between the control prediction and the experiments using Bland–Altman plots ([72,73]), with the idea of identifying the variables that produce the largest sensitivities to the wildfires, and also in order to create strategies that could help to efficiently mitigate the number of wildfires. Regarding the aforementioned strategies, they are developed based on the already existing policies and plans of the study region (e.g., [14]), but they are also designed to complement them.

3. Results and Discussion

This section commences with an account of the progression of wildfires in Cartagena del Chairá (hereafter referred to as CdC). Subsequently, our focus shifts to illustrating the meteorological conditions prevalent during wildfire occurrences in the region, aimed at comprehending the driving factors behind these incidents. While wildfires are closely intertwined with meteorology, they also bear connections to human activities and land cover. We proceed to elucidate the vegetation cover that exhibits a stronger correlation with fire development in the region, as well as the interplay between vegetation and human practices. Following this, a climatological examination is undertaken for the near future (up to 2049) to discern potentially heightened wildfire risks arising from atmospheric conditions. Concluding this section, we subject an ML model to assessment and subsequently employ it to appraise strategies. These strategies illuminate potential avenues for mitigating the risk associated with fires in the region.

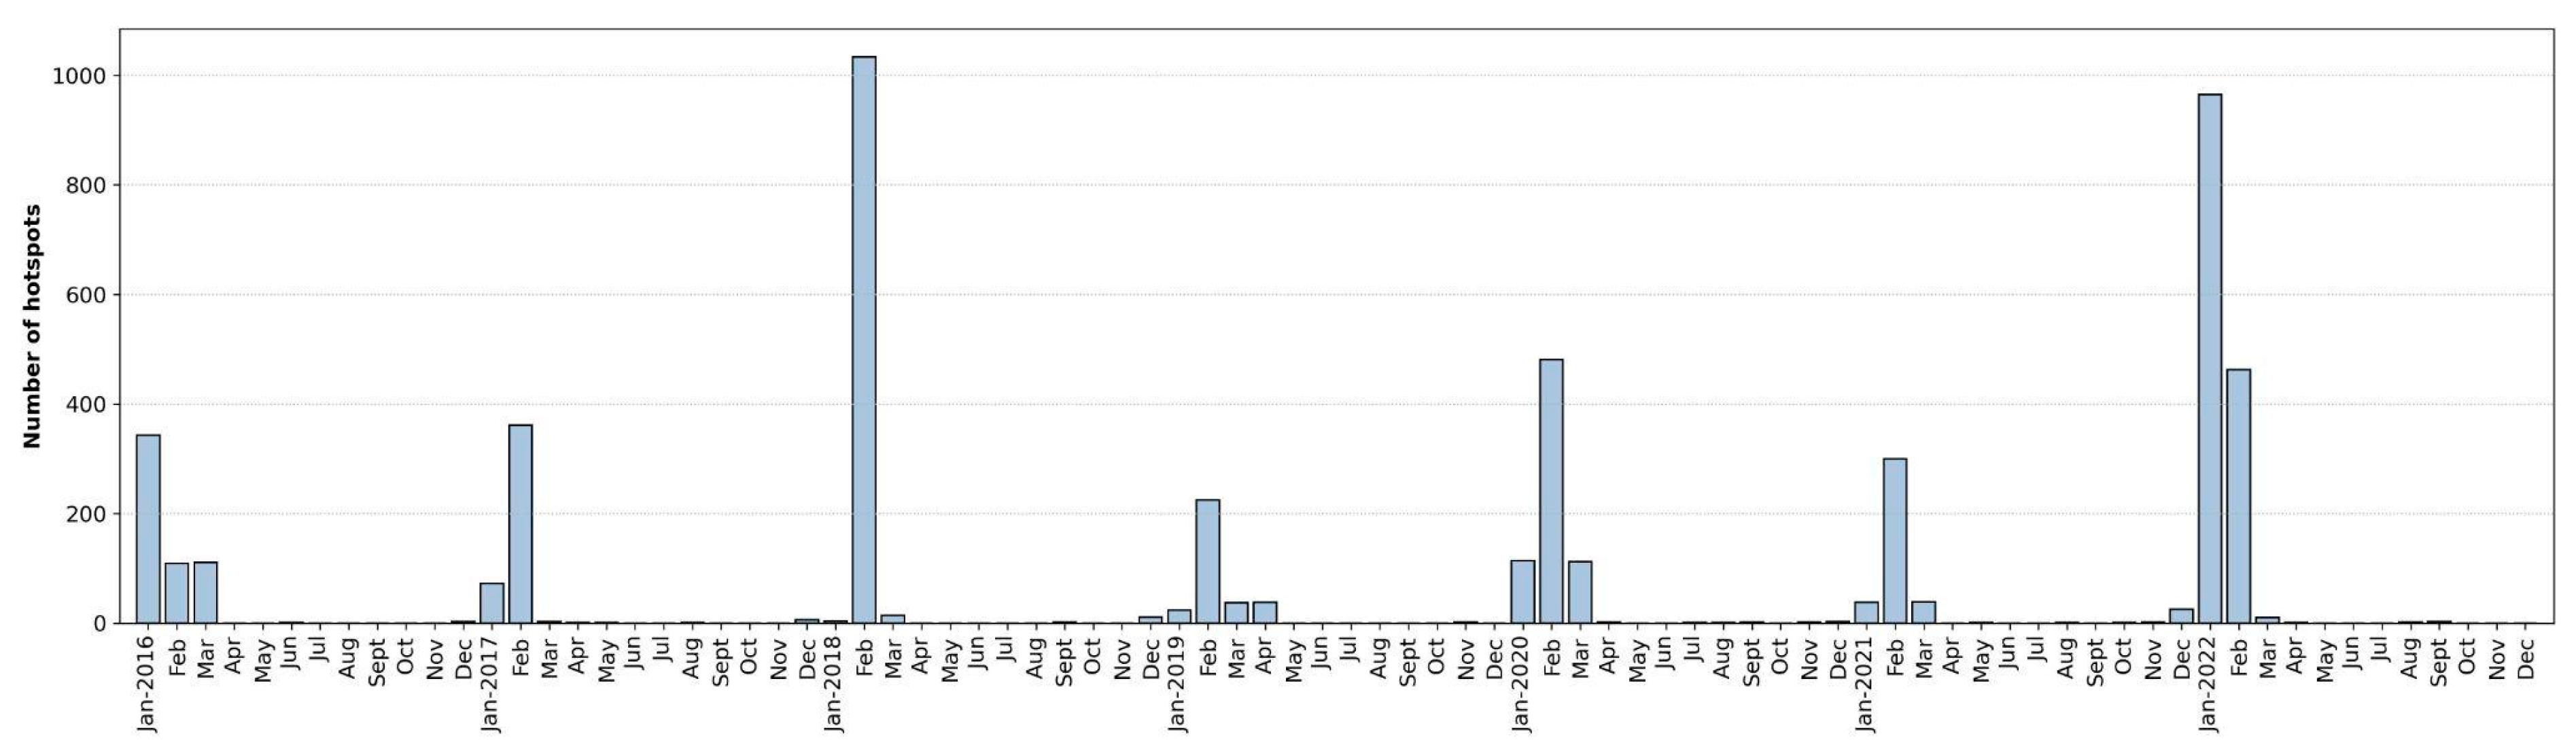
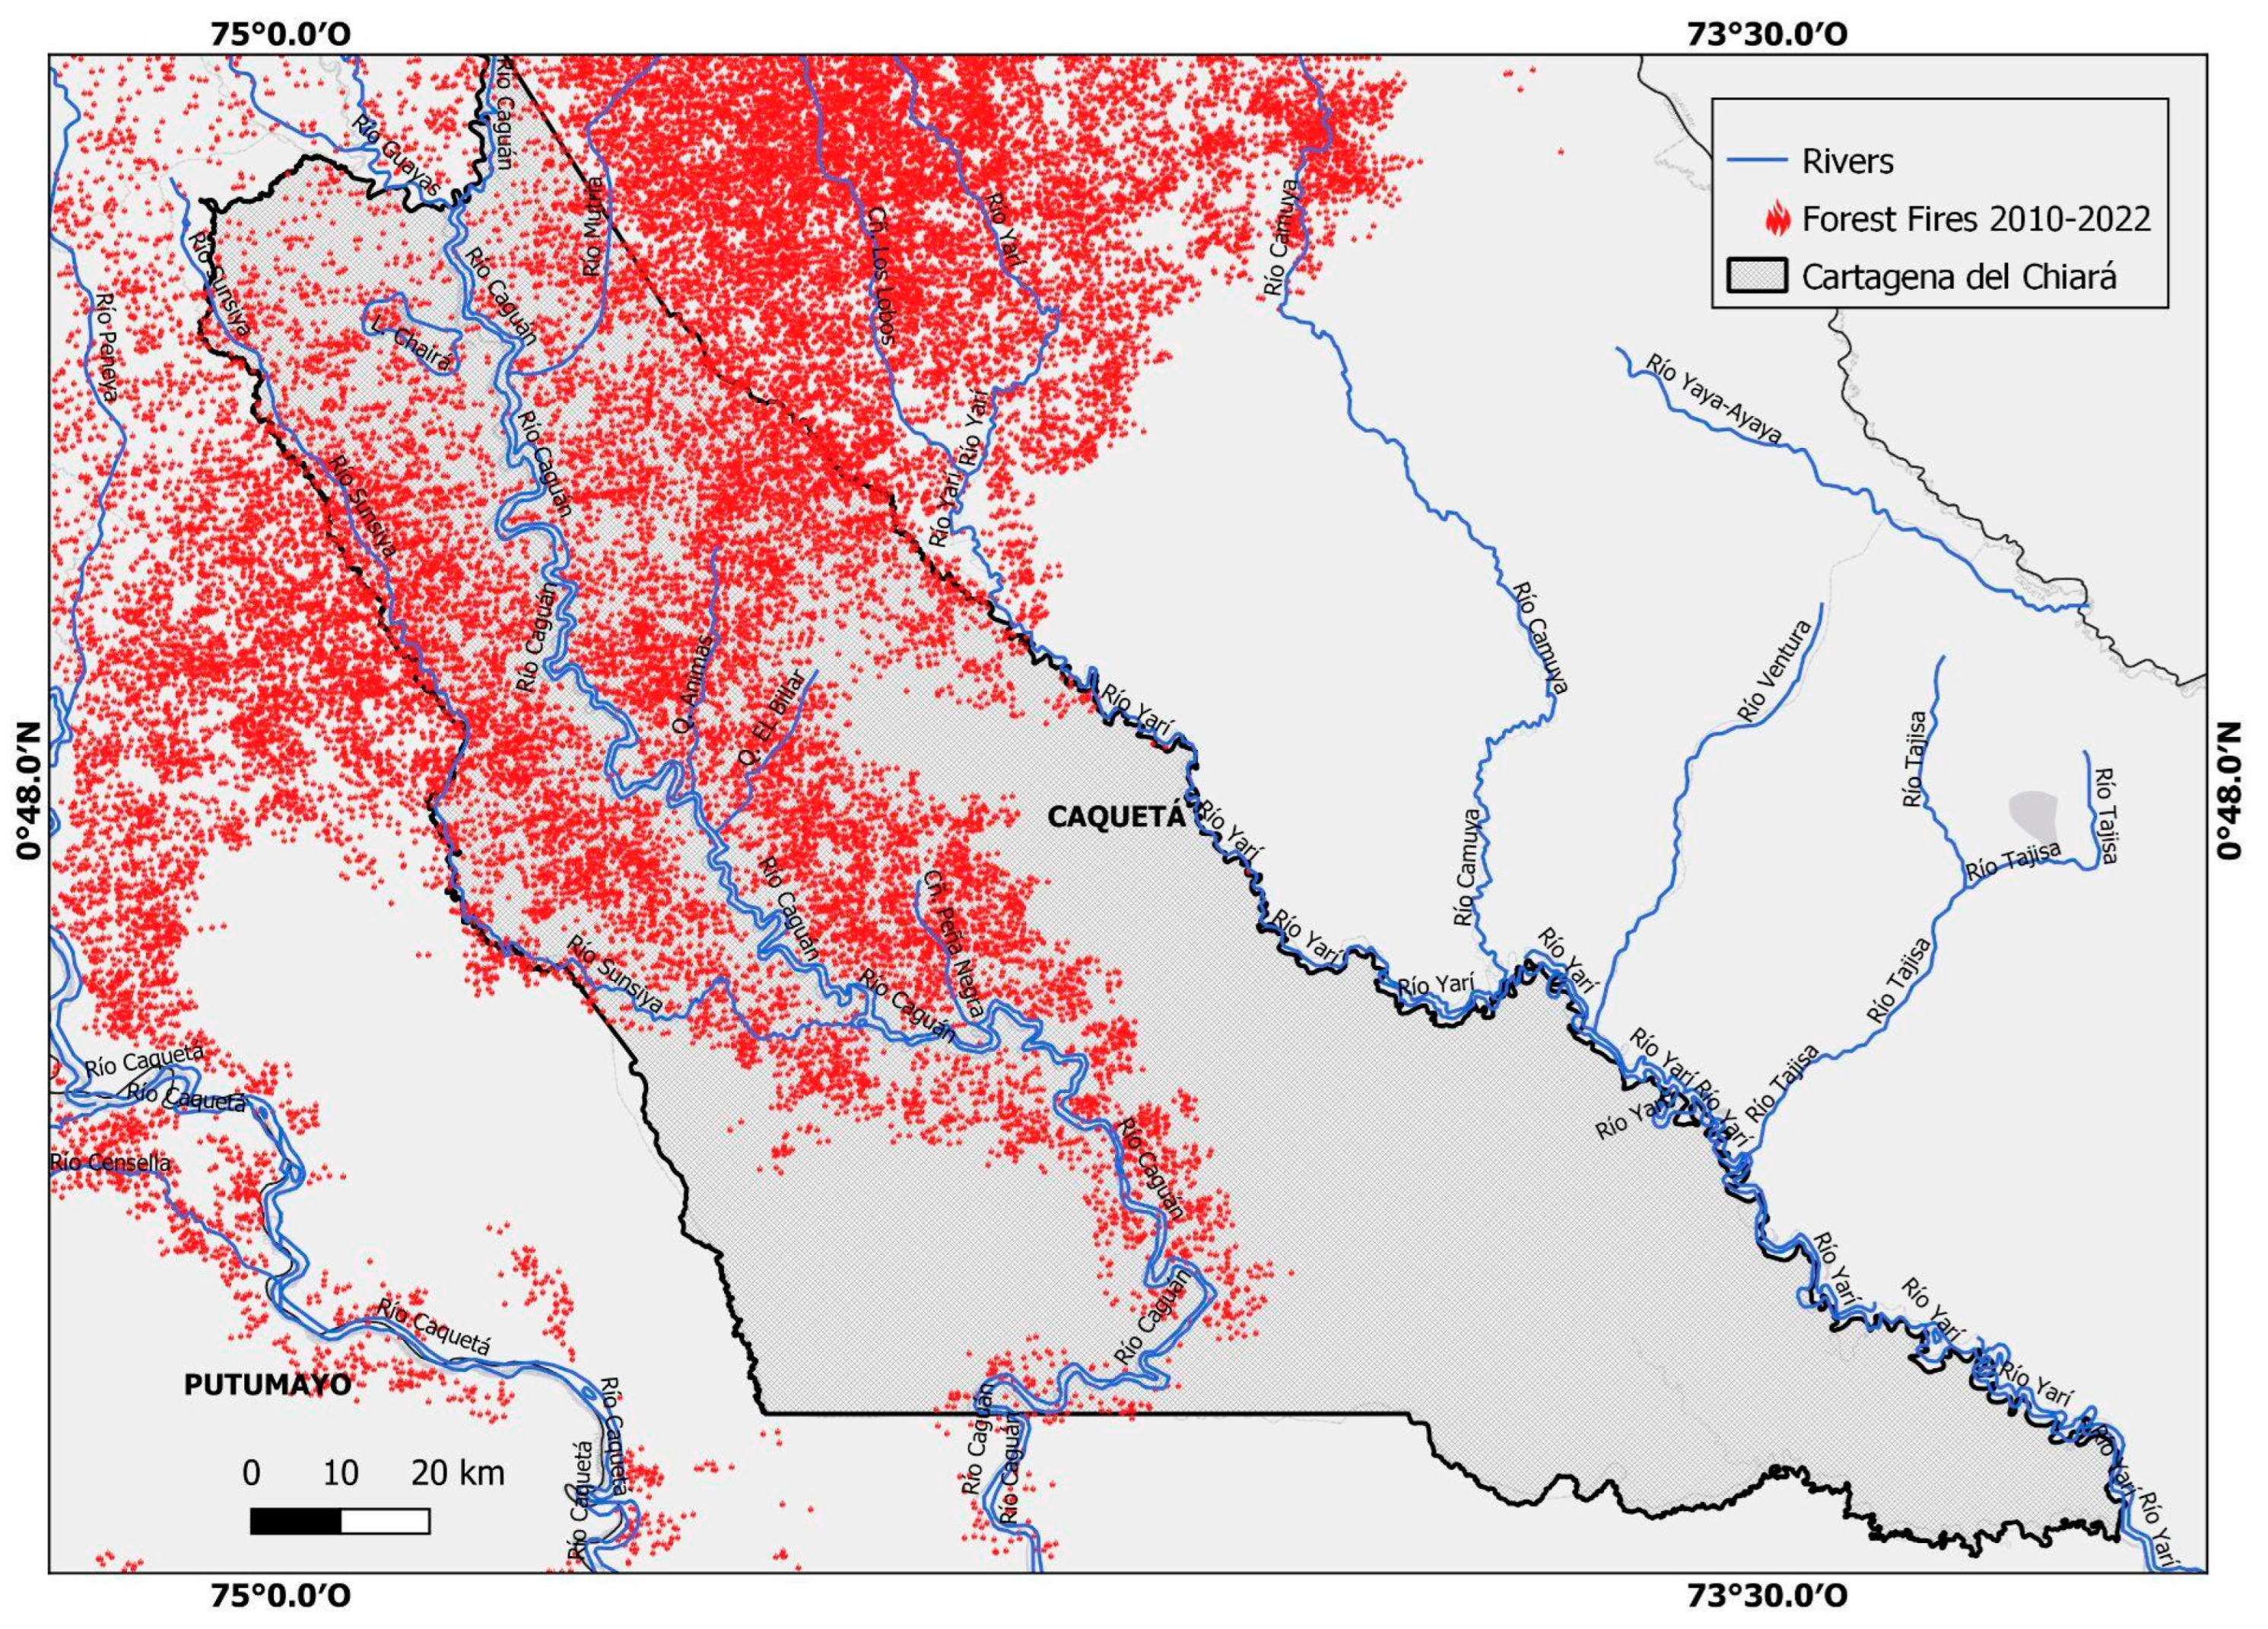
3.1. Wildfires’ Temporal Evolution in Cartagena del Chairá

Situated within the Amazonian sector of Colombia, CdC holds substantial ecological significance, particularly in relation to the susceptibility of the region to wildfires. This area exhibits over 200 hotspots annually, with instances occasionally escalating to 800, as witnessed in both 2018 and 2022 (depicted in Figure 3). This pattern of hotspots follows a pronounced seasonality, predominantly emerging during boreal winter, as showcased in Figure 3 and Table S1. This recurring seasonal trend underscores the substantial influence exerted by meteorological conditions on the initiation and progression of wildfires within the region, a premise well-supported by previous research (e.g., [9,74]). Figure 3 distinctly illustrates an upward trajectory in wildfire occurrences since 2018, a phenomenon potentially linked to Colombia’s peace agreement, which facilitated expanded agricultural practices within the municipality. Furthermore, from years before the peace agreement, illicit activities such as illegal cultivation, including illegal crops occurring more often and to a larger extent, might be contributing to the proliferation of wildfires [8]. Notably, the geographical distribution of wildfires is in close proximity to rivers, primarily situated in the northern and central-western sectors of the municipality, as delineated in Figure 4. This spatial correlation suggests a strong association between agricultural endeavors and the prevalence of wildfires within the region.
These findings underscore the combined impact of meteorological conditions, land cover (with ties to agriculture), and socio-economic factors in shaping the frequency of wildfires in the area. In the ensuing sections, our focus shifts to dissecting the individual roles played by each of these three driving forces.

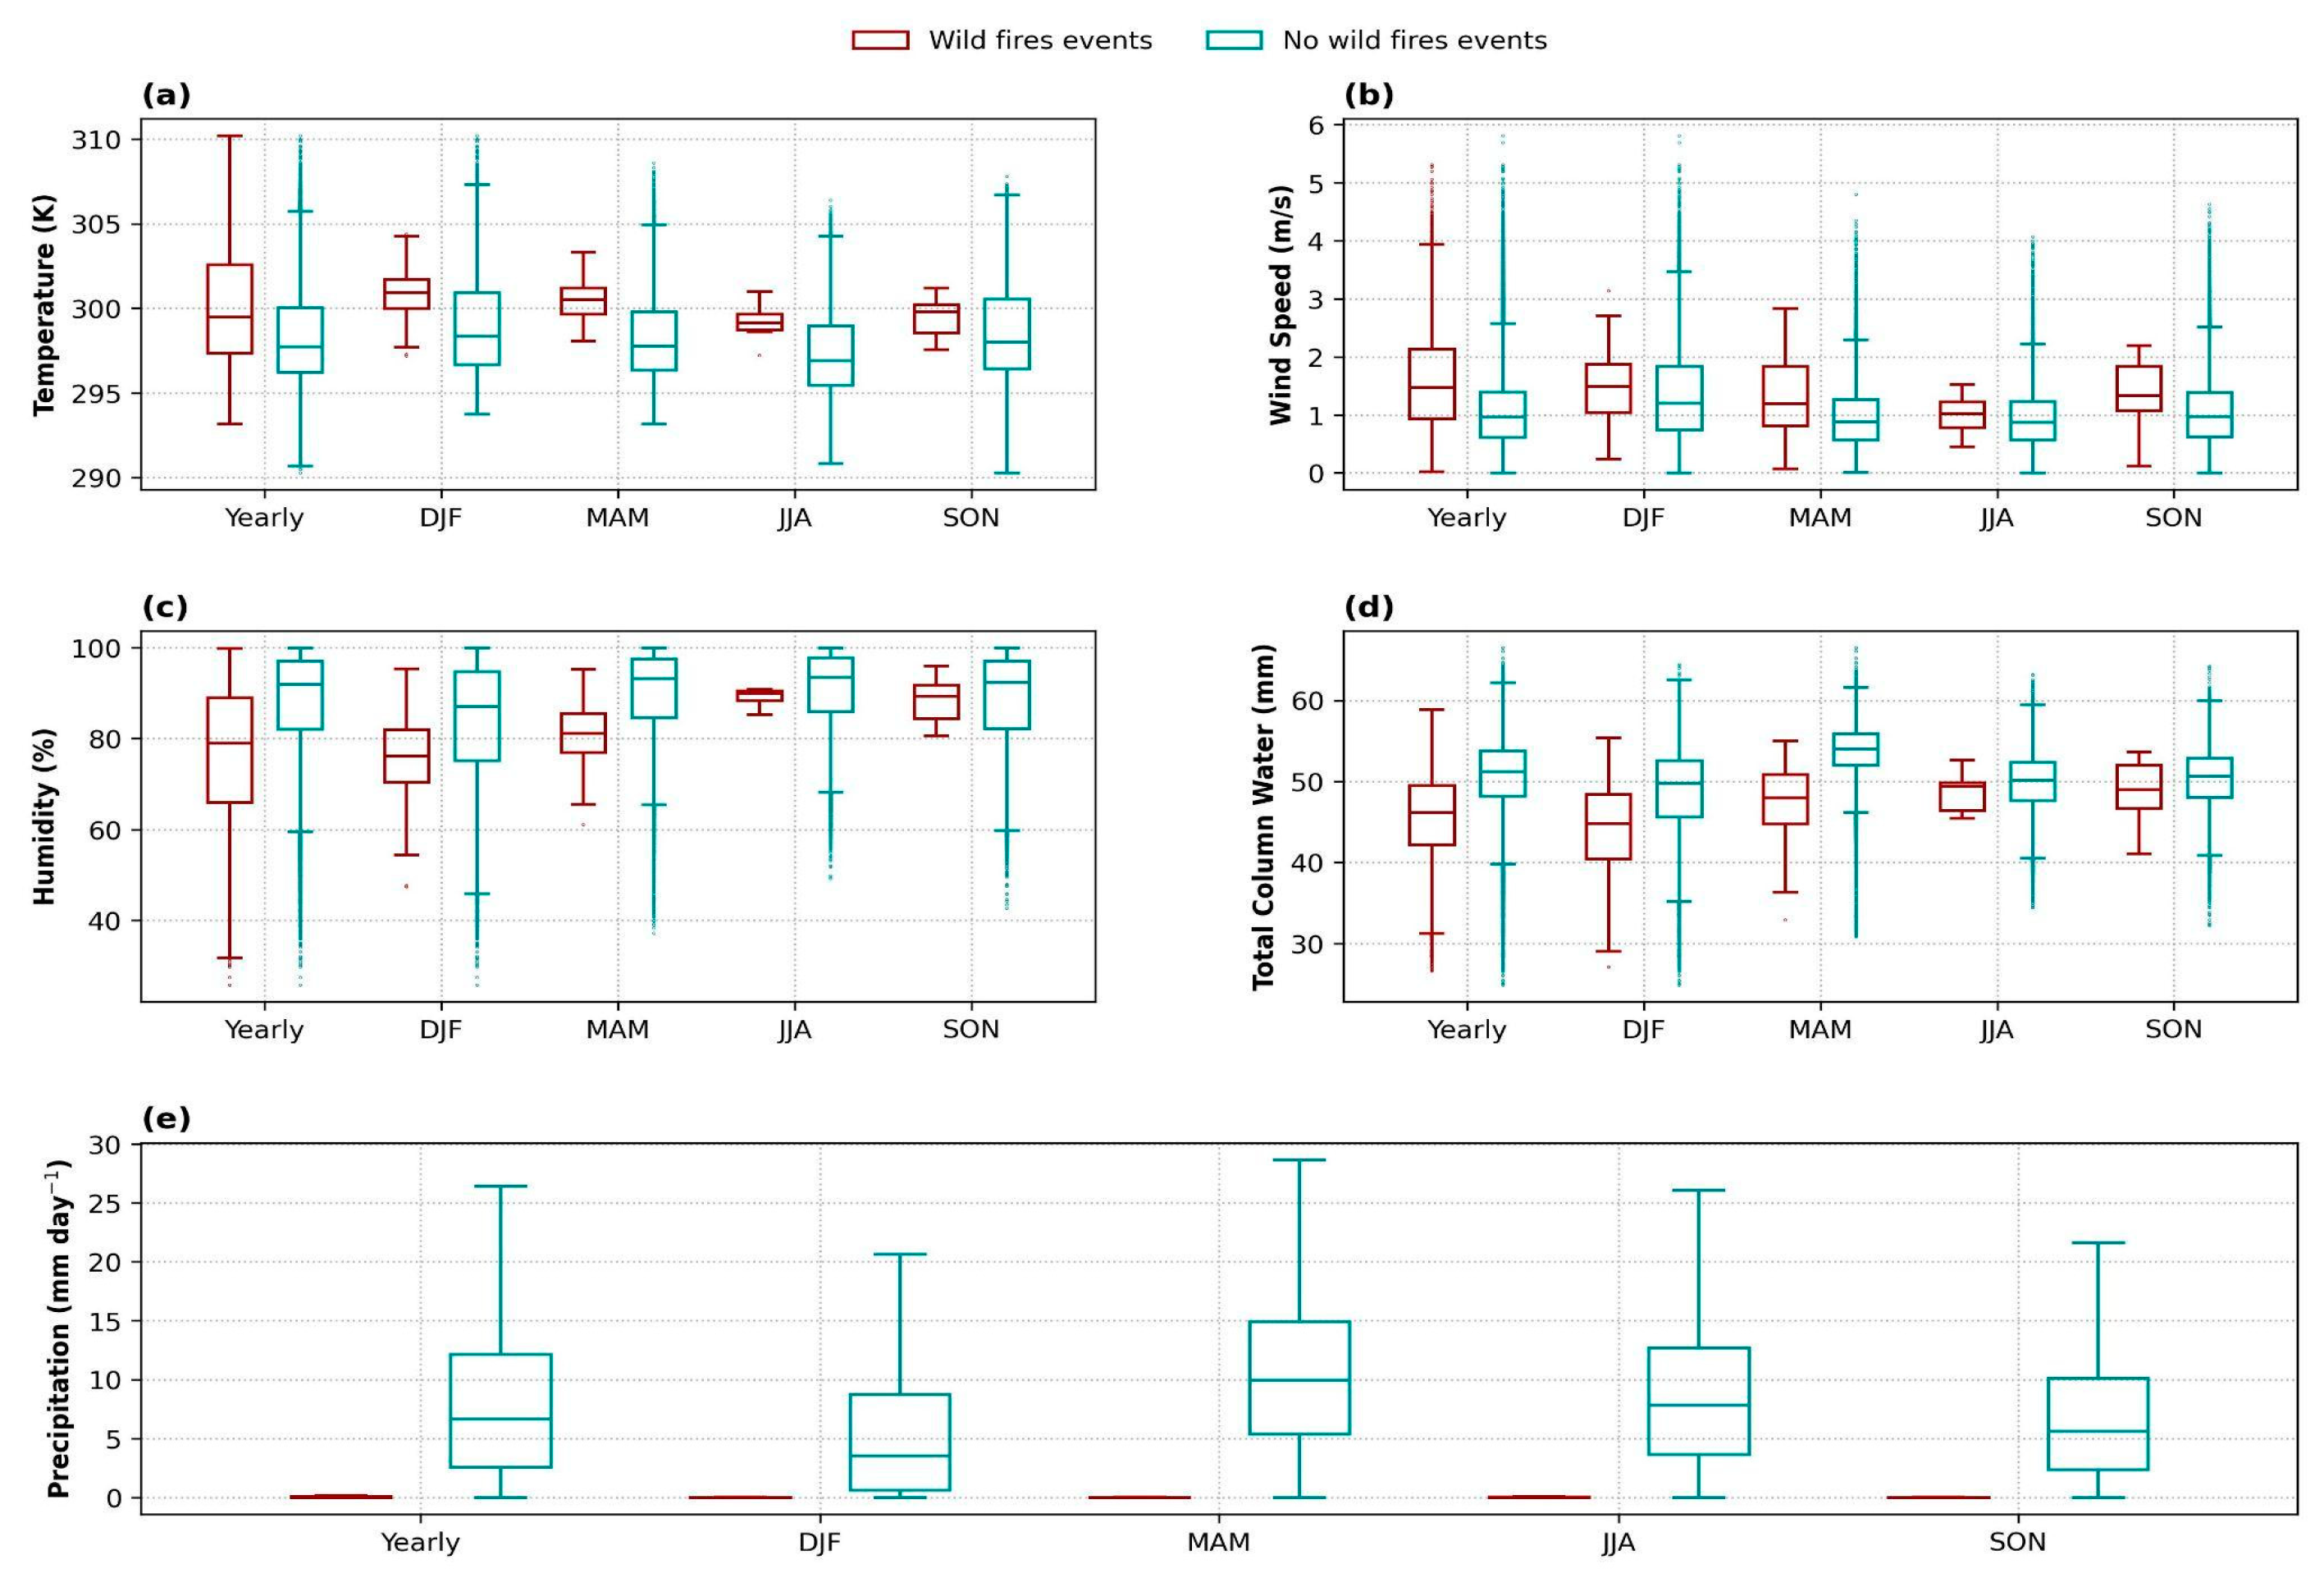
3.2. Meteorological Analysis

Wildfires are closely tied to meteorological conditions, particularly air temperature and RH. When the air temperature is high and both the air and soil have low RH, wildfires tend to develop more readily [9]. In Colombia, various studies (e.g., [43,75]) have indicated that meteorological conditions characterized by high temperatures, coupled with low RH, minimal rainfall, and strong winds, create favorable circumstances for the emergence of wildfires. These fires not only impact vegetation and ecosystems ([10,17,46]) but also affect the air quality of many cities in the country due to long-range transport ([41,76,77]). These findings align with Figure 5, which illustrates the distinctions between days with wildfires (dark red boxes) and those without (green boxes).
In terms of air temperature (Figure 5a), days with wildfires exhibit temperatures 3–4 K higher than non-wildfire days throughout each season, with the most notable difference occurring during boreal winter months, as expected considering the greater occurrence of wildfires in DJF and MAM compared to JJA and SON. The heightened surface air temperature during wildfire days triggers a decrease in surface air pressure, resulting in increased wind speed (Figure 5b) due to the necessity to balance out the disparities (by continuity) caused by the expanding, ascending warm air, which reduces pressure [30]. This increase in wind not only lowers humidity through advection but increases temperature through surface fluxes and also intensifies the spread and duration of fires [12].
In terms of RH, wildfire days exhibit lower RH (Figure 5c) as anticipated, given the inverse relationship between RH and air temperature according to the Clasius–Clapeyron relation. Stronger winds also contribute to decreased RH through advection. Furthermore, Figure 5d depicts reduced atmospheric moisture during wildfire days, particularly evident in boreal winter, where the median humidity of wildfire days falls below the second quartile of non-wildfire days. Conversely, this difference is less pronounced during boreal summer, highlighting the greater significance of RH over total regional moisture during this season. The dryness of the atmosphere on wildfire days inhibits convective activity ([78,79]), resulting in decreased precipitation, as indicated in Figure 5e.
In essence, wildfire days are marked by dry and warm conditions, lacking rainfall and characterized by strong winds. In fact, when subjecting the variables to a Student’s t-test to assess the statistical significance of differences between wildfire and non-wildfire days (except for precipitation due to its non-parametric nature), most variables and seasons exhibit statistically significant disparities (except for wind speed during JJA). The subsequent paragraphs dive into the geographical distribution of wildfires and the corresponding atmospheric characteristics. To facilitate this, we combine DJF with MAM seasons (hereafter boreal winter), as well as JJA with SON (hereafter boreal summer), due to their similar atmospheric conditions and the predominant occurrence of wildfires during boreal winter.
In the context of boreal summer, the region experiences a relatively low incidence of wildfires, averaging less than two occurrences per season, as depicted by the gray contours in Figure 6. This could be attributed to the comparatively milder anomalies in temperature (Figure 6a) and moisture levels (Figure 6d–f) compared to those observed during boreal winter (Figure 6). Wind speed (Figure 6h) displays positive anomalies in the southern part of the study area during boreal summer, yet these anomalies seemingly have limited impact on wildfire development, given that most fires arise in the northern region. However, precipitation stands out as the sole variable with notably negative anomalies (Figure 6j), indicating that a lack of rainfall is a critical factor for wildfire initiation. Broadly speaking, boreal summer is characterized by a scarcity of fires, and those few fires are primarily associated with warm air conditions, a significant dearth of rainfall, and dry conditions in the northern portion of the region ([9,42]).
In stark contrast, boreal winter showcases a substantial number of hotspots (>30) emerging in the northern part of CdC (Figure 6). This season is characterized by markedly strong anomalies across all the studied meteorological variables. The northern region displays a robustly positive anomaly in air temperature (Figure 6a), aligning with hotspot locations, and a corresponding negative anomaly in relative humidity (Figure 6c). This reduction in humidity is in line with the strong relationship between these variables [30] and their connection to wildfires ([46,80]). This moisture-related negative anomaly is equally evident in the TCWV (Figure 6e), reflecting drier conditions across the entire region, particularly in the north. Such arid conditions discourage convection [20], contributing to negative anomalies in terms of precipitation (Figure 6i). Turning to wind speed anomalies (Figure 6g), a pronounced positive anomaly emerges in the northern region, correlating with the location of wildfires and the positive temperature anomaly in accordance with the continuity principles previously discussed. It is noteworthy that elevated temperatures lead to reduced RH, triggering a pressure gradient that intensifies wind. As wind velocity increases, it further diminishes RH, which in turn inhibits convective processes, resulting in a lack of precipitation events [12].
In summary, wildfire occurrences are concentrated in the northern and central sectors of the region, closely tied to positive anomalies in temperature and wind speed, along with negative anomalies in RH, TCWV, and precipitation during boreal winter. Conversely, boreal summer experiences fewer wildfires in the northern region, linked to elevated air temperatures, a dry environment characterized by reduced RH and TCWV levels, and a shortage of rainfall. The fact that wildfires emerge in specific zones within our study area suggests that the type of land cover may significantly influence wildfire development. This drives our focus in the subsequent section on analyzing the land cover characteristics of the region.
Figure 6. Wildfire anomalies (days with wildfires and days without wildfires) in boreal winter (a,c,e,g,i) and boreal summer (b,d,f,h,j). The anomalies (colors) are calculated for (a,b) 2 m air temperature, (c,d) relative humidity, (e,f) TCWV, (g,h) wind speed, and (i,j) precipitation. The gray contours represent the mean number of hotspots that develop during both seasons from 2013 to 2022. The plot was constructed using the Cartopy Python package [81].
Ijgi 12 00436 g006

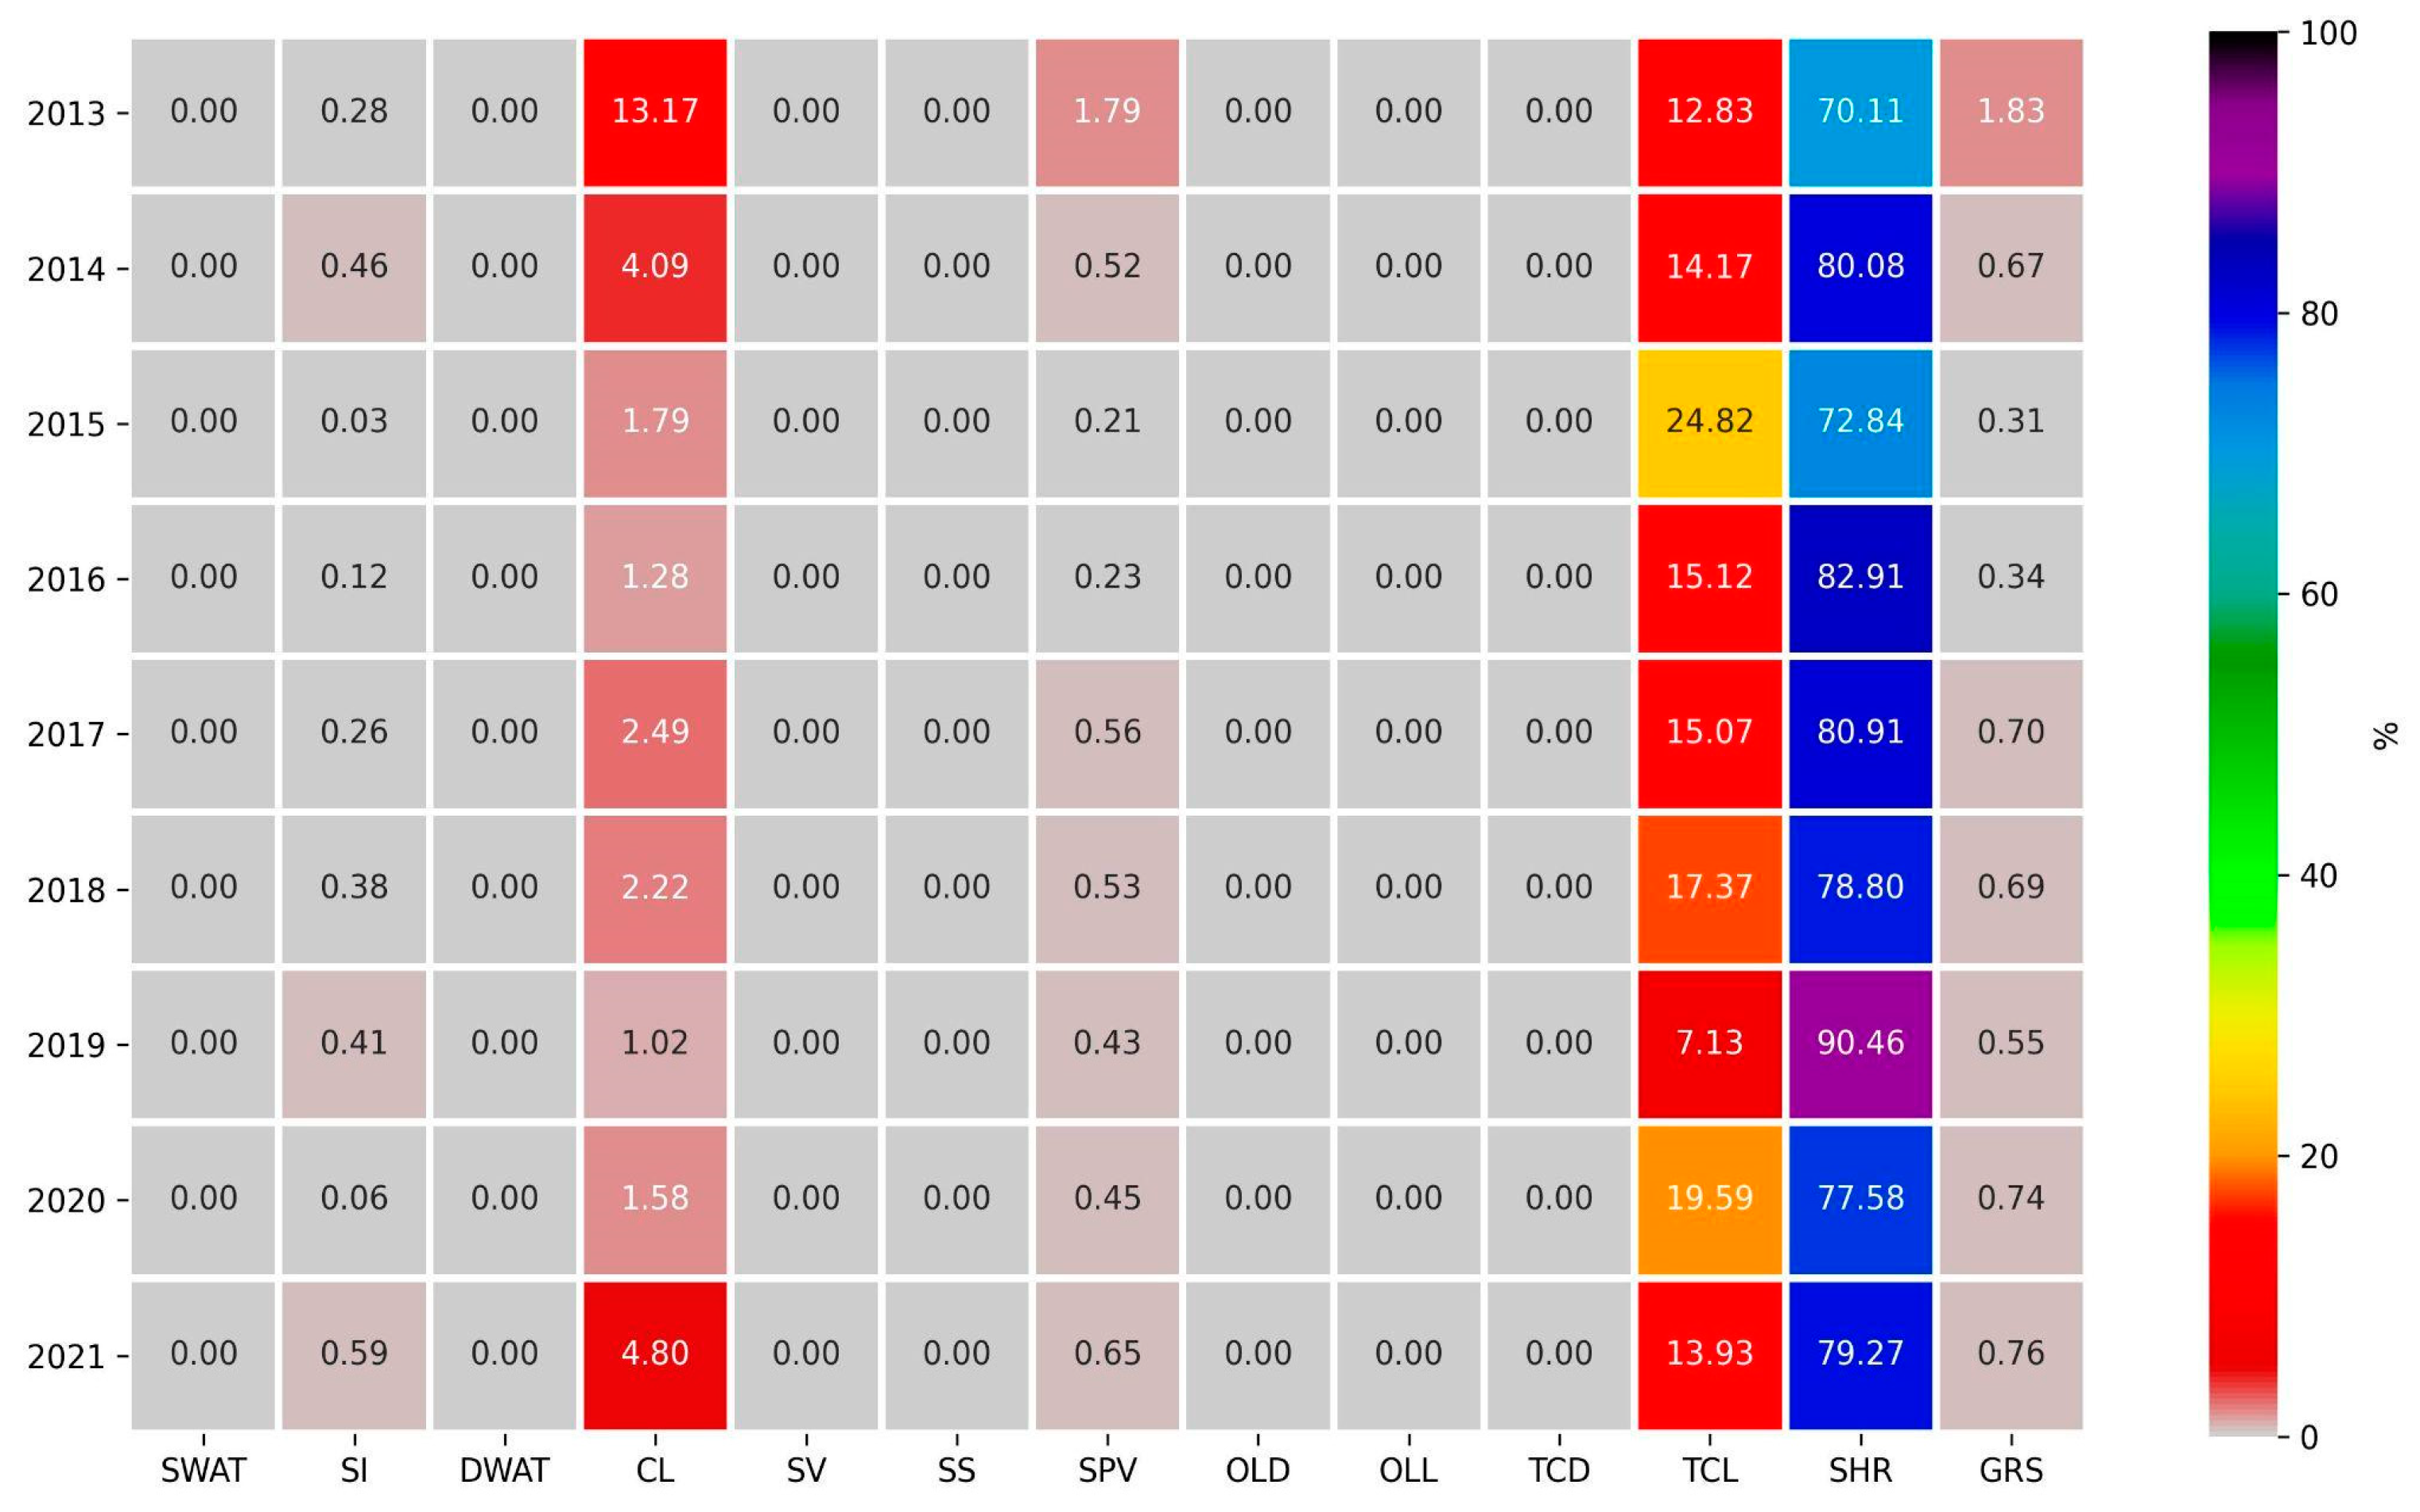
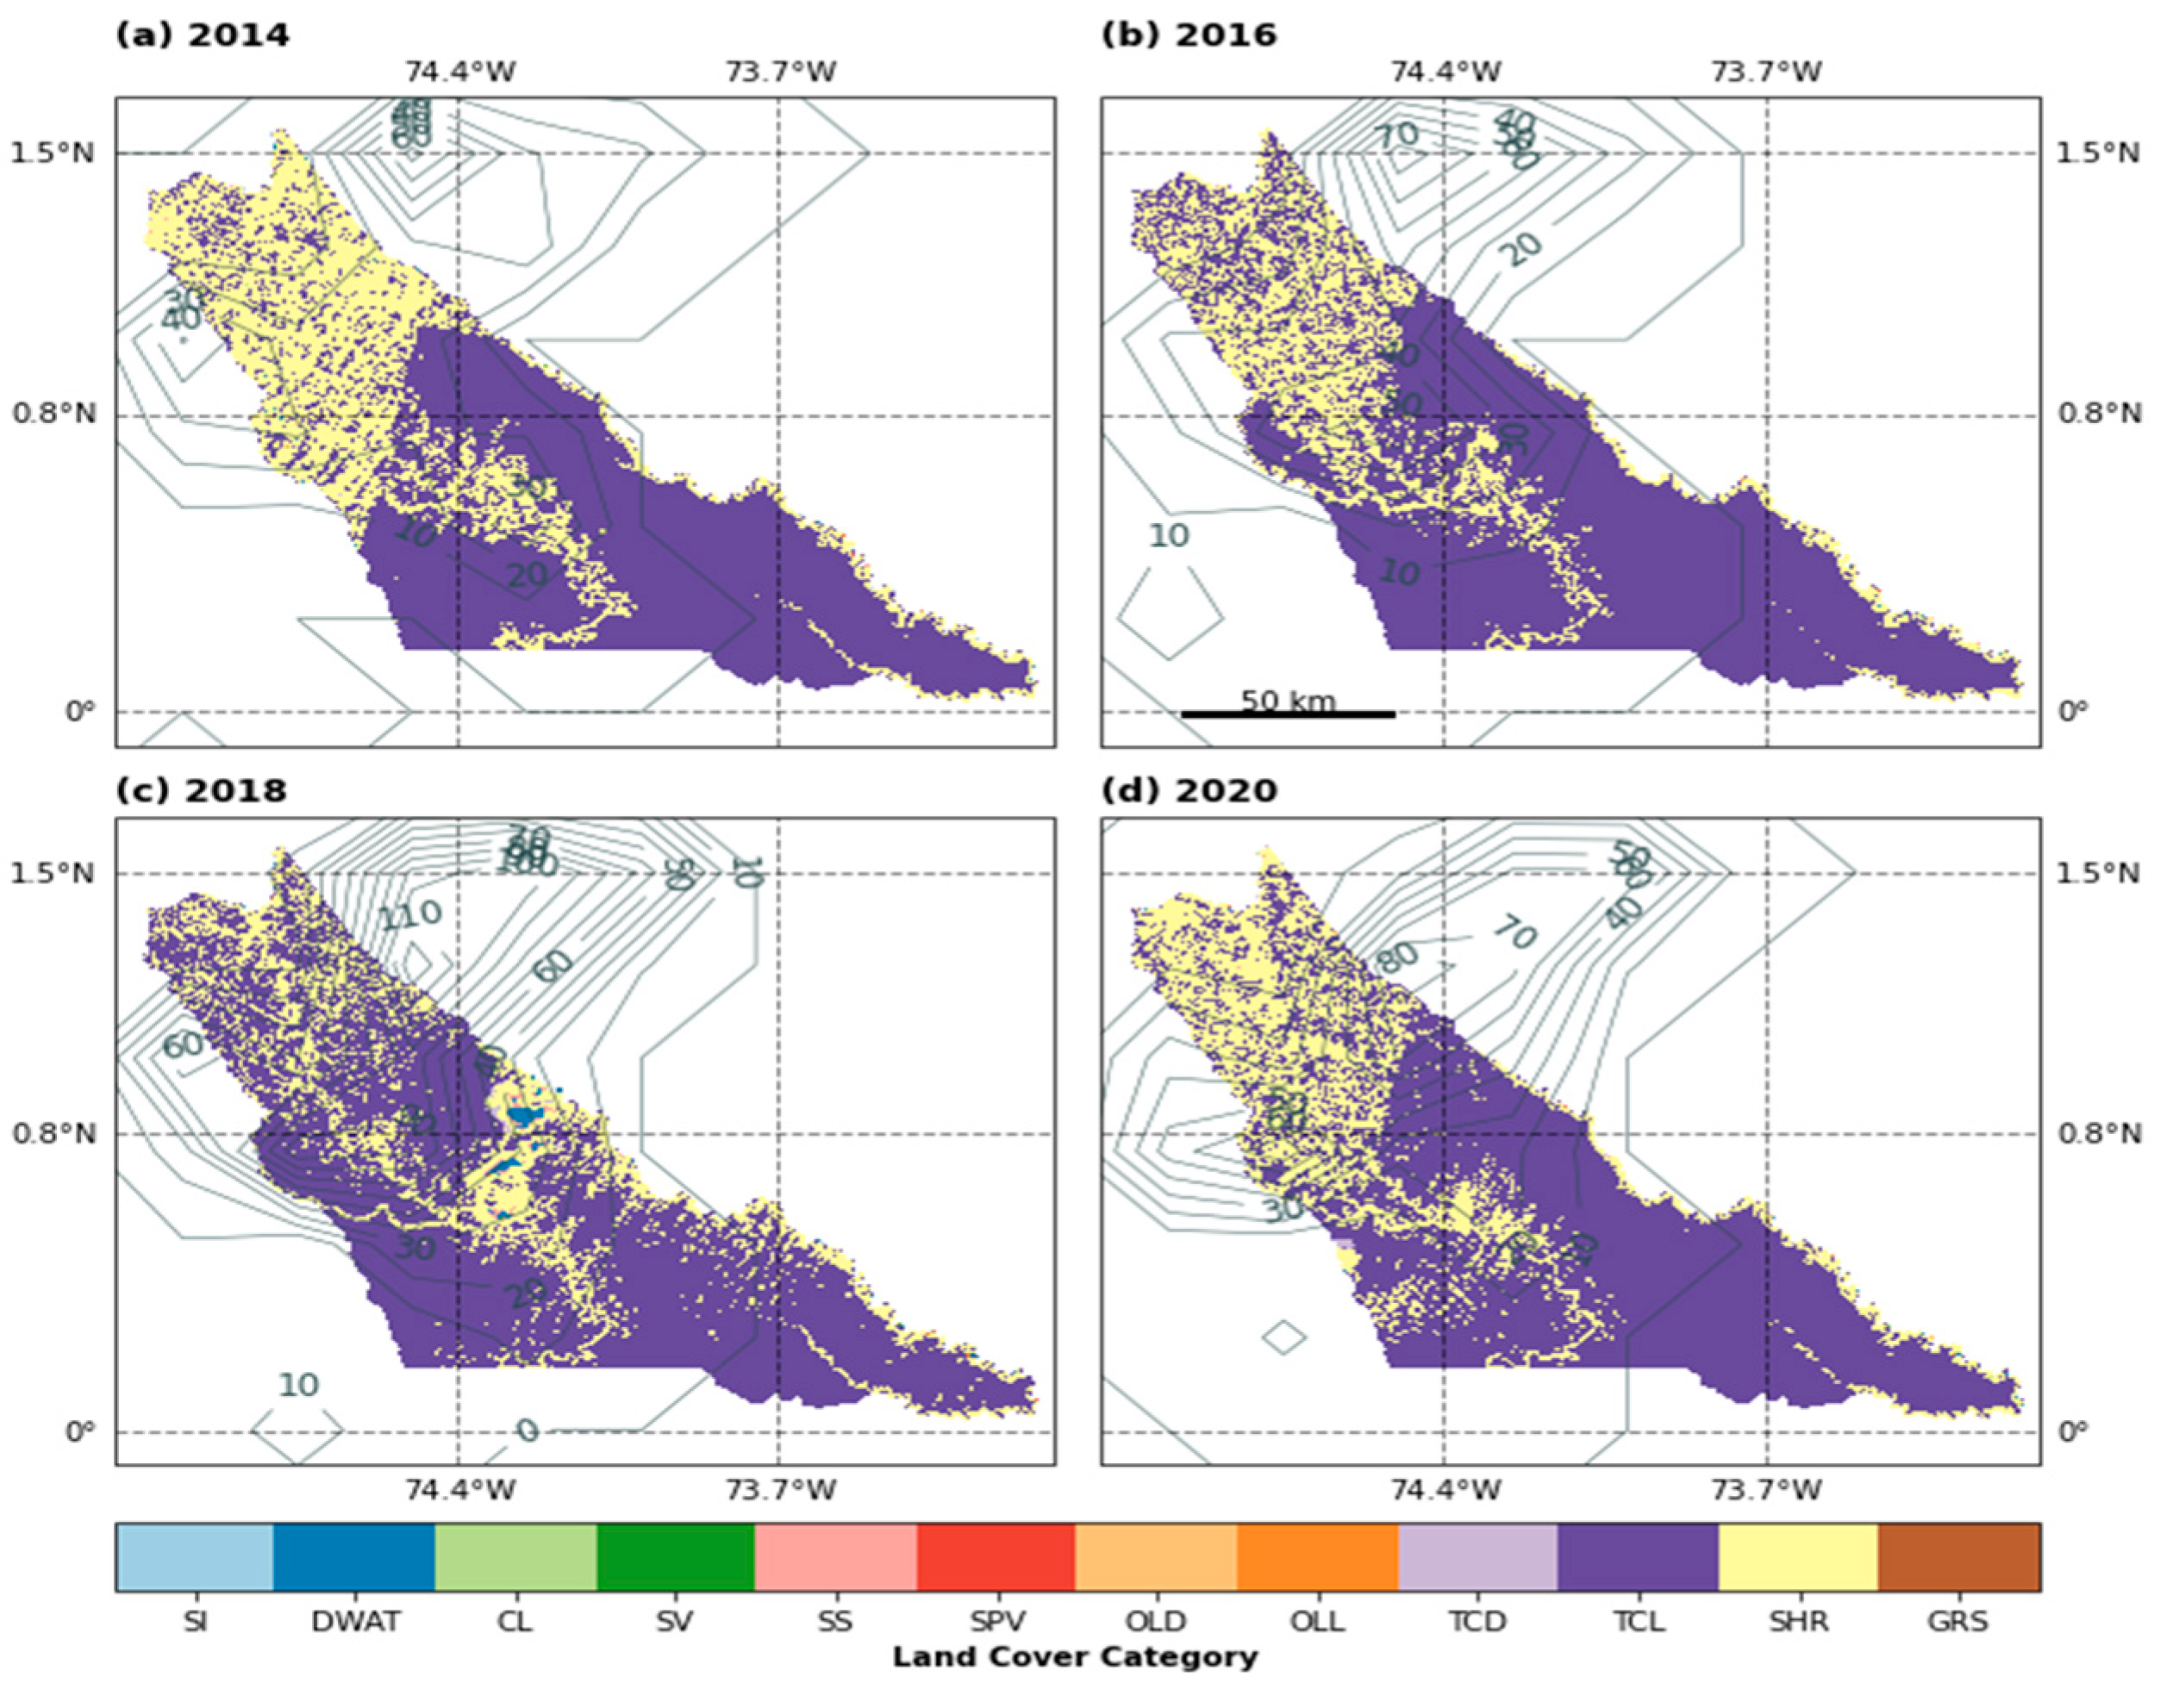
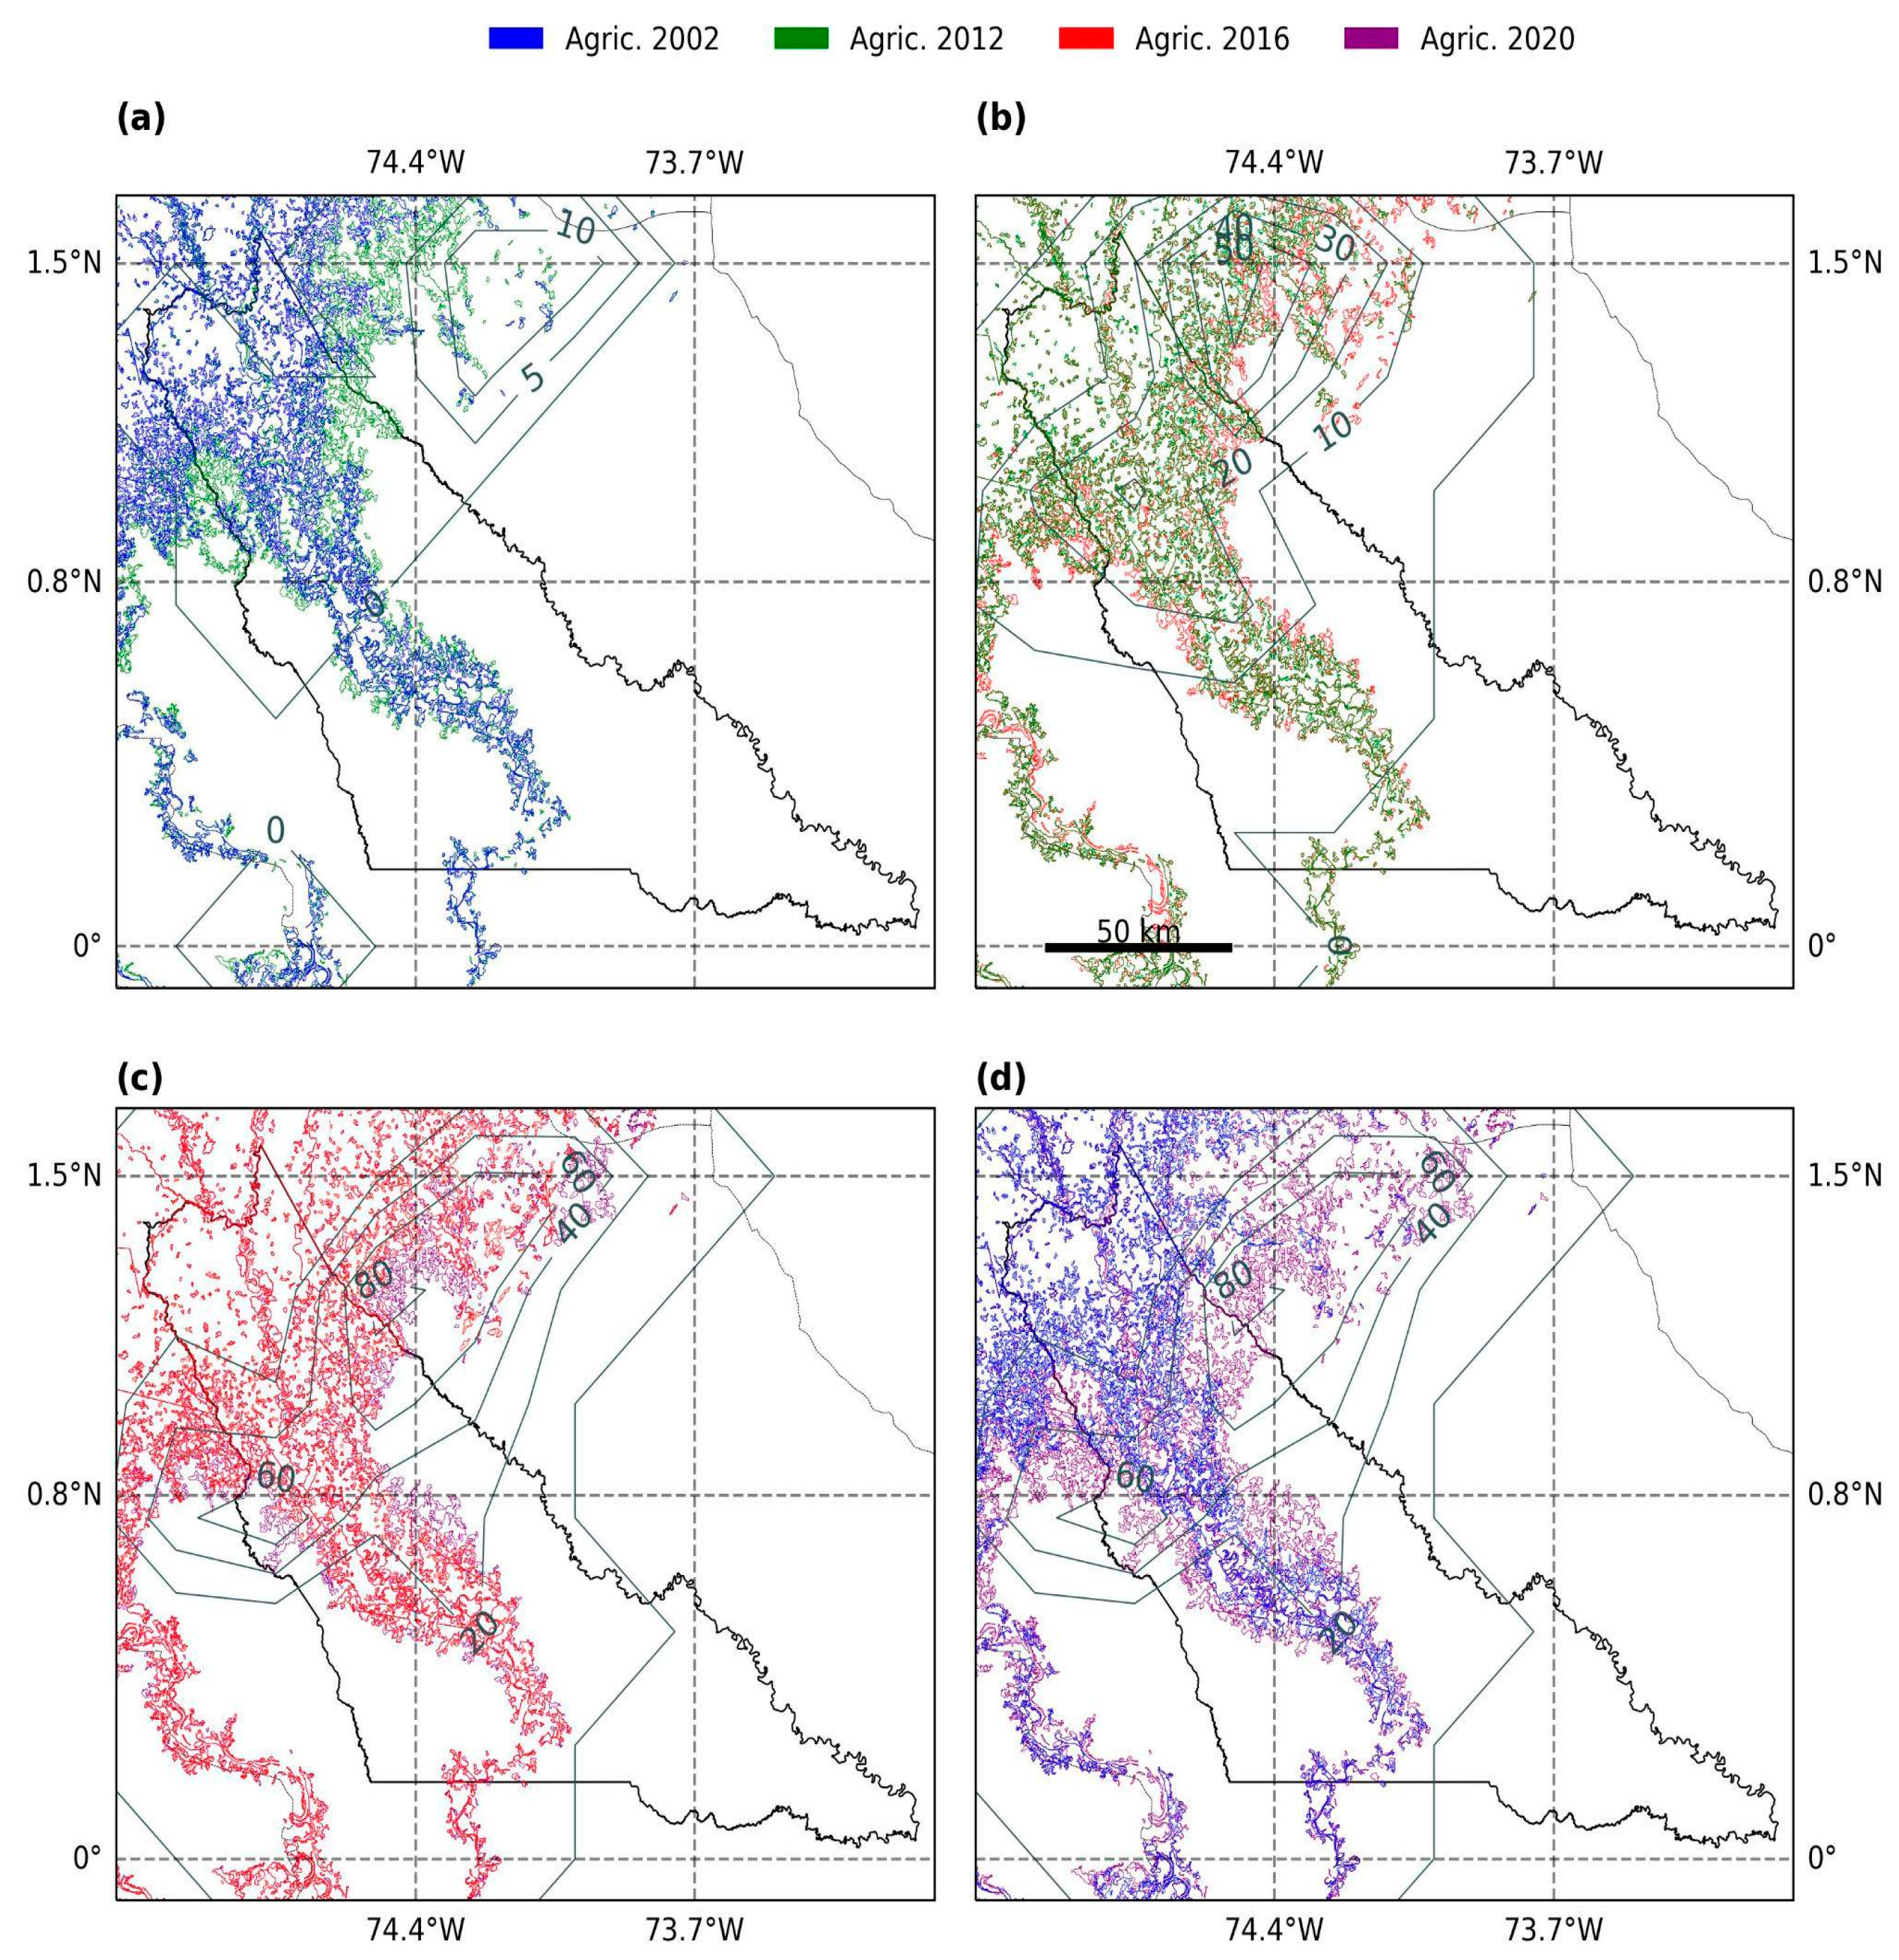
3.3. Land Cover Analysis

In the preceding section, we underscored the significance of meteorological variables and the spatial distribution of wildfires. It was evident that these fires tend to emerge in proximity to rivers (Figure 4), hinting at their connection to agricultural regions. Within this section, we focus on the relationship between fires and areas populated by shrubs, which are notably influenced by the agricultural landscape of the region. Commencing with Figure 7, we present the proportional representation of land cover categories as defined by [37]. To ensure the accuracy of this classification, we computed the classifications through two methods: (i) a procedure aligned with the methodology of [37] and (ii) a random forest classification technique [82]. The outcomes displayed remarkable consistency between the two approaches. Consequently, we opted to employ the classification methodology itself due to its reduced computational demands.
CdC exhibits a predominant land cover of shrubs ( 80 ± 5%) and a smaller proportion of trees ( 15 ± 5%) consistently across the evaluated years, as depicted in Figure 7 and Table S2. While the percentage composition of each land cover category remains relatively stable over the years, specific years demonstrate notable fluctuations in both shrubs and trees. For instance, there was a reduction of 6000 km2 in shrub coverage between 2014 and 2015, followed by recovery between 2015 and 2016. Similarly, trees experienced a significant decline (1600 km2) in the 2019–2018 period, followed by a rebound in the 2020–2019 period. These changes indicate that while the land cover undergoes considerable alterations over time, the overall percentage composition remains relatively consistent. These fluctuations could arise due to factors such as variations in satellite image sampling timing, local shifts linked to socio-economic activities, and potentially the influence of fires on land cover evolution. However, while a detailed investigation of CdC’s land cover evolution is not the primary objective of this paper, it suggests avenues for further research. In the subsequent paragraphs, we concentrate on elucidating the spatial distribution of trees and shrubs to establish connections with hotspot locations.
Depicted in Figure 8 is the spatial distribution of land cover categories across four years, juxtaposed with hotspot locations tied to wildfires. While land cover data span from 2013 to 2021, the similarity in land cover locations across these years renders a four-year span suitable as an example for the analysis. The northern region of CdC is primarily characterized by shrubs extending through the central part along the Caquetá River’s trajectory (as visible in Figure 4). Shrubs also line the eastern boundary along the Caguán River (Figure 4), as well as the southeastern zone. The remaining sectors of CdC are marked by the presence of trees, constituting part of the Amazon rainforest.
It is crucial to underscore that the origin of wildfires in the northern CdC is closely linked to shrub locations (R = 0.8, with a p-value < 0.05). Conversely, despite the abundance of shrubs near the border and southern sections, wildfire occurrences are limited (Figure 8). This disparity arises due to less favorable meteorological conditions in these areas compared to the more conducive conditions in the north and center, as evident from Figure 6. During wildfire events, the northern CdC experiences high temperatures, arid humidity levels, strong winds, and scant rainfall—factors that significantly promote wildfire development [9]. Notably, this region features shrubs tightly intertwined with agricultural endeavors (Figure 9), which have progressively expanded over time, augmenting the likelihood of wildfire occurrence as farmers resort to controlled burns for harvesting purposes (e.g., [12,83]), or even to shift crop types, such as illegal crops [8]. Notably, this evolving agricultural landscape has been shaped by both local dynamics and national policies enacted by the government, which have precipitated the expansion of Caqueta’s agricultural frontier. This trajectory raises significant concerns, given that CdC is situated within the Amazon rainforest—an area that warrants protection. Regrettably, the intrusion extends beyond local farmers, driven also by national policies and a decline in international law enforcement of deforestation and, consequently, occurrence of biomass burning and forest degradation, which increased carbon emissions and enhanced the drying of the Amazon region [84].
In summary, it is crucial to emphasize that both agricultural-related shrubland and meteorological factors play pivotal roles in determining wildfire occurrence and intensity in CdC. The presence of both these conditions is essential for wildfires to develop. In regions where both variables align to favor fires, wildfires are more likely to occur and intensify, particularly in the northern areas. Conversely, in southern areas where meteorological conditions are less conducive to fires, the incidence of fires is significantly reduced or absent. The significance of meteorology gains further prominence in the context of a changing climate, especially as agricultural policies appear to drive the expansion of the agricultural frontier. This expansion has the potential to influence the intricate relationships between water ecosystems and carbon cycles in the region. Consequently, the next section of this study delves into an extensive examination of temperature, humidity, wind speed, and precipitation patterns over the “near-future” period, spanning from 2015 to 2049.

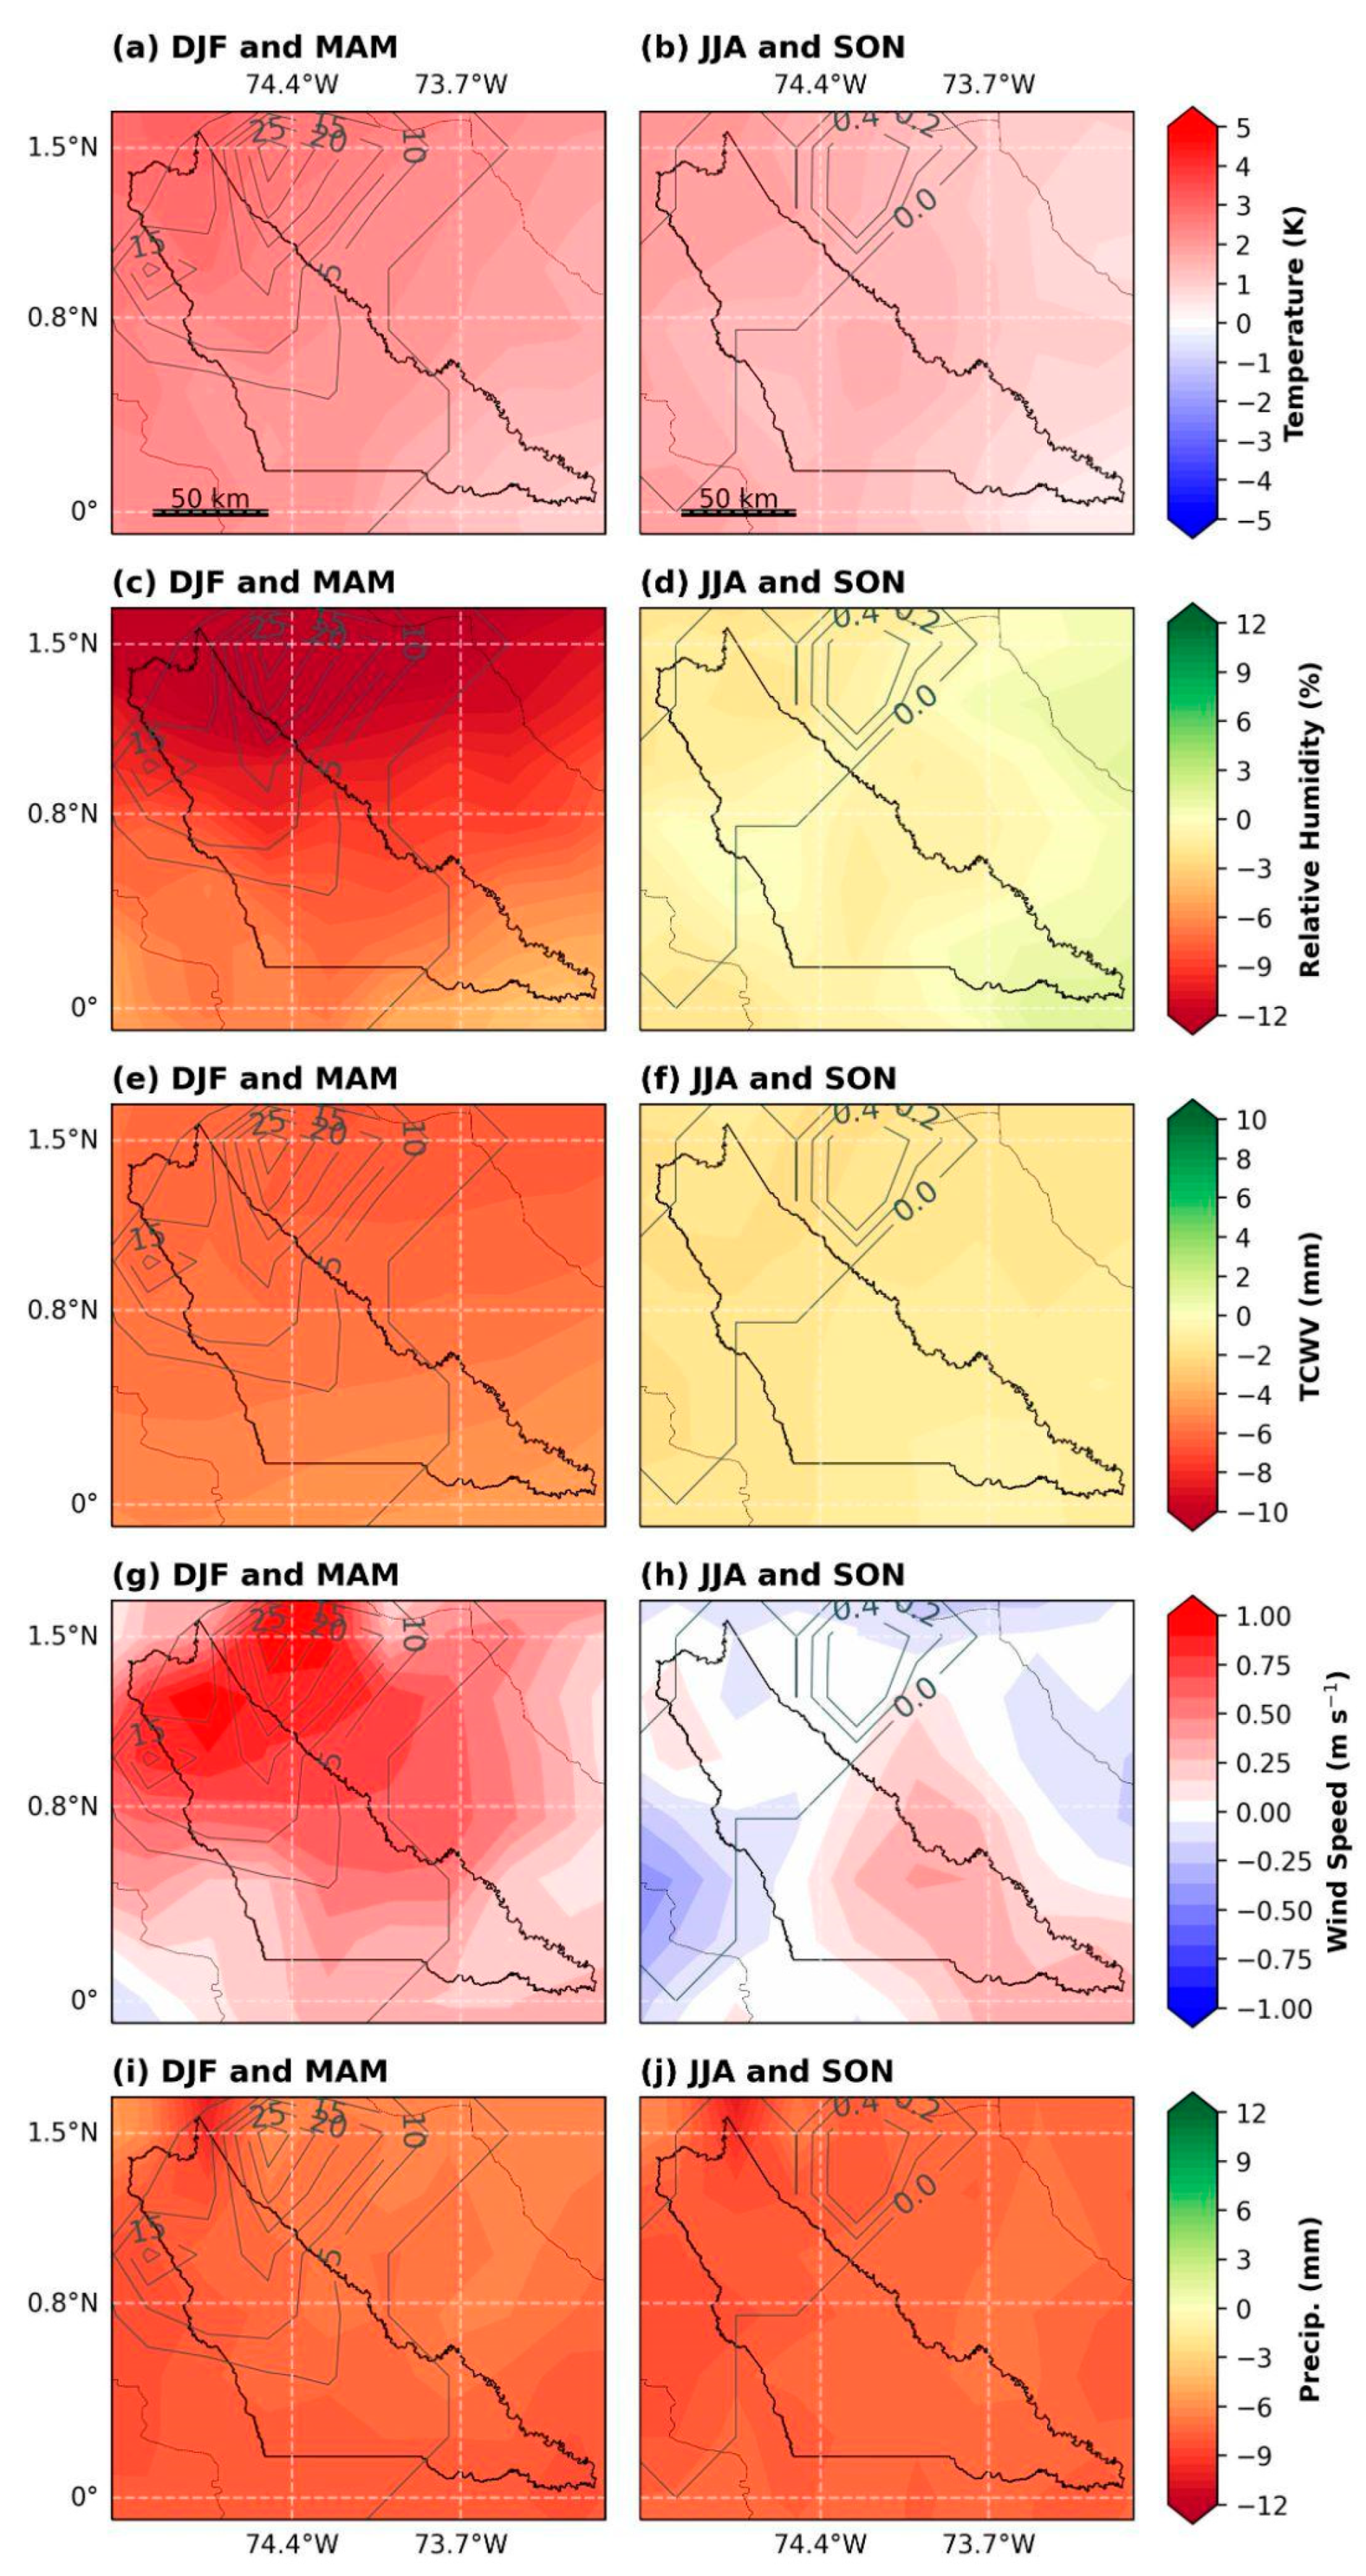
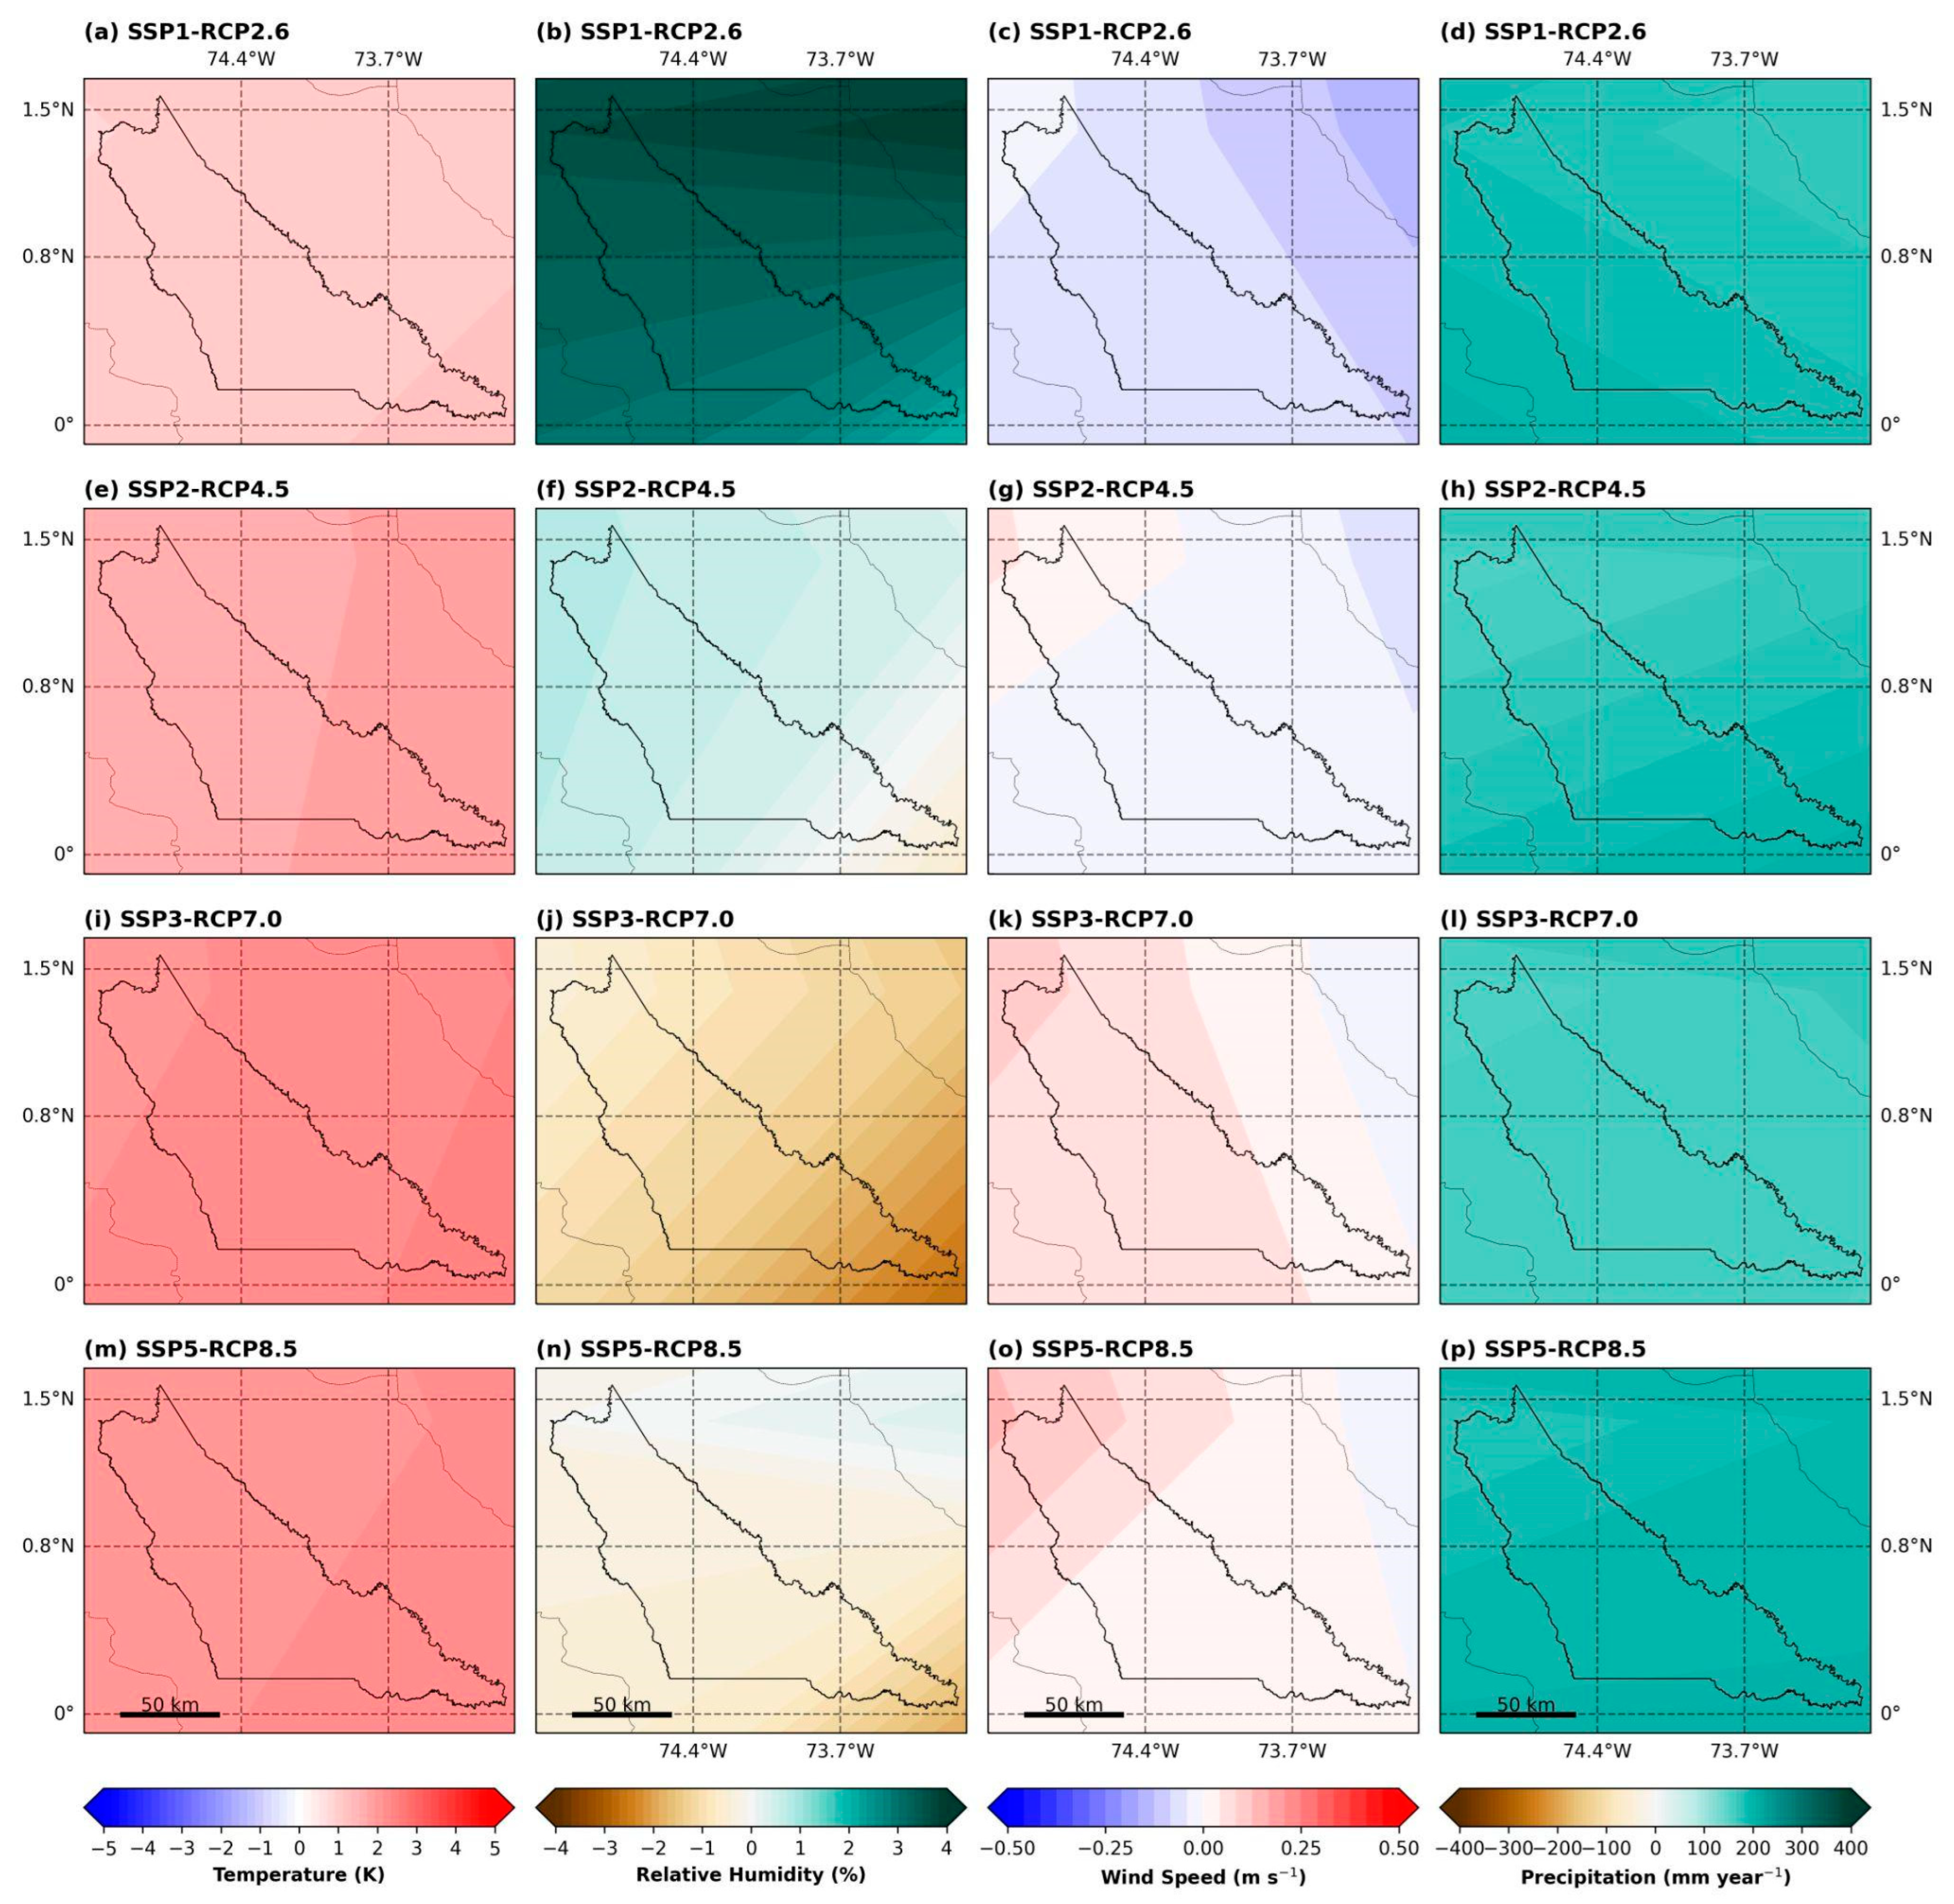
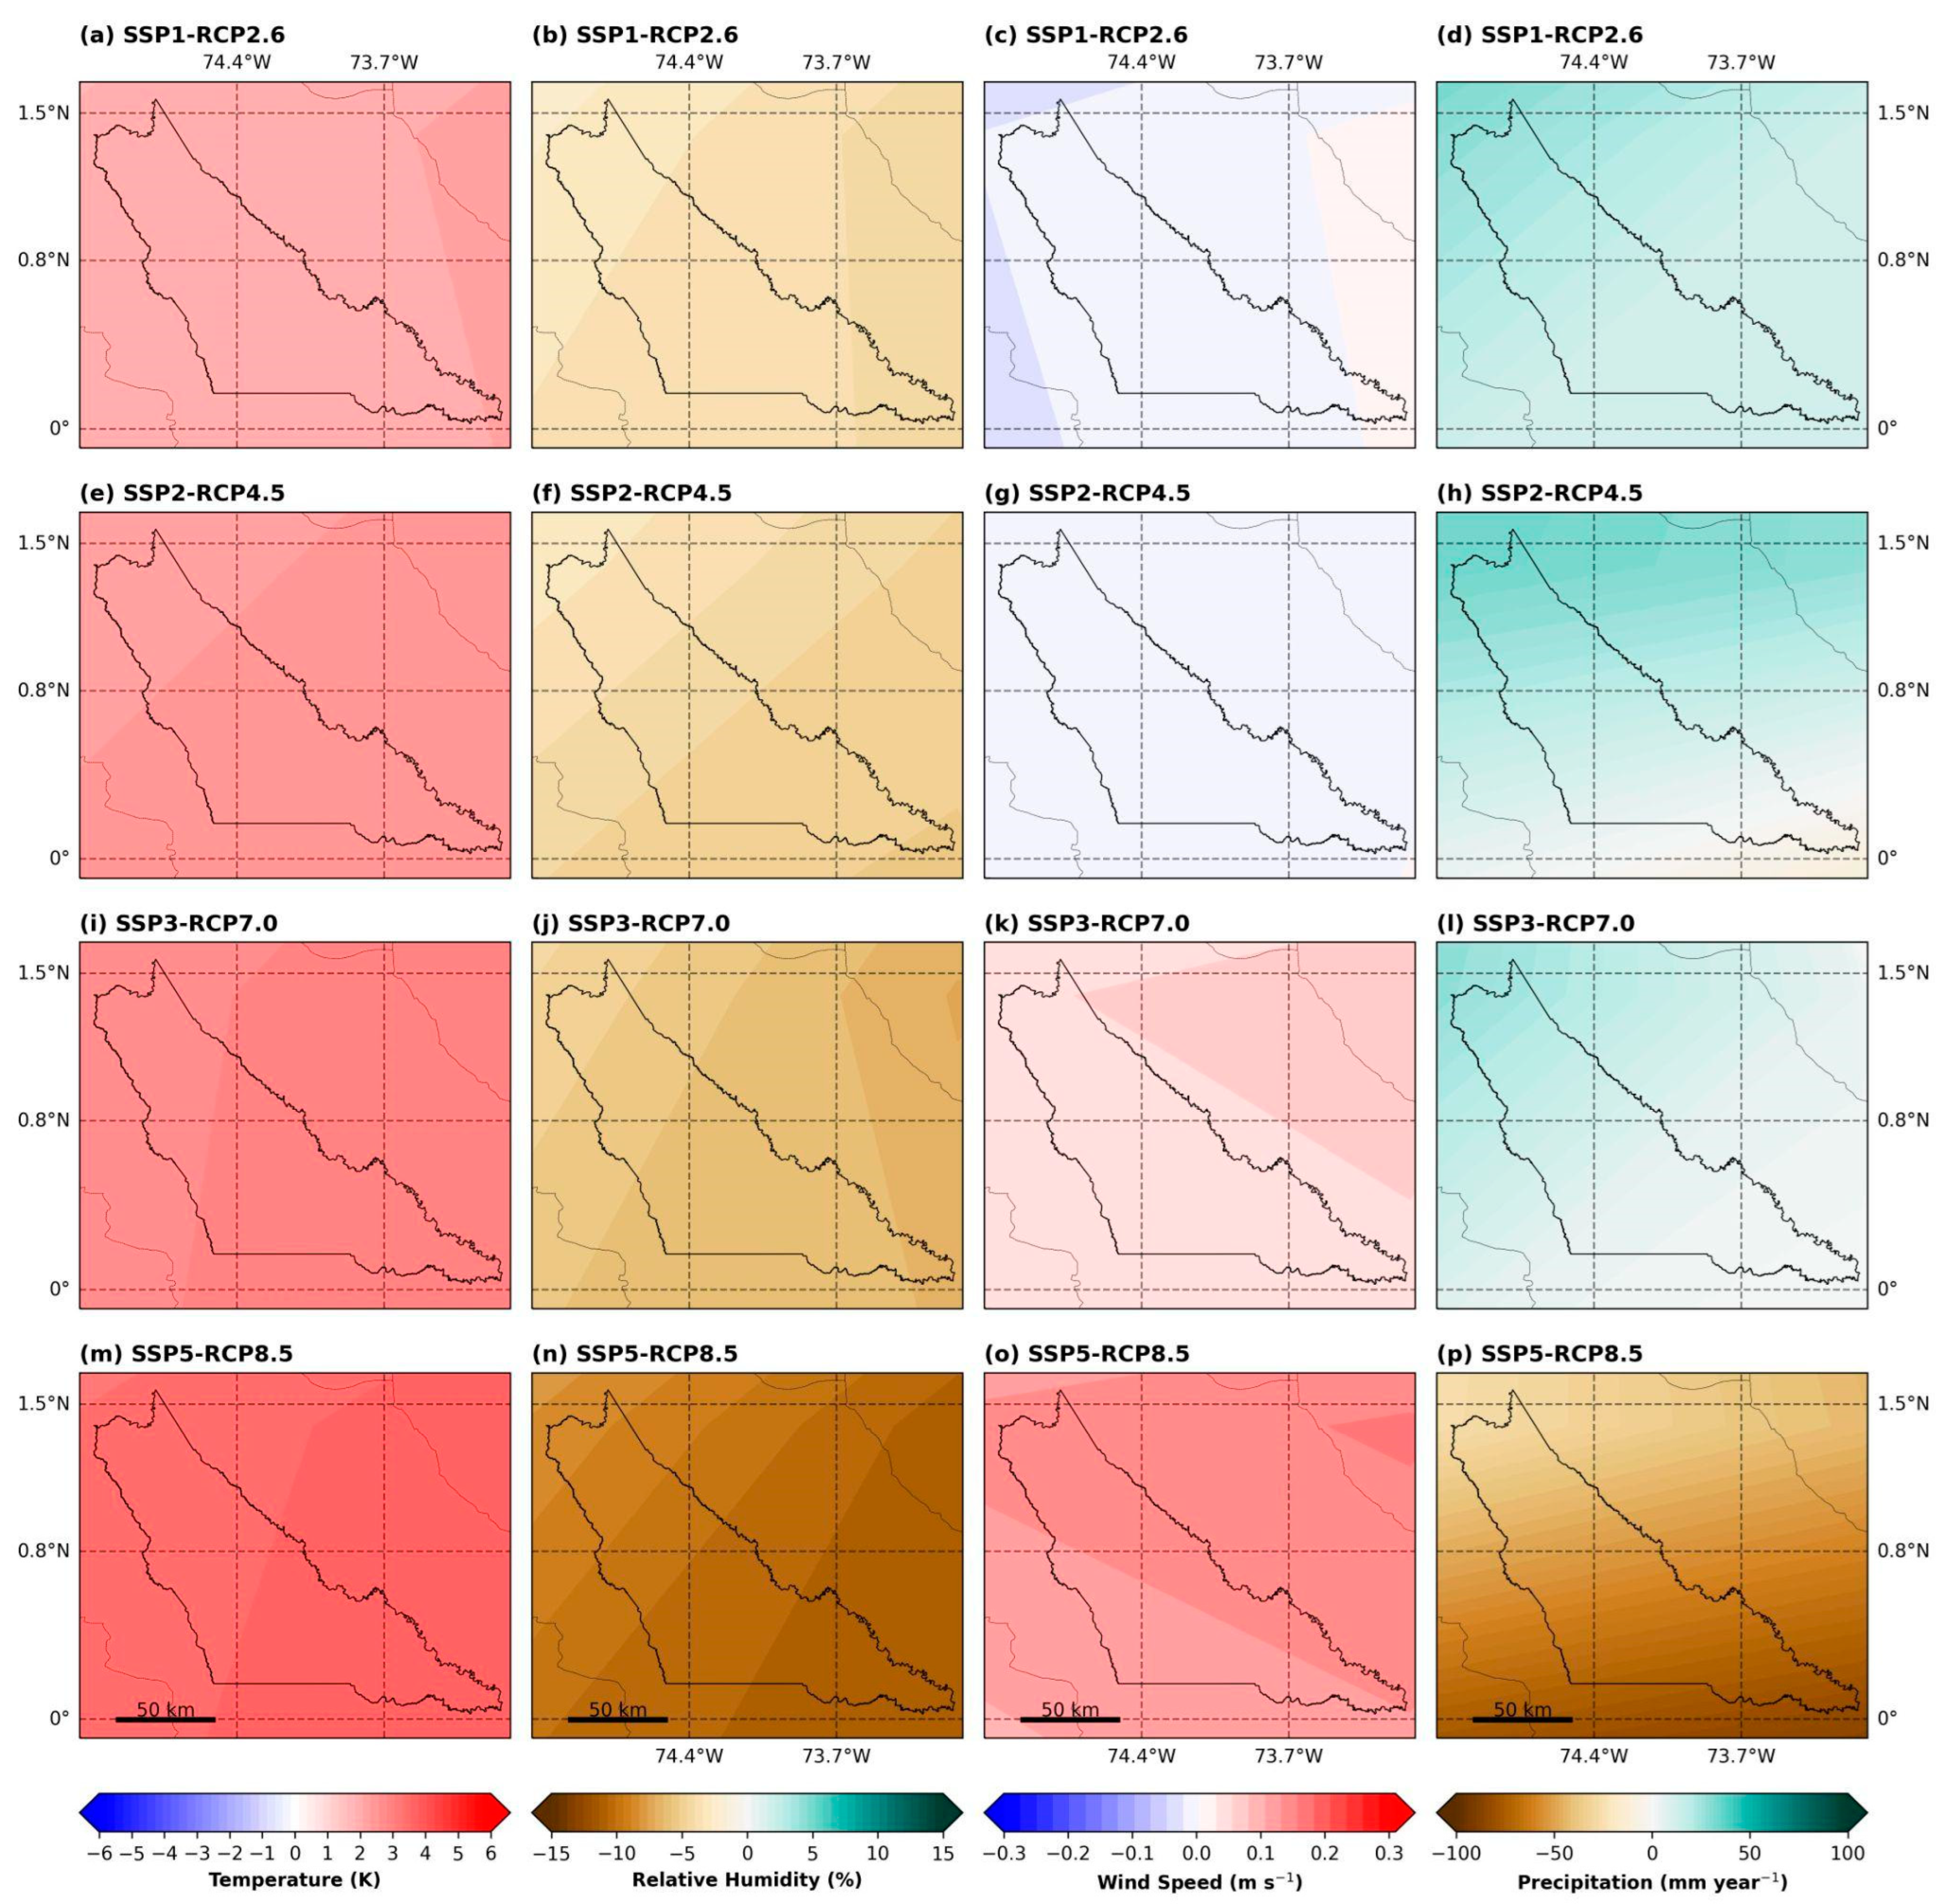
3.4. Climatological Analysis

In this section, our focus shifts to the analysis of anticipated climatological changes for the year 2049 and their interrelation with wildfire development. However, it is essential to acknowledge that this analysis remains localized and, thus, several identified phenomena and changes may lack comprehensive explanations. A broader regional analysis, considering factors such as ITCZ displacement, low-pressure system dynamics, and moist thermodynamics, would be required to offer a complete understanding, although such an endeavor falls beyond the scope of this paper.
For the SSP1-RCP2.6 scenario, ensemble mean anomalies reveal that during boreal winter (Figure 10a–d), rising temperatures would foster conditions conducive to wildfire growth. In contrast, anomalies in RH, wind speed, and precipitation would deter such conditions. Particularly in the north of CdC, the most significant RH increase transpires. These anomalies might be linked to ITCZ behavior and the Amazon’s usual low-pressure systems [23], though a comprehensive analysis is necessary to fully comprehend the underlying causes. In boreal summer (Figure 11a–d), temperature and RH anomalies would favor wildfire development, while wind speed and precipitation would impede it. Notably, the southern and eastern CdC regions experience the most prominent RH and temperature anomalies, as well as a positive wind speed anomaly, indicating a favorable environment for wildfires. While precipitation anomalies are positive, they are less pronounced than in other regions.
Considering the SSP2-RCP4.5 scenario, boreal winter anomalies (Figue 10e–h) in temperature and wind speed align to encourage wildfire development in the north, while RH and precipitation anomalies hinder it. The significance of the RH anomaly is notably less compared to the SSP1-RCP2.6 scenario, underscoring the critical importance of minimizing radiative forcing, as even a 3 Wm−2 alteration can have a substantial impact on wildfire probability. In boreal summer (Figure 11e–h), temperature and RH anomalies align more favorably for ignition, yet wind speed and precipitation work against it. Notably, the southern and southeastern CdC experience negative precipitation anomalies, coupled with significant temperature and RH anomalies, suggesting an elevated wildfire probability—a concerning prospect for this previously fire-scarce region—and actions must be taken to reduce the risk associated with fires in this zone.
Turning to the SSP3-RCP7.0 scenario, boreal winter anomalies (Figure 10i–l) in temperature, RH, and wind speed favor wildfire ignition, particularly in the south and southeast of CdC. Precipitation, however, discourages wildfire onset, albeit less significantly compared to the previous scenarios, likely due to larger-scale dynamics. Similarly, boreal summer (Figure 11i–l) temperature, RH, and wind speed anomalies establish favorable conditions for wildfires, while precipitation anomalies are unfavorable. Nevertheless, the southern and southeastern CdC regions exhibit either negative or nearly zero precipitation anomalies, indicating heightened susceptibility to wildfires, particularly in conjunction with agricultural expansion.
In the context of the SSP5-RCP8.5 scenario, boreal winter (Figure 10m–p) presents notable anomalies favoring increased fires in terms of air temperature, RH, and wind speed, while precipitation anomalies are unfavorable despite being positive. Boreal summer (Figure 11m–p), however, yields the most disconcerting ensemble mean anomalies compared to other scenarios and periods. Anomalies in temperature, RH, wind speed, and precipitation contribute to elevated hotspot occurrences, especially in the northern part of the country. This implies that under this scenario, boreal summer’s wildfire frequency could approach that of boreal winter, as these anomalies closely align with those observed during wildfire days (Figure 6). Robust policies would be imperative to safeguard the soil, ecosystems, and populace, as such meteorological conditions throughout the year would yield profound ramifications for the region’s population, ecosystems, economy, and the Amazonian Forest it is integral to.
In this section, we examine the projected impact of meteorological variables on 2050 wildfire development. A key finding emerges: any radiative forcing increase surpassing 2.6 Wm−2 could profoundly affect the region, particularly during boreal summer, potentially fostering year-round favorable wildfire conditions, a departure from the current boreal winter dominance. Intriguingly, while wildfire conditions may intensify in the north, they could also extend to the south, where flammable vegetation currently experiences fewer fires. Although most scenarios indicate increased precipitation, a potential wildfire mitigator, rising temperatures and reduced RH in most scenarios emphasize the urgent need to acknowledge climate change. This underscores the importance of implementing comprehensive strategies and policies for adaptation and mitigation. These measures are critical, as urban areas, ecosystems, and essential economic activities remain vulnerable to the far-reaching impacts of climate change and wildfires. The subsequent section of this study endeavors to assess potential mitigation strategies. We employ an ML approach similar to the one developed by [13] to explore these strategies in depth.

3.5. Model Evaluation and Proposed Strategies

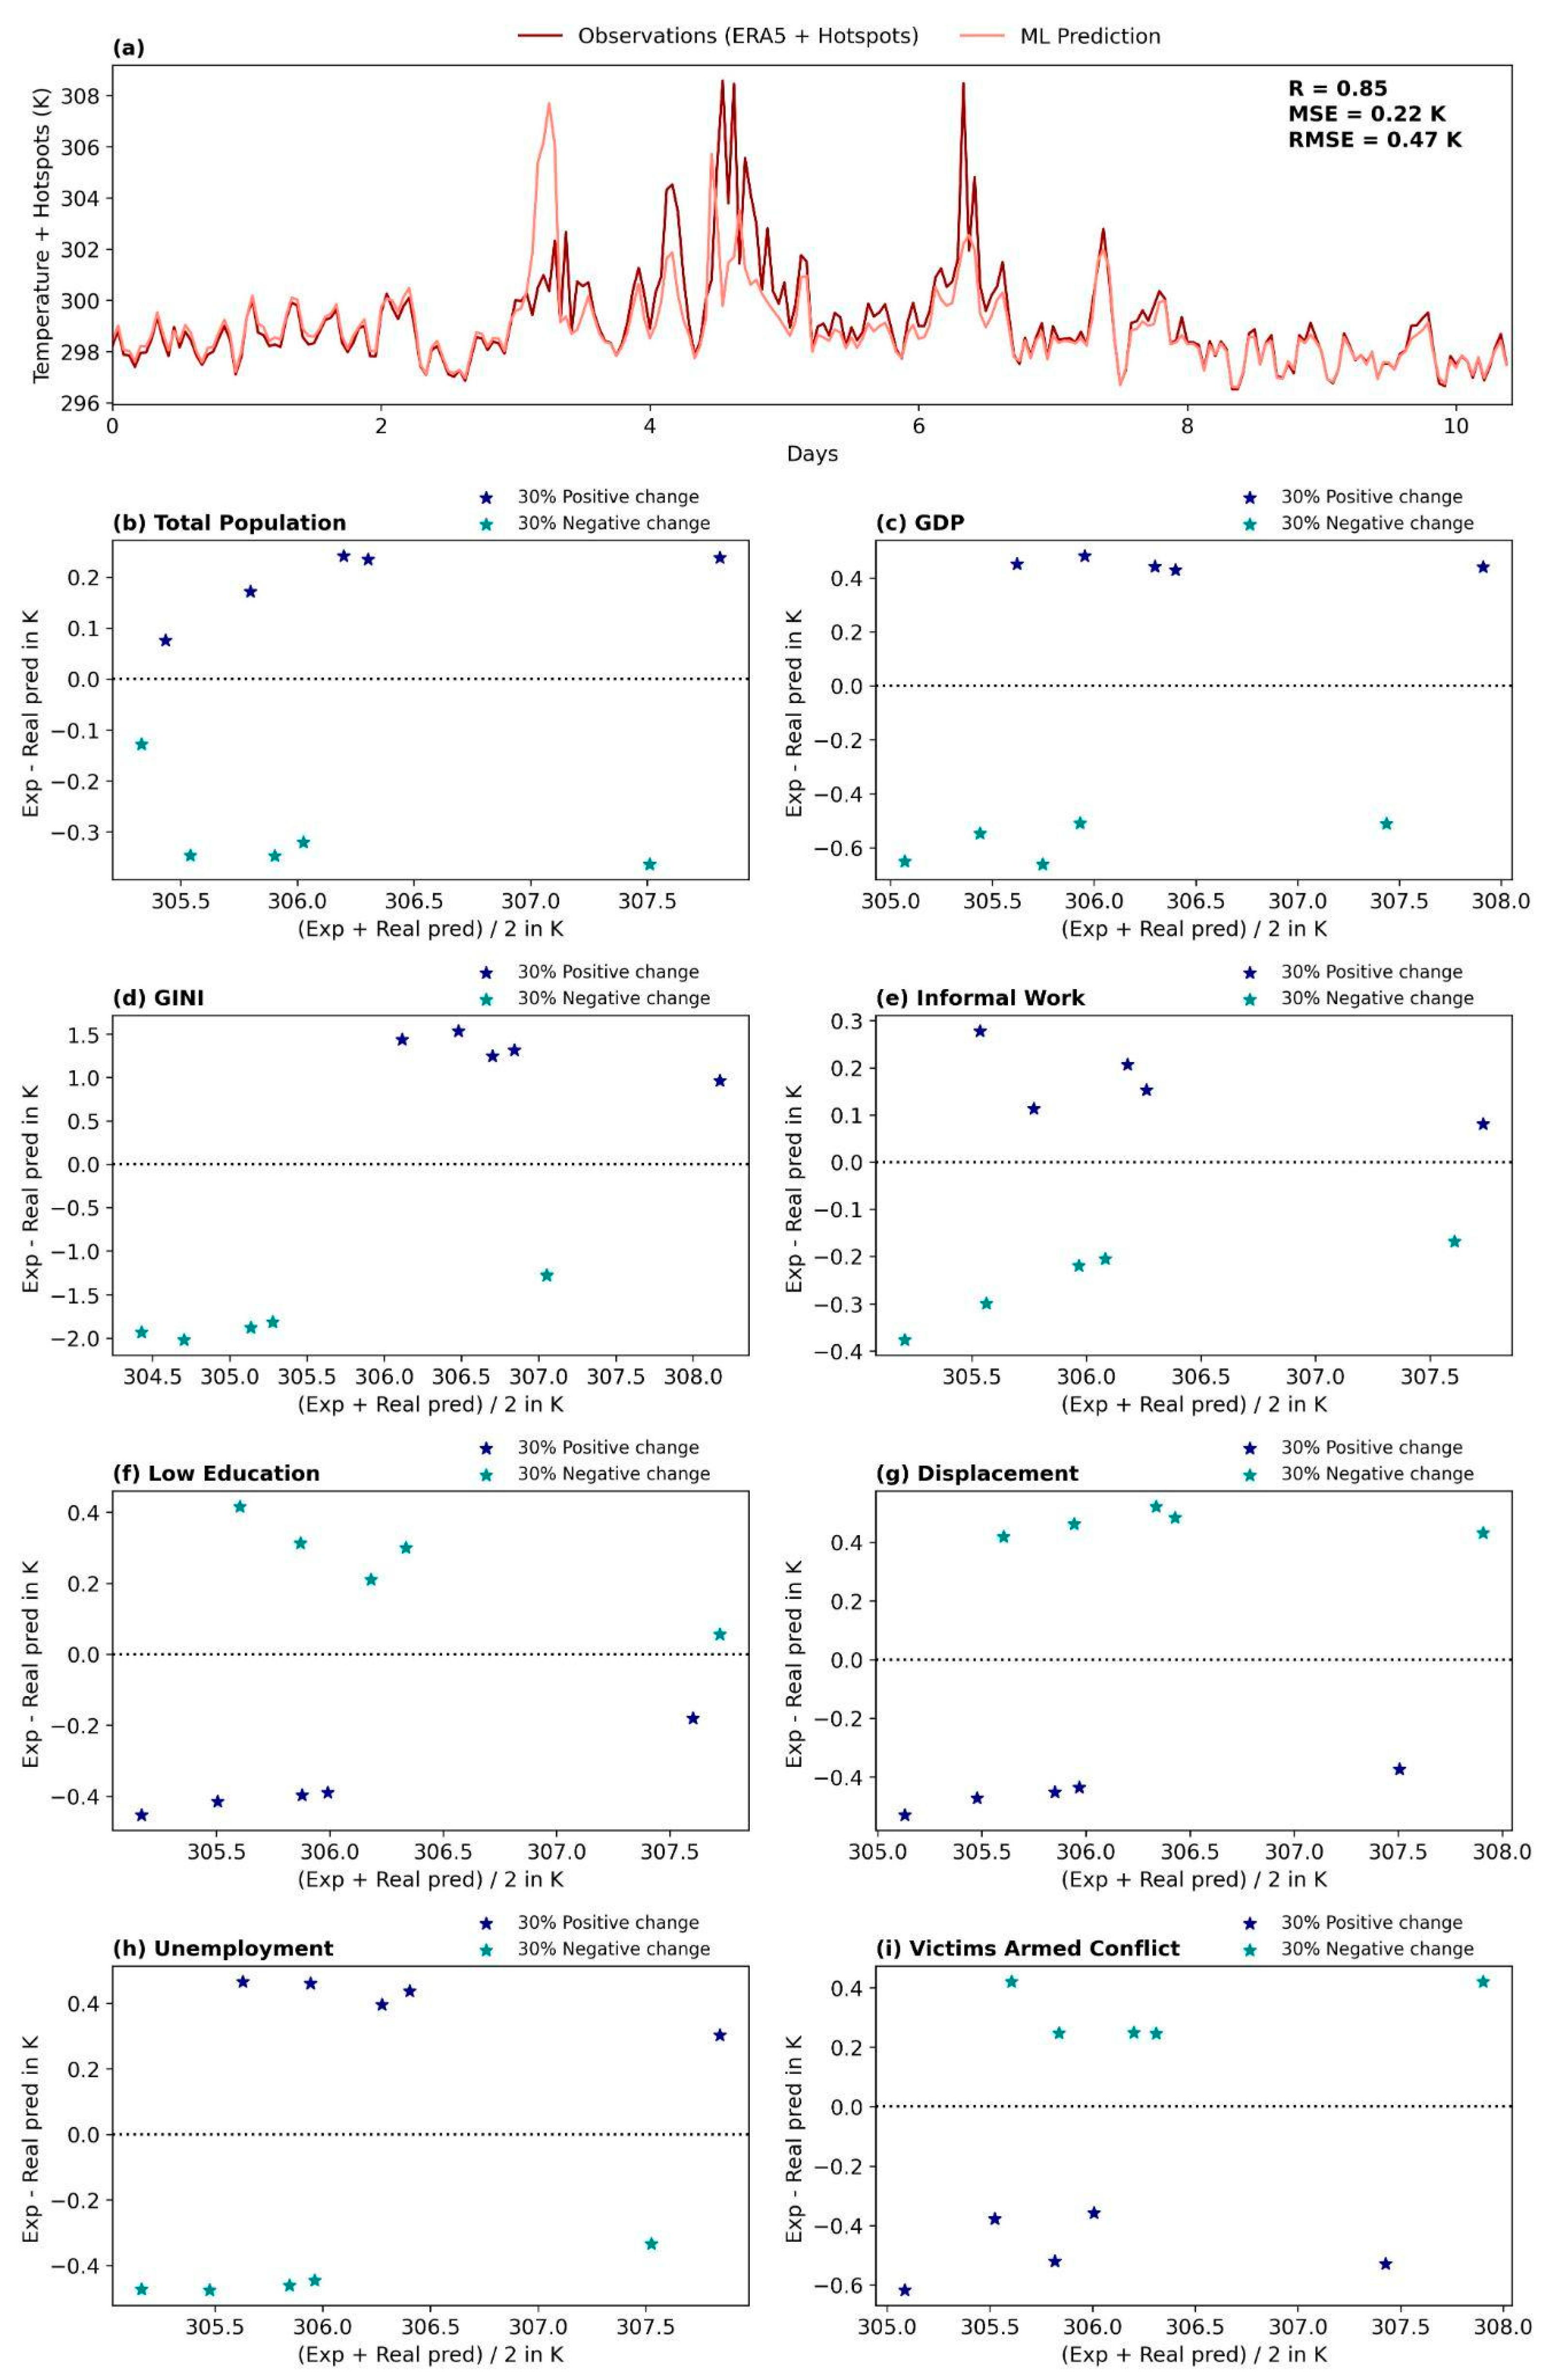
3.5.1. Model Results and Sensitivity Experiments

Before diving into the details of the conducted sensitivity experiments, it is essential to assess the performance of the ML model to ascertain its capacity to accurately depict wildfire occurrences [11]. Figure 12a illustrates the temporal progression of both observed data and ML model outcomes over a span of 10.5 consecutive days, while validation encompassed 20% of the dataset (refer to the Method section for comprehensive information). During periods devoid of active wildfires, the model exhibits exceptional precision; however, this precision diminishes during instances of fire occurrence (days 3 to 5). Nonetheless, the model is able to capture the upsurge in temperature and the associated peaks correlated with fires. Evidently, statistical metrics (depicted in Figure 12a) corroborate the model’s robust performance in representing both the magnitude (RMSE = 0.47 K and MSE = 0.22 K) and temporal evolution (R = 0.85) of temperature.
Given the ML model’s capacity to faithfully depict both temperature magnitude and evolution, including temperature peaks linked to wildfires (e.g., [11]), we leverage this capability to investigate the variables exerting the most substantial influence on temperature values during wildfire occurrences (temperature > 304, with consistent conclusions for alternative thresholds) when these variables are altered (refer to the Method section for details). In the realm of meteorology, RH, TCWV, and precipitation emerge as potent determinants of the model’s output [9]. Notably, an increase in these three parameters leads to temperature moderation, thereby diminishing the favorability of wildfire conditions (Figure S4a–c). Moreover, wind speed influences temperature, causing a decrease when it diminishes; however, with a comparatively lesser impact relative to other meteorological variables (Figure S4d). These findings align with theoretical expectations and the outcomes of prior sections and with the results of [85,86], reinforcing the model’s accurate representation of the interconnectedness between meteorology and fires. This suggests that the model could also aptly incorporate socio-economic variables, although this relationship might be less transparent.
Turning to the socio-economic experiments (Figure 12), the variables inducing the most substantial impacts on wildfires are GDP, GINI (of paramount significance) (e.g., [47,50], and armed conflict victims, closely followed by displacement of people, unemployment, and lower education levels. Informal work and total population also generate changes in wildfire patterns [44], albeit with less pronounced effects. The salience of the total population (Figure 12b) stems from the tendency of newcomers to colonize various areas, engaging in informal work and individual planting practices lacking in best practices. Elevating GDP (Figure 12c) tends to suppress wildfire incidents, as increased financial resources imply enhanced technologies and practices for soil protection and harvesting. This alignment with GINI outcomes (Figure 12d) underscores a decrease in wildfires with reduced inequality [51], as equity entails job creation, a decline in informal labor, and better agricultural practices and infrastructure.
The GINI experiment underscores that reducing unemployment (Figure 12h) and informal work (Figure 12e) diminishes wildfire favorability (e.g., [52,54,56]). This can be attributed to fewer potential ignition sources, decreased involvement in illegal activities like illegal crops (linked to fires, as per [8]), and improved conditions due to reduced inequality. Education’s significance is also apparent in GINI results, where diminishing low educational levels (Figure 12f) disfavors wildfires ([51,56]). Multiple factors contribute to this: (i) educated individuals are less prone to ignite forests or crops, (ii) they are less inclined towards illegal activities, i.e., illegal crops, and (iii) enhanced agricultural knowledge fosters better practices, safeguarding soil and discouraging fires [15].
Conversely, displacement and armed conflict victimization are closely intertwined, with displacement primarily arising from Colombia’s internal conflict. Interestingly, an increase in conflict victims and displacement leads to decreased fires. This is because heightened agricultural activity is curtailed, as people are reluctant to enter forests or agricultural areas due to the risk of encountering armed groups overseeing illegal crops [8]. These findings emphasize the government’s responsibility to not only conclude the conflict but also integrate displaced individuals into groups that contribute to CdC’s educational, economic, and agricultural progress. Ceasing hostilities could yield unintended benefits, transforming challenges into opportunities to enrich lives, enhance agricultural practices, bolster connectivity, expand job opportunities, and develop technologies. Such growth would be personally and communally transformative, aiding CdC’s advancement and concurrently diminishing GINI while bolstering GDP, thus reducing wildfire vulnerability from multifaceted angles.

3.5.2. Proposed Strategies

Our approach first presents existing strategies as a foundation, followed by new proposals, enhancing transparency in their development. Assessing the socio-economic analysis and CdC’s recent government program [14] focused on forest fires, we find the proposed strategies fundamental to shaping our approach. The plan emphasizes boosting technical and non-formal education for adults in non-formal jobs and implementing integral farms in schools for agricultural practices. It also emphasizes rural advancement and agricultural production for food sovereignty.
Apart from agricultural production, it is important to emphasize the immense potential of the bioeconomy within the Colombian Amazon region, closely aligned with the Colombian Green Growth Policy [87]. This presents an opportunity to transition towards a production and food sovereignty paradigm that intricately connects culture, biodiversity, and sustainability. Furthermore, this vision resonates with the National Development Plan (2022–2026), which is centered around productive transformation, and bio-based enterprises have an essential role to play here [88]. They can make substantial contributions by implementing sustainable and inclusive production models that harness the region’s unique endemic resources. These innovative business models may encompass a wide range of offerings, from direct-to-consumer products sourced from sustainable agriculture and aquaculture to items derived from responsibly managed wildlife, as well as nature-based tourism services and various other ecosystem services [89]. This holistic approach holds the promise of catalyzing positive change across multiple dimensions.
The central focus on fire-related issues lies in agriculture. Strategies concentrate on providing technical aid, training, and assessing the environmental and societal impacts of new practices. Land tenure is prioritized to enable farmers to improve their livelihoods through agriculture [14]. Financing comes from municipal, regional, and national budgets, agricultural yield, and external sources. The plan supports local farmer associations and initiatives to enhance livestock security. Economic diversification includes creating poultry and fish farms managed by local producers. Funding family farming aims to support small-scale producers’ income, aligned with post-conflict efforts and environmental conservation [14].
While the government plan’s strategies offer valuable insights, some diverge from fire mitigation needs and sustainable Amazonian goals ([90,91]). We propose preliminary measures considering meteorological, vegetation, and socio-economic findings and near-term climate projections (2050), focusing on land cover and economic and social aspects to sustainably mitigate forest fires in CdC.

Land Cover Strategies

  • Since the municipality shows a strong susceptibility to fires where vegetation is dry and small. It is imperative to maintain hydrated soil, using plants that retain moisture and evaporate slowly to disfavor very dry conditions that could promote wildfires. These can be done by using nanomaterials and hydrogels that retain humidity in the vegetation cover (e.g., [92,93]).
  • To reduce vulnerability to forest fires, proactive measures include planning of areas, monitoring land cover changes (to shrubs), and preventing illegal settlements (population through colonization) [94]. Integrating the identification of Wildland–Urban Interface (WUI) zones into planning tools serves as a guideline for fire prevention and risk reduction. This strategy is applied in municipalities with varying levels of socio-economic vulnerability, aiming to safeguard populations from fire-related risks ([95,96,97,98,99]).
  • To protect the deforested border (ecotone), we propose granting monitored concessions to small landowners with significant forest areas in their plots. These concessions would be located within the deforested portions and accompanied by integrating value chains for endemic fruits and high-value agroforestry products (e.g., acai, camu-camu, buriti, etc.), disallowing the proliferation of shrubs. This approach represents a significant policy shift, moving from encouraging deforestation to promoting sustainable agroecology and natural forests. While unprecedented in Colombia, similar bioeconomy strategies [100] and effective land market management offer a potential pathway for conserving Amazonian forests and biodiversity (reducing shrubs and improving temperature conditions through shading).
  • Holistic forest fire management spans prevention through impact reduction, encompassing individual responsibility, community engagement, resident training, and fire mitigation equipment provision (tackling low-level education and unemployment). This strategy also entails deploying fire detection systems and communication networks and protecting strategic ecosystems in the region (e.g., [11,101]). This comprehensive approach strives to avert fire incidents and minimize their adverse repercussions on both communities and ecosystems. The strategy encompasses situational awareness, long-term evaluation, monitoring and control, as well as post-fire assessment [101].
  • The convergence of community and ecological networks is crucial for (i) guiding land management choices, (ii) comprehending the area’s social, environmental, and economic context, and (iii) forging an innovative framework to interconnect social and ecological systems [102]. This calls for prioritizing practices that harmoniously blend these dimensions. Creating agroecological training collaborations across public, private, and non-profit sectors can facilitate education, implementation, support, and adaptation of these practices (improving community knowledge).
  • Evaluating positive and negative incentive policies is essential. Prohibitions need counterbalancing with rewards. For example, investing in social initiatives could offset the costs of practices like pasture rotation and trial verge management, aligning with the national development plan’s rural sustainability goals (affecting the GDP and GINI). This approach could catalyze the adoption of agroecological methods.
  • Strengthening government-led territorial consolidation requires a dual focus on infrastructure and culture (pursuing inequality). Notably, collaborative small-scale clearances by peasant families contribute significantly to deforestation. To mitigate this, a comprehensive approach addressing environmental and social dimensions is crucial.
  • Given that our results indicate the significance of RH and temperature as robust predictors of fires, it is crucial for the municipality to prioritize the measurement and monitoring of these variables. This proactive approach is essential for both fire prevention and timely response (nowcasting).

Economic Strategies

  • Securing research funding is a challenge for institutions in the Global South ([103,104]). Navigating grant applications and subsidies can be complex, delaying scientific projects and international collaborations [105]. Urgently, transparent funding management policies are needed to ensure equitable access to research funds, reducing administrative burdens and benefiting researchers from both national and international contexts (improving GDP, unemployment, GINI, and education). However, implementing such policies may require new administrative structures, like ethics committees, entailing financial and time investments ([106,107]). Nevertheless, this effort can raise awareness among administrators about funding opportunities and contribute to institutional growth [108].
  • Certain funding opportunities prioritize international collaborations, allowing ecologists and conservationists from the Global South to lead research grant applications, ensuring fair access and benefits for all collaborators [109]. Taking charge of funding applications may involve more work, including identifying suitable funding sources and aligning proposals with standards. Despite the added workload, it enables well-structured collaborations with global researchers and widens funding options. Moreover, it helps funding agencies appreciate the needs of Global South recipients, leading to more inclusive grant requirements [110]. Currently, limited funding supports joint research between the Global South and international researchers, hampering collaboration based on shared interests. Increasing research awards for early international agreements holds potential for nurturing cross-cultural scientific partnerships [108].
  • Regarding funding, it is noteworthy that private financing is lacking due to the non-commercial nature of rainforest conservation and restoration endeavors. These initiatives lack appeal to financial institutions. Nevertheless, livestock ownership may align with financial institutions’ interests, offering lending opportunities compared to voluntary-based rainforest conservation efforts (private donations).

Social Strategies

  • We must acknowledge that parachute research practices also exist within countries of the Global South, especially when access to higher education and capacity development is concentrated in large cities [111]. Research and the practice of tropical ecology and conservation can greatly benefit from diverse teams (improving educational level), including local specialists, such as “paraecologists”, who possess empirical knowledge of local ecosystems and biodiversity ([112,113]). Collaborative project development and results discussion with local communities maximize applicability and impact while respecting local communities’ sovereignty over their territory and resources and ensuring enduring trust-based relationships ([108,114]).
  • Respectful engagement of local communities entails their active participation and input at multiple stages, securing permissions, co-developing research questions, collaborating with and hiring locals, and building capacities during data collection and processing. Open discussions of interim and final research findings and adaptive refinement of participatory research and practices are crucial (e.g., [108,114,115]).
  • In the future, a significant challenge for integrating social and ecological networks revolves around appropriate data collection. Specifically, gathering and aligning data of the correct type (i.e., weighted links with comparable or interactable units) and at the correct resolution (e.g., seasonal management decisions and knowledge exchange by farmers) is vital. Many methods exist to generate social data for network construction; however, current methods are qualitative (i.e., using ecosystem service provision as a node linked to species without measuring the species’ impact on service provision) and/or collect data at spatial or temporal resolutions inappropriate for integration with ecological networks [102].

4. Conclusions

This study explores the meteorological factors driving wildfires in Cartagena del Chairá. Wildfires result from a combination of elements, including high temperatures, arid conditions, strong winds, and minimal precipitation. These conditions are particularly favorable for wildfires in the northern region during boreal winter. However, it is essential to emphasize that these climatic conditions must align with areas featuring shrubland, often associated with agricultural activities. Farmers frequently use controlled burns for soil preparation, but issues arise due to insufficient adherence to safety standards in many plantations. The problem is exacerbated by the presence of illegal plantations that replace legal ones using fires, intensifying wildfire challenges. Furthermore, precise identification of the specific vegetation species most susceptible to wildfires is vital. However, this requires higher-resolution data on ecological units and biomes, which are currently lacking.
Conversely, a thorough analysis of climate change is conducted by gauging the magnitude of meteorological variable anomalies for the year 2049 across four diverse scenarios encompassing different SSPs and RCPs. The findings reveal that during boreal winter when wildfires typically emerge, temperature and RH primarily contribute to favorable wildfire conditions, whereas wind speed and precipitation hinder their development. It is crucial to highlight that certain scenarios depict conditions wherein both precipitation and wind speed at the south and southeast of CdC could foster fires, while temperature and RH in the same scenarios favor them more pronouncedly. This dual concern underscores the necessity for the government to not only mitigate existing fire-prone zones but also prevent new fire outbreaks in previously unaffected areas. Additionally, in boreal summer, temperature, RH, and wind speed promote wildfires, with precipitation offering a counteracting influence (albeit less potent than in boreal winter) across most scenarios. Nonetheless, at the south and southeast of CdC, all variables align to elevate the likelihood of wildfires, raising two alarming aspects: (i) regions previously untouched by fires could become susceptible, and (ii) boreal summer could evolve into a season conducive to wildfires, extending the fire-prone period beyond just boreal winter.
Given the ominous climate change scenarios threatening the region, an ML model is devised to (i) discern the meteorological and socio-economic factors influencing fires and (ii) develop strategies to address the variables wielding the most significant impact on fire occurrences. The results underscore the significance of RH, TCWV, and precipitation in wildfire dynamics, emphasizing the importance of maintaining a moist environment and hydrated soil to curtail fires. On the socio-economic front, the GINI index and lower education levels exhibit the potential to diminish wildfires, while heightened displacement trends could amplify fire risks. This underscores the government’s imperative to not only resolve conflicts but also foster opportunities, employment, and education, with the overarching goal of reducing inequality (GINI), thereby mitigating fire incidents.
At last, we create strategies that combine all the results and are based on already designed plans and policies. Our comprehensive approach encompasses land cover and economic and social strategies to address the complex challenges posed by forest fires and sustainable land management in the Amazon region:
  • Land Cover Strategies: Our approach focuses on mitigating wildfire risk by promoting well-hydrated soil through the cultivation of moisture-retaining plants, discouraging arid conditions. We propose innovative concessions to small landowners, positioning them within deforested zones. These concessions, accompanied by value chains for endemic produce and premium agroforestry goods, represent a paradigm shift towards sustainable agroforestry and forest preservation. This novel strategy, akin to Brazilian bioeconomy success, underscores the potential of robust land market management to safeguard Amazonian biodiversity.
  • Fire Vulnerability Reduction: To lower forest fire vulnerability, we propose proactive steps, including meticulous area planning, ongoing land cover monitoring, and thwarting unauthorized settlements. Incorporating WUI zones into planning tools serves as a strategic directive for fire prevention, shielding populations in municipalities with diverse socio-economic vulnerabilities from fire-associated risks.
  • Holistic Fire Management: Our approach encompasses prevention through impact reduction, weaving together individual and community roles, training, and furnishing fire mitigation equipment. Anchored in this strategy is the deployment of fire detection systems, resilient communication networks, and safeguarding critical ecosystems. By embracing a comprehensive framework that embraces situational awareness, long-term assessment, monitoring, control, and post-fire evaluation, our aim is to avert fire events and alleviate their repercussions on communities and ecosystems.
  • Harmonizing Community Ecological Networks: Recognizing their role in guiding land management, understanding local contexts, and linking social–ecological systems, we advocate seamless practices. Collaborative agroecological training initiatives across sectors can educate, implement, and support sustainability.
  • Balanced Incentive Policies for Sustainability: We highlight the need for balanced incentives, combining restrictions with rewards. Social investments could offset expenses linked to practices such as pasture rotation and trial verge management. This aligns with the national development plan’s rural sustainability objectives, promoting broader adoption of agroecological methods.
  • Government-Led Territorial Consolidation: To bolster government-led efforts, we propose a dual focus on infrastructure and culture. Collaborative deforestation by local families requires a comprehensive approach that addresses both environmental and social aspects
In conclusion, our comprehensive approach, encompassing land cover and economic and social aspects, highlights the significance of sustainable measures in curbing forest fires and fostering prudent land management in the Amazon. By embracing a holistic framework that integrates stakeholder views and engages local communities, we aspire to facilitate a balanced coexistence between society and nature in this vital ecosystem.

Supplementary Materials

The following supporting information can be downloaded at: https://www.mdpi.com/article/10.3390/ijgi12100436/s1, Table S1: Satellite data specifications used in Cartagena del Chairá, Caquetá-Colombia; Table S2: PBLCC classification; Figure S1: Seasonal number of hotspots in Cartagena del Chairá from 2010 to 2022. Notice that the y-axis has a logarithmic scale; Figure S2: Area in km2 of each land cover category from [37]. The nomenclature of the x-axis is described in Table S2; Figure S3: Land cover category changes per year in km2. The categories are from [37]. The nomenclature of the x-axis is described in Table S2; Figure S4: Experiments increasing (blue stars) and decreasing (green stars) by 30% the meteorological variables: (a) RH, (b) TCWV, (c) precipitation, and (d) wind speed. For plotting purposes, each star represents the mean of 10 wildfire events that present similar temperatures.

Author Contributions

Conceptualization, Nathalia Celis, Salvatore E. Pappalardo and Alejandro Casallas; Data Curation, Nathalia Celis and Alejandro Casallas; Methodology, Nathalia Celis, Salvatore E. Pappalardo, Alejandro Casallas, Ellie Anne Lopez-Barrera, Martina Felician and Massimo De Marchi; Validation, Nathalia Celis and Alejandro Casallas; Formal Analysis, Nathalia Celis, Salvatore E. Pappalardo, Alejandro Casallas, Ellie Anne Lopez-Barrera, Martina Felician and Massimo De Marchi; Investigation, Nathalia Celis; Visualization, Nathalia Celis and Alejandro Casallas; Writing—Original Draft, Nathalia Celis, Salvatore E. Pappalardo, Alejandro Casallas, Ellie Anne Lopez-Barrera, Martina Felician and Massimo De Marchi; Funding Acquisition, Salvatore E. Pappalardo and Massimo De Marchi. All authors have read and agreed to the published version of the manuscript.

Funding

This research is funded under support of the Advanced Master inGISCience and Unmanned Aerial from the University of Padua (Department of Civil, Environmental and Architectural Engineering).

Institutional Review Board Statement

Not applicable.

Informed Consent Statement

Not applicable.

Data Availability Statement

All the data and scripts will be made available on request to the authors.

Acknowledgments

The lead author expresses gratitude to the STeDe program for the mobility scholarship that facilitated the progress of this project. Sincere appreciation is extended to WWF Trieste and Sergio Arboleda University for hosting the lead author, as well as for the valuable assistance in data collection and enriching discussions. Recognition is due to Grammarly and ChatGPT for improving English readability, although after using the tools, the authors reviewed and edited the content. Lastly, special thanks go to the QGIS, pandas, numpy, Xarray, Rioxarray, and matplotlib developer teams.

Conflicts of Interest

The authors declare no conflict of interest. The funding sources had no role in the design of the study; in the collection, analysis, or interpretation of data; in the writing of the manuscript; or in the decision to publish the results.

References

  1. Albert, J.S.; Carnaval, A.C.; Flantua, S.G.A.; Lohmann, L.G.; Ribas, C.C.; Riff, D.; Carrillo, J.D.; Fan, Y.; Figueiredo, J.J.P.; Guayasamin, J.M.; et al. Human impacts outpace natural processes in the Amazon. Science 2023, 379, eabo5003. [Google Scholar] [CrossRef] [PubMed]
  2. Ometto, J.; Kalaba, G.; Anshari, N.; Chacon, A.; Farrell, S.; Halim, H.; Sukumar, R. Chapter Paper 7: Tropical Forests. In Climate Change 2022: Impacts, Adaptation and Vulnerability. Contribution of Working Group ii to the Sixth Assessment Report of the Intergovernmental Panel on Climate Change; Cambridge University Press: Cambridge, UK, 2022; pp. 2369–2410. [Google Scholar]
  3. Armenteras, D.; Schneider, L.; Dávalos, L.M. Fires in protected areas reveal unforeseen costs of Colombian peace. Nat. Ecol. Evol. 2019, 3, 20–23. [Google Scholar] [CrossRef]
  4. SINCHI. Análisis Geográfico. 2023. Available online: https://sinchi.org.co/coah/analisis-geografico (accessed on 9 May 2023).
  5. Carolsfeld, J.; Harvey, B.; Ross, C.; Baer, A. Migratory Fishes of South America; The World Bank: Washington, DC, USA, 2003. [Google Scholar]
  6. IDEAM. Comportamiento Espacial Radiación Solar. 2023. Available online: http://www.ideam.gov.co/web/tiempo-y-clima/caracteristicas-de-la-radiacion-solar#:~:text=La%20radiaci%C3%B3n%20solar%20nos%20proporciona,s%C3%ADntesis%20de%20los%20neurotransmisores%20cerebrales (accessed on 9 May 2023).
  7. Roca, A.M.; Bonilla-Mejía, L.; Sánchez-Jabba, A. Geografía Económica de la Amazonia Colombiana; Banco de la República—Economía Regional: Bogotá, Colombia, 2013. [Google Scholar]
  8. Dávalos, L.M.; Bejarano, A.C.; Hall, M.A.; Correa, H.L.; Corthals, A.; Espejo, O.J. Forests and drugs: Coca-driven deforestation in tropical biodiversity hotspots. Environ. Sci. Technol. 2011, 45, 1219–1227. [Google Scholar] [CrossRef] [PubMed]
  9. Jain, P.; Castellanos-Acuna, D.; Coogan, S.C.P.; Abatzoglou, J.T.; Flannigan, M.D. Observed increases in extreme fire weather driven by atmospheric humidity and temperature. Nat. Clim. Chang. 2021, 12, 63–70. [Google Scholar] [CrossRef]
  10. Armenteras Pascual, D.; Bernal Toro, F.H.; González Alonso, F.; Morales Rivas, M.; Pabón Caicedo, J.D.; Páramo Rocha, G.E.; Parra Larad, C. Incendios de la Cobertura Vegetal en Colombia; Universidad Autónoma de Occidente: Puerto Tejada, Colombia, 2011; ISBN 9789588713038. [Google Scholar]
  11. Casallas, A.; Jiménez-Saenz, C.; Torres, V.; Quirama-Aguilar, M.; Lizcano, A.; Lopez-Barrera, E.A.; Ferro, C.; Celis, N.; Arenas, R. Design of a Forest Fire Early Alert System through a Deep 3D-CNN Structure and a WRF-CNN Bias Correction. Sensors 2022, 22, 8790. [Google Scholar] [CrossRef] [PubMed]
  12. Kosovíc, B.; Juliano, T.W.; DeCastro, A.; Frediani, M.; Siems-Anderson, A.; Jimenez, P.; Muñoz-Esparza, D.; Knievel, J.C.; Eghdami, M. Extreme Weather Forecasting, Chapter Overview of Extreme Weather Events, Impacts and Forecasting Techniques; Elsevier: Amsterdam, The Netherlands, 2023. [Google Scholar]
  13. Agudelo-Hz, W.-J.; Castillo-Barrera, N.-C.; Uriel, M.-G. Scenarios of land use and land cover change in the Colombian Amazon to evaluate alternative post-conflict pathways. Sci. Rep. 2023, 13, 2152. [Google Scholar] [CrossRef] [PubMed]
  14. Vargas-Correa, L.F. Programa de Gobierno Municipal; Technical Report; Alcaldia Cartagena del Chaira, Departamento de Caqueta-Colombia: Cartagena del Chairá, Colombia, 2019. [Google Scholar]
  15. Armenteras, D.; Gonzales, T.; Vargas-Rios, O.; Meza-Elizalde, M.; Olviveras, I. Incendios en ecosistemas del norte de suramérica: Avances en la ecología del fuego tropical en Colombia, ecuador y perú. Caldasia 2020, 42, 1–16. [Google Scholar] [CrossRef]
  16. Morton, D.C.; Defries, R.S.; Randerson, J.T.; Giglio, L.; Schroeder, W.; Van Der Werf, G.R. Agricultural intensification increases deforestation fire activity in Amazonia. Glob. Chang. Biol. 2008, 14, 2262–2275. [Google Scholar] [CrossRef]
  17. Armenteras-Pascual, D.; Retana-Alumbreros, J.; Molowny-Horas, R.; Roman-Cuesta, R.M.; Gonzalez-Alonso, F.; Morales-Rivas, M. Characterising fire spatial pattern interactions with climate and vegetation in Colombia. Agric. For. Meteorol. 2011, 151, 279–289. [Google Scholar] [CrossRef]
  18. Hernandez-Deckers, D. Features of atmospheric deep convection in Northwestern South America obtained from infrared satellite data, Quart. J. Roy. Meteor. Soc. 2022, 148, 338–350. [Google Scholar] [CrossRef]
  19. Casallas, A.; Hernández-Deckers, D.; Mora-Páez, H. Understanding convective storms in a tropical, high-altitude location with in-situ meteorological observations and GPS-derived water vapor. Atmósfera 2021, 36, 225–238. [Google Scholar] [CrossRef]
  20. Adams, D.K.; Gutman, S.I.; Holub, K.L.; Pereira, D.S. GNSS observations of deep convective time scales in the Amazon. Geophys. Res. Lett. 2013, 40, 2818–2823. [Google Scholar] [CrossRef]
  21. Murad, C.A.; Pearse, J. Landsat study of deforestation in the Amazon region of Colombia: Departments of Caquetá and Putumayo. Remote Sens. Appl. Soc. Environ. 2018, 11, 161–171. [Google Scholar] [CrossRef]
  22. Peel, M.C.; Finlayson, B.L.; McMahon, T.A. Updated world map of the Köppen-Geiger climate classification. Hydrol. Earth Syst. Sci. 2007, 11, 1633–1644. [Google Scholar] [CrossRef]
  23. Guzman, D.; Ruiz, F.; Cadena, M. Regionalización de Colombia Según la Estacionalidad de la Precipitación Media Mensual, A Través Análisis de Componentes Principales (ACP); Technical Report; Instituto de Hidrología, Meteorología y Estudios Ambientales: Bogotá, Colombia, 2014. [Google Scholar]
  24. UNESCO. Chiribiquete National Park—“The Maloca of the Jaguar”. 2017. Available online: https://whc.unesco.org/en/list/1174/ (accessed on 28 April 2023).
  25. Instituto Nacional de los Recursos Naturales Renovables y del Ambiente. Acuerdo 65 de 1985. 1985. Available online: https://www.redjurista.com/Documents/acuerdo_65_de_1985.aspx (accessed on 11 April 2023).
  26. DANE. PIB Total Por Municipios. 2021. Available online: https://www.dane.gov.co/index.php/estadisticas-por-tema/cuentas-nacionales/cuentas-nacionales-departamentales (accessed on 18 April 2023).
  27. NASA. MODIS Collection 6 Hotspot/Active Fire Detections MCD14ML Distributed from NASA FIRMS. 2023. Available online: https://earthdata.nasa.gov/firms (accessed on 10 February 2023).
  28. Kaufman, Y.J.; Justice, C.O.; Flynn, L.P.; Kendall, J.D.; Prins, E.M.; Giglio, L.; Ward, D.E.; Menzel, W.P.; Setzer, A.W. Potential global fire monitoring from EOS-MODIS. J. Geophys. Res. 1998, 103, 32215–32238. [Google Scholar] [CrossRef]
  29. Hersbach, H.; Bell, B.; Berrisford, P.; Hirahara, S.; Horányi, A.; Muñoz-Sabater, J.; Nicolas, J.; Peubey, C.; Radu, R.; Schepers, D.; et al. The ERA5 global reanalysis. Q. J. R. Meteorol. Soc. 2020, 146, 1999–2049. [Google Scholar] [CrossRef]
  30. Holton, J.R. An Introduction to Dynamic Meteorology, 4th ed.; Elsevier Academic Press: Cambridge, MA, USA, 2004. [Google Scholar]
  31. IPCC. Global Warming of 1.5 °C. An IPCC Special Report on the Impacts of Global Warming of 1.5 °C above Pre-Industrial Levels and Related Global Greenhouse Gas Emission Pathways, in the Context of Strengthening the Global Response to the Threat of Climate Change, Sustainable Development, and Efforts to Eradicate Poverty; Technical report; Intergovernmental Panel on Climate Change: Geneva, Switzerland, 2018. [Google Scholar]
  32. Christian, J.R.; Denman, K.L.; Hayashida, H.; Holdsworth, A.M.; Lee, W.G.; Riche, O.G.J.; Shao, A.E.; Steiner, N.; Swart, N.C. Ocean biogeochemistry in the Canadian Earth System Model version 5.0.3: CanESM5 and CanESM5-CanOE. Geosci. Model Dev. 2022, 15, 4393–4424. [Google Scholar] [CrossRef]
  33. Voldoire, A.; Saint-Martin, D.; Sénési, S.; Decharme, B.; Alias, A.; Chevallier, M.; Colin, J.; Guérémy, J.; Michou, M.; Moine, M.; et al. Evaluation of CMIP6 DECK Experiments With CNRM-CM6-1. Geosci. Model Dev. 2019, 11, 2177–2213. [Google Scholar] [CrossRef]
  34. Bonnet, R.; Boucher, O.; Deshayes, J.; Gastineau, G.; Hourdin, F.; Mignot, J.; Servonnat, J.; Swingedouw, D. Presentation and Evaluation of the IPSL-CM6A-LR Ensemble of Extended Historical Simulations. Geosci. Model Dev. 2021, 13, e2021MS002565. [Google Scholar] [CrossRef]
  35. Colón-González, F.J.; Sewe, M.O.; Tompkins, A.M.; Sjödin, H.; Casallas, A.; Rocklöv, J.; Caminade, C.; Lowe, R. Projecting the risk of mosquito-borne diseases in a warmer and more populated world: A multi-model, multi-scenario intercomparison modelling study. Lancet Planet. Health 2021, 5, e404–e414. [Google Scholar] [CrossRef]
  36. USGS. Earth Engine Data Catalog. 2023. Available online: https://developers.google.com/earth-engine/datasets (accessed on 19 April 2023).
  37. Simonetti, E.; Simonetti, D.; Preatoni, D. Phenology-Based Land Cover Classification Using Landsat 8 Time Series. 2014. Available online: https://publications.jrc.ec.europa.eu/repository/handle/JRC91912 (accessed on 20 April 2023).
  38. Celis, N.; Casallas, A.; López-Barrera, E.A.; Martínez, H.; Rincón, C.A.P.; Arenas, R.; Ferro, C. Design of an early alert system for PM2.5 through a stochastic method and machine learning models. Environ. Sci. Policy 2022, 127, 241–252. [Google Scholar] [CrossRef]
  39. D’Agostino, R.B. An omnibus test of normality for moderate and large size samples. Biometrika 1971, 58, 341–348. [Google Scholar] [CrossRef]
  40. D’Agostino, R.; Pearson, E.S. Tests for departure from normality. Empirical results for the distributions of b2 and √b1. Biometrika 1973, 60, 613–622. [Google Scholar] [CrossRef]
  41. Casallas, A.; Castillo-Camacho, M.P.; Sanchez, E.R.; González, Y.; Celis, N.; Mendez-Espinosa, J.F.; Belalcazar, L.C.; Ferro, C. Surface, satellite ozone variations in Northern South America during low anthropogenic emission conditions: A machine learning approach. Air Qual. Atmosphere Health 2023, 16, 745–764. [Google Scholar] [CrossRef] [PubMed]
  42. Casallas, A.; Castillo-Camacho, M.P.; Guevara-Luna, M.A.; González, Y.; Sanchez, E.; Belalcazar, L.C. Spatio-temporal analysis of PM2.5 and policies in Northwestern South America. Sci. Total Environ. 2022, 852, 158504. [Google Scholar] [CrossRef]
  43. Gómez, A.; Bussink, C.; Bauer, T.; Fritz, S.; Escobar, S.; Gusti, M.; See, L.; Atzberger, C. Examining the potential of using information on fire detected by MODIS and socio-economic variables to highlight potential coca cultivations in forest areas in Colombia. Open Geogr. J. 2014, 6, 18–29. [Google Scholar]
  44. Bautista-Cespedes, O.V.; Willemen, L.; Castro-Nunez, A.; Groen, T.A. The effects of armed conflict on forest cover changes across temporal and spatial scales in the Colombian Amazon. Reg. Environ. Chang. 2021, 21, 70. [Google Scholar] [CrossRef]
  45. Quan, D.; Quan, H.; Zhu, W.; Lin, Z.; Jin, R. A Comparative Study on the Drivers of Forest Fires in Different Countries in the Cross-Border Area between China, North Korea and Russia. Forests 2022, 13, 1939. [Google Scholar] [CrossRef]
  46. Armenteras, D.; Cabrera, E.; Rodríguez, N.; Retana, J. National and regional determinants of tropical deforestation in Colombia. Reg. Environ. Chang. 2013, 13, 1181–1193. [Google Scholar] [CrossRef]
  47. Geist, H.; McConnell, W.; Lambin, E.F.; Moran, E.; Alves, D.; Rudel, T. Causes and Trajectories of Land-Use/Cover Change. In Land-Use and Land-Cover Change. Global Change—The IGBP Series; Lambin, E.F., Geist, H., Eds.; Springer: Berlin/Heidelberg, Germany, 2006. [Google Scholar] [CrossRef]
  48. Ferrara, C.; Salvati, L.; Corona, P.; Romano, R.; Marchi, M. The background context matters: Local-scale socioeconomic conditions and the spatial distribution of wildfires in Italy. Sci. Total. Environ. 2019, 654, 43–52. [Google Scholar] [CrossRef]
  49. Aldersley, A.; Murray, S.J.; Cornell, S.E. Global and regional analysis of climate and human drivers of wildfire. Sci. Total. Environ. 2011, 409, 3472–3481. [Google Scholar] [CrossRef] [PubMed]
  50. Mancini, L.D.; Corona, P.; Salvati, L. Ranking the importance of Wildfires’ human drivers through a multi-model regression approach. Environ. Impact Assess. Rev. 2018, 72, 177–186. [Google Scholar] [CrossRef]
  51. Eugenio, F.C.; dos Santos, A.R.; Pedra, B.D.; Pezzopane, J.E.M.; Mafia, R.G.; Loureiro, E.B.; Martins, L.D.; Saito, N.S. Causal, temporal and spatial statistics of wildfires in areas of planted forests in Brazil. Agric. For. Meteorol. 2019, 266–267, 157–172. [Google Scholar] [CrossRef]
  52. Stokowski, P.A. Chapter 10 Human Communities and Wildfires: A Review of Research Literature and Issues. In Living on the Edge (Advances in the Economics of Environmental Resources, Vol. 6); Troy, A., Kennedy, R.G., Eds.; Emerald Group Publishing Limited: Bingley, UK, 2007; pp. 165–179. [Google Scholar] [CrossRef]
  53. Ganteaume, A.; Jappiot, M. What causes large fires in Southern France. For. Ecol. Manag. 2013, 294, 76–85. [Google Scholar] [CrossRef]
  54. Chas-Amil, M.; Prestemon, J.; McClean, C.; Touza, J. Human-ignited wildfire patterns and responses to policy shifts. Appl. Geogr. 2015, 56, 164–176. [Google Scholar] [CrossRef]
  55. Pozo, R.A.; Galleguillos, M.; González, M.E.; Vásquez, F.; Arriagada, R. Assessing the socio-economic and land-cover drivers of wildfire activity and its spatiotemporal distribution in south-central Chile. Sci. Total. Environ. 2022, 810, 152002. [Google Scholar] [CrossRef]
  56. Pismel, G.O.; Marchezini, V.; Selaya, G.; de Paula, Y.A.; Mendoza, E.; Anderson, L.O. Wildfire governance in a tri-national frontier of southwestern Amazonia: Capacities and vulnerabilities. Int. J. Disaster Risk Reduct. 2023, 86, 103529. [Google Scholar] [CrossRef]
  57. Ghahremanloo, M.; Lops, Y.; Choi, Y.; Yeganeh, B. Deep learning estimation of daily ground-level NO2 concentrations from remote sensing data. J. Geophys. Res. Atmos. 2021, 126, e2021JD034925. [Google Scholar] [CrossRef]
  58. Kline, R.B. Principles and Practice of Structural Equation Modeling; Guilford Publications: New York, NY, USA, 2015. [Google Scholar]
  59. Ghahremanloo, M.; Lops, Y.; Choi, Y.; Jung, J.; Mousavinezhad, S.; Hammond, D. A comprehensive study of the COVID-19 impact on PM2.5 levels over the contiguous United States: A deep learning approach. Atmos. Environ. 2022, 272, 118944. [Google Scholar] [CrossRef]
  60. Wei, J.; Huang, W.; Li, Z.; Xue, W.; Peng, Y.; Sun, L.; Cribb, M. Estimating 1-km-resolution PM2.5 concentrations across China using the space-time random forest approach. Remote Sens. Environ. 2019, 231, 111221. [Google Scholar] [CrossRef]
  61. Abadi, M.; Agarwal, A.; Barham, P.; Brevdo, E.; Chen, Z.; Citro, C.; Corrado, G.S.; Jeffrey Dean, D.; Devin, M.; Ghemawat, S.; et al. TensorFlow: Large-Scale Machine Learning on Heterogeneous Systems. arXiv 2015, arXiv:1603.04467. [Google Scholar]
  62. Chollet, F. Keras. 2015. Available online: https://keras.io (accessed on 12 October 2023).
  63. Kingman, D.P.; Ba, J. Adam: A Method for Stochastic Optimization. arXiv 2014, arXiv:1412.6980. [Google Scholar]
  64. Fukushima, K. Cognitron: A self-organizing multilayered neural network. Biol. Cybern. 1975, 20, 121–136. [Google Scholar] [CrossRef] [PubMed]
  65. Hochreiter, S.; Schmidhuber, J. Long short-term memory. Neural Comput. 1997, 9, 1735–1780. [Google Scholar] [CrossRef]
  66. Cybenko, G. Approximation by superpositions of a sigmoidal function. Math. Control Signals Syst. 1989, 2, 303–314. [Google Scholar] [CrossRef]
  67. Ndiaye, E.; Le, T.; Fercoq, O.; Salmon, J.; Takeuchi, I. Safe grid search with optimal complexity. In Proceedings of Machine Learning Research, Proceedings of the 36th International Conference on Machine Learning, Long Beach, CA, USA, 9–15 June 2019; Volume 97, pp. 4771–4780. Available online: http://proceedings.mlr.press/v97/ndiaye19a.html (accessed on 12 October 2023).
  68. Prechelt, L. Early stopping—But when? In Neural Networks: Tricks of the Trade. Lecture Notes in Computer Science; Orr, G.B., Müller, K.R., Eds.; Springer: Berlin/Heidelberg, Germany, 1998; Volume 1524. [Google Scholar] [CrossRef]
  69. Tompkins, A.M.; Semie, A.G. Impact of a mixed ocean layer and the diurnal cycle on convective aggregation. Geosci. Model Dev. 2021, 13, e2020MS002186. [Google Scholar] [CrossRef]
  70. Coughlan, R.; Di Giuseppe, F.; Vitolo, C.; Barnard, C.; Lopez, P.; Drusch, M. Using machine learning to predict fire-ignition occurrences from lightning forecasts. Meteorol. Appl. 2021, 28, e1973. [Google Scholar] [CrossRef]
  71. McGovern, A.; Lagerquist, R.; Gagne, D.J.; Jergensen, G.E.; Elmore, K.L.; Homeyer, C.R.; Smith, T. Making the Black Box More Transparent: Understanding the Physical Implications of Machine Learning. Bull. Am. Meteorol. Soc. 2019, 100, 2175–2199. [Google Scholar] [CrossRef]
  72. Altman, D.G.; Bland, J.M. Measurement in medicine: The analysis of method comparison studies. J. R. Stat. Society. Ser. D Stat. 1983, 32, 307–317. [Google Scholar] [CrossRef]
  73. Bland, J.M.; Altman, D.G. Statistical methods for assessing agreement between two methods of clinical measurement. Lancet 1986, 327, 307–310. [Google Scholar] [CrossRef]
  74. Armenteras, D.; González-Alonso, F.; Franco-Aguilera, C. Geographic and temporal distribution of fire in Colombia using thermal anomalies data. Caldasia 2009, 31, 303–318. [Google Scholar]
  75. Hoyos, N.; Correa-Metrio, A.; Sisa, A.; Ramos-Fabiel, M.; Espinosa, J.; Restrepo, J.; Escobar, J. The environmental envelope of fires in the Colombian Caribbean. Appl. Geogr. 2017, 84, 42–54. [Google Scholar] [CrossRef]
  76. Sokhi, R.S.; Singh, V.; Querol, X.; Finardi, S.; Targino, A.C.; Andrade, M.d.F.; Pavlovic, R.; Garland, R.M.; Massagué, J.; Kong, S.; et al. A global observational analysis to understand changes in air quality during exceptionally low anthropogenic emission conditions. Environ. Int. 2021, 157, 106818. [Google Scholar] [CrossRef] [PubMed]
  77. Casallas, A.; Cabrera, A.; Guevara-Luna, M.-A.; Tompkins, A.; González, Y.; Aranda, J.; Belalcazar, L.C.; Mogollon-Sotelo, C.; Celis, N.; Lopez-Barrera, E.; et al. Air Pollution Analysis in Northwestern South America: A New Lagrangian Framework. Sci. Total Environ. 2024, 906, 167350. [Google Scholar] [CrossRef] [PubMed]
  78. Emanuel, K. Atmospheric Convection; Oxford University Press: New York, NY, USA, 1994. [Google Scholar]
  79. Sherwood, S.C.; Roca, R.; Weckwerth, T.M.; Andronova, N.G. Tropospheric water vapor, convection, and climate. Rev. Geophys. 2010, 48. [Google Scholar] [CrossRef]
  80. Escobar, A.C.; Castiblanco, M.F. Análisis de Condiciones Atmosféricas y de Cobertura Vegetal Asociadas a Incendios Forestales. Bachelor’s Thesis, Editorial Universidad Sergio Arboleda, Bogota, Colombia, 2021. Available online: https://www.researchgate.net/publication/353244855_Analisis_de_condiciones_atmosfericas_y_de_cobertura_vegetal_asociadas_a_incendios_forestales (accessed on 12 October 2023).
  81. Met Office. Cartopy: A Cartographic Python Library with Matplotlib Interface; Met Office: Exeter, UK, 2015; Available online: http://scitools.org.uk/cartopy/docs/latest (accessed on 12 October 2023).
  82. Ramo, R.; Chuvieco, E. Developing a Random Forest Algorithm for MODIS Global Burned Area Classification. Remote Sens. 2017, 9, 1193. [Google Scholar] [CrossRef]
  83. Mateus-Fontecha, L.; Vargas-Burbano, A.; Jimenez, R.; Rojas, N.Y.; Rueda-Saa, G.; van Pinxteren, D.; van Pinxteren, M.; Fomba, K.W.; Herrmann, H. Understanding aerosol composition in an inter-andean valley impacted by sugarcane intensive agriculture and urban emissions. Atmos. Chem. Phys. 2022, 22, 8473–8495. [Google Scholar] [CrossRef]
  84. Gatti, L.V.; Cunha, C.L.; Marani, L.; Cassol, H.L.G.; Messias, C.G.; Arai, E.; Denning, A.S.; Soler, L.S.; Almeida, C.; Setzer, A.; et al. Increased Amazon carbon emissions mainly from decline in law enforcement. Nature 2023, 621, 318–323. [Google Scholar] [CrossRef]
  85. Di Giuseppe, F.; Rémy, S.; Pappenberger, F.; Wetterhall, F. Using the Fire Weather Index (FWI) to improve the estimation of fire emissions from fire radiative power (FRP) observations. Atmos. Chem. Phys. 2018, 18, 5359–5370. [Google Scholar] [CrossRef]
  86. Vitolo, C.; Di Napoli, C.; Di Giuseppe, F.; Cloke, H.L.; Pappenberger, F. Mapping combined wildfire and heat stress hazards to improve evidence-based decision making. Environ. Int. 2019, 127, 21–34. [Google Scholar] [CrossRef]
  87. CONPES 3934 de 2018. “Política de Crecimiento Verde”. República de Colombia, Departamento Nacional de Planeación. Available online: https://colaboracion.dnp.gov.co/CDT/Conpes/Econ%C3%B3micos/3934.pdf (accessed on 12 October 2023).
  88. DNP. Plan Nacional de Desarrollo 2022–2026. Colombia, Potencial Mundial de la vida. Departamento Nacional de Planeación. 2023. Available online: https://colaboracion.dnp.gov.co/CDT/portalDNP/PND-2023/2023-05-05-texto-conciliado-PND.pdf (accessed on 13 September 2023).
  89. BID. Amazonia Siempre. 2023. Available online: https://www.iadb.org/es/quienes-somos/tematicas/Amazonia (accessed on 13 September 2023).
  90. Nobre, C.; Encalada, A.; Anderson, E.; Roca Alcazar, F.; Bustamante, M.; Mena, C.; Peña-Claros, M.; Poveda, G.; Rodriguez, J.; Saleska, S.; et al. Executive Summary of the Amazon Assessment Report 2021; United Nations Sustainable Development Solutions: New York, NY, USA, 2021. [Google Scholar]
  91. Painter, L.; Alencar, A.; Bennett, A.; Bynoe, P.; Guio, C.; Murmis, M.; Paez, B.; Robison, D.; von Hildebrand, M.; Ochoa-Herrera, V.; et al. Informe de Evaluación de Amazonía 2021, chapter Objetivos de Desarrollo Sostenible (ODS) y la Amazonía; Elsevier: Amsterdam, The Netherlands, 2023. [Google Scholar]
  92. Mosina, K.S.; Nazarova, E.A.; Vinogradov, A.V.; Vinogradov, V.V.; Krivoshapkina, E.F.; Krivoshapkin, P.V. Alumina nanoparticles for firefighting and fire prevention. ACS Appl. Nano Mater. 2020, 3, 4386–4393. [Google Scholar] [CrossRef]
  93. Nabipour, H.; Shi, H.; Wang, X.; Hu, X.; Song, L.; Hu, Y. Flame retardant cellulose-based hybrid hydrogels for firefighting and fire prevention. Fire Technol. 2022, 58, 2077–2091. [Google Scholar] [CrossRef]
  94. Jara, J.; Florez, J.; Mujica, O.; Chalan, I.; Silva, J. Manual Para el Control de Incendios Forestales-SERNANP-Parque Nacional del Manu; Technical Report; Servicio Nacional de Áreas Naturales Protegidas por el Estado-SERNAP, Sociedad Zoológica de Francfort: Cusco, Peru, 2016. [Google Scholar]
  95. Galiana-Martin, L.; Herrero, G.; Solana, J. A Wildland–urban interface typology for forest fire risk management in mediterranean areas. Landsc. Res. 2011, 36, 151–171. [Google Scholar] [CrossRef]
  96. Calkin, D.E.; Cohen, J.D.; Finney, M.A.; Thompson, M.P. How risk management can prevent future wildfire disasters in the wildland-urban interface. Proc. Natl. Acad. Sci. USA 2014, 111, 746–751. [Google Scholar] [CrossRef] [PubMed]
  97. Moritz, M.A.; Batllori, E.; Bradstock, R.A.; Gill, A.M.; Handmer, J.; Hessburg, P.F.; Leonard, J.; McCaffrey, S.; Odion, D.C.; Schoennagel, T.; et al. Learning to coexist with wildfire. Nature 2014, 515, 58–66. [Google Scholar] [CrossRef] [PubMed]
  98. Hernández, S. El Periurbano, un Espacio Estratégico de Oportunidad; Technical Report; Universidad de Barcelon: Barcelona, Spain, 2016. [Google Scholar]
  99. Miranda, A.; Carrasco, J.; González, M.; Pais, C.; Lara, A.; Altamirano, A.; Weintraub, A.; Syphard, A.D. Evidence-based mapping of the wildland-urban interface to better identify human communities threatened by wildfires. Environ. Res. Lett. 2020, 15, 094069. [Google Scholar] [CrossRef]
  100. Gobierno de Colombia. Bioeconomia para una Colombia Potencia Viva y Diversa; hacia una sociedad Impulsada por el Conocimiento. Technical Report; Presidencia de Colombia. 2020. Available online: https://minciencias.gov.co/sites/default/files/upload/paginas/bioeconomia_para_un_crecimiento_sostenible-qm_print.pdf (accessed on 12 October 2023).
  101. Calkin, D.E.; O’connor, C.D.; Thompson, M.P.; Stratton, R.D. Strategic wildfire response decision support and the risk management assistance program. Forests 2021, 12, 1407. [Google Scholar] [CrossRef]
  102. Windsor, F.M.; Armenteras, D.; Assis, A.P.A.; Astegiano, J.; Santana, P.C.; Cagnolo, L.; Carvalheiro, L.G.; Emary, C.; Fort, H.; Gonzalez, X.I.; et al. Network science: Applications for sustainable agroecosystems and food security. Perspect. Ecol. Conserv. 2022, 20, 79–90. [Google Scholar] [CrossRef]
  103. Coccia, M. Bureaucratization in public research institutions. Minerva 2009, 47, 31–50. [Google Scholar] [CrossRef]
  104. Clavijo, G. La Universidad y la Burocracia; Technical Report; Universidad Colombian: Bogotá, Colombia, 2016. [Google Scholar]
  105. Merkle, O. Corruption Risks in Research Funding in Developing Countries; Technical report; CHR Michelsen Institute: Bergen, Norway, 2016. [Google Scholar]
  106. Hyden, G. The Role and Impact of Funding Agencies on Higher Education and Research for Development. North-South Knowledge Networks towards Equitable Collaboration between Academics, Donors and Universities. African Minds. 2016. Available online: https://library.oapen.org/bitstream/handle/20.500.12657/28917/AMT-South-North-Cooperation-Lighting-Source_LWed.pdf?sequence=1#page=17 (accessed on 12 October 2023).
  107. van Helden, P. The cost of research in developing countries. EMBO Rep. 2012, 13, 395. [Google Scholar] [CrossRef]
  108. Ocampo-Ariza, C.; Toledo-Hernández, M.; Librán-Embid, F.; Armenteras, D.; Vansynghel, J.; Raveloaritiana, E.; Arimond, I.; Angulo-Rubiano, A.; Tscharntke, T.; Ramírez-Castañeda, V.; et al. Global South leadership towards inclusive tropical ecology and conservation. Perspect. Ecol. Conserv. 2023, 21, 17–24. [Google Scholar] [CrossRef]
  109. Asase, A.; Mzumara-Gawa, T.I.; Owino, J.O.; Peterson, A.T.; Saupe, E. Replacing “parachute science” with “global science” in ecology and conservation biology. Conserv. Sci. Pract. 2022, 4, e517. [Google Scholar] [CrossRef]
  110. Escobar-Alvarez, S.; Drake, W.; Evans, L.; Myers, E. Funders, diversify research grant awards. Science 2021, 374, 1063–1064. [Google Scholar] [CrossRef] [PubMed]
  111. de Vos, A.; Schwartz, M. Confronting parachute science in conservation. Conserv. Sci. Pract. 2022, 4, e12681. [Google Scholar] [CrossRef]
  112. Sheil, D.; Lawrence, A. Tropical biologists, local people and conservation: New opportunities for collaboration. Trends Ecol. Evol. 2004, 19, 634–638. [Google Scholar] [CrossRef] [PubMed]
  113. Schmiedel, U.; Araya, Y.; Bortolotto, M.I.; Boeckenhoff, L.; Hallwachs, W.; Janzen, D.; Kolipaka, S.S.; Novotny, V.; Palm, M.; Parfondry, M.; et al. Contributions of paraecologists and parataxonomists to research, conservation, and social development. Conserv. Biol. 2016, 30, 506–519. [Google Scholar] [CrossRef]
  114. Toomey, A.H.; Alvaro, M.E.C.; Aiello-Lammens, M.; Cossio, O.L.; Barlow, J. A question of dissemination: Assessing the practices and implications of research in tropical landscapes. AMBIO 2019, 48, 35–47. [Google Scholar] [CrossRef]
  115. Ramírez-Castañeda, V.; Westeen, E.P.; Frederick, J.; Amini, S.; Wait, D.R.; Achmadi, A.S.; Andayani, N.; Arida, E.; Arifin, U.; Bernal, M.A.; et al. A set of principles and practical suggestions for equitable fieldwork in biology. Proc. Natl. Acad. Sci. USA 2022, 119, e2122667119. [Google Scholar] [CrossRef]
Figure 1. Colombia, with all its departments marked; the red square represents the location of Caquetá. Close-up of the location of Cartagena del Chairá (blue polygon) municipality, located inside the Caquetá department (gray polygon). The yellow polygons determine the forest reserves that can be subtracted and used for economic activities. The red squares are the subset of images utilized from Landsat to cover the entire region; the numbers inside the squares indicate the satellite path and row.
Ijgi 12 00436 g001
Figure 2. Neural network structure. Every box has the number of neurons/filters in the layer. The dropout percentage of a layer is also indicated. Notice that the purple boxes include the variables that construct the X-tensor and the Y-matrix.
Ijgi 12 00436 g002
Figure 3. Monthly hotspots evolution related to wildfire evolution from 2016 to 2022 in Cartagena del Chairá.
Ijgi 12 00436 g003
Figure 4. Location of Cartagena del Chairá (gray polygon). The blue lines represent the rivers, and the red dots indicate the hotspots that developed from 2010 to 2022.
Ijgi 12 00436 g004
Figure 5. Boxplots of days/events with (dark red) and without wildfires (green) for (a) 2 m air temperature, (b) wind speed, (c) relative humidity, (d) TCWV, and (e) precipitation.
Ijgi 12 00436 g005
Figure 7. The colors and numbers inside the squares represent the percentage of land cover in Cartagena del Chairá following the classification of [37]. The nomenclature of the x-axis is described in Table S2.
Ijgi 12 00436 g007
Figure 8. Land cover classification following [37]. A mosaic of images of (a) 2014, (b) 2016, (c) 2018, and (d) 2020. A detailed description of every land cover category can be found in Table S2. The gray contours represent the number of wildfires that develop in the related year. The plot was constructed using the Cartopy Python package [81].
Ijgi 12 00436 g008
Figure 9. Evolution of the agricultural frontier (color contours) for (a) 2002 and 2012, (b) 2012 and 2016, (c) 2016 and 2020, and (d) 2002 and 2020. No other years are plotted due to data availability. The gray contours represent the number of hotspots produced in (a) 2002, (b) 2012, and (c,d) 2020. The plot was constructed using the Cartopy Python package [81].
Ijgi 12 00436 g009
Figure 10. Climatological anomalies between the near-future and the historical period for boreal-winter for (a,e,i,m) the surface air temperature, (b,f,j,n) surface RH, (c,g,k,o) surface wind speed, and (d,h,l,p) precipitation. Additionally, each row represents a different scenario: (ad) SSP1-RCP2.6, (eh) SSP2-RCP4.5, (il) SSP3-RCP7.0, and (mp) SSP5-RCP8.5. The plot was constructed using the Cartopy Python package [81].
Ijgi 12 00436 g010
Figure 11. Climatological anomalies between the near-future and the historical period for boreal summer for (a,e,i,m) the surface air temperature, (b,f,j,n) surface RH, (c,g,k,o) surface wind speed, and (d,h,l,p) precipitation. Additionally, each row represents a different scenario: (ad) SSP1-RCP2.6, (eh) SSP2-RCP4.5, (il) SSP3-RCP7.0, and (mp) SSP5-RCP8.5. The plot was constructed using the Cartopy Python package [81].
Ijgi 12 00436 g011
Figure 12. (a) ML model evaluation of three months of data. Here, a subset of 10.5 days that includes wildfires is plotted. Notice that the R, MSE, and RMSE are also plotted in the figure but are calculated for the three months and not only for the subset. Bland–Altman plots for experiments increasing (blue stars) and decreasing (green stars) by 30% the socio-economic variables: (b) total population, (c) GDP, (d) GINI, (e) informal work, (f) low education level, (g) displacement, (h) unemployment, and (i) victims armed conflict. For plotting purposes, each star represents the mean of 10 wildfire events that present similar temperatures.
Ijgi 12 00436 g012
Table 1. Socio-economic variables studied between 2013 and 2021 in Cartagena del Chairá, Caquetá, associated with forest fire drivers.
CategoryVariableTime ResolutionExpressionDefinitionsSource
DemographicUrban PopulationAnnualNumber of PeopleNumber of people living in CdC in rural and urban areasPopulation and back projections
Rural Population
EconomicGDPQuarterly-Combined value generated by all domestic producers in an economy, including product taxes and excluding subsidies that are not accounted for in the product valueQuarterly GDP
Informal WorkAnnualPercentagePercentage of the total population that fills in one or more of the following categories (i) Private employees and laborers working in establishments, businesses, or enterprises that employ up to five persons in all their agencies and branches, including the partner, (ii) unpaid family workers, (iii) unpaid workers in enterprises or businesses of other households, (iv) domestic employees, (v) day laborers or laborers, and (vi) self-employed workers working in establishments up to five personsInformal Work Indicator
Long-Term UnemploymentAnnualPercentagePeople who have been unemployed for 12 months or more Long-Term Unemployment Indicator
EducationLow Educational LevelAnnualPercentagePercentage of the population with less than 9 years of educationLow Educational Level Indicator
PovertyGINIAnnual-A GINI index of 0 represents perfect equality, while an index of 1 implies perfect inequalityMonetary Poverty
Victims Due to Arm ConflictMassacresDailyNumber of PeopleThe first variable, related to massacres, is understood as the intentional homicide of four (4) or more peopleVictims Database
Forced DisappearanceDeprivation of freedom against the will by agents of the State, members of illegal armed groups that take part in the armed conflict, or with their authorization or support followed by their concealment and/or refusal to provide information on their whereabouts
Child and Adolescent RecruitmentWhen minors under 18 years of age are forced to participate directly or indirectly in hostilities or armed actions for the purpose of armed conflict
DisplacementSituation where a person has been forced to migrate within the national territory, abandoning their home or usual economic activities because their life, physical integrity, personal safety or freedom have been violated or are directly threatenedCEDE and OCHA Datasets
Disclaimer/Publisher’s Note: The statements, opinions and data contained in all publications are solely those of the individual author(s) and contributor(s) and not of MDPI and/or the editor(s). MDPI and/or the editor(s) disclaim responsibility for any injury to people or property resulting from any ideas, methods, instructions or products referred to in the content.

