
The Seasonal Migrants Spatially Affect the Park Green Space Accessibility and Equity under Different Travel Modes: Evidence from Sanya, China

Abstract
:1. Introduction
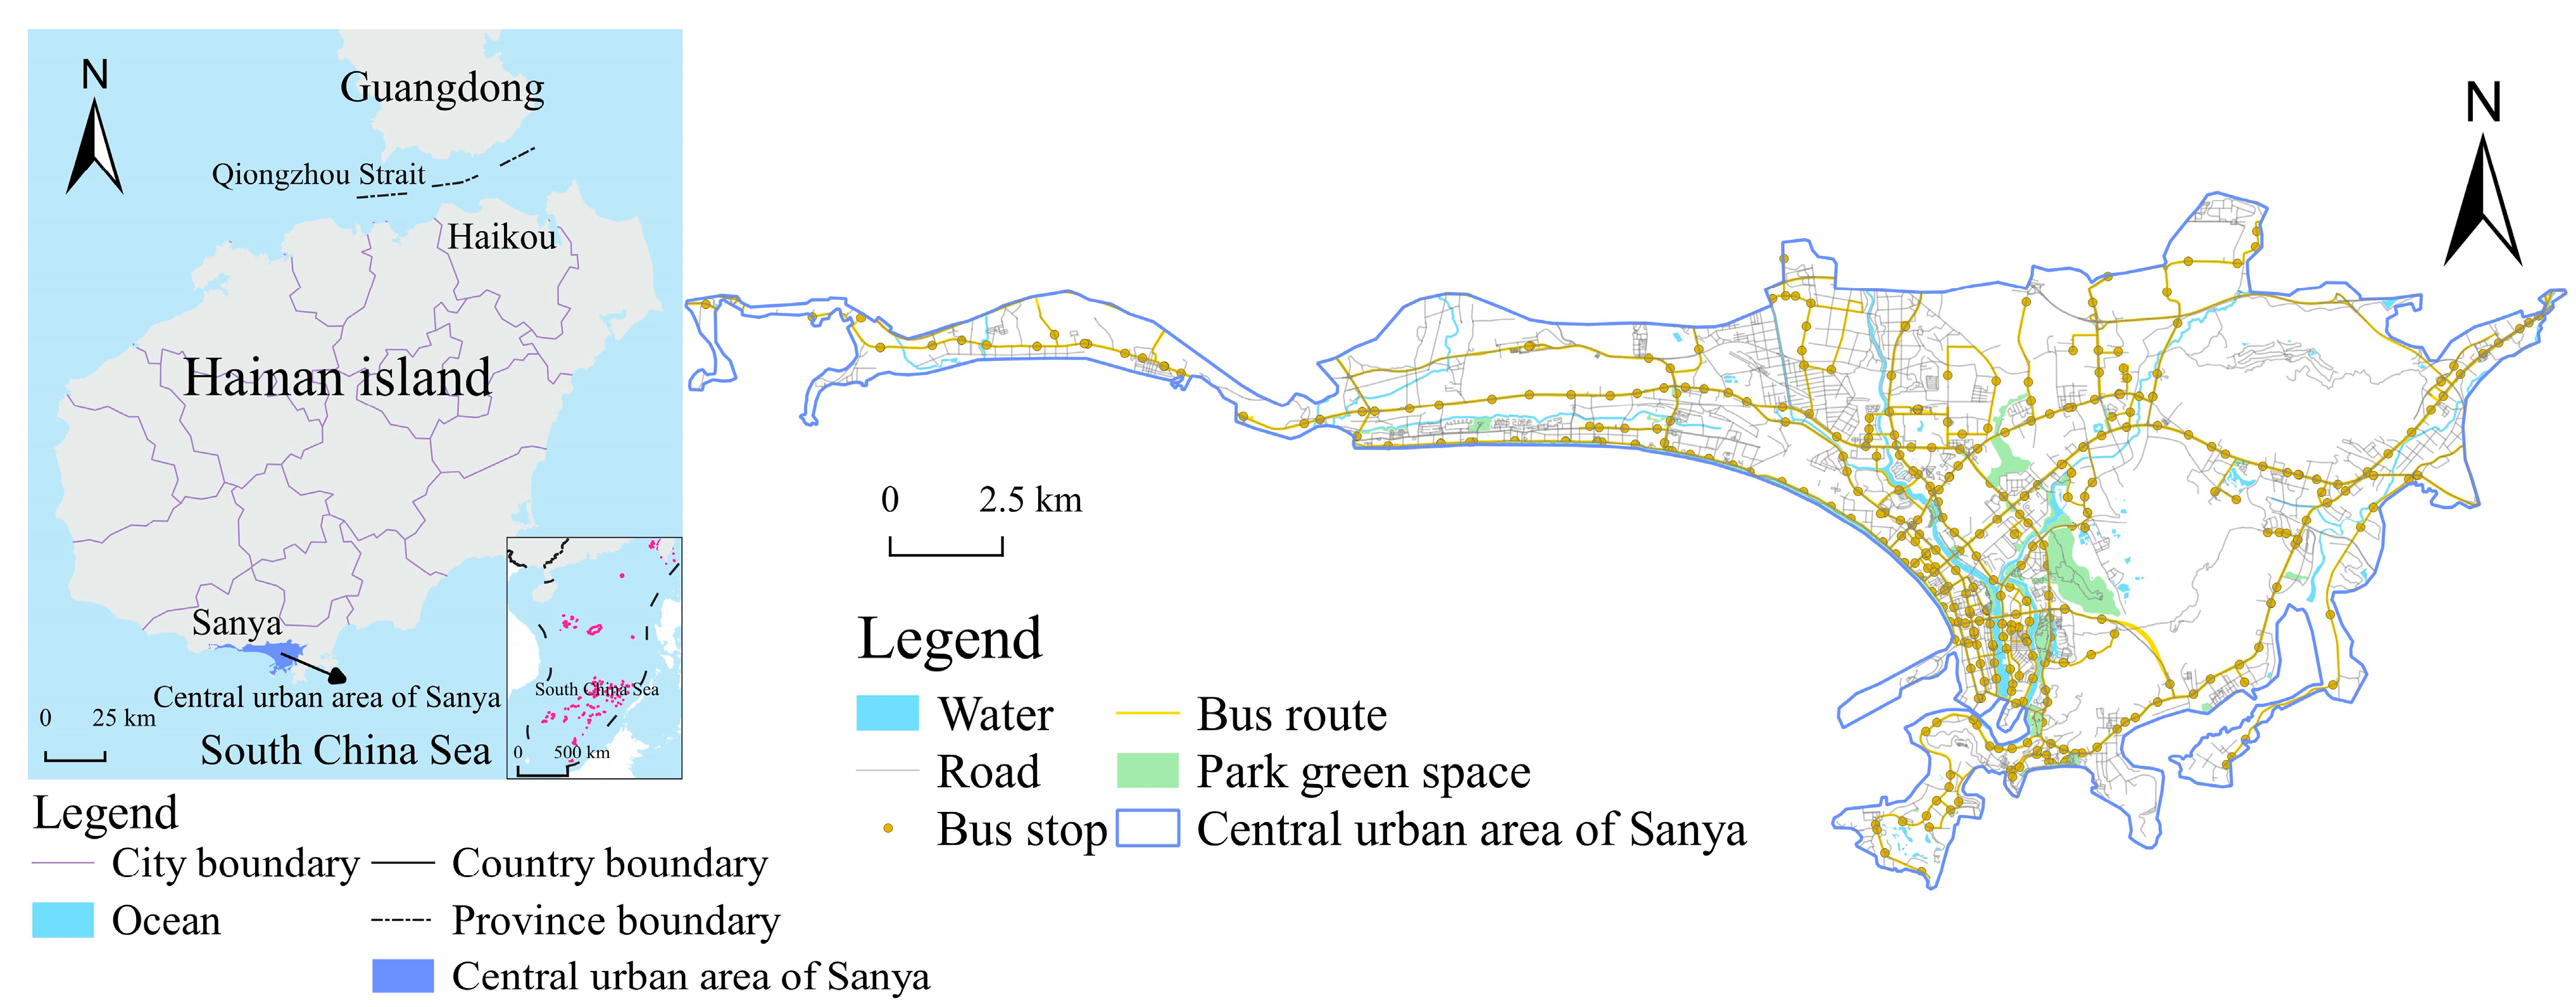
2. Study Area
3. Materials and Methods
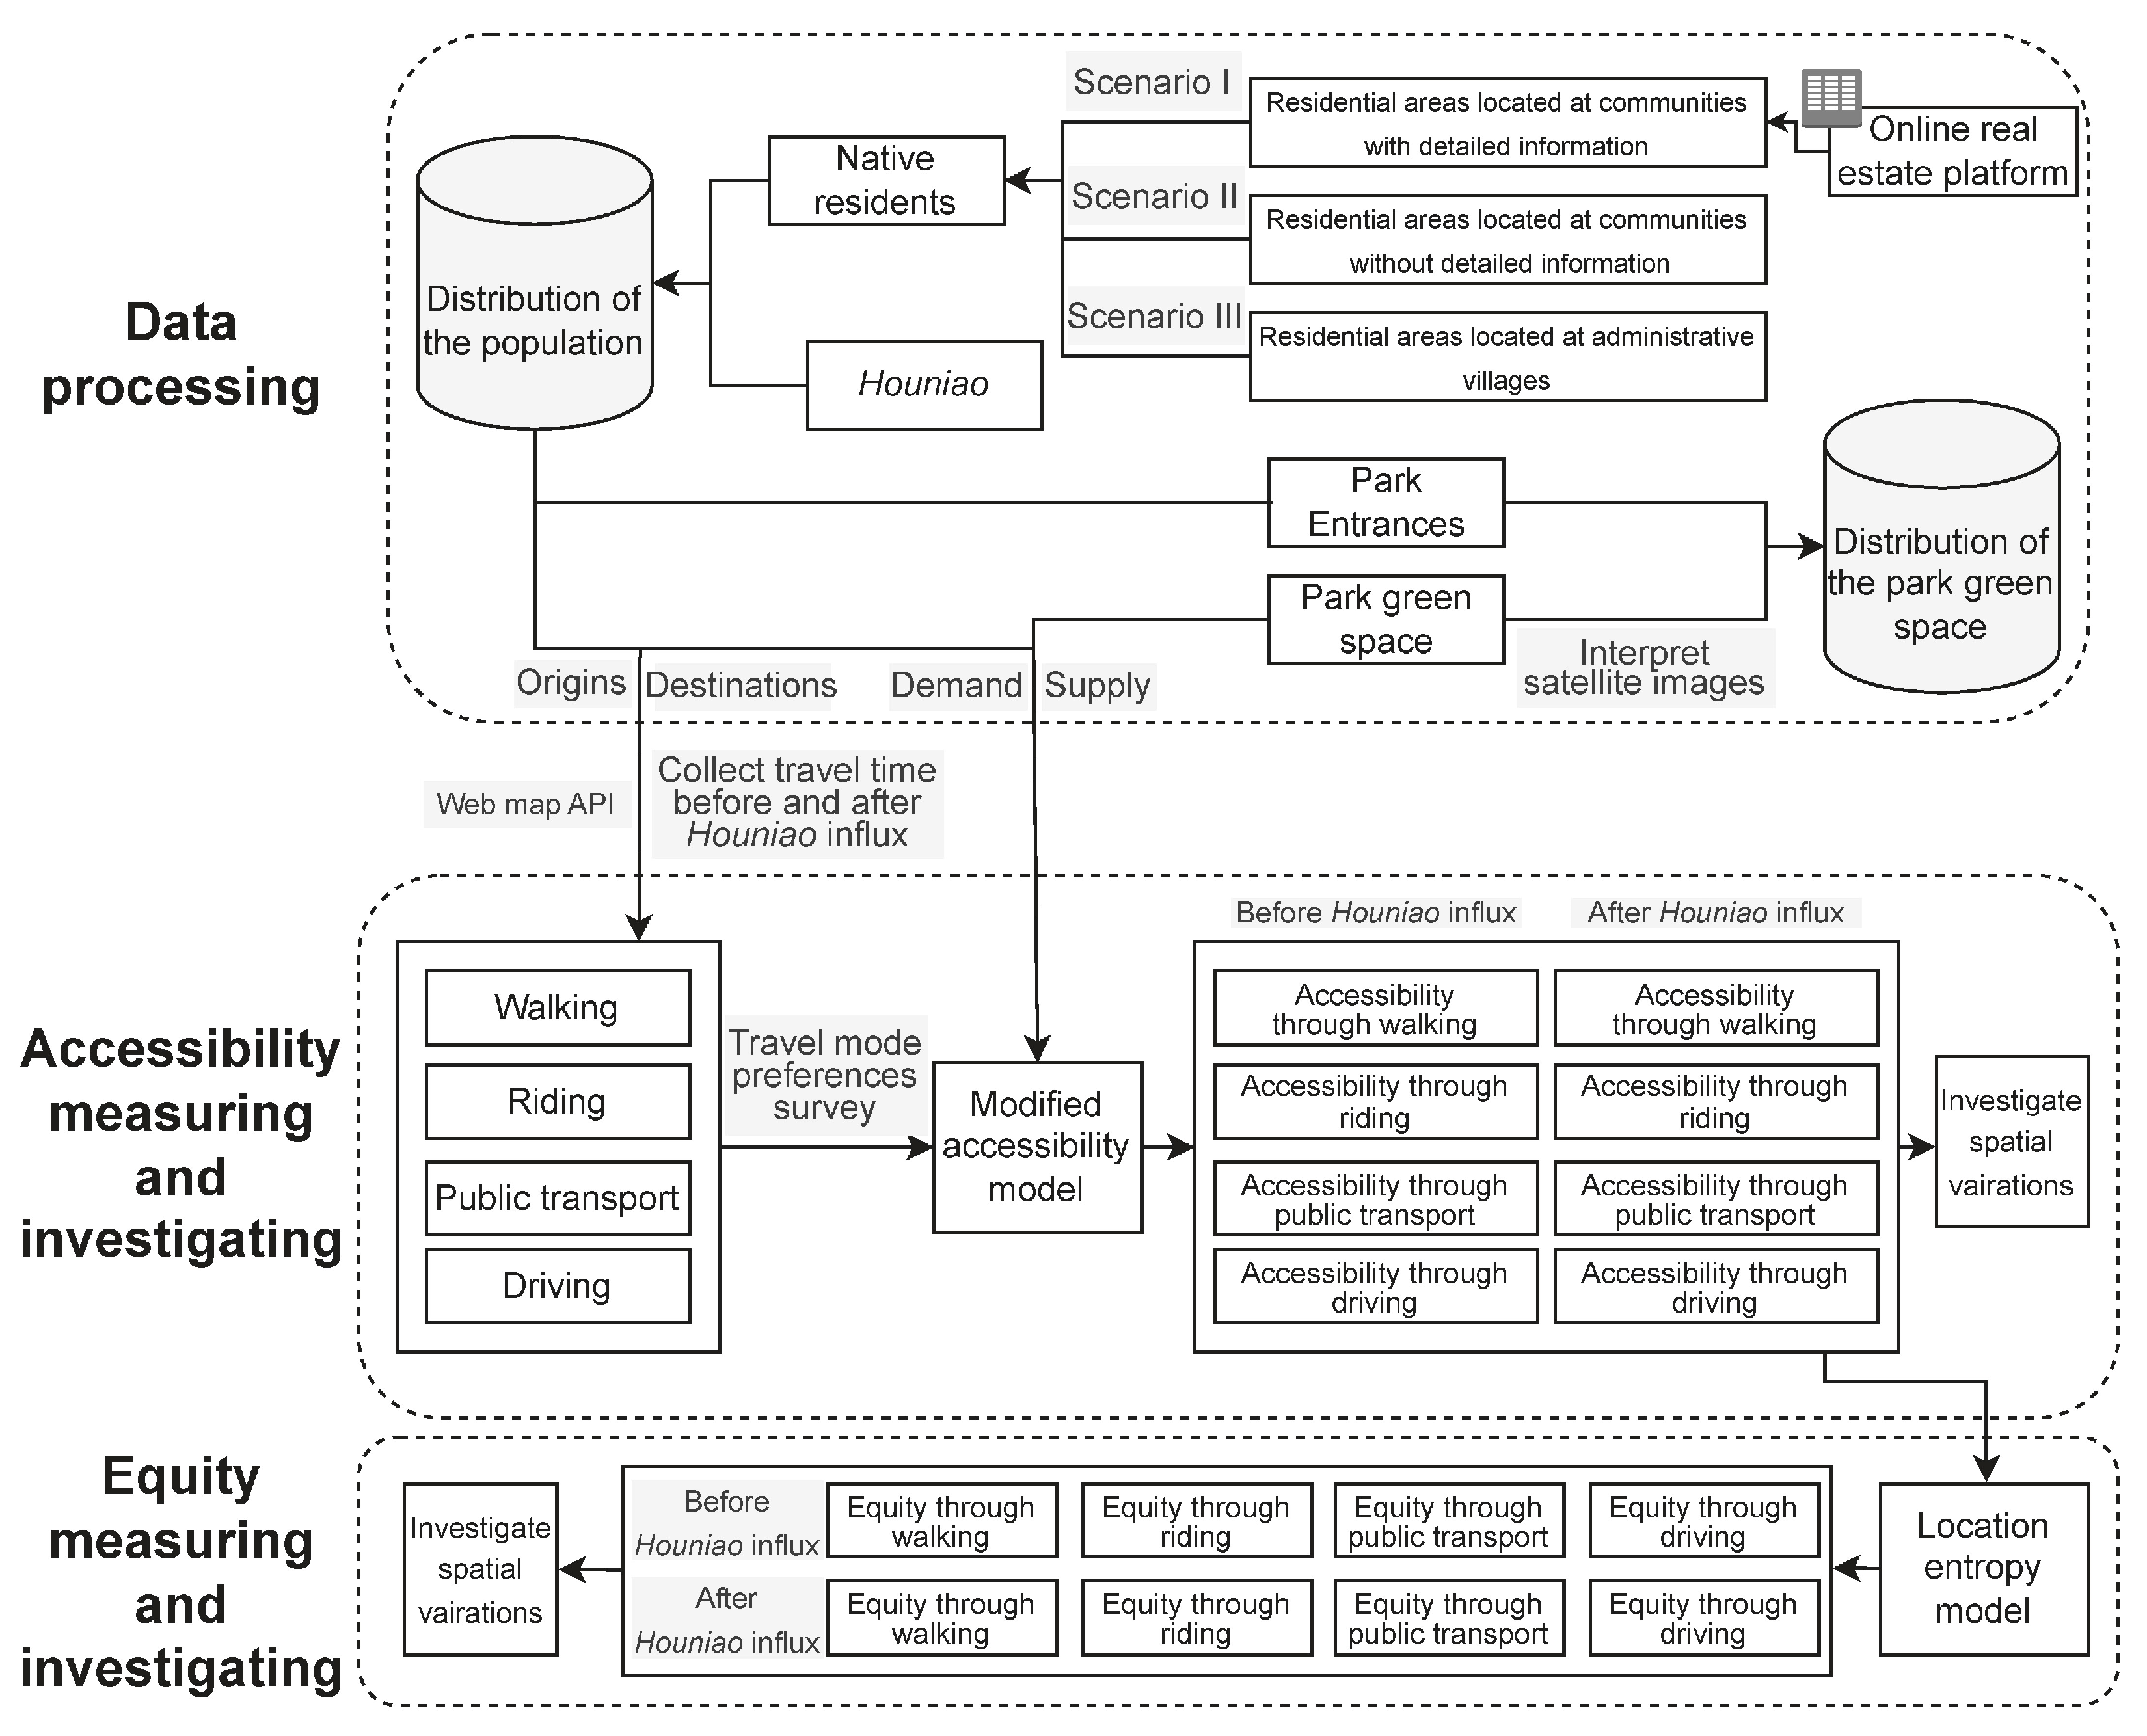
3.1. Methodological Framework
3.2. Data Processing
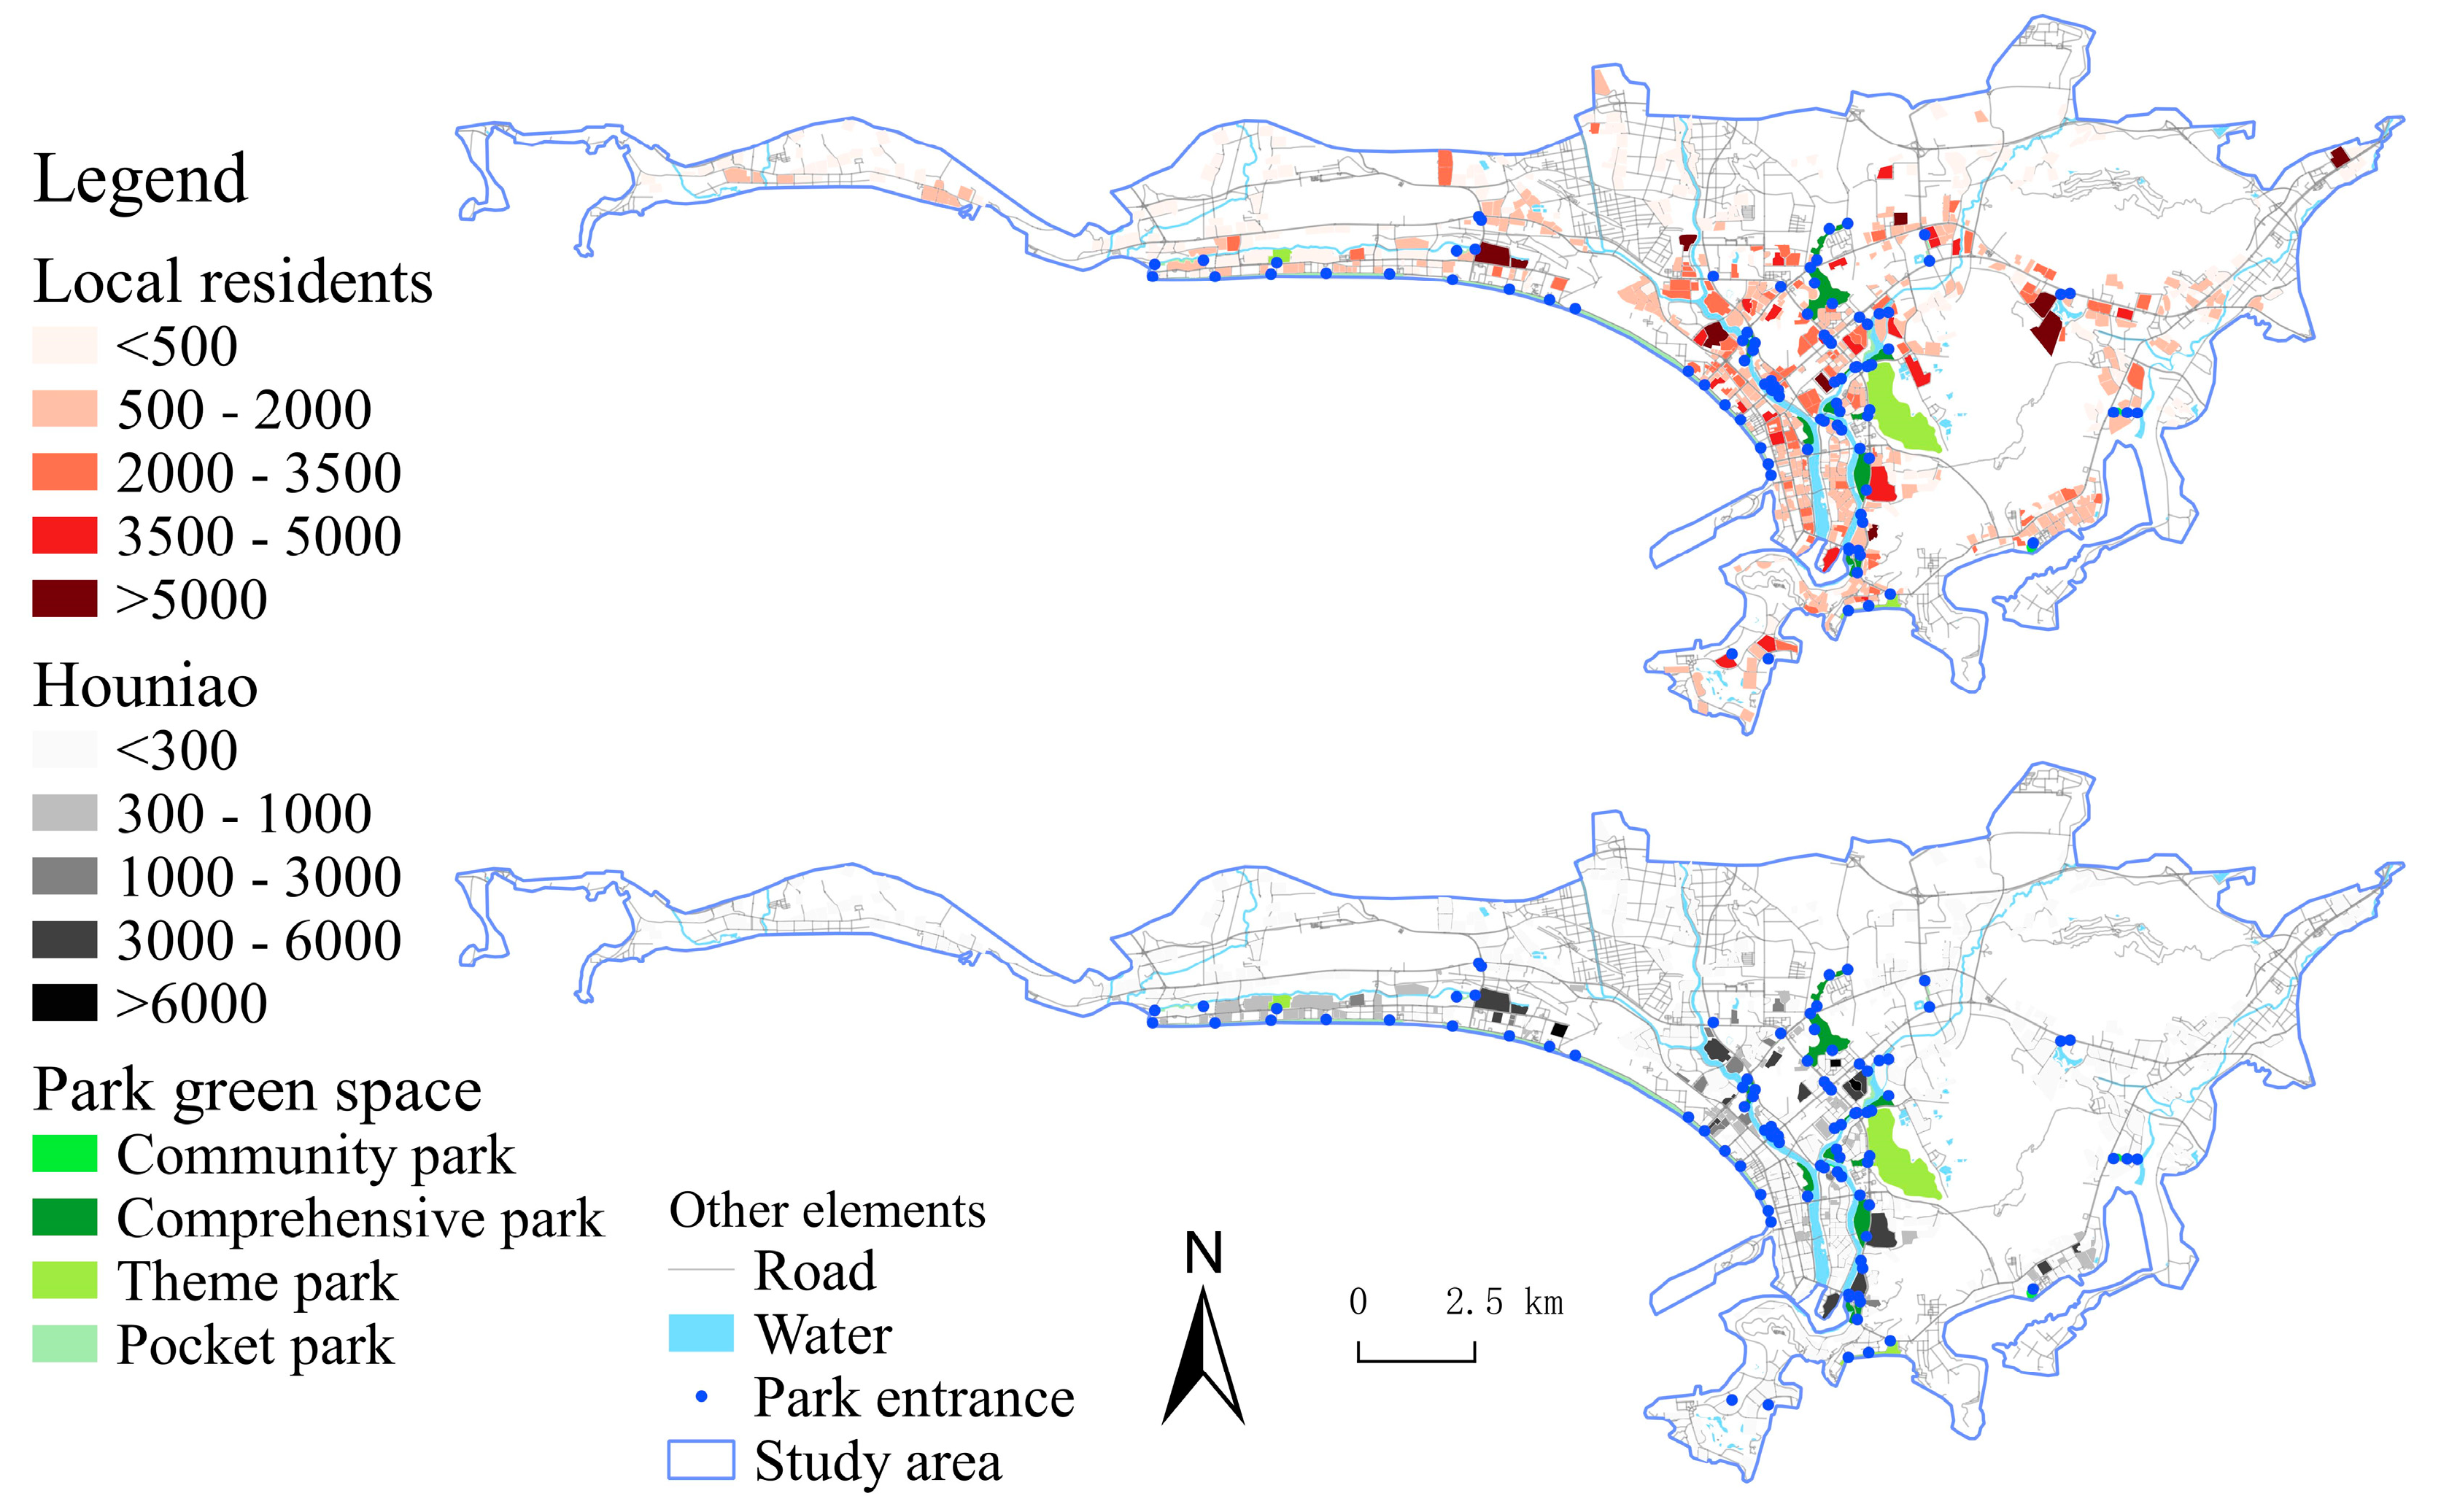
3.2.1. Population
3.2.2. Park Green Space
3.2.3. Travel Time
3.3. Methodology
3.3.1. Assessment of Spatial Accessibility of Park Green Space
3.3.2. Assessment of Spatial Equity of Park Green Space
4. Results
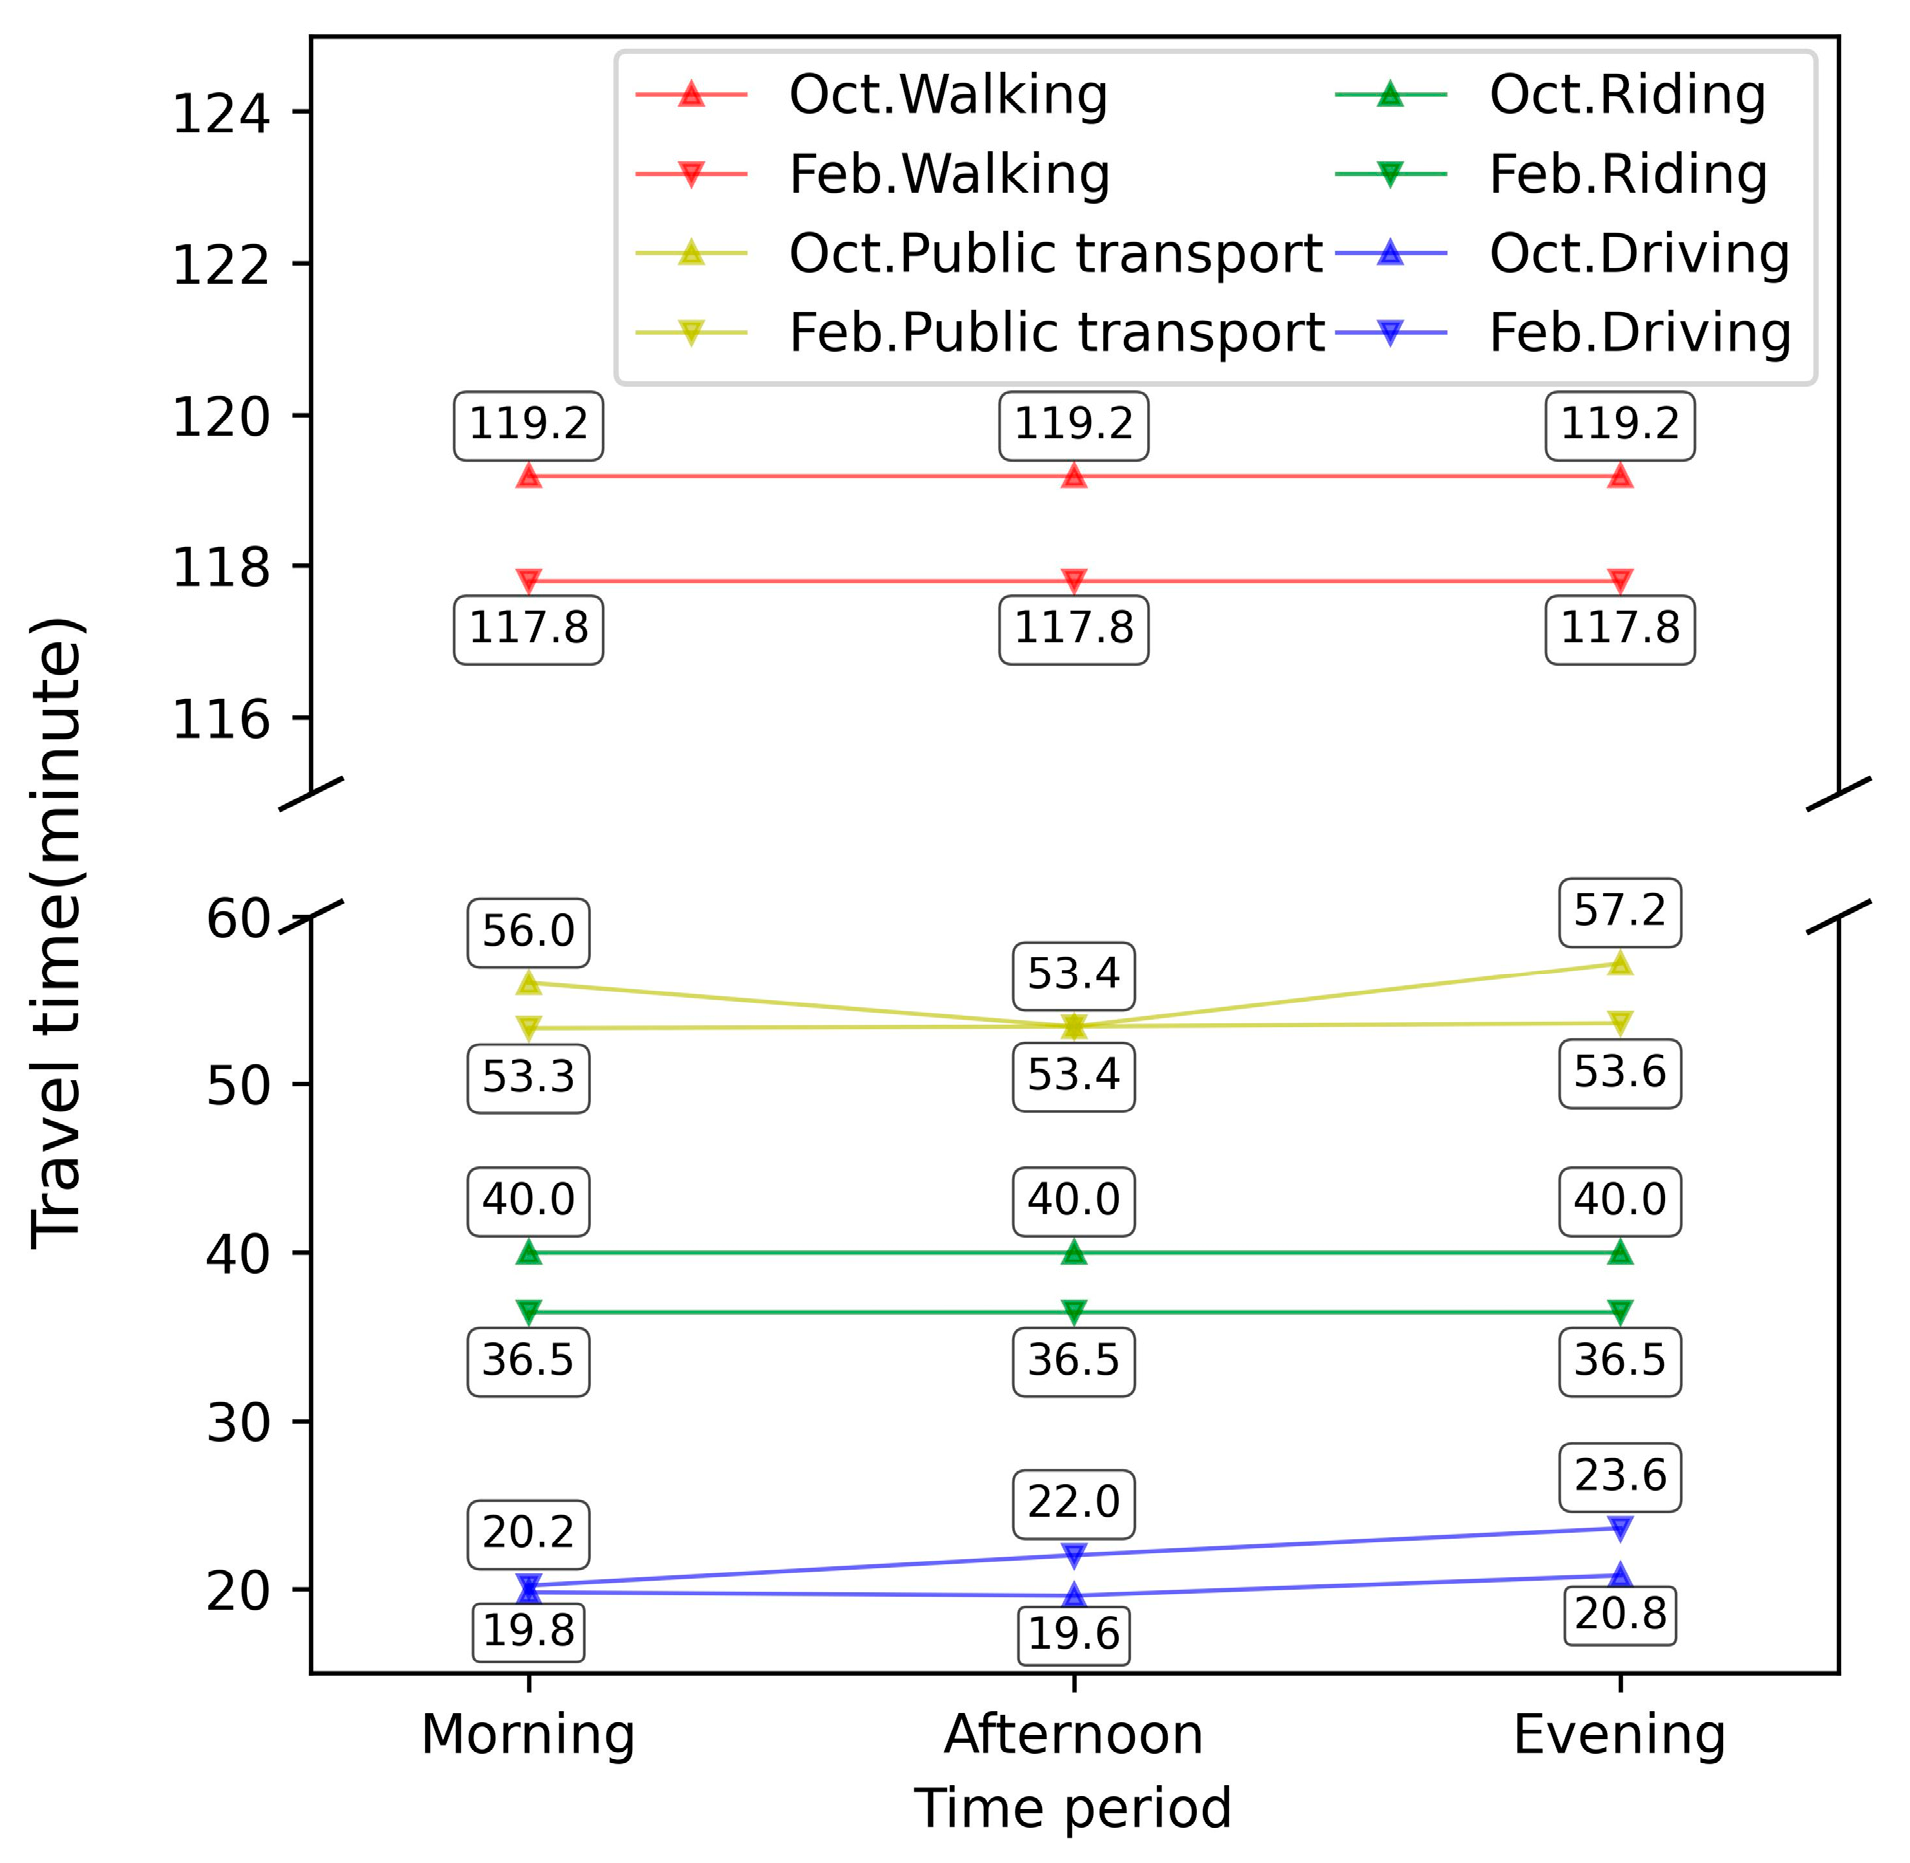
4.1. Travel Time under Different Modes
4.2. Park Green Space Accessibility before and after the Houniao Influx
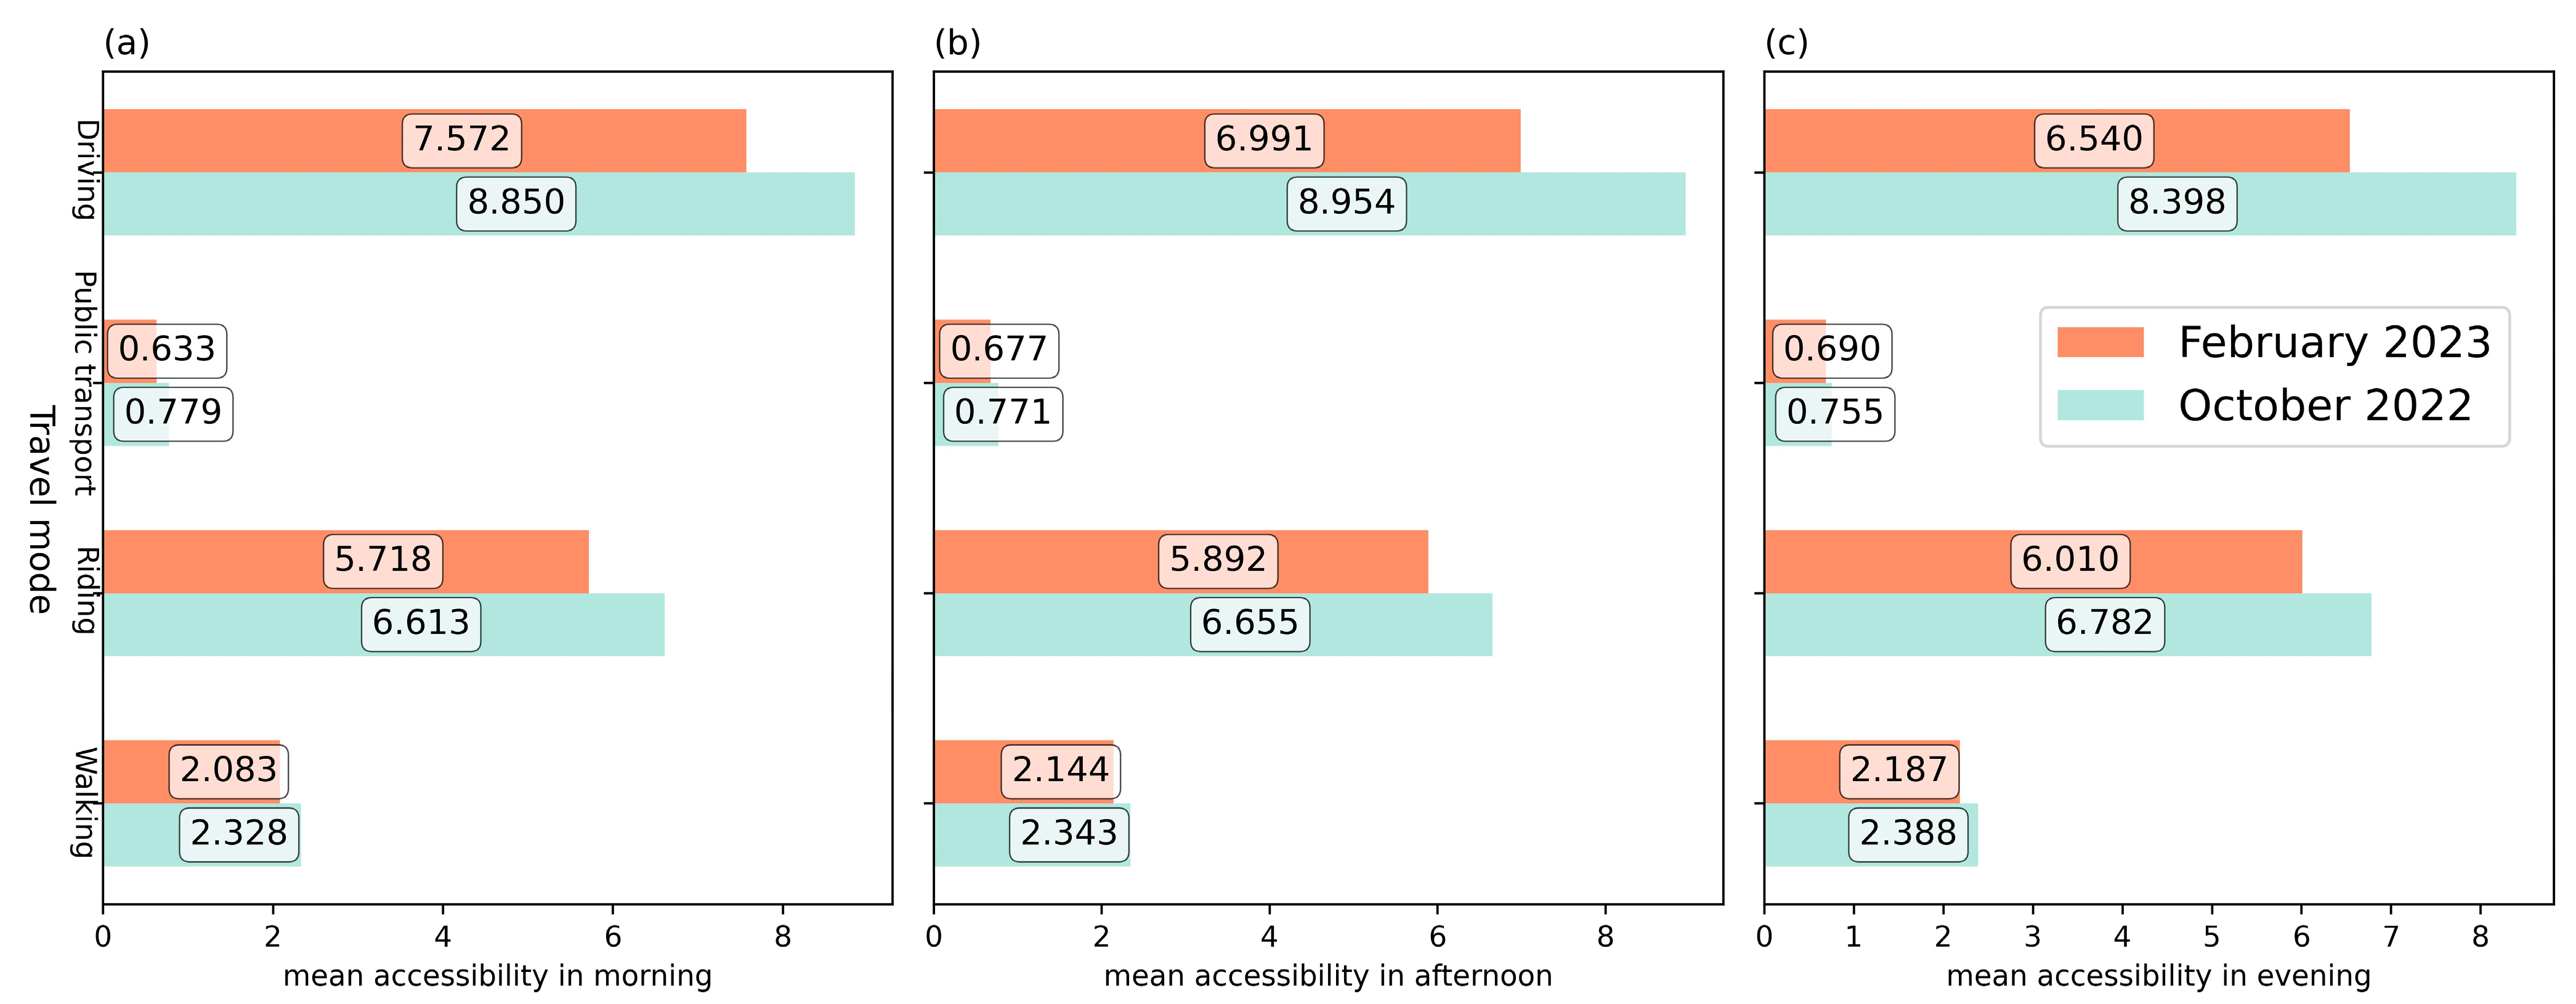
4.2.1. Discrepancy in the Average Park Green Space Accessibility
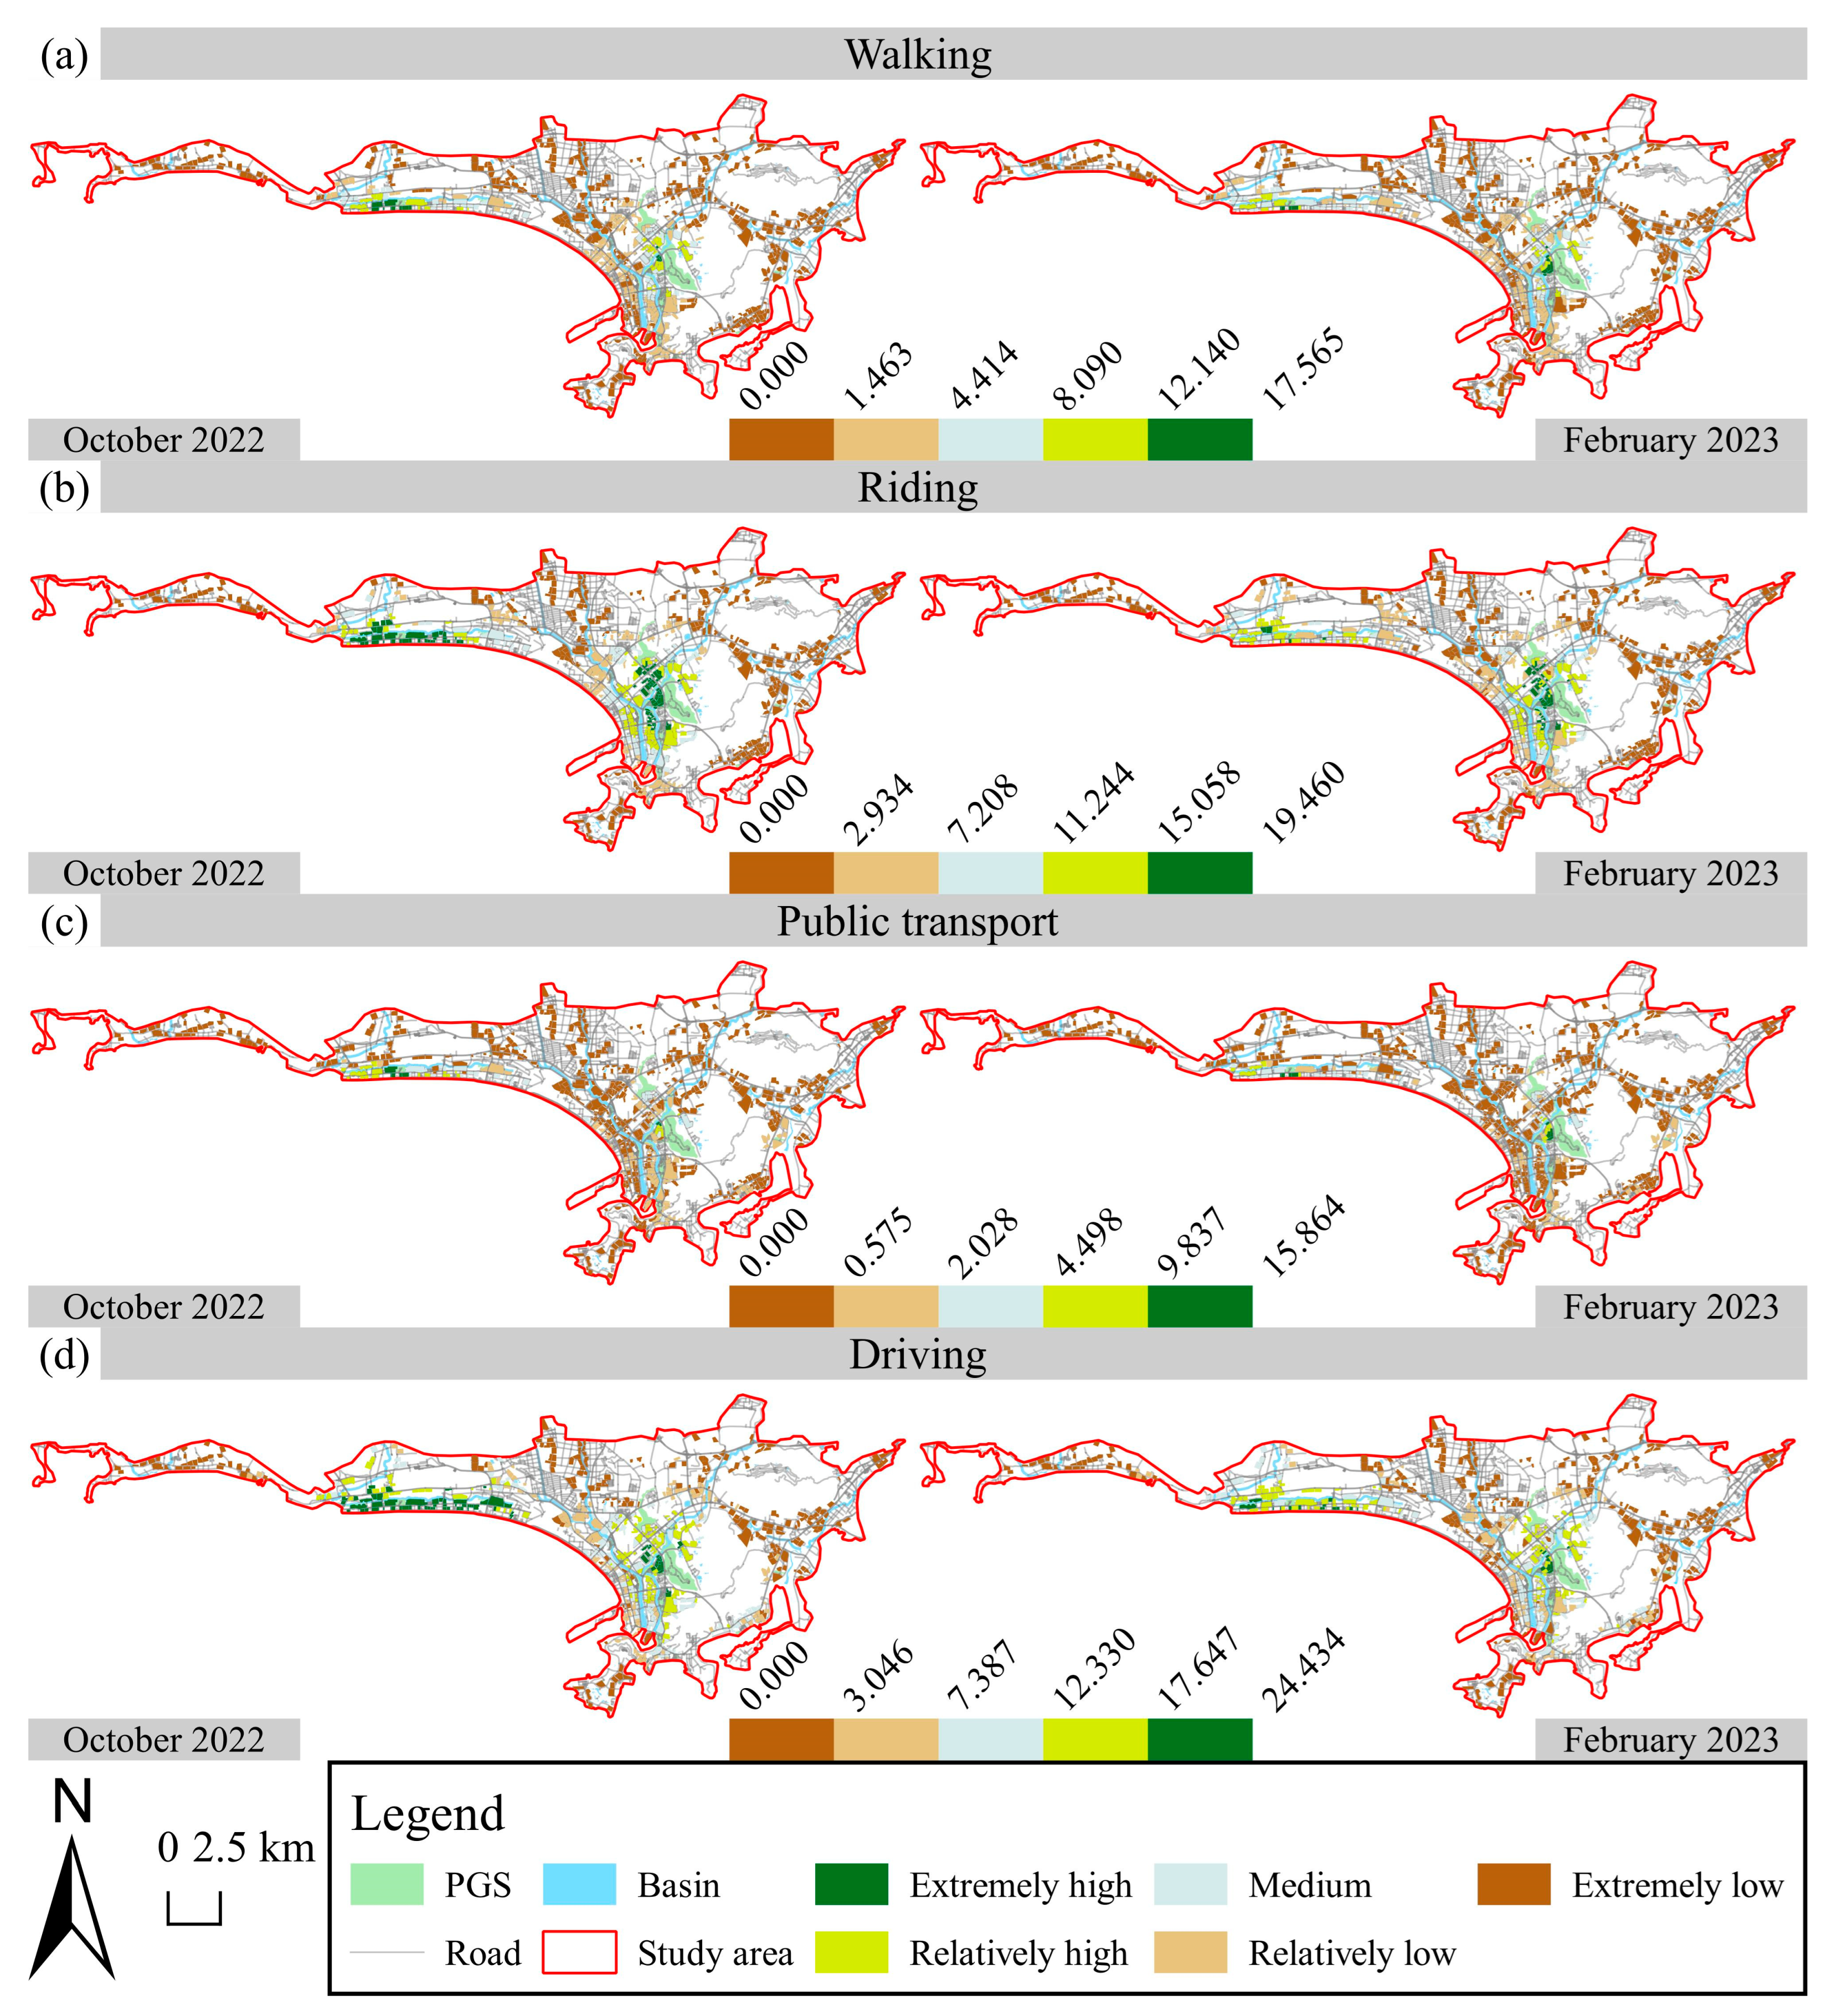
4.2.2. Spatiotemporal Variation in Park Green Space Accessibility
4.3. Park Green Space Equity before and after Influx of Houniao
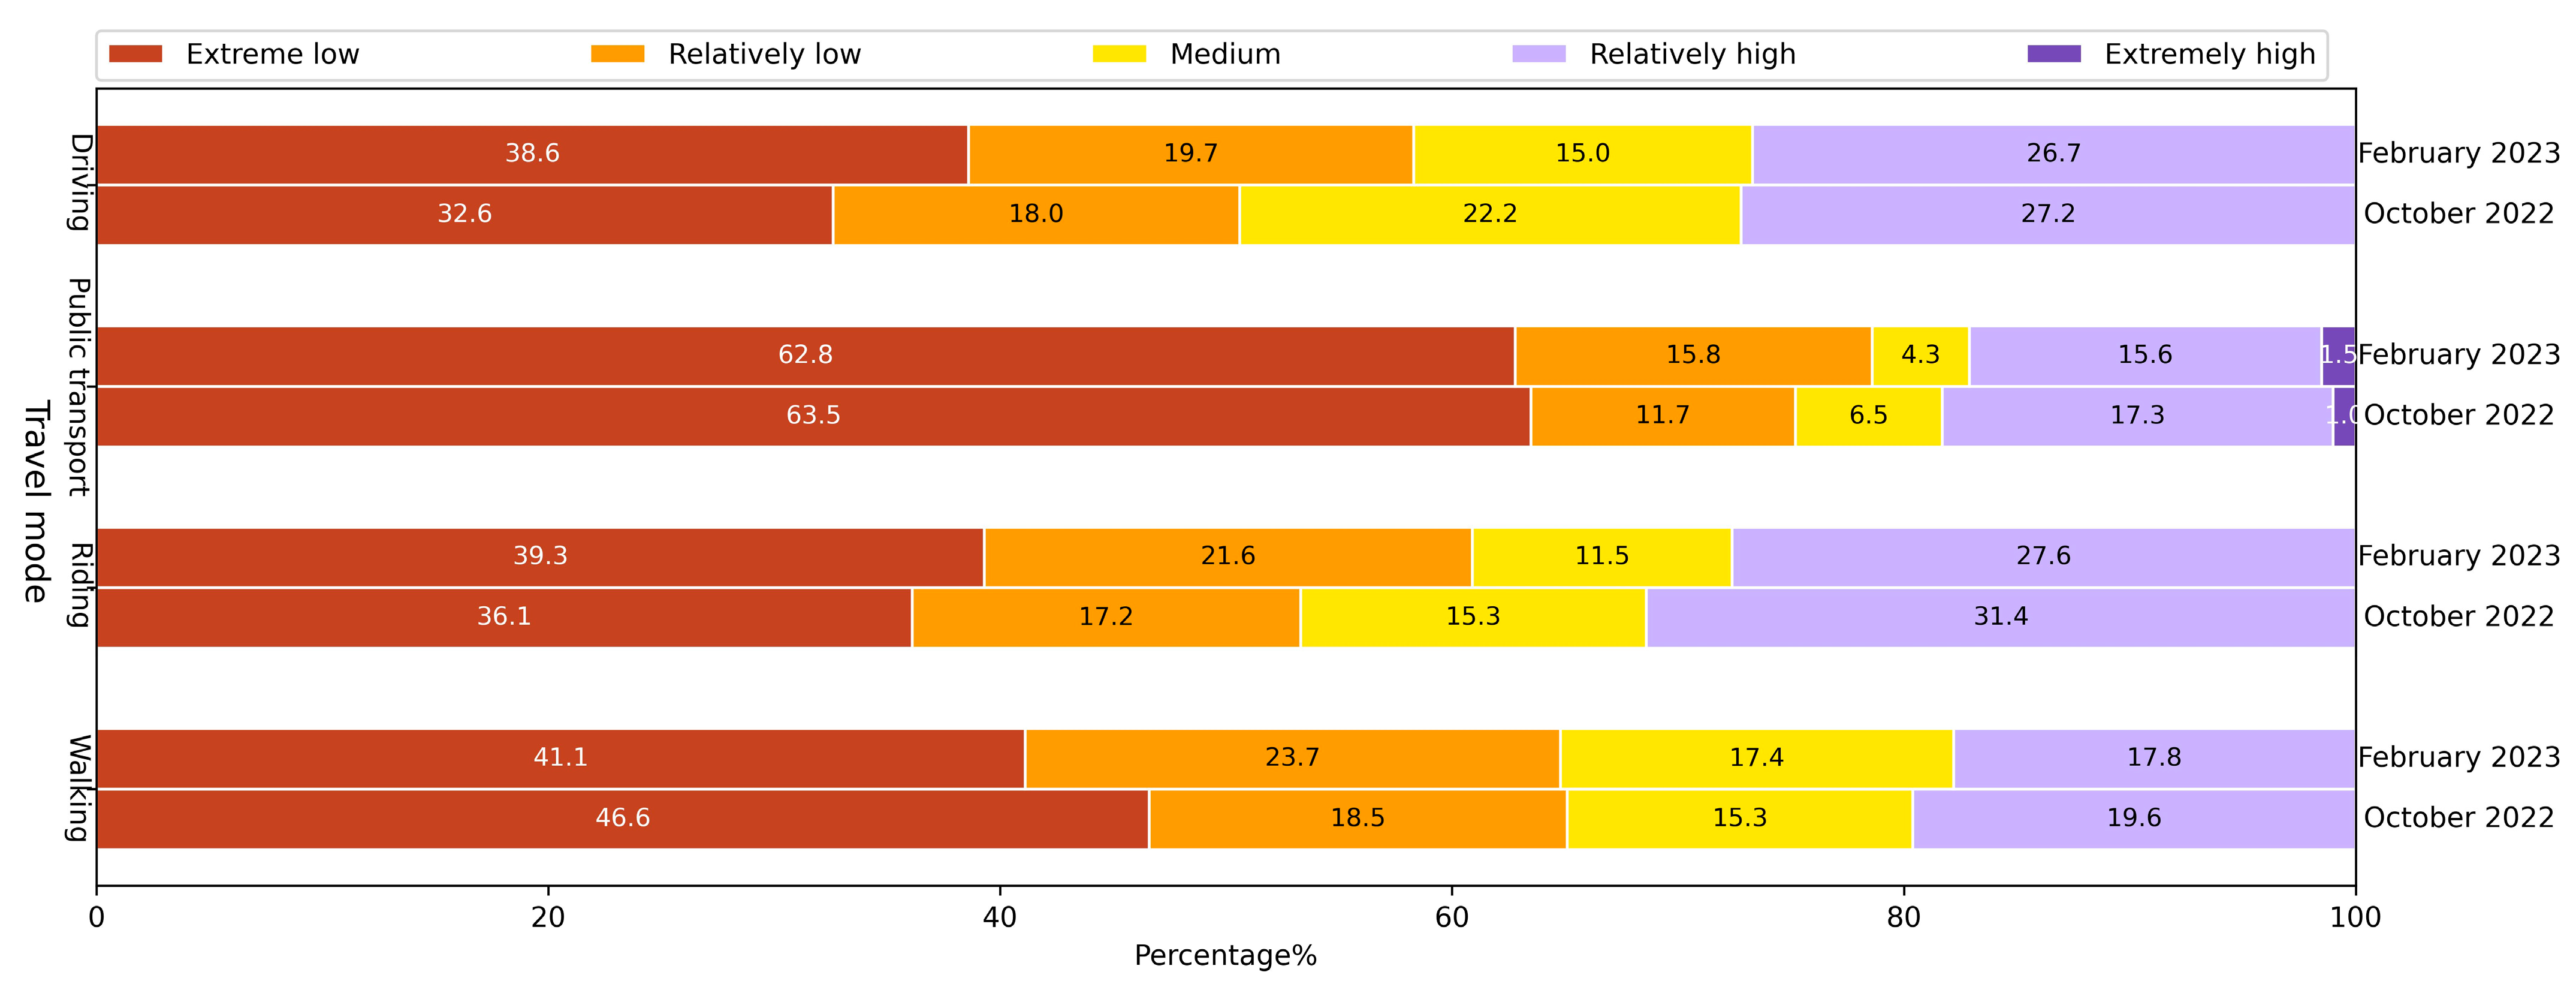
4.3.1. Variation in Park Green Space Equity
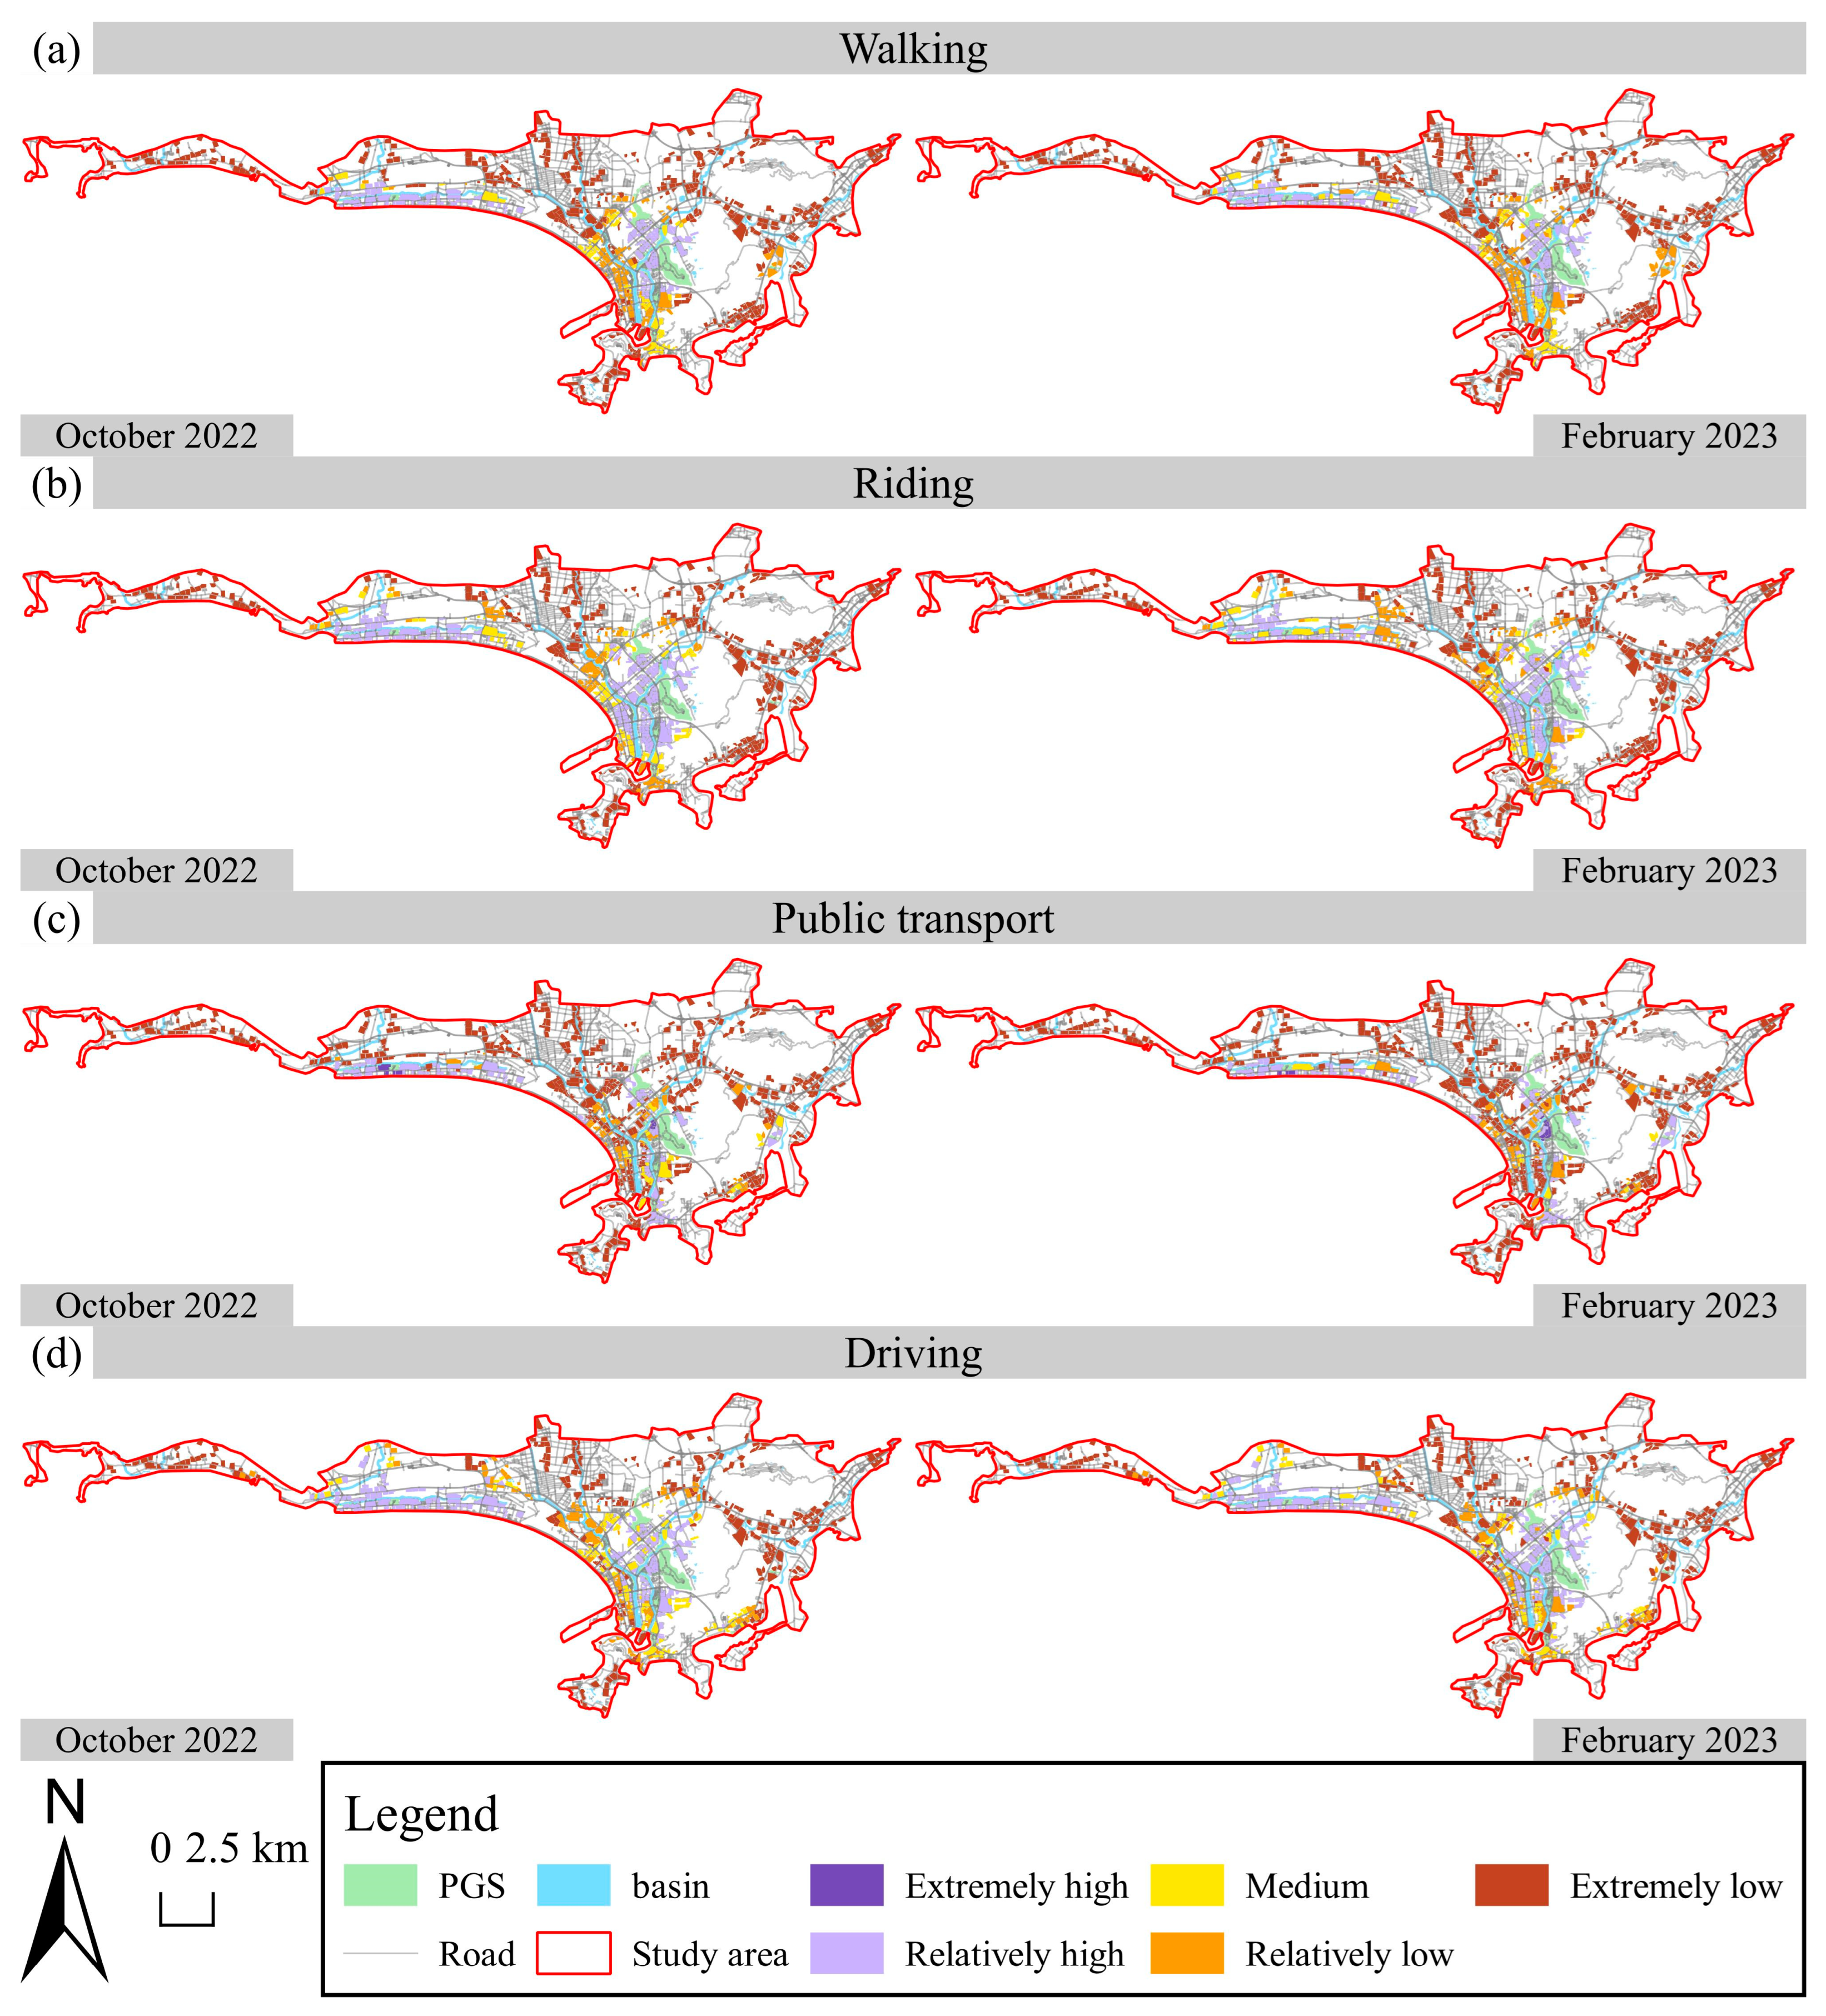
4.3.2. Spatiotemporal Variation in Park Green Space Equity
5. Discussion
6. Conclusions
Author Contributions
Funding
Data Availability Statement
Conflicts of Interest
References
- Repetti, M.; Phillipson, C.; Calasanti, T. Retirement migration in Europe: A choice for a better life? Sociol. Res. Online 2018, 23, 780–794. [Google Scholar] [CrossRef]
- Wong, K.M.; Musa, G. Retirement motivation among ‘Malaysia my second home’participants. Tour. Manag. 2014, 40, 141–154. [Google Scholar] [CrossRef]
- Li, Y.; Alencar, A. A tale of two cities: Digital place-making and elderly Houniao migration in China. J. Ethn. Migr. Stud. 2023, 49, 1032–1049. [Google Scholar] [CrossRef]
- Kohno, A.; Musa, G.; Nik Farid, N.D.; Abdul Aziz, N.; Nakayama, T.; Dahlui, M. Issues in healthcare services in Malaysia as experienced by Japanese retirees. BMC Health Serv. Res. 2016, 16, 167. [Google Scholar] [CrossRef]
- Iorio, M. Italian retirement migration: Stories from Bulgaria. Geoforum 2020, 111, 198–207. [Google Scholar] [CrossRef]
- Viallon, P. Retired snowbirds. Ann. Tour. Res. 2012, 39, 2073–2091. [Google Scholar] [CrossRef]
- Repetti, M.; Lawrence, J.L. The cultural and structural motivations of cheap mobility: The case of retirement migrants in Spain and Costa Rica. Geoforum 2021, 124, 156–164. [Google Scholar] [CrossRef]
- Pickering, J.; Crooks, V.A.; Snyder, J.; Milner, T. “If you have a pain, get on a plane”: Qualitatively exploring how short-term Canadian international retirement migrants prepare to manage their health while abroad. Trop. Dis. Travel Med. Vaccines 2021, 7, 1–10. [Google Scholar] [CrossRef]
- Tate, J.; Crooks, V.A.; Snyder, J. Altering consumer practices, facing uncertainties, and seeking stability: Canadian news media framings of international retirement migrants during the COVID-19 pandemic. Can. Geogr./Le Géographe Canadien 2022, 66, 65–75. [Google Scholar] [CrossRef]
- Winkler, R.L.; Matarrita-Cascante, D. Exporting consumption: Lifestyle migration and energy use. Glob. Environ. Chang. 2020, 61, 102026. [Google Scholar] [CrossRef]
- Jover, J.; Díaz-Parra, I. Who is the city for? Overtourism, lifestyle migration and social sustainability. Tour. Geogr. 2022, 24, 9–32. [Google Scholar] [CrossRef]
- Zasada, I.; Alves, S.; Müller, F.C.; Piorr, A.; Berges, R.; Bell, S. International retirement migration in the Alicante region, Spain: Process, spatial pattern and environmental impacts. J. Environ. Plan. Manag. 2010, 53, 125–141. [Google Scholar] [CrossRef]
- Crespo, M.; Follmann, A.; Butsch, C.; Dannenberg, P. International Retirement Migration: Mapping the spatio-temporal growth of foreign-owned properties in Cotacachi, Ecuador. J. Maps 2022, 18, 53–60. [Google Scholar] [CrossRef]
- Ma, A.; Chow, N.W. Economic impact of elderly amenity mobility in Southern China. J. Appl. Gerontol. 2006, 25, 275–290. [Google Scholar] [CrossRef]
- Chen, J. Displacement, emplacement and the lifestyles of Chinese ‘snowbirds’ and local residents in tropical Sanya. Soc. Cult. Geogr. 2020, 21, 629–650. [Google Scholar] [CrossRef]
- Chen, J.; Chen, N.; Cai, F. Sanya, China: Tropical climate and the rise of a small city. Cities 2022, 123, 103589. [Google Scholar] [CrossRef]
- Chen, J.; Wang, B. “Unattended” retirement: Lifestyle migration and precarity of the Houniao. Popul. Space Place 2020, 26, e2369. [Google Scholar] [CrossRef]
- Wang, Y.; Shi, X.; Cheng, K.; Zhang, J.; Chang, Q. How do urban park features affect cultural ecosystem services: Quantified evidence for design practices. Urban For. Urban Green. 2022, 76, 127713. [Google Scholar] [CrossRef]
- Gai, S.; Fu, J.; Rong, X.; Dai, L. Users’ views on cultural ecosystem services of urban parks: An importance-performance analysis of a case in Beijing, China. Anthropocene 2022, 37, 100323. [Google Scholar] [CrossRef]
- Yu, P.; Yung, E.H.K.; Chan, E.H.W.; Wang, S.; Chen, Y.; Chen, Y. Capturing open space fragmentation in high–density cities: Towards sustainable open space planning. Appl. Geogr. 2023, 154, 102927. [Google Scholar] [CrossRef]
- Zhang, R.; Peng, S.; Sun, F.; Deng, L.; Che, Y. Assessing the social equity of urban parks: An improved index integrating multiple quality dimensions and service accessibility. Cities 2022, 129, 103839. [Google Scholar] [CrossRef]
- Byrne, J.; Wolch, J. Nature, race, and parks: Past research and future directions for geographic research. Prog. Hum. Geogr. 2009, 33, 743–765. [Google Scholar] [CrossRef]
- Xing, L.; Liu, Y.; Wang, B.; Wang, Y.; Liu, H. An environmental justice study on spatial access to parks for youth by using an improved 2SFCA method in Wuhan, China. Cities 2020, 96, 102405. [Google Scholar] [CrossRef]
- Gu, Z.; Luo, X.; Tang, M.; Liu, X. Does the edge effect impact the healthcare equity? An examination of the equity in hospitals accessibility in the edge city in multi-scale. J. Transp. Geogr. 2023, 106, 103513. [Google Scholar] [CrossRef]
- Yu, P.; Chan, E.H.W.; Yung, E.H.K.; Wong, M.S.; Chen, Y. Open space fragmentation in Hong Kong’s built–up area: An integrated approach based on spatial horizontal and vertical equity lenses. Environ. Impact Assess. Rev. 2023, 102, 107174. [Google Scholar] [CrossRef]
- Rong, P.; Zheng, Z.; Kwan, M.-P.; Qin, Y. Evaluation of the spatial equity of medical facilities based on improved potential model and map service API: A case study in Zhengzhou, China. Appl. Geogr. 2020, 119, 102192. [Google Scholar] [CrossRef]
- Li, Z.; Fan, Z.; Song, Y.; Chai, Y. Assessing equity in park accessibility using a travel behavior-based G2SFCA method in Nanjing, China. J. Transp. Geogr. 2021, 96, 103179. [Google Scholar] [CrossRef]
- Wang, M.; Mu, L. Spatial disparities of Uber accessibility: An exploratory analysis in Atlanta, USA. Comput. Environ. Urban Syst. 2018, 67, 169–175. [Google Scholar] [CrossRef]
- Tian, M.; Yuan, L.; Guo, R.; Wu, Y.; Liu, X. Sustainable development: Investigating the correlations between park equality and mortality by multilevel model in Shenzhen, China. Sustain. Cities Soc. 2021, 75, 103385. [Google Scholar] [CrossRef]
- Stewart, J.Q. Empirical mathematical rules concerning the distribution and equilibrium of population. Geogr. Rev. 1947, 37, 461–485. [Google Scholar] [CrossRef]
- Hansen, W.G. How accessibility shapes land use. J. Am. Inst. Plan. 1959, 25, 73–76. [Google Scholar] [CrossRef]
- Nicholls, S. Measuring the accessibility and equity of public parks: A case study using GIS. Manag. Leis. 2001, 6, 201–219. [Google Scholar] [CrossRef]
- Oh, K.; Jeong, S. Assessing the spatial distribution of urban parks using GIS. Landsc. Urban Plan. 2007, 82, 25–32. [Google Scholar] [CrossRef]
- Luo, W.; Wang, F. Measures of spatial accessibility to health care in a GIS environment: Synthesis and a case study in the Chicago region. Environ. Plan. B Plan. Des. 2003, 30, 865–884. [Google Scholar] [CrossRef] [PubMed]
- Luo, W.; Qi, Y. An enhanced two-step floating catchment area (E2SFCA) method for measuring spatial accessibility to primary care physicians. Health Place 2009, 15, 1100–1107. [Google Scholar] [CrossRef] [PubMed]
- McGrail, M.R.; Humphreys, J.S. Measuring spatial accessibility to primary health care services: Utilising dynamic catchment sizes. Appl. Geogr. 2014, 54, 182–188. [Google Scholar] [CrossRef]
- Wan, N.; Zou, B.; Sternberg, T. A three-step floating catchment area method for analyzing spatial access to health services. Int. J. Geogr. Inf. Sci. 2012, 26, 1073–1089. [Google Scholar] [CrossRef]
- Mao, L.; Nekorchuk, D. Measuring spatial accessibility to healthcare for populations with multiple transportation modes. Health Place 2013, 24, 115–122. [Google Scholar] [CrossRef]
- Wang, H.; Wei, X.; Ao, W. Assessing Park Accessibility Based on a Dynamic Huff Two-Step Floating Catchment Area Method and Map Service API. ISPRS Int. J. Geo-Inf. 2022, 11, 394. [Google Scholar] [CrossRef]
- Yang, L.; Zhang, S.; Guan, M.; Cao, J.; Zhang, B. An Assessment of the Accessibility of Multiple Public Service Facilities and Its Correlation with Housing Prices Using an Improved 2SFCA Method—A Case Study of Jinan City, China. ISPRS Int. J. Geo-Inf. 2022, 11, 414. [Google Scholar] [CrossRef]
- Seifu, S.; Stellmacher, T. Accessibility of public recreational parks in Addis Ababa, Ethiopia: A GIS based analysis at sub-city level. Urban For. Urban Green. 2021, 57, 126916. [Google Scholar] [CrossRef]
- Boisjoly, G.; Deboosere, R.; Wasfi, R.; Orpana, H.; Manaugh, K.; Buliung, R.; El-Geneidy, A. Measuring accessibility to hospitals by public transport: An assessment of eight Canadian metropolitan regions. J. Transp. Health 2020, 18, 100916. [Google Scholar] [CrossRef]
- Liu, L.; Yu, H.; Zhao, J.; Wu, H.; Peng, Z.; Wang, R. Multiscale Effects of Multimodal Public Facilities Accessibility on Housing Prices Based on MGWR: A Case Study of Wuhan, China. ISPRS Int. J. Geo-Inf. 2022, 11, 57. [Google Scholar] [CrossRef]
- Wu, W.; Zheng, T. Establishing a “dynamic two-step floating catchment area method” to assess the accessibility of urban green space in Shenyang based on dynamic population data and multiple modes of transportation. Urban For. Urban Green. 2023, 82, 127893. [Google Scholar] [CrossRef]
- Xiao, W.; Wei, Y.D.; Wan, N. Modeling job accessibility using online map data: An extended two-step floating catchment area method with multiple travel modes. J. Transp. Geogr. 2021, 93, 103065. [Google Scholar] [CrossRef]
- Zheng, Z.; Shen, W.; Li, Y.; Qin, Y.; Wang, L. Spatial equity of park green space using KD2SFCA and web map API: A case study of Zhengzhou, China. Appl. Geogr. 2020, 123, 102310. [Google Scholar] [CrossRef]
- GB/T 51346-2019; Standard for Planning of Urban Green Space. Ministry of Housing and Urban-Rural Development of the People’s Republic of China: Beijing, China, 2019.
- CJJ/T 85-2017; Standard for Classification of Urban Green Space. Ministry of Housing and Urban-Rural Development of the People’s Republic of China: Beijing, China, 2017.
- Zhou, S.; Chen, F.; Xu, Z. Evaluating the accessibility of urban parks and waterfronts through online map services: A case study of Shaoxing, China. Urban For. Urban Green. 2022, 77, 127731. [Google Scholar] [CrossRef]
- Jin, H.; Lu, Y. Multi-Mode Huff-Based 2SFCA: Examining Geographical Accessibility to Food Outlets in Austin, Texas. ISPRS Int. J. Geo-Inf. 2022, 11, 579. [Google Scholar] [CrossRef]
- Hu, S.; Song, W.; Li, C.; Lu, J. A multi-mode Gaussian-based two-step floating catchment area method for measuring accessibility of urban parks. Cities 2020, 105, 102815. [Google Scholar] [CrossRef]
- Xu, M.; Xin, J.; Su, S.; Weng, M.; Cai, Z. Social inequalities of park accessibility in Shenzhen, China: The role of park quality, transport modes, and hierarchical socioeconomic characteristics. J. Transp. Geogr. 2017, 62, 38–50. [Google Scholar] [CrossRef]
- Talen, E.; Anselin, L. Assessing spatial equity: An evaluation of measures of accessibility to public playgrounds. Environ. Plan. A 1998, 30, 595–613. [Google Scholar] [CrossRef]
- Omer, I. Evaluating accessibility using house-level data: A spatial equity perspective. Comput. Environ. Urban Syst. 2006, 30, 254–274. [Google Scholar] [CrossRef]
- Zheng, Z.; Xia, H.; Ambinakudige, S.; Qin, Y.; Li, Y.; Xie, Z.; Zhang, L.; Gu, H. Spatial accessibility to hospitals based on web mapping API: An empirical study in Kaifeng, China. Sustainability 2019, 11, 1160. [Google Scholar] [CrossRef]
- Wang, J.; Su, Y.; Chen, Z.; Tang, L.; Wang, G.; Wang, J. Assessing the Spatial Accessibility of Urban Medical Facilities in Multi-Level and Multi-Period Scales Based on Web Mapping API and an Improved Potential Model. ISPRS Int. J. Geo-Inf. 2022, 11, 545. [Google Scholar] [CrossRef]
- Zhang, L.; Chen, P.; Hui, F. Refining the accessibility evaluation of urban green spaces with multiple sources of mobility data: A case study in Shenzhen, China. Urban For. Urban Green. 2022, 70, 127550. [Google Scholar] [CrossRef]
- Liu, S.; Wang, X. Reexamine the value of urban pocket parks under the impact of the COVID-19. Urban For. Urban Green. 2021, 64, 127294. [Google Scholar] [CrossRef]
- Xia, Y.; Chen, H.; Zuo, C.; Zhang, N. The impact of traffic on equality of urban healthcare service accessibility: A case study in Wuhan, China. Sustain. Cities Soc. 2022, 86, 104130. [Google Scholar] [CrossRef]
- Zhang, W.; Gao, Y.; Li, S.; Liu, W.; Zeng, C.; Gao, L.; Li, M.; Peng, C. Accessibility measurements for urban parks considering age-grouped walkers’ sectorial travel behavior and built environment. Urban For. Urban Green. 2022, 76, 127715. [Google Scholar] [CrossRef]
- Pfertner, M.; Büttner, B.; Wulfhorst, G. An Open-Source Modelling Methodology for Multimodal and Intermodal Accessibility Analysis of Workplace Locations. Sustainability 2023, 15, 1947. [Google Scholar] [CrossRef]

| Levels | Meaning | |
|---|---|---|
| I | PGS equity of extremely high level | |
| I | PGS equity of relatively high level | |
| III | PGS equity of medium level | |
| IV | PGS equity of relatively low level | |
| V | PGS equity of extremely low level |
Disclaimer/Publisher’s Note: The statements, opinions and data contained in all publications are solely those of the individual author(s) and contributor(s) and not of MDPI and/or the editor(s). MDPI and/or the editor(s) disclaim responsibility for any injury to people or property resulting from any ideas, methods, instructions or products referred to in the content. |
© 2023 by the authors. Licensee MDPI, Basel, Switzerland. This article is an open access article distributed under the terms and conditions of the Creative Commons Attribution (CC BY) license (https://creativecommons.org/licenses/by/4.0/).
Share and Cite
Yang, W.; Cheng, Y.; Xu, C.; Zhang, J. The Seasonal Migrants Spatially Affect the Park Green Space Accessibility and Equity under Different Travel Modes: Evidence from Sanya, China. ISPRS Int. J. Geo-Inf. 2023, 12, 423. https://doi.org/10.3390/ijgi12100423
Yang W, Cheng Y, Xu C, Zhang J. The Seasonal Migrants Spatially Affect the Park Green Space Accessibility and Equity under Different Travel Modes: Evidence from Sanya, China. ISPRS International Journal of Geo-Information. 2023; 12(10):423. https://doi.org/10.3390/ijgi12100423
Chicago/Turabian StyleYang, Wentong, Yeqing Cheng, Chunru Xu, and Jinping Zhang. 2023. "The Seasonal Migrants Spatially Affect the Park Green Space Accessibility and Equity under Different Travel Modes: Evidence from Sanya, China" ISPRS International Journal of Geo-Information 12, no. 10: 423. https://doi.org/10.3390/ijgi12100423
APA StyleYang, W., Cheng, Y., Xu, C., & Zhang, J. (2023). The Seasonal Migrants Spatially Affect the Park Green Space Accessibility and Equity under Different Travel Modes: Evidence from Sanya, China. ISPRS International Journal of Geo-Information, 12(10), 423. https://doi.org/10.3390/ijgi12100423