

Mapping Climate Parameters over the Territory of Botswana Using GMT and Gridded Surface Data from TerraClimate

Abstract
1. Introduction
- To produce a series of climatic maps of Botswana and their associated topographic, environmental, and climate attributes, referenced to the regional and local geospatial geographic scale of the country;
- To perform script-based mapping techniques, which present a new cartographic methodology. This includes the demonstrating of the programming approach of GMT, which differs from the traditional GIS, because it integrates the cartographic methods and the programming syntax;
- To apply the open source datasets of GEBCO and TerraClimate with a spatial extent of Botswana, aimed at addressing and visualising the occurrence, trends and strength of different climate variables associated with environmental factors;
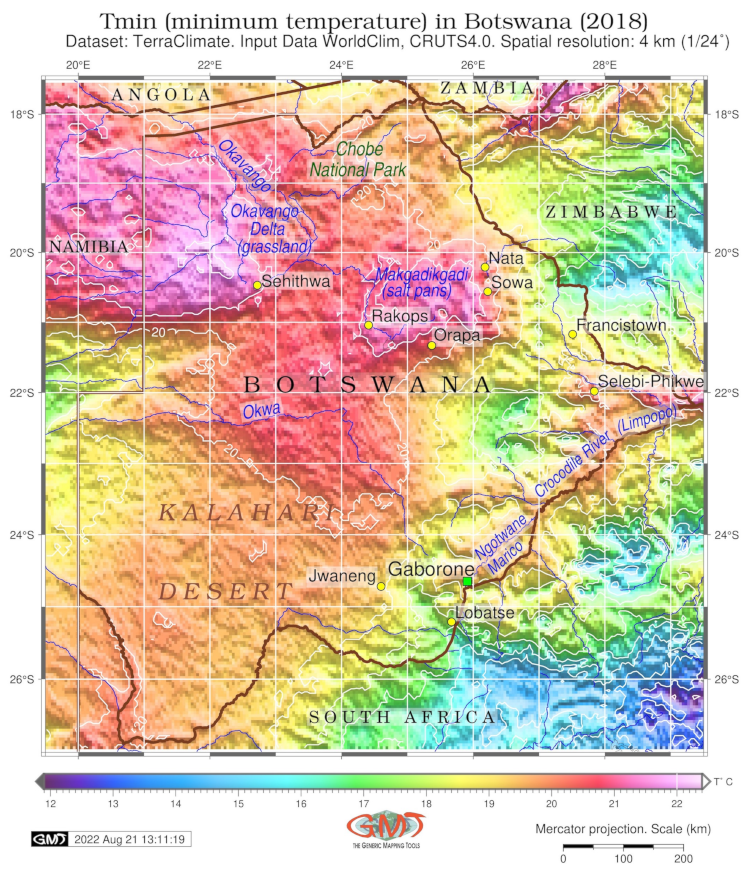
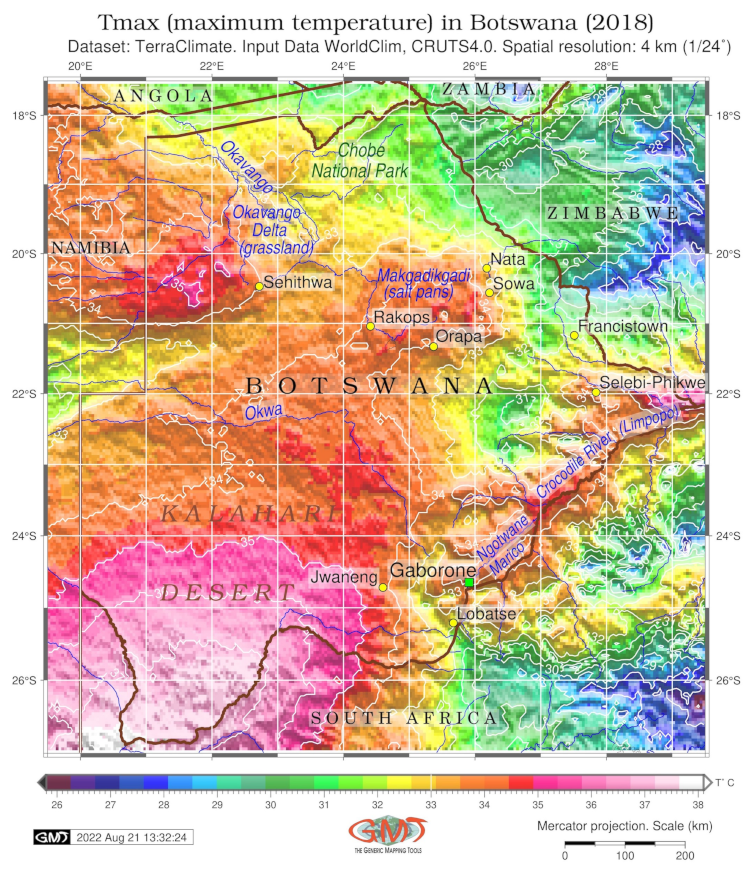
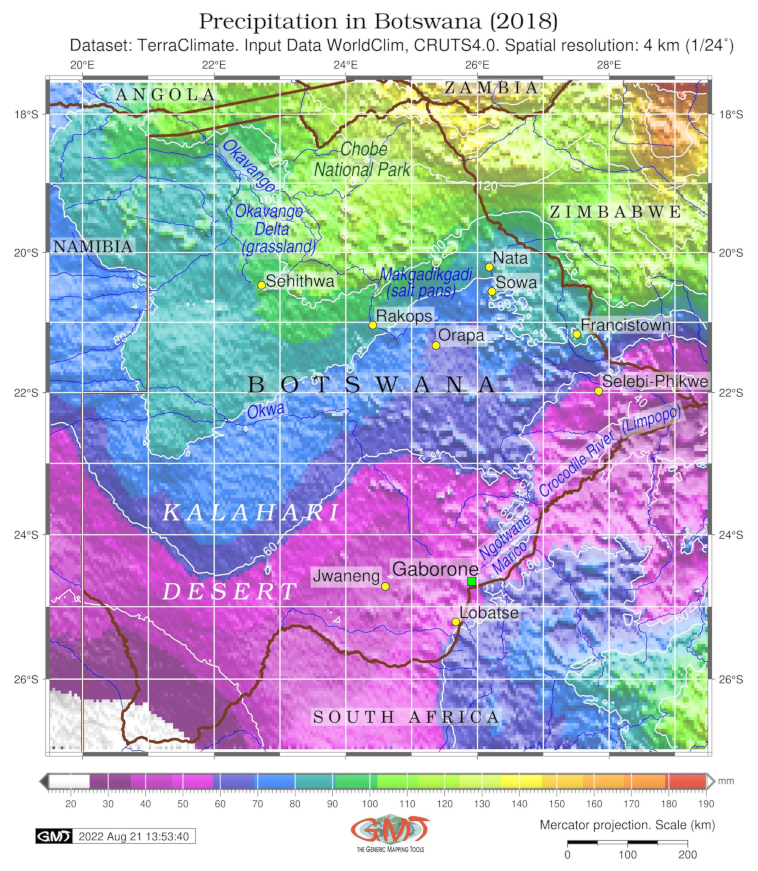
- To visualise the climate parameters of Botswana: temperature extremes /, precipitation, soil moisture, potential evapotranspiration (PET), actual evapotranspiration (AET), downward surface shortwave radiation, vapour pressure (VP), vapour pressure deficit (VPD), wind speed, Palmer Drought Severity Index (PDSI).
2. Study Area
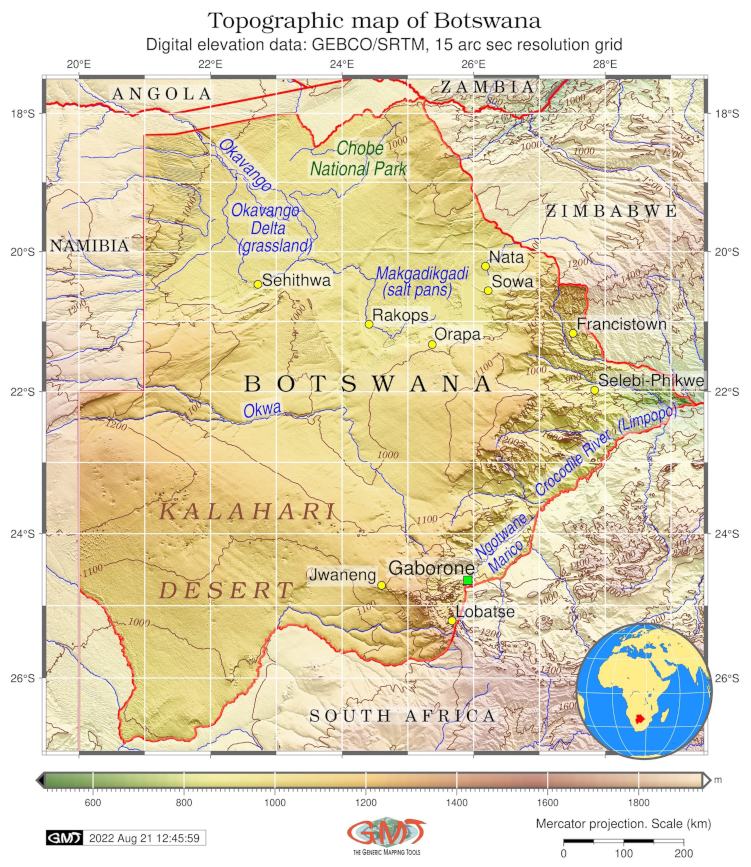
2.1. Relief
2.2. Climate
3. Data
4. Methodology
- Making background raster grid with 50% translucency:
- Adding isolines:
- Adding coastlines, country borders and rivers:
- Adding text for cities: , where the plotted text is located between the two EOF (a common abbreviation for the End Of File expression).
- Changing text parameters:
- Adding a GMT logo:
- Adding a subtitle:
- Plotting the insert map (round globe in the lower right bottom corner of the map in Figure 1 showing the country’s location with the map of Africa): This code utilises the ‘BW’ abbreviation of Botswana from the ISO 3166-1 alpha-2 countries codes.
- Specifying the location of the insert map on the main map in Figure 1: . Here the ‘BR’ signifies the ‘bottom right’ specification for the insert globe map plotting.
- : here, the temporary file with the data is created.
- : here, the plotting is finished, this part of the script is ready, and ‘-O -K’ signifies the overlay and code continuation.
- Extracting a subset of AET for Botswana:
- Adding grids for all the maps: Here, the ‘f’ stands for the frequency of minor ticks, ‘g’ for major, and ‘a’ for annotations.
- Converting PostScript file to the image JPG file with 720 dpi resolution using GhostScript (PET of Botswana):
- Generating colour palette and adjusting it for the extent of values in PDSI map of Botswana: .
- Using the Geospatial Data Abstraction Library (GDAL) library for analysis of the statistics for raster grid of Botswana:
5. Results
6. Discussion
- −
- Meteorological drought (dominating dry weather conditions);
- −
- Hydrological drought (noticeable low water supply);
- −
- Agricultural drought (crops are being affected);
- −
- Socioeconomic drought.
7. Conclusions
Funding
Institutional Review Board Statement
Informed Consent Statement
Data Availability Statement
Acknowledgments
Conflicts of Interest
Abbreviations
| AET | Actual Evapotranspiration |
| DSSR | Downward Shortwave Surface Radiation |
| GDAL | Geospatial Data Abstraction Library |
| GEBCO | General Bathymetric Chart of the Oceans |
| GIS | Geographic Information System |
| GMT | Generic Mapping Tools |
| GUI | Graphical User Interface |
| NetCDF | Network Common Data Form |
| PDSI | Palmer Drought Severity Index |
| PET | Potential Evapotranspiration |
| SRTM | Shuttle Radar Topography Mission |
| SPI | Standardized Precipitation Index |
| SPEI | Standardized Precipitation Evapotranspiration Index |
| VPD | Vapor Pressure Deficit |
| VP | Vapor Pressure |
References
- Turner, M.D. Methodological Reflections on the Use of Remote Sensing and Geographic Information Science in Human Ecological Research. Hum. Ecol. 2003, 31, 255–279. [Google Scholar] [CrossRef]
- Hamandawana, H. The impacts of herbivory on vegetation in Moremi Game Reserve, Botswana: 1967–2001. Reg. Environ. Chang. 2012, 12, 1–15. [Google Scholar] [CrossRef]
- Maoyi, M.L.; Abiodun, B.J. Investigating the response of the Botswana High to El Niño Southern Oscillation using a variable resolution global climate model. Theor. Appl. Climatol. 2022, 147, 1601–1615. [Google Scholar] [CrossRef]
- Segobye, A. Divided commons: The political economy of Southern Africa’s cultural heritage landscapes—Observations of the central Kalahari game reserve, Botswana. Archaeologies 2006, 2, 52–72. [Google Scholar] [CrossRef]
- Ceccato, P.; Fernandes, K.; Ruiz, D.; Allis, E. Climate and environmental monitoring for decision making. Earth Perspect. 2014, 1, 16. [Google Scholar] [CrossRef]
- De Sherbinin, A. Climate change hotspots mapping: What have we learned? Clim. Chang. 2014, 123, 23–37. [Google Scholar] [CrossRef]
- Herslund, L.B.; Jalayer, F.; Jean-Baptiste, N.; Jørgensen, G.; Kabisch, S.; Kombe, W.; Lindley, S.; Nyed, P.K.; Pauleit, S.; Printz, A.; et al. A multi-dimensional assessment of urban vulnerability to climate change in Sub-Saharan Africa. Nat. Hazards 2016, 82, 149–172. [Google Scholar] [CrossRef]
- Wessel, P.; Luis, J.F.; Uieda, L.; Scharroo, R.; Wobbe, F.; Smith, W.H.F.; Tian, D. The Generic Mapping Tools version 6. Geochem. Geophys. Geosyst. 2019, 20, 5556–5564. [Google Scholar] [CrossRef]
- Batisani, N. The Spatio-Temporal-Severity Dynamics of Drought in Botswana. J. Environ. Prot. 2011, 2, 803–816. [Google Scholar] [CrossRef]
- Vanderpost, C.; Ringrose, S.; Matheson, W.; Arntzen, J. Satellite based long-term assessment of rangeland condition in semi-arid areas: An example from Botswana. J. Arid. Environ. 2011, 75, 383–389. [Google Scholar] [CrossRef]
- Mogotsi, K.; Nyangito, M.M.; Nyariki, D.M. The role of drought among agro-pastoral communities in a semi-arid environment: The case of Botswana. J. Arid. Environ. 2013, 91, 38–44. [Google Scholar] [CrossRef]
- Akinyemi, F.O.; Mashame, G. Analysis of land change in the dryland agricultural landscapes of eastern Botswana. Land Use Policy 2018, 76, 798–811. [Google Scholar] [CrossRef]
- Atekwana, E.A.; Molwalefhe, L.; Kgaodi, O.; Cruse, A.M. Effect of evapotranspiration on dissolved inorganic carbon and stable carbon isotopic evolution in rivers in semi-arid climates: The Okavango Delta in North West Botswana. J. Hydrol. Reg. Stud. 2016, 7, 1–13. [Google Scholar] [CrossRef]
- Ringrose, S.; Chipanshi, A.; Matheson, W.; Chanda, R.; Motoma, L.; Magole, I.; Jellema, A. Climate- and Human-Induced Woody Vegetation Changes in Botswana and Their Implications for Human Adaptation. Environ. Manag. 2002, 30, 98–109. [Google Scholar] [CrossRef]
- Kenabatho, P.K.; Parida, B.P.; Moalafhi, D.B. The value of large-scale climate variables in climate change assessment: The case of Botswana’s rainfall. Phys. Chem. Earth Parts A/B/C 2012, 50–52, 64–71. [Google Scholar] [CrossRef]
- Byakatonda, J.; Parida, B.P.; Kenabatho, P.K.; Moalafhi, D.B. Prediction of onset and cessation of austral summer rainfall and dry spell frequency analysis in semiarid Botswana. Theor. Appl. Climatol. 2019, 135, 101–117. [Google Scholar] [CrossRef]
- Batisani, N.; Yarnal, B. Rainfall variability and trends in semi-arid Botswana: Implications for climate change adaptation policy. Appl. Geogr. 2010, 30, 483–489. [Google Scholar] [CrossRef]
- Longley, P.A.; Goodchild, M.F.; Maguire, D.J.; Rhind, D.W. Geographic Information Science and Systems, 4th ed.; John Wiley & Sons: Hoboken, NJ, USA, 2015. [Google Scholar]
- Chrisman, N. Exploring Geographic Information Systems, 2nd ed.; John Wiley & Sons: Hoboken, NJ, USA, 2001. [Google Scholar]
- Vankova, L.; Krejza, Z.; Kocourkova, G.; Laciga, J. Geographic Information System Usage Options in Facility Management. Procedia Comput. Sci. 2022, 196, 708–716. [Google Scholar] [CrossRef]
- Rahman, M.M.; Szabó, G. Sustainable Urban Land-Use Optimization Using GIS-Based Multicriteria Decision-Making (GIS-MCDM) Approach. ISPRS Int. J. Geo-Inf. 2022, 11, 313. [Google Scholar] [CrossRef]
- Visvalingam, M. Cartography, GIS and Maps in Perspective. Cartogr. J. 1989, 26, 26–32. [Google Scholar] [CrossRef]
- Nilsson, A.; Mentis, D.; Korkovelos, A.; Otwani, J. A GIS-Based Approach to Estimate Electricity Requirements for Small-Scale Groundwater Irrigation. ISPRS Int. J. Geo-Inf. 2021, 10, 780. [Google Scholar] [CrossRef]
- Lemenkova, P. The visualization of geophysical and geomorphologic data from the area of Weddell Sea by the Generic Mapping Tools. Stud. Quat. 2021, 38, 19–32. [Google Scholar] [CrossRef]
- Xing, Z.; Guo, W. A New Urban Space Analysis Method Based on Space Syntax and Geographic Information System Using Multisource Data. ISPRS Int. J. Geo-Inf. 2022, 11, 297. [Google Scholar] [CrossRef]
- Reed, M.; Dougill, A. Linking degradation assessment to sustainable land management: A decision support system for Kalahari pastoralists. J. Arid. Environ. 2010, 74, 149–155. [Google Scholar] [CrossRef]
- Jovanovic, N.Z.; Annandale, J.G.; Claassens, A.S.; Lorentz, S.A.; Tanner, P.D. Modeling Irrigation with Gypsiferous Mine Water: A Case Study in Botswana. Mine Water Environ. 2001, 20, 65–72. [Google Scholar] [CrossRef]
- Basupi, L.V.; Quinn, C.H.; Dougill, A.J. Historical perspectives on pastoralism and land tenure transformation in Ngamiland, Botswana: What are the policy and institutional lessons? Pastoralism 2017, 7, 24. [Google Scholar] [CrossRef]
- Mfundisi, K.B. Overview of an integrated management plan for the Okavango Delta Ramsar Site, Botswana. Wetlands 2008, 28, 538–543. [Google Scholar] [CrossRef]
- Osupile, K.; Yahya, A.; Samikannu, R. A Review on Agriculture Monitoring Systems using Internet of Things (IoT). In Proceedings of the 2022 International Conference on Applied Artificial Intelligence and Computing (ICAAIC), Kuala Lumpur, Malaysia, 9–10 December 2022; pp. 1565–1572. [Google Scholar] [CrossRef]
- Tsheboeng, G.; Murray-Hudson, M.; Kashe, K. Regeneration status of riparian tree species in two sites that differ in land-use in the Okavango Delta, Botswana. J. For. Res. 2017, 28, 1073–1082. [Google Scholar] [CrossRef]
- Moses, O. Weather systems influencing Botswana rainfall: The case of 9 December 2018 storm in Mahalapye, Botswana. Model. Earth Syst. Environ. 2019, 5, 1473–1480. [Google Scholar] [CrossRef]
- Mogome-Ntsatsi, K.; Adeola, O.A. Promoting environmental awareness in Botswana: The role of community education. Environmentalist 1995, 15, 281–292. [Google Scholar] [CrossRef]
- Lange, G. Wealth, Natural Capital, and Sustainable Development: Contrasting Examples from Botswana and Namibia. Environ. Resour. Econ. 2004, 29, 257–283. [Google Scholar] [CrossRef]
- Kasalica, V.; Lamprecht, A.L. Automated composition of scientific workflows: A case study on geographic data manipulation. In Proceedings of the 2018 IEEE 14th International Conference on e-Science (e-Science), Amsterdam, The Netherlands, 29 October–1 November 2018; pp. 362–363. [Google Scholar] [CrossRef]
- Lemenkova, P. Automatic Data Processing for Visualising Yap and Palau Trenches by Generic Mapping Tools. Cartogr. Lett. 2019, 27, 72–89. [Google Scholar] [CrossRef]
- Lemenkova, P. Seismicity in the Afar Depression and Great Rift Valley, Ethiopia. Environ. Res. Eng. Manag. 2022, 78, 83–96. [Google Scholar] [CrossRef]
- Spinellis, D. Drawing Tools. IEEE Softw. 2009, 26, 12–13. [Google Scholar] [CrossRef]
- Lemenkova, P. GMT Based Comparative Analysis and Geomorphological Mapping of the Kermadec and Tonga Trenches, Southwest Pacific Ocean. Geogr. Tech. 2019, 14, 39–48. [Google Scholar] [CrossRef]
- Yajima, T.; Gwandu, K.R.; Sigweni, M.A. Mapping mafic and ultramafic units using remote sensing data in north east Botswana. In Proceedings of the 2011 IEEE International Geoscience and Remote Sensing Symposium, Vancouver, BC, Canada, 24–29 July 2011; pp. 2218–2220. [Google Scholar] [CrossRef]
- Ceccato, P.; Vancutsem, C.; Temimi, M. Monitoring air and Land Surface Temperatures from remotely sensed data for climate-human health applications. In Proceedings of the 2010 IEEE International Geoscience and Remote Sensing Symposium, Honolulu, HI, USA, 25–30 July 2010; pp. 178–180. [Google Scholar] [CrossRef]
- Campbell, A. The use of wild food plants, and drought in Botswana. J. Arid. Environ. 1986, 11, 81–91. [Google Scholar] [CrossRef]
- Ellery, W.N.; McCarthy, T.S.; Smith, N.D. Vegetation, hydrology, and sedimentation patterns on the major distributary system of the Okavango fan, Botswana. Wetlands 2003, 23, 357–375. [Google Scholar] [CrossRef]
- Franchi, F.; Kelepile, T.; Di Capua, A.; De Wit, M.C.J.; Kemiso, O.; Lasarwe, R.; Catuneanu, O. Lithostratigraphy, sedimentary petrography and geochemistry of the Upper Karoo Supergroup in the Central Kalahari Karoo Sub-Basin, Botswana. J. Afr. Earth Sci. 2021, 173, 104025. [Google Scholar] [CrossRef]
- Masunga, G.S.; Moe, S.R.; Pelekekae, B. Fire and Grazing Change Herbaceous Species Composition and Reduce Beta Diversity in the Kalahari Sand System. Ecosystems 2013, 16, 252–268. [Google Scholar] [CrossRef]
- Elliott, D.R.; Thomas, A.D.; Hoon, S.R.; Sen, R. Niche partitioning of bacterial communities in biological crusts and soils under grasses, shrubs and trees in the Kalahari. Biodivers. Conserv. 2014, 23, 1709–1733. [Google Scholar] [CrossRef]
- Eckardt, F.D.; Cotterill, F.P.; Flügel, T.J.; Kahle, B.; McFarlane, M.; Rowe, C. Mapping the surface geomorphology of the Makgadikgadi Rift Zone (MRZ). Quat. Int. 2016, 404, 115–120. [Google Scholar] [CrossRef]
- McFarlane, M.; Long, C. Pan floor ‘barchan’ mounds, Ntwetwe Pan, Makgadikgadi, Botswana: Their origin and palaeoclimatic implications. Quat. Int. 2015, 372, 108–119. [Google Scholar] [CrossRef]
- Burrough, S.L.; Thomas, D.S.G.; Bailey, R.M.; Davies, L. From landform to process: Morphology and formation of lake-bed barchan dunes, Makgadikgadi, Botswana. Geomorphology 2012, 161–162, 1–14. [Google Scholar] [CrossRef]
- Wood, W.W.; Eckardt, F.D.; Kraemer, T.F.; Eng, K. Quantitative Eolian Transport of Evaporite Salts from the Makgadikgadi Depression (Ntwetwe and Sua Pans) in Northeastern Botswana: Implications for Regional Ground-Water Quality. In Sabkha Ecosystems. Tasks for Vegetation Science; Öztürk, M., Böer, B., Barth, H.J., Clüsener-Godt, M., Khan, M., Breckle, S.W., Eds.; Springer: Dordrecht, The Netherlands, 2010; Volume 46, pp. 27–37. [Google Scholar] [CrossRef]
- Hemming, C.F. Drought in Botswana. J. Arid. Environ. 1980, 3, 181. [Google Scholar] [CrossRef]
- Karikari, S.K.; Tabona, T.T. Constitutive traits and selective indices of Bambara groundnut (Vigna subterranea (L.) Verdc) landraces for drought tolerance under Botswana conditions. Phys. Chem. Earth Parts A/B/C 2004, 29, 1029–1034. [Google Scholar] [CrossRef]
- Badimo, D.; Mogomotsi, P.K.; Mogomotsi, G.E.J. Participatory mapping of water collection by Sexaxa community in Okavango, Botswana. Phys. Chem. Earth 2020, 124, 102963. [Google Scholar] [CrossRef]
- Basupi, L.V.; Quinn, C.H.; Dougill, A.J. Adaptation strategies to environmental and policy change in semi-arid pastoral landscapes: Evidence from Ngamiland, Botswana. J. Arid. Environ. 2019, 166, 17–27. [Google Scholar] [CrossRef]
- Charis, G.; Danha, G.; Muzenda, E. Waste valorisation opportunities for bush encroacher biomass in savannah ecosystems: A comparative case analysis of Botswana and Namibia. Procedia Manuf. 2019, 35, 974–979. [Google Scholar] [CrossRef]
- Craig, M.H.; Sharp, B.L.; Mabaso, M.L.H.; Kleinschmidt, I. Developing a spatial-statistical model and map of historical malaria prevalence in Botswana using a staged variable selection procedure. Int. J. Health Geogr. 2007, 6. [Google Scholar] [CrossRef]
- Tonnang, H.E.; Tchouassi, D.P.; Juarez, H.S.; Igweta, L.K.; Djouaka, R.F. Zoom in at African country level: Potential climate induced changes in areas of suitability for survival of malaria vectors. Int. J. Health Geogr. 2014, 13. [Google Scholar] [CrossRef]
- Motsholapheko, M.R.; Ngwenya, B.N. Access toWater Resources and Household Vulnerability to Malaria in the Okavango Delta, Botswana. In African Handbook of Climate Change Adaptation; Oguge, N., Ayal, D., Adeleke, L., da Silva, I., Eds.; Springer: Cham, Switzerland, 2021; pp. 1227–1246. [Google Scholar] [CrossRef]
- Charnley, G.E.C.; Kelman, I.; Green, N.; Hinsley, W.; Gaythorpe, K.A.M.; Murray, K.A. Exploring relationships between drought and epidemic cholera in Africa using generalised linear models. BMC Infect. Dis. 2021, 21, 1177. [Google Scholar] [CrossRef]
- Moses, O.; Hambira, W.L. Effects of climate change on evapotranspiration over the Okavango Delta water resources. Phys. Chem. Earth Parts A/B/C 2018, 105, 98–103. [Google Scholar] [CrossRef]
- Milzow, C.; Kgotlhang, L.; Bauer-Gottwein, P.; Meier, P.; Kinzelbach, W. Regional review: The hydrology of the Okavango Delta, Botswana—Processes, data and modelling. Hydrogeol. J. 2009, 17, 1297–1328. [Google Scholar] [CrossRef]
- Wolski, P.; Murray-Hudson, M. Flooding dynamics in a large low-gradient alluvial fan, the Okavango Delta, Botswana, from analysis and interpretation of a 30-year hydrometric record. Hydrol. Earth Syst. Sci. 2005, 2, 1865–1892. [Google Scholar] [CrossRef]
- Belbase, K.; Morgan, R. Food security and nutrition monitoring for drought relief management: The case of Botswana. Food Policy 1994, 19, 285–300. [Google Scholar] [CrossRef]
- Dintwa, K.F.; Letamo, G.; Navaneetham, K. Quantifying social vulnerability to natural hazards in Botswana: An application of cutter model. Int. J. Disaster Risk Reduct. 2019, 37, 101189. [Google Scholar] [CrossRef]
- Byakatonda, J.; Parida, B.P.; Kenabatho, P.K. Relating the dynamics of climatological and hydrological droughts in semiarid Botswana. Phys. Chem. Earth. Parts A/B/C 2018, 105, 12–24. [Google Scholar] [CrossRef]
- Abatzoglou, J.; Dobrowski, S.; Parks, S.; Hegewisch, K.C. TerraClimate, a high-resolution global dataset of monthly climate and climatic water balance from 1958–2015. Sci. Data 2018, 5, 170191. [Google Scholar] [CrossRef]
- Byakatonda, J.; Parida, B.P.; Kenabatho, P.K.; Moalafhi, D.B. Influence of climate variability and length of rainy season on crop yields in semiarid Botswana. Agric. For. Meteorol. 2018, 248, 130–144. [Google Scholar] [CrossRef]
- Byakatonda, J.; Parida, B.P.; Moalafhi, D.B.; Kenabatho, P.K. Analysis of long term drought severity characteristics and trends across semiarid Botswana using two drought indices. Atmos. Res. 2018, 213, 492–508. [Google Scholar] [CrossRef]
- Ujeneza, E.L.; Abiodun, B.J. Drought regimes in Southern Africa and how well GCMs simulate them. Clim. Dyn. 2015, 44, 1595–1609. [Google Scholar] [CrossRef]
- Akinyemi, F.O.; Abiodun, B.J. Potential impacts of global warming levels 1.5 °C and above on climate extremes in Botswana. Clim. Chang. 2019, 154, 387–400. [Google Scholar] [CrossRef]
- Palmer, W. Meteorological Drought; Research Paper no. 45; U.S. Department of Commerce Weather Bureau: Washington, DC, USA, 1965.
- Ermel, H. Der deutsche Beitrag zur Neuherstellung der General Bathymetric Chart of the Oceans (GEBCO). Dtsch. Hydrogr. Z. 1966, 19, 49–57. [Google Scholar] [CrossRef]
- Schenke, H. General Bathymetric Chart of the Oceans (GEBCO). In Encyclopedia of Marine Geosciences; Springer: Dordrecht, The Netherlands, 2016; pp. 268–269. [Google Scholar] [CrossRef]
- Bracke, S.; Sochacki, S.; Radetzky, M. Multivariate Data Analytics in Surface Topography Assessments: Case Study High Precision Fine Grinding Processes. Procedia Manuf. 2019, 39, 1752–1761. [Google Scholar] [CrossRef]
- Smith, W.H.F. On the accuracy of digital bathymetric data. J. Geophys. Res. 1993, 98, 9591–9603. [Google Scholar] [CrossRef]
- Lemenkova, P. Mapping Ghana by GMT and R scripting: Advanced cartographic approaches to visualize correlations between the topography, climate and environmental setting. Adv. Geod. Geoinf. 2022, 71, e16. [Google Scholar] [CrossRef]
- Jakobsson, M.; Macnab, R. A Comparison Between GEBCO Sheet 5.17 and the International Bathymetric Chart of the Arctic Ocean (IBCAO) Version 1.0. Mar. Geophys. Res. 2006, 27, 35–48. [Google Scholar] [CrossRef]
- Lemenkova, P. Topography of the Aleutian Trench south-east off Bowers Ridge, Bering Sea, in the context of the geological development of North Pacific Ocean. Baltica 2021, 34, 27–46. [Google Scholar] [CrossRef]
- Hall, J.K. GEBCO Centennial Special Issue—Charting the Secret World of the Ocean Floor: The GEBCO Project 1903–2003. Mar. Geophys. Res. 2006, 27, 1–5. [Google Scholar] [CrossRef]
- Lemenkova, P. GEBCO Gridded Bathymetric Datasets for Mapping Japan Trench Geomorphology by Means of GMT Scripting Toolset. Geod. Cartogr. 2020, 46, 98–112. [Google Scholar] [CrossRef]
- Marks, K.M.; Smith, W.H.F. An Evaluation of Publicly Available Global Bathymetry Grids. Mar. Geophys. Res. 2006, 27, 19–34. [Google Scholar] [CrossRef]
- Kolawole, O.D.; Wolski, P.; Ngwenya, B.; Mmopelwa, G. Ethno-meteorology and scientific weather forecasting: Small farmers and scientists’ perspectives on climate variability in the Okavango Delta, Botswana. Clim. Risk Manag. 2014, 4–5, 43–58. [Google Scholar] [CrossRef]
- Lemenkova, P. Tanzania Craton, Serengeti Plain and Eastern Rift Valley: Mapping of geospatial data by scripting techniques. Est. J. Earth Sci. 2022, 71, 61–79. [Google Scholar] [CrossRef]
- Ringrose, S.; Chanda, R.; Nkambwe, M.; Sefe, F. Environmental change in the mid-Boteti area of north-central Botswana: Biophysical processes and human perceptions. Environ. Manag. 1996, 20, 397–410. [Google Scholar] [CrossRef]
- Lindh, P.; Lemenkova, P. Evaluation of Different Binder Combinations of Cement, Slag and CKD for S/S Treatment of TBT Contaminated Sediments. Acta Mech. Autom. 2021, 15, 236–248. [Google Scholar] [CrossRef]
- Manisa, M.; Das, R.K.; Segobye, M.; Maphale, L. Developing local geoid model to assess accuracy of orthometric heights from GPS-based ellipsoidal heights in Botswana. Spat. Inf. Res. 2016, 24, 607–616. [Google Scholar] [CrossRef]
- Lemenkova, P. Robust Vegetation Detection Using RGB Colour Composites and Isoclust Classification of the Landsat TM Image. Geomat. Landmanag. Landsc. 2021, 4, 147–167. [Google Scholar] [CrossRef]
- Ringrose, S.; Musisi-Nkambwe, S.; Coleman, T.; Nellis, D.; Bussing, C. Use of Landsat Thematic Mapper Data to Assess Seasonal Rangeland Changes in the Southeast Kalahari, Botswana. Environ. Manag. 1999, 23, 125–138. [Google Scholar] [CrossRef]
- Lemenkova, P. Dataset compilation by GRASS GIS for thematic mapping of Antarctica: Topographic surface, ice thickness, subglacial bed elevation and sediment thickness. Czech Polar Rep. 2021, 11, 67–85. [Google Scholar] [CrossRef]
- Pachka, H.; Annelise, T.; Alan, K.; Tshikae, P.; Kgori, P.; Chevalier, V.; Paweska, J.; Jori, F. Rift Valley fever vector diversity and impact of meteorological and environmental factors on Culex pipiens dynamics in the Okavango Delta, Botswana. Parasites Vectors 2016, 9, 434. [Google Scholar] [CrossRef]
- Pricope, N.G. Variable-source flood pulsing in a semi-arid transboundary watershed: The Chobe River, Botswana and Namibia. Environ. Monit. Assess. 2013, 185, 1883–1906. [Google Scholar] [CrossRef] [PubMed]
- Lemenkova, P. Sentinel-2 for High Resolution Mapping of Slope-Based Vegetation Indices Using Machine Learning by SAGA GIS. Transylv. Rev. Syst. Ecol. Res. 2020, 22, 17–34. [Google Scholar] [CrossRef]
- Virden, W.; Habermann, T.; Glover, G.; Divins, D.; Sharman, G.; Fox, C. Multibeam bathymetric data at NOAA/NGDC. In Proceedings of the Oceans ’04 MTS/IEEE Techno-Ocean ’04 (IEEE Cat. No.04CH37600), Kobe, Japan, 9–12 November 2004; Volume 2, pp. 1159–1162. [Google Scholar] [CrossRef]
- Lemenkova, P. Submarine tectonic geomorphology of the Pliny and Hellenic Trenches reflecting geologic evolution of the southern Greece. Rud.-GeološKo-Naft. Zb. 2021, 36, 33–48. [Google Scholar] [CrossRef]
- Senturk, S.; Cakir, Z.; Berk Ustundag, B. The potential of Sentinel-IA interferometric SAR data in monitoring of surface subsidence caused by overdrafting groundwater in agricultural areas. In Proceedings of the 2016 Fifth International Conference on Agro-Geoinformatics (Agro-Geoinformatics), Tianjin, China, 18–20 July 2016; pp. 1–4. [Google Scholar] [CrossRef]
- Lemenkova, P. Using GMT for 2D and 3D Modeling of the Ryukyu Trench Topography, Pacific Ocean. Misc. Geogr. 2021, 25, 213–225. [Google Scholar] [CrossRef]
- Lindh, P.; Lemenkova, P. Geochemical tests to study the effects of cement ratio on potassium and TBT leaching and the pH of the marine sediments from the Kattegat Strait, Port of Gothenburg, Sweden. Baltica 2022, 35, 47–59. [Google Scholar] [CrossRef]
- Lemenkova, P. Geomorphology of the Puerto Rico Trench and Cayman Trough in the Context of the Geological Evolution of the Caribbean Sea. Ann. Univ. Mariae-Curie-Sklodowska, Sect. B—Geogr. Geol. Mineral. Petrogr. 2020, 75, 115–141. [Google Scholar] [CrossRef]
- Shi, H.; Du, Z.; Lu, Y.; Hu, X.; Ke, X. Amery Ice Shelf Digital Elevation Model from GLAS and GMT. In Proceedings of the 2009 Third International Symposium on Intelligent Information Technology Application, Nanchang, China, 21–22 November 2009; Volume 2, pp. 129–133. [Google Scholar] [CrossRef]
- Lemenkova, P. Mapping submarine geomorphology of the Philippine and Mariana trenches by an automated approach using GMT scripts. Proc. Latvian Acad. Sci. Sect. B 2022, 76, 258–266. [Google Scholar] [CrossRef]
- Totolo, O.; Mosweu, S. Spatial Variability of Selected Soil Properties in Relation to Different Land Uses in Northern Kgalagadi (Matsheng), Botswana. Int. J. Geosci. 2012, 3, 659–663. [Google Scholar] [CrossRef]
- Lindh, P.; Lemenkova, P. Seismic velocity of P-waves to evaluate strength of stabilized soil for Svenska Cellulosa Aktiebolaget Biorefinery Östrand AB, Timrå. Bull. Pol. Acad. Sci. Tech. Sci. 2022, 70, 1–9. [Google Scholar] [CrossRef]
- Mosweu, S.; Munyati, C.; Kabanda, T. Modification of soil properties by Prosopis L. in the Kalahari Desert, South-Western Botswana. Open J. Ecol. 2013, 3, 145–150. [Google Scholar] [CrossRef]
- Lemenkov, V.; Lemenkova, P. Using TeX Markup Language for 3D and 2D Geological Plotting. Found. Comput. Decis. Sci. 2021, 46, 43–69. [Google Scholar] [CrossRef]
- Zeilhofer, P. Soil Mapping in the Pantanal of Mato Grosso, Brazil, using Multitemporal Landsat TM data. Wetl. Ecol. Manag. 2006, 14, 445–461. [Google Scholar] [CrossRef]
- McGill, B.M.; Altchenko, Y.; Hamilton, S.K.; Kenabatho, P.K.; Sylvester, S.R.; Villholth, K.G. Complex interactions between climate change, sanitation, and groundwater quality: A case study from Ramotswa, Botswana. Hydrogeol. J. 2019, 27, 997–1015. [Google Scholar] [CrossRef]
- Maoyi, M.L.; Abiodun, B.J. How well does MPAS-atmosphere simulate the characteristics of the Botswana High? Clim. Dyn. 2021, 57, 2109–2128. [Google Scholar] [CrossRef]
- Ramberg, L.; Hancock, P.; Lindholm, M.; Meyer, T.; Ringrose, S.; Sliva, J.; Van As, J.; Vander Post, C. Species diversity of the Okavango Delta, Botswana. Aquat. Sci. 2006, 68, 310–337. [Google Scholar] [CrossRef]
- Asefa, S. Enhancing food access in Africa: The Botswana experience. Stud. Comp. Int. Dev. 1991, 26, 59–83. [Google Scholar] [CrossRef]
- Vanderpost, C. Population change and environmental problems in the Mid-Boteti region of Botswana. GeoJournal 1995, 35, 521–529. [Google Scholar] [CrossRef]
- Rahm, D.; Swatuk, L.; Matheny, E. Water Resource Management in Botswana: Balancing Sustainability and Economic Development. Environ. Dev. Sustain. 2006, 8, 157–183. [Google Scholar] [CrossRef]
- Mogomotsi, P.K.; Sekelemani, A.; Mogomotsi, G.E.J. Climate change adaptation strategies of small-scale farmers in Ngamiland East, Botswana. Clim. Chang. 2020, 159, 441–460. [Google Scholar] [CrossRef]
- Moreri, K.K.; Maphale, L.; Nkhwanana, N. Optimizing dispatch and home delivery services utilizing GIS in Botswana: Botswana Post case study. Spat. Inf. Res. 2017, 25, 565–573. [Google Scholar] [CrossRef]
- Mpofu, G.; Darkoh, M.K.; Gwebu, T. Peri-urbanization landuse dynamics: An analysis of evolving patterns and their impacts on Gabane Village, Botswana. GeoJournal 2018, 83, 725–741. [Google Scholar] [CrossRef]
- Lemenkova, P. Console-Based Mapping of Mongolia Using GMT Cartographic Scripting Toolset for Processing TerraClimate Data. Geosciences 2022, 12, 140. [Google Scholar] [CrossRef]
- Ramberg, L.; Wolski, P.; Krah, M. Water balance and infiltration in a seasonal floodplain in the Okavango Delta, Botswana. Wetlands 2006, 26, 677–690. [Google Scholar] [CrossRef]
- Lancaster, N. Response of Aeolian Processes and Landforms to Climate Change and Variability. In Treatise on Geomorphology, 2nd ed.; Shroder, J.J.F., Ed.; Academic Press: Oxford, UK, 2022; pp. 318–339. [Google Scholar] [CrossRef]
- Radulović, M.; Brdar, S.; Mesaroš, M.; Lukić, T.; Savić, S.; Basarin, B.; Crnojević, V.; Pavić, D. Assessment of Groundwater Potential Zones Using GIS and Fuzzy AHP Techniques—A Case Study of the Titel Municipality (Northern Serbia). ISPRS Int. J. Geo-Inf. 2022, 11, 257. [Google Scholar] [CrossRef]
- Lemenkova, P. Geophysical Mapping of Ghana Using Advanced Cartographic Tool GMT. Kartogr. Geoinf. 2021, 20, 16–37. [Google Scholar] [CrossRef]
- Karydas, C.; Jiang, B. Scale Optimization in Topographic and Hydrographic Feature Mapping Using Fractal Analysis. ISPRS Int. J. Geo-Inf. 2020, 9, 631. [Google Scholar] [CrossRef]
- Akinyemi, F.O.; Kgomo, M.O. Vegetation dynamics in African drylands: An assessment based on the Vegetation Degradation Index in an agro-pastoral region of Botswana. Reg. Environ. Chang. 2019, 19, 2027–2039. [Google Scholar] [CrossRef]
- Ishimoto, Y.; Yabuta, S.; Kgokong, S.; Motsepe, M.; Tominaga, J.; Teramoto, S.; Konaka, T.; Mmopelwa, G.; Kawamitsu, Y.; Akashi, K.; et al. Environmental evaluation with greenhouse gas emissions and absorption based on life cycle assessment for a Jatropha cultivation system in frost- and drought-prone regions of Botswana. Biomass Bioenergy 2018, 110, 33–40. [Google Scholar] [CrossRef]
- Klaučo, M.; Gregorová, B.; Stankov, U.; Marković, V.; Lemenkova, P. Determination of ecological significance based on geostatistical assessment: A case study from the Slovak Natura 2000 protected area. Open Geosci. 2013, 5, 28–42. [Google Scholar] [CrossRef]
- Eze, P.N.; Madani, N.; Adoko, A.C. Multivariate Mapping of Heavy Metals Spatial Contamination in a Cu–Ni Exploration Field (Botswana) Using Turning Bands Co-simulation Algorithm. Nat. Resour. Res. 2019, 28, 109–124. [Google Scholar] [CrossRef]
- Lemenkova, P. Handling Dataset with Geophysical and Geological Variables on the Bolivian Andes by the GMT Scripts. Data 2022, 7, 74. [Google Scholar] [CrossRef]
- Chipanshi, A.C.; Chanda, R.; Totolo, O. Vulnerability Assessment of the Maize and Sorghum Crops to Climate Change in Botswana. Clim. Chang. 2003, 61, 339–360. [Google Scholar] [CrossRef]
- Klaučo, M.; Gregorová, B.; Koleda, P.; Stankov, U.; Marković, V.; Lemenkova, P. Land planning as a support for sustainable development based on tourism: A case study of Slovak Rural Region. Environ. Eng. Manag. J. 2017, 16, 449–458. [Google Scholar] [CrossRef]
- Maruatona, P.B.; Moses, O. Assessment of the onset, cessation, and duration of rainfall season over Botswana. Model. Earth Syst. Environ. 2022, 8, 1657–1668. [Google Scholar] [CrossRef]
- Parida, B.; Moalafhi, D. Regional rainfall frequency analysis for Botswana using L-Moments and radial basis function network. Phys. Chem. Earth Parts A/B/C 2008, 33, 614–620. [Google Scholar] [CrossRef]
- Moses, O.; Ramotonto, S. Assessing forecasting models on prediction of the tropical cyclone Dineo and the associated rainfall over Botswana. Weather. Clim. Extrem. 2018, 21, 102–109. [Google Scholar] [CrossRef]
- Dahlberg, A.C. Vegetation diversity and change in relation to land use, soil and rainfall—A case study from North-East District, Botswana. J. Arid. Environ. 2000, 44, 19–40. [Google Scholar] [CrossRef]


Publisher’s Note: MDPI stays neutral with regard to jurisdictional claims in published maps and institutional affiliations. |
© 2022 by the author. Licensee MDPI, Basel, Switzerland. This article is an open access article distributed under the terms and conditions of the Creative Commons Attribution (CC BY) license (https://creativecommons.org/licenses/by/4.0/).
Share and Cite
Lemenkova, P. Mapping Climate Parameters over the Territory of Botswana Using GMT and Gridded Surface Data from TerraClimate. ISPRS Int. J. Geo-Inf. 2022, 11, 473. https://doi.org/10.3390/ijgi11090473
Lemenkova P. Mapping Climate Parameters over the Territory of Botswana Using GMT and Gridded Surface Data from TerraClimate. ISPRS International Journal of Geo-Information. 2022; 11(9):473. https://doi.org/10.3390/ijgi11090473
Chicago/Turabian StyleLemenkova, Polina. 2022. "Mapping Climate Parameters over the Territory of Botswana Using GMT and Gridded Surface Data from TerraClimate" ISPRS International Journal of Geo-Information 11, no. 9: 473. https://doi.org/10.3390/ijgi11090473
APA StyleLemenkova, P. (2022). Mapping Climate Parameters over the Territory of Botswana Using GMT and Gridded Surface Data from TerraClimate. ISPRS International Journal of Geo-Information, 11(9), 473. https://doi.org/10.3390/ijgi11090473