Article

Improving the Spatial Accessibility of Community-Level Healthcare Service toward the ‘15-Minute City’ Goal in China

1
Laboratory of Geospatial Technology for the Middle and Lower Yellow River Regions, Ministry of Education, Henan University, Kaifeng 475004, China
2
College of Geography and Environmental Science, Henan University, Kaifeng 475004, China
*
Author to whom correspondence should be addressed.
ISPRS Int. J. Geo-Inf. 2022, 11(8), 436; https://doi.org/10.3390/ijgi11080436
Submission received: 27 May 2022 / Revised: 18 July 2022 / Accepted: 30 July 2022 / Published: 1 August 2022

Abstract

:
Background: The recent global COVID-19 pandemic serves as another reminder that people in different urban neighborhoods need equal access to basic medical services. This study aims to improve the spatial accessibility of healthcare services toward the ‘15-minute city’ goal. Methods: We chose Zhengzhou, China, as a case study. To improve spatial accessibility, two optimization models of optimal supply-demand allocation (OSD) and the capacitated p-medina problem (CPMP) were used. Spatial accessibility in this study is defined as the walking time from the communities to healthcare centers. Results: For the current status of healthcare services at the community level, the mean travel time is 18.3 min, and 39.6% of residents can access healthcare services within a 15-minute travel time. Population coverage within a 15-minute walking time is significantly lower than the national target of 80%. After redefining the service areas through OSD allocation, the mean travel time was reduced to 16.5 min, and 45.1% of the population could reach services. Furthermore, the 60 newly proposed healthcare centers selected by the CPMP model could potentially increase by 35.0% additional population coverage. The average travel time was reduced to 10 min. Conclusions: Both the redefinition of the service areas and the opening of new service centers are effective ways to improve the spatial accessibility of healthcare services. Two methods of this study have implications for urban planning practices towards the 15-minute city.

1. Introduction

The socioeconomic impacts on cities during the COVID-19 pandemic have been brutal, leading to increased inequalities for urban dwellers, and the current energy crisis is exacerbating inequality [1,2,3]. How to build safer, more resilient, sustainable, and inclusive cities, as depicted in the United Nations Sustainable Development Goal 11, has attracted global attention [4,5]. Therefore, the concept of the ‘15-minute city’, initially proposed by Carlos Moreno in 2016, is once again being addressed by popular media, governments, and researchers during the COVID-19 pandemic [6,7,8,9,10]. In February 2016, the Chinese government first proposed to “create a convenient and fast life circle”. In 2018, the Ministry of Housing and Urban-Rural Development in China adopted the “15-minute living circle” as the new standard for urban residential district planning and design [11]. Several cities in China (e.g., Shanghai, Wuhan, and Beijing) have implemented strategies and action plans for the “15-minute community living circle”. Thus, in the post-pandemic era, the construction of the “15-minute city” and the reasonable layout of public service facilities not only affect the quality of life of urban dwellers but also promote the construction of safer, more resilient, and more sustainable cities [8,9,12,13].
Community-level healthcare service facilities, as essential public service facilities in urban areas, are key to building “15-minute cities”. In 2015, the Chinese government established the Hierarchical Diagnosis and Treatment System (HDTS). This medical system is divided into three tiers, including primary medical institution, secondary hospital, and tertiary hospital. The primary medical institution refers to a community-level healthcare center that offers basic medical services, such as disease prevention, ailment treatment, family therapy, and health education. The secondary and tertiary hospitals are regional hospitals that provide comprehensive and complicated medical services. The primary medical is a key step to accelerating the implementation of HDTS. Community-level health service centers are an important part of HDTS in China. During a COVID-19 outbreak, community-level health centers are considered vaccination centers. However, due to the unreasonable layout of community-level healthcare centers and low utilization efficiency, the problem of “difficult to see a doctor” is pronounced in urban areas. In 2005, the Chinese government set the goal of “equalization of basic public services”, and the World Bank’s 2009 Development Report advocated “balanced coverage of people’s access to public services” [14]. During the 14th Five-Year Plan period, the Chinese government emphasized that basic public services would be more equal. Therefore, how to plan a community-level healthcare service within the ‘15-minute city’ by adopting spatial analysis techniques is a key point that affects the quality of life of residents and sustainable urban development.
Currently, research on community-level healthcare services mainly focuses on three aspects: service efficiency evaluation [15,16,17], resource allocation [18,19], and location selection [20,21,22]. Facility location selection plays a key role in strategic system design in a wide range of public and private services [23]. Three classic facility location problems include the p-median problem (PMP) [24], the location set covering problem (LSCP) [25], and the maximum covering location problem (MCLP) [26]. PMP aims to determine the locations of p facilities among n candidate locations with the minimum total weighted distance between all demands and their facilities. It was widely used in the planning of health facilities [27,28,29,30]. However, traditional PMP does not consider facility capacity. The capacitated p-median problem (CPMP) is preferred over the traditional PMP to ensure the capacity constraints of the available facilities [31].
Accessibility theory is widely used in research on equity and spatial layout of public services [32,33,34,35]. In general, spatial accessibility is described as “the complexity of getting from a place to a destination based on certain kinds of transportation” [36] or “the potential of opportunities for interaction” [37,38]. Measuring spatial accessibility is crucial for assessing inequities in access to healthcare services, identifying areas with insufficient medical services, and developing effective intervention strategies. Common spatial accessibility methods include ratio method [39], minimum distance model [40], Geographic Information System (GIS)-based spatial analysis [33,34], gravity model [41,42], and two-step floating catchment area method (2SFCA) [43,44,45]. The ratio method assumes that healthcare services serve only people within pre-defined area units, such as census tracts or health districts [39,46], without considering the outside scenario. The minimum distance model assumes that people are more likely to choose the nearest public health service [40]. Travel time or costs from population centers to health services are considered indicators of accessibility. Some accessibility indicators consider the relationship between supply (service) and demand, such as gravity models [41,42], kernel density models [47,48], and the 2SFCA method [43,44,45,49,50,51]. The 2SFCA method, which is considered one of the most popular approaches for measuring the spatial accessibility of public services, is widely applied in the research of equity and spatial layout of medical facilities [33,52,53], public green spaces [54,55,56], educational facilities [57], and transportation facilities [58]. However, despite its relative popularity, some limitations have been identified. First, it is a dichotomous measure, so demand points outside of the catchment are assumed to have no access [43]. Second, it lacks universally recognized classification standards, making it difficult to verify accessibility results [59]. Compared to other accessibility models, the optimal supply and demand (OSD) allocation model can overcome these limitations, which can be used for the supply–demand relationship under the constraint of minimizing user-to-facility allocation time/distance cost [60]. It accurately reflects residents’ access to public services facilities and resources within a certain time/distance cost. However, there are still two shortcomings in the current research. First, the accessibility of healthcare services (e.g., general hospital, specialized hospital) was analyzed, but research on community-level healthcare services is rare. Second, how to assess and improve the spatial accessibility of community-level healthcare services toward the ‘15-minute city’ goal is still lacking a systematic approach.
To fill the aforementioned research gap and better inform urban planners and policymakers to improve the spatial accessibility of community-level healthcare services, this study aims to provide a framework for improving urban public services by coupling new accessibility assessment methods and a location-allocation model according to the ‘15-minute city’ goal in China. This will enable an effective assessment of the accessibility of urban public service and improve its accessibility. This study selected Zhengzhou, China, as a case study. First, we identify areas with insufficient community-level healthcare services using an optimal supply and demand (OSD) allocation model. Second, we use the CPMP model to select the best locations for a new healthcare service center and further improve spatial accessibility toward the ‘15-minute city’ goal. Accessibility improvement methods and research results may have important implications for urban planning practices for building 15-minute cities.

2. Materials and Methods
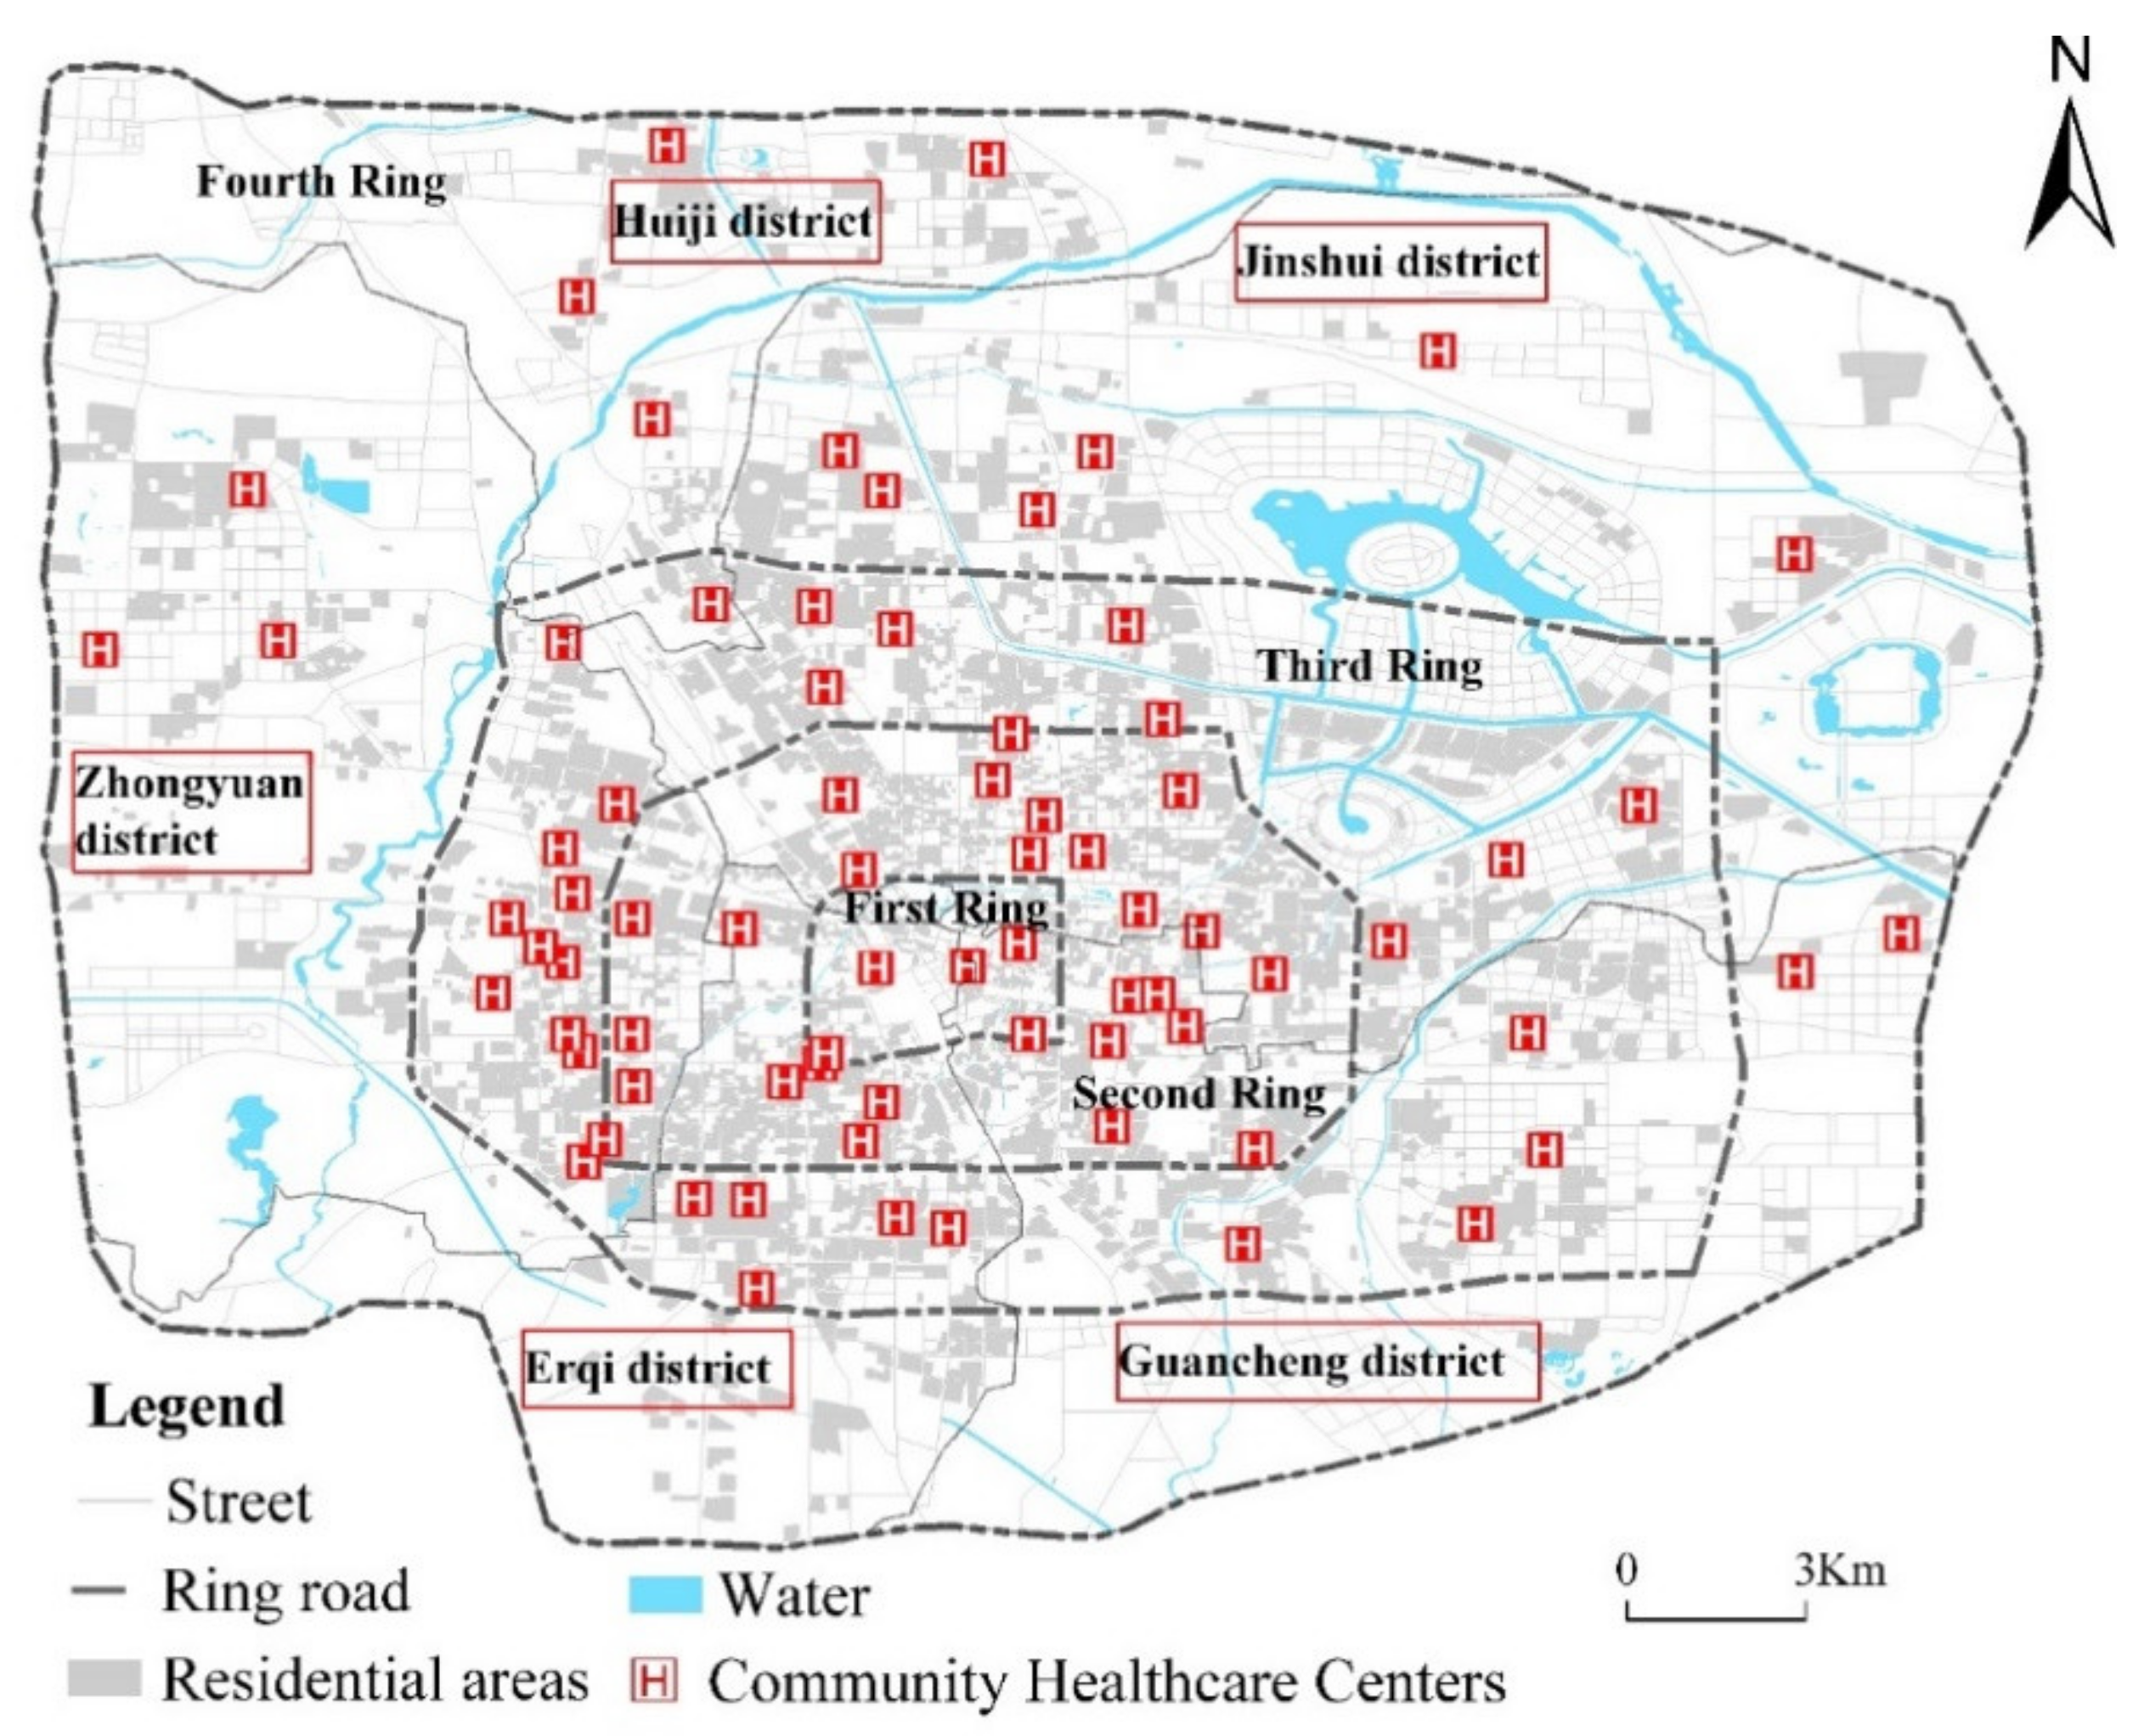
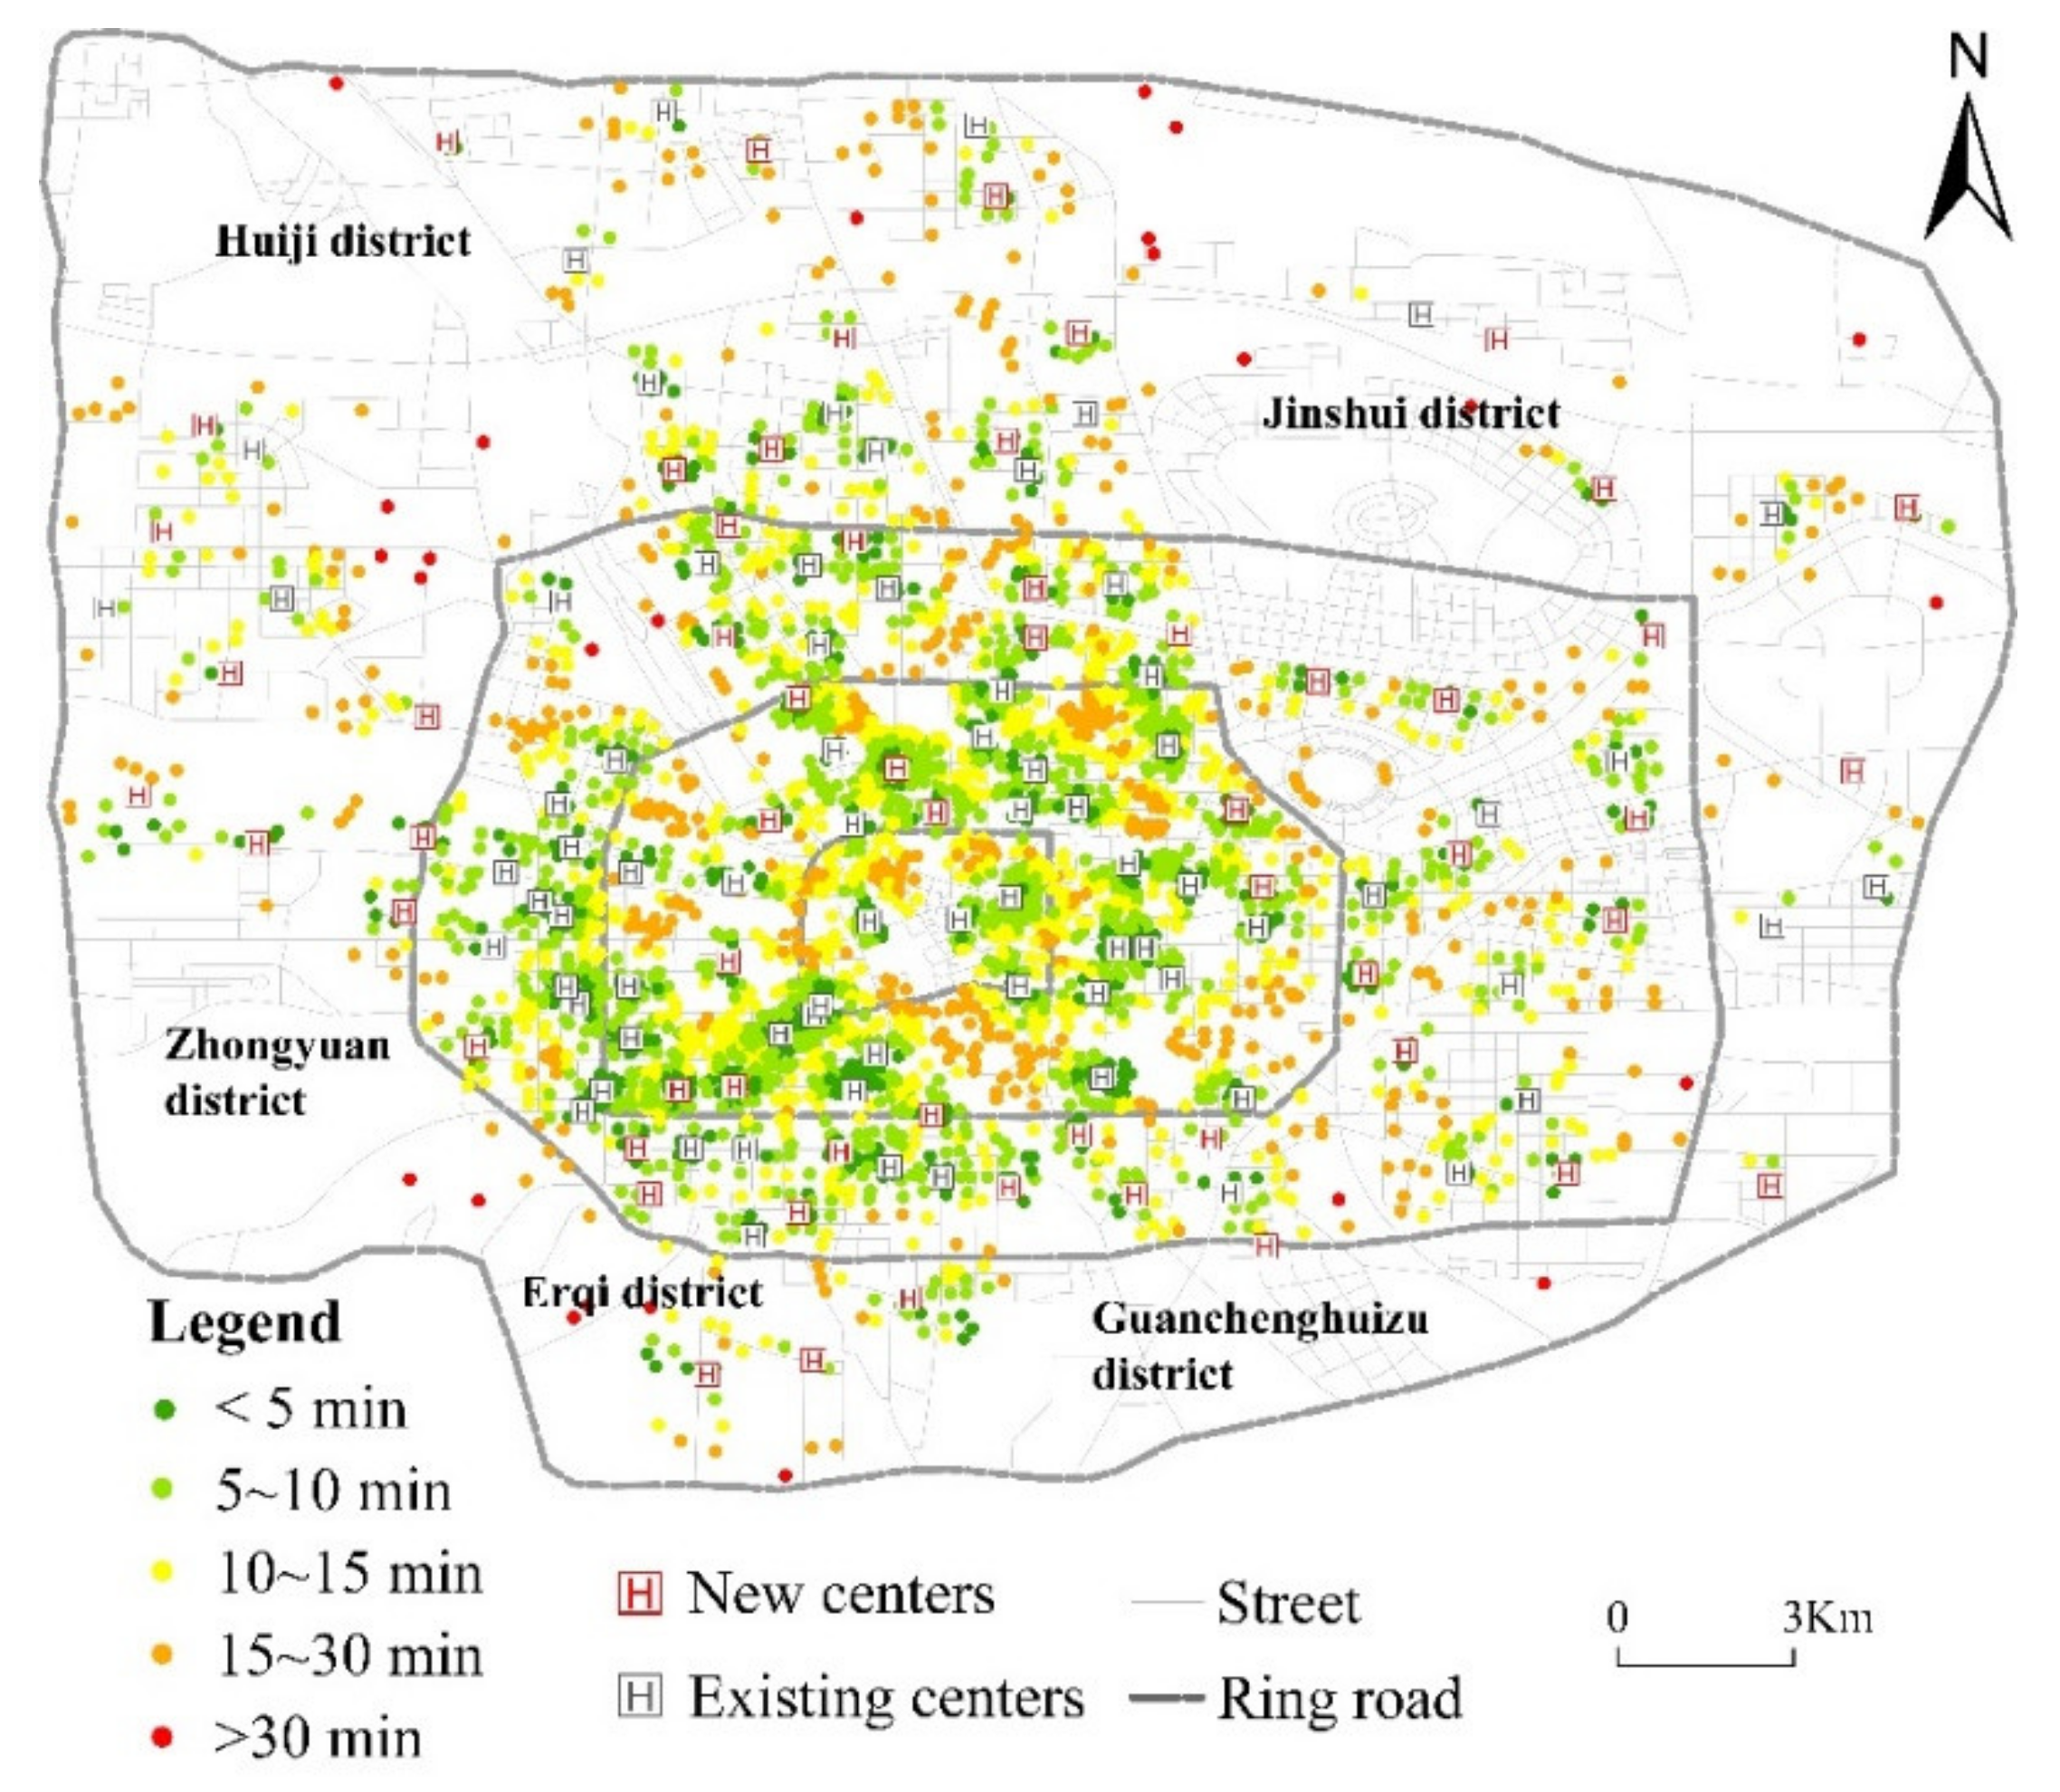
2.1. Study Area

Zhengzhou is located between 112°42′–114°14′ E and 34°16′–34°58′ latitude and is the capital of Henan Province, China. It is also the core city of the Central Plains city cluster in China. As urbanization developed rapidly in recent decades, Zhengzhou’s urban area and population expanded rapidly. By the end of 2019, Zhengzhou’s built-up area reached 580.8 million square kilometers, with a total population of approximately 5.379 million. From the perspective of the expansion mode, Zhengzhou forms a concentric ring-shaped urban structure (first–fourth rings), with residents gradually migrating from the core area to the periphery. The first ring road is the earliest one in Zhengzhou, with the smallest area and population. As one of the most prosperous areas in Zhengzhou, it is mainly composed of the Erqi Business district and railway station business district and provides a commercial service. The second and third ring roads are mostly enclosed by high-rise and multistory buildings, with a relatively high urban function and building density and the highest population density in the area. The area within the fourth ring road is a rural–urban fringe area, which belongs to the suburban part of the city. It is mainly occupied by industrial construction land, the residential area is relatively scattered, and the population distribution is relatively sparse. In the current study, the selected study area was the area within the fourth ring road in Zhengzhou, where the registered population and community healthcare centers are mainly distributed (Figure 1).

2.2. Data Sources

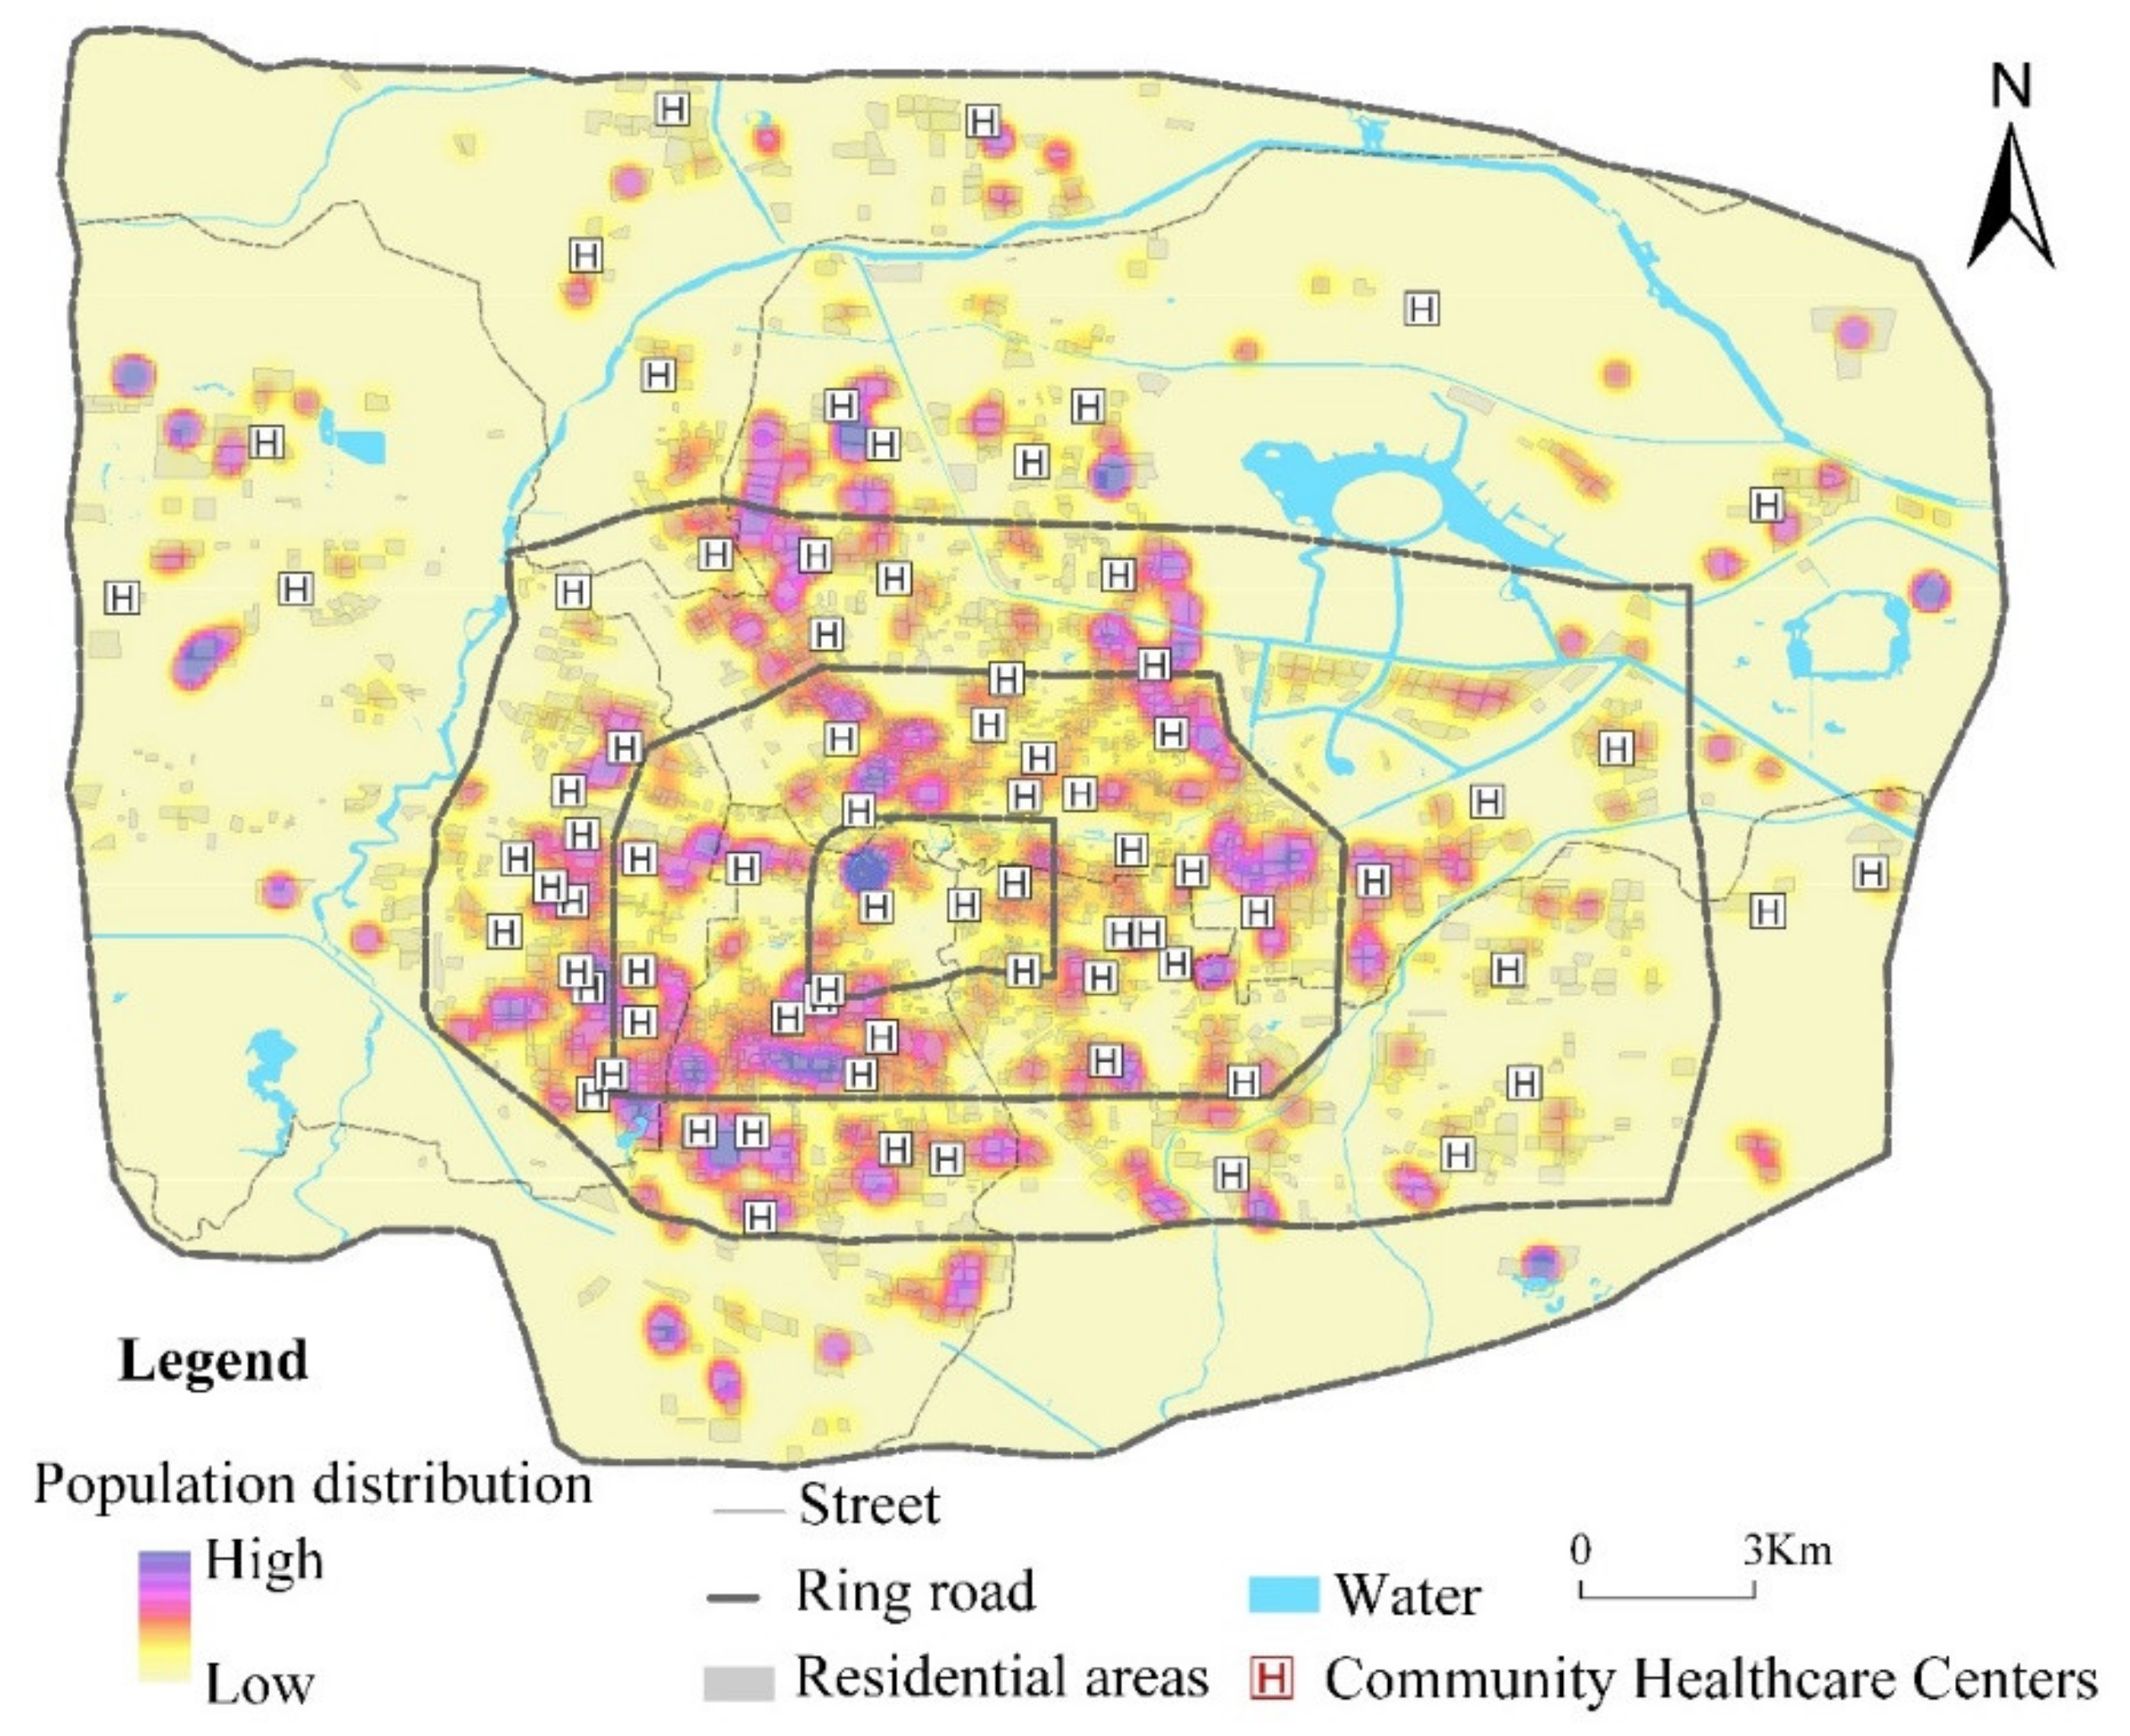
2.2.1. Residential Population

An accurate assessment of the spatial distribution of the population has a direct impact on the demand for healthcare services. It is also key to assessing and improving spatial accessibility. We took communities as demand points and represented the locations of communities with their centroids. According to [61], data on the spatial distribution of residential buildings were used to estimate the community population (Figure 2). The building outline data, including the building area and floors, were obtained from the GeoHey big data platform (https://geohey.com (accessed on 15 July 2021)). The per capita living areas were 27.6 m2, 30.8 m2, 32.9 m2, 30.6 m2, and 29.5 m2 for Zhongyuan, Erqi, Guanchenghuizu, Jinshui, and Huiji districts, respectively, based on the 2020 Zhengzhou Statistical Yearbook [62]. We collected a list of names and address information of 3321 communities from the Google Earth platform. The population was estimated according to Formula (1):
P = A f r
where P is the population of the residential community, A is the building area of the residential community, f is the number of floors of the building, and r is the building area per capita. The population of the 3321 communities in the study area is estimated at 4.84 million.

2.2.2. Community-Level Healthcare Service Centers

The Chinese government has established a Hierarchical Diagnosis and Treatment System (HDTS). This medical system is classified into 3 tiers, including primary medical institution, secondary hospital, and tertiary hospital. The first-level hospitals (primary hospitals) are primary healthcare institutions that directly provide the community with comprehensive services such as medical treatment, prevention, rehabilitation, and healthcare. The second-level hospitals (secondary hospitals) provide health services regionally in several communities and serve as technical centers for regional medical prevention. The third-level hospitals (tertiary hospitals) provide medical and health services throughout regions, provinces, cities, and the entire country. They also act as medical and preventive technology centers with comprehensive medical, teaching, and scientific research facilities. There are 75 community-level healthcare service centers in this study. They are responsible for basic public health services for urban residents, primary diagnosis, treatment and rehabilitation services, and form mechanisms for division of labor and cooperation with urban hospitals [63]. We collected a list of names and address information of 75 healthcare service centers from the Zhengzhou Health Committee (http://wjw.zhengzhou.gov.cn (accessed on 20 July 2021)). We then geocoded each healthcare service center using Amap (https://lbs.amap.com (accessed on 20 July 2021)). Descriptive statistics of community-level healthcare service centers are presented in Table 1.

2.2.3. Travel Time

We collected road network data from OpenStreetMap (https://www.openstreetmap.org (accessed on 15 July 2021)). ArcGIS 10.2 was adopted to create a network dataset using travel time as the network impedance. Based on the concept of a 15-minute community life circle, we considered travel time in walking mode only. The origin-destination (OD) matrix is constructed using the shortest network distance from the demand point to the supply point through the network analysis module. The walking time was calculated according to the road length, and the walking speed was set to 72 m/min.

2.3. Methods

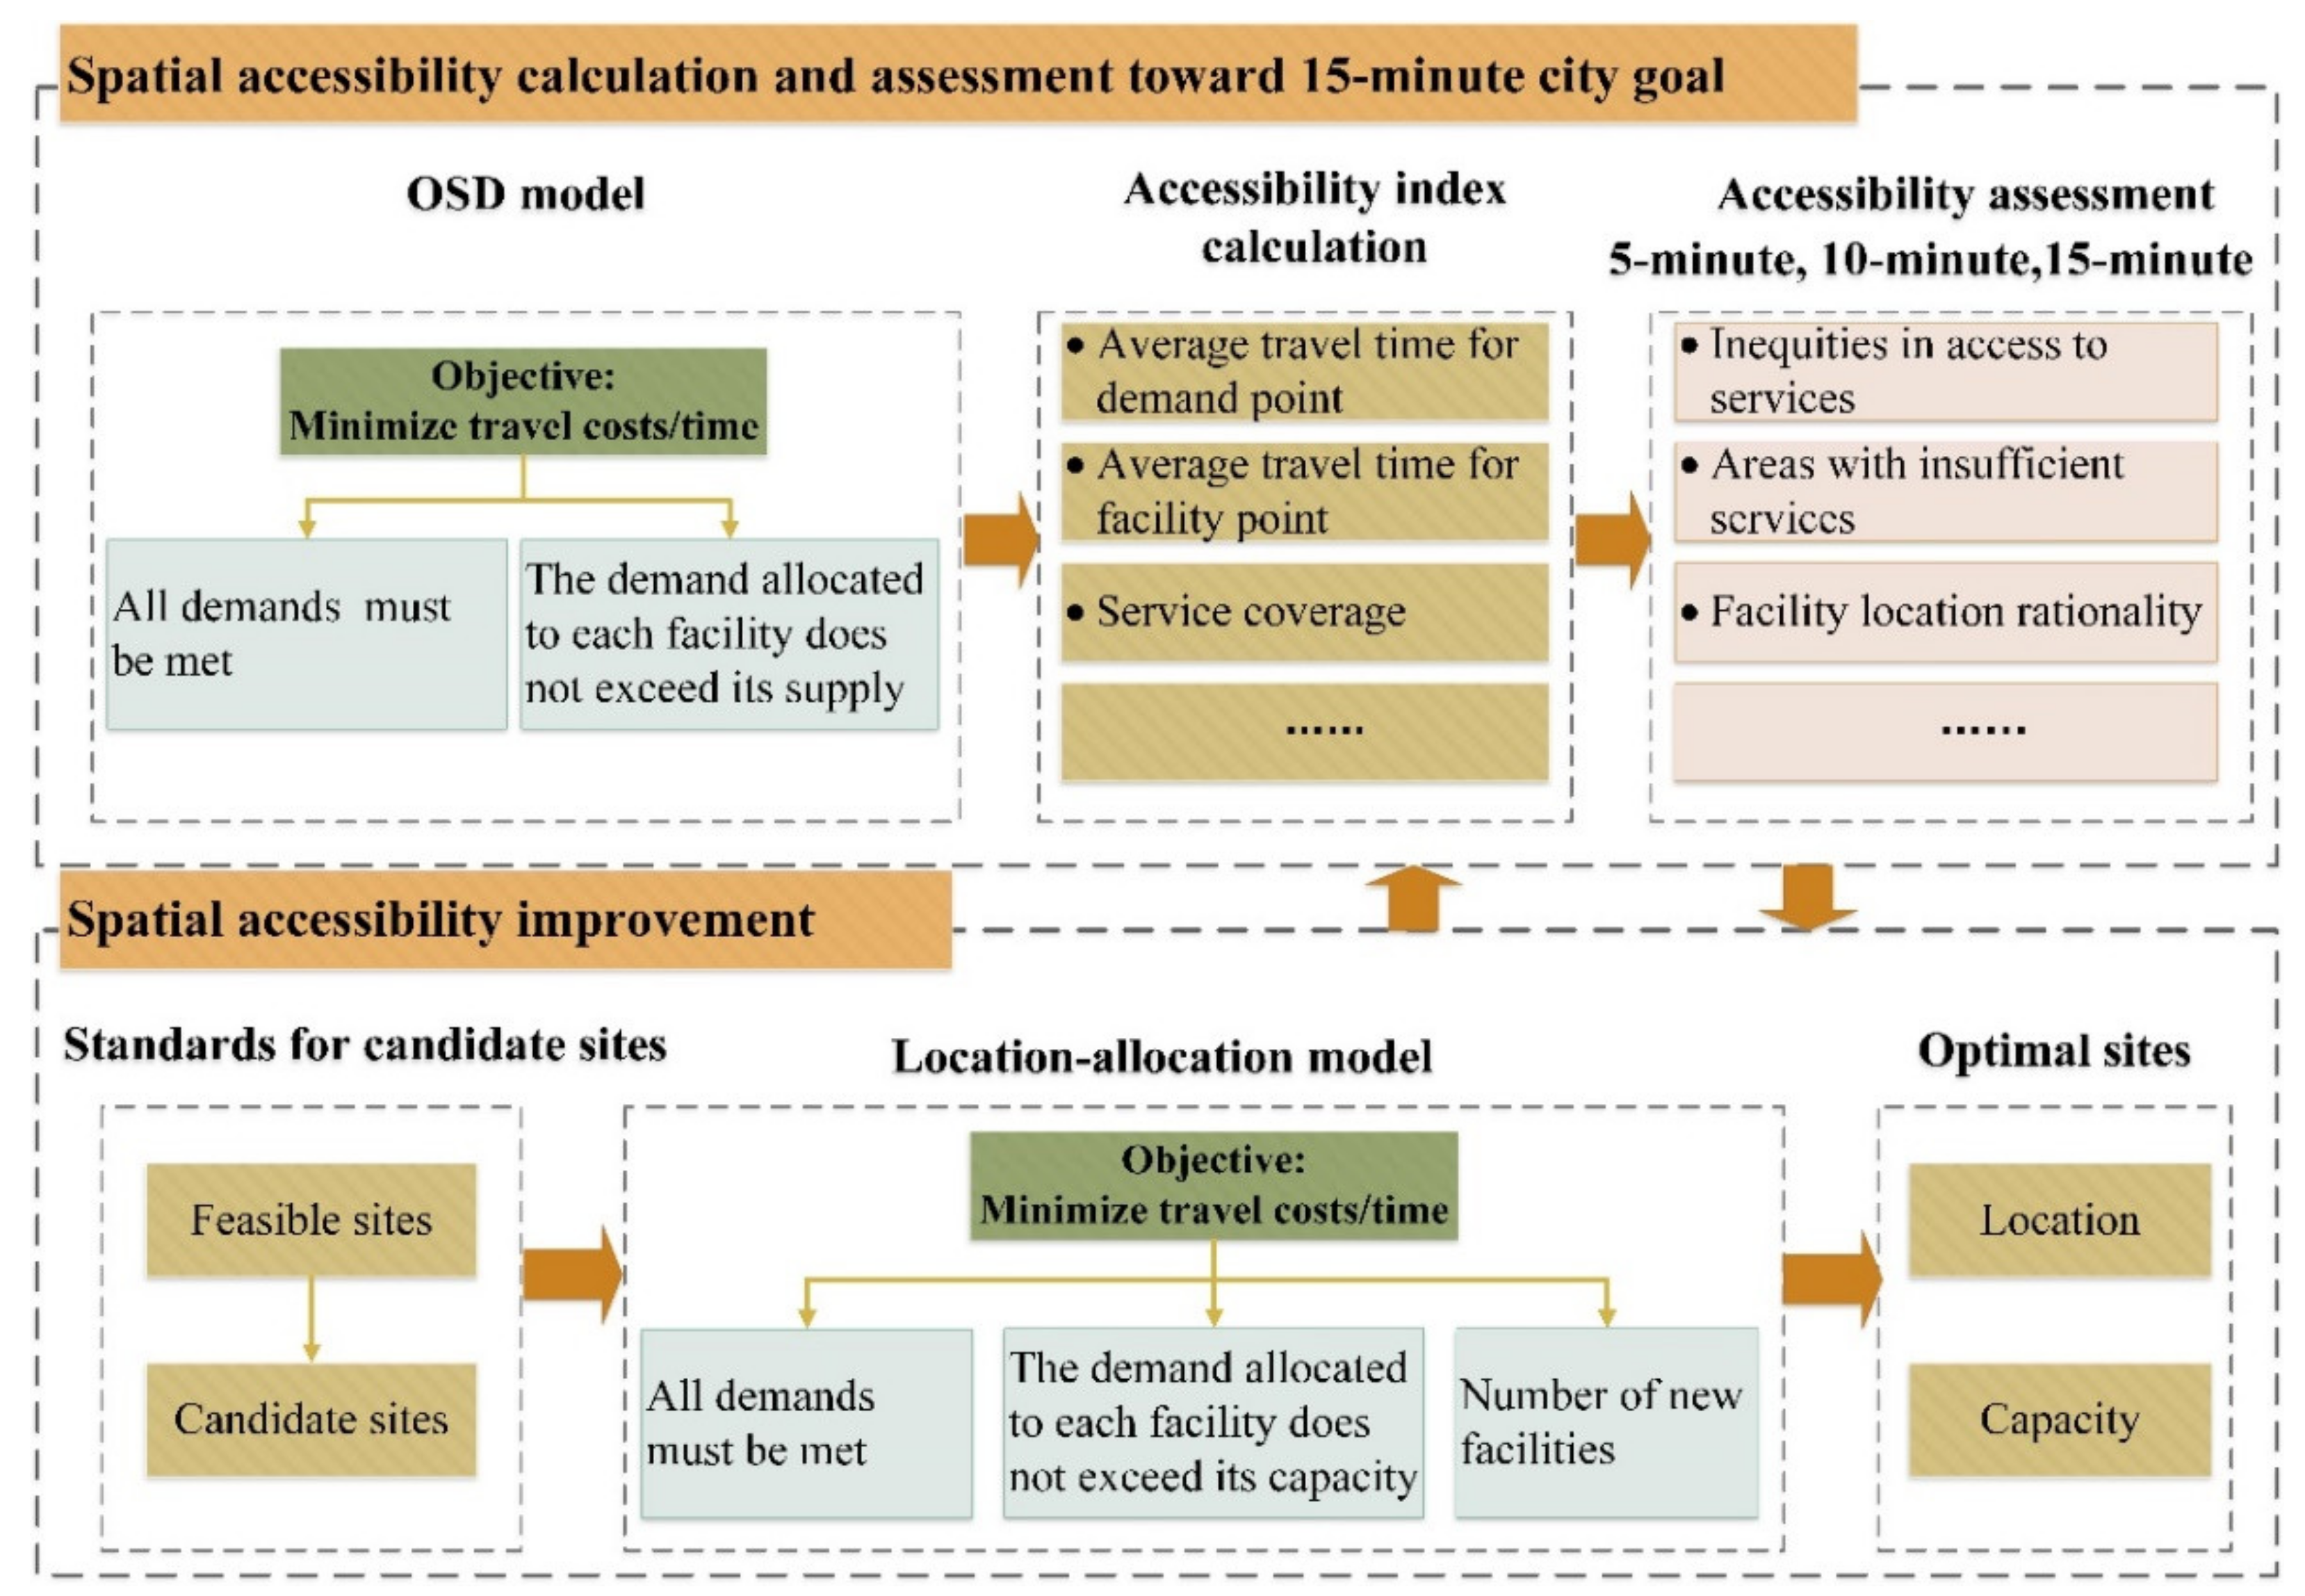
2.3.1. Analytical Framework

A spatial accessibility assessment and improvement framework for community-level healthcare services that links OSD’s accessibility assessment methods and the location-allocation model toward the “15-minute city” goal is developed and presented in Figure 3. First, we readjust the matching relationship between the community-level healthcare service center (supply) and neighborhood (demand) using the OSD model under the constraint of minimizing the users-to-facilities allocation time/distance cost. Second, an accessibility index can be calculated, such as average travel time for each demand point, average travel time for facility point, service coverage, etc. Third, we could assess inequities among neighborhoods in access to healthcare services and identify areas with insufficient healthcare services. Fourth, a location-allocation model is applied to determine the number of new facilities to be opened in order to meet the “15-minute city” goal and improve the accessibility of public service facilities. Finally, the OSD model is used to re-evaluate facility accessibility after improvements.

2.3.2. Optimal Supply–Demand Allocation

The matching relationship between supply and demand is crucial for measuring the accessibility of healthcare services. The OSD allocation is an effective method to readjust the supply-demand relationship under the constraint of minimizing the users-to-facilities allocation time/distance cost [60]. The OSD model assumes that each demand point always tries to access the nearest services. When the supply quantity of its nearest facility exceeds the supply capacity, the demand point will request service from the next nearest facility. It is then easy to summarize accessibility indicators, such as average travel time at each demand point and service coverage within a 5-, 10-, or 15-min walking radius. According to Zhai et al. [60], this study adopted the OSD allocation method to calculate and assess the spatial accessibility of healthcare services at the community level.
Let set I = {1, 2…, m} as the demand points, and d i as the demand at point i. Let set J = {1, 2…, n} as the supply points, and q j as the capacity at facility j. c i j represents the distance between demand point i and facility j. In addition, we define decision variables x i j , which express the number of services provided by facility j at demand point i. Specifically, the OSD allocation model can be written as:
Minimize:
i I j J c i j x i j
Subject to:
j J x i j = d i ,       i I
i I x i j q j ,   j J
x i j = 0 , 1 , 2 ,   i I ,   j J
Formula (2) is the objective function and represents the minimized travel costs. Formula (3) guarantees that, for any demand point, the demand for access to all supply points is equal to the total demand at that point. Formula (4) ensures that the number of services assigned to each facility does not exceed its supply.

2.3.3. Capacitated p-Median Problem (CPMP) Model

Two main decisions need to be made for location-allocation analysis, namely demands for services and locations of candidate sites for new facilities. In this study, we used the CPMP model to determine the best locations for new healthcare service centers. According to the site selection standards for healthcare service centers (http://public.zhengzhou.gov.cn/D480401X/300673.jhtml (accessed on 20 July 2021)), 318 candidate sites were selected for the entire city. Ideally, candidate sites for new healthcare service centers would be close to a major road, with convenient transportation and thus able to provide efficient services; the building area is not less than 1000 square meters; the parking area is within 100 m; it is not located within 500 m of the existing healthcare center; and the service capacity for each candidate point is set to 100,000. For the specific selection process for determining candidate sites, see Supplementary Materials.
Let J * be the set of candidate locations, and q j is the maximum capacity of the facility at location j. c i j represents the distance between demand point i and facility j. The CPMP has been reformulated to select locations for the opening of new healthcare service centers. The decision variable y j determines whether location j is selected to set a new facility. The decision variable x i j represent the number of services provided by facility j at demand point i. P is the number of new facilities to be set. Specifically, the CPMP model with capacity constraints can be written as follows:
Minimize:
i I j J J * c i j x i j
Subject to:
j J J * x i j = d i ,       i I
i I x i j q j ,   j J
i I x i j q j y j ,   j J *
j J y j = P ,   j J *
x i j = 0 , 1 , 2 ,   i I ,   j J
y j 0 , 1 , j J *
The objective function (6) maximizes the accessibility of healthcare services by minimizing the total travel time. Constraint (7) ensure that all demands must be satisfied. Constraint (8) guarantee that the total demand assigned to each existing healthcare service center must not exceed its capacity. In constraint (9), if location j is not selected ( y j = 0 ), no demand will be assigned to the facility at location j ( x i j = 0); otherwise, the total demand assigned to the new service center does not exceed its capacity. Constraint (10) restricts the number of new facilities. Constraints (11) and (12) define the decision variables.
The proposed model can be efficiently solved by Gurobi Optimizer 9.x (https://gurobi.com (accessed on 25 July 2021)) on a desktop computer with Intel Core (TM) i5-6300HQ [email protected] GHz and 8 GB RAM.

2.3.4. Patients and Public Involvement

This research was conducted without patient or public involvement. The analysis is based on community-level healthcare service statistics and publicly available geospatial data collected through the-‘Key Scientific Research Projects of Colleges and Universities in Henan Province Project’ supported by Henan Province.

3. Results

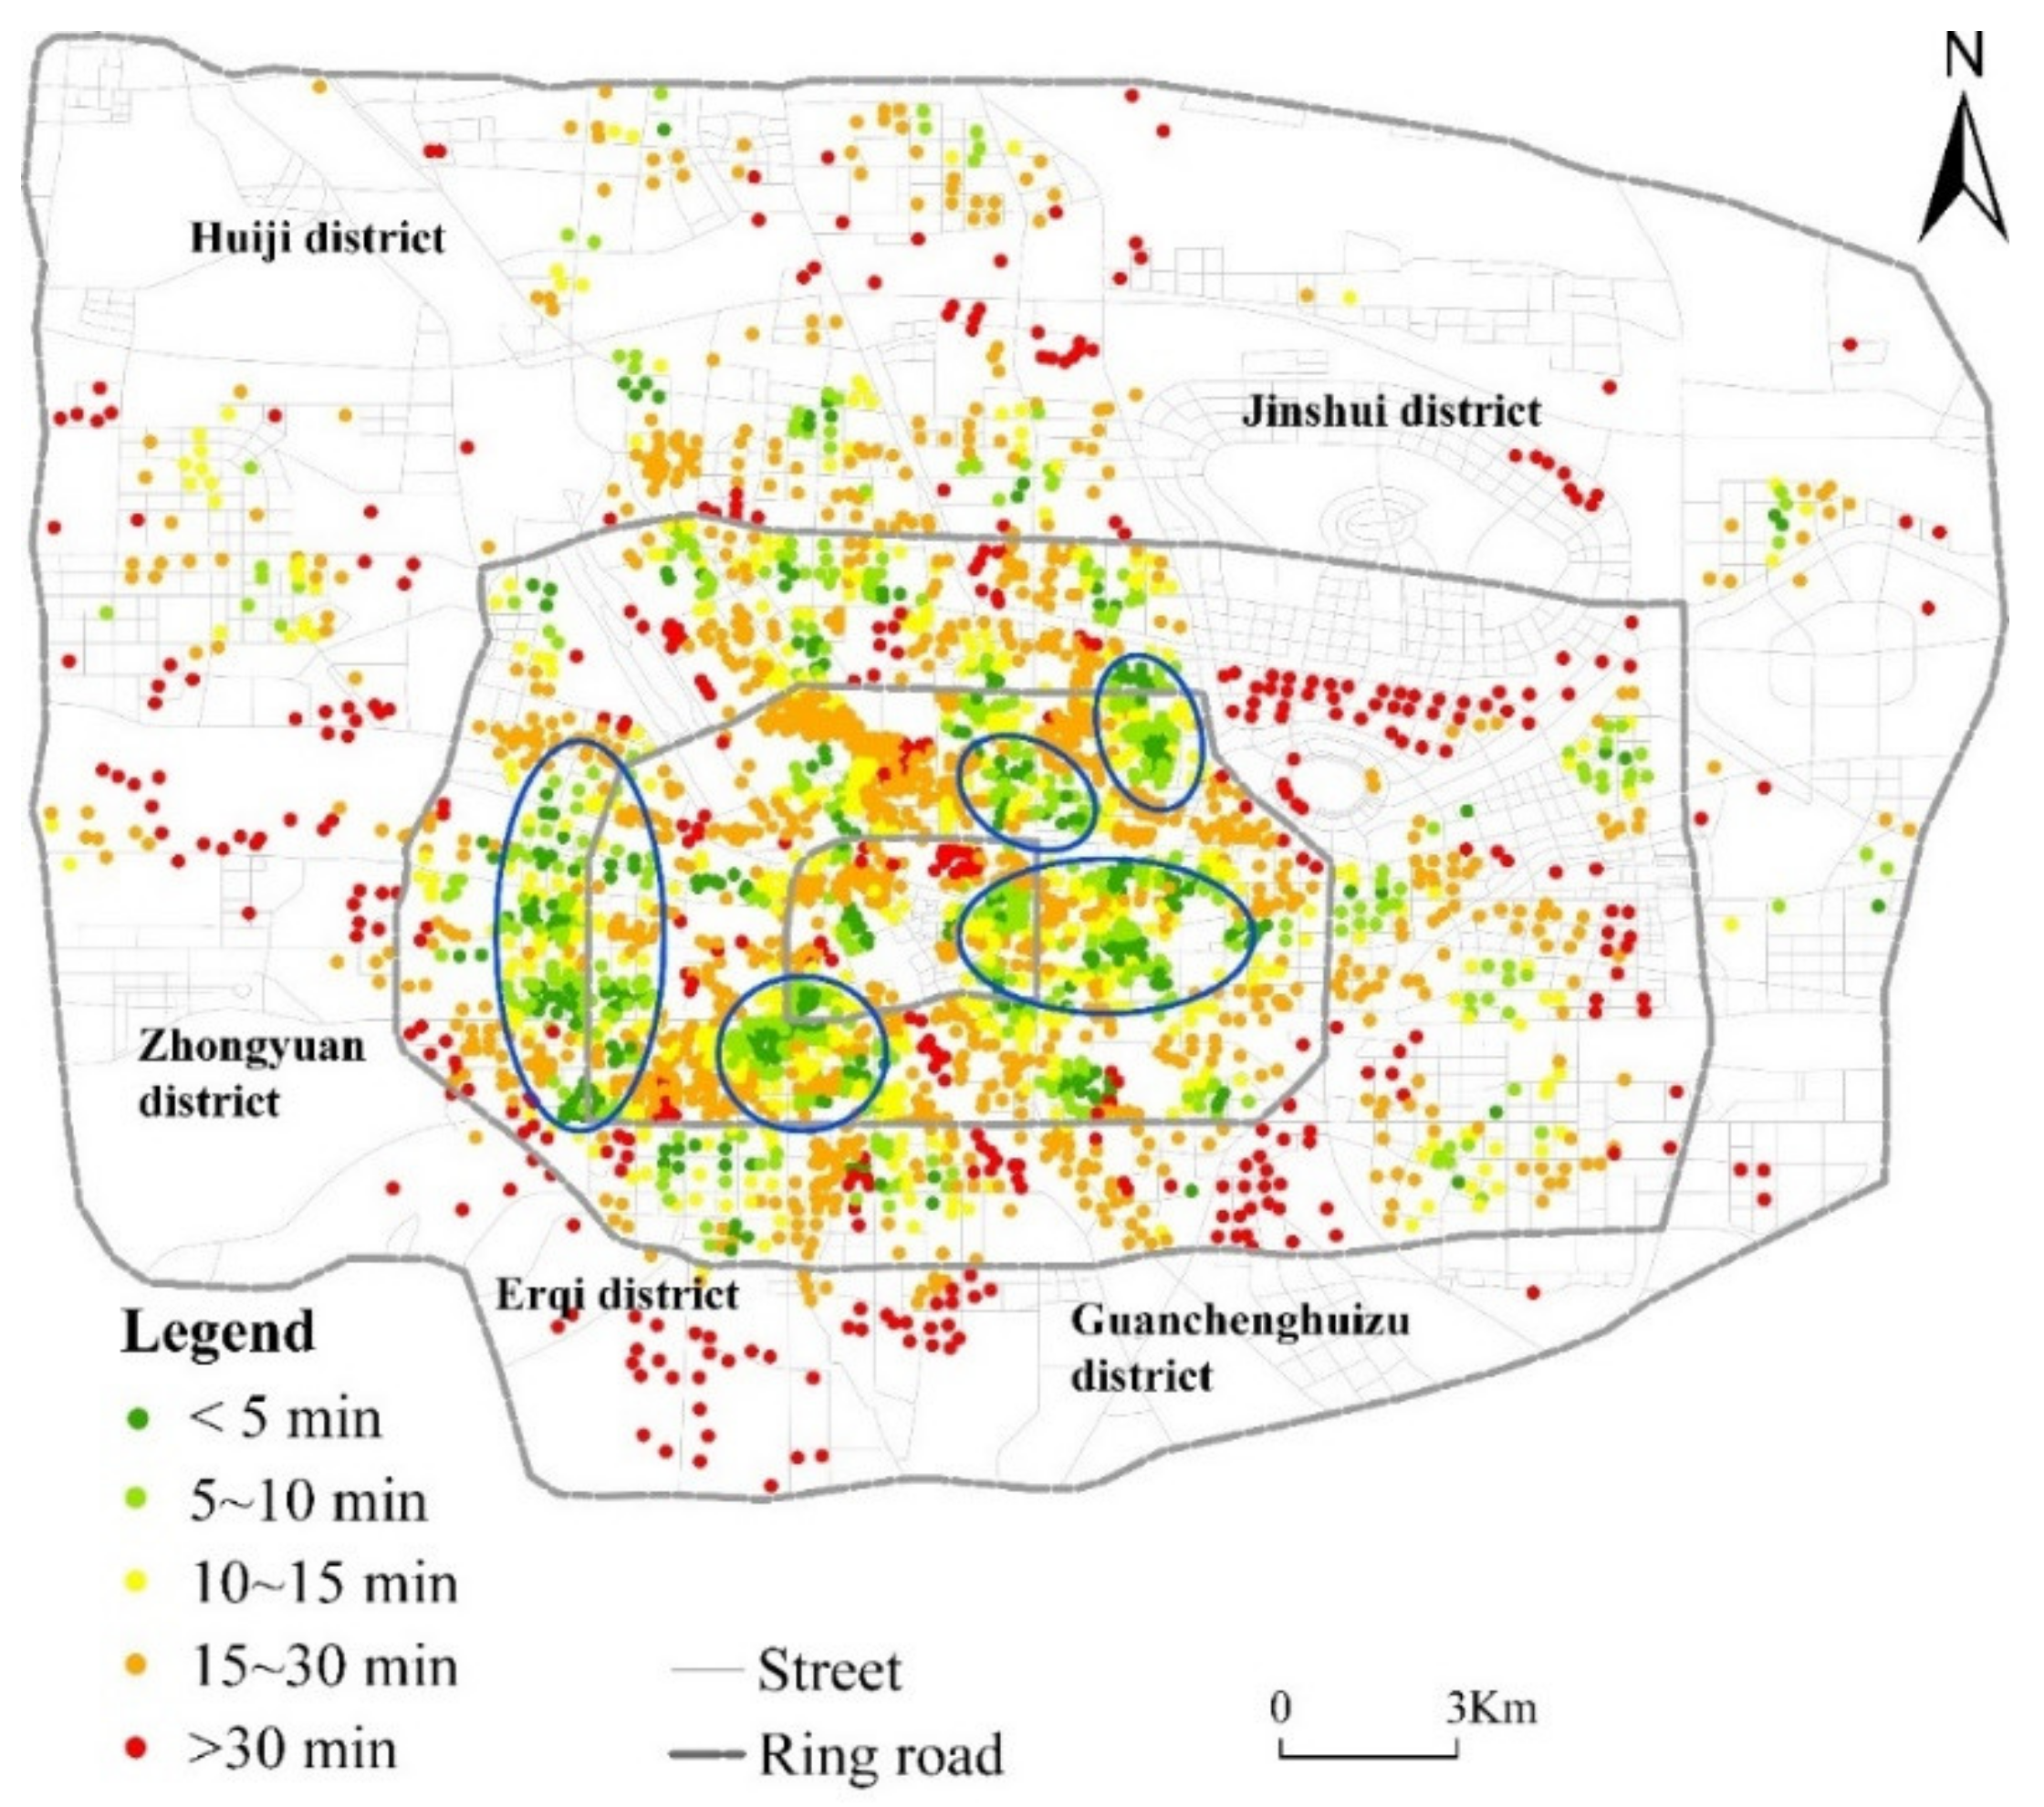
3.1. Current Status of Healthcare Services

In this study, spatial accessibility was measured by walking time from the community to healthcare service centers. According to the actual service area of 75 community-level healthcare service centers, the accessibility results are summarized in Figure 4. For most communities, the travel time from communities to healthcare service centers is more than 15 min, which is far below the national target of 80%. Spatial accessibility is relatively good in five areas within the existing facility configuration (shown in circles in Figure 4). Travel time to use healthcare services is less than 15 min. Table 2 shows that only 39.57% of residents could reach their community healthcare center within 15 min, while 61.43% could not access this service. The highest proportion of residents had accessibility within 15–30 min (39.60%). Table 2 shows that different ring roads showed significant differences. Residents of the second ring road had the best accessibility, and the coverage rate of the population within 15-minute travel time is up to 53.11%. The average travel time is 15.04 min. On the contrary, residents in the fourth ring road had poor accessibility. The population coverage rate within a 15-minute travel time is only 19.32%, and the average travel time is 33.53 min.

3.2. Potential Spatial Accessibility of Healthcare Services

We applied the optimal supply–demand allocation method to calculate the potential spatial accessibility of the healthcare service center. Figure 5 shows that the spatial accessibility of healthcare services is improved using the OSD model. However, the distribution pattern of spatial accessibility does not obviously change. In the central area, accessibility is relatively good. Spatial accessibility is still poor in urban fringe areas. Table 3 shows that, after optimal allocation, the 15-minute population coverage rate of community-level healthcare service centers was 48.11%, which is an increase of 8.54%. In addition, average accessibility dropped from 18.25 min to 16.48 min, which is a decrease of 1.77 min. The first ring road has the greatest improvement, with the average medical treatment time reduced by 5.15 min, and the 15-minute population coverage increased by 38.96%. The fourth ring road has the smallest change, with the average accessibility reduced by 1.25 min, and the population coverage rate increased by 0.91% in 15 min.

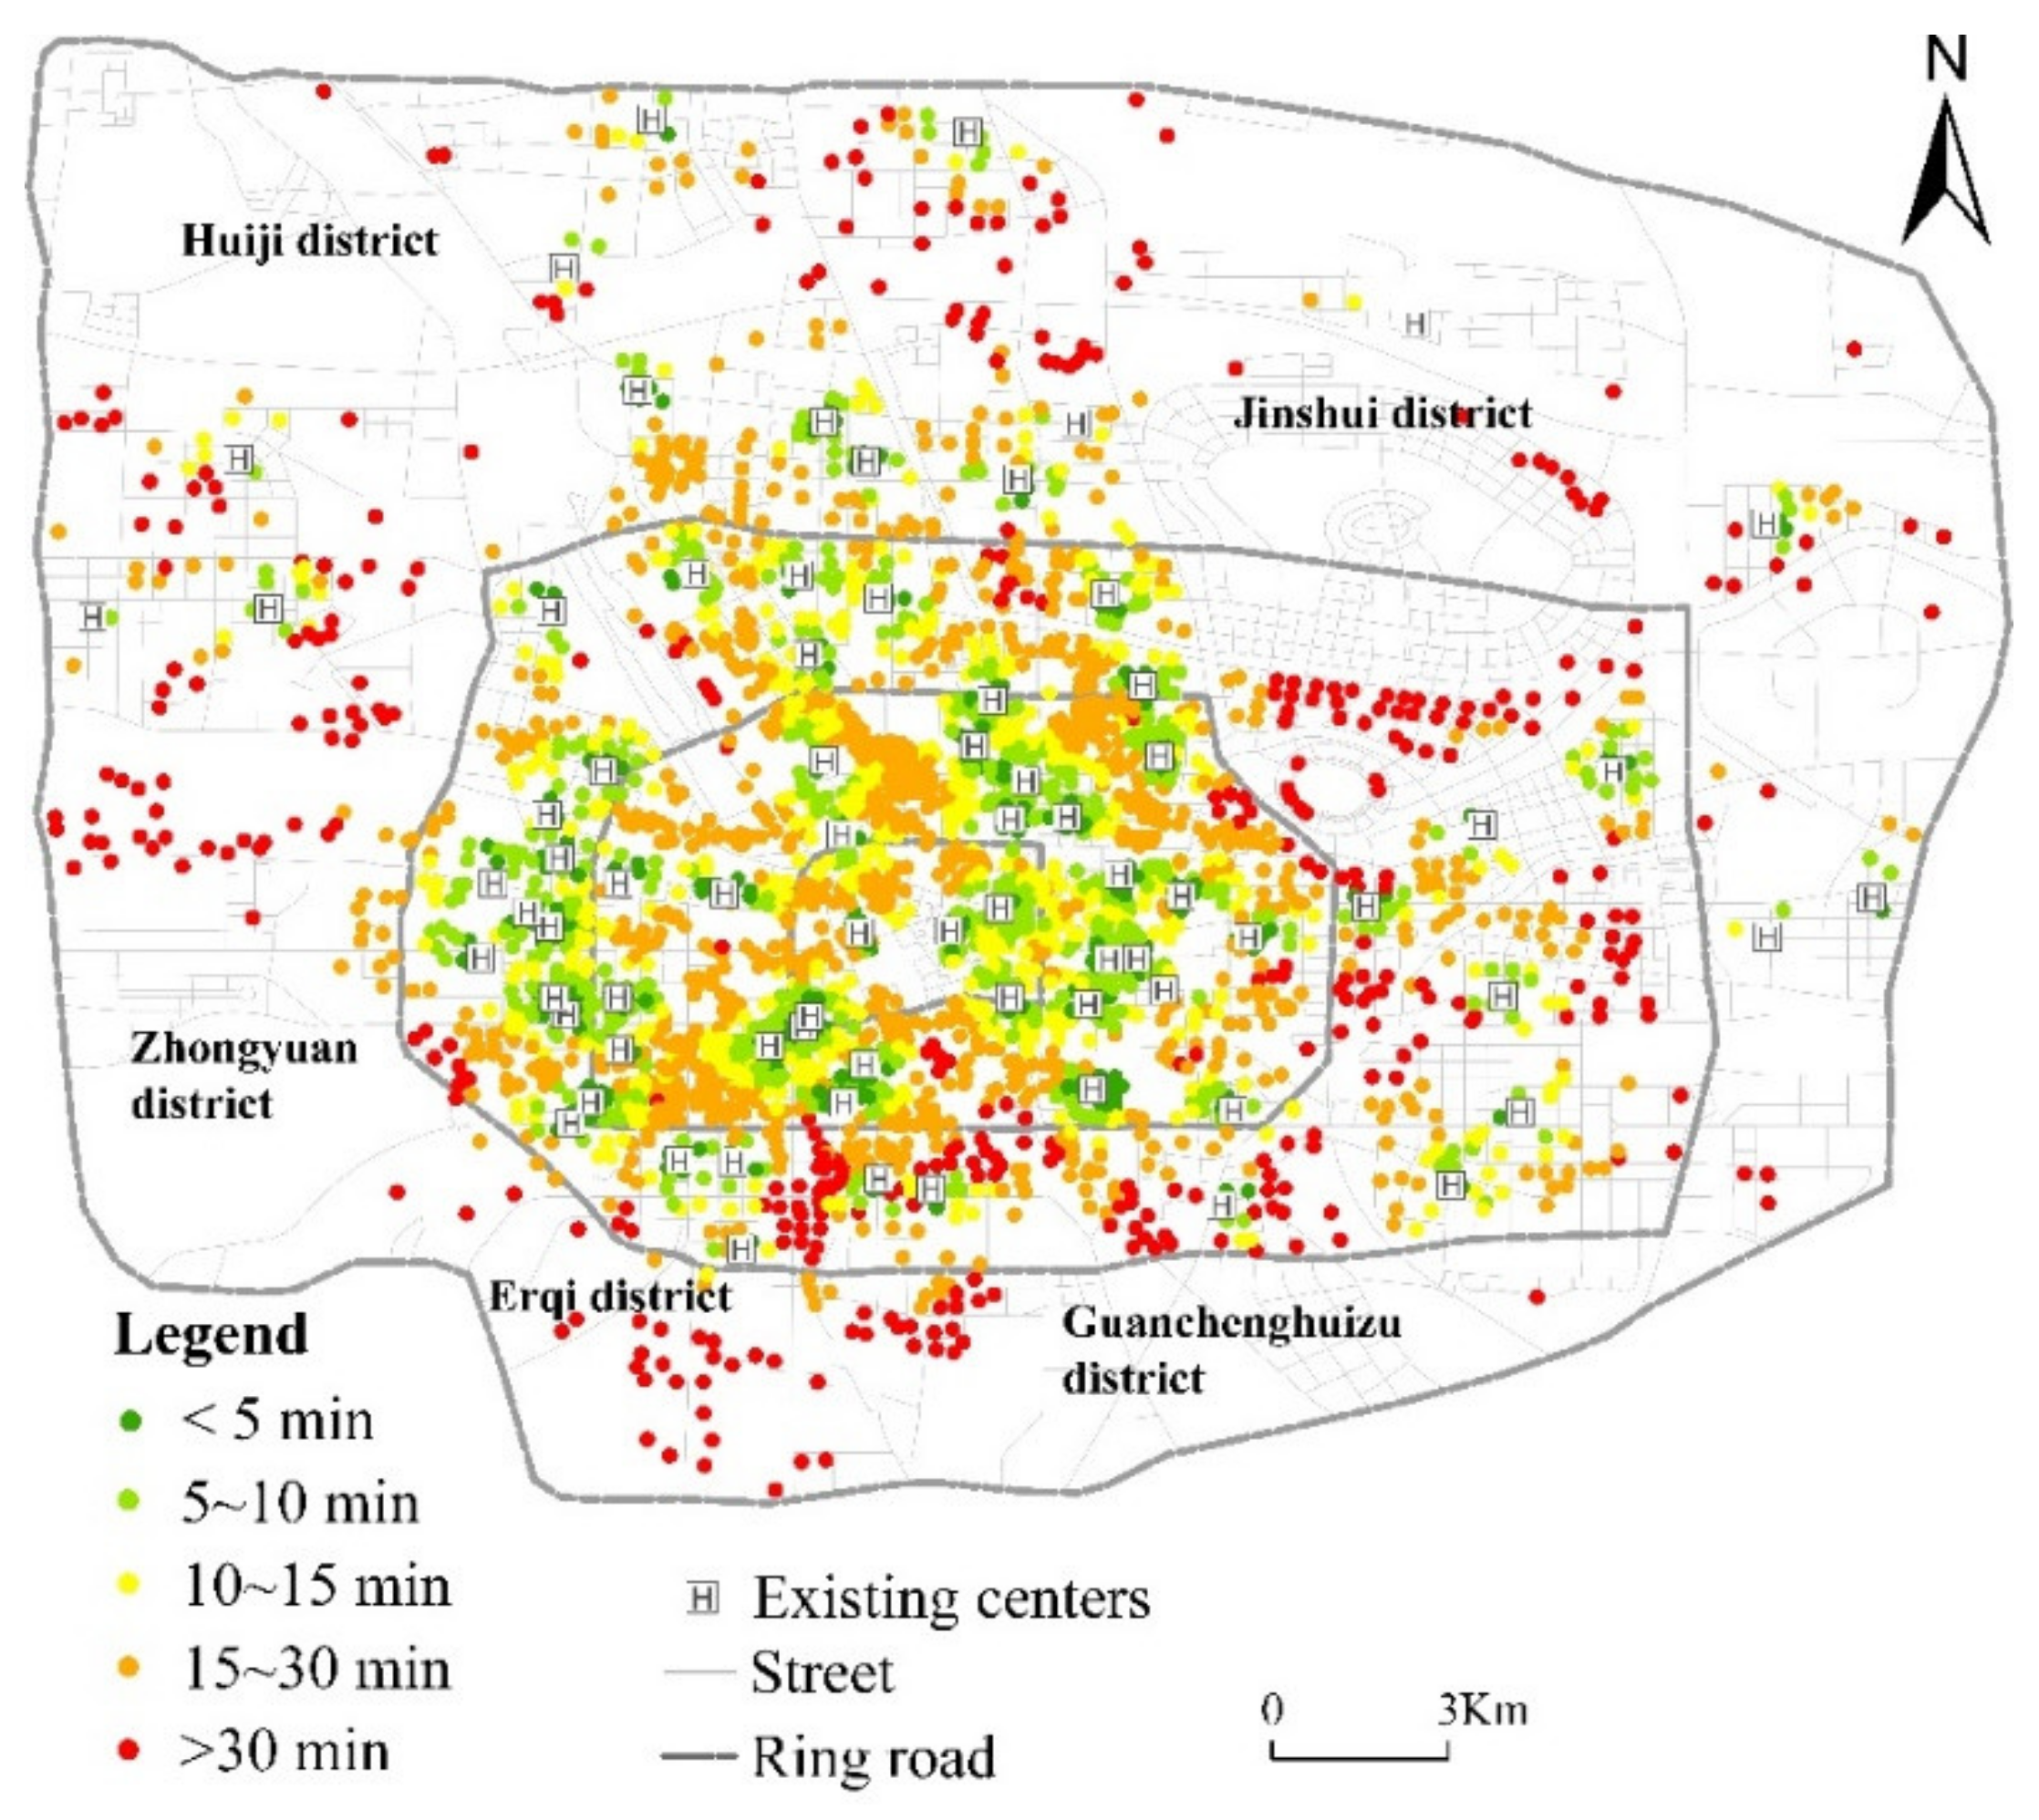
3.3. Improving the Spatial Accessibility of Healthcare Services

After optimal allocation, population coverage within a 15-minute walking time was significantly lower than the national target of 80%. To achieve the ‘15-minute city’ goal, we used the CPMP model to select the best locations for the new healthcare services center and further improve spatial accessibility. Table 4 summarizes the statistics of population coverage by healthcare services centers under different numbers. As the number of healthcare service centers increased, accessibility improved significantly. When the number of centers reached 135, the healthcare services centers were able to cover 80.11% of residents within 15 min, which is an increase of 40.54% compared to the 15-minute population coverage rate of the existing healthcare services centers. The proportion of residents who had accessibility within 5–10 min was the highest and accounted for 35.45% of the total residents. The average travel time dropped from 18.25 min to 10 min. Figure 6 shows that the spatial accessibility of healthcare services has been greatly improved by the addition of 60 healthcare service centers. Areas with high (low) accessibility values are significantly expanded (decreased), especially areas with accessibility over 30 min. Table 5 shows that the 15-minute population coverage rates exceeded 80% for the first three ring roads, representing increases of 41.31%, 34.08%, and 43.55%, respectively. Although the 15-minute population coverage rate increased by 43.16%, it only reached 62.48% for the fourth ring road. The average accessibility of these four ring roads was within 15 min and decreased by 5.76%, 5.70%, 9.26%, and 20.02%.
Comparing Figure 4 and Figure 6, we can find that for several communities (e.g., Long Xiang Jia Yuan Courtyard no. 1, Long Xiang Jia Yuan Courtyard no. 2, Long Xiang Jia Yuan Courtyard no. 3, and Long Xiang Jia Yuan Courtyard no. 4) located in Jinshui district, Zhengzhou city, the current mean travel time to access healthcare services was up to 93 min, which is more than 15 min. The new health service center can reduce the mean travel time to 10 min. It would be beneficial for residents to have access to healthcare services.

4. Discussion

We assessed the spatial accessibility of healthcare services and identified areas with poor access to them. Based on the 15-minute city concept, we set a 15-minute walking distance of 1080 m as the maximum distance and identified areas with poor accessibility. We found that the average travel time for residents to access healthcare services was 18.25 min, and 39.57% of residents could reach healthcare services within 15 min. In 2017, the National Health Commission of the People’s Republic of China proposed that more than 80% of the population should be able to reach the nearest healthcare service within a 15-minute walk. Evidently, the current service status of the existing healthcare centers in Zhengzhou cannot meet this goal. We also found that there are spatial inequities in access to healthcare services in the study area. Areas with relatively high accessibility were distributed around the central urban area and business districts, while accessibility in newly developed areas and suburbs was poor. These findings are consistent with other studies in Wuhan [64] and Shanghai [12].
In China, the topic of the 15-minute city has been widely discussed and mainly focused on theoretical discussions, such as the definition of its connotation and function [65], the division method of its spatial scope [66], and the theoretical guidance for its construction [67]. However, the assessment and optimization of the layout of public service facilities in the 15-minute city have not yet formed a unified standard, and systematic practical solutions are missing. The results showed that the OSD model can effectively improve the spatial accessibility of healthcare services. Compared to actual healthcare services, the mean travel time was potentially reduced by 1.8 min, and the population covered by the 15-minute city concept increased by 5.5%. In addition, the current planning scope of the 15-minute city is mainly based on the administrative unit. In order to improve the efficiency of public services, service facilities should be distributed by administrative units. Optimal distribution of supply and demand can overcome the obstacles of administrative regions and achieve an overall balance between supply and demand at the city level.
Although the spatial accessibility of healthcare services can be improved by allocating healthcare services to communities with minimum total travel distances, the population coverage within a 15-minute walking time is significantly lower than the national target of 80%. The location-allocation model plays a key role in improving the spatial accessibility of healthcare services [68,69,70]. Therefore, we introduced the CPMP model to select optimal sites for the new healthcare services centers and further improve spatial accessibility. As the number of facilities increases, population coverage increases rapidly within a 15-minute walking time. Although the differences in the spatial accessibility of healthcare services decreased significantly after the optimization, the accessibility in the suburbs of the city remained relatively low. The reasons may be that the population distribution in the suburbs is relatively scattered, and transportation is inconvenient. Previous studies have illustrated that the service radius of basic public facilities should be 0.8–1.5 km in a 15-minute city [71,72]. However, the service radius may vary depending on population density. For some aging communities located in an urban central area, the service radius should be relatively reduced. It will benefit aging people in shopping, leisure, and healthcare. On the contrary, for communities with low population density and scattered distribution in new urban areas, the service distance can be increased [73].
In addition, the elderly over 60 years can enjoy free physical examination at China’s community health service centers in urban areas so as to achieve the goal of early detection, prevention, diagnosis, and treatment of diseases and reduction of mortality rates. For the elderly, walking is their preferred mode of travel. Therefore, they would be critically affected if the 15 min reachability is not provided. If the walking distance is far more than 15 min, it would not be beneficial for them in terms of assessing healthcare services. In this study, 135 healthcare services centers in Zhengzhou were needed to meet the national target of 80%. In reality, adapting the layout of existing healthcare service centers often requires a comprehensive consideration of social and economic aspects, which is somewhat complicated. We kept the original layout of the centers, which was more in line with the actual situation during the execution process and was easier to execute. However, ignoring the problem in the original layout would not allow us to effectively optimize the facility layout, which affected the overall efficiency of the optimization. In practical applications, we should choose a more suitable solution according to our own needs. The two proposed solutions can provide valuable information to support health promotion and urban planning practices to build 15-minute cities. The 60 newly proposed healthcare centers selected by the CPMP model could potentially increase population coverage by an additional 35%. Finally, the new community-level health service centers have convenient transportation, convenient parking, and safety features.

5. Conclusions

In this study, we evaluated the spatial accessibility of healthcare services centers based on their areas of responsibility areas and identified the best places to build them in order to improve the spatial accessibility of Zhengzhou’s healthcare services centers. The results of spatial accessibility analysis showed that Zhengzhou’s community health service resources could not fully meet the needs of residents, and 60.43% of residents could not reach a community health service center within 15 min. Healthcare services centers were unevenly distributed, mostly concentrated within the third ring road with a smaller number of centers outside the third ring road. Spatial accessibility of healthcare services centers was unfair, and average accessibility decreased from the inner to the outer ring. In this study, we considered supply and demand requirements with the goal of minimizing the distance between residents seeking medical care. We used the model to optimize healthcare service centers in Zhengzhou. Ultimately, the coverage rate of the community population exceeded 80%. The results of this study are, therefore, an important asset for health planners and decision-makers.
In addition, this study has some shortcomings. First, the population data used were estimated from building data. Although the estimation error is small, the population data are still not real. Second, residents’ preferences and socioeconomic factors are not considered, and results may deviate from residents’ actual healthcare service accessibility. Third, the accessibility of public service facilities can be improved by expanding the facilities’ capacity, adding new facilities, or adjusting the facilities location. This study considers only the capacity adjustment of facilities capacity and the addition of new facilities. These challenges can be solved in future research.

Supplementary Materials

The following supporting information can be downloaded at: https://www.mdpi.com/article/10.3390/ijgi11080436/s1, Figure S1: Buildings within the 50-m buffer zone of road network; Figure S2: Buildings with area greater than 1000 m2; Figure S3: Buildings within 100-m buffer zone of parking area; Figure S4: Buildings outside 500-m buffer zone of the existing community health service center; Figure S5: Spatial distribution of candidate healthcare facilities.

Author Contributions

Data curation, Jingjing Luo; formal analysis, Hongquan Song; investigation, Ke Li; methodology, Xinxin He; project administration, Yunfeng Kong; writing—original draft, Genxin Song; writing—review and editing, Shiyan Zhai. All authors have read and agreed to the published version of the manuscript.

Funding

This research was funded by the Science and Technology Department of Henan Province (No. 222102320397), the National Natural Science Foundation of China (No. 42171294), key scientific research projects of colleges and universities in Henan Province (No. 21A170007), and the National Experimental Teaching Demonstrating Center of Henan University (No. 2020HGSYJX004).

Institutional Review Board Statement

Not applicable.

Informed Consent Statement

Not applicable.

Data Availability Statement

The data presented in this study are available on request to the corresponding author.

Conflicts of Interest

The authors declare no conflict of interest.

References

  1. Shifa:, M.; David, A.; Leibbrandt, M. Spatial inequality through the prism of a pandemic: COVID-19 in South Africa. Sci. Rep. 2021, 13, e00949. [Google Scholar] [CrossRef] [PubMed]
  2. Alemdar, K.D.; Kaya, Ö.; Çodur, M.Y.; Campisi, T.; Tesoriere, G. Accessibility of vaccination centers in COVID-19 outbreak control: A GIS-Based multi-criteria decision making approach. ISPRS Int. J. Geo-Inf. 2021, 10, 708. [Google Scholar] [CrossRef]
  3. Kang, J.Y.; Michels, A.; Lyu, F.; Wang, S.; Agbodo, N.; Freeman, V.L.; Wang, S. Rapidly measuring spatial accessibility of COVID-19 healthcare resources: A case study of Illinois, USA. Int. J. Health Geogr. 2020, 19, 36. [Google Scholar] [CrossRef] [PubMed]
  4. Earle, L. Urban crises and the new urban agenda. Environ. Urban 2016, 28, 77–86. [Google Scholar] [CrossRef] [Green Version]
  5. Klopp, J.M.; Petretta, D.L. The urban sustainable development goal: Indicators, complexity and the politics of measuring cities. Cities 2017, 63, 92–97. [Google Scholar] [CrossRef]
  6. Moreno, C.; Allam, Z.; Chabaud, D.; Gall, C.; Pratlong, F. Introducing the ‘15-minute city’: Sustainability, resilience and place identity in future post-pandemic cities. Smart Cities 2021, 4, 93–111. [Google Scholar] [CrossRef]
  7. Weng, M.; Ding, N.; Li, J.; Jin, X.; Xiao, H.; He, Z.; Su, S. The 15-minute walkable neighborhoods: Measurement, social inequalities and implications for building healthy communities in urban China. J. Transp. Health 2019, 13, 259–273. [Google Scholar] [CrossRef]
  8. Pozoukidou, G.; Chatziyiannaki, Z. 15-Minute City: Decomposing the new urban planning eutopia. Sustainability 2021, 13, 928. [Google Scholar] [CrossRef]
  9. Caselli, B.; Carra, M.; Rossetti, S.; Zazzi, M. Exploring the 15-minute neighbourhoods. An evaluation based on the walkability performance to public facilities. Procedia Comput. Sci. 2022, 60, 346–353. [Google Scholar] [CrossRef]
  10. Balletto, G.; Ladu, M.; Milesi, A.; Campisi, T.; Borruso, G. Walkability and city users. Critical analysis of opportunities and risks. In Proceedings of the 1st Conference on Future Challenges in Sustainable Urban Planning & Territorial Management, Sciforum Platform, 17–19 January 2022. [Google Scholar] [CrossRef]
  11. GB50180-2018; Urban Residential Area Planning and Design Standards. Ministry of Housing and Urban-Rural Development of the People’s Republic of China: Beijing, China, 2018.
  12. Wu, H.; Wang, L.; Zhang, Z.; Gao, J. Analysis and optimization of 15-minute community life circle based on supply and demand matching: A case study of Shanghai. PLoS ONE 2021, 16, e0256904. [Google Scholar] [CrossRef]
  13. Allam, Z.; Nieuwenhuijsen, M.; Chabaud, D.; Moreno, C. The 15-minute city offers a new framework for sustainability, liveability, and health. Lancet Planet. Health 2022, 6, 181–183. [Google Scholar] [CrossRef]
  14. Montgomery, M.R. World Development Report 2009: Reshaping Economic Geography; The World Bank: Washington, DC, USA, 2009; Available online: http://hdl.handle.net/10986/5991 (accessed on 10 June 2021).
  15. Pansiri, J.; Mmereki, R.N. Using the SERVQUAL model to evaluate the impact of public service reforms in the provision of primary health care in Botswana. J. Afr. Bus. 2010, 11, 219–234. [Google Scholar] [CrossRef]
  16. Ding, H.; Xu, Y.; Zheng, K.F. Establishment of performance evaluation indicator system for community health service. Chin. Health Qual. Manag. 2016, 23, 113–115. [Google Scholar] [CrossRef]
  17. Chen, Y.T.; Liu, Y. Research on performance optimization of government purchasing community health services based on tripartite game. J. Xiangtan Univ. 2020, 44, 39–45. [Google Scholar] [CrossRef]
  18. Qiu, C.L.; Xu, X.; Wang, H.R. Status of resource allocation of community health center in main labor distribution regions of Shenzhen. Chin. Gen. Pract. 2013, 16, 33–36. [Google Scholar] [CrossRef]
  19. Tang, L.J.; Wang, C.Q.; Qian, D.F. Study on resource allocation and service provision of community health institutions under the background of aging: A case study of Jiangsu province. Chin. J. Health Policy 2020, 13, 33–39. [Google Scholar] [CrossRef]
  20. Griffin, P.M.; Scherrer, C.R.; Swann, J.L. Optimization of community health center locations and service offerings with statistical need estimation. IIE Trans. 2008, 40, 880–892. [Google Scholar] [CrossRef]
  21. Shariff, S.; Moin, N.H.; Omar, M. Location allocation modeling for healthcarefacility planning in Malaysia. Comput. Ind. Eng. 2012, 62, 1000–1010. [Google Scholar] [CrossRef]
  22. Zhao, L.Z.; Gao, S.Q. Research on optimization of community health service facilities layout based on population density: Taking Central Urban area of Beijing for an example. Urban Dev. Stud. 2020, 27, 26–32. [Google Scholar]
  23. Ahmadi-Javid, A.; Seyedi, P.; Syam, S.S. A survey of healthcare facility location. Comput. Oper. Res. 2017, 79, 223–263. [Google Scholar] [CrossRef]
  24. Revelle, C.; Marks, D.; Liebman, J.C. An analysis of private and public sector location models. Manag. Sci. 1970, 16, 692–707. [Google Scholar] [CrossRef]
  25. Toregas, C.; Swain, R.; ReVelle, C.; Bergman, L. The location of emergency service facilities. Oper. Res. 1971, 19, 1363–1373. [Google Scholar] [CrossRef]
  26. Church, R.; ReVelle, C. The Maximal Covering Location Problem. In Papers of the Regional Science Association; Springer: Berlin/Heidelberg, Germany, 1974; Volume 32, pp. 101–118. [Google Scholar] [CrossRef]
  27. Daskin, M.S.; Hesse, S.M.; Revelle, C.S. α-Reliable p-minimax regret: A new model for strategic facility location modeling. Locat. Sci. 1997, 5, 227–246. [Google Scholar] [CrossRef]
  28. Widener, M.J.; Horner, M.W. A hierarchical approach to modeling hurricane disaster relief goods distribution. J. Transp. Geogr. 2011, 19, 821–828. [Google Scholar] [CrossRef]
  29. Yaghini, M.; Karimi, M.; Rahbar, M. A hybrid metaheuristic approach for the capacitated p-median problem. Appl. Soft Comput. 2013, 13, 3922–3930. [Google Scholar] [CrossRef]
  30. Xu, J.; Yin, X.; Chen, D.; An, J.; Nie, G. Multi-criteria location model of earthquake evacuation shelters to aid in urban planning. Int. J. Disaster Risk Reduct. 2016, 20, 51–62. [Google Scholar] [CrossRef]
  31. Kocatepe, A.; Ozguven, E.E.; Horner, M.; Ozel, H. Pet- and special needs-friendly shelter planning in south florida: A spatial capacitated p-median-based approach. Int. J. Disaster Risk Reduct. 2018, 31, 1207–1222. [Google Scholar] [CrossRef]
  32. Gu, X.; Tao, S.; Dai, B. Spatial accessibility of country parks in Shanghai, China. Urban For. Urban Green. 2017, 27, 373–382. [Google Scholar] [CrossRef]
  33. Shin, K.; Lee, T. Improving the measurement of the Korean emergency medical System’s spatial accessibility. Appl. Geogr. 2018, 100, 30–38. [Google Scholar] [CrossRef]
  34. Wang, X.; Yang, H.; Duan, Z.; Pan, J. Spatial accessibility of primary healthcare in China: A case study in Sichuan Province. Soc. Sci. Med. 2018, 209, 14–24. [Google Scholar] [CrossRef]
  35. Yiannakoulias, N.; Bland, W.; Svenson, L.W. Estimating the effect of turn penalties and traffic congestion on measuring spatial accessibility to primary healthcare. Appl. Geogr. 2013, 39, 172–182. [Google Scholar] [CrossRef]
  36. Järv, O.; Tenkanen, H.; Salonen, M.; Ahas, R.; Toivonen, T. Dynamic cities: Location-based accessibility modelling as a function of time. Appl. Geogr. 2018, 95, 101–110. [Google Scholar] [CrossRef]
  37. Kwan, M.-P.; Murray, A.T.; O’Kelly, M.E.; Tiefelsdorf, M. Recent advances in accessibility research: Representation, methodology and applications. J. Geogr. Syst. 2003, 5, 129–138. [Google Scholar] [CrossRef]
  38. Zhang, Q.; Northridge, M.E.; Jin, Z.; Metcalf, S.S. Modeling accessibility of screening and treatment facilities for older adults using transportation networks. Appl. Geogr. 2018, 93, 64–75. [Google Scholar] [CrossRef]
  39. Joseph, A.E.; Bantock, P.R. Measuring potential physical accessibility to general practitioners in rural areas: A method and case study. Soc. Sci. Med. 1982, 16, 85–90. [Google Scholar] [CrossRef]
  40. Onega, T.; Duell, E.J.; Shi, X. Geographic access to cancer care in the US. Cancer 2008, 112, 909–918. [Google Scholar] [CrossRef]
  41. Schuurman, N.; Berube, M.; Crooks, V.A. Measuring potential spatial access to primary healthcare physicians using a modified gravity model. Cancer Geogr. 2010, 54, 29–45. [Google Scholar] [CrossRef]
  42. Xia, N.; Cheng, L.; Chen, S.; Wei, X.; Zong, W.; Li, M. Accessibility based on gravity-radiation model and google maps API: A case study in Australia. J. Transp. Geogr. 2018, 72, 178–190. [Google Scholar] [CrossRef]
  43. Luo, W.; Wang, F. Measures of spatial accessibility to healthcare in a GIS environment: Synthesis and a case study in the Chicago Region. Environ. Plan. B Plan. Des. 2003, 30, 865–884. [Google Scholar] [CrossRef] [Green Version]
  44. Luo, W.; Whippo, T. Variable catchment sizes for the two-step floating catchment area (2SFCA) method. Health Place 2012, 18, 789–795. [Google Scholar] [CrossRef]
  45. Reshadat, S.; Zangeneh, A.; Saeidi, S.; Teimouri, R.; Yigitcanlar, T. Measures of spatial accessibility to health centers: Investigating urban and rural disparities in Kermanshah, Iran. J. Public Health 2019, 27, 519–529. [Google Scholar] [CrossRef]
  46. Luo, W.; Qi, Y. An enhanced two-step floating catchment area (E2SFCA) method for measuring spatial accessibility to primary care physicians. Health Place 2009, 15, 1100–1107. [Google Scholar] [CrossRef]
  47. Guagliardo, M.F. Spatial accessibility of primary care: Concepts, methods and challenges. Int. J. Health Geogr. 2004, 3, 3. [Google Scholar] [CrossRef] [Green Version]
  48. Spencer, J.; Angeles, G. Kernel density estimation as a technique for assessing availability of health services in Nicaragua. Health Serv. Outcomes Res. Methodol. 2007, 7, 145–157. [Google Scholar] [CrossRef]
  49. Ghorbanzadeh, M.; Kim, K.; Erman Ozguven, E.; Horner, M.W. Spatial accessibility assessment of COVID-19 patients to healthcare facilities: A case study of Florida. Travel Behav. Soc. 2021, 24, 95–101. [Google Scholar] [CrossRef]
  50. McGrail, M.R.; Humphreys, J.S. Measuring spatial accessibility to primary care in rural areas: Improving the effectiveness of the two-step floating catchment area method. Appl. Geogr. 2009, 29, 533–541. [Google Scholar] [CrossRef]
  51. Wang, F. Measurement, optimization, and impact of healthcare accessibility: A methodological review. Ann. Assoc. Am. Geogr. 2012, 102, 1104–1112. [Google Scholar] [CrossRef] [Green Version]
  52. McGrail, M.R.; Humphreys, J.S. Measuring spatial accessibility to primary healthcare services: Utilising dynamic catchment sizes. Appl. Geogr. 2014, 54, 182–188. [Google Scholar] [CrossRef]
  53. Pu, Q.; Yoo, E.-H.; Rothstein, D.H.; Cairo, S.; Malemo, L. Improving the spatial accessibility of healthcare in North Kivu, Democratic Republic of Congo. Appl. Geogr. 2020, 121, 102262. [Google Scholar] [CrossRef]
  54. Cetin, M. Using GIS analysis to assess urban green space in terms of accessibility: Case study in Kutahya. Int. J. Sustain. Dev. World Ecol. 2015, 22, 420–424. [Google Scholar] [CrossRef]
  55. Liu, D.; Kwan, M.-P.; Kan, Z. Analysis of urban green space accessibility and distribution inequity in the City of Chicago. Urban For. Urban Green. 2021, 59, 127029. [Google Scholar] [CrossRef]
  56. Li, M.T.; Yang, L.B.; Wei, Y. Improved Gaussian based 2-step floating catchment area method: A case study of green space accessibility in Shanghai. Prog. Geogr. 2016, 35, 990–996. Available online: http://www.progressingeography.com/CN/10.18306/dlkxjz.2016.08.008 (accessed on 15 June 2021).
  57. Xu, Y.; Song, W.X.; Liu, C.H. Social-spatial accessibility to urban educational resources under the school district system: A case study of public primary schools in Nanjing, China. Sustainability 2018, 10, 2305. [Google Scholar] [CrossRef] [Green Version]
  58. Liu, R.; Chen, Y.; Wu, J.; Xu, T.; Gao, L.; Zhao, X. Mapping spatial accessibility of public transportation network in an urban area—A case study of Shanghai Hongqiao transportation Hub. Transp. Res. D Transp. Environ. 2018, 59, 478–495. [Google Scholar] [CrossRef]
  59. Chen, X.; Jia, P. A comparative analysis of accessibility measures by the two-step floating catchment area (2SFCA) method. Int. J. Geogr. Inf. Sci. 2019, 33, 1739–1758. [Google Scholar] [CrossRef]
  60. Zhai, S.; He, X.; Kong, Y.; Luo, J.; Song, G. Measuring spatial accessibility of public service by optimal supply-demand allocation. Acta Geogr. Sin. 2022, 77, 1028–1038. [Google Scholar] [CrossRef]
  61. Rong, P.; Zheng, Z.; Kwan, M.P.; Qin, Y. Evaluation of the spatial equity of medical facilities based on improved potential model and map service API: A case study in Zhengzhou, China. Appl. Geogr. 2020, 119, 102192. [Google Scholar] [CrossRef]
  62. Zhengzhou, S.B.O. Zhengzhou Statistical Yearbook 2020; China Statistics Press: Beijing, China, 2021; Available online: https://navi.cnki.net/knavi/yearbooks/YZZTJ/detail (accessed on 1 October 2021).
  63. Lu, C.; Zhang, Z.; Lan, X. Impact of China’s referral reform on the equity and spatial accessibility of healthcare resources: A case study of Beijing. Soc. Sci. Med. 2019, 235, 112386. [Google Scholar] [CrossRef]
  64. Zhao, P.; Li, S.; Liu, D. Unequable spatial accessibility to hospitals in developing megacities: New evidence from Beijing. Health Place 2020, 65, 102406. [Google Scholar] [CrossRef]
  65. Chai, Y.; Li, C. Urban life cycle planning: From research to practice. City Plan. Rev. 2019, 43, 9–16, +60. [Google Scholar]
  66. Sun, D.; Chai, Y.; Zhang, y. The definition and measurement of community life circle: A case study of Qinghe Area in Beijing. Urban Dev. Stud. 2016, 23, 1–9. [Google Scholar]
  67. Cheng, R. Planning and Practice of a 15-Minute Community Living Circle in Shanghai Guided by Promoting Implementation. Shanghai Urban Plan. Rev. 2018, 2, 84–88. [Google Scholar]
  68. Du, G.; Sun, C. Location planning problem of service centers for sustainable home healthcare: Evidence from the empirical analysis of Shanghai. Sustainability 2015, 7, 15812–15832. [Google Scholar] [CrossRef] [Green Version]
  69. Gu, W.; Wang, X.; McGregor, S.E. Optimization of preventive healthcare facility locations. Int. J. Health Geogr. 2010, 9, 17. [Google Scholar] [CrossRef] [Green Version]
  70. Luo, J.; Tian, L.; Luo, L.; Yi, H.; Wang, F. Two-Step optimization for spatial accessibility improvement: A case study of healthcare planning in rural China. Biomed. Res. Int. 2017, 2017, 2094654. [Google Scholar] [CrossRef] [Green Version]
  71. Lu, Y.; Hou, C.; Zhao, L.; Wang, S. Evaluation Of 15-minute public service level. Planners 2018, 34, 106–110. [Google Scholar]
  72. Liu, Q.; Qian, Z.; Huang, D.; Zhou, X. The characteristics of spatial pattern evolution and the trend of the 15-minute life circle. Urban Plan. Forum 2020, 6, 94–101. [Google Scholar]
  73. Thoughts, methodology, and practice: Symposium on the planning of 15-minute community-life circles. Urban Plan. Forum 2020, 1, 1–8.
Figure 1. Study area (created by the authors).
Ijgi 11 00436 g001
Figure 2. Spatial distribution of the residential population in Zhengzhou, China (created by the authors).
Ijgi 11 00436 g002
Figure 3. Spatial accessibility assessment and improvement framework toward ‘15-minute city’ goal (created by the authors).
Ijgi 11 00436 g003
Figure 4. Accessibility measurement of the existing facility configuration (created by the authors).
Ijgi 11 00436 g004
Figure 5. Accessibility measurement after the OSD allocation (Created by the authors).
Ijgi 11 00436 g005
Figure 6. Accessibility measurement after adding 60 new healthcare centers (created by the authors).
Ijgi 11 00436 g006
Table 1. Statistics of the healthcare services centers and communities within each ring road.
Ring RoadNumber of Communities (%)Population Size (%)Number of Centers (%)
First ring279 (8.40)215,375 (4.44)5 (6.67)
Second ring1528 (46.01)1,436,335 (29.63)25 (33.33)
Third ring1072 (32.28)1,876,302 (38.71)30 (40.00)
Fourth ring442 (13.31)1,319,526 (27.22)15 (20.00)
Table 2. The current statistics of healthcare services coverage for each ring road.
<5 min
(%)
<10 min
(%)
<15 min
(%)
<30 min
(%)
>30 min
(%)
Average Time
(min)
All8.2823.0839.5778.9321.0718.25
First ring7.2922.8339.8289.810.216
Second ring10.6728.7653.1195.484.5115.04
Third ring10.6827.3743.4179.4420.5718.69
Fourth ring2.4210.8419.3258.4241.5833.53
Table 3. Healthcare service coverage statistics after the OSD allocation at different time thresholds on each ring road.
<5 min
(%)
<10 min
(%)
<15 min
(%)
<30 min
(%)
>30 min
(%)
Average Time
(min)
All9.6329.1848.1181.6418.3516.48
First ring8.3647.5778.78100010.45
Second ring14.1638.0965.0498.341.6712.75
Third ring11.1332.3651.2484.7215.2816.71
Fourth ring2.7811.9720.2356.1143.8832.28
Table 4. Statistics of the population coverage of the healthcare services with different center numbers.
Center Numbers<5 min
(%)
<10 min
(%)
<15 min
(%)
<30 min
(%)
>30 min
(%)
Average Time
(min)
758.2823.0839.5778.9321.0718.25
8511.4135.3859.8193.026.9813.35
9512.7639.5465.8896.133.8712.25
10514.6344.3170.6196.643.3611.41
11516.7948.5474.5396.863.1410.8
12517.9252.3578.4697.142.8610.35
13519.0554.580.1197.872.1310
Table 5. Medical service coverage statistics at different time thresholds within the ring roads with the addition of 60 centers.
<5 min
(%)
5~10 min
(%)
10~15 min
(%)
15~30 min
(%)
>30 min
(%)
Average Time
(min)
All19.0535.4525.6117.762.1310.00
First ring8.3639.8132.9618.870.0010.24
Second ring19.8838.4928.8212.800.009.34
Third ring23.3438.8724.7512.500.549.43
Fourth ring13.7826.5722.1330.477.0513.51
Publisher’s Note: MDPI stays neutral with regard to jurisdictional claims in published maps and institutional affiliations.

