1. Introduction
Extreme rainfall and large earthquake events have caused severe landslides in several countries; examples of such events include the 1999 Chichi earthquake in Taiwan [
1], the 2005 Kashmir earthquake in Pakistan [
2,
3], the 2008 Wenchuan earthquake in China [
4,
5,
6], Typhoon Morakot in 2009 in Taiwan [
7,
8], the 2015 Gorkha earthquake in Nepal [
9], and the 2017 Jiuzhaigou earthquake in China [
10]. Consequently, the areas affected by such events have become fragile and susceptible to landslides in subsequent years. The landslide susceptibility of mountainous areas after extreme rainfall or large earthquakes changes with time and space. Watersheds that experience numerous earthquake- or extreme-rainfall-induced landslides usually require more than 10 years to recover from such landslides. Moreover, sediment generated by continuous landslides in fragile watersheds is transported to rivers and dominates the subsequent geomorphologic evolution of these rivers. The unstable sediment yield from numerous landslides induced by large earthquake or extreme rainfall events in mountainous regions can cause further sediment disasters in the following years [
7,
8,
11].
Research on post-extreme rainfall and postearthquake landslide evolution is essential for disaster prevention and reduction [
4,
5,
6,
7,
8]. Accordingly, the spatiotemporal characteristics of landslide evolution and the dominant factors affecting it must be determined to ensure effective watershed management in the years after severe landslide events. Several studies have analyzed the relationship between geomorphological factors—including elevation, slope, aspect, and distance to river—and annual landslide distributions in subsequent years to determine the dominant factors influencing landslide evolution [
4,
5] and determine the sensitivity of geomorphological factors affecting landslide occurrence [
6]. Because of numerous landslide distributed in the mountainous regions, the thresholds of rainfall for triggering the debris flows in southern Taiwan sharply decreased [
7,
8]. Furthermore, the distribution and concentration of landslides in the years that follow extreme-rainfall- and large-earthquake-induced landslide events must be compared. Some spatial differences in the distribution of landslide evolution before and after large-earthquake- and extreme-rainfall-induced landslide events have been found [
4,
7,
8]. In the years that follow large earthquake-induced landslide events, the subsequent landslides that occur are typically concentrated in areas with elevations of <2000 m, slopes of 30–50°, aspects identical to the thrust directions of earthquake-induced faults, and slope toes located near rivers [
2,
4,
6]. Nevertheless, few studies have discussed the distribution and concentration of landslides in the years following extreme-rainfall-induced landslide events [
12,
13]. Landslide recovery time after large earthquake and extreme rainfall events is a key factor for watershed management and has been assessed by several methods. The landslide recovery time was estimated as 2 years by assessing the landslide activity after the 2005 Kashimir earthquake in northern Pakistan [
2]; 3–4 years by observing the number and area of annual landslides after the 2008 Wenchuan earthquake in Sichuan, China [
5,
14]; and 5 years by assessing the ratios of the annual decline in landslide area after Typhoon Morakot in 2009 in southern Taiwan [
7,
8].
The emerging hotspot analysis technique for spatiotemporal analysis has been used by several scholars to investigate the transmission of the COVID-19 virus [
15,
16,
17], explore temporal changes in the volume of capture fisheries [
18], investigate the distribution of traffic accidents [
19,
20], track pollutant emissions [
21], and analyze the relationship between urban growth and urban fire [
22]. Moreover, this new technique has been used to explain the patterns and characteristics of the long-term landslide evolution after extreme-rainfall-induced landslide events in Taiwan [
12,
13]. Spatiotemporal analysis has been used to explore the spatiotemporal distribution of landslide hotspots [
12] and analyze differences in landslide spatiotemporal distribution based on different bin sizes [
13] in the landslide-prone watersheds in southern Taiwan. The traditional hotspot analysis approach considers the spatial distribution and clustering of landslides by using a specific time database; by contrast, the emerging hotspot analysis technique can consider the spatial distribution and clustering of landslides by using multiple time databases. The new technique can provide spatiotemporal plots of landslide hotspots, which can be used to explain changes in the spatial patterns and distributions of landslides over time. Accordingly, the spatiotemporal distribution of landslide clustering can be used to explain landslide recovery and watershed evolution in the years that follow severe landslide events.
Southwestern Taiwan experienced substantial rainfall during Typhoon Morakot in 2009. Consequently, severe landslides, including the well-known Xiaolin landslide, occurred in the Chishan river watershed [
7,
8]. The sediment yield induced by this typhoon in the Chishan river watershed was estimated to exceed 10
8 m
3 [
23]. Therefore, this study investigated the effect of the typhoon-induced sediment yield on watershed evolution in the years that followed Typhoon Morakot. The spatial and temporal changes in landslide clustering intensity in the landslide-prone watershed have never been discussed. This study focused on explaining the spatial and temporal changes in landslide clustering intensity in the landslide-prone watershed in Taiwan by using spatiotemporal analysis and the Z-score of the Getis–Ord formula. The study also compared the landslide recovery after the 1999 Chichi earthquake (
ML = 7.2) with that after Typhoon Morakot in 2009 in the Chishan river watershed to determine the differences between and characteristics of the recovery processes after earthquake- and rainfall-induced landslides. The long-term observation of the evolution of landslides in the Chishan river watershed could provide valuable insights for understanding landslide recovery and evolution in southern Taiwan.
2. Research Area
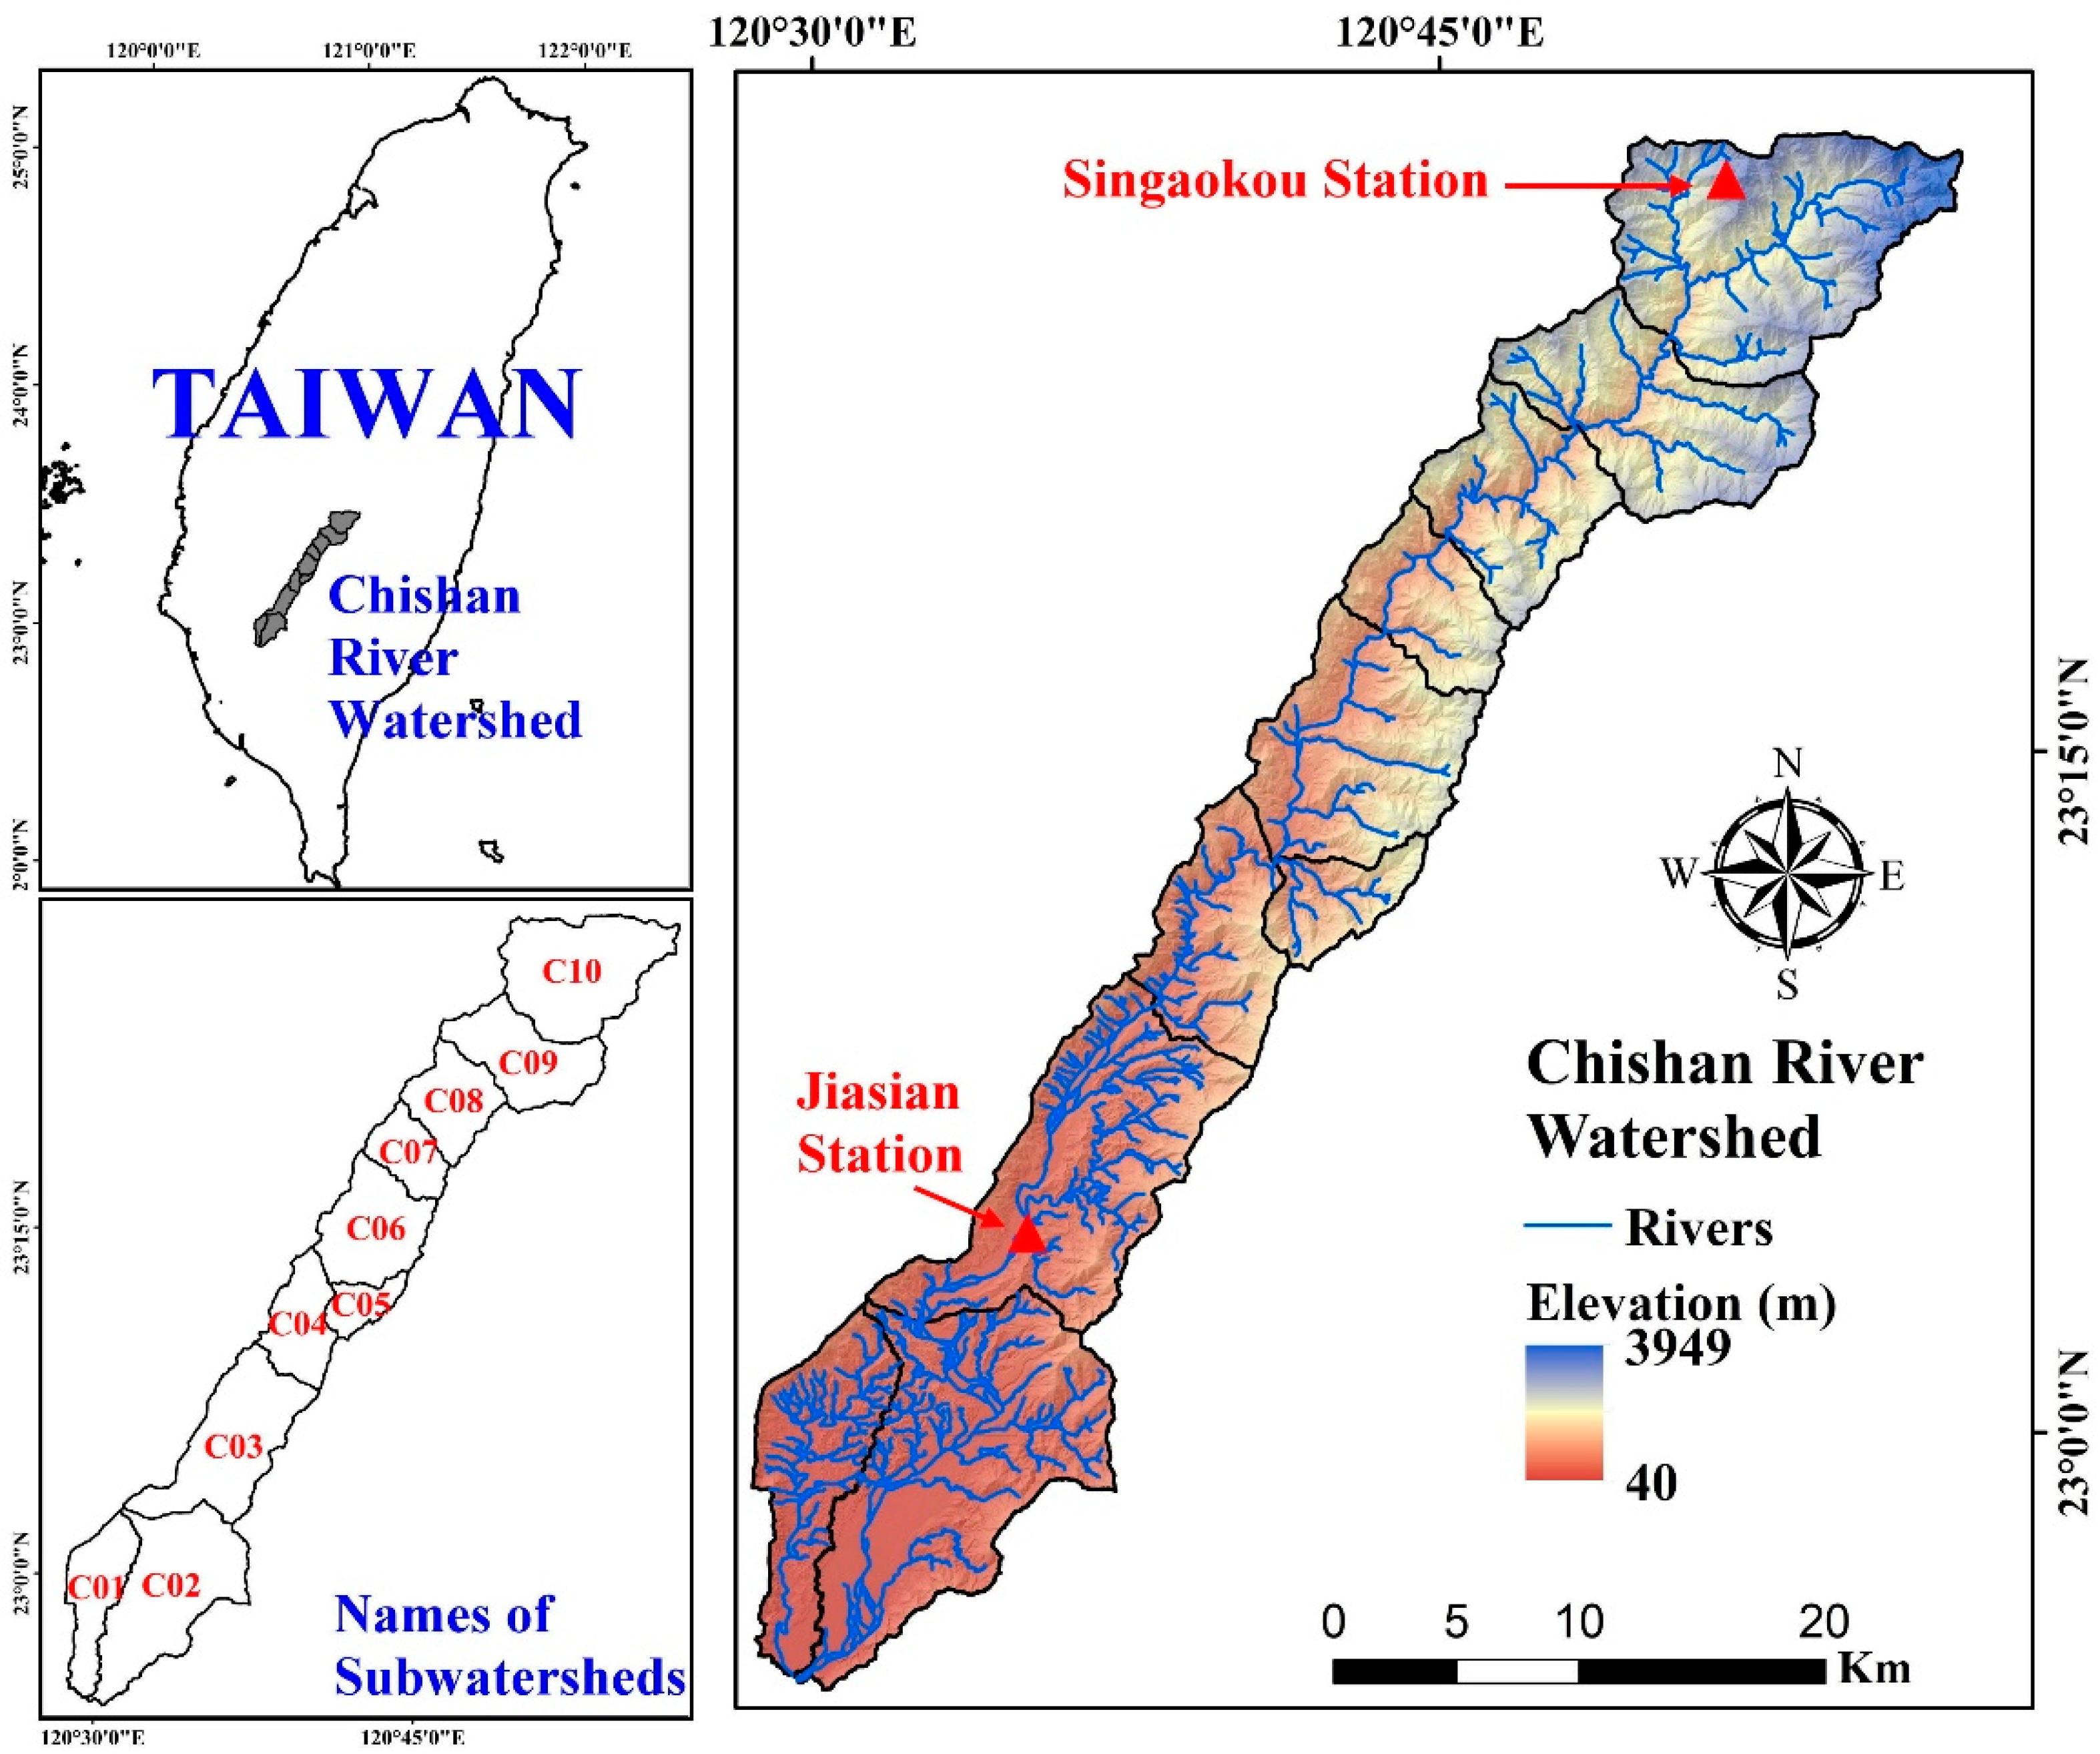
The study area was the Chishan river watershed in southwestern Taiwan and covered an area of 612.8 km
2 (
Figure 1). The elevation in the study area ranged from 40 to 3950 m above sea level, and the area with elevation <1000 m occupied 51.9% of the study area. The slope in the study area ranged from 0 to 85°, and more than 79.3% of the total study area had a slope <40°. Around 88.2% of the study area was covered by natural forest and agriculture. The Chishan river was the main river in the study area, and its average discharge was 30.1 m
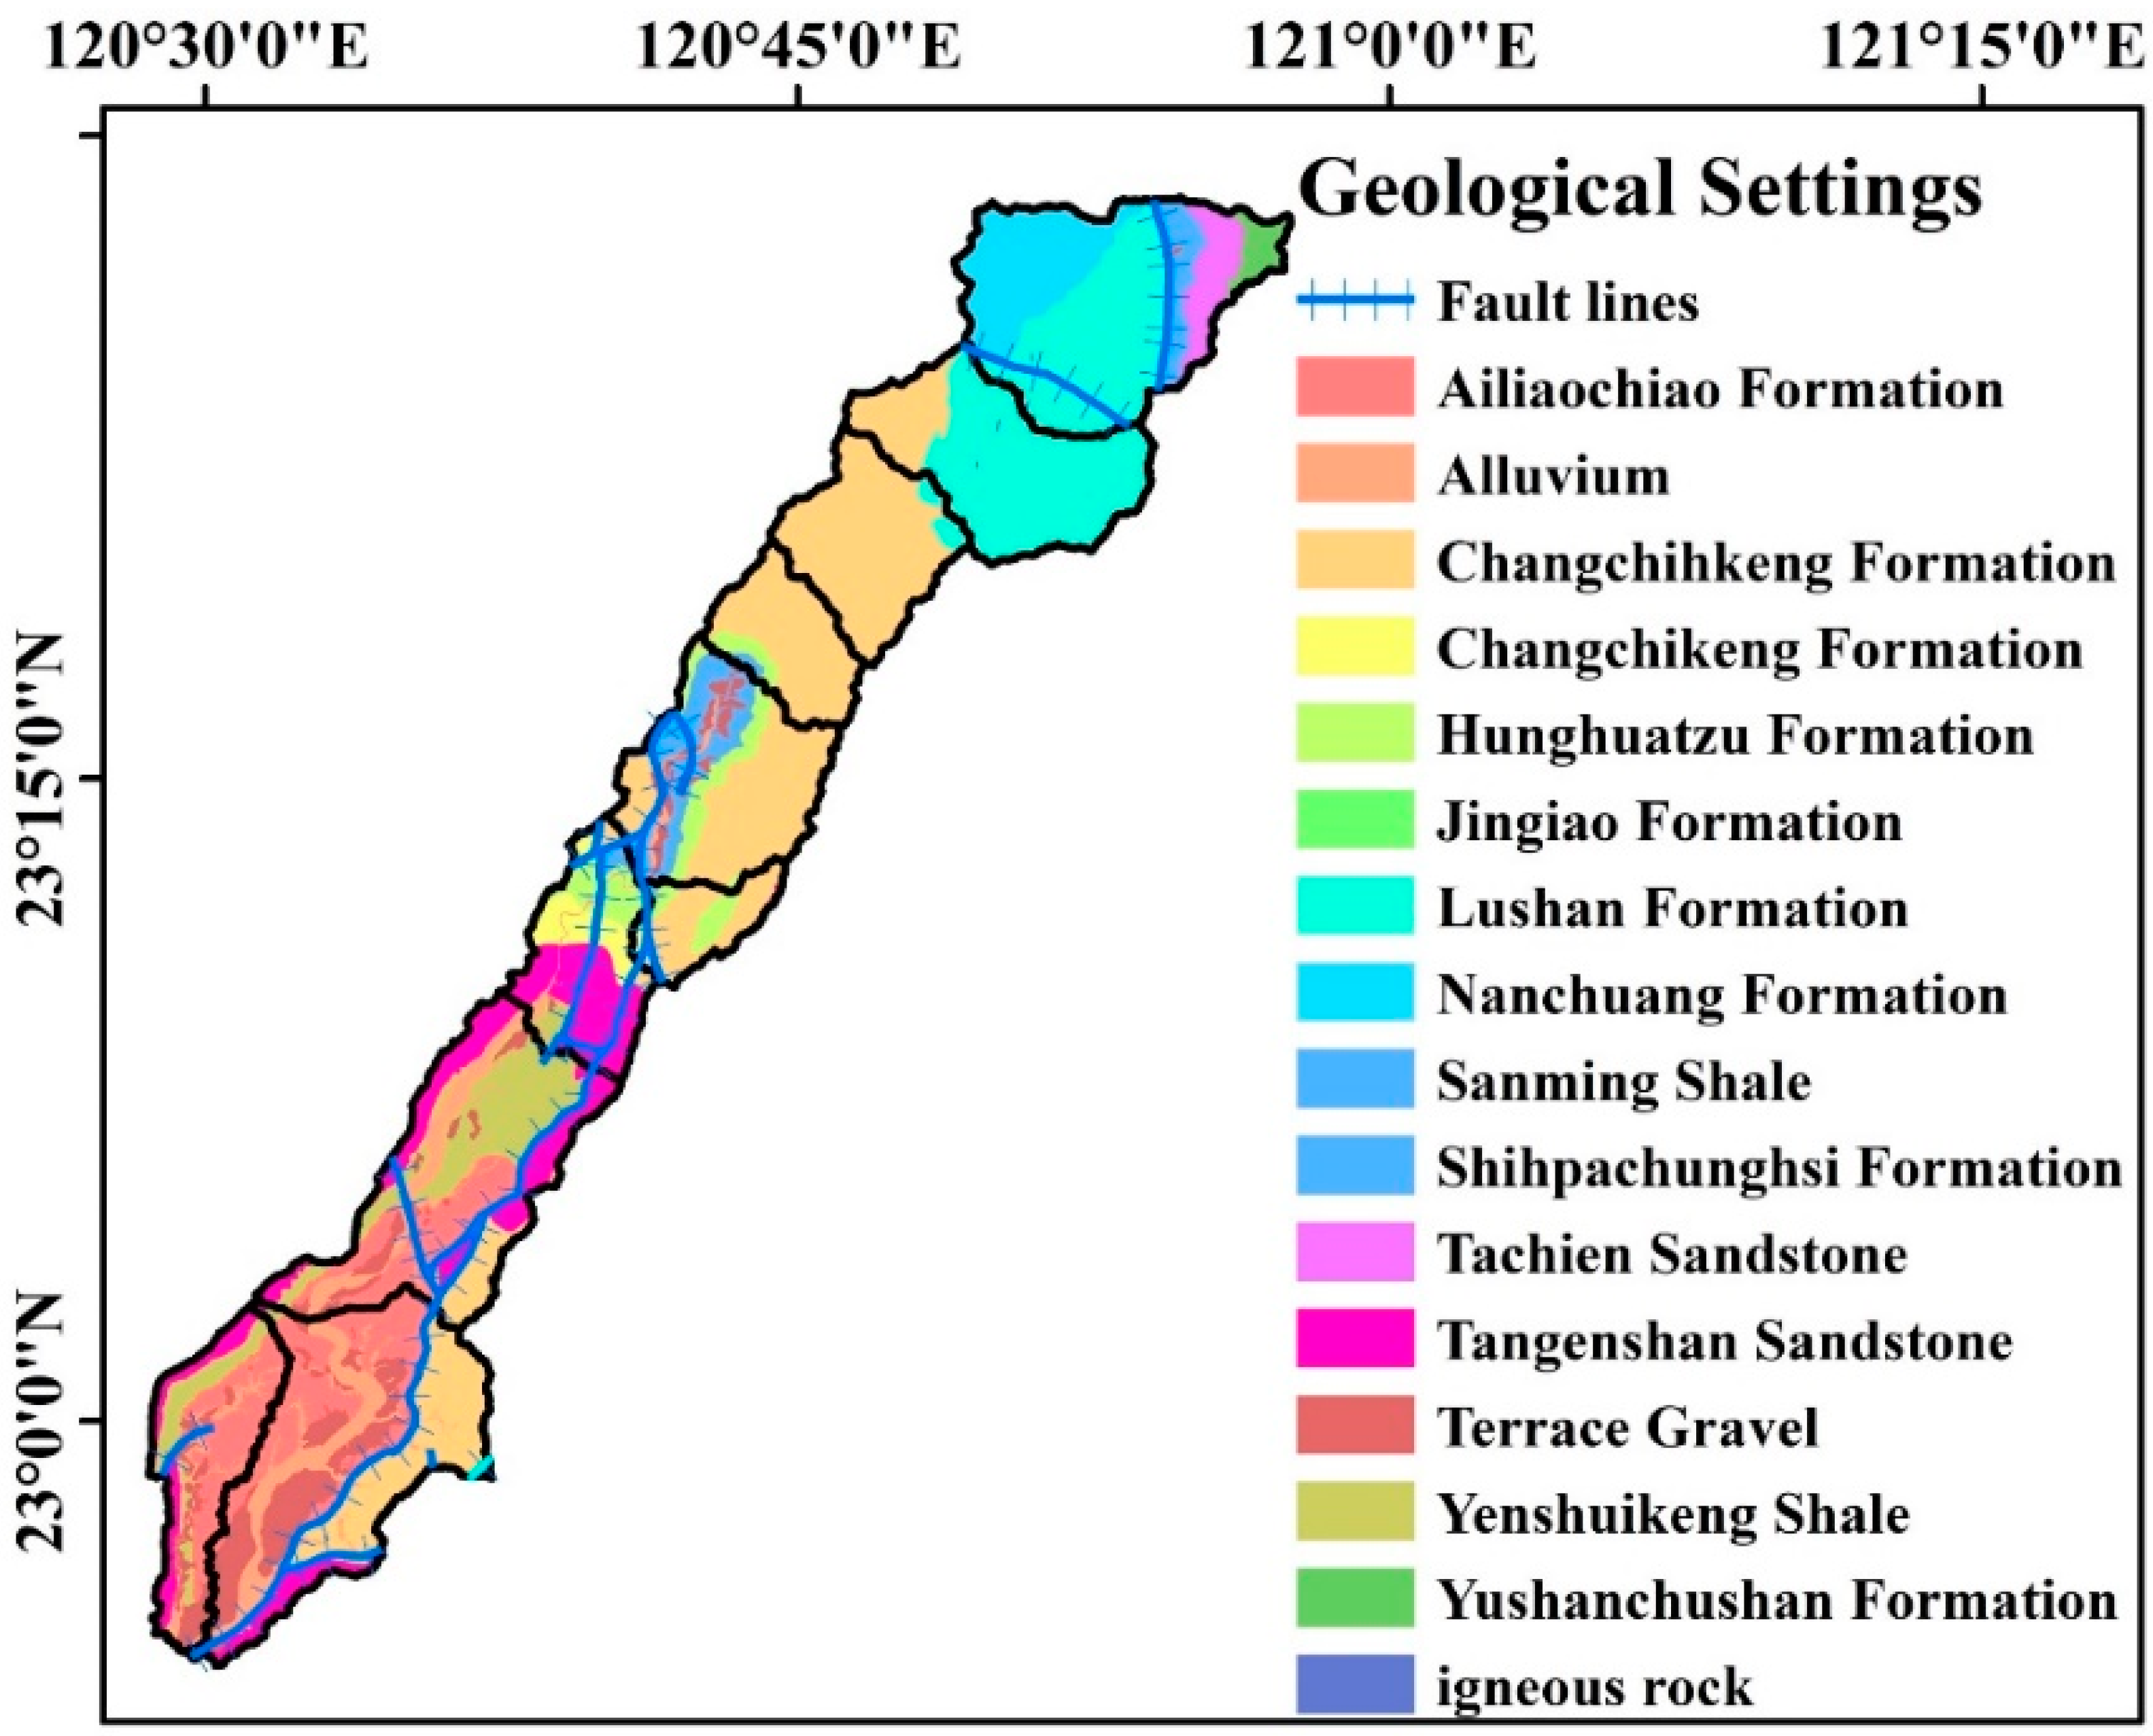
3/day. The study area was surrounded by 11 faults (
Figure 2), including 2 faults passing through the C10 watershed (
Figure 1) and 9 faults passing through the C01 to C06 subwatersheds (
Figure 1). The lithology in the study area was characterized by sandstone, shale, clay, slate, and interlayered sandstone and shale from the mid-Miocene to the Holocene. The weak geological formations in the study area lead to poor lithologic resistance to landslides and erosion, and the decadal erosion rate was estimated to be around 30 mm/year [
24]. The mean suspended-sediment concentration measured at the Shanlin bridge in the downstream of the Chishan river watershed was 696 ppm, and the annual sediment yield was estimated to be around 1.06 Mt/year [
24].
The average annual rainfall at the Jiasian (low altitude,
Figure 1) and Singaokou rainfall stations (high altitude,
Figure 1) was around 2845 mm in 1951–2020 and 2908 mm in 1983–2020. The accumulated rainfall in the rainy season (from May to October) occupied >80% of the annual rainfall in the Chishan river watershed [
18], and the heavy rainfall and typhoon events from June to September were the main reasons why. The Chishan river watershed is prone to natural disasters (e.g., floods, soil erosion, landslides, and debris flow). The two main geohazards in the Chishan river watershed are landslides and debris flow, and the main landslide-trigger event in 1999–2017 was Typhoon Morakot in 2009. Typhoon Morakot dumped record-breaking rainfall, over 2000 mm in 4 days, and caused very serious landslide disaster events in the Chishan river watershed [
7]. As of 2021, the ratio and severity of extreme-rainfall-triggered landsliding from Typhoon Morakot in southern Taiwan were historical highs. Based on the rainfall record of the Jiasian rainfall station, the accumulated rainfall during Typhoon Morakot was 2142 mm, 72.3% of the annual rainfall in 2009. During Typhoon Morakot, there was 31.5 km
2 of landslide area, including 3.8 km
2 and 12.3 km
2 located in the upslope and downslope, respectively, in the Chishan river watershed, and the landslide ratio was estimated to be larger than 7.0% [
7]. There were also 39 potential debris flow torrents in the Chishan river watershed in 2021.
4. Results
4.1. Annual Rainfall and Landslide Records in 1999–2017
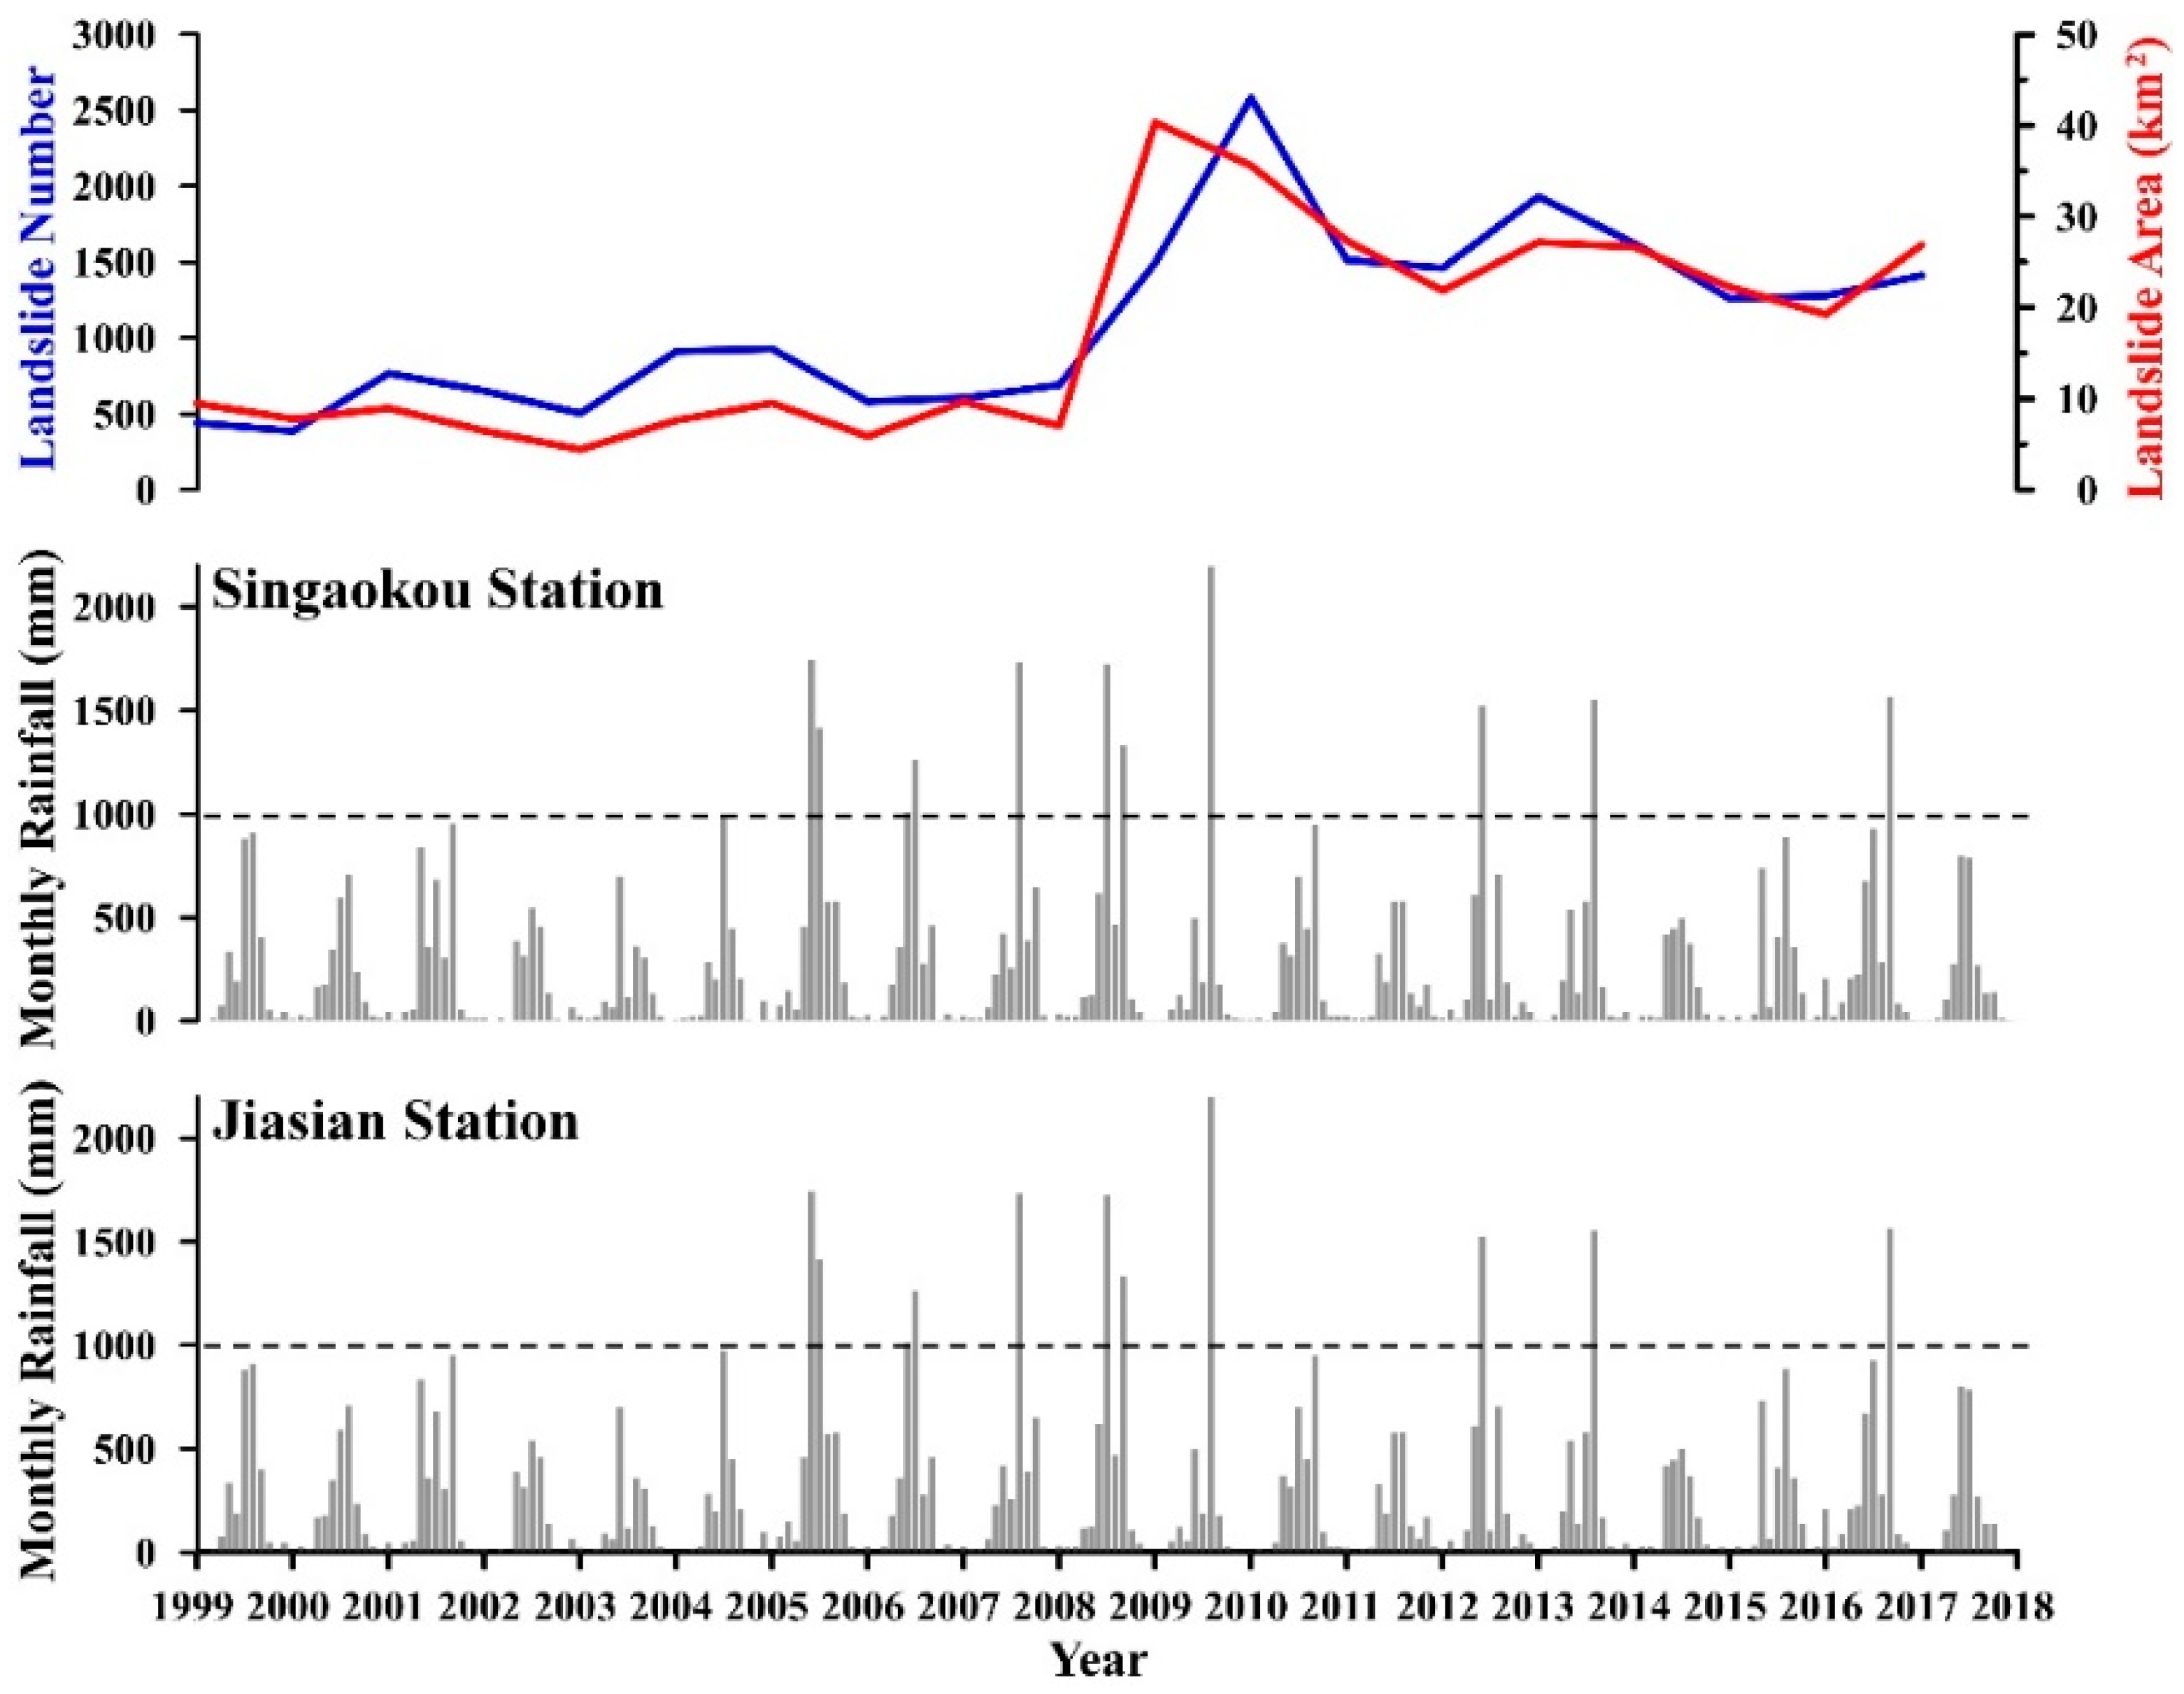
The annual rainfall data from the Jiasian and Singaokou stations were used to analyze the temporal changes in annual rainfall in the Chishan river watershed during 1999–2017. The rainfall characteristics of the Chishan river watershed during 1999–2017 are presented in
Figure 4 and summarized in
Table 3. At the Jiasian station, the average annual rainfall during 1999–2017 was higher than that during 1950–2020; moreover, at the Singaokou station, the average annual rainfall during 1999–2017 was higher than that during 1983–2020. The annual rainfall during 1999–2017 was higher than that during 1950–1998. The accumulated rainfall in the rainy season at the Jiasian station during 1999–2017 accounted for 92.2–93.8% of the average annual rainfall, and that at the Singaokou station accounted for 78.6–82.8%. Typhoon Morakot in 2009, a heavy-rainfall event with a return period of >200 years [
7], was the strongest heavy-rainfall event during 1999–2017 in the Chishan river watershed. This study compared the rainfall characteristics before and after Typhoon Morakot.
The accumulated rainfall in the rainy seasons, i.e., from May to October, and the number of monthly rainfalls >1000 mm at the Jiasian and Singaokou stations were used to describe the temporal distribution during 1999–2008 in the Chishan river watershed. The accumulated rainfall in the rainy seasons and the number of monthly rainfalls >1000 mm during 1999–2008 were greater than or close to those during 2009–2017. Using empirical equations provided in the regulations on soil and water conservation in Taiwan, this study estimated that the amounts of daily rainfall with return periods of 50 and 200 years were 601.3 and 704.3 mm, respectively, at the Jiasian rainfall station and 607.6 and 711.6 mm, respectively, at the Singaokou rainfall station. During 1999–2017, the numbers of daily rainfall events in which the amount of rainfall exceeded 601.3 mm at the Jiasian station and 607.6 mm at the Singaokou station were two and three, respectively. The two events recorded at the Jiasian station were Typhoon Kalmaegi (629.5 mm on 17 July 2008) and Typhoon Morakot (1072.0 mm on 8 August 2009), and the three events recorded at the Singaokou station were Typhoon Kalmaegi (609.5 mm on 9 June 2005), Typhoon Morakot (833.0 mm on 8 August 2009), and Typhoon Morakot (780.0 mm on 9 August 2009). The rainfall characteristics in the Chishan river watershed during 1999–2017 featured plenty of rainfall with high rainfall intensity, concentrated in the rainy seasons. These results indicated that the strengths of rainfall-induced landslides during 1999–2008 in the Chishan river watershed were greater than those during 2009–2017, except for the landslides induced by Typhoon Morakot.
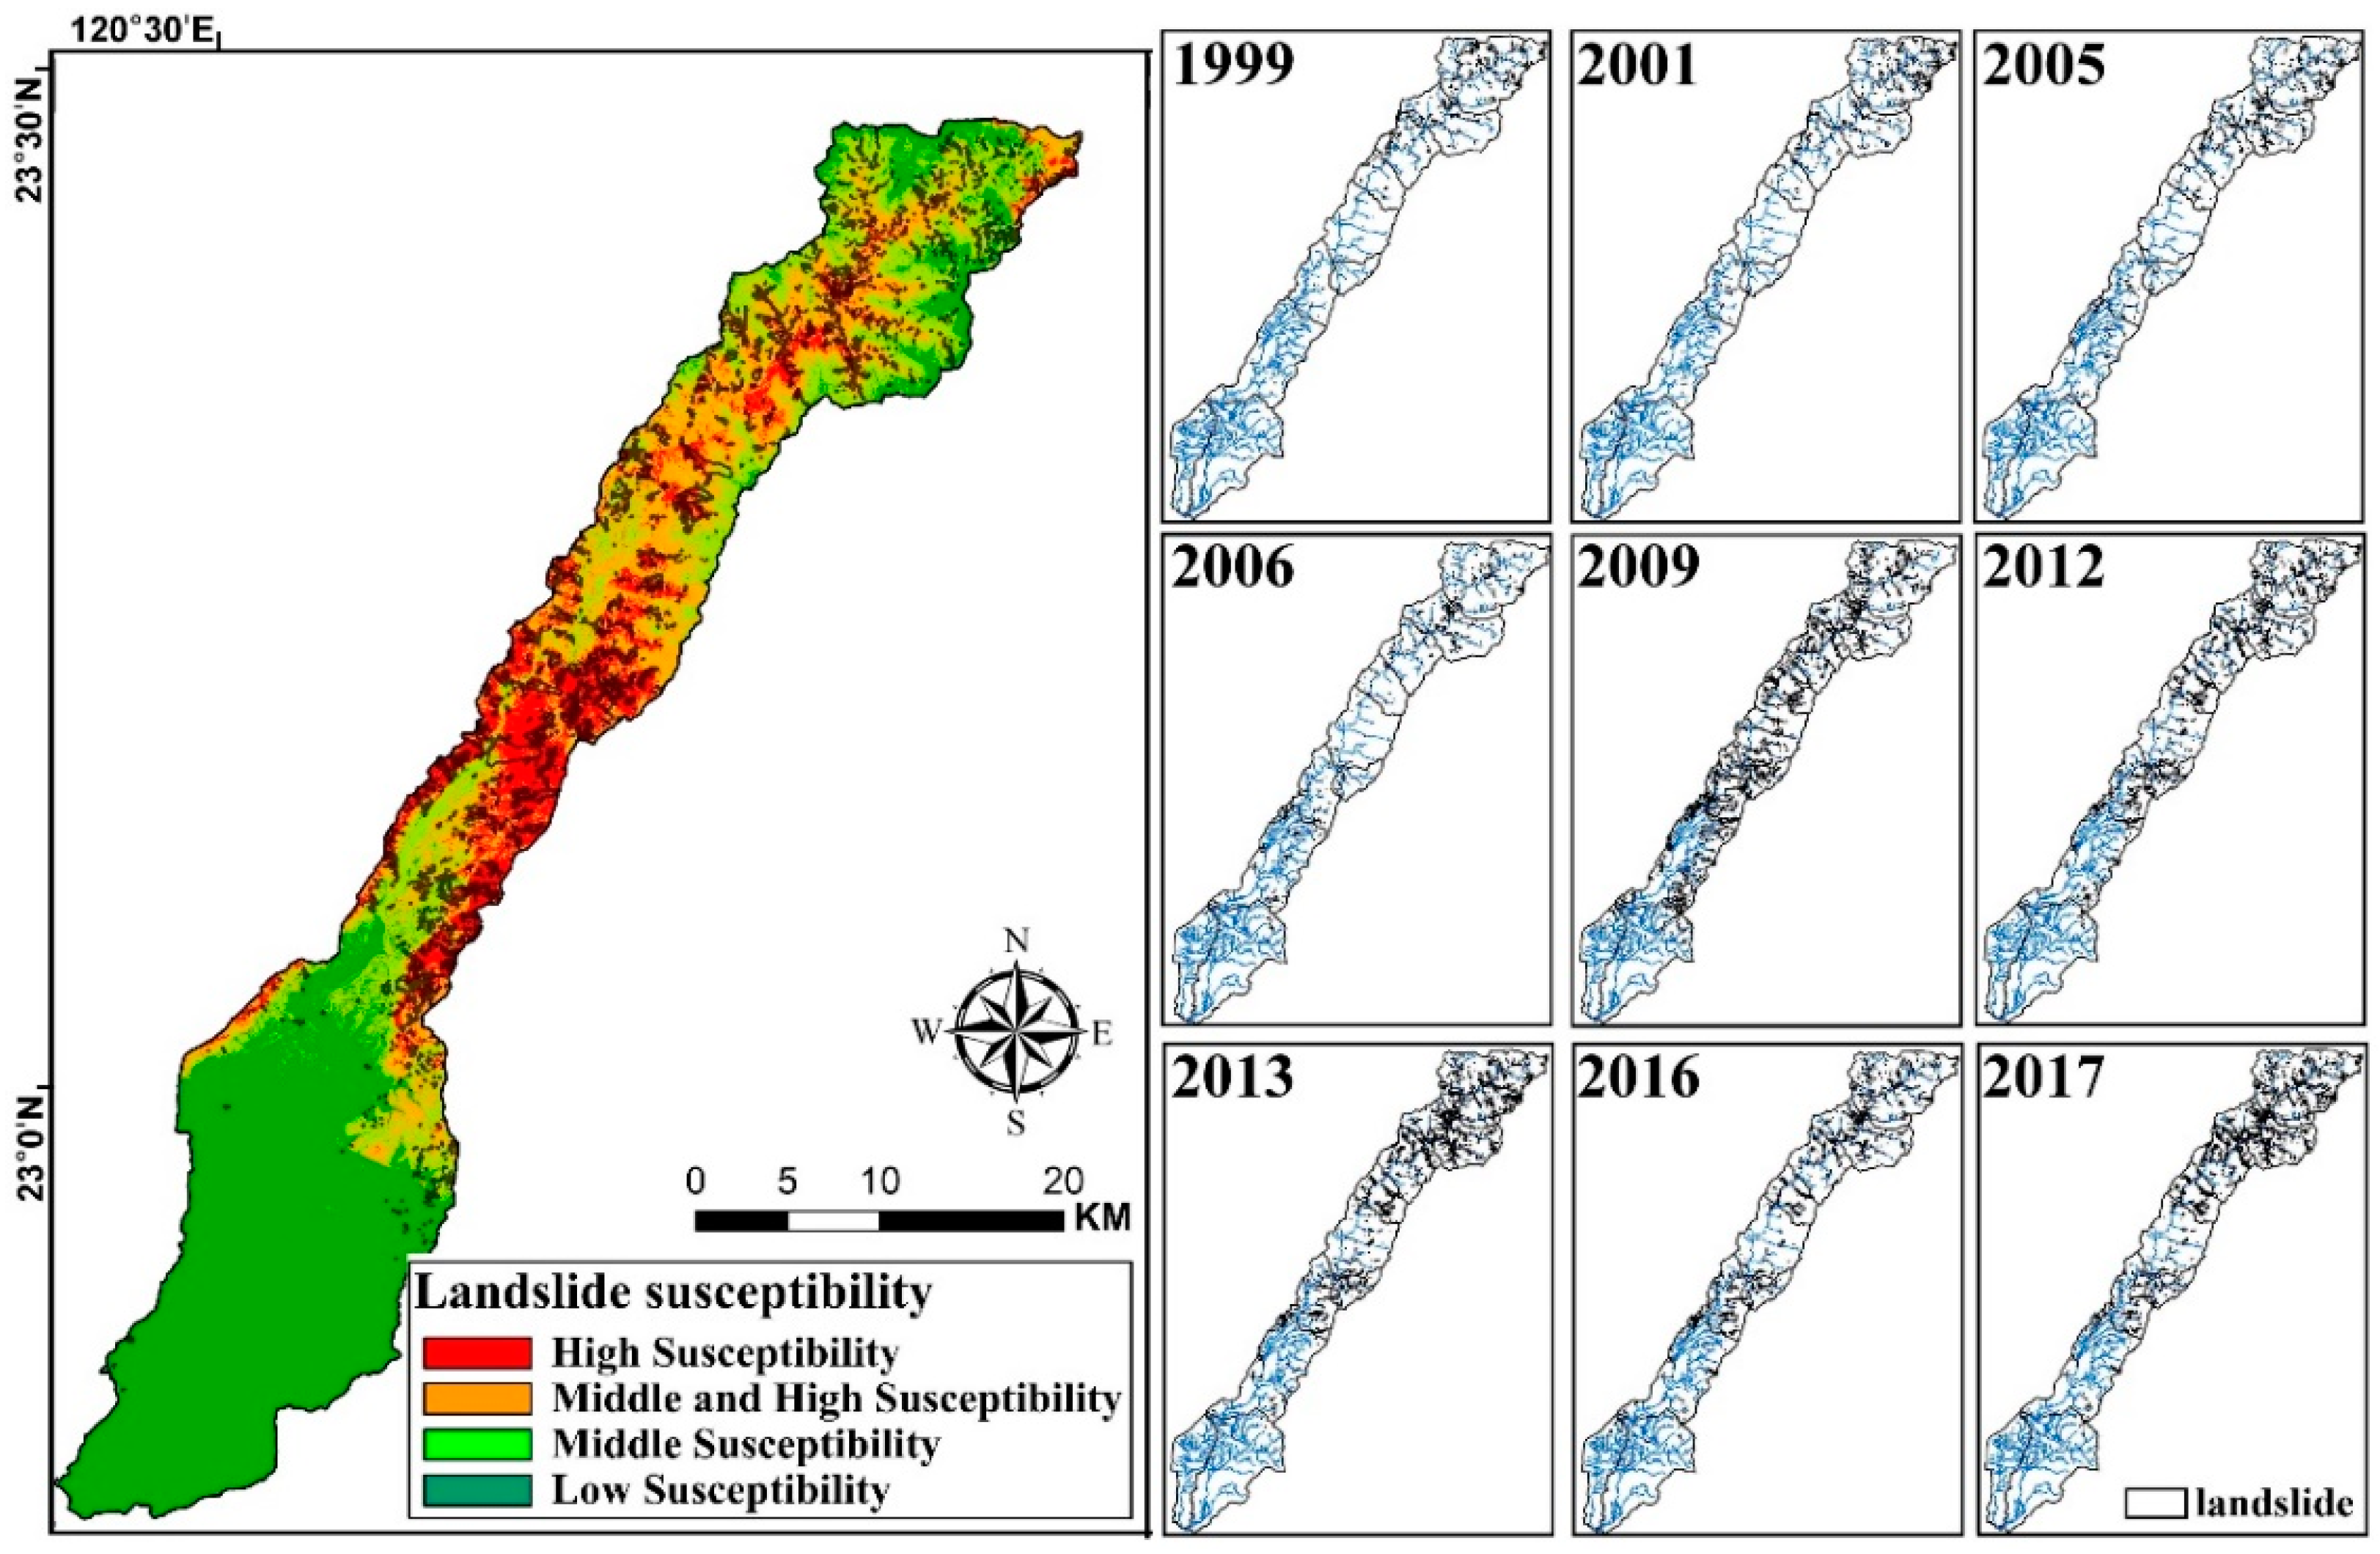
Data on the numbers and areas of landslides during 1999–2017 in the Chishan river watershed were used to explain temporal changes in landslides. The results revealed obvious differences between the numbers and areas of landslides before and after Typhoon Morakot. Analysis of landslide disaster data during 1999–2017 showed that the considerable number of landslide disasters during 2008–2017 was larger than that during 1999–2008. The numbers of landslides were 385–927 during 1999–2008, 1494 after Typhoon Morakot, and 1258–2581 during 2010–2017. The landslide areas were 4.4–9.7 km2 during 1999–2008, 40.4 km2 after Typhoon Morakot, and 19.2–35.6 km2 during 2010–2017. The numbers and areas of landslides during 2010–2017 were 2.8–3.3 and 3.7–4.4 times higher, respectively, than those during 1999–2008. The obvious increases in the numbers and areas of landslides demonstrated the considerable impact of Typhoon Morakot on the landslide susceptibility of the Chishan river watershed.
The frequency of landslides [
13] was defined as the total number of landslides occurring in each grid during 1999–2017, as shown in
Figure 5. This information was used to explain the spatial changes in landslide susceptibility in the Chishan river watershed. Areas with a landslide frequency of 0 accounted for 91.0% of the study area, and those with a landslide frequency of >5 accounted for 3.0% of the area. Areas with a landslide frequency of >5 were concentrated along the rivers and in the sources of rivers in the C04–C10 subwatersheds, especially in the C07–C10 subwatersheds. These results indicated that the landslide distributions during 1999–2017 in the Chishan river watershed were related to the distribution of rivers. The landslide distributions in 1999, 2003, 2005, 2008, 2009, 2012, 2013, 2016, and 2017 in the Chishan river watershed are illustrated in
Figure 4. Landslides were distributed in the C08–C10 subwatersheds before 2009 and then distributed densely in the C03–C10 subwatersheds after Typhoon Morakot. The landslide distribution narrowed, but it was still densely spread in the C04–C05 and C07–C10 subwatersheds during 2010–2017. The upstream subwatersheds, including C07–C10, were always susceptible to landslides, but the midstream subwatersheds, including C04–C05, became susceptible to landslides after Typhoon Morakot.
Rainfall events primarily triggered the evolution of large-earthquake-induced landslides [
1,
4], but they were not the only triggers for the evolution of extreme-rainfall-induced landslides [
7,
8]. According to the spatial and temporal distributions of landslides during 1999–2017, differences existed between the landslide distributions before and after Typhoon Morakot in the Chishan river watershed. Despite the decreasing strength and numbers of rainfall-induced landslides after Typhoon Morakot, the landslide area tended to decrease continuously, but the number of landslides tended to fluctuate in the Chishan river watershed. This fluctuation indicates that recovery from landslides was difficult and that landslides were easily reinduced.
4.2. Certainty Factor Analyses of Landslide Occurrence in 1999–2017
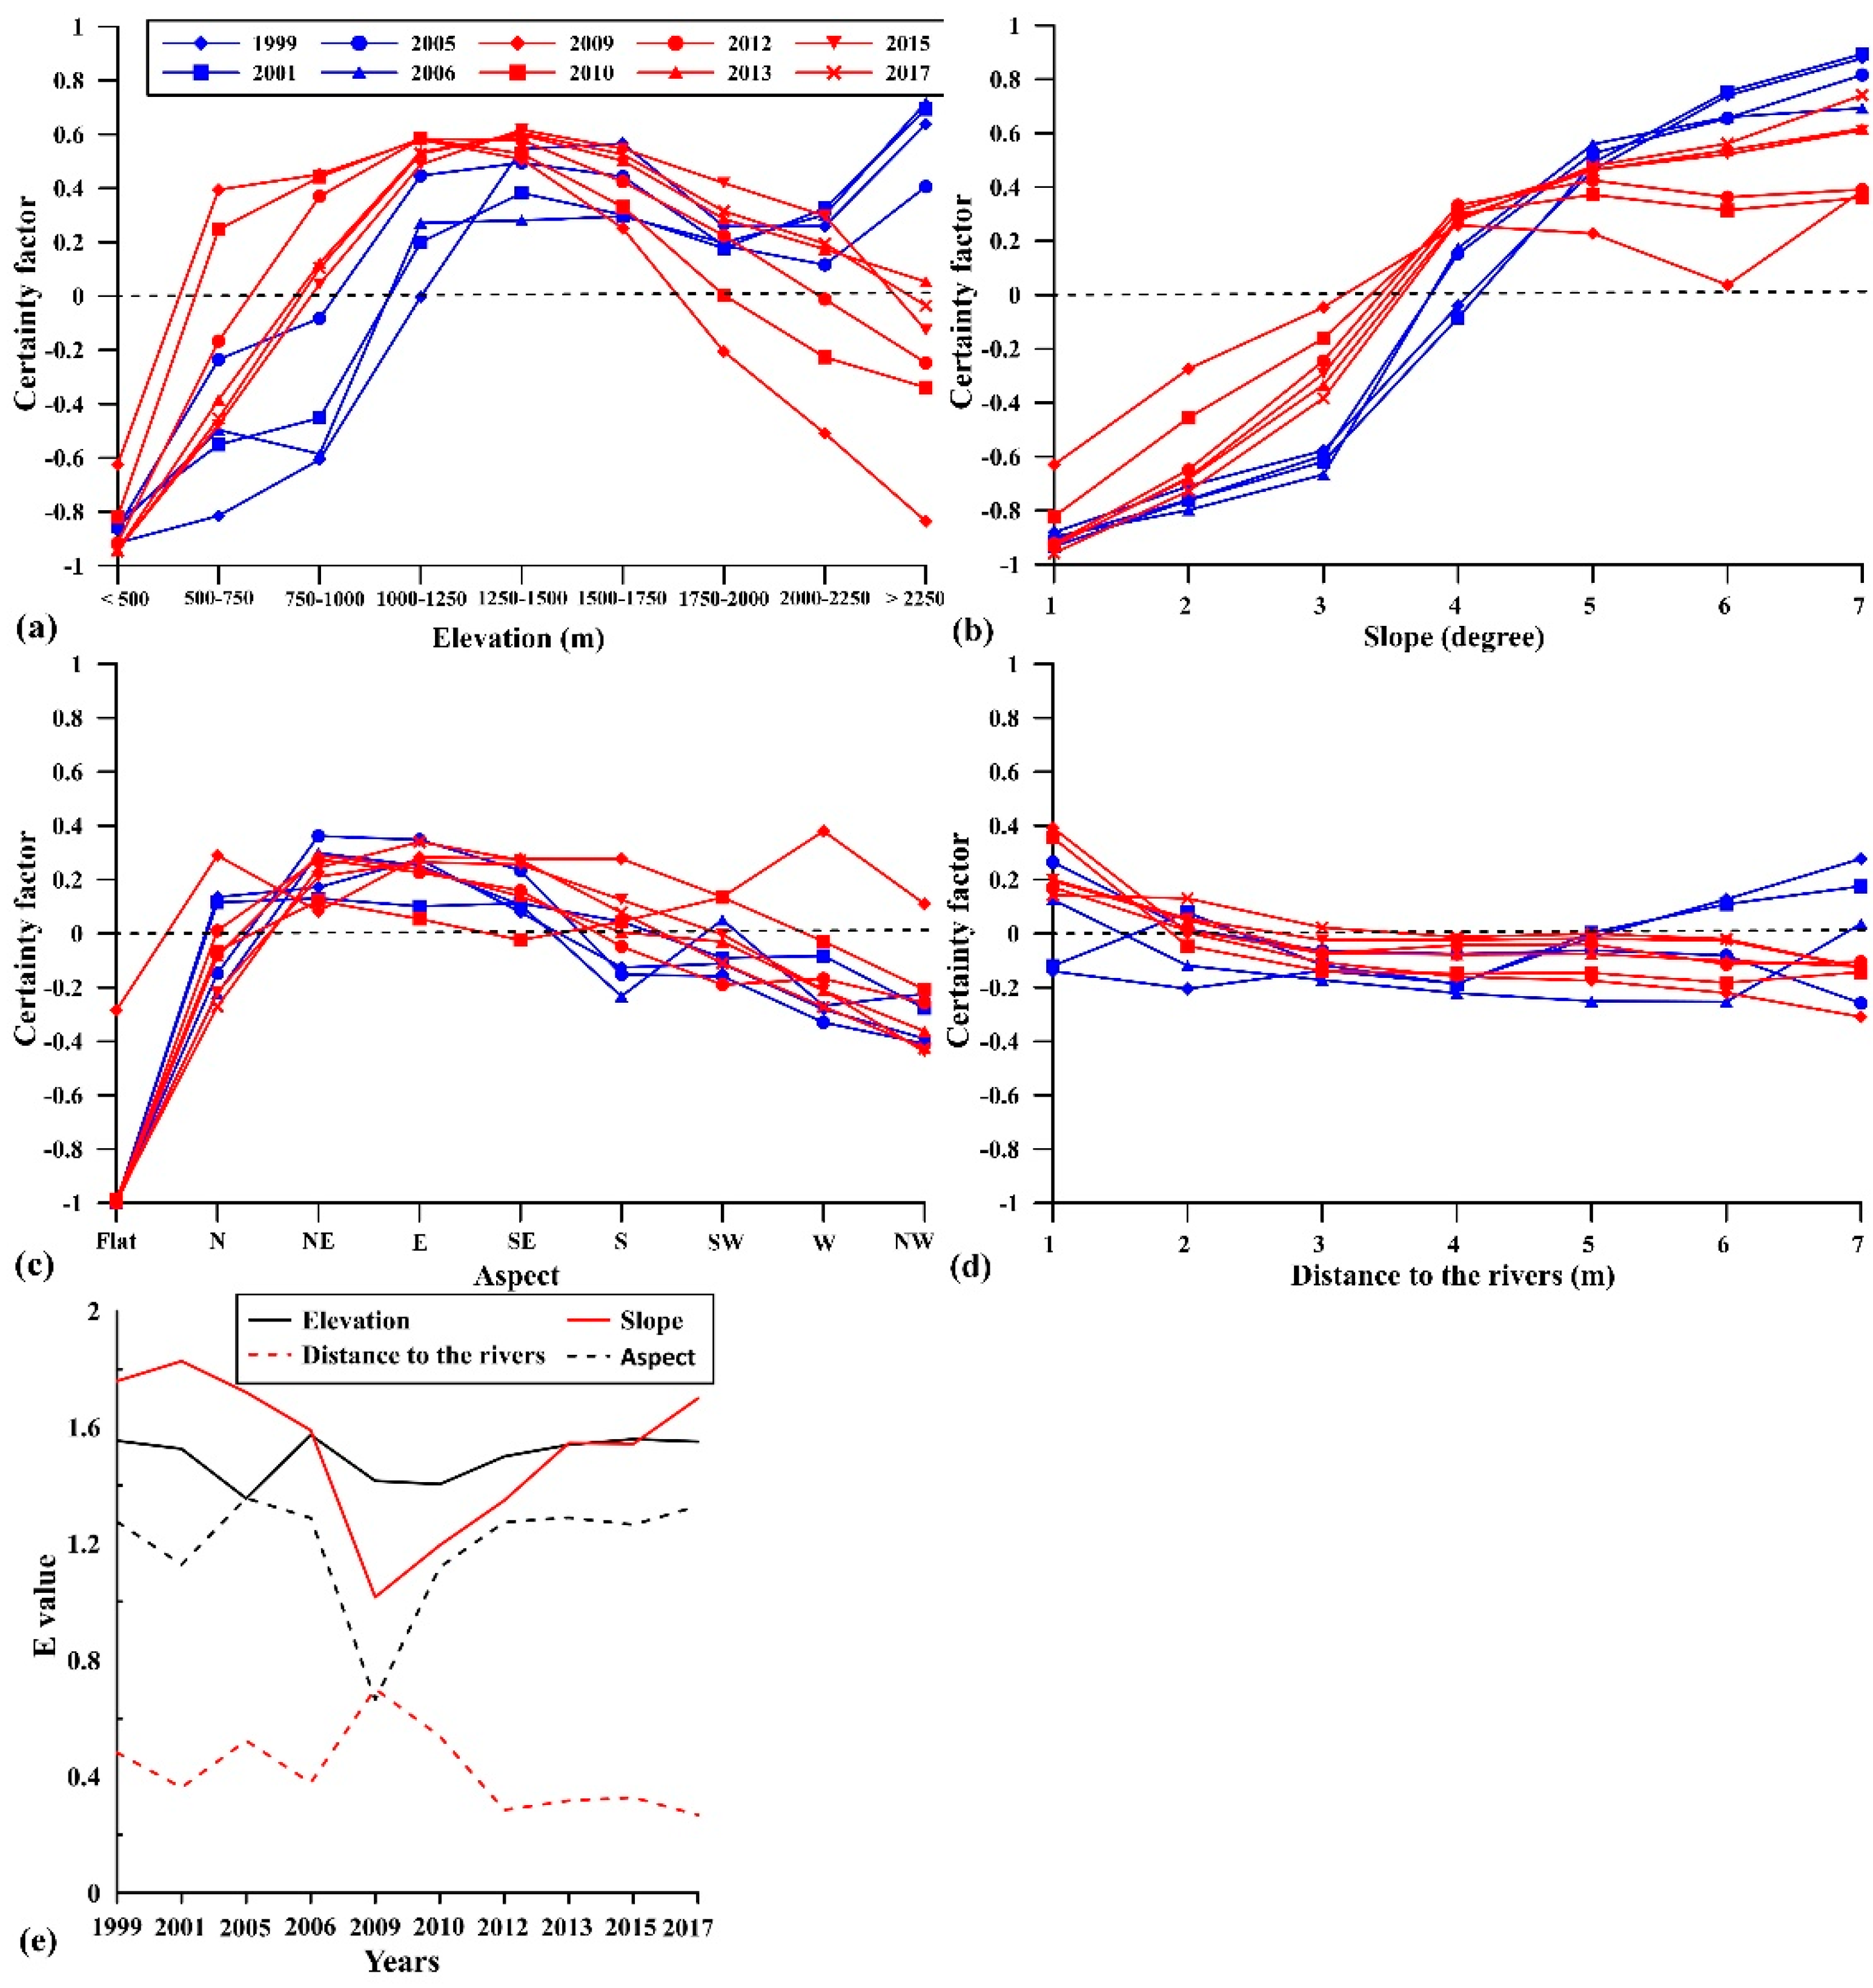
This study applied a certainty factor to analyze the effectiveness of four geomorphologic factors—namely elevation, slope, aspect, and distance to rivers—at affecting the occurrence of landslides during 1999–2017 in the Chishan river watershed by using the landslide inventories of 1999, 2001, 2005, 2006, 2009, 2010, 2012, 2013, 2015, and 2017. Most of the landslides in the Chishan river watershed were induced by rainfall events. The analysis results obtained in the Chishan river watershed by using the certainty factor were compared with those obtained in other earthquake-induced landslide areas [
6,
31].
Figure 6 presents the relationships between landslide occurrence and the four geomorphologic factors.
Positive certainty factor values were derived in areas with elevations of >1000 m during 1999–2008. Moreover, the certainty factor values in areas with elevations of >2000 m increased with time. In 2009, positive certainty factor values were obtained in areas with elevations of 500–1750 m, but the certainty factor values in the areas with elevations of >2000 m were negative. The certainty values in areas with elevations of <1000, 1000–1750, and >1750 m decreased, were positive, and increased, respectively. In areas with elevations of >2000 m, recovery from landslides was difficult, and landslides were easily reinduced, as determined on the basis of the long-term distribution of certainty factor values with respect to elevation during 1999–2017. The areas in which recovery from landslides was difficult and in which landslides were easily reinduced were determined to be valuable for the analysis of landslide evolution. The elevations of these areas in the Chishan river watershed after Typhoon Morakot were similar to the elevations observed after the 2008 Wenchuan earthquake in Sichuan, China [
6].
The areas with positive certainty factor values during 1999–2008, 2009, and 2010–2017 in the Chishan river watershed had slopes of >40°. The certainty factor values in these areas during 2010–2017 increased gradually. The certainty factor values were higher in areas with steeper slopes. In these areas, recovery from landslides was difficult, and landslides were easily reinduced, as determined on the basis of the long-term distribution of the certainty factor values with respect to slope during 1999–2017. The slopes in these areas in the Chishan river watershed after Typhoon Morakot were the same as those observed after the 2008 Wenchuan earthquake in Sichuan, China [
6].
The slopes of the areas with positive certainty factor values during 1999–2008 had NE, E, and SE aspects. After Typhoon Morakot, the slopes of the areas with positive certainty factor values were in all aspects except for the flat aspect. Furthermore, the slopes of the areas with positive certainty factor values during 2009–2017 had N, NE, E, and SE aspects. In the Chishan river watershed, the slopes of the areas with high landslide susceptibility and difficulty recovering from landslides had N, NE, E, and SE aspects, as determined on the basis of the long-term distribution of certainty factor values with respect to aspect during 1999–2017. The aspects of slopes in the landslide-prone areas after large-earthquake-induced landslide events were similar to the directions of earthquake-causing faults [
6], but the aspects of slopes in the landslide-prone areas in the Chishan river watershed after extreme-rainfall-induced landslide events were similar to windward side of the monsoon.
Studies have reported that the surroundings of rivers in upstream watersheds in Taiwan are susceptible to landslides [
9,
10]. This study revealed that the certainty factor values derived in areas within 400 m of rivers in the Chishan river watershed were negative after the 1999 Chichi earthquake event, indicating that the surroundings of rivers are not earthquake-induced landslide-prone areas. The certainty factor values derived in areas within 100 m of rivers were positive during 2005–2008. The certainty factor values reached their maximum during 1999–2017, 0.4, in areas within 100 m of rivers after Typhoon Morakot in the Chishan river watershed. The certainty factor values derived in areas within 100 m of rivers in the Chishan river watershed were greater than 0.15 during 2010–2017, and those derived in areas within 100–200 m of rivers were positive during 2012–2017. These results indicated that in terms of long-term landslide evolution after extreme rainfall or large earthquake events, areas around rivers in the Chishan river watershed had difficulty recovering from landslides, and landslides were easily reinduced in these areas.
The effectiveness index
(E) was used to compare changes in the temporal effect of each factor on landslide occurrence during 1999–2017 in the Chishan river watershed (
Figure 6e). The top two factors affecting landslide occurrence during 1999–2017 were elevation and slope, meaning that landslide location was a major factor affecting landslide evolution in the Chishan river watershed. Distance to rivers did not seem to have a clear effect on landslide evolution in the Chishan river watershed. Distance to rivers had the lowest effectiveness index (
E) among all four factors, and its effectiveness index decreased rapidly after Typhoon Morakot.
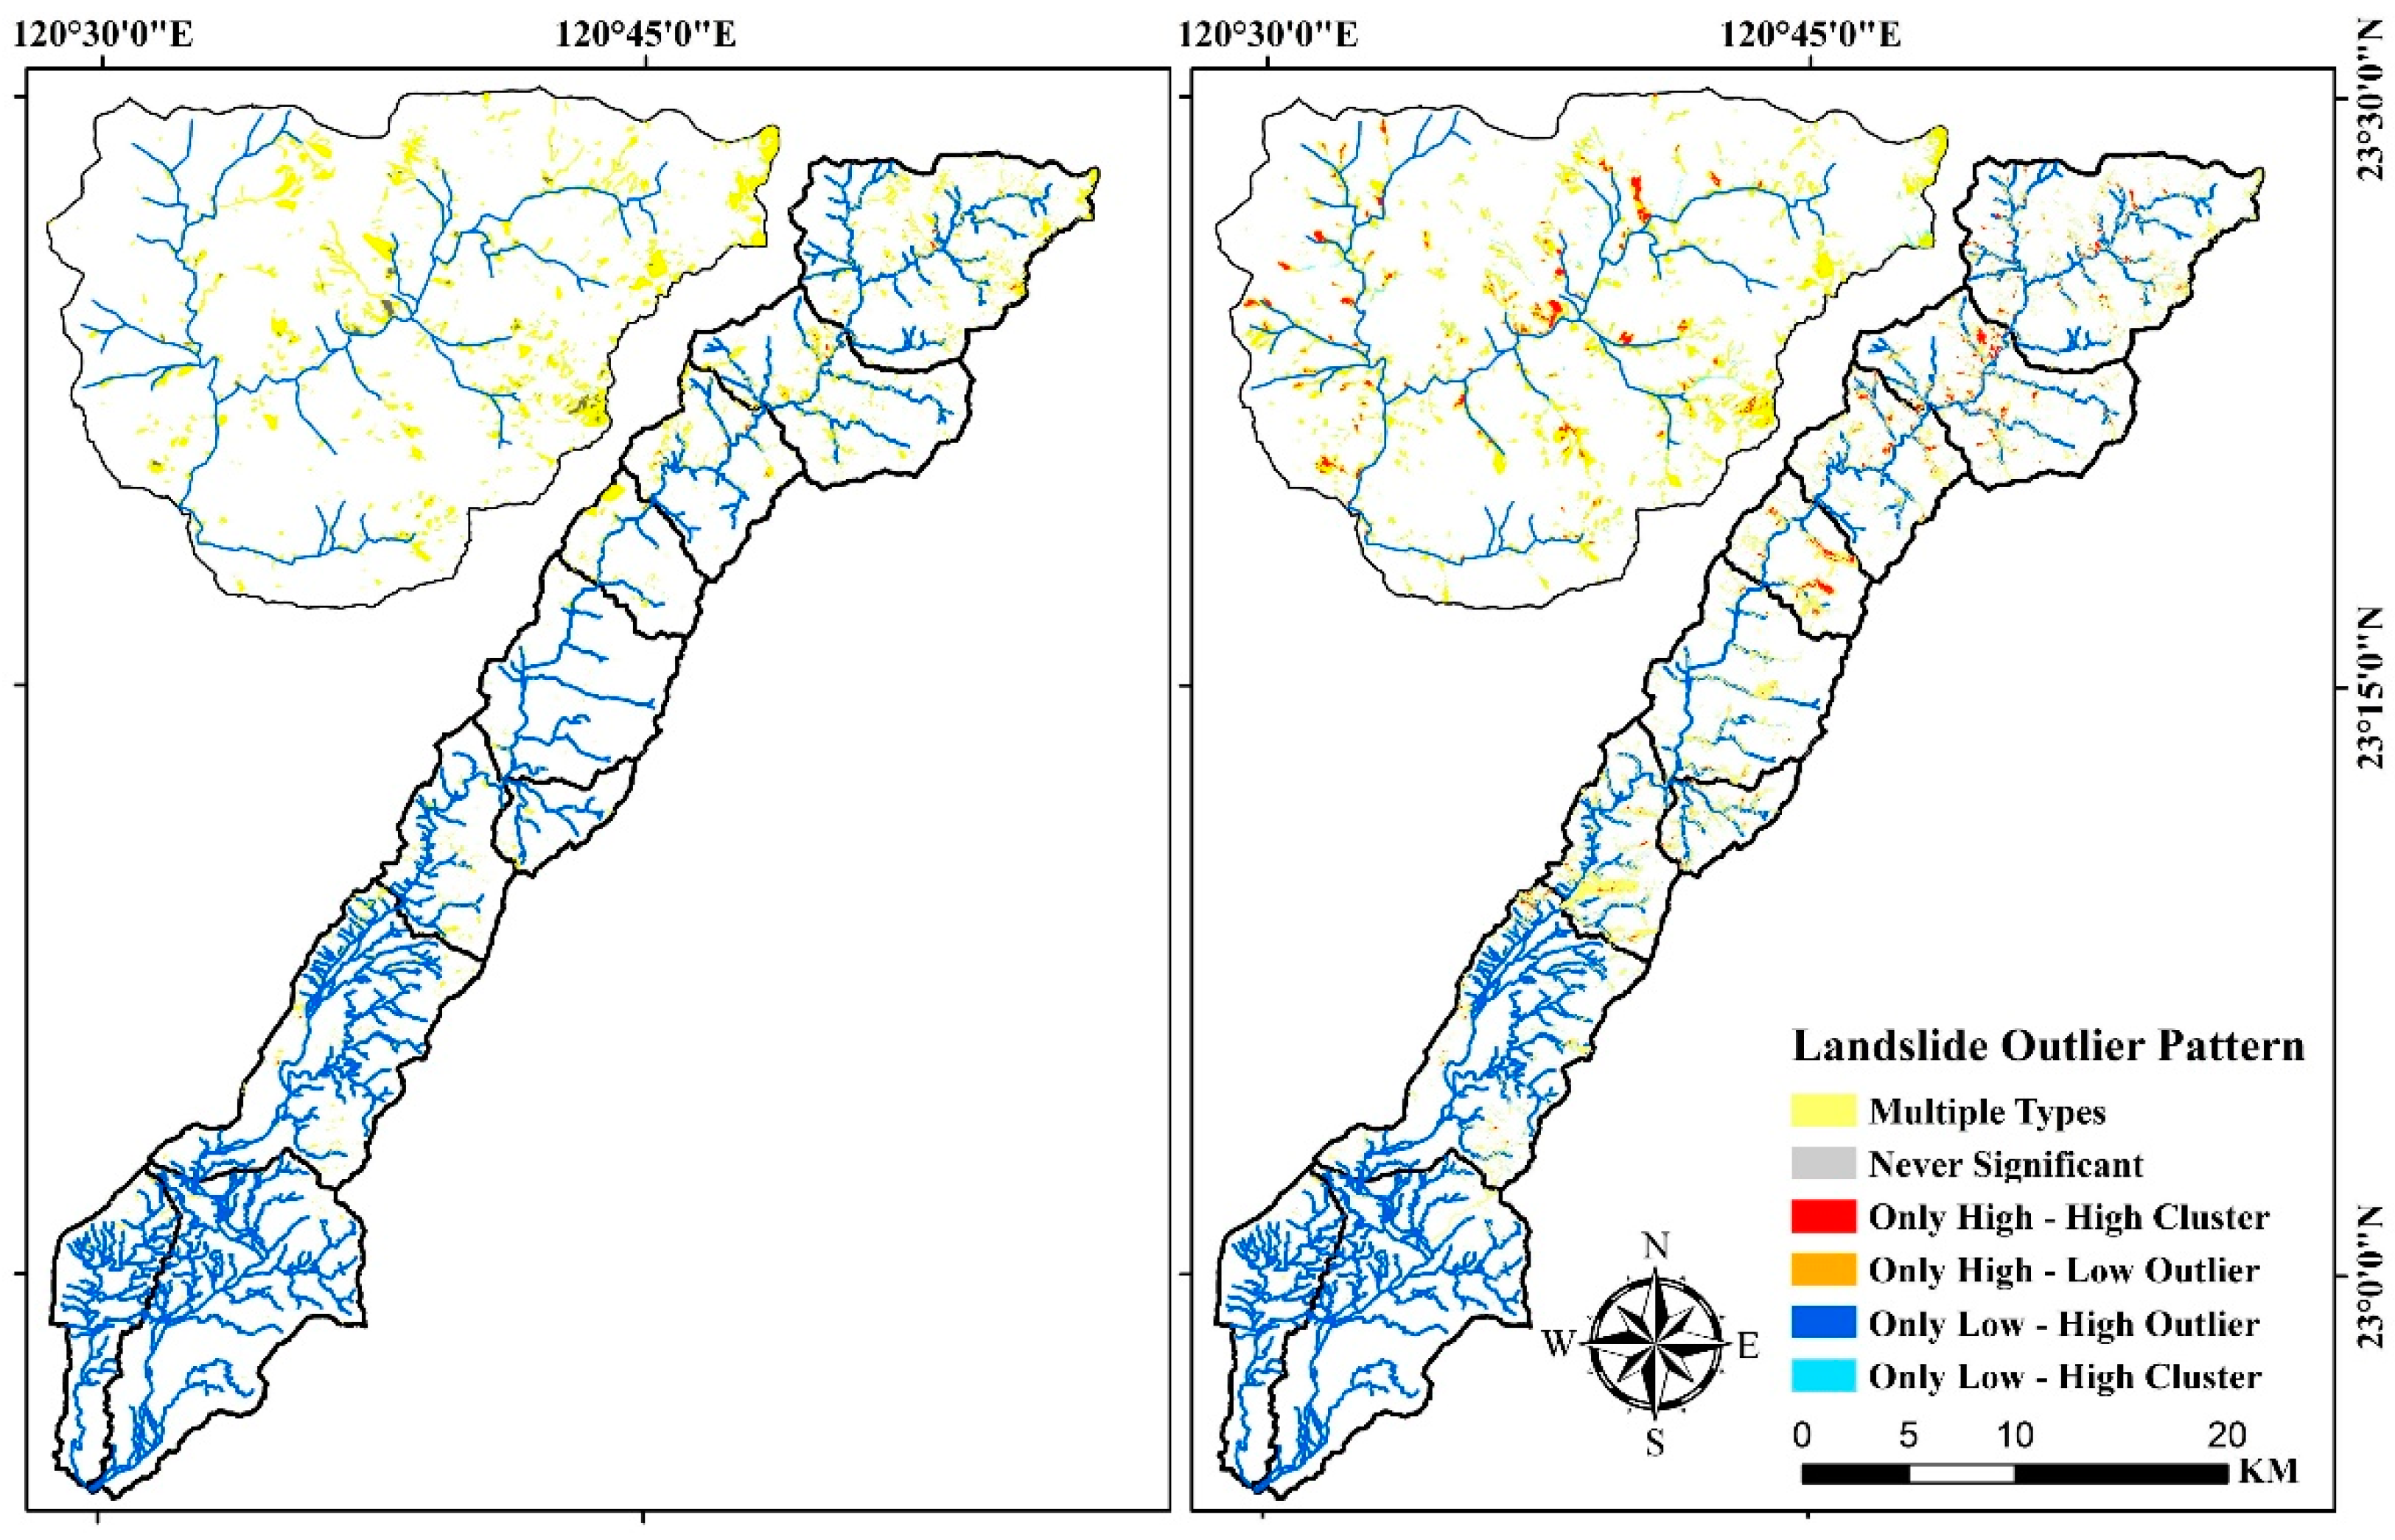
4.3. Result of Local Outlier Analysis
The study conducted local outlier analysis to recognize the bins with landslide spatiotemporal statistical significance by using the local Anselin Moran’s I index, and the statistical results are shown in
Table 4. The multiple type dominated the spatiotemporal clustering pattern of landslide evolution during 1999–2008 and 2008–2017 in the Chishan river watershed. The areas of only high–high and low–low cluster patterns during 2008–2017 in the Chishan river watershed were obviously larger than those during 1999–2008. The distribution trend of the spatiotemporal clustering patterns of landslide evolution in the C10 subwatershed was similar to that in the Chishan river watershed. The distribution maps of local outlier analysis in the C10 subwatershed and Chishan river watershed are shown in
Figure 7. The multiple types were widely spread in the C04 to C10 subwatersheds from 1999–2008 to 2008–2017. The only high–high clusters were recognized in the source areas of creeks and the neighborhoods of sinuous rivers, especially in the C10 subwatershed.
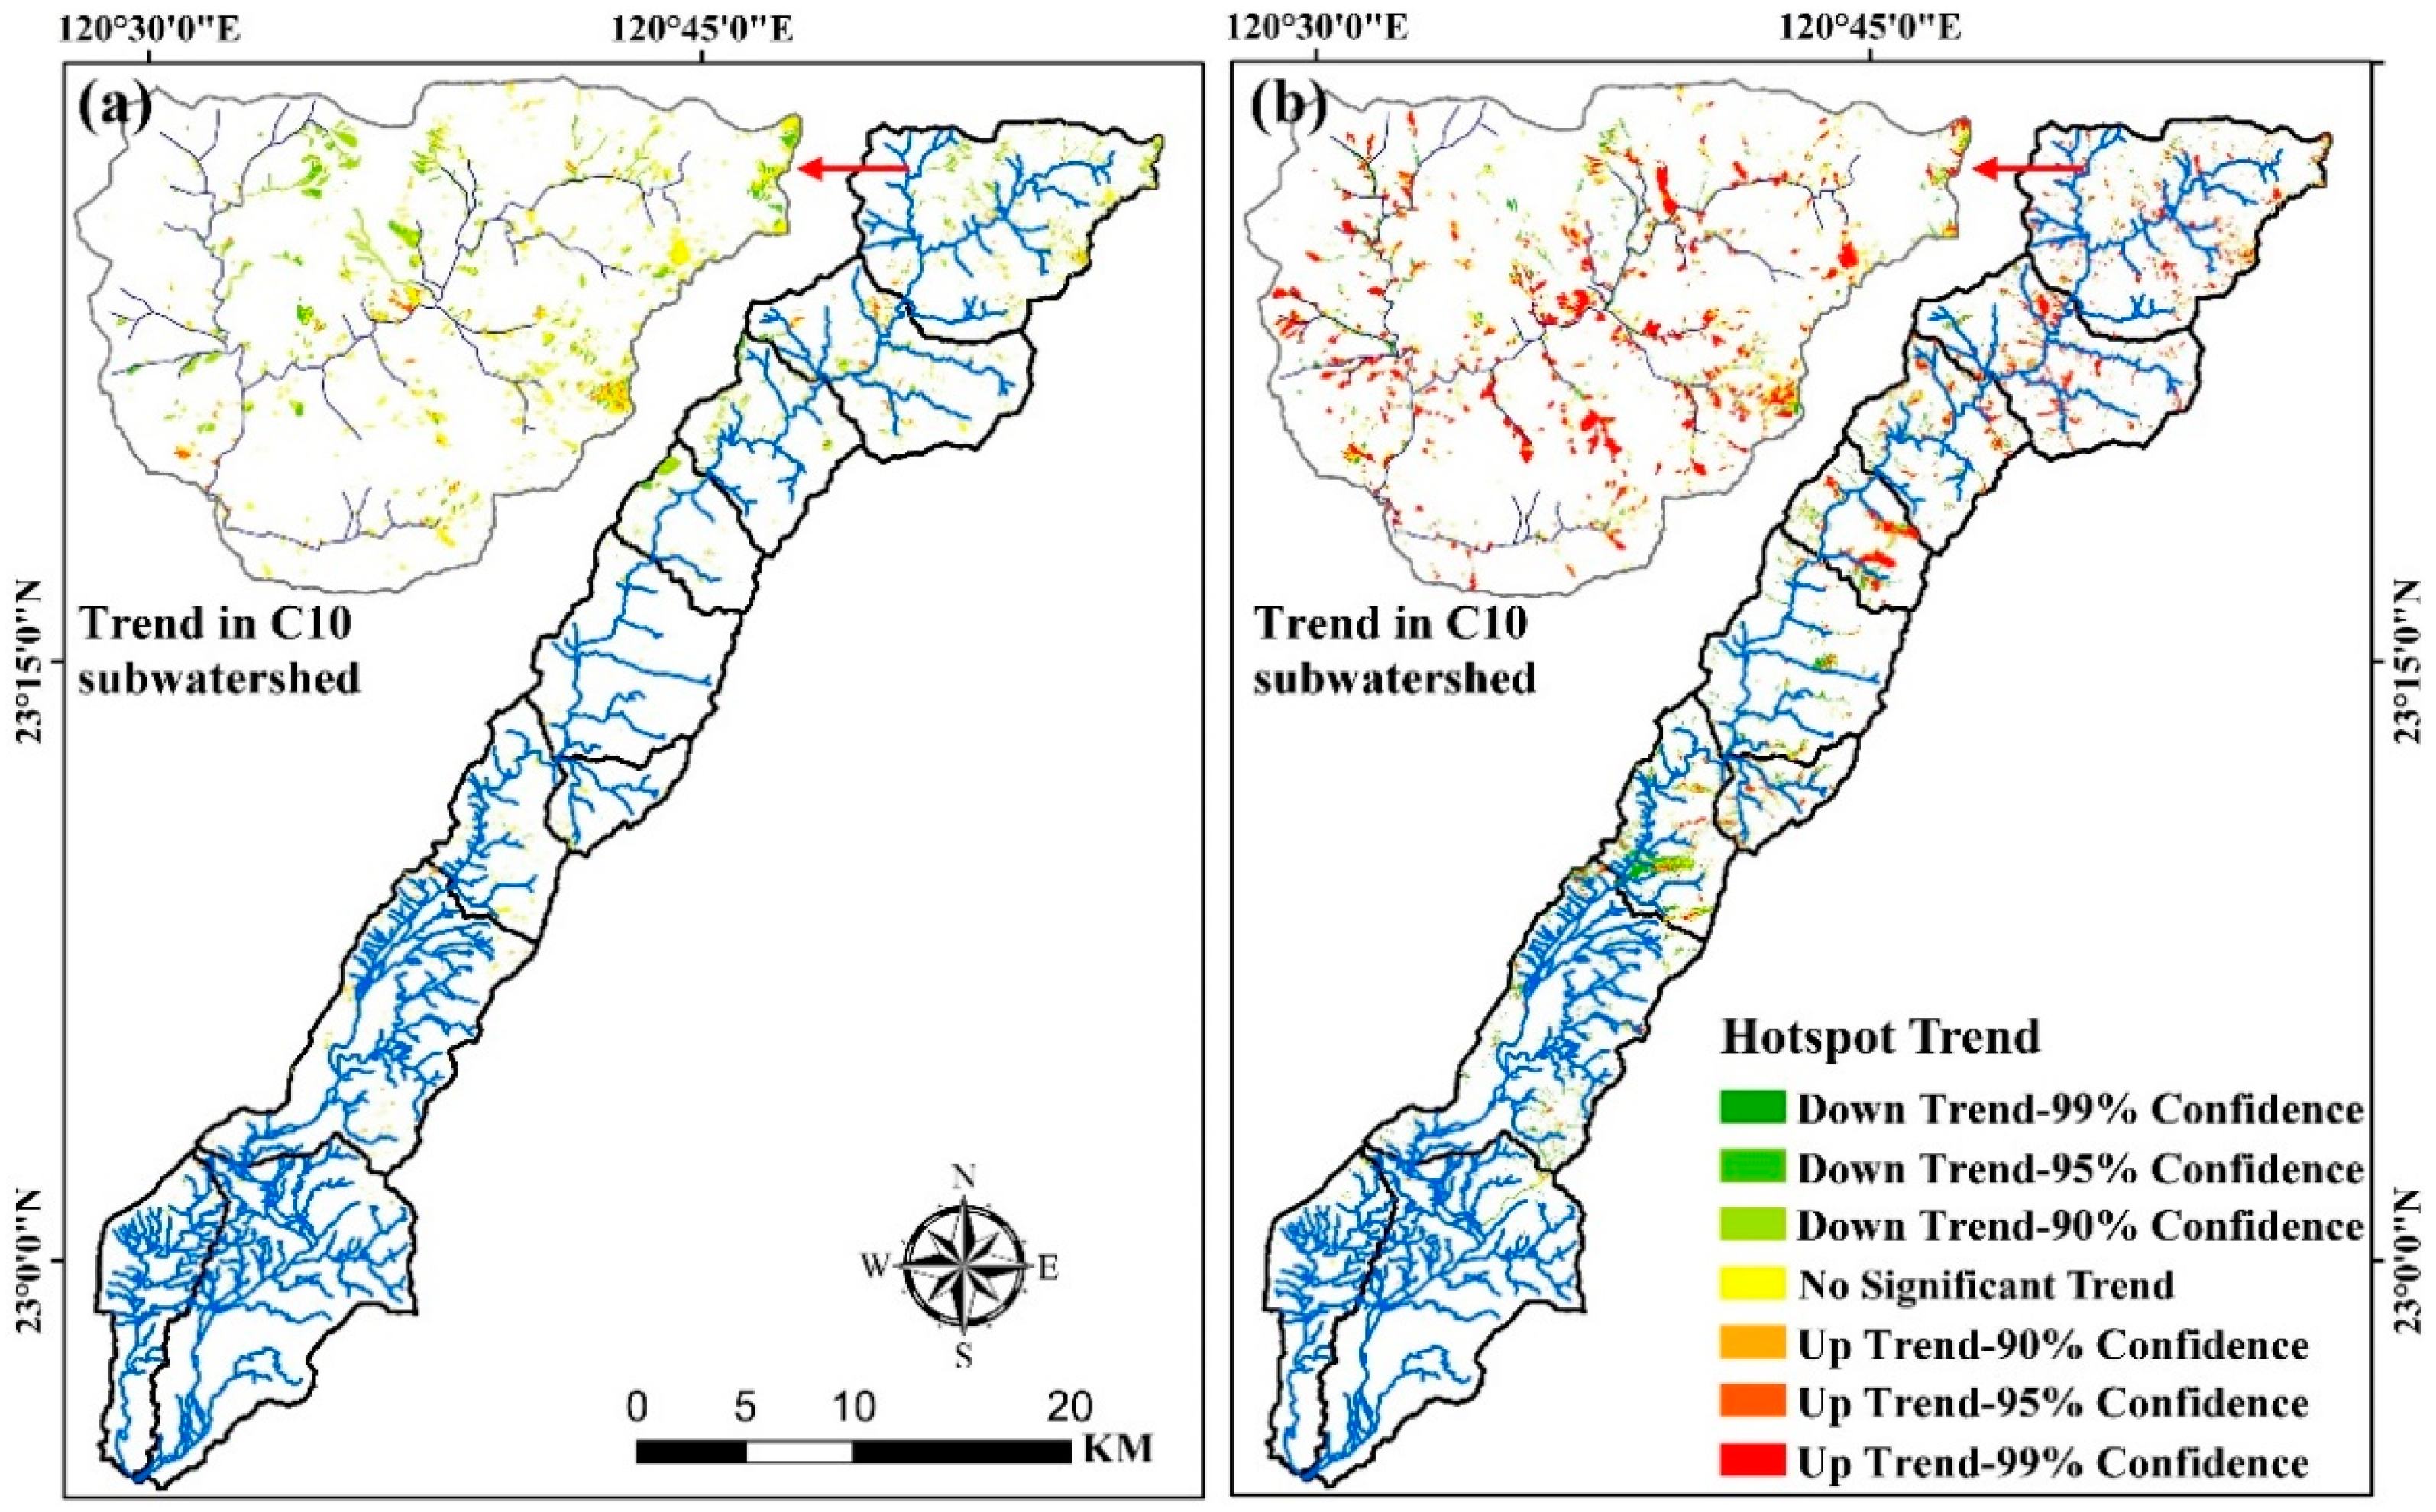
4.4. Spatiotemporal Hotspot Distribution
Emerging hotspot analysis was used to explore the spatiotemporal hotspot distribution and patterns of landslide evolution during 1999–2017 in the Chishan river watershed. Previous studies have not examined the evolution trends of landslide clustering before and after Typhoon Morakot in the Chishan river watershed. A spatiotemporal analysis can provide a comprehensive view of landslide clustering locations. Accordingly, the present study performed the Mann–Kendall trend test to demonstrate changes in the spatial clustering of landslides in each grid during 1999–2008 and 2008–2017 (
Figure 6). The spatial clustering distributions of landslides in the Chishan river watershed during 1999–2008 (
Figure 6a) and 2008–2017 (
Figure 6b) were remarkably different; areas with increasing landslide occurrence trends are clearly highlighted in
Figure 6. The numbers of grids with no significant trend, declining trends, and increasing trends during 2008–2017 were 1.1, 3.1, and 8.9 times larger, respectively, than those during 1999–2008. These results imply that the trends of landslide clustering in the Chishan river watershed after Typhoon Morakot were clearer than those after the 1999 Chichi earthquake.
Moreover, grids with increasing trends were concentrated in the upstream subwatersheds (C07–C10) during 2008–2017. The numbers of grids with no significant trend, declining trends, and increasing trends during 2008–2017 in the upstream subwatersheds were 0.89, 1.07, and 9.06 times larger, respectively, than those during 1999–2008. The number of grids with increasing trends in the upstream subwatersheds during 2008–2017 accounted for 82.6% of those in the Chishan river watershed, meaning that the upstream subwatersheds represented the main areas with landslide clustering in the Chishan river watershed during 2008–2017. The spatial distribution of landslide clustering in C10 is illustrated in
Figure 8. The grids with increasing trends in C10 were clustered along the rivers, in the source areas of the rivers, and in the surroundings of large landslides. In Taiwan, the locations of landslides have been reported to be related to geomorphological factors and rainfall distribution during heavy rainfall events [
1,
7,
8,
12]. However, the present study revealed that river systems and large landslide cases influenced the locations where landslides were difficult to recover from and easy to reinduce in the upstream of the Chishan river watershed during 2008–2017.
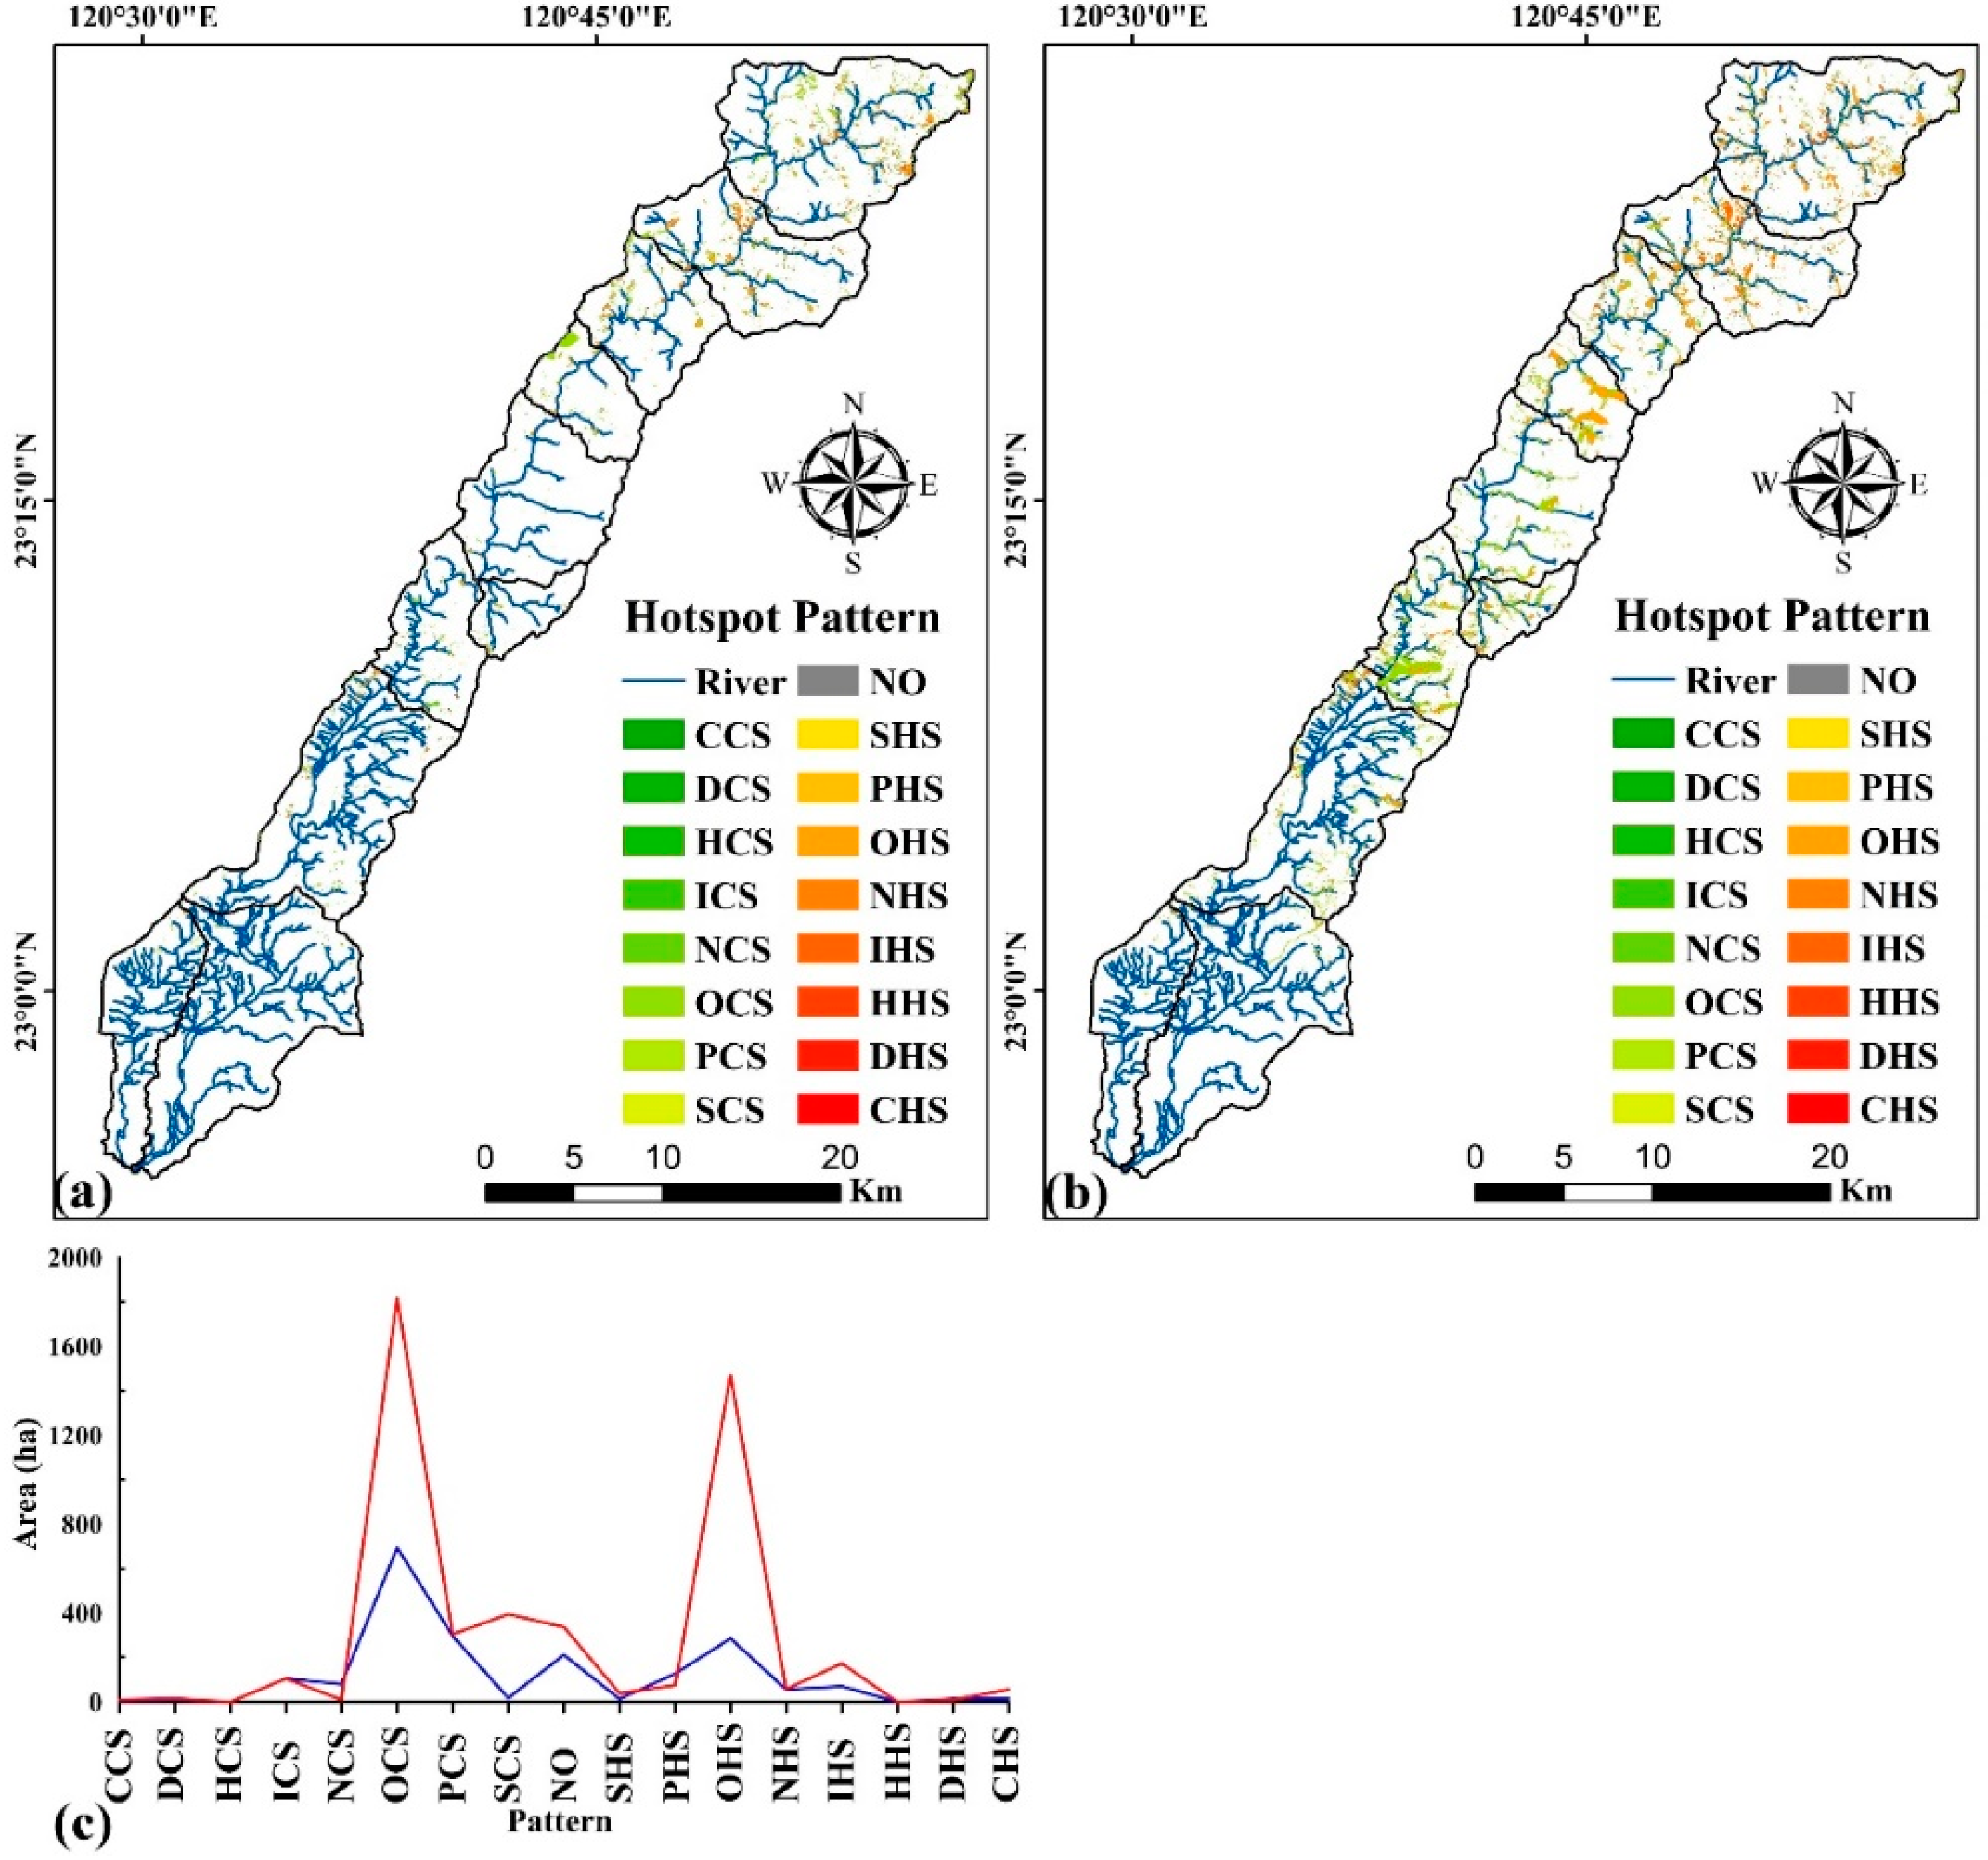
Figure 9 shows the differences in the spatiotemporal patterns and distributions of landslide hotspots during 1999–2008 and 2008–2017. The three main cold spot patterns during 1999–2008 were oscillating cold spots (OCS), persistent cold spots (PCS), and intensifying cold spots (ICS), and those during 2008–2017 were OCS, PCS, and sporadic cold spots (SCS). The three main hotspot patterns during 1999–2008 were oscillating hotspots (OHS), persistent hotspots (PHS), and intensifying hotspots (IHS), and those during 2008–2017 were OHS, HIS, and PHS. The characteristics of the main hotspot and cold spot patterns before and after Typhoon Morakot were oscillating and persistent, respectively.
During 1999–2017, the landslide hotspots were mainly distributed upstream of the Chishan river watershed. The main landslide hotspots in the upstream subwatersheds during 1999–2008 and 2008–2017 occupied 89.4% and 80.1%, respectively, of those in the Chishan river watershed. The main landslide hotspot in the upstream subwatersheds during 2008–2017 was 3.2 times larger than that during 1999–2008. OHS appeared in all upstream subwatersheds, but they were centralized in the surroundings of rivers and gullies and in the source areas of landslides. IHS and PHS were centralized in the core landslide areas and the downslopes of riverbank landslide areas.
The spatiotemporal patterns and distributions of the main landslide hotspots in the Chishan river watershed were related to the landslide area. The main landslide hotspot areas occupied 42.3%, 50.1%, and 59.1% of the large-, medium-, and small-landslide areas, respectively.
4.5. Clustering Strength of Small, Medium, and Large Landslides
In the Getis–Ord formula for hotspot analysis, the Z-score indicates the statistical significance of hotspots and cold spots; this study used it as an index to assess the strength of landslide clustering and estimate oscillation periods. A higher Z-score was considered to indicate more obvious landslide clustering, with a Z-score of 0 or a negative Z-score indicating the absence of landslide clustering.
Figure 10 presents the average Z-scores during 1999–2008 and 2008–2017 in the Chishan river watershed.
The temporal distributions of the clustering strengths of large, medium, and small landslides during 1999–2008 were similar, and those of landslides during 2008–2017 were also similar. During 1999–2004, the landslides could be ordered as follows in terms of strength (in decreasing order): large, medium, and small landslides. Moreover, during 2005–2008, they could be ordered as follows in terms of strength (in decreasing order): medium, small, and large landslides. These results demonstrate that the clustering strength of large landslides in the Chishan river watershed was high only in the early years after the 1999 Chichi earthquake.
The distributions of the clustering strength of the large, medium, and small landslides during 2010–2014 fluctuated, and the strength decreased rapidly from 2015 onward. The clustering of small landslides induced by Typhoon Morakot was not obvious, and the average Z-score derived for small landslides was positive only during 2010–2012 and in 2014. The average Z-scores derived for large and medium landslides induced by Typhoon Morakot were positive in the subsequent 5 years, and they started to decrease rapidly from 2015 onward.
5. Discussion
The spatiotemporal hotspots and cold spots of landslides can indicate the clustering strength of landslides and the patterns of landslide locations. Moreover, the spatiotemporal distribution of landslide hotspots is directly related to the evolution and recovery of a watershed after extreme-rainfall-induced landslide events, and it exerts a strong negative effect on the sustainability of watershed management. The oscillation period [
9] can be defined as the period during which the number or area of landslides fluctuates in the years that follow severe landslide events. The oscillation period can also be defined as the time needed for the watershed to stably recover from landslides. Landslide evolution research has used different methods to assess landslide recovery time and the oscillation period after large-earthquake- and extreme-rainfall-induced serious landslide events. The spatial distribution of landslide recovery has been assessed by estimating the landslide activity, and the temporal changes in landslide recovery have been assessed by observing the numbers and areas of landslides every year after serious landslide events, after the 2005 Kashimir earthquake [
2] and the 2008 Wenchuan earthquake [
4,
5,
6]. The oscillation period was estimated to be 3–5 years after the 2005 Kashmir earthquake and the 2008 Wenchuan earthquake and 5 years after Typhoon Morakot in southern Taiwan [
9].
The 1999 Chichi earthquake induced 439 landslide cases covering a total area of 9.5 km
2 in the Chishan river watershed. The average Z-score in the Chishan river watershed (
Figure 10) was 2.15 in 1999; it increased to 3.04–3.68 in 2000–2002 and then started to decrease in 2003 before finally dropping to −1.48 in 2008. Typhoon Morakot in 2009 induced 1494 landslide cases covering a total area of 40.3 km
2 in the Chishan river watershed. The average Z-score in the Chishan river watershed was 0.31 in 2009; it increased rapidly to 29.43 in 2010 and fluctuated between 26.02 and 29.78 during 2010–2014, after which it started to decrease in 2015 until reaching −5.37 in 2017. The average Z-score after the 1999 Chichi earthquake in the Chishan river watershed was 1.41 times greater than that before 1999, and the average Z-score after Typhoon Morakot was 94.94 times greater than that before 2009. These results demonstrate that the clustering strength of landslides induced by Typhoon Morakot in the Chishan river watershed was considerably greater than that of landslides induced by the 1999 Chichi earthquake. According to the temporal changes in the average Z-scores, the Chishan river watershed required 2 years to achieve stable recovery after the 1999 Chichi earthquake but 4 years after Typhoon Morakot. Accordingly, the oscillation period after Typhoon Morakot in the Chishan river watershed was twice as long as that after the 1999 Chichi earthquake. The results also indicated that recovery from landslides induced by a large earthquake (
ML = 7.3) in Taiwan was faster than from those induced by an extreme rainfall event with accumulated rainfall of >2000 mm.
The average Z-scores in the upstream subwatersheds during 1999–2008 ranged from −0.95 to 5.66, and they were marginally higher than those in the Chishan river watershed. However, the average Z-scores in the upstream subwatersheds during 2008–2017 ranged from −63.70 to 101.38, and those after 2010 were higher than those in the Chishan river watershed. The average Z-score in the upstream subwatersheds during 2016–2017 was approximately 70.0, and that in the other area of the Chishan river watershed was negative. These results indicate that the landslide recovery period in the upstream subwatersheds was longer than that in the Chishan river watershed.
The spatial resolution of images that were used to identify the landslide was the major factor for the number of identified small landslides. The images used to identify landslides were Spot 1 and Spot 2 images with spatial resolution of 10 m during 1999–2002 and Formosat-2 images with spatial resolution of 2 m during 2003–2017. The number of small landslides ranged from 238 to 550 during 1999–2002, from 503 to 604 during 2003–2008, and from 1411 to 1930 during 2009–2017. The number of small landslides in the Chishan river watershed increased obviously after 2003, especially after Typhoon Morakot in 2009.
The number of small landslides was also the major reason explaining the temporal changes in Z-values. The number of small landslides was 54.2 to 71.8% of the total number of landslides during 1999–2002 and 70.2 to 80.4% during 2003–2017. The number of small landslide was 1494 in 2009, peaked at 1930 in 2014, and ended at 1411 in 2017. The fluctuation in the number of small landslides was similar to the temporal change in Z-values during 2009–2017. We suggest that the number of small landslides was the major factor for the average Z-value and that the location of medium and large landslides was the major factor for the distribution and patterns of spatiotemporal landslide hotspots based on the results on long-term landslide evolution in the Chishan river watershed.
The Z-values in the study provided quantified data on landslide clustering at different scales (watershed or subwatershed) and different landslide sizes (small, medium, and large) in different time periods. Using Z-values to explain the spatial distribution of and temporal changes in landslide recovery can be a convincing method for explaining landslide evolution.
Using spatiotemporal hotspot analysis to analyze landslide evolution in the study provided powerful theoretical evidence to explain the spatial and temporal distribution of landslide clustering. The patterns and distributions of landslide spatiotemporal hotspots can also explain the characteristics of watershed recovery after serious landslide events and can thus represent useful information for formulating policies for watershed recovery.


