Article

Associative Analysis of Inefficiencies and Station Activity Levels in Emergency Response

INESC-ID, Instituto Superior Tecnico, Universidade de Lisboa, 1000-029 Lisbon, Portugal
*
Author to whom correspondence should be addressed.
ISPRS Int. J. Geo-Inf. 2022, 11(7), 356; https://doi.org/10.3390/ijgi11070356
Submission received: 2 May 2022 / Revised: 15 June 2022 / Accepted: 21 June 2022 / Published: 23 June 2022

Abstract

:
Emergency medical services (EMS) around the world face the challenging task of allocating resources to efficiently respond to medical emergencies within a geographical area. While several studies have been done to improve various aspects of EMS, such as ambulance dispatch planning and station placement optimization, few works have focused on the assessment of existing rich real-world emergency response data to systematically identify areas of improvement. In this paper, we propose DAPI (data-driven analysis of potential response inefficiencies), a general tool for analyzing inefficiencies in emergency response datasets. DAPI efficiently identifies potential response bottlenecks based on spatial distributions of ambulance responses and statistically assesses them with respect to inferred activity levels of relevant dispatch stations to aid causality analysis. DAPI is applied on a dataset containing all medical emergency responses in mainland Portugal, in which we find statistical evidence that inefficiencies are correlated with high levels of activity of stations closer to an emergency location. We present these findings, along with the associated patterns and geographical clusters, serving as a valuable decision support tool to aid EMS in improving their operations.

1. Introduction

Timely delivery of goods and services is of great importance in various domains such as logistics distribution [1], transportation [2], and crime prevention [3]. This also holds true in emergency medical services (EMS), as ensuring that vehicles are allocated and dispatched promptly and efficiently can help save lives and improve the overall quality of public service. This has led to substantial efforts to develop tools and approaches that can support the handling of medical emergencies [4].
Many jurisdictions around the world have designated organizations tasked with coordinating and managing emergencies. The availability of rich real-world data from these organizations has provided opportunities to improve various aspects of medical emergency response [5,6,7]. Several studies have been done to this end, falling under several research scopes, such as ambulance dispatch planning [8,9], station and ambulance placement and relocation [10,11], vehicle routing [12,13], hospital evacuation [14,15], and visualization/decision support [16,17]. However, in addition to these contributions, there is also a need to assess existing emergency response systems, unraveling patterns that highlight potential local problems in those systems. This can help organizations better understand the current state of emergency response and make appropriate data-driven decisions grounded on historical events. Our motivation in this work is to propose a general tool for uncovering systematic potential inefficiencies in real-world emergency response data backed by solid statistical principles in terms of the assignment of vehicle dispatch stations to emergency locations as well as the availability of vehicles in each station using parameterizable spatiotemporal criteria.
Despite the abundance of studies on the medical emergency response domain, few studies have focused on the discovery of actionable patterns from existing ambulance dispatch data [4]. Nevertheless, pattern discovery can provide valuable insights for decision support. For instance, it can provide an objective data-grounded rationale for policy development and implementation. It can also be used to assess specific spatiotemporal frames to identify specific regions and time intervals where interventions are most needed. Finally, it can be used for the efficient identification of areas for improvement in large emergency response systems, such as those on a nationwide scale.
In this work, we aim to take advantage of rich real-world ambulance dispatch data to discover potential inefficiencies and analyze their occurrence with respect to the activity level of relevant stations to reveal potential points of improvement in vehicle allocation and dispatch. In this work, a potential inefficiency is a scenario where one or more stations are assigned to respond to an emergency when there are other stations closer to it. Take for example the case illustrated in Figure 1, where a faraway station made a dispatch to respond to an emergency despite historical evidence that the two closer stations had the appropriate vehicles to respond to it, signaling a possible inefficiency in the emergency response.
The analysis of real-world medical emergency response data is challenged by several factors. First, information included in such records is often incomplete. According to a review of EMS services by [18], a major difficulty in this domain is the collection of information regarding all events that transpire throughout the whole emergency response. For instance, in our real-world case study on Portuguese EMS data, while vehicle dispatches are recorded, actual routes taken by the vehicles as well as the times for the different stages of the response (e.g., arrival to the destination, return to the station) are often missing or inaccurate due to different vehicles belonging to different organizations. Second, relevant contextual information cannot always be easily retrieved, such as vehicle availability in each station. Moreover, there is a diversity of medical emergencies, whose varying properties and severity may require specialized vehicles and personnel [19,20]; dynamic availability of vehicles for dispatch as a result of emergency assistance and transport needs, operational schedules, availability of staff, malfunctions, or maintenance [21]; inherently high variability of medical emergencies, and external factors such as weather conditions, traffic, and (large-scale) public events [22]; and the localized nature of available domain knowledge and dispatch criteria. This highlights the need for an approach that requires only minimal information yet is able to estimate needed contextual details and is also parameterizable with context-specific spatiotemporal and emergency criteria.
To analyze potential inefficiencies from emergency response data, we apply a systematic three-step process. First, we identify potential inefficiencies from the rich historical response data of different stations. In this case, potential inefficiencies are non-optimal dispatches of vehicles to an emergency when there are closer stations to address it. Second, we estimate each station’s level of activity across time based on the distribution of its responses. Finally, we extract patterns by statistically validating the correlation of potential inefficiencies with activity levels of relevant stations. Our approach works with minimal information, as it does not require data on vehicle availability per station and key response timestamps other than the dispatch. We applied the proposed approach to a real-world dataset comprising all medical emergency responses in mainland Portugal. We show that we are able to isolate, analyze, and visualize potential inefficiencies supported by statistical evidence to serve as a guide for EMS stakeholders to identify points of improvement.
This paper is structured as follows. Section 2 contains related work done on this domain. Section 3 presents the research methodology, comprising the case study parameters and data, the formal specification of the problem, and the proposed approach for data-driven analysis of potential inefficiencies. Section 4 presents the results and findings of the Portuguese EMS study. Finally, Section 5 contains the concluding remarks.

2. Related Work

In this section, related studies on medical emergency response and their relationship with our work are discussed. Medical emergency response is a rich field, comprising several computational advances, which can be classified under three broad categories: optimization, visualization, and knowledge discovery.
In optimization studies, emergency response scenarios are typically represented as abstract data structures, such as graphs, on which various processes, such as allocation or routing of vehicles, can be optimized using computational techniques. Most works on ambulance dispatch planning fall under this category. This research line focuses on the decisional aspects involved in ambulance fleet management, such as the implementation of dispatch strategies for different scenarios and the optimization of ambulance placements to efficiently address emergency occurrences [23]. In the work of [9], a robust network-based optimization approach is proposed for relocating and routing ambulances, which is validated through simulation using parameters that capture real-world conditions in developing countries. In [24], decision trees are used to model real-world human decisions in ambulance dispatch in the Dutch EMS, leading to improvements in on-time performance. In the work of [25], a dynamic strategy for ambulance dispatch is proposed, using a reinforcement learning framework to efficiently assign vehicles to emergency occurrences. In the work of [20], an algorithm is proposed to perform dynamic decisions on whether to dispatch one or multiple vehicles to an emergency. In [26], the effect of dedicating specific ambulances only for COVID-19 pandemic patients was studied in terms of its effect on overall EMS performance.
Another aspect of optimization in medical emergency response is the vehicle routing problem. The vehicle routing problem aims to optimize the paths taken by responding vehicles in emergency situations. In these studies, typically, the goal is to minimize the associated cost of routing vehicles to respond to a set of emergencies [13]. In the work of [27], shortest paths are assigned from responding ambulances to emergencies using a graph search algorithm. In the works of [12,28], mathematical programming is used to find optimal solutions for routing a set of vehicles to accommodate a set of emergencies in a given area. In [29], the vehicle routing problem is approached by first clustering patients into groups according to geographical locations, then finding optimal routes to address the emergencies.
Medical emergency response also covers the research scope of hospital evacuation and bus evacuation problems. This area focuses on the development of effective strategies for transporting a large number of patients from hospitals or risk areas to alternative healthcare locations in the face of unforeseen events, such as disasters [15,30]. In the work of [31], the problem of efficiently evacuating several people from disaster areas using a limited number of buses is solved by a novel sim-heuristic approach, showing promising results. In [32], a stochastic optimization model is used to determine a suitable evacuation plan for patients in a hospital during a disaster situation. In the work of [33], the problem of routing ambulances to transport a large number of critical and non-critical patients from a hospital under flooding risk is formulated as a mixed-integer programming problem.
In contrast to optimization approaches, another stream of research on medical emergency response focuses on visualization and knowledge discovery. These works play a more supportive role by augmenting EMS with decision support tools to better respond to emergencies [16]. Visualizations are used for various purposes, such as training and simulation [34,35], real-time management [36,37,38], and decision support [39,40]. On the knowledge discovery front, valuable data-driven insights are extracted from emergency response data. In the work of [41], self-organizing maps are used to find patterns in the incidence of emergencies on a spatial map. Such patterns can then be used to better decide how to allocate and dispatch medical resources. In [42], the number of ambulance dispatches in a state of emergency is estimated from a fusion of historical response and environmental data, providing support for emergency response stakeholders.
Our work falls under this last category (i.e., knowledge discovery and visualization) but has strong potential applications to the above research scopes. Although there have been many computational studies on medical emergency response, few have focused on leveraging existing historical EMS data to unravel potential actionable patterns. In this study, we address this by proposing a general tool for discovering potential inefficiencies and statistically assessing their correlation with activity levels of ambulance stations from real-world EMS data. The proposed approach can be used to augment and improve various aspects of the emergency response process.

3. Research Methodology

In this section, we formally introduce our research methodology for the discovery and analysis of potential inefficiencies in medical emergency response. First, we introduce the dataset that we used as a case study in this paper. Then, we formally outline the objectives of our work. Finally, we introduce our proposed solution to achieve these goals.

3.1. Portuguese Emergency Response Dataset

EMS in mainland Portugal are coordinated by Instituto Nacional de Emergência Médica (INEM) http://www.inem.pt (accessed on 22 March 2022). Medical emergencies are reported via the 112 number. Thereafter, the staff assesses the nature of the emergency and dispatches the appropriate vehicle with the medical staff as needed. Each type of vehicle is equipped to deal with different situations, from light injuries to life support, and is stationed at one of many designated stations (e.g., hospitals, fire departments) located all over mainland Portugal. In 2019 alone, INEM answered (dispatched) nearly 1.3 million calls (1.2 million vehicles).
INEM stores information about its medical emergency responses in a database. Among the pieces of information stored are: the timestamp of each emergency response, the type of emergency (a categorical value with a finite set of options, e.g., “Aggression”, “Road Accident”), the severity (an ordinal scale from 1 to 9), the location of the emergency (e.g., coordinates, district, municipality), the responding unit, and the station where the responding unit was dispatched from. In some cases, additional information is also recorded by the responding staff at the emergency vehicles, such as the arrival, departure, and hospital redirection times. These data are encoded manually by the responding emergency response staff using digital forms, which are then transmitted to INEM’s database. Access to INEM’s database, used as a basis in this study, was granted under the DSAIPA/AI/0044/2018 collaboration. We primarily focus on the information regarding the time and location of each emergency, as well as the locations of the stations. From this, we obtain the origin points from the locations of the responding stations and the corresponding destinations from the emergency locations. We also obtain the time of the dispatches. However, precise vehicle locations over time are not recorded, as not all vehicles are owned by INEM, so the times of arrival and return are mostly incomplete. We consider emergency response data recorded in mainland Portugal from 2017 to 2019, containing over three million records.

3.2. Task Description

For this study, we assume a medical emergency response dataset with the following minimum components:
  • a set of stations S from which response vehicles are dispatched, where each station s S has a fixed location;
  • a set of vehicles V, where each vehicle v V belongs to a well-established category (e.g., vehicles with basic versus advanced life support), is assigned to a base station s S , and is uniquely identified;
  • a set of medical emergency response records E. Each response in E contains information about the time and location of its occurrence, as well as the station s S that responded to it. The responding vehicle is one of the vehicles stationed in s.
In this work, our proposed approach aims to address two main objectives: (1) identify which emergency response records in E are potential inefficiencies, and (2) find systematic statistical evidence of a correlation between potential inefficiencies and activity levels of closer stations. In the first objective, we formally define a “potential inefficiency” as a non-optimal allocation of a station to an emergency where (1) the emergency location is unusually far from the station’s typical coverage and (2) there is at least one closer station that could have responded to it. Potential inefficiencies could be caused by a variety of factors, such as problems with allocation and dispatch strategy, unavailability of vehicles, or unforeseen circumstances. By analyzing the activity level of closer stations, we can gain insight into whether such potential inefficiencies are correlated with the unavailability of vehicles due to high loads. To this end, the second objective aims to analyze potential inefficiencies in the context of station activity levels grounded on solid statistical methods.
The proposed approach aims to discover, statistically assess, and investigate the presence of potential inefficiencies in real-world Portuguese medical emergency data and their correlations with the activity levels of closer stations. From this general objective, we define three specific research questions that we aim to answer in our case study:
  • How correlated are potential inefficiencies with the activity levels of closer stations?
  • Are there specific areas or days in which potential inefficiencies occurred often?
  • Can stations be profiled according to their activity level to promote actionability?
We believe the above questions are important for EMS as they provide a concrete view of the current state of emergency response. For instance, if systematic potential inefficiencies occur with high activity levels in closer stations, then it could suggest the need to allocate more vehicles. Otherwise, it could signal the need to investigate other contextual sources of inefficiency, such as operational protocols or environmental factors. We believe these insights are valuable in guiding EMS to make decisions.

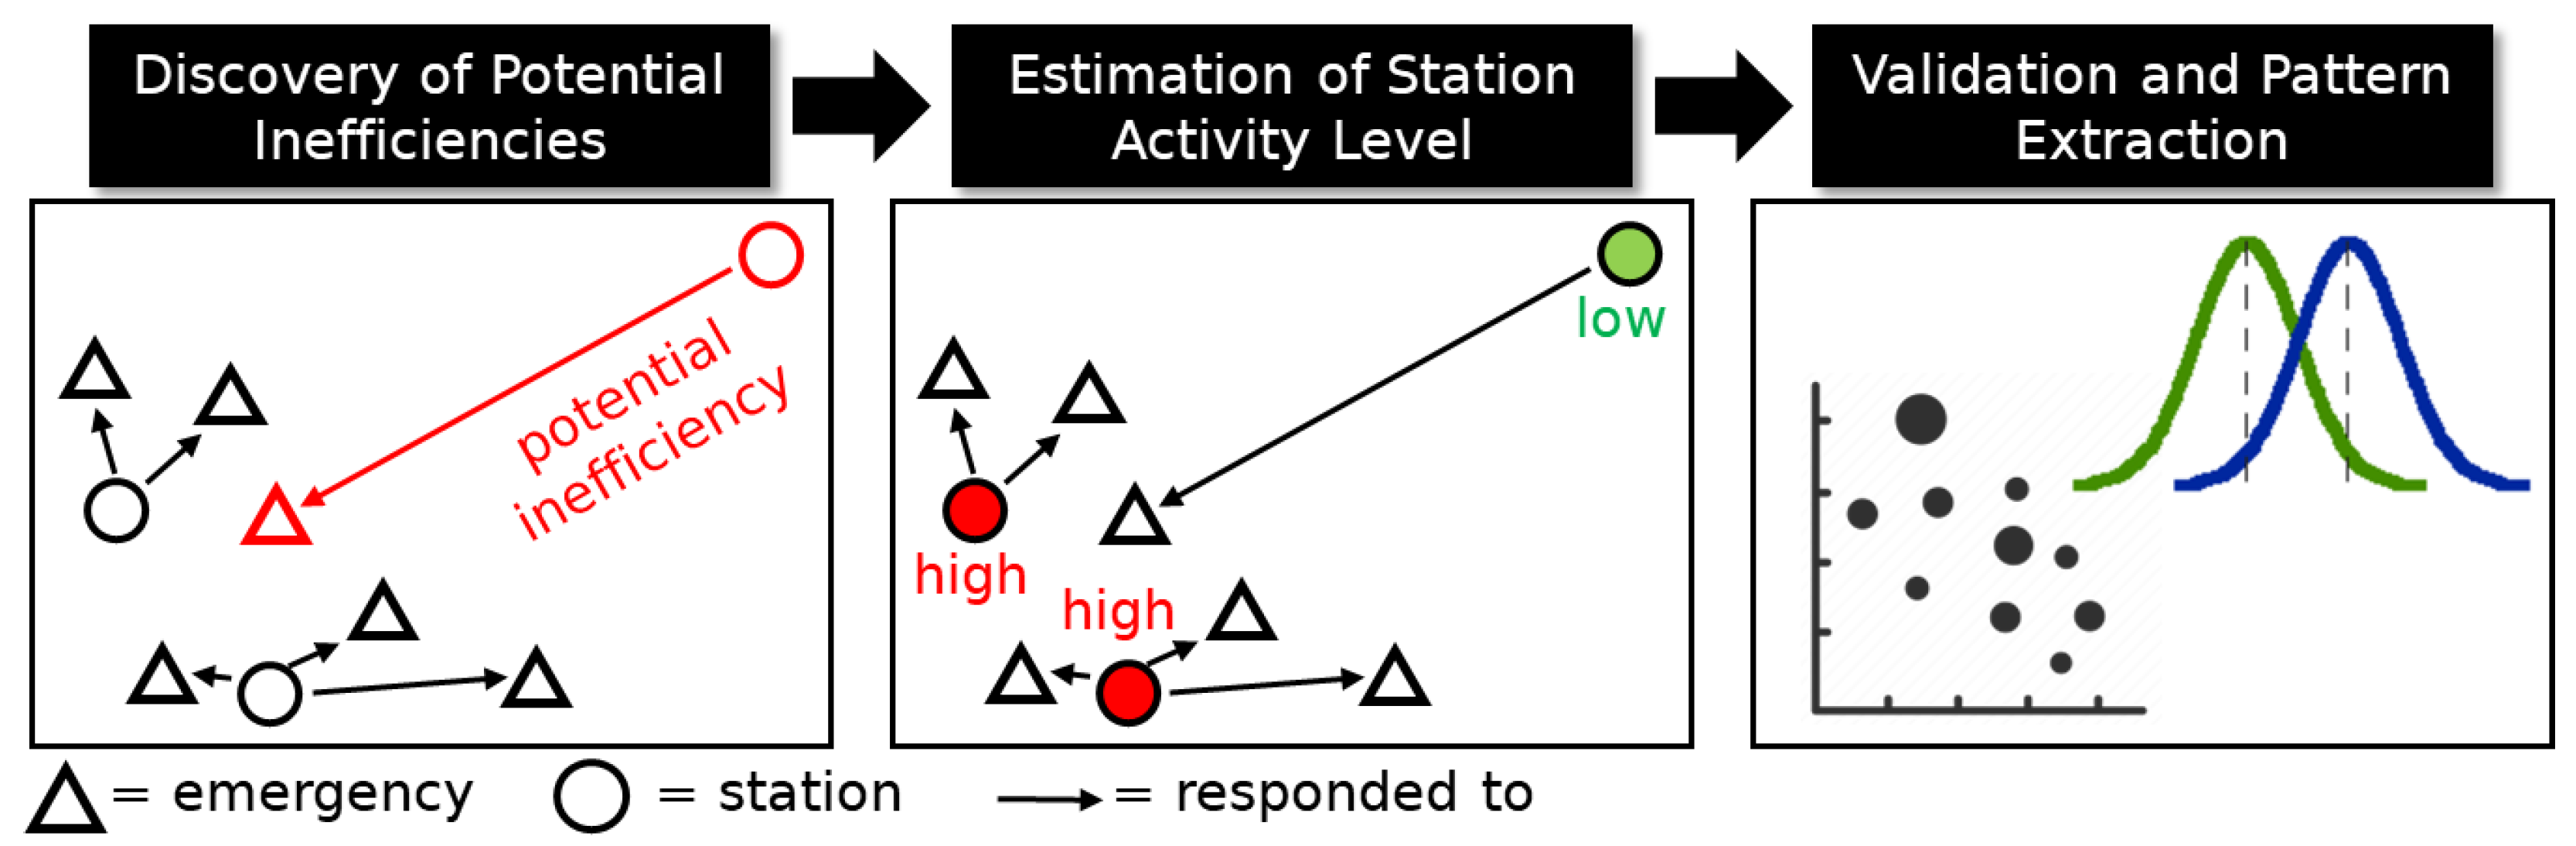
3.3. Discovery and Analysis of Potential Inefficiencies

We now present DAPI, the proposed tool for the discovery and analysis of potential inefficiencies in medical emergency response data, addressing the aforementioned objectives. The source code for DAPI is publicly available at https://github.com/thomastiamleept/dapi/ (accessed on 22 May 2022). DAPI is divided into three phases: (1) discovery of potential inefficiencies, (2) estimation of station activity levels, and (3) validation and extraction of patterns. In the first phase, real-world emergency vehicle dispatch data is used as an input, and potential inefficiencies are efficiently identified based on the spatial distributions of each station’s historical responses and road distances. In the second phase, activity levels of each station over time are inferred from the historical data based on the distributions of the number of responses and the estimated number of active vehicles. Finally, the third phase analyzes the correlation of potential inefficiencies with activity levels of closer stations using solid statistical principles. A pipeline of the approach is shown in Figure 2. The following subsections describe each phase in detail.

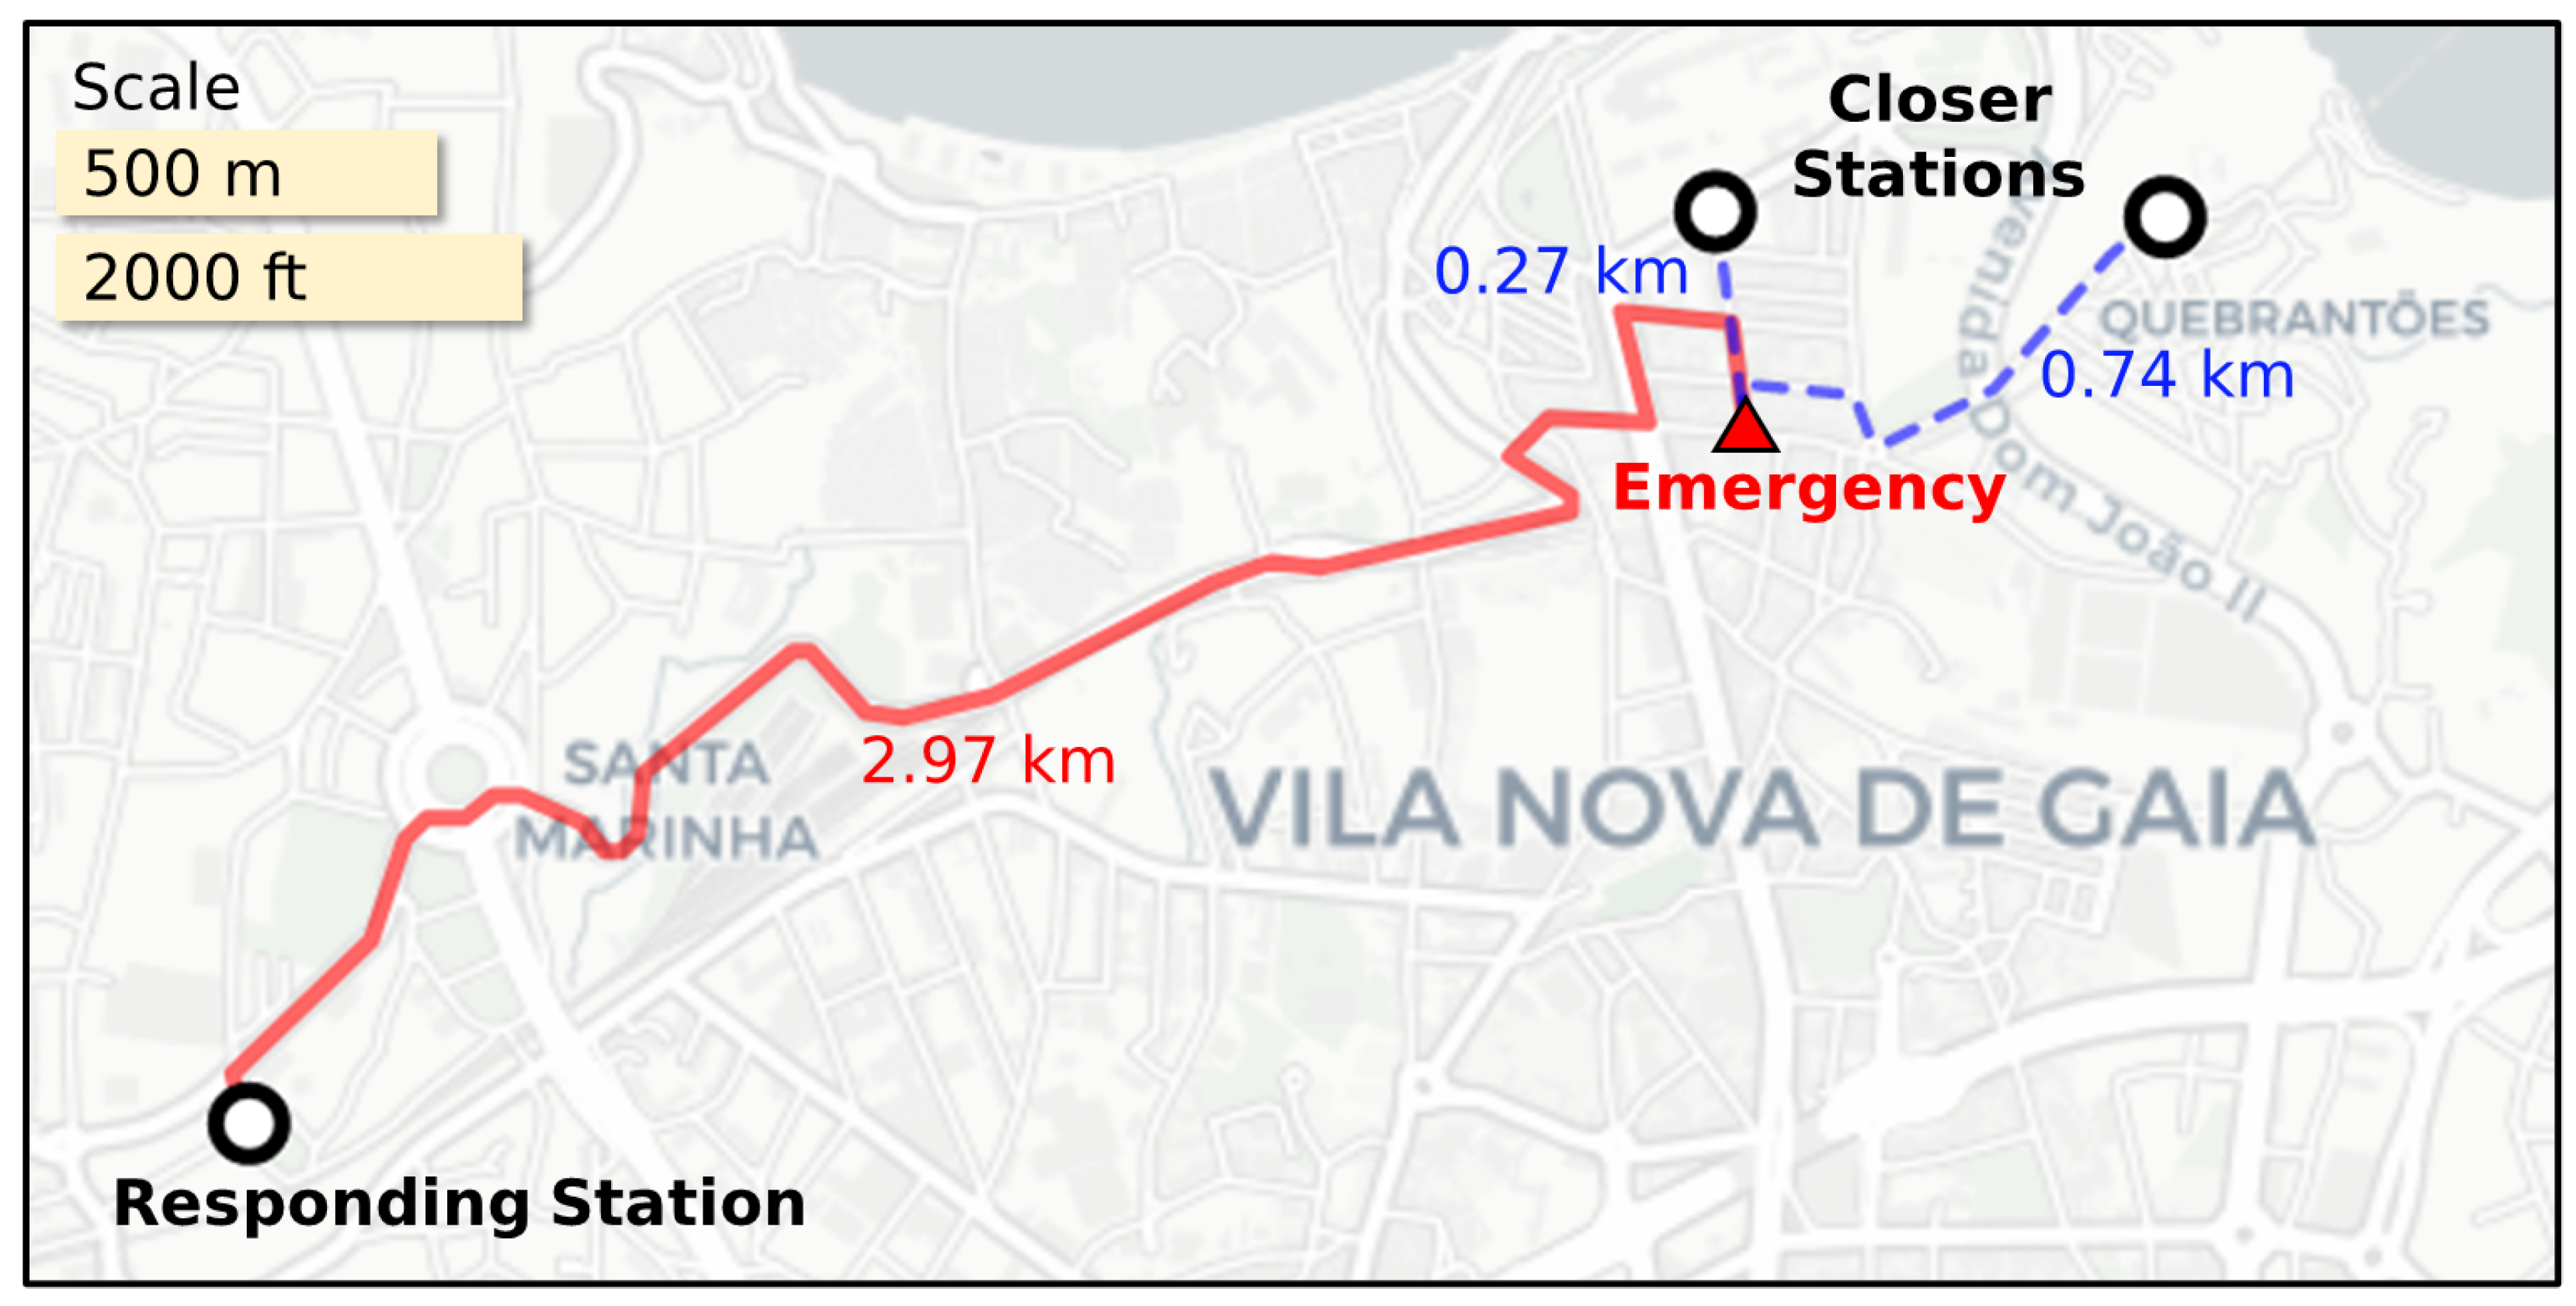
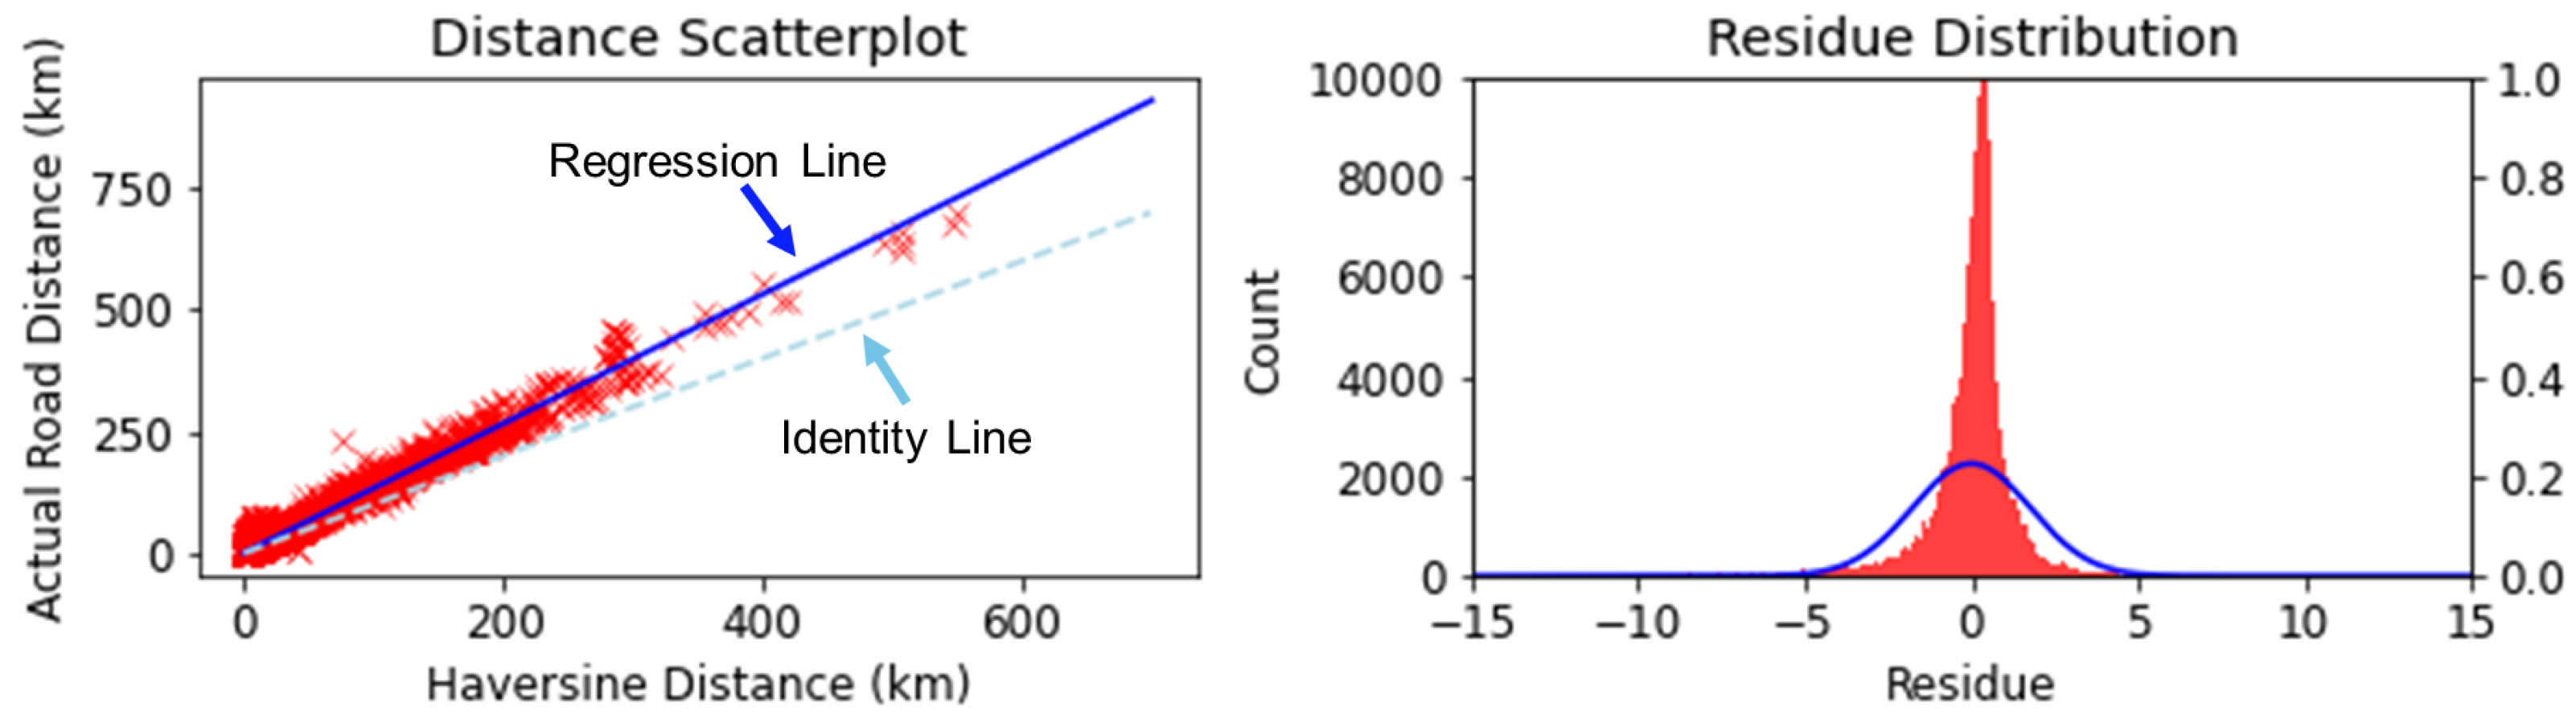
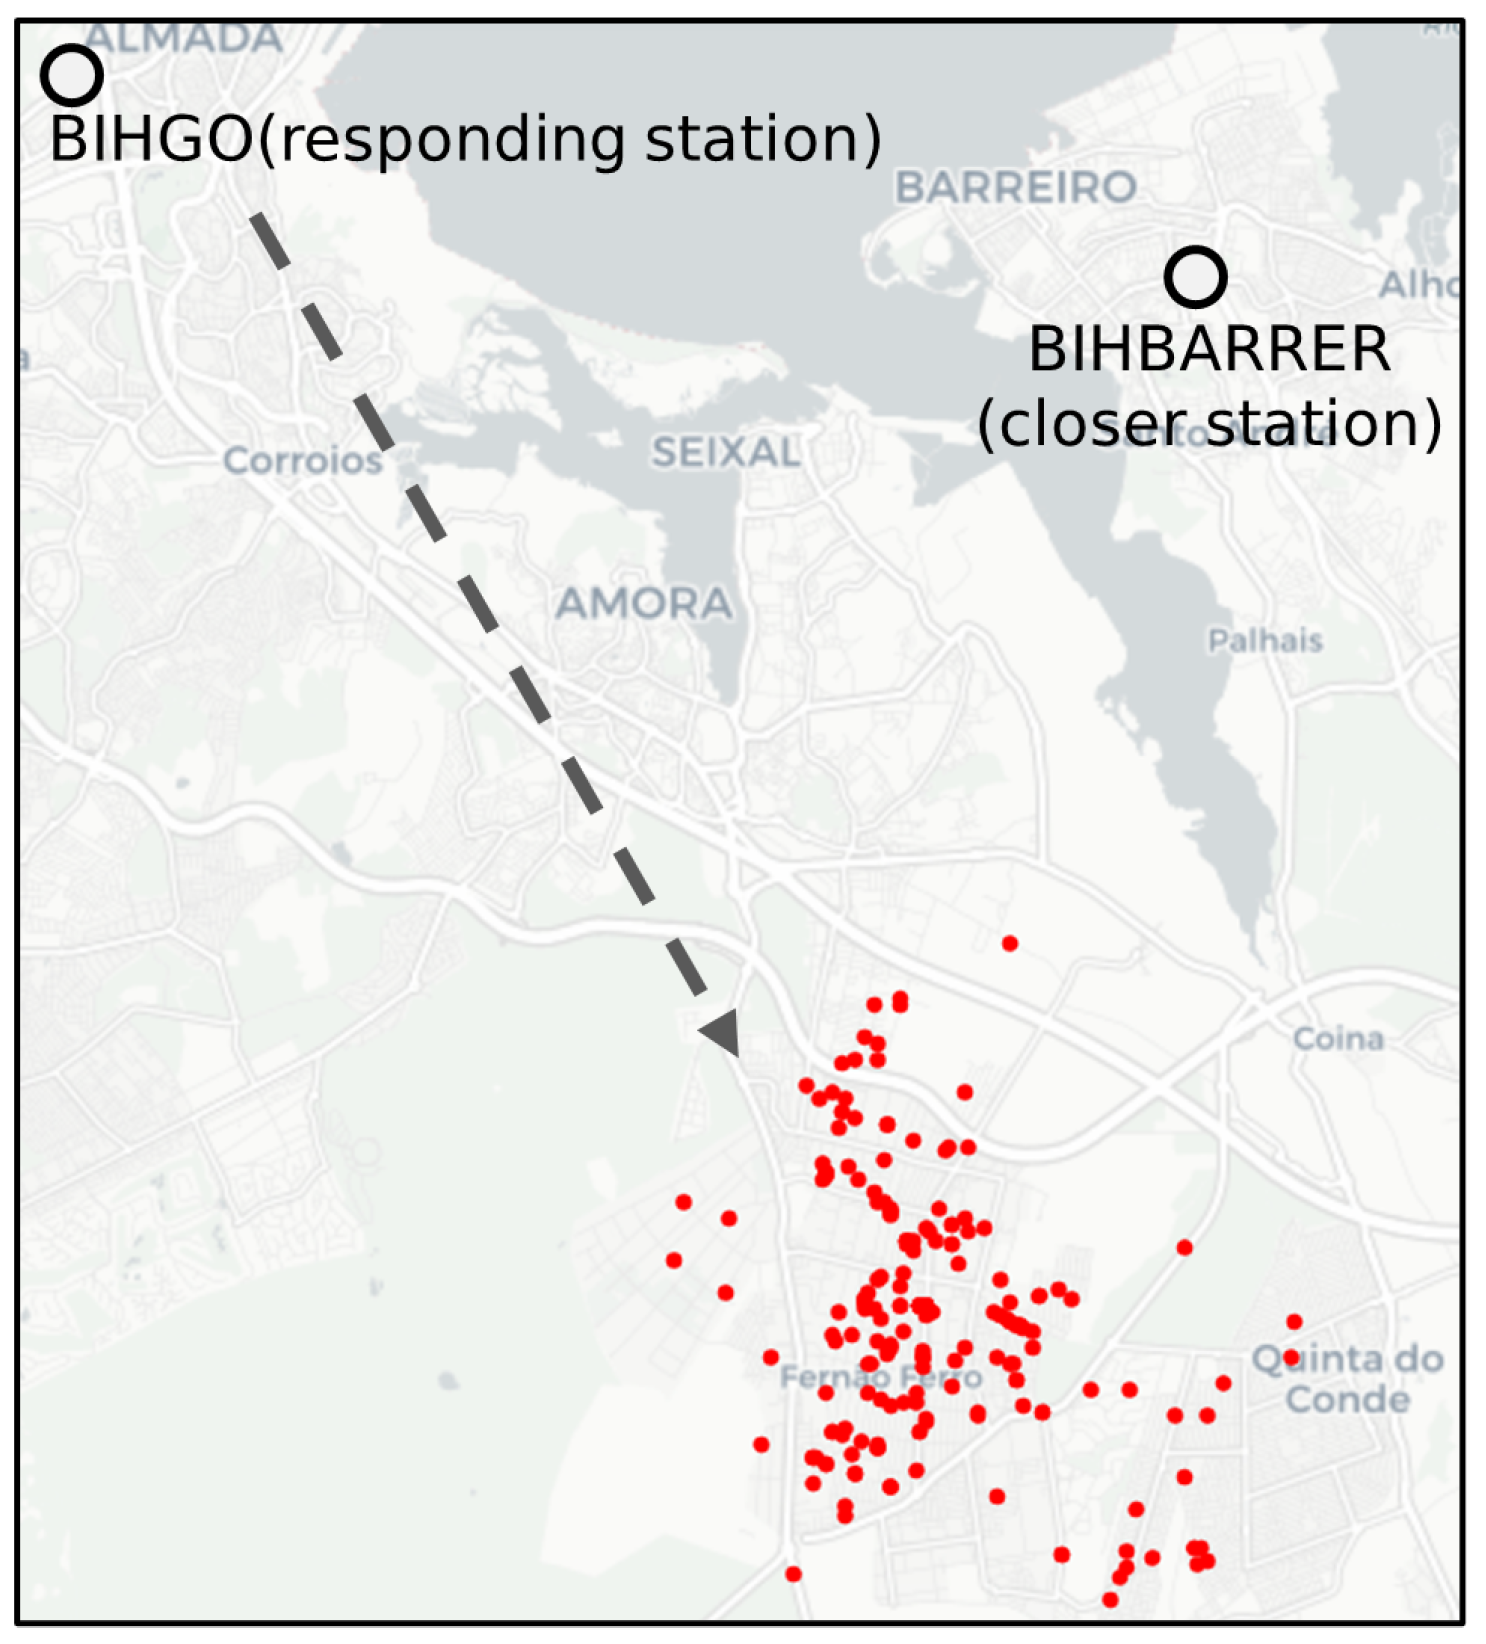
3.3.1. Identification of Potential Inefficiencies

The first phase of DAPI takes a set of medical emergency response records, as described in Section 3.2, and aims to efficiently identify records that are potential inefficiencies. Potential inefficiencies are cases where (1) the responding station is unusually far from the usual coverage of the station, and (2) there are stations closer to the location of the emergency. While this appears to be a trivial task, it is complicated by the fact that different stations have varying areas of coverage and by the infeasibility of comparing the distance of every emergency–station pair given the large size of the dataset.
To determine which cases have responding stations that are unusually far from the usual coverage of the station, DAPI computes the Mahalanobis distance of each emergency occurrence to the corresponding responding station. The Mahalanobis distance between a point x and a distribution with mean μ and covariance matrix Σ is defined in Equation (1).
D M ( x , μ , Σ ) = ( x μ ) T Σ 1 ( x μ )
The Mahalanobis distance provides two key desirable properties for this task: (1) it provides a distance metric relative to the area of coverage of the station, which in this case is captured by the historical spatial distribution of its responses; and (2) it has a vectorized implementation, allowing for efficient computation across a large number of queries.
All responses whose Mahalanobis distance to the responding station’s distribution is greater than or equal to a threshold θ are identified and added to the list of candidates for potential inefficiencies. In DAPI, θ = 1.5 by default, though this can be adjusted according to the desired sensitivity. The Mahalanobis distance can be interpreted as the number of standard deviations away from the center. The threshold θ = 1.5 is chosen as a conservative value to cover responses that are statistically farther away from the usual coverage of the responding station yet are not necessarily outliers. Figure 3 shows responses made by a station, with the potential inefficiency candidates highlighted for different values of θ .
Once candidate potential inefficiencies have been identified, the next step is to further filter these cases according to the second criteria, which requires at least one other station closer to the emergency. To this end, we need to compute actual road distances between the stations and the emergency locations. Open-source tools are available for computing the distance between two geographical points while considering real-world road networks, such as the Open Source Routing Machine (OSRM) (http://project-osrm.org (accessed on 22 May 2022)) in combination with OpenStreetMap data (https://wiki.openstreetmap.org/wiki/Downloading_data (accessed on 22 May 2022)). However, executing large numbers of queries using these tools can take infeasibly large amounts of time. Thus, to significantly minimize the number of computations, DAPI uses the Haversine distance to approximate the actual road distance first, to filter the number of road distance queries required. The Haversine distance is the angular distance between two (latitude, longitude) coordinates on Earth ( Φ 1 , λ 1 ) and ( Φ 2 , λ 2 ) . Haversine distance has previously been shown to be a good estimator of real-world road distances [43].
Equation (2) defines the Haversine distance as
d = 2 r sin 1 sin 2 Φ 2 Φ 1 2 + cos Φ 1 cos Φ 2 sin 2 λ 2 λ 1 2 ,
where r = 6378.137 , the radius of the Earth in kilometers. The Haversine distance provides a lower bound for the road distance, and its calculation can be vectorized.
Using OpenStreetMap, road distances between each emergency and the responding stations are estimated, as well as distances to non-responding stations with closer road distance to the emergency site. From here, DAPI only queries the actual road distance when the estimated road distance of the closest station is smaller than the estimated road distance of the responding station, considering some error margin ϵ for the Haversine estimate.
The linear model for road distance estimation can be fitted to a random sample of the data. Figure 4 shows, in a sample in our dataset, (a) the relationship between the Haversine distance and the actual road distance, with a least-squares regression line fitted for prediction, and (b) the residue distribution of said linear model. Note that ϵ can be selected based on the residue distribution. In the most conservative case, the minimum value could be selected, but a percentile can be used in the case of prevalent outliers.
Once relevant road distances have been obtained, DAPI selects from the candidate responses those which have closer stations to the emergency. Depending on the conditions, additional restrictions may be imposed, such as ensuring that the closer stations are within the same district or municipality, if one wishes to respect operational jurisdictions. After the above operations, we come up with a list of potential inefficiencies, with each instance containing: (1) the emergency, (2) the responding station and its distance from the emergency, and (3) the list of closer stations to the emergency and their corresponding distances from the emergency.
Algorithm 1 summarizes the procedure for identification of potential inefficiencies. The algorithm receives as input a set of emergencies E , the set of all stations S , and a threshold value θ . First, we produce a list C of candidate emergencies based the Mahalanobis distance of each response (lines 3–8). Next, for each candidate emergency in C (lines 9–20), we check if there is at least one closer station that could have responded to the emergency. If this is the case, then an emergency with potential inefficiency has been found (lines 14–17). Note that line 13 uses the Haversine distance to trim down the number of road distance queries required, significantly improving efficiency. Finally, the algorithm returns the set of all emergencies with potential inefficiencies (line 21).
Algorithm 1 Potential inefficiencies identification algorithm
Input: E : emergencies, S : stations, θ : threshold
Output: list of potential inefficiencies
  1:
C                           ▹ Candidate Emergencies
  2:
I                      ▹ Emergencies with Potential Inefficiencies
  3:
for each  e E do
  4:
     s R e s p o n d i n g S t a t i o n ( e )
  5:
    if  M a h a l a n o b i s ( e , s ) θ  then
  6:
         C = C { e }               ▹ New candidate emergency found
  7:
    end if
  8:
end for
  9:
for each  e C do
  10:
     s R e s p o n d i n g S t a t i o n ( e )
  11:
     r R o a d D i s t a n c e ( e , s )
  12:
    for each  t S { s }  do
  13:
        if  H a v e r s i n e ( e , t ) ϵ < r  then
  14:
           if  R o a d D i s t a n c e ( e , t ) < r  then
  15:
                    I = I { e }     ▹ Emergency with potential inefficiency found
  16:
                  break
  17:
           end if
  18:
        end if
  19:
    end for
  20:
end for
  21:
return I

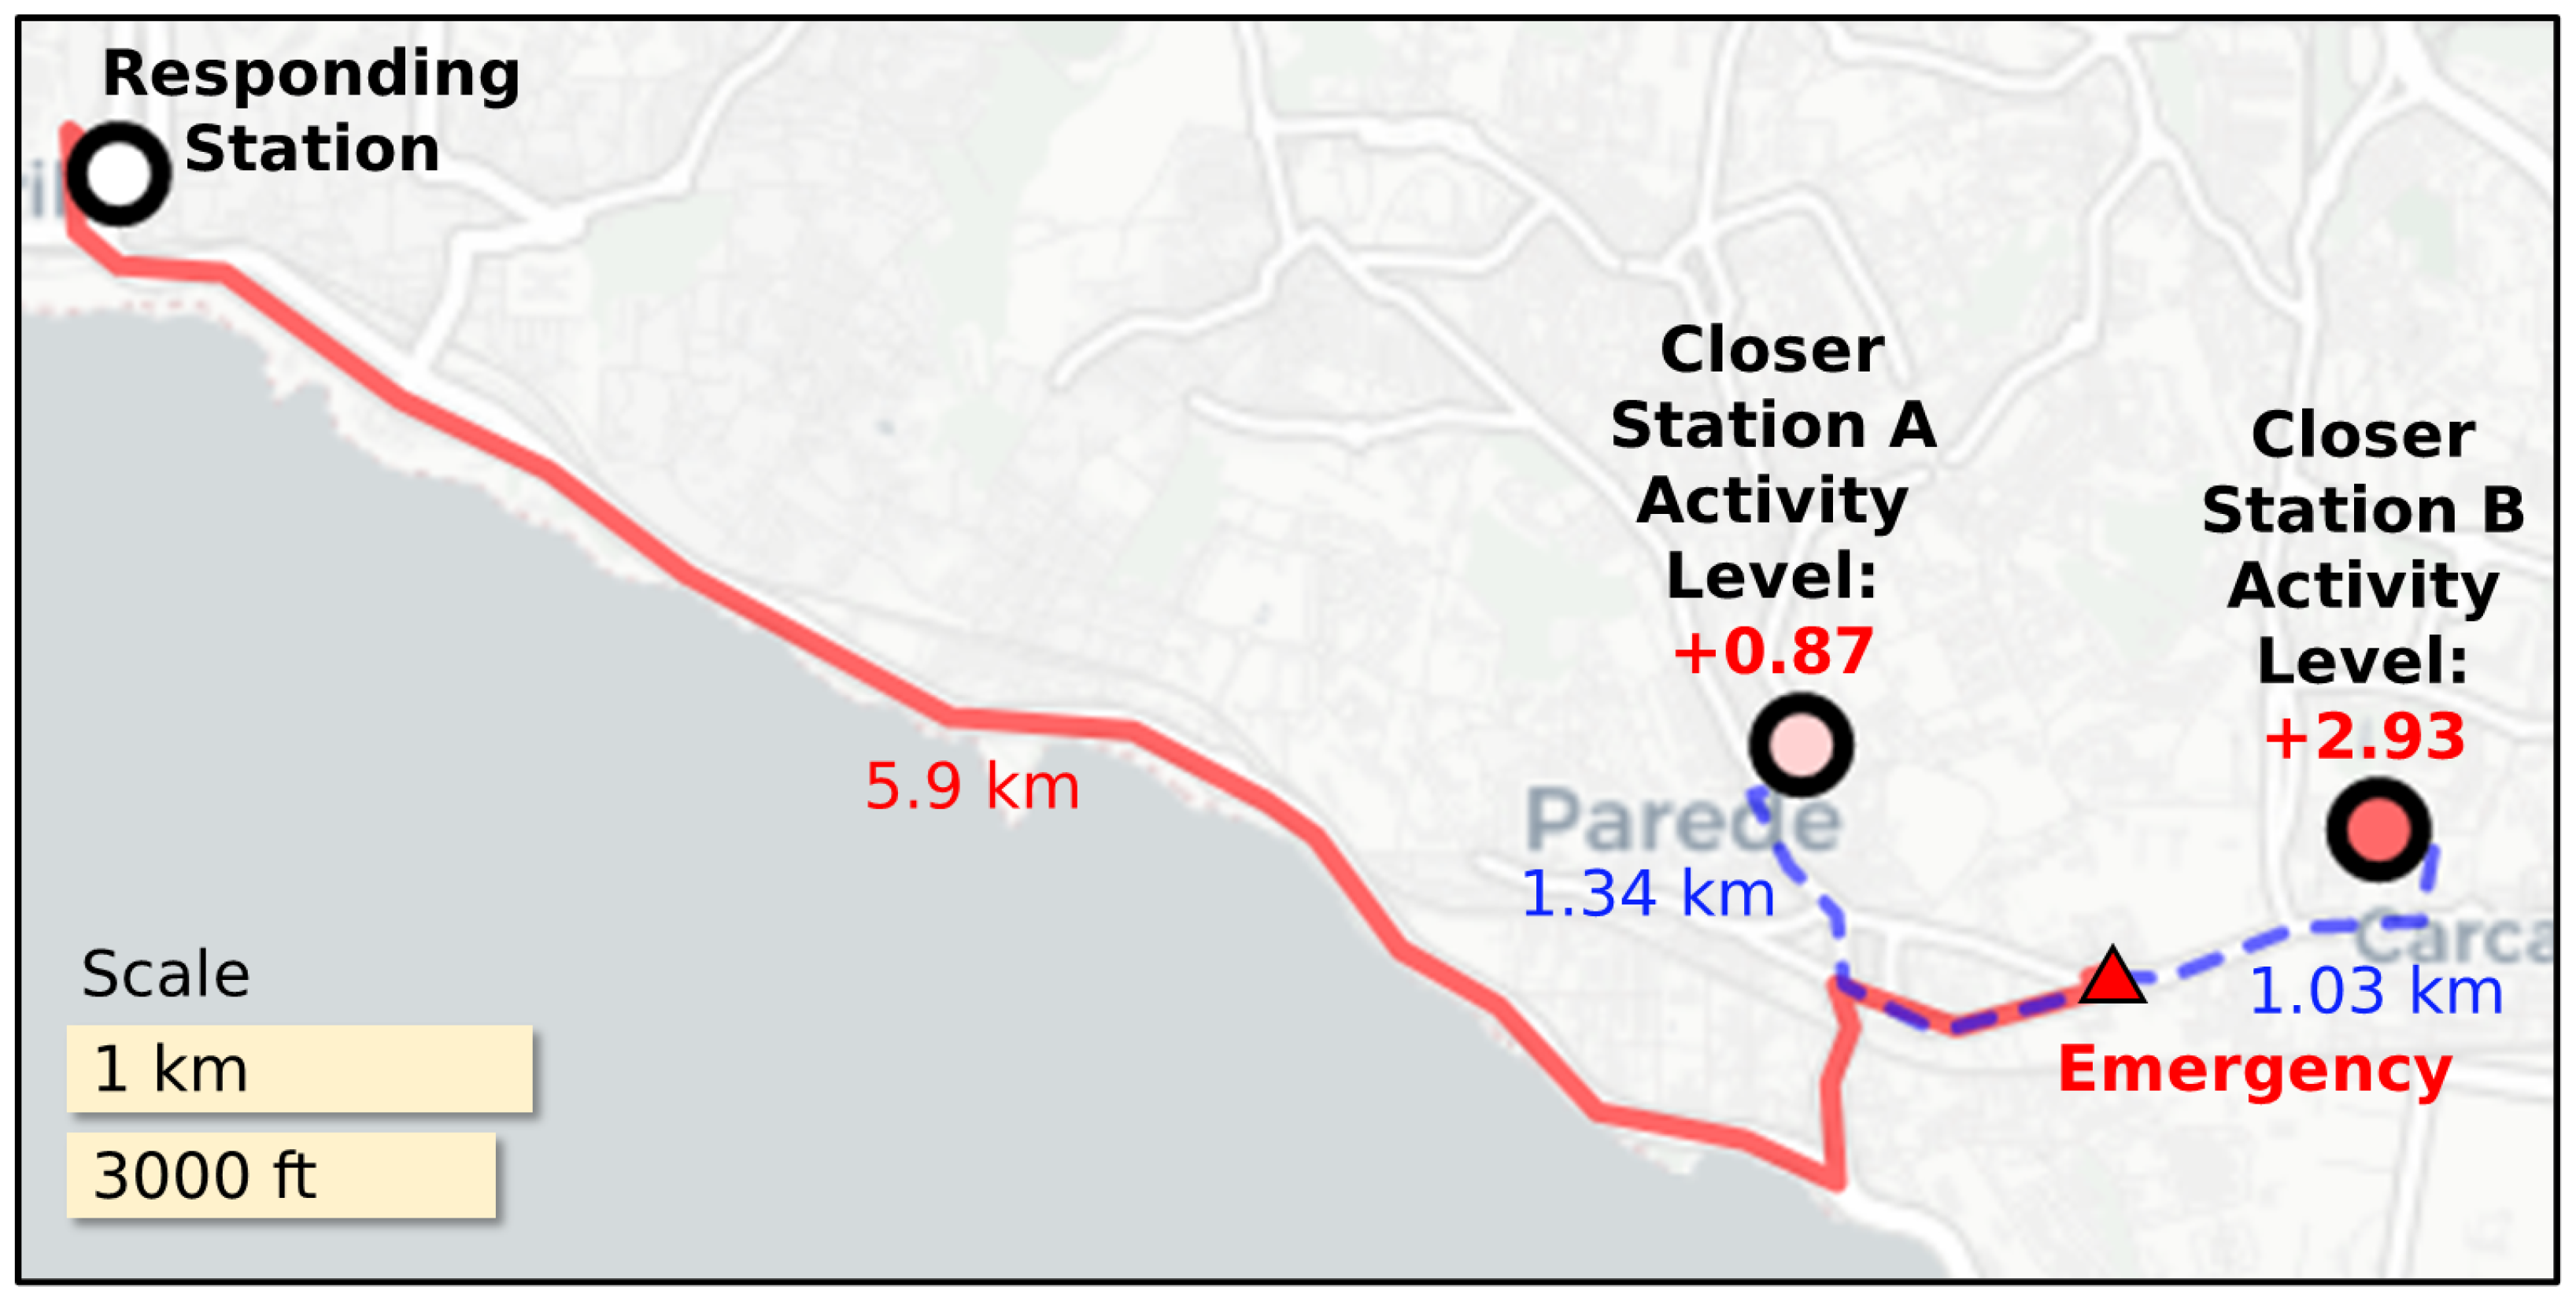
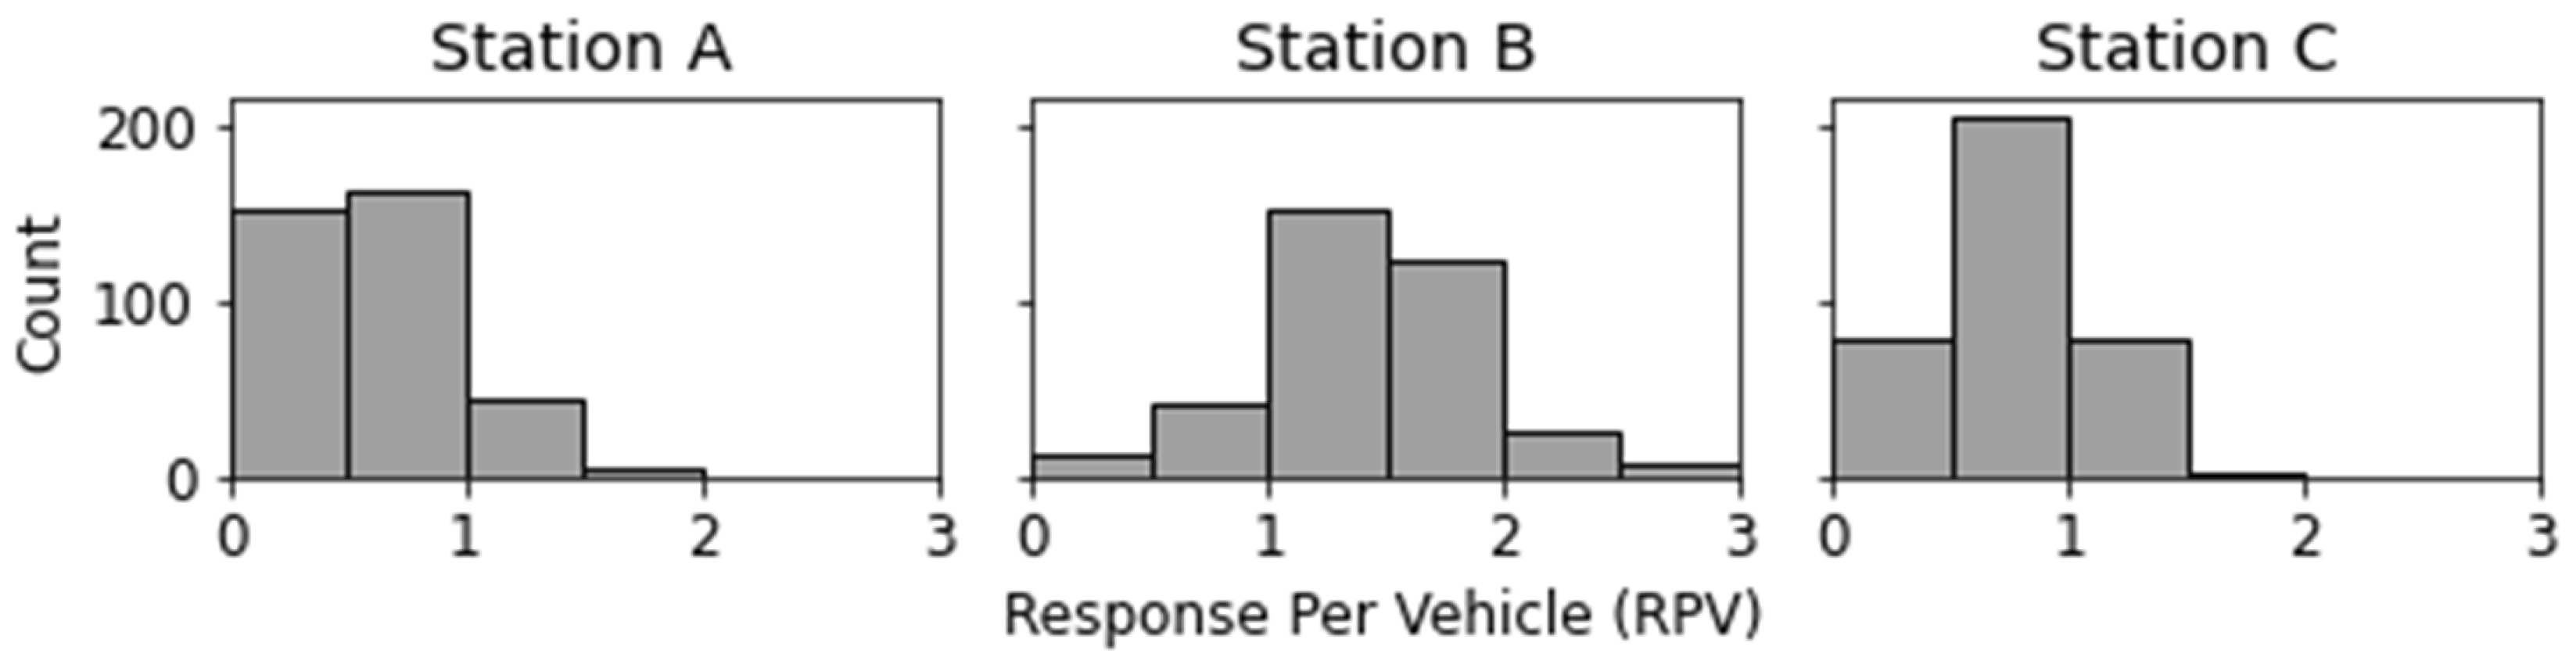
3.3.2. Estimation of Station Activity Level

Once potential inefficiencies have been identified, DAPI analyzes these in the context of the availability of vehicles within the stations. However, information on vehicle and staff availability may not be promptly available. In this context, our approach aims at estimating the activity level of each station at a given time based on the volume of responses it dispatched for a given time window. To accommodate for varying station sizes, we look into the average number of responses per vehicle (RPV) in each station.
Given a station s S , a specific date d, and a integer parameter D , let vehicles ( s , d , D ) be the number of unique active vehicles in station s within the time period from d D 1 2 to d + D 1 2 . The parameter D represents the total number of days to consider when estimating the number of unique vehicles, with the day d at the center. To calculate the number of vehicles, we simply count the number of unique vehicle codes from all the responses made from station s in that time period. An ideal D should be small enough to capture the number of operational vehicles in a station over time but large enough to cover the small fluctuations in the number of responding vehicles on a daily basis. Intuitively, D can be interpreted as “if a vehicle is operational, then it must have made at least one response within the past D 1 2 days up to the next D 1 2 days; otherwise, it is a candidate to be non-operational.” In this study, we set D = 15 , corresponding to a 15-day time span, which we believe is a reasonable time window to detect non-operational candidate vehicles.
Given a station s, a timestamp t, and a constant window length parameter W , let count ( s , t , W ) be the total number of responses made within the time period from t W to t. Intuitively, if W = 2 h, then we consider responses that were made from the past 2 h up to the timestamp. Let day ( t ) be a function that returns the day that a given timestamp t falls under. Equation (3) defines the RPV of a vehicle at a given time.
R P V ( s , t ) = count ( s , t ) vehicles ( s , day ( t ) )
The RPV range may vary between stations due to geographical and operational factors. Figure 5 shows the distribution of the RPV values of three different stations for an arbitrarily chosen time frame, illustrating this. Thus, there is a need to normalize the RPV values to produce a general metric for the activity level. The normalization process is discussed later in the algorithm. The normalized RPV values for each station are hereby referred to as the activity level of each station. Intuitively, a positive activity level means that the station is “busier than usual”, while a negative activity level means that a station is “less busy than usual”.
Given the above formulations, DAPI performs the activity level estimation using Algorithm 2. The algorithm requires the stations S , the vector of dates in the dataset TD , and the vector of timestamps TS from partitioning the timeline into 5 min intervals. Moreover, the algorithm also needs the two parameters D and W . To compute the activity levels efficiently, DAPI makes use of a lookup table to store the number of vehicles and number of emergencies for different combinations so that they are only computed once. Lines 4–7 set up the data structures for the algorithm. Lines 8–13 compute the estimated number of vehicles for different station–date pairs and the number of emergencies for different station–time interval pairs.
Algorithm 2 Activity level estimation algorithm
 Input: S : stations, TD : dates, TS : timestamps, D : time span length, W : window length
 Output: Activity level of each station
  1:
n | S |                             ▹ Number of Stations
  2:
m | TD |                   ▹ Number of Dates in the dataset
  3:
k | TS |                ▹ Number of Time Stamps in the dataset
  4:
V L new vector [ n ] [ m ]
  5:
C L new vector [ n ] [ k ]
  6:
R P V L new vector [ n ] [ k ]
  7:
a c t i v i t y _ l e v e l s new vector [ n ] [ k ]
  8:
for each  s [ 1 n ] , d [ 1 m ]  do            ▹ Each station and date
  9:
     V L [ s ] [ d ] v e h i c l e s ( S [ s ] , TD [ d ] , D )
  10:
end for
  11:
for each  s [ 1 n ] , t [ 1 k ]  do         ▹ Each station and timestamp
  12:
     C L [ s ] [ t ] c o u n t ( S [ s ] , TS [ t ] , W )
  13:
end for
  14:
for each s [ 1 n ] , t [ 1 k ]   do
  15:
     R P V L [ s ] [ t ] R P V ( S [ s ] , TS [ t ] , V L , C L )
  16:
end for
  17:
for each  s [ 1 n ] , t [ 1 k ]   do
  18:
     μ m e a n ( s , t , R P V L )
  19:
     σ s t d ( s , t , R P V L )
  20:
     a c t i v i t y _ l e v e l s [ s ] [ t ] R P V L [ s ] [ t ] μ σ
  21:
end for
  22:
return  a c t i v i t y _ l e v e l s
Next, the RPV is computed for every station–interval pair in lines 14–16. The RPV function in line 15 is exactly the same as the one defined previously, except the precomputed values for the estimated number of vehicles ( V L ) and the emergency counts ( C L ) are added as parameters, so that they do not have to be recomputed several times. Essentially, this means re-expressing the RPV function in Equation (3) above as Equation (4).
R P V ( s , t , V L , C L ) = C L [ s ] [ t ] V L [ s ] [ d a y ( t ) ]
Finally, lines 17–21 normalize the RPV by using z-normalization. First, the mean and standard deviation of the RPV values across all time intervals are computed per station. Then, the activity level is computed as the RPV subtracted by the mean divided by the standard deviation. To capture differences in the activity of stations during different times of the day, μ and σ can be computed according to the time of the day, taking into account the t parameter. For example, a separate mean and standard deviation can be used for each hour of the day.
The algorithm returns the activity level of each station during each time window. Using this as the basis, we then analyze each potential inefficiency and the activity levels of the stations around it. An example illustrating the introduced concepts related to activity level is shown in Figure 6.

3.3.3. Validation and Analysis

While the examination of individual examples already provides valuable support to EMS stakeholders, there is a need to further statistically validate the correlations between potential inefficiencies and activity levels. In this step, we establish a framework used by DAPI to validate the correlation between potential inefficiencies and the station activity levels identified in the previous steps, with the aim of aiding the identification of potential causes for the identified bottlenecks. The framework can be summarized in two main steps: (1) identification of responses to validate, and (2) statistical comparison of activity levels of relevant stations.
First, we identify a set of potential inefficiencies X to be validated. X can be selected to include all potential inefficiencies to validate the entire system, or X can be selected to be a subset of the found cases to perform more localized validations (e.g., specific spatiotemporal footprints). At the highest level, DAPI considers all the emergency occurrences in mainland Portugal, but the study scenario is parameterizable by spatiotemporal criteria (specific regions and time intervals) and typical attribute-based filters (e.g., specific types of vehicles, emergencies).
We then set up the statistical test as follows. For each x X , let C S be the set of stations that are closer (but did not respond) to the emergency described in x. For each c C , activity ( c , e ) is recorded, where e is the timestamp of the emergency described in x. Finally, we perform a non-parametric one-sample Wilcoxon signed-rank test on the recorded cases to check whether the activity levels diverge from 0 on a significant level, with 0 being the baseline activity level of each station according to the definition of the z-normalized activity level. This test was used because the distribution of activity levels is not necessarily normal. Since we are using the Wilcoxon signed-rank test, the size of X should be sufficiently large for statistical soundness. Previous works have placed a minimum of 16 samples [44], but larger sizes are understandably preferable.
The selection of X can be done systematically to perform more localized validations of potential inefficiencies. For instance, X can be selected to include potential inefficiencies in a specific region or time period. In addition, to assess whether the inefficiencies are caused by high activity levels of nearby stations, simplistic yet robust statistical tests can be carried out. These processes are demonstrated later in Section 4.

4. Results and Discussion

In this section, we present a case study on Portuguese EMS response data. We divide this section into three subsections, in which we answer the research questions defined in Section 3.2 through acquired insights from the experimental validation of the proposed approach, showing its effectiveness, usability, and interpretability.

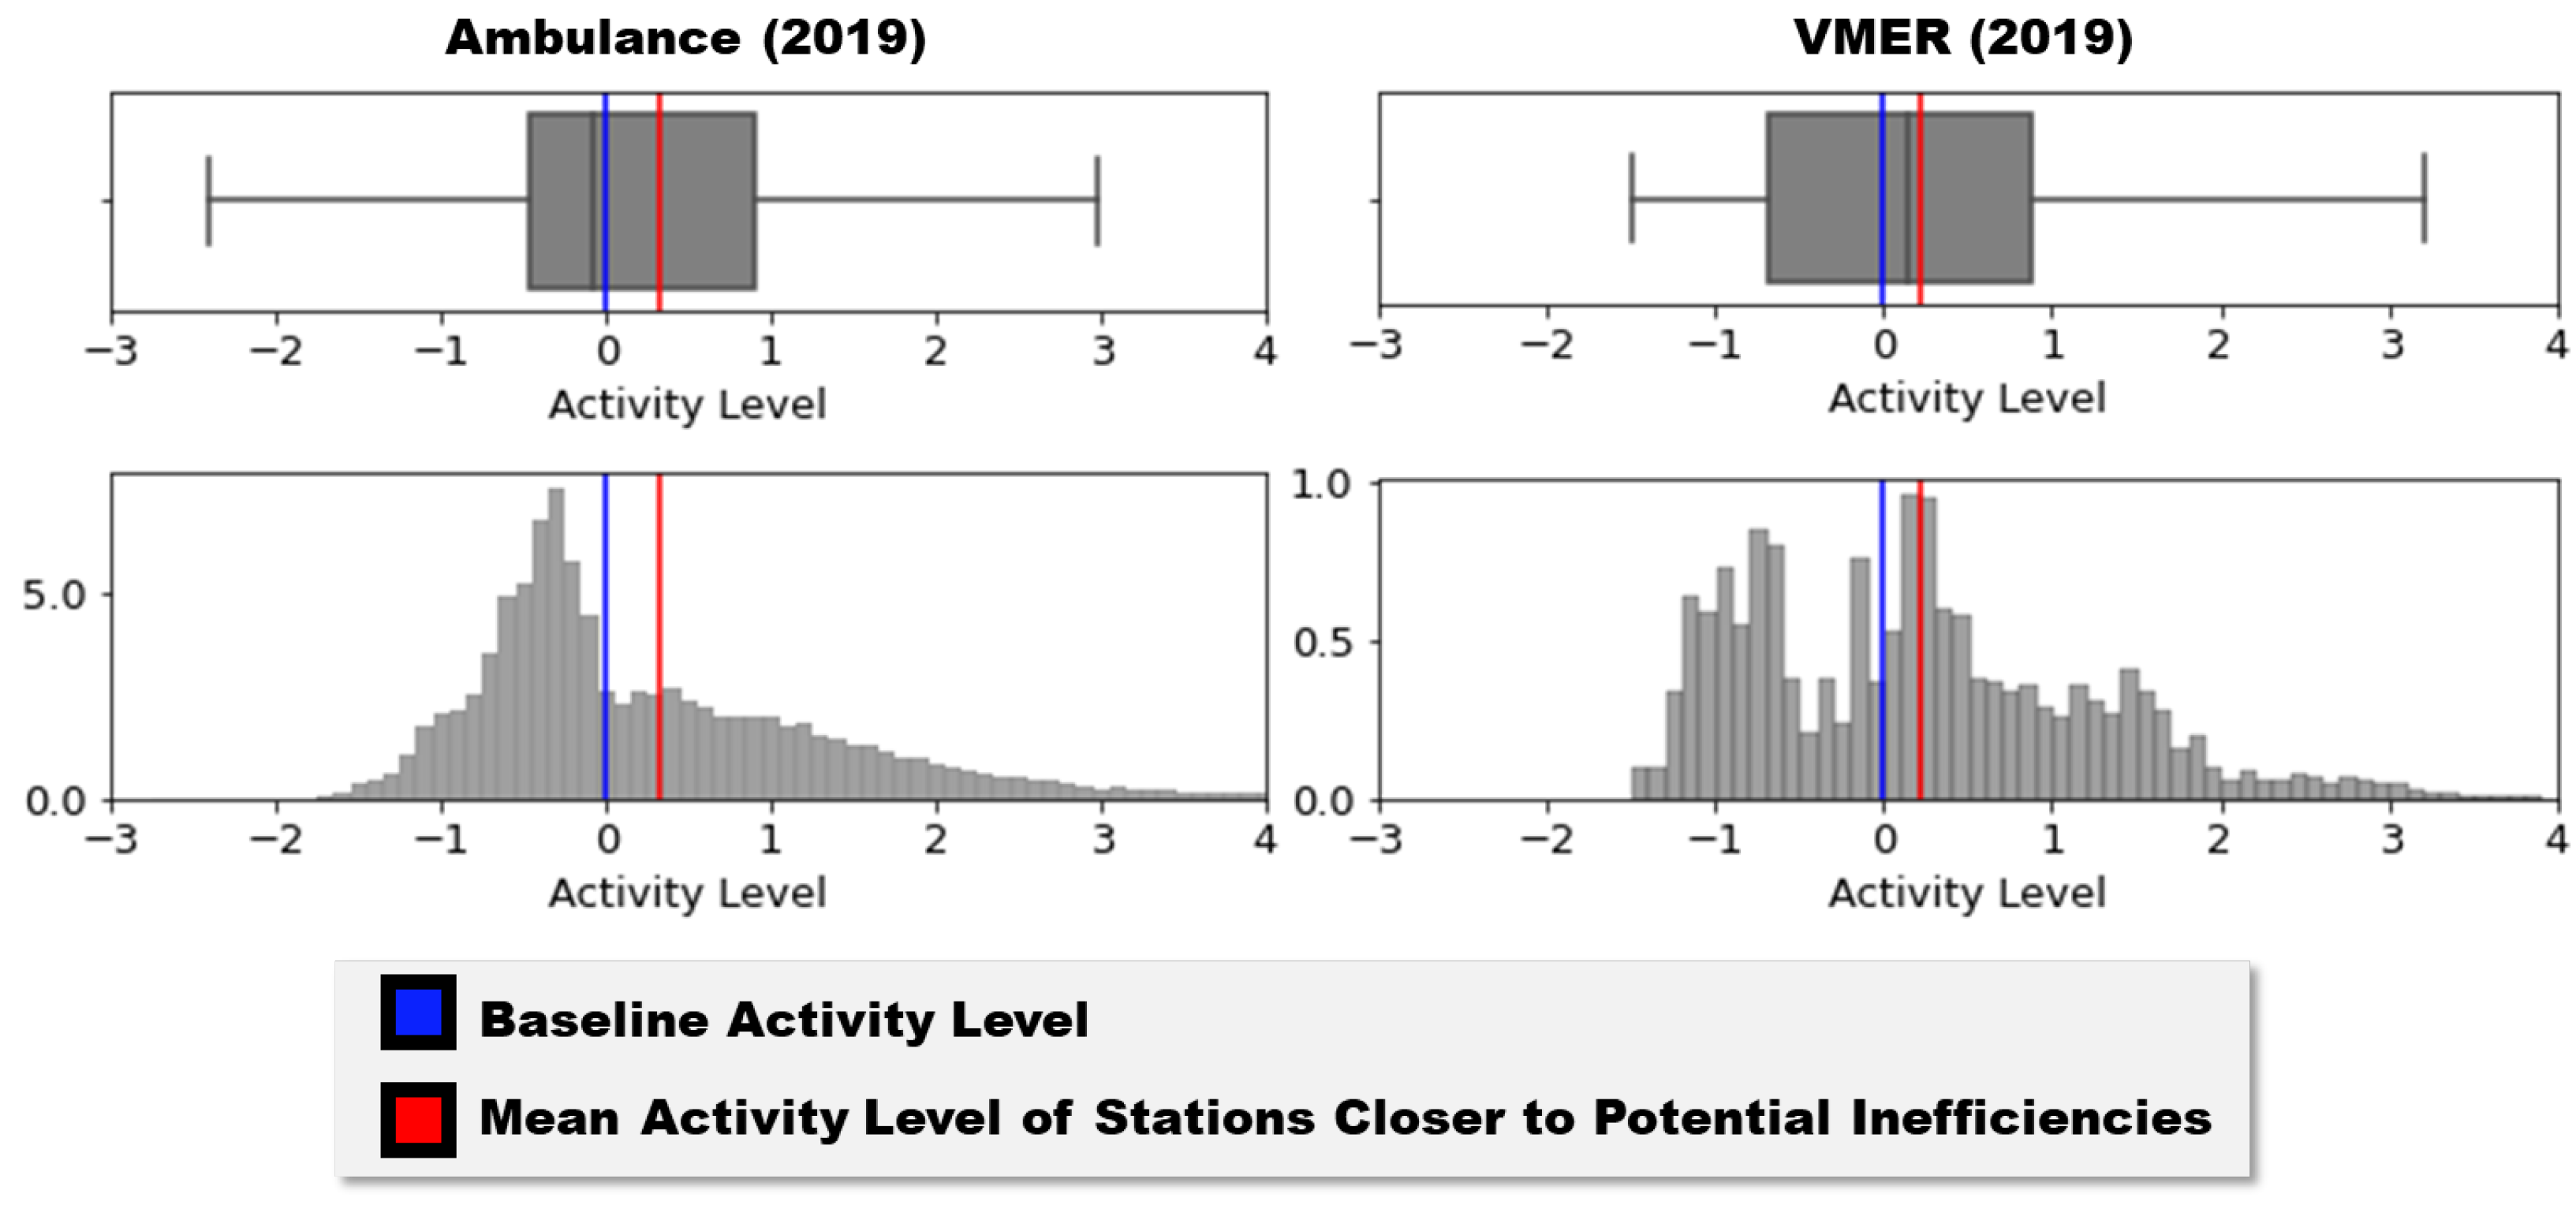
4.1. RQ1: How Correlated Are Potential Inefficiencies with Activity Levels of Closer Stations?

First, we investigate potential inefficiencies on a macro level. To do this, we discover all potential inefficiencies for the years 2017, 2018, and 2019 for two groups of vehicles: ambulances and vehicles of medical emergency and reanimation (VMER). Ambulances provide basic life support and respond to non-critical situations, while VMER are advanced life support ambulances that are staffed by trained medical personnel and contain advanced medical equipment. For each group, we only consider emergency responses that were responded to by a vehicle in that category. For the purposes of this analysis, we assume that each emergency strictly requires a specific type of vehicle.
In running the algorithm, we consider a 2 h time window ( W = 2 h) in detecting the activity level of a station at a given time. D = 15 (15 days) is used for estimating the number of unique vehicles. In addition, in the case of ambulances, we restrict the identification of closer stations to those in the same municipality as the emergency to respect operational jurisdictions. The responding station, however, can be from other municipalities. Finally, we apply an hourly segmentation for the normalization of the RPV to account for possible differences in the availability of vehicles at different times of the day.
Table 1 shows the results for the years 2017–2019. From here, we can see that a substantial amount of potential inefficiencies have been detected consistently for both ambulances and VMER. Furthermore, findings per year consistently confirm that closer emergency stations had significantly higher levels of activity than usual when those inefficiencies happened. To illustrate further, Figure 7 shows the distribution of activity levels of closer stations during potential inefficiencies in 2019. Here, it can be seen that closer stations more often exhibit positive activity levels in these time frames. These provide compelling evidence that as a whole, potential inefficiencies are correlated with high levels of activity and, consequently, high levels of demand for medical emergency services.

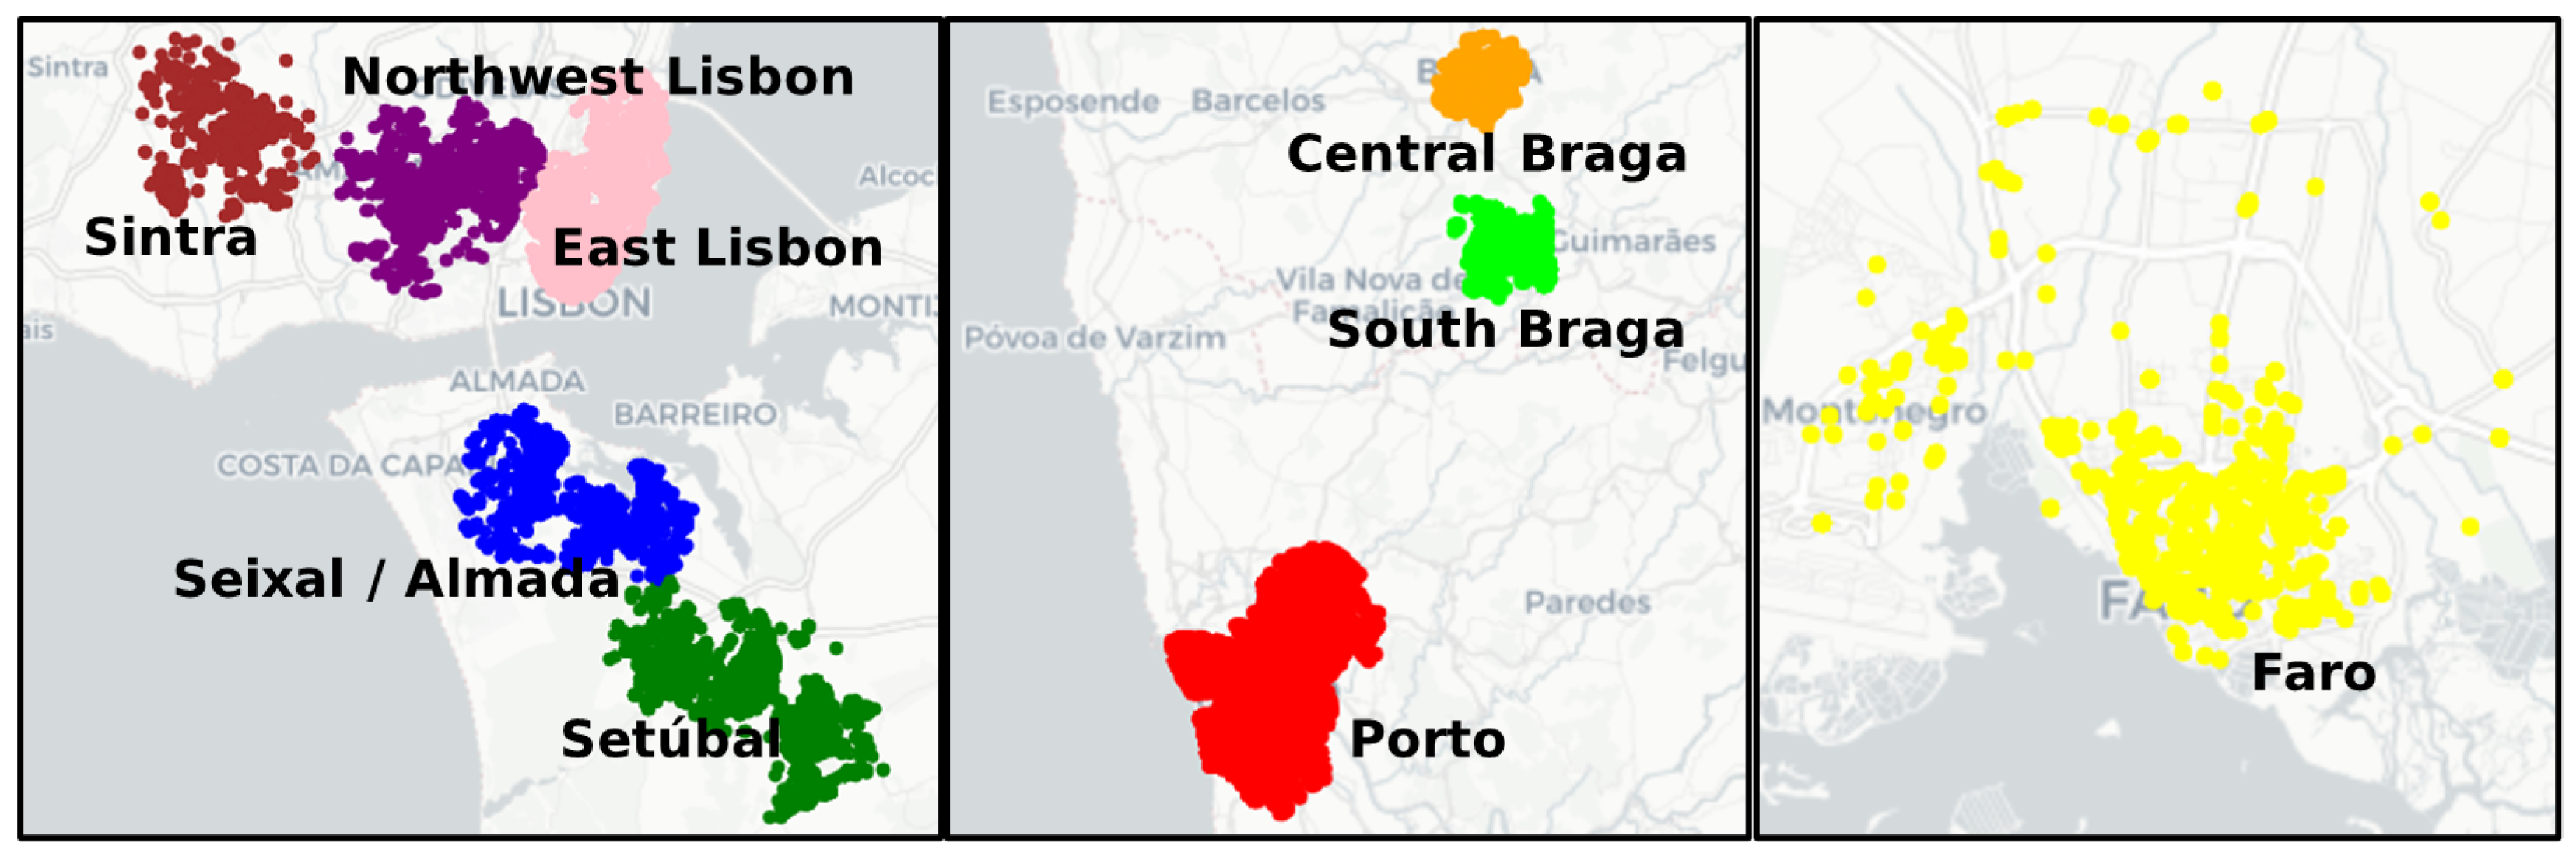
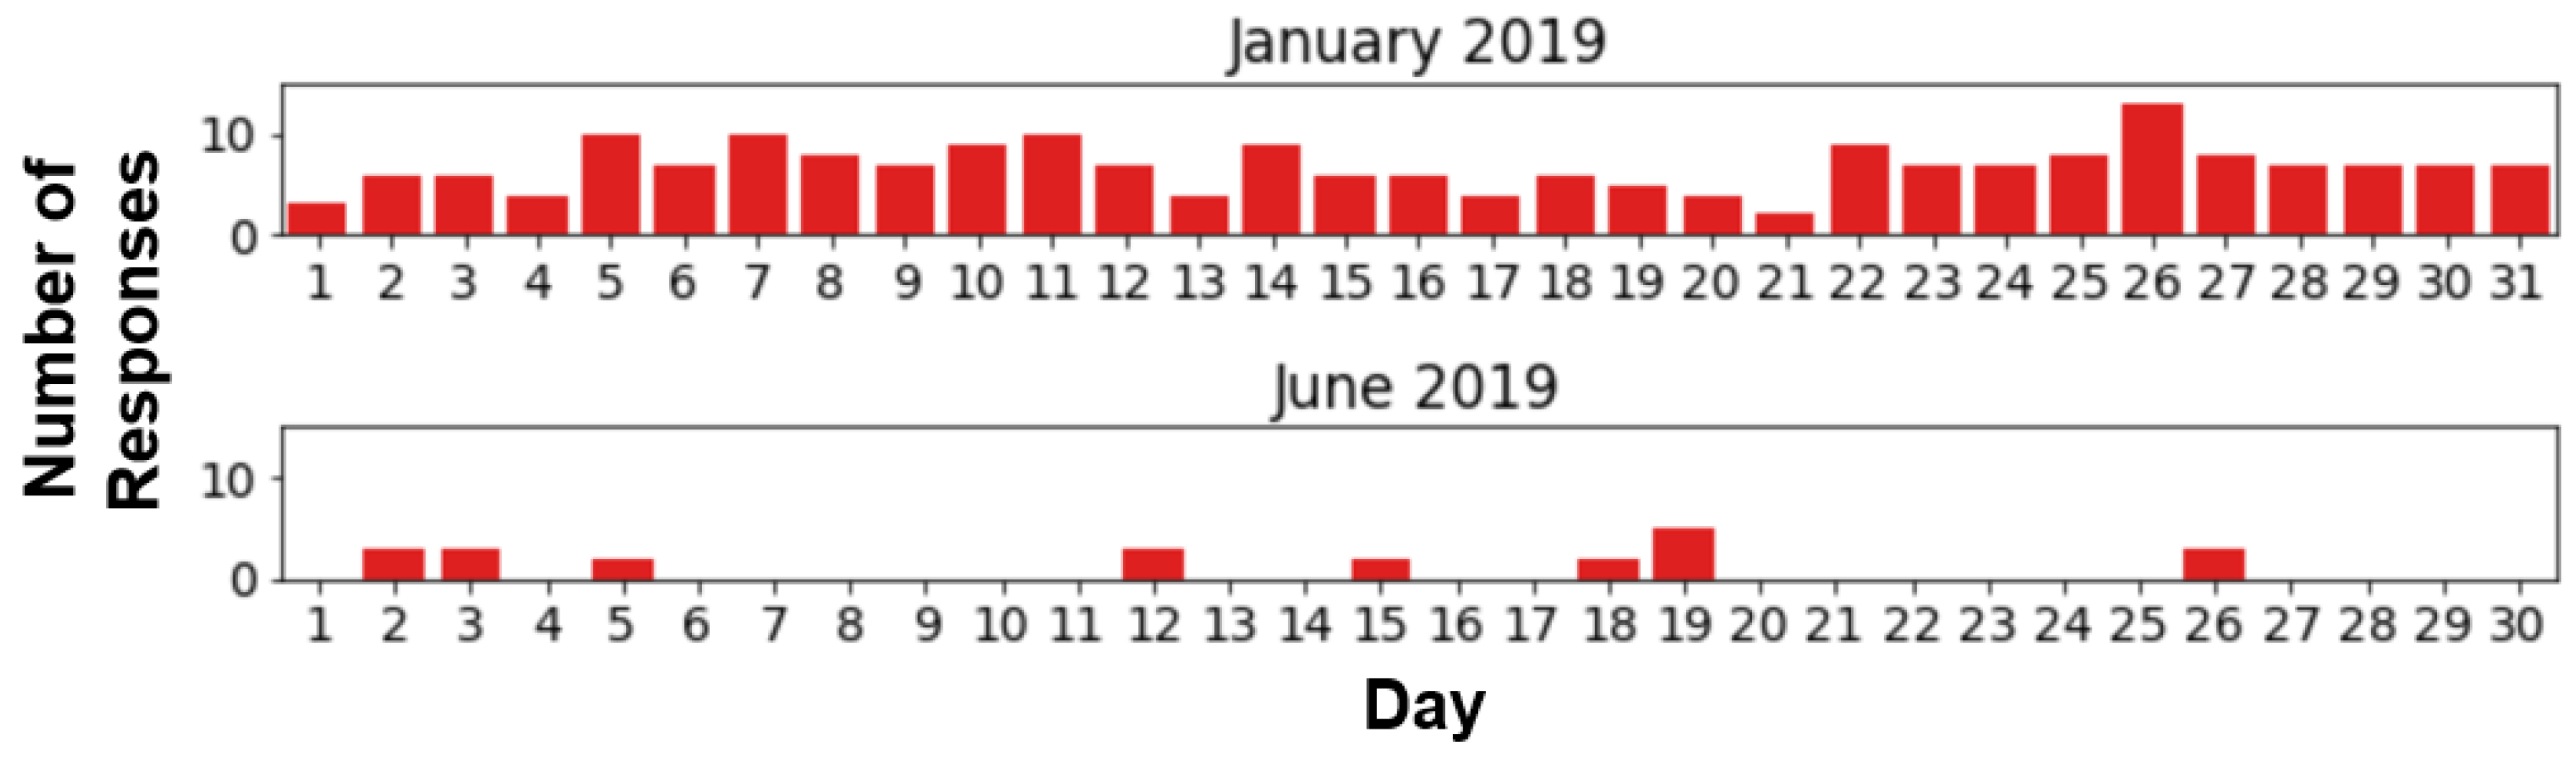
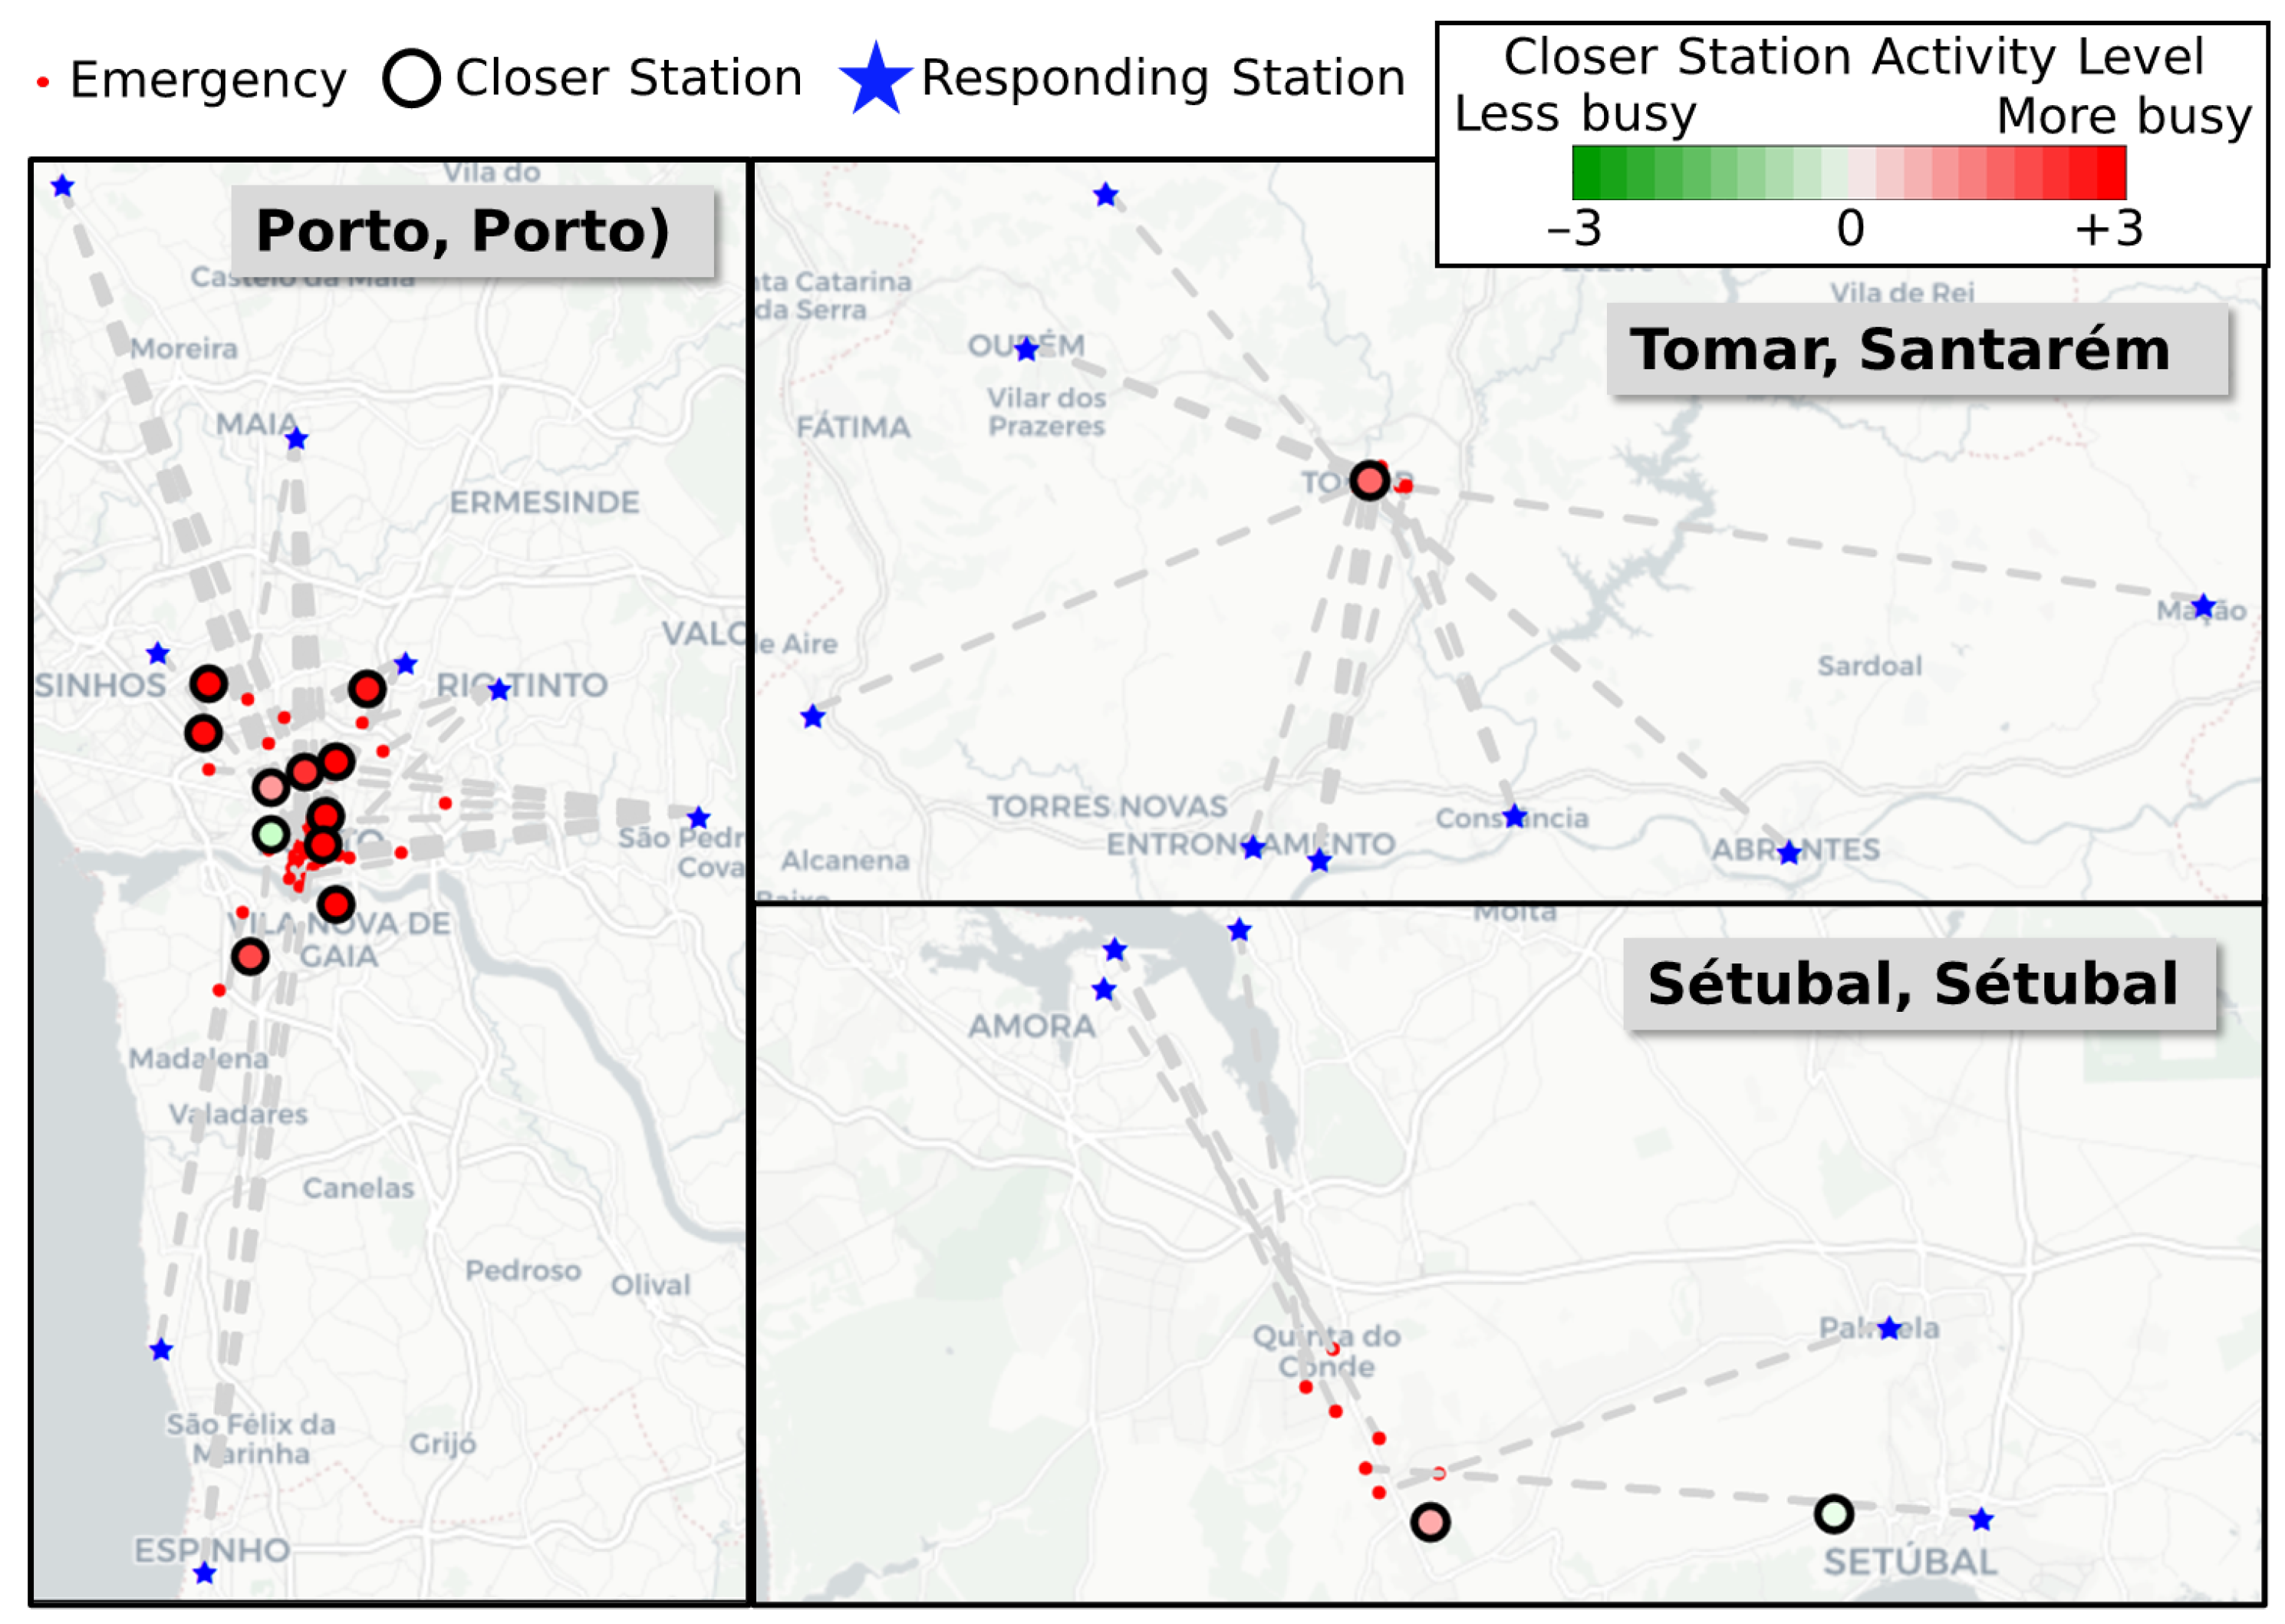
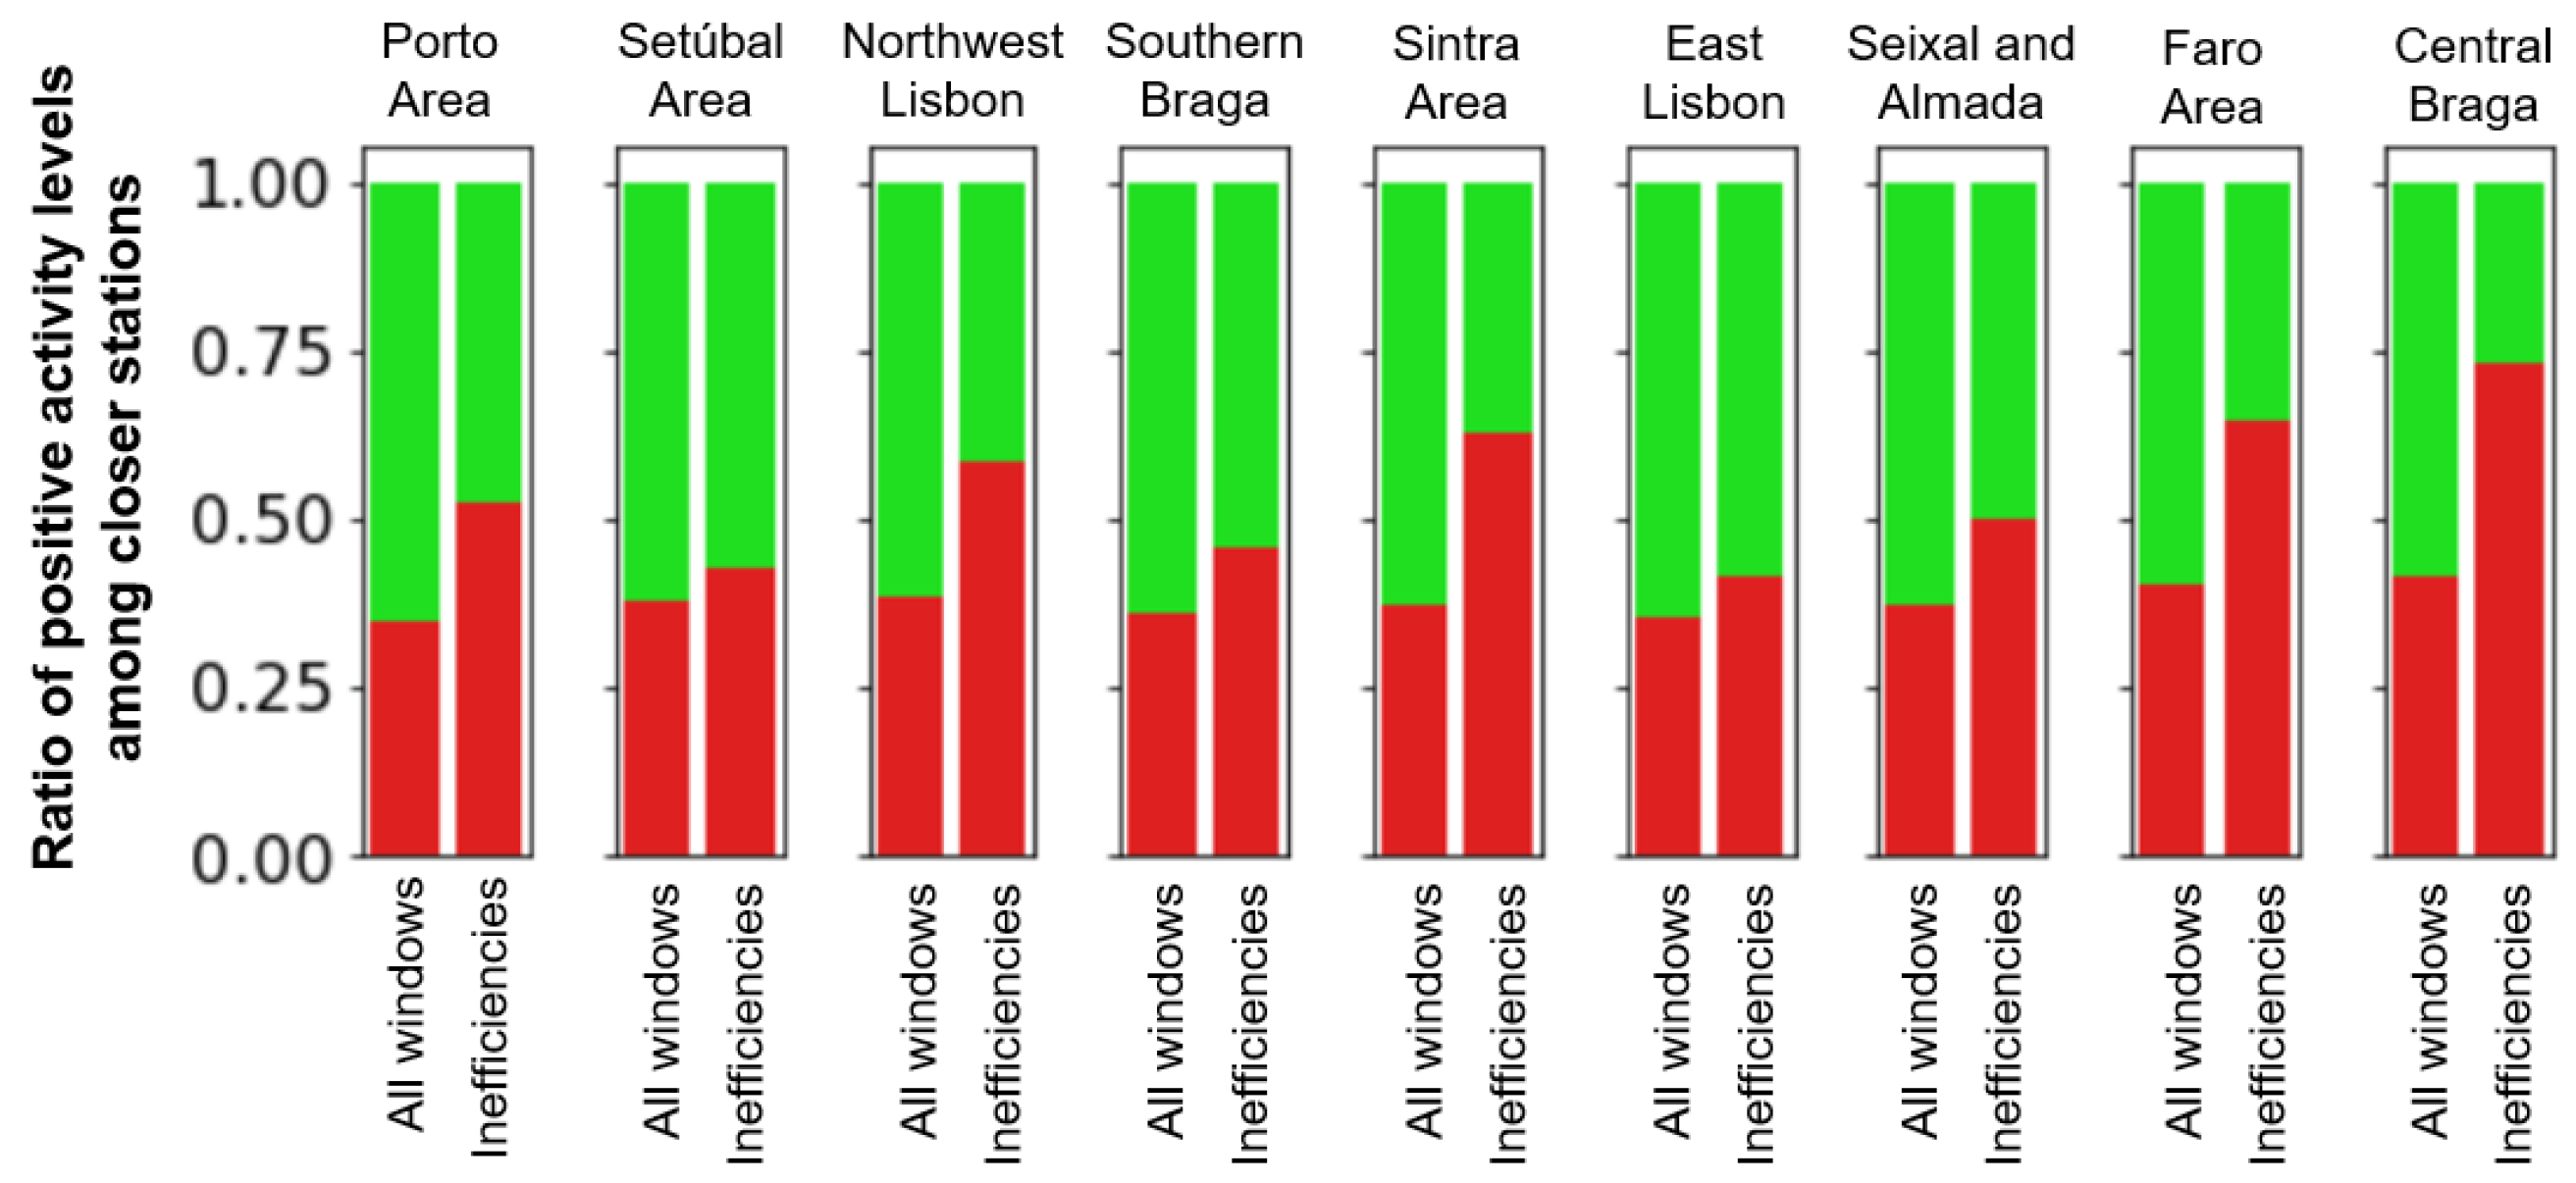
4.2. RQ2: Are There Specific Areas or Days in Which Potential Inefficiencies Occurred Often?

To answer this question, we apply spatial clustering to the potential inefficiencies based on the location of the emergency. To do this, we use a density-based clustering algorithm, DBSCAN [45], with Haversine distance as the basis. We set the eps parameter to 2 km and the minpts parameter to 500. This allows us to systematically find dense emergency occurrences involved in potential inefficiencies that are geographically close to one another.
Figure 8 shows the pertinent clusters of potential inefficiencies identified for the entire year of 2019 considering ambulances, while Table 2 shows the statistics of the activity levels of closer stations for each area cluster. From here, we can see that the largest concentration of potential inefficiencies are detected around the Porto area, while there are eight other identified clusters around Portugal. Most of these areas, expectedly, are included in the most populated areas of Portugal, with the exception of Faro. Nevertheless, Faro is a popular tourist destination.
For seven out of the nine clusters, the activity levels of the closer stations are above the baseline activity level at a significance level of 0.01. Interestingly, the clusters of Seixal and Almada and East Lisbon revealed several potential inefficiencies, yet did not generally exhibit high activity levels among closer stations during these inefficiencies. This suggests that the potential inefficiencies in general for this cluster are not caused by high demand, but by other reasons.
Zooming in further, we discover clusters of potential inefficiencies that happen on a daily basis. To do this, we apply the spatial clustering using DBSCAN for each day, with the eps parameter set to 2 km and the minpts parameter set to 10. Table 3 shows some of these clusters, with the corresponding visualizations in Figure 9.
In Porto, there was a large concentration of emergencies that happened on a single day. A majority of these emergencies were intoxication-related, which was likely due to a big holiday on that date. Most closer stations had very high activity levels during these emergency occurrences. However, there was one station that had a negative activity level. These instances were mostly from emergencies that happened in the morning hours (12 a.m. to 8 a.m.), where said station was not able to respond, despite evidence in the data that it can dispatch responses in those hours. This means that this station was not able to respond on the 1st of January due to some uncertain factor. On the other hand, in Tomar, there was also an unusually high number of emergencies on a day that coincides with a local festival. In total, 38 emergencies occurred, compared to the daily average of 14.22. This was likely the reason why faraway stations were called to respond to some of them. Finally, in Setúbal, there was a day when a high concentration of potential inefficiencies occurred. In this case, the activity levels of the two closer stations were not consistently positive. In the case of the closer station, while it had a positive mean activity level, this was influenced by only a few instances with very high values. As such, overall, there was no statistically significant divergence from the baseline for this cluster, suggesting that these potential inefficiencies are not caused by high activity, but by other factors.
Applying the same algorithm for VMER, but with the parameter of minpts reduced to 100 due to the smaller number of VMER responses, Table 4 shows the statistics of activity levels of closer stations for each area cluster.
Unlike the case for ambulances, potential inefficiencies among VMER responses are fewer and far between. Nevertheless, there are six area clusters that exhibited a large number of potential inefficiencies. However, most of them are not systematically correlated with high activity levels in closer stations. These dense clusters of potential inefficiencies are likely due to some operational jurisdictions observed by the management. For instance, Figure 10 shows emergencies in the Sesimbra cluster. In most of these emergencies, the closest station is BIHBARRER, and yet it was consistently BIHGO station that made the dispatch.

4.3. RQ3: Can Stations Be Profiled According to Their Activity Level to Promote Actionability?

The previous analysis shows that some stations have a higher likelihood of suffering from emergency response bottlenecks. In this context, assessing potential causes is relevant in order to distinguish between occurrences that are due to high activity levels (due to peaks in EMS demand) and those due to other potential causes.
Figure 11 shows, for each cluster, the ratio of positive activity levels among closer stations within the time windows of the potential inefficiency occurrences, compared to the ratio of positive activity levels among the same stations over all time windows. Among these, differences are most apparent in Cluster I (central Braga) and Cluster H (Faro). This provides further evidence that, in general, closer stations are busier than usual during the occurrence of potential inefficiencies.
It is interesting to note that even though potential inefficiencies are correlated with higher activity levels in closer stations, there is also a substantial amount of cases where closer stations have negative (less busy than usual) activity levels. To further investigate this, it is possible to break down the activity levels for each station. For instance, considering the Central Braga cluster, Table 5 shows a list of stations closer to emergencies involved in potential inefficiencies.
From here, we can see that three out of the four stations generally have high activity levels in the presence of potential inefficiencies. The exception is BIBRAGA2, which has a relatively low mean activity level. Furthermore, this station had a positive activity level in only 32.66% of the potential inefficiency cases. This suggests that, in general, this station is unable to respond to emergencies, not because of high load, but due to other unknown factors, such as the irregularity of service schedules, lack of staff, or other context-dependent reasons. Nonetheless, it is important to visualize these stations for stakeholders to gain a better insight into the dynamics of potential inefficiencies within the system. In fact, the BIBRAGA2 station has apparent irregularities in response in some periods of time, as shown in Figure 12, where the number of responses became evidently sparse in June 2019. Without further contextual information, it is impossible to determine whether this was caused by the unavailability of vehicles, conscious operational decisions, or other reasons.
Overall, for ambulances, 43673 out of 78817 identified potential inefficiencies (55.41%) are associated with a positive mean activity level among closer stations. For VMER, 3668 out of 5176 potential inefficiencies (58.53%) are associated with a positive mean activity level.

5. Conclusions

In this paper, we presented an approach for the discovery and analysis of potential inefficiencies in medical emergency response data and applied it to real-world EMS data from mainland Portugal. In this work, we make the following contributions:
1.
We introduce a robust and efficient approach for the identification of potential inefficiencies in emergency response data that is sensitive to differences in the areas of coverage of stations. A tool, DAPI, is made available to this end.
2.
Furthermore, said approach is able to perform statistical analysis on response bottlenecks in relation to station activity levels with the aim of assessing potential causes. DAPI is able to perform this assessment in the presence of spatiotemporal dispatch information only, thus being applicable to EMS systems with minimal records of historical emergency data.
3.
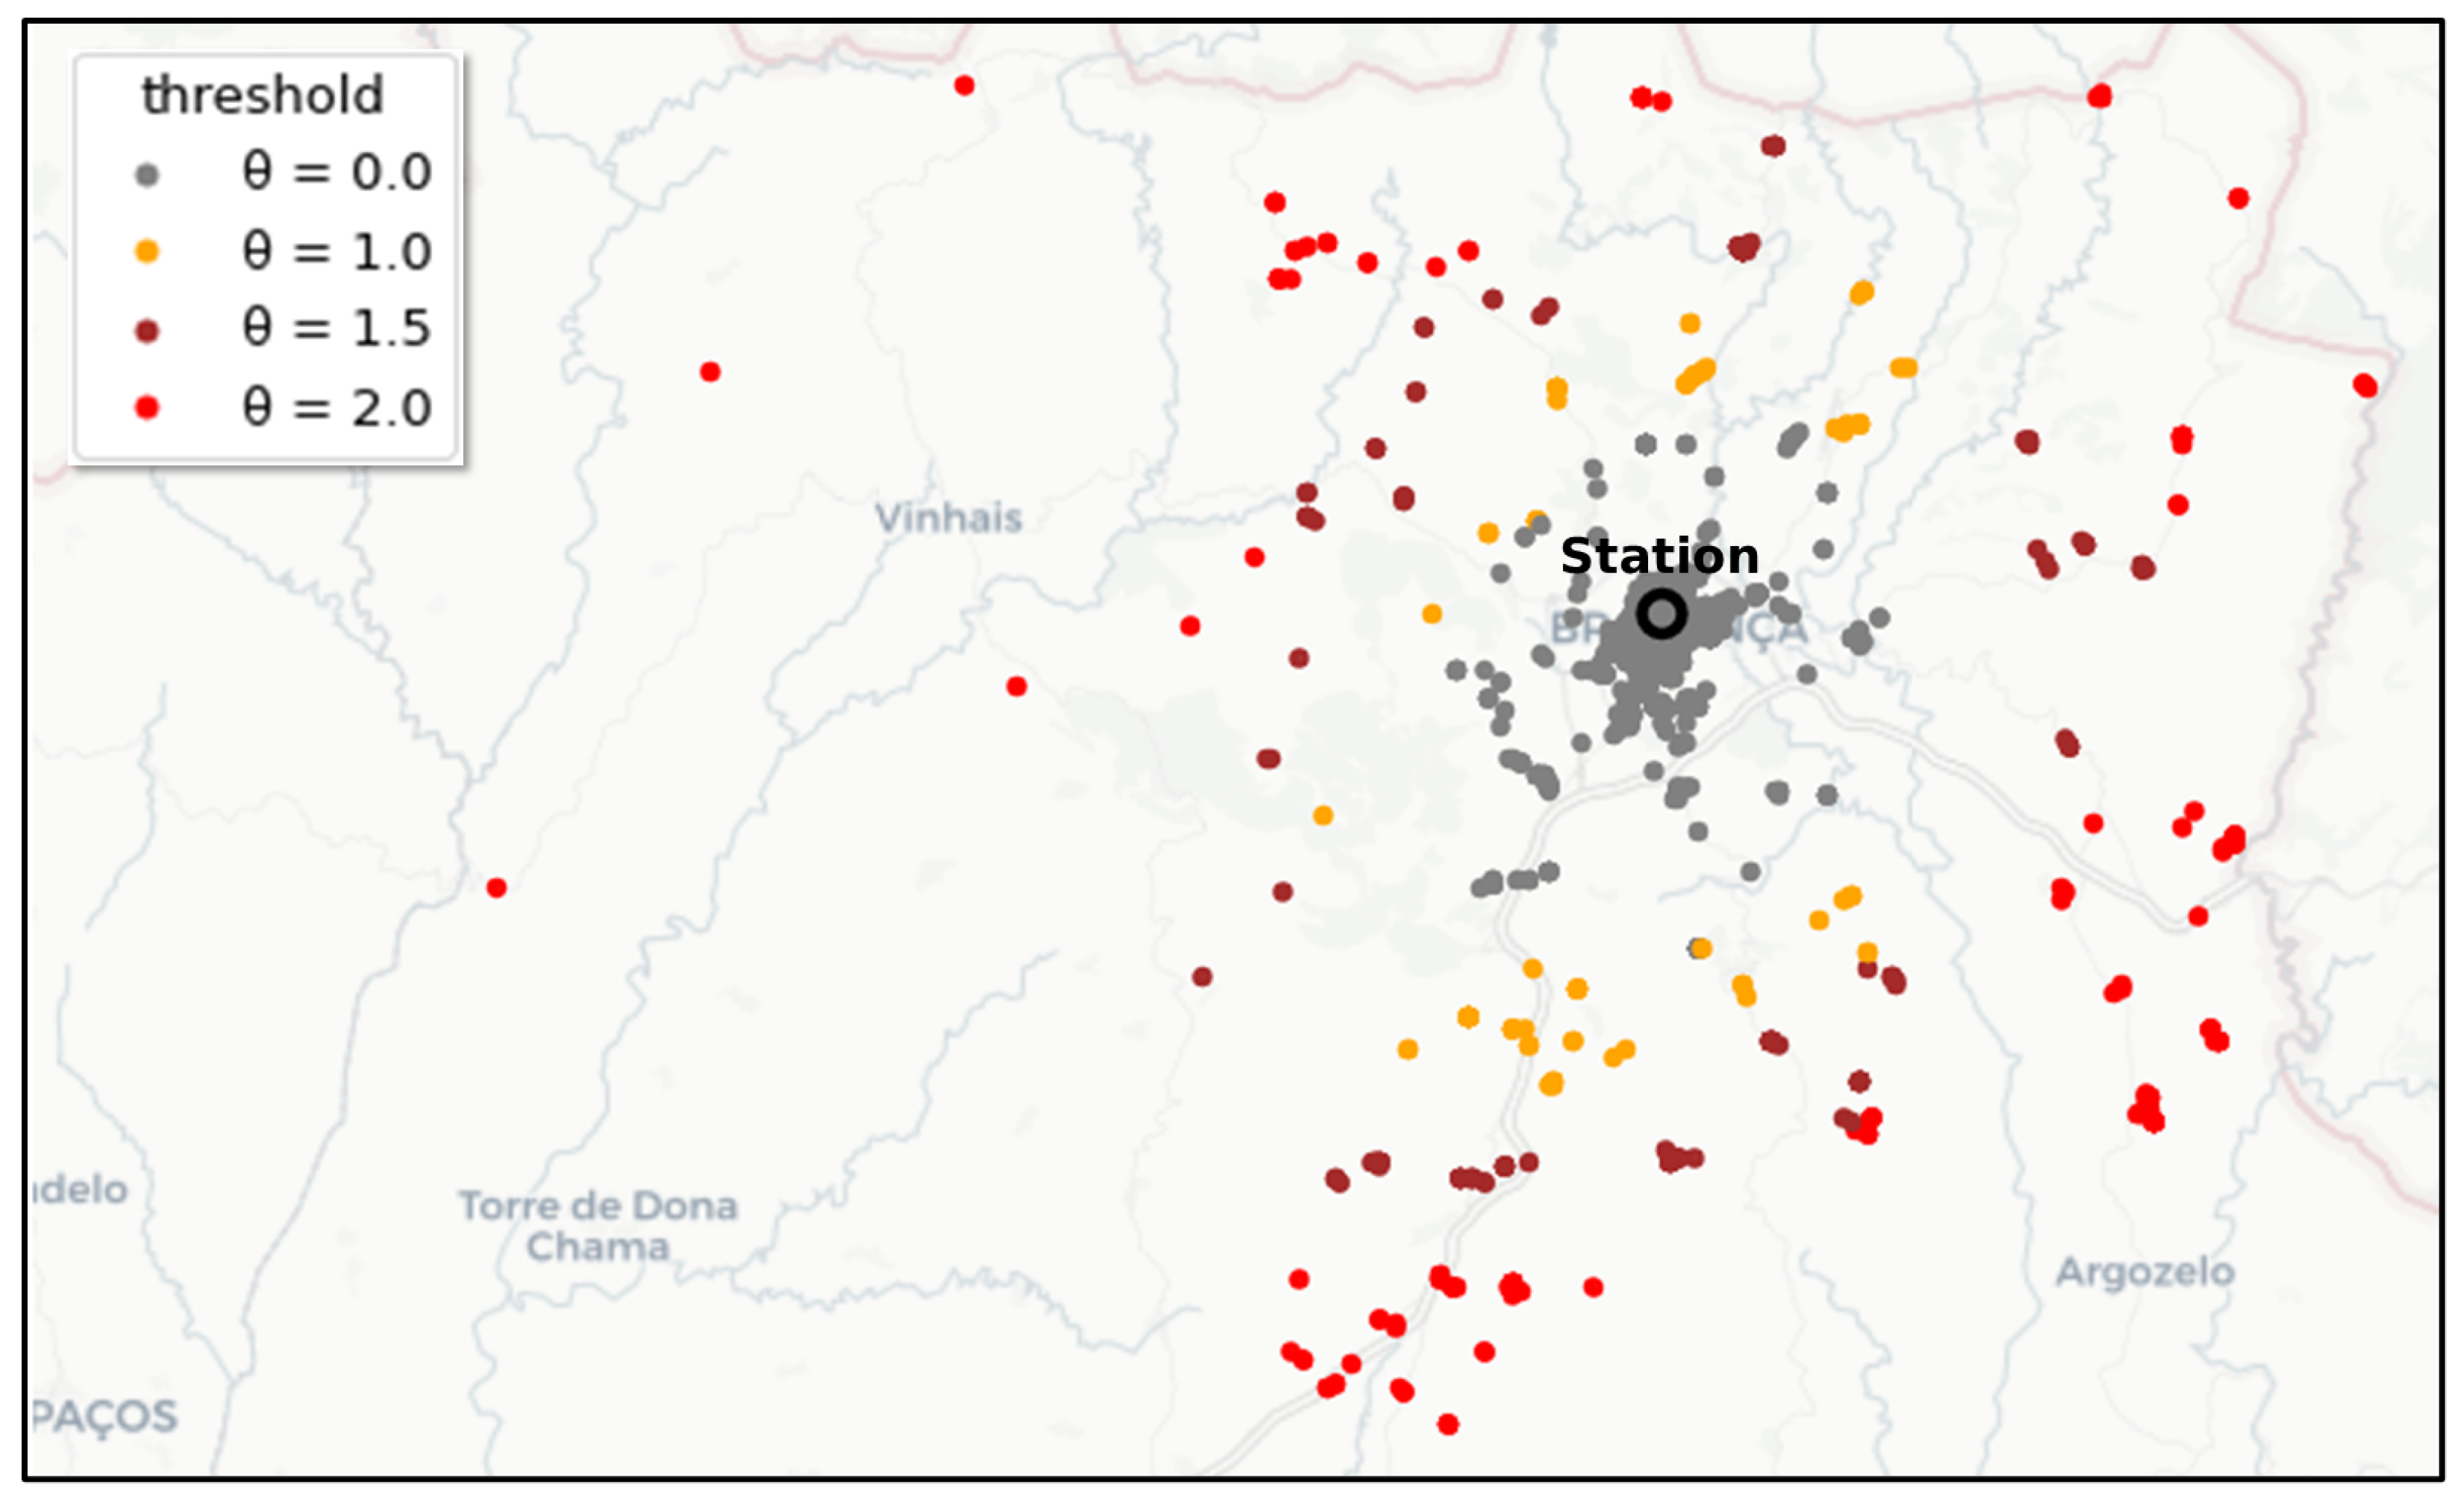
We offer the possibility of visualizing potential inefficiencies in interactive maps under a parameterizable spatiotemporal footprint. DAPI integrates these graphical facilities with guarantees of statistical significance, serving as a valuable decision support tool for EMS stakeholders.
The application of DAPI at a national level, using the Portuguese case study, further revealed two important observations:
The majority of potential inefficiencies are significantly correlated with high activity levels among closer stations for both ambulance and VMER data across different years.
Potential inefficiencies appear to be geographically located according to dense clusters. Some clusters show evidence of a correlation between potential inefficiencies and high activity levels, while some clusters do not, suggesting that inefficiencies are associated with some unknown factors.
This study highlights the value of knowledge discovery and visualization for rich historical data, particularly medical emergency responses. The proposed tool can provide valuable inputs to aid EMS management in several sectors. The proposed approach has applications in augmenting various aspects of emergency response. In ambulance dispatch planning, it can be used to choose appropriate and targeted dispatch strategies to minimize inefficiencies in specific areas. In vehicle placements and routing, it can be used as basis for making decisions on vehicle and station relocation, or in deciding placements for new stations. Activity level patterns of stations can be used as a guide for planning hospital evacuations or humanitarian responses. Furthermore, while we demonstrated our approach using Portuguese EMS data as the case study, there is potential for the approach to be applied in EMS systems and other domains as well. For instance, it could be applied to domains centered around spatiotemporal service allocation, such as the delivery of goods or crime prevention.
Finally, we present some directions for future work: first, the integration of contextual factors such as road conditions (traffic, road closures), weather conditions, and local events (festivals, sports events) in the process of discovering potential inefficiencies; second, the consideration of succeeding stages in the emergency response, such as the transportation of the patient to the hospital and the procedures thereafter; third, the development of effective real-time visualization and decision support tools for EMS stakeholders, which could lead to more proactive interventions in emergency response policies.

Author Contributions

Conceptualization, Thomas James Tiam-Lee, Rui Henriques, and Vasco Manquinho; methodology, Thomas James Tiam-Lee; software, Thomas James Tiam-Lee; validation, Thomas James Tiam-Lee, Rui Henriques, and Vasco Manquinho; formal analysis, Thomas James Tiam-Lee; investigation, Thomas James Tiam-Lee, Rui Henriques, and Vasco Manquinho; resources, Vasco Manquinho; data curation, Thomas James Tiam-Lee, Rui Henriques, and Vasco Manquinho; writing—original draft preparation, Thomas James Tiam-Lee; writing—review and editing, Rui Henriques and Vasco Manquinho; visualization, Thomas James Tiam-Lee; supervision, Rui Henriques and Vasco Manquinho; project administration, Vasco Manquinho and Rui Henriques; funding acquisition, Vasco Manquinho and Rui Henriques. All authors have read and agreed to the published version of the manuscript.

Funding

This research was funded by Fundação para a Ciência e Tecnologia (FCT) through projects DATA2HELP DSAIPA/AI/0044/2018 and ILU DSAIPA/AI/0111/2018, and Instituto de Engenharia de Sistemas e Computadores-Investigação e Desenvolvimento (INESC-ID) pluriannual UIDB/50021/2020.

Institutional Review Board Statement

Not applicable.

Informed Consent Statement

Not applicable.

Data Availability Statement

Source code and sample data are publicly made available at https://github.com/thomastiamleept/dapi/ (accessed on 22 May 2022).

Acknowledgments

The authors would like to thank Instituto Nacional de Emergência Médica (INEM) for providing us with the emergency data used in the development of this study.

Conflicts of Interest

The authors declare no conflict of interest.

References

  1. Sheu, J.B. A novel dynamic resource allocation model for demand-responsive city logistics distribution operations. Transp. Res. Part Logist. Transp. Rev. 2006, 42, 445–472. [Google Scholar] [CrossRef]
  2. Aminzadegan, S.; Tamannaei, M.; Fazeli, M. An integrated production and transportation scheduling problem with order acceptance and resource allocation decisions. Appl. Soft Comput. 2021, 112, 107770. [Google Scholar] [CrossRef]
  3. Araújo, A.; Cacho, N.; Bezerra, L.; Vieira, C.; Borges, J. Towards a crime hotspot detection framework for patrol planning. In Proceedings of the 2018 IEEE 20th International Conference on High Performance Computing and Communications, Exeter, UK, 28–30 June 2018; pp. 1256–1263. [Google Scholar]
  4. Mukhopadhyay, A.; Pettet, G.; Vazirizade, S.M.; Lu, D.; Jaimes, A.; El Said, S.; Baroud, H.; Vorobeychik, Y.; Kochenderfer, M.; Dubey, A. A review of incident prediction, resource allocation, and dispatch models for emergency management. Accid. Anal. Prev. 2022, 165, 106501. [Google Scholar] [CrossRef] [PubMed]
  5. Rathore, M.M.; Ahmad, A.; Paul, A.; Wan, J.; Zhang, D. Real-time medical emergency response system: Exploiting IoT and big data for public health. J. Med. Syst. 2016, 40, 283. [Google Scholar] [CrossRef] [PubMed]
  6. Yu, D.; Yin, J.; Wilby, R.L.; Lane, S.N.; Aerts, J.C.; Lin, N.; Liu, M.; Yuan, H.; Chen, J.; Prudhomme, C.; et al. Disruption of emergency response to vulnerable populations during floods. Nat. Sustain. 2020, 3, 728–736. [Google Scholar] [CrossRef]
  7. Carlson, J.N.; Karns, C.; Mann, N.C.; E. Jacobson, K.; Dai, M.; Colleran, C.; Wang, H.E. Procedures performed by emergency medical services in the United States. Prehospital Emerg. Care 2016, 20, 15–21. [Google Scholar] [CrossRef]
  8. Henderson, S.G.; Mason, A.J. Ambulance service planning: Simulation and data visualisation. In Operations Research and Health Care; Springer: Berlin/Heidelberg, Germany, 2005; pp. 77–102. [Google Scholar]
  9. Boutilier, J.J.; Chan, T.C. Ambulance emergency response optimization in developing countries. Oper. Res. 2020, 68, 1315–1334. [Google Scholar] [CrossRef]
  10. Ferrari, T.; Camara, M.V.O.; Nassi, C.D.; Ribeiro, G.M.; Costa Junior, R.R.; Ribeiro Junior, C.; Bilate, A. Analysis of the location of rescue ambulance dispatch bases: A case study in Rio de Janeiro, Brazil. Geogr. Anal. 2018, 50, 397–421. [Google Scholar] [CrossRef]
  11. Brotcorne, L.; Laporte, G.; Semet, F. Ambulance location and relocation models. Eur. J. Oper. Res. 2003, 147, 451–463. [Google Scholar] [CrossRef]
  12. Talarico, L.; Meisel, F.; Sorensen, K. Ambulance routing for disaster response with patient groups. Comput. Oper. Res. 2015, 56, 120–133. [Google Scholar] [CrossRef] [Green Version]
  13. Tassone, J.; Choudhury, S. A comprehensive survey on the ambulance routing and location problems. arXiv 2020, arXiv:1603.00278. [Google Scholar]
  14. Bish, D.R.; Agca, E.; Glick, R. Decision support for hospital evacuation and emergency response. Ann. Oper. Res. 2014, 221, 89–106. [Google Scholar] [CrossRef]
  15. Yazdani, M.; Mojtahedi, M.; Loosemore, M.; Sanderson, D.; Dixit, V. Hospital evacuation modelling: A critical literature review on current knowledge and research gaps. Int. J. Disaster Risk Reduct. 2021, 66, 102627. [Google Scholar] [CrossRef]
  16. Wang, D.; Guo, D.; Zhang, H. Spatial temporal data visualization in emergency management: A view from data-driven decision. In Proceedings of the 3rd ACM SIGSPATIAL Workshop on Emergency Management using, Beach, CA, USA, 7–10 November 2017; pp. 1–7. [Google Scholar]
  17. Dusse, F.; Júnior, P.S.; Alves, A.T.; Novais, R.; Vieira, V.; Mendonça, M. Information visualization for emergency management: A systematic mapping study. Expert Syst. Appl. 2016, 45, 424–437. [Google Scholar] [CrossRef]
  18. Aringhieri, R.; Bruni, M.E.; Khodaparasti, S.; van Essen, J.T. Emergency medical services and beyond: Addressing new challenges through a wide literature review. Comput. Oper. Res. 2017, 78, 349–368. [Google Scholar] [CrossRef]
  19. Sudtachat, K.; Mayorga, M.E.; McLay, L.A. Recommendations for dispatching emergency vehicles under multitiered response via simulation. Int. Trans. Oper. Res. 2014, 21, 581–617. [Google Scholar] [CrossRef]
  20. Yoon, S.; Albert, L.A. Dynamic dispatch policies for emergency response with multiple types of vehicles. Transp. Res. Part Logist. Transp. Rev. 2021, 152, 102405. [Google Scholar] [CrossRef]
  21. Budge, S.; Ingolfsson, A.; Erkut, E. Approximating vehicle dispatch probabilities for emergency service systems with location-specific service times and multiple units per location. Oper. Res. 2009, 57, 251–255. [Google Scholar] [CrossRef] [Green Version]
  22. Tiam-Lee, T.J.Z.; Henriques, R.; Costa, J.; Manquinho, V.M.; Galhardas, H. Consolidation of Massive Medical Emergency Events with Heterogeneous Situational Context Data Sources. In Proceedings of the EDBT/ICDT Workshops, Edinburgh, UK, 29 March–1 April 2022. [Google Scholar]
  23. Bélanger, V.; Ruiz, A.; Soriano, P. Recent optimization models and trends in location, relocation, and dispatching of emergency medical vehicles. Eur. J. Oper. Res. 2019, 272, 1–23. [Google Scholar] [CrossRef]
  24. Theeuwes, N.; Houtum, G.J.V.; Zhang, Y. Improving ambulance dispatching with machine learning and simulatio. In Proceedings of the Joint European Conference on Machine Learning and Knowledge Discovery in Databases, Bilbao, Spain, 13–17 September 2021; Springer: Berlin/Heidelberg, Germany; pp. 302–318. [Google Scholar]
  25. Liu, K.; Li, X.; Zou, C.C.; Huang, H.; Fu, Y. Ambulance Dispatch via Deep Reinforcement Learning. In Proceedings of the 28th International Conference on Advances in Geographic Information Systems, Seattle, WA, USA, 3–6 November 2020; pp. 123–126. [Google Scholar]
  26. Rautenstrauss, M.; Martin, L.; Minner, S. Ambulance dispatching during a pandemic: Tradeoffs of categorizing patients and allocating ambulances. Eur. J. Oper. Res. 2021; in press. [Google Scholar]
  27. Nordin, N.A.M.; Kadir, N.; Zaharudin, Z.A.; Nordin, N.A. An application of the A* algorithm on the ambulance routing. In Proceedings of the 2011 IEEE Colloquium on Humanities, Science and Engineering, Penang, Malaysia, 5–6 December 2011; pp. 855–859. [Google Scholar]
  28. Repoussis, P.P.; Paraskevopoulos, D.C.; Vazacopoulos, A.; Hupert, N. Optimizing emergency preparedness and resource utilization in mass-casualty incidents. Eur. J. Oper. Res. 2016, 255, 531–544. [Google Scholar] [CrossRef] [Green Version]
  29. Tlili, T.; Harzi, M.; Krichen, S. Swarm-based approach for solving the ambulance routing problem. Procedia Comput. Sci. 2017, 112, 350–357. [Google Scholar] [CrossRef]
  30. Yazdani, M.; Mojtahedi, M.; Loosemore, M.; Sanderson, D. A modelling framework to design an evacuation support system for healthcare infrastructures in response to major flood events. Prog. Disaster Sci. 2022, 13, 100218. [Google Scholar] [CrossRef]
  31. Yazdani, M.; Mojtahedi, M.; Loosemore, M. Enhancing evacuation response to extreme weather disasters using public transportation systems: A novel simheuristic approach. J. Comput. Des. Eng. 2020, 7, 195–210. [Google Scholar] [CrossRef]
  32. Rambha, T.; Nozick, L.K.; Davidson, R.; Yi, W.; Yang, K. A stochastic optimization model for staged hospital evacuation during hurricanes. Transp. Res. Part Logist. Transp. Rev. 2021, 151, 102321. [Google Scholar] [CrossRef]
  33. Kim, K.Y.; Kutanoglu, E.; Hasenbein, J.J.; Wu, W.Y.; Yang, Z.L. A Large-Scale Patient Evacuation Modeling Framework using Scenario Generation and Stochastic Optimization. In Proceedings of the IISE Annual Conference, New Orleans, LA, USA, 30 May–2 June 2020. [Google Scholar]
  34. Campbell, B.D.; Mete, H.O.; Furness, T.; Weghorst, S.; Zabinsky, Z. Emergency response planning and training through interactive simulation and visualization with decision support. In Proceedings of the 2008 IEEE Conference on Technologies for Homeland Security, Waltham, MA, USA, 12–13 May 2008; pp. 176–180. [Google Scholar]
  35. Wu, A.; Convertino, G.; Ganoe, C.; Carroll, J.M.; Zhang, X.L. Supporting collaborative sense-making in emergency management through geo-visualization. Int. J. Hum.-Comput. Stud. 2013, 71, 4–23. [Google Scholar] [CrossRef]
  36. Zhang, A.; Qi, Q.; Jiang, L. GeoRSS based emergency response information sharing and visualization. In Proceedings of the Third International Conference on Semantics, Knowledge and Grid (SKG 2007), Xi’an, China, 29–31 October 2007; pp. 596–597. [Google Scholar]
  37. Wang, P.; Bishop, I.; Stock, C. Real-time data visualization in Collaborative Virtual Environments for emergency response. In Proceedings of the Surveying & Spatial Sciences Institute Biennial International Conference, Adelaide, Surveying & Spatial Sciences Institute, Adelaide, Australia, 28 September–2 October 2009; pp. 435–441. [Google Scholar]
  38. Kim, S.Y.; Jang, Y.; Mellema, A.; Ebert, D.S.; Collinss, T. Visual analytics on mobile devices for emergency response. In Proceedings of the 2007 IEEE Symposium on Visual Analytics Science and Technology, Sacramento, CA, USA, 30 October–1 November 2007; pp. 35–42. [Google Scholar]
  39. Onorati, T.; Díaz, P.; Carrion, B. From social networks to emergency operation centers: A semantic visualization approach. Future Gener. Comput. Syst. 2019, 95, 829–840. [Google Scholar] [CrossRef]
  40. Rhudy Jr, J.P.; Alexandrov, A.W.; Rike, J.; Bryndziar, T.; Maleki, A.H.Z.; Swatzell, V.; Dusenbury, W.; Metter, E.J.; Alexandrov, A.V. Geospatial visualization of mobile stroke unit dispatches: A method to optimize service performance. Interv. Neurol. 2018, 7, 464–470. [Google Scholar] [CrossRef]
  41. Špatenková, O.; Demšar, U.; Krisp, J.M. Self-organising maps for exploration of spatio-temporal emergency response data. In Proceedings of the Geocomputation, Galway, Ireland, 3–5 September 2007; Volume 2007. [Google Scholar]
  42. Rashed, E.A.; Kodera, S.; Shirakami, H.; Kawaguchi, R.; Watanabe, K.; Hirata, A. Knowledge discovery from emergency ambulance dispatch during COVID-19: A case study of Nagoya City, Japan. J. Biomed. Inform. 2021, 117, 103743. [Google Scholar] [CrossRef]
  43. Ugalde, B.H.; Vinluan, A.A.; Carpio, J.T. Graph representation of road network for mobility-impaired persons. In Proceedings of the 2021 4th International Conference on Information and Computer Technologies (ICICT), Kahului, HI, USA, 11–14 March 2021; pp. 194–198. [Google Scholar]
  44. Dwivedi, A.K.; Mallawaarachchi, I.; Alvarado, L.A. Analysis of small sample size studies using nonparametric bootstrap test with pooled resampling method. Stat. Med. 2017, 36, 2187–2205. [Google Scholar] [CrossRef]
  45. Ester, M.; Kriegel, H.P.; Sander, J.; Xu, X. A density-based algorithm for discovering clusters in large spatial databases with noise. In Proceedings of the The Second International Conference on Knowledge Discovery and Data Mining, Portland, OR, USA, 2–4 August 1996; Volume 96, pp. 226–231. [Google Scholar]
Figure 1. Example of a potential inefficiency: a farther station responded to an emergency despite having two other stations that are closer to it. Map and routes are based on OpenStreetMap.
Ijgi 11 00356 g001
Figure 2. Phases in the discovery and analysis of potential inefficiencies.
Ijgi 11 00356 g002
Figure 3. Responses made by a station over a six-month period, showing candidate potential inefficiencies for different values of θ .
Ijgi 11 00356 g003
Figure 4. Relationship between the Haversine distance and the actual road distance (in km).
Ijgi 11 00356 g004
Figure 5. Response per vehicle (RPV) distribution across different days during an arbitrarily chosen time frame for three stations, showing differences in mean and variability.
Ijgi 11 00356 g005
Figure 6. Example of a potential inefficiency where the two closer stations are busier than usual in the past 2 h. Map and routes are based on OpenStreetMap.
Ijgi 11 00356 g006
Figure 7. Distribution of the activity level of closer stations in the context of potential inefficiencies for the year 2019. Histogram counts are in thousands.
Ijgi 11 00356 g007
Figure 8. Dense clusters of potential inefficiency occurrence among ambulances in 2019.
Ijgi 11 00356 g008
Figure 9. Visualizations of dense clusters of potential inefficiencies that occurred on certain days in 2019, showing the activity levels of the stations that are closer to the emergencies in question.
Ijgi 11 00356 g009
Figure 10. One dense cluster of potential inefficiencies in the Sesimbra area.
Ijgi 11 00356 g010
Figure 11. Ratio of positive activity levels among closer stations within the time windows of potential efficiencies versus all time windows.
Ijgi 11 00356 g011
Figure 12. Number of responses made by station BIBBRAGA2 for January and June 2019.
Ijgi 11 00356 g012
Table 1. Overall statistics on potential inefficiencies detected on ambulances and VMER vehicles for the years 2017–2019. Bold values indicate significance at a 0.01 level. Red values indicate positive activity level.
Mean Activityp-Value of
No. ofNo. of PotentialLevel ofWilcoxon Signed
GroupResponsesInefficienciesCloser StationsRank Test
2017
   Ambulance933,34970,069 (7.51%)+0.4022<10 293
   VMER90,1458510 (9.44%)+0.2598 5.7 × 10 93
2018
   Ambulance1,321,464118,523 (8.97%)+0.3814<10 293
   VMER93,6868066 (8.61%)+0.2340 6.4 × 10 74
2019
   Ambulance1,154,62278,765 (6.82%)+0.3208<10 293
   VMER95,6408826 (9.23%)+0.2306 1.7 × 10 84
Table 2. Potential inefficiency statistics per area cluster. Bold values indicate significance at a 0.01 level. Red values indicate positive activity level.
No. ofMean Activtyp-Value of
PotentialLevel ofWilcoxon Signed
ClusterInefficienciesCloser StationsRanked Test
Porto area (red)6611+0.2150 8.2 × 10 21
Setúbal area (dark green)3122+0.1333 1.6 × 10 25
Northwest Lisbon (purple)1739+0.2448 4.2 × 10 33
South Braga (light green)1546+0.0463 4.4 × 10 9
Sintra area (brown)1501+0.2789 1.3 × 10 32
East Lisbon (pink)1306+0.1348 0.0646
Seixal and Almada (blue)779+0.1053 0.1408
Faro area (yellow)774+0.3171 1.5 × 10 22
Central Braga (orange)695+0.3204 6.5 × 10 33
Table 3. Potential inefficiencies on specific days. Actual dates are anonymized for privacy reasons. Bold values indicate significance at a 0.01 level. Red values indicate positive activity level.
No. ofMean Activtyp-Value of
ClusterPotentialLevel ofWilcoxon Signed
AreaInefficienciesCloser StationsRanked Test
Porto, Porto61+2.9322 3.7 × 10 56
Porto, Porto42+1.4623 5.5 × 10 14
Setúbal, Setúbal17+0.7214 0.4123
Tomar, Santarém16+1.7720 3.1 × 10 5
Table 4. Potential inefficiency statistics for VMER vehicles per area cluster. Bold values indicate significance at a 0.01 level. Red values indicate positive activity level.
No. ofMean Activityp-Value of
PotentialLevel ofWilcoxon Signed
ClusterInefficienciesCloser StationsRanked Test
Espinho, Aveiro233+0.3229 6.2 × 10 4
Seixal, Setúbal203+0.0201 0.1181
Oieras and Cascais, Lisbon161+0.2308 5.5 × 10 5
M: Sesimbra, Setúbal154+0.1046 0.4239
Loulé, Faro116+0.1463 0.0028
Porto Area115+0.0765 0.2277
Table 5. Closer stations to emergencies with inefficient responses in Central Braga. Statistics from a sample of 695 potential inefficiencies. Red values indicate positive activity level and green values indicate negative activity level.
Mean ActivityMedian ActivtyRatio of
StationLevelLevel+ Activity Level
BSBRAGA+0.5629+0.408768.06%
BISMARCOS+0.3826+0.200660.29%
BVBRAGA+0.3488+0.198955.83%
BIBRAGA2 0.0157 0.5701 32.66%
Publisher’s Note: MDPI stays neutral with regard to jurisdictional claims in published maps and institutional affiliations.

