1. Introduction
The housing vacancy rate (HVR) is one of the most important indicators for assessing the health of urban real estate [
1]. In recent decades, the housing vacancy problem has gradually emerged as China’s urbanization process has accelerated. According to a research report published by the China Centre for Household Finance Survey and Research (CHFS) of the Southwest University of Finance and Economics, the housing vacancy rate in China’s urban areas reached 21.4% in 2017, with the number of vacant commercial residential units about 65 million. Higher housing vacancy has a negative impact on urban spatial patterns and sustainable development, causing uneven distribution and a waste of housing resources and even increasing financial risks [
2]. It has also been shown that high vacancy rates can also increase regional crime rates [
3], poverty and unemployment rates [
4], bringing about a series of social problems. Against this background, it is necessary to research urban housing vacancies. The study of urban housing vacancy rates can provide a reference for residents’ rational choice of house purchases and real estate developers’ rational development. It can also provide the basis for government management departments to formulate housing development and management policies. It can also reduce the waste of social and land resources, make scarce land resources exert the greatest effect, relieve the pressure of housing, and balance the supply and demand of housing market.
As there are no official data on vacant houses in China, let alone publicly available information on personal housing [
5,
6], scholars studying housing vacancies have had to find alternative approaches. Currently, in intra-city housing vacancy studies, traditional common methods, such as on-site sampling surveys [
7], field surveys, and interview methods [
8], are labor-intensive and time-consuming. Thus, with the advancement in technology, microblog check-in data [
9], multi-source remote sensing data (e.g., DMSP/OLS and NPP/VIIRS night lighting, GF satellite image, Luojia-1 imagery, and Jilin1-03 imagery) [
10,
11,
12], residential electricity consumption [
13,
14], and municipal water consumption [
15,
16], WIFI (Wireless Fidelity) signals [
17] have been used to conduct inner-city housing vacancy studies, but there are problems of difficult access or low accuracy. In this paper, a new method, the daytime exterior images observation method, is used to estimate the vacancy rate of urban residential quarters. This method can be used to investigate housing vacancies on a smaller scale than previous research methods, and it is simple, less time-consuming, and less difficult to obtain data, which is innovative in that it provides a new approach to the study of urban housing vacancies and helps home buyers to understand housing occupancy rates and purchase homes rationally.
According to the progress and findings of existing studies on the spatial pattern of urban housing vacancies at home and abroad, most studies have demonstrated that housing vacancy rates are low in the inner-city central areas and higher in the peripheral areas. Bentley et al. found in their study of the city of Detroit in the United States that vacancies showed a trend of gradually spreading outward from the urban center [
18]. Liu et al. found in their study of housing vacancies in the Yichun District of Yichun City that the housing vacancy rate generally showed a core–edge pattern, that is, the central housing rate is lower and the marginal vacancy rate is higher [
13]; Chen et al. found that Nanjing generally showed a higher housing vacancy rate rating in the outer urban circle than in the inner circle layer [
19]; Niu found a relatively low housing vacancy rates in the southeast coastal area of Qingdao, with a patchy distribution of vacant areas with low–low clustering characteristics, while, in other areas, a trend of low–low value agglomeration in the central city increasing to the outer suburbs is shown [
20]. He et al. also found in their identification of housing vacancies in 30 Chinese cities that areas with high intra-city vacancy rates were concentrated in the periphery of low-vacancy areas and gradually increased outwards along the central urban areas [
9]. However, there are some exceptions, such as Daegu, South Korea, where high-vacancy-rate areas are doughnut-shaped in the center of the city and low-vacancy-rate areas are closely surrounded by high-vacancy-rate areas [
21,
22]. The spatial variation in vacancy rates within cities is due to many factors, including the physical environment characteristics of the housing itself, such as age, type, floor level, floor area, and structure [
22,
23]; the socio-economic characteristics of the city, such as housing prices [
24], policies [
25], land prices, demographic changes [
26], aging [
27], and the amount of housing supply [
28]. Other factors include the accessibility of the city characteristics, including access to employment, accessibility to transport, accessibility to public services, natural and built environment, and distance from city centers [
9,
29].
The cities that have been studied for housing vacancies in China are mainly those that rank high in the ‘ghost city’ index, such as Changshu [
15,
30], or those with significant shrinkage characteristics, such as Yichun [
13], while few scholars have focused on the internal housing vacancy problem in megacities such as Guangzhou. At the same time, Guangzhou, as a typical case city in Chinese geography research, has been a hot spot for research in terms of its housing problem. Therefore, it is a typical and representative example for studying its housing vacancy problem in the district. By exploring the spatial pattern and influencing factors of its housing vacancy, it is of some practical value as it can provide guidance to residents for rational housing purchases and to developers for rational development and help policymakers with rational planning.
Given this, this study constructed an idea and method for urban housing vacancy estimation based on daytime housing exterior images. On this basis, we took Guangzhou, China as a case study, residential quarters as the basic evaluation unit, and used average nearest neighbor analysis, kernel density estimation, and spatial autocorrelation analysis to study the spatial pattern of housing vacancies in Guangzhou and to visualize and analyze it. Finally, the main influencing factors of housing vacancy in Guangzhou were explored using the geodetector technique.
The rest of the paper proceeds as follows:
Section 2 provides a detailed description of the methods and processes of this paper;
Section 3 introduces the study area and the specific sources of data;
Section 4 presents the results of this study, including the spatial pattern of housing vacancies in Guangzhou and its influencing factors;
Section 5 concludes the paper with a summary, discussion, and conclusions.
2. Methods and Processes
2.1. Estimation Methods and Process for Housing Vacancy Rates
At present, there is no global unified concept of vacant houses, and vacant houses can be divided into many types, such as long-term vacant houses, seasonal vacant houses, vacant houses to be sold, unsold vacant houses, speculative vacant houses for investment, vacant houses for stock, etc. Different countries and regions adopt varying standards to measure the situation of vacant houses; thus, there are problems related to different definitions, concepts, statistical caliber, and survey methods. However, according to the literature review, at the time of this investigation, most countries (such as the United States, Singapore, and some European countries) regard unoccupied houses as vacant houses [
31]. Based on the existing domestic and foreign research and definition standards, this study defines vacant houses as houses that were unoccupied (not temporarily unoccupied) at the time of investigation from the perspective of statistical investigation. It is worth emphasizing that, in our research, vacant houses are those that have no trace of residence (such as those with no decoration and those that are unoccupied long term), not just short-term vacant houses that were unoccupied at the time of the investigation. Thus, for the calculation of the vacancy rate in this paper, the housing vacancy rate is equal to the number of vacant houses divided by the total number of houses.
At present, there are many ways to study housing vacancy; however, there remains no unified and optimal method. At present, all of the methods have shortcomings, including obtaining data that can accurately reflect the housing situation, such as residents’ water and electricity consumption. However, these data involve the privacy of residents, require stringent confidentiality, are strictly managed by relevant departments, and are expensive and difficult to obtain. Observing the black light at night, however, when the house is empty, or occupied at the time of investigation but the lights are not turned on, will substantially affect the accuracy of the vacancy rate. With using night light remote sensing image data to estimate the vacancy rate, although the data are easy to obtain, the data accuracy is low, such as NPP-VIIRS data, which have a resolution of about 500 m. For some small-scale buildings, it is not possible to accurately match the location, and the accuracy is low, so it is impossible to identify the correct residential area. Vacancy rate studies have also been conducted based on LBS (Location-Based Service) data, such as micro-blog check-in data. Although it has wide coverage and high positioning accuracy, this technology depends entirely on mobile devices.
In comparison, this study obtains data on housing vacancy by observing the clothes drying on balconies (including other windows where residential traces can be observed, etc., observing other items indicating a living situation, noting whether curtains are installed or not, etc.). The data acquisition cost is low, the precision is high, the accuracy is strong, and the scope of application is wider. This is thus a feasible way to study housing vacancy.
Notably, we not only observed the drying of clothes (or the stacking of articles) on the balcony but also carefully observed all parts of each house where residential trace information can be observed, such as whether curtains were installed in the room, because according to the living habits of Chinese people, once a house is being lived in, some information will inevitably be observable. Before conducting this practice, we evaluated the accuracy of this method. We randomly selected sample communities and conducted an on-the-spot investigation during different periods, both during the day and at night (20:00–22:30). We compare the results of the field survey with the results of this research method, such as regarding Jiangyuan Peninsula Community, and prove that the vacancy rates assessed by the two methods are roughly the same. We talked with the property personnel in some communities (because they are highly familiar with the occupancy of the communities). After we obtained a general understanding of the vacancy rate, we compared it with the results obtained using this research method, and the results remained reliable. Therefore, this is a relatively accurate research method for us to use to evaluate vacancy rate.
This study was based on the Baidu Street View Map and field survey to obtain data. First, samples of residential quarters for the study were selected based on screening; we then entered Baidu Maps, selected panorama mode, and searched for panoramic images of each residential quarter. If panoramic data were available, a random sample of single buildings was selected, and the number of vacant housing units and the total number of units were observed and recorded. If the residential quarter was not covered by the Baidu Street View Map, we recorded information about the residential quarter, conducted a field survey, took exterior images of the building, and observed the number of vacant housing units and the number of vacant units in the photos. Finally, the vacancy data of single buildings collected in these two ways were collated and recorded into the corresponding building vector data to calculate the vacancy rate of single buildings, which in turn produced the vacancy rate of the whole district. The specific estimation method flowed as follows (
Figure 1).
2.1.1. Methods for Obtaining Daytime Housing Exterior Images
The daytime housing exterior images for this study were mainly sourced from the Baidu Street View Map, supplemented by field survey shots. The street view maps in this study were mainly obtained from the Baidu Maps’ Street View mode (
https://map.baidu.com/, accessed from 1 January 2022 to 8 February 2022 ). Baidu Street View is a relatively new way to provide homebuyers with a visual and immersive view of their preferred residential area without having to leave home, and its data are constantly being updated to keep up with the times [
32,
33]. However, at present, Baidu Street View cannot cover all areas, and in some areas where traffic is difficult, there are no data available, which requires conducting field surveys to supplement the data with mobile phone photos of exteriors.
Among them, the Baidu Street View mode to obtain building exterior images is the main data acquisition method in this study. To obtain the Baidu Street View image data, we first searched the panoramic map of the target residential quarters in Baidu Street View mode and selected the images of the latest time shown in the Time Machine tool, mainly from 2019 to 2020. Here, the method used for building sample selections attempted to select 50% and above of the number of all residential buildings in each residential quarter to represent the vacancy rate situation in that residential quarter, while for areas with more developed street view data, as many building samples as possible were selected. With this method, approximately 90% (400) of the residential quarter’s building data required for the study were obtained. The remaining small amount of data was supplemented by manual field surveys to access the target sample residential quarters to take exterior images of residential buildings, with the data being obtained from March to April 2022. The sample of single buildings was selected similarly as before, with as many samples as possible to make the data more accurate.
2.1.2. Vacancy Rate Estimation Method for Single Residential Buildings Based on Daytime Housing Exterior Images
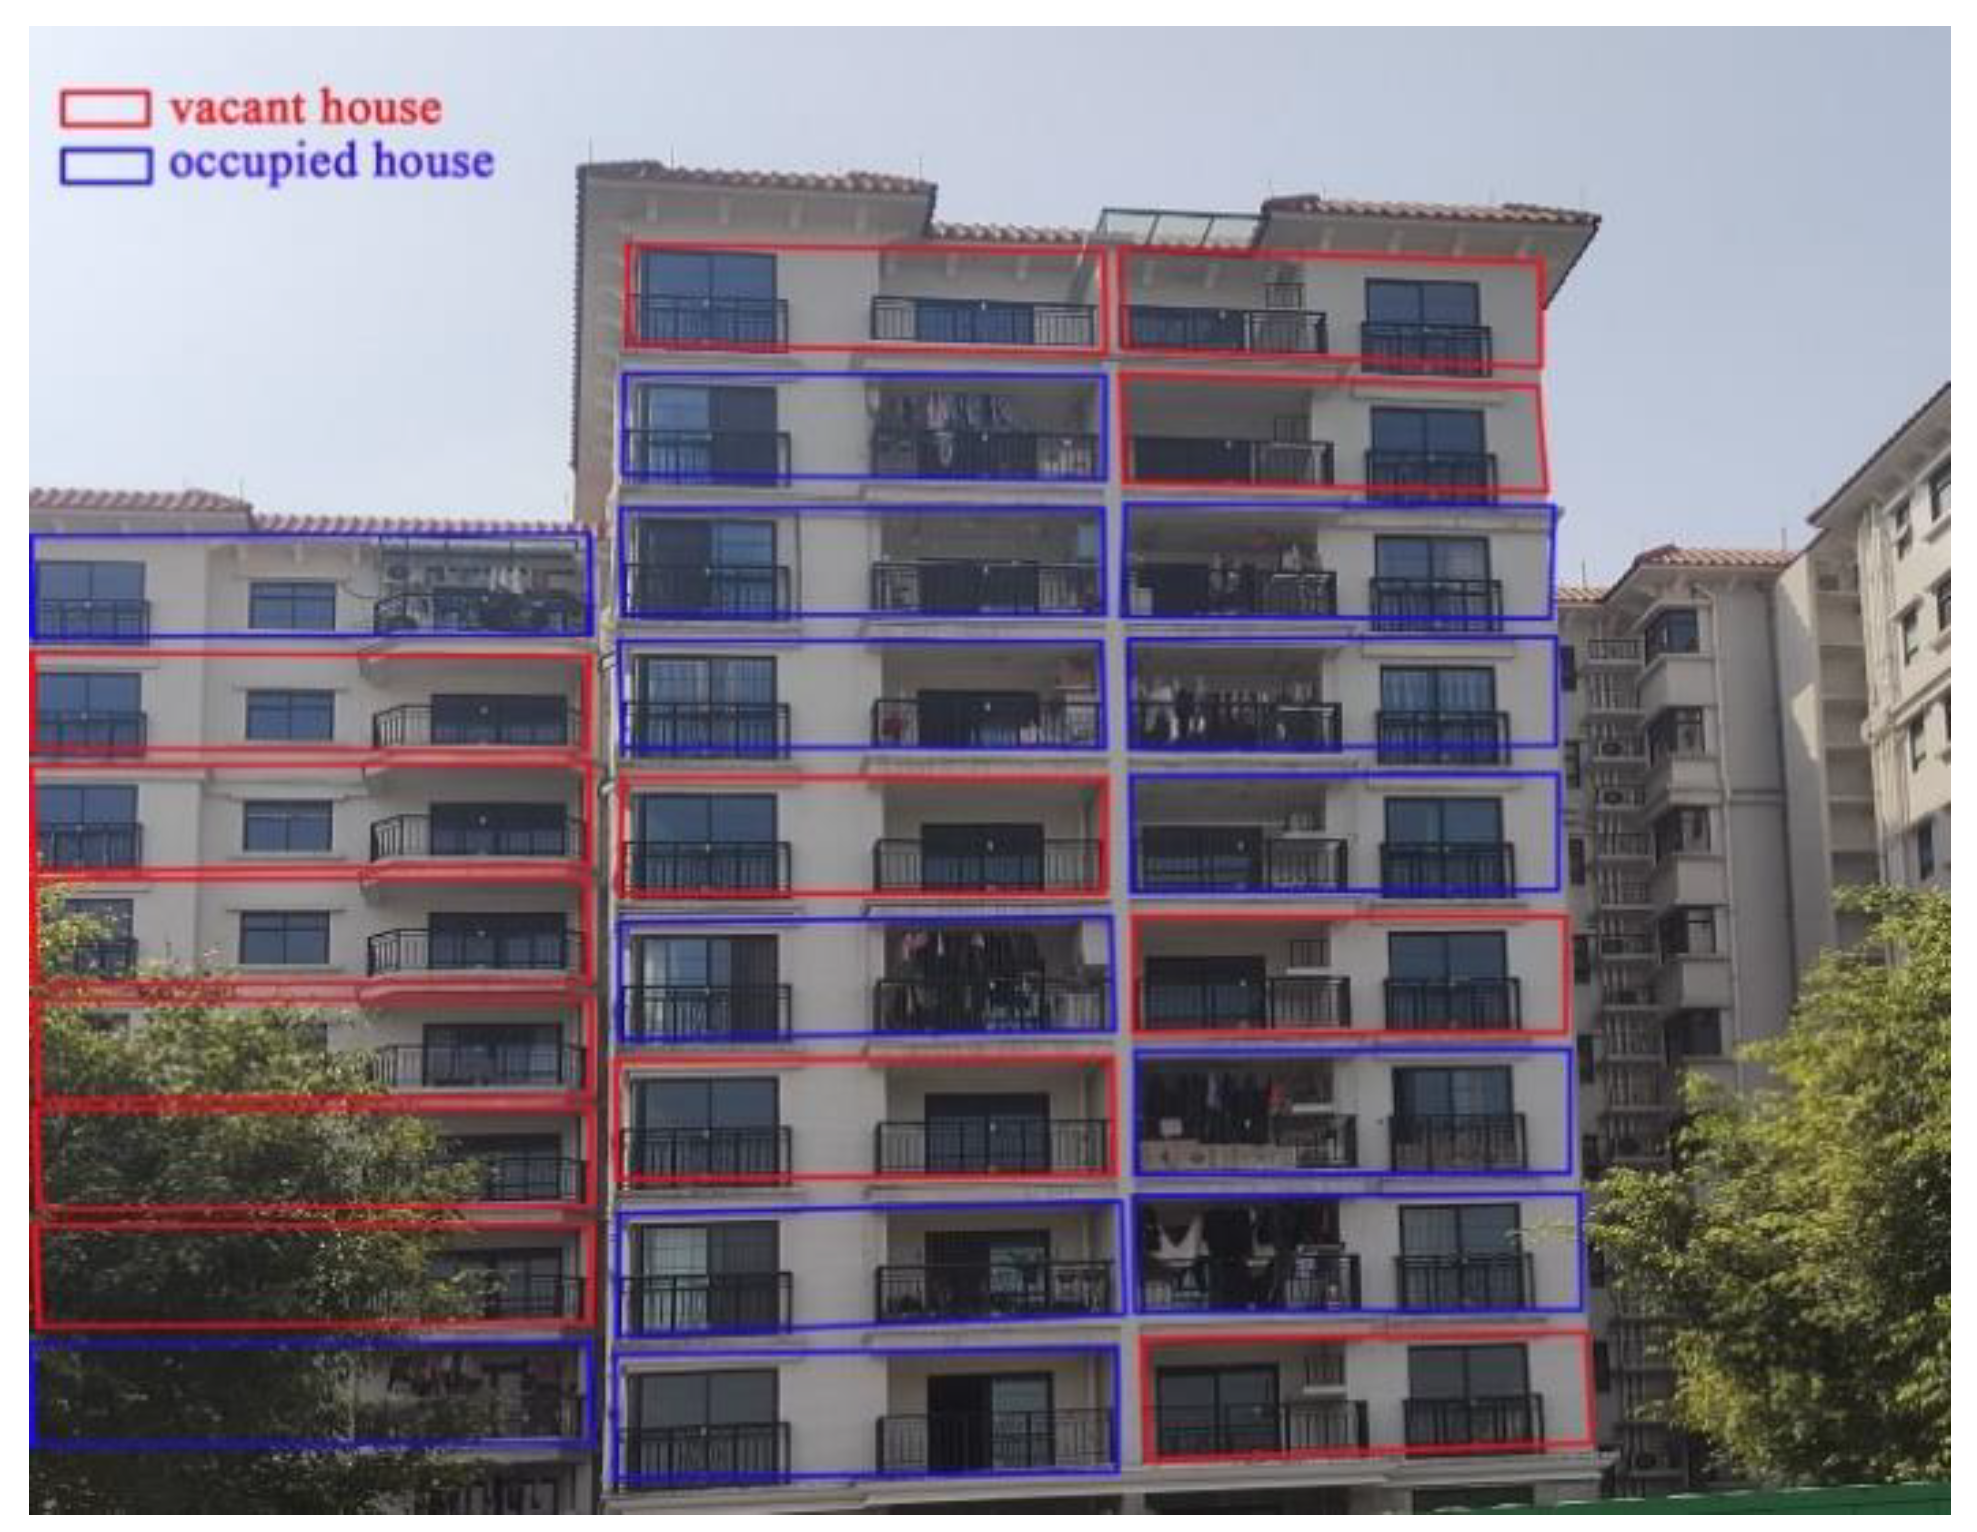
The total number of units and the number of vacant units were estimated by manual observation of the exterior images of single residential buildings obtained from the Baidu Street View and field surveys. The distinction between vacant houses and occupied houses was based on whether clothes were drying on the balconies of households (or the balconies place more living items) and whether household items could be seen from the windows of the room (whether there were more items indicating a living situation in the room, whether curtains were installed or not, etc.); if clothes were drying (or you could see more items indicating a living situation or other signs of residence), it meant that the house was occupied. If this was not the case, the house was considered unoccupied and as a vacant house, as shown in
Figure 2. Then, the vacancy rate of every single building was calculated according to the definition of vacancy rate.
Based on the above definition of the housing vacancy rate, the specific formula for the calculation of the single building is as follows:
where
i = 1, 2……,
n and
j = 1, 2……,
n is the
jth building in residential quarter
i;
Vij is the number of vacant houses units in the
jth building in residential quarter
i;
Aij is the total number of houses units in the
jth building in residential quarter
i.
HVRij represents the vacancy rate of the
jth single building in residential quarter
i.
2.1.3. Calculation of the Average Vacancy Rate Level in Residential Quarters
The vacancy data for the residential quarter were derived from the vacancy data for a sample of single buildings in the residential quarter. The total number of houses and vacant houses of all single building samples in this residential area were summarized to obtain the total number of houses and vacant houses. The vacancy rate formula is as follows:
HVRi refers to the vacancy rate of sample residential quarters I, i = 1, 2…… 450.
2.2. A Spatial Analysis Approach to the Spatial Pattern of Housing Vacancy Rates
2.2.1. Spatial Autocorrelation Analysis
Spatial autocorrelation analysis can be used to explore the spatial correlation characteristics and spatial distribution patterns of housing vacancies in Guangzhou. In this study, three methods of spatial autocorrelation analysis were used: Global Moran’s I, Hot Spot Analysis (Getis-Ord Gi*) and Cluster and Outlier Analysis (Anselin Local Moran’s I).
- 1.
Global Moran’s index
Global Moran’s I was used to detect the general spatial characteristics of housing vacancies with the following expressions [
34,
35]:
where
I stands for global spatial autocorrelation index;
xi and
xj represent the housing vacancy rate of the
i-th and
j-th residential quarter, respectively;
Wij is the weight matrix of each residential quarter, when the matrix is created by fixed distance, the adjacent elements of the residential quarter within the specified critical distance will have a weight of 1, which will have a great impact on that residential quarter, while the element weight of the residential quarter outside the critical distance will be 0, which will not have any impact on the calculation of the residential quarter.
I is in the range of [–1,1]. When
I is between [−1, 0), there is a negative correlation between residential quarters with vacancy rate, and the closer
I is to −1, the greater the negative correlation; when
I is (0,1], the vacancy rate is positively correlated, and the closer
I is to 1, the greater the positive correlation. When
I is 0, there is no correlation between vacant residential quarters, and they are randomly distributed.
Z-value is a standardized statistic of
I, which is used to determine the degree of clustering of vacant residential quarters.
Z-value can be expressed as:
where
Var(
I) denotes the number of variances and
E(
I) is the mathematical expectation of the housing vacancy rate. When the absolute value of
Z is larger, it indicates that the spatial positive (negative) correlation of the housing vacancy rate in Guangzhou is more significant; when the absolute value of
Z tends to zero, it means that the result is not significant, and the housing vacancy rate is randomly distributed.
- 2.
Local spatial autocorrelation analysis
Once the housing vacancy rate showed spatial autocorrelation, we used local spatial autocorrelation analysis to further test it.
- (1)
Getis-Ord Gi*
Getis-Ord
Gi* was proposed by Getis and Ord [
36,
37], which allows for
Gi* statistics on vacancy rates in each residential quarter to accurately identify hot and cold spot areas of housing vacancy rates, with the following equation:
d is the distance between
i and
j, and
Wij(
d) is the distance weight between points
i and
j.
Z(
Gi*) can also be obtained by normalizing the
Z-value for
Gi* with the following equation:
If Z(Gi*) is positive and significant, that is, Z(Gi*) > 1.96 and p < 0.05, it means that the vacancy rate of residential quarter i is high, and it is a vacant hot spot area; on the contrary, if Z(Gi*) is negative and significant, that is, Z(Gi*) < −1.96 and p < 0.05, which indicates that the vacancy rate of residential quarters around i is low and it is a vacant cold spot area.
- (2)
Local Moran’s I
Local Moran’s
I was used to further analyze the characteristics and location of the spatial distribution of clusters and outliers of housing vacancy rates. It allowed the Moran’s
I value for each region to be counted to detect local aggregation or anomalies, and here the local spatial correlation indicator LISA (Local Indicators of Spatial Association) could be used to explore local autocorrelation [
38]. Its expression is as follows:
where
I is the local correlation index,
wij’ is the row standardization of
wij, and
Zi and
Zj are standardized values of the housing vacancy rate. At the 5% significance level, if
Ii and
Zi are both positive, there is high–high agglomeration; when
Ii is negative and
Zi is positive, there is high–low agglomeration; when
Ii is positive and
Zi is negative, there is low–low agglomeration; and when both
Ii and
Zi are negative, there is low–high agglomeration. LISA can show the four types of spatially high–high, low–low, high–low, and low–high agglomeration as well as the not significant type.
2.2.2. Average Nearest Neighbor Analysis
The average nearest neighbor distance can determine the average distance between residential quarters with the same level of vacancy rate and their spatial distribution characteristics (uniform, clustered, and random) according to the ratio
R of the average observed nearest neighbor distance value (
di) to the expected nearest neighbor distance value (
de). The range of
R is [0, 2.1491]. When
R < 1, the vacant residential quarters of the same grade are clustered;
R > 1, they are randomly distributed; when
R = 1, that is, the actual observed distance is equal to the expected distance, it means uniform distribution. The ratio
R can be expressed as:
where
de can be expressed as:
where
N is the number of vacant residential quarters points of different levels and
A is the area of Guangzhou. Its standard deviation
Z is expressed as [
39]:
where the
Z-value is too high (strongly dispersed) or too low (strongly clustered), the significance
p-value is smaller. When
p > 0.1, the significance is poor, and the residential quarters with the same grade vacancy rate are randomly distributed; when
p < 0.01, there is a strongly clustered (or dispersed) distribution; 0.01 <
p < 0.05 is a more strongly clustered (dispersed) distribution; 0.05 <
p < 0.1 is a general clustered (dispersed).
2.2.3. Kernel Density Estimation
Kernel density estimation is a statistical analysis method for non-parametric density estimation and is a common method for analyzing spatial patterns in geography. Kernel density analysis was used to explore the spatial differentiation characteristics of higher-vacancy-rate and lower-vacancy-rate residential quarters, respectively. The kernel density formula is as follows [
40]:
where
x1,
x2,
x3,…,
xi is a set of observed locations within the
x bandwidth; (
x − xi) denotes the distance from residential quarter
x to
xi;
n is the sample size of residential quarters, 450 in total;
f(
x) is an estimation of the kernel density value at residential quarter point
x. The higher the kernel density value, the greater the density of the spatial distribution of vacant residential quarters in that level of housing, and conversely the smaller the density;
h is the bandwidth, that is, the search radius of the density function;
K(
x) is the quadratic kernel function of the spatial weights, with
K greater than 0.
2.3. Housing Vacancy Rates about the Main Influencing Factors
The geodetector technique can detect spatial heterogeneity [
41], it can achieve high statistical accuracy with a small sample size without having to consider multicollinearity between variables [
42], and does not require the continuity of data. In this study, geodetector was used to detect the influencing factors of housing vacancy rates and the extent to which they affect vacancy rates. The core idea is that if an influencing factor has a significant impact on the housing vacancy rate, then their spatial distribution should have similarity [
43,
44]. The strength of its influence is expressed through a geographic detection power value (
q-value), expressed as follows:
where
h = 1,…,
L is the stratification according to each independent variable (influencing factor), we divided the influencing factor (i.e., independent variables) into five levels [
45].
Nh is the sample size of the stratification
h (i.e., the sub-region divided) of the influencing factor, and
N is the number of sample residentials in Guangzhou city (450).
σ2 and
σ2h are the variance of Guangzhou city and stratification
h, respectively. The value of
q takes the interval [0,1], with larger
q-value indicating a stronger influence of the factor on the housing vacancy rate, and the value closer to 1 indicating a stronger influence of the factor on the spatial clustering of the housing vacancy rate; the value closer to 0 indicates a weaker influence of the factor.
3. Study Area and Data Sources
3.1. Study Area
Guangzhou, located in South China, is the central city of the Guangdong–Hong Kong–Macao Greater Bay Area, and an important central city in China. Guangzhou has a total administrative area of 7434.40 km
2 and 11 administrative districts, namely Yuexiu, Liwan, Haizhu, Tianhe, Baiyun, Huangpu, Panyu, Huadu, Zengcheng, Conghua, and Nansha. In 2020, the permanent population at end-year of Guangzhou was 18,740,300 at the end of the year and the per capita housing construction area of urban households is 34.61 m
2 (
https://lwzb.gzstats.gov.cn:20001/datav/admin/home/www_nj/, accessed on 15 April 2022). According to the reality of Guangzhou’s urban construction and development and concerning the research results of Wang et al. on the manner of dividing the functional territory of Guangzhou [
46,
47], the city was divided into four circles: the core area, the urban district, the suburban area, and the outer suburb area (
Figure 3). There are 450 residential quarters as the basic study unit, of which 61 are in the core area, 70 in the urban district, 81 in the suburban and 238 in the outer suburb. The total sample of single buildings selected from these 450 residential quarters is 1846.
3.2. Data Sources and Processing
Data sources were obtained from single building data from Baidu building data, residential quarters data from Lianjia (
https://gz.lianjia.com/, accessed on 16 May 2021) and Cric (
http://www.cricchina.com/#/home, accessed on June 2018), with properties linked and filtered by name, with a total of 450 retaining residential quarters built in the years 2010–2019.
Housing vacancy is the embodiment of residential location choice, and many factors have an impact on residential location choice [
48]. According to the existing research, the factors that influence the choice of residential location include employment convenience [
49], school accessibility [
50], commercial service convenience [
46], public service convenience [
51,
52], public transportation convenience (for example, subways and bus systems) [
53,
54], distance from the city center [
55], and population density [
46] and physical environment, such as parks [
56], waterfronts [
57], and factories [
58,
59,
60]. Based on this, this study selects seven factors that have an impact on the housing vacancy rate, namely, office accessibility, basic educational convenience, business services accessibility, public service accessibility, subway accessibility (that is, public transportation convenience), population density, and distance from the central business district (CBD).
Employment, schooling, business services, public services, the subway, and so on are all characteristic factors of convenience, and convenience is an important guiding factor that affects residents’ living choices. For residents living in cities, the first consideration when buying or renting a house is the convenience of the community, such as whether it is easy to work and travel, whether there is a school for their children, and whether there are shops for basic needs. Theoretically, the more convenient a house is, the more attractive it is to buyers or renters, and the vacancy rate is naturally low in such areas.
Population density is a social characteristic factor that can reflect the popularity and economic strength of residential areas. High population density stimulates the development of the surrounding businesses and service industries, and the more the regional population gathers, the stronger its strength will be. It is generally believed that the living atmosphere in places with high population density is not poor; thus, regional population density is one factor considered by buyers and renters. Theoretically, the vacancy rate in areas with high population density is low.
The distance from the CBD is a location characteristic factor in a narrow sense. Generally speaking, the closer the area is to the CBD, the better the infrastructure, the more convenient the public transportation, and the better the educational and medical resources, and the residents’ needs related to living, employment, schooling, and medical treatment can thus be better met. In the market for buying or renting houses, people are more inclined to buy or rent in the central area of a city.
The basic data required for the five factors, namely office accessibility, basic educational convenience, business services accessibility, public service accessibility, and subway accessibility, were obtained from Amap POI (Point of Interest) data in January 2020 and were subject to coordinate correction and manual screening. Population density was obtained from the Baidu heat map data at 20:00 on 22 March 2022. The data were processed for coordinate correction, projection, reclassification, resampling, raster to point, and so on to obtain the point data of the Baidu heat map. The distance from the CBD was calculated in ArcGIS 10.7 by taking the West Tower of Zhujiang New Town—the International Financial Center of Guangzhou (IFC), as the center of the city.
The degree of influence of these seven factors on the housing vacancy rate was evaluated in the form of an assigned score, which is treated and assigned in
Table 1.
The distribution of POI follows the related characteristics of normal distribution [
61,
62]. According to the normal distribution law, mean ± σ covers about 68% of the data, mean ±2σ covers about 95%, and ±3σ covers about 99% [
63]. Therefore, analyzing these influencing factors and extracting the standard deviation mean surface of the nuclear density value according to this principle and then assigning points to residential quarters has statistical value.
5. Discussions
Based on the research in Guangzhou, it was found that the spatial structure of vacant housing is low in the core area and high in the outer suburb, which is in line with the findings of many existing housing vacancy case cities, such as Detroit [
18], Yichun [
13], and Nanjing [
19]. The results of this study show that distance from the CBD, office accessibility, population density, basic educational convenience, business services accessibility, public services accessibility, and subway accessibility all have a significant effect on housing vacancies. Among them, distance from the CBD has the greatest impact on the housing vacancy rate, which is consistent with Zhu’s research based on Hangzhou. The closer to the CBD, the stronger the role of completeness and sharing of commercial infrastructure in driving and gathering urban real estate development [
29]. Factors such as office accessibility, basic educational convenience, business services accessibility, public services accessibility, and subway accessibility have also been confirmed in the current research. Areas with significant employment location advantages, good public service facilities such as education and medical care, and superior subway resources, are more likely to meet residents’ needs for living and commuting, strengthen residents’ willingness to live, and cause spatial differences in vacant houses [
13,
19,
65]. In addition, the results of this study show that population density has a significant impact on inner-city housing vacancies, but this is something that is rarely mentioned in existing studies, suggesting that population density is also a direction that should be paid attention to in the research of urban housing vacancies.
Compared with existing research findings on vacancy rates, this method explored the spatial pattern characteristics and influencing factors of vacancy rates at a finer scale (residential quarters) with higher precision, and the estimation method is novel, unique, and innovative. The greatest contribution of this study is that it can provide a new analysis idea and method for the current research of urban housing vacancy. Compared with the previous research methods for vacancy rate, such as observing the dark light rate at night, conducting a household census of water and electricity meters, obtaining residential water consumption data, and evaluating housing vacancy based on night light remote sensing data and LBS mobile positioning data, this method is easier to realize, has a wide application range, strong operability, low cost, and higher accuracy, and provides an evaluation method for urban housing vacancy rate. Before using this method to evaluate housing vacancy rate, various methods should be adopted to verify the accuracy of the data, and the data obtained in various ways should be compared to determine the applicability and accuracy of this method.
This study has several deficiencies and limitations that need to be improved in future studies. First, due to the limitation of current technology and time, the vacancy data utilized for this study were investigated only once, and the vacancy situation and changes across different years were not analyzed. In the future, we will obtain more data and discuss and analyze the housing vacancy situation in different years. Second, this method is limited by some special circumstances, such as that some houses are occupied, but the balcony, windows, and other perspectives do not indicate signs of life; moreover, some people do not place things on their balcony, which leads to inaccuracy in vacancy rate estimation. A small number of cases remain, such as high-rise buildings, where it is difficult for us to observe all aspects via streetscape. Thus, we conducted field research in these communities. On location, we observed the living conditions of houses in many ways, such as observing high-rise buildings from a high position and observing them using the shooting function of mobile phone cameras to ensure as much accuracy in the vacancy rate estimation as possible. It is undeniably more difficult to obtain images of high-rise buildings than of low-rise houses. Thus, this method is more suitable for mid- and low-rise houses. This paper has also not considered the influencing factors of the housing vacancy rate sufficiently and has not analyzed them from various perspectives.
The evaluation of urban housing vacancy rate using this method not only has significance in terms of providing guidance for residents in making rational housing purchases, but also helps policymakers plan logically and provides effective references for solving urban housing problems, which has certain practical value. As the current urban housing vacancy situation is grim, we will more deeply explore housing vacancy in future research, such as by obtaining vacancy data from multiple periods and analyzing the spatial and temporal patterns of change in vacant housing. We will also construct a comprehensive index system of influencing factors in relation to housing vacancy and explore its relationship with the social environment, built environment, and other factors. Furthermore, the multi-scale geographic weighted regression model can be used to determine the direction and spatial heterogeneity of influencing factors.
6. Conclusions and Policy Implications
6.1. Conclusions
In this study, the ideas and methods of urban housing vacancy estimations based on daytime housing exterior images were constructed, and taking Guangzhou as an example, the spatial pattern and influencing factors of housing vacancies were analyzed by using kernel density estimation, nearest neighbor analysis, and spatial autocorrelation analysis. Compared with previous research methods, this method is innovative, easy in the obtaining of data, short in time, and easy to operate, which is helpful in studying housing vacancies on a small scale. It not only provides a new path for the study of urban housing vacancies but also provides effective information references for homebuyers to purchase houses and helps them to purchase houses rationally.
Generally speaking, the housing vacancy rate in Guangzhou is low in the core area and urban district, followed by suburban and higher in the outer suburb, showing a spatial pattern of increasing core area–urban district–suburban–outer suburb. Guangzhou’s housing vacancy rate has obvious spatial agglomeration characteristics. Local autocorrelation analysis shows that the residential quarters with low–low value are concentrated in the core area and urban district, while the high–high value are mainly concentrated in the outer suburb, and the vacancy rate in the outer circle is significantly higher than that in the inner circle.
According to the results of kernel density estimation, the residential quarters with low vacancy rates (<5%) are distributed in the core area, showing a “dual-core” pattern, while the residential quarters with high vacancy rates (>50%) are distributed in the outer suburb in a multi-core pattern. The results of nearest neighbor distance analysis show that both of them are clustered, and the clustering degree of residential quarters with low vacancy rates is higher than those with high vacancy rates.
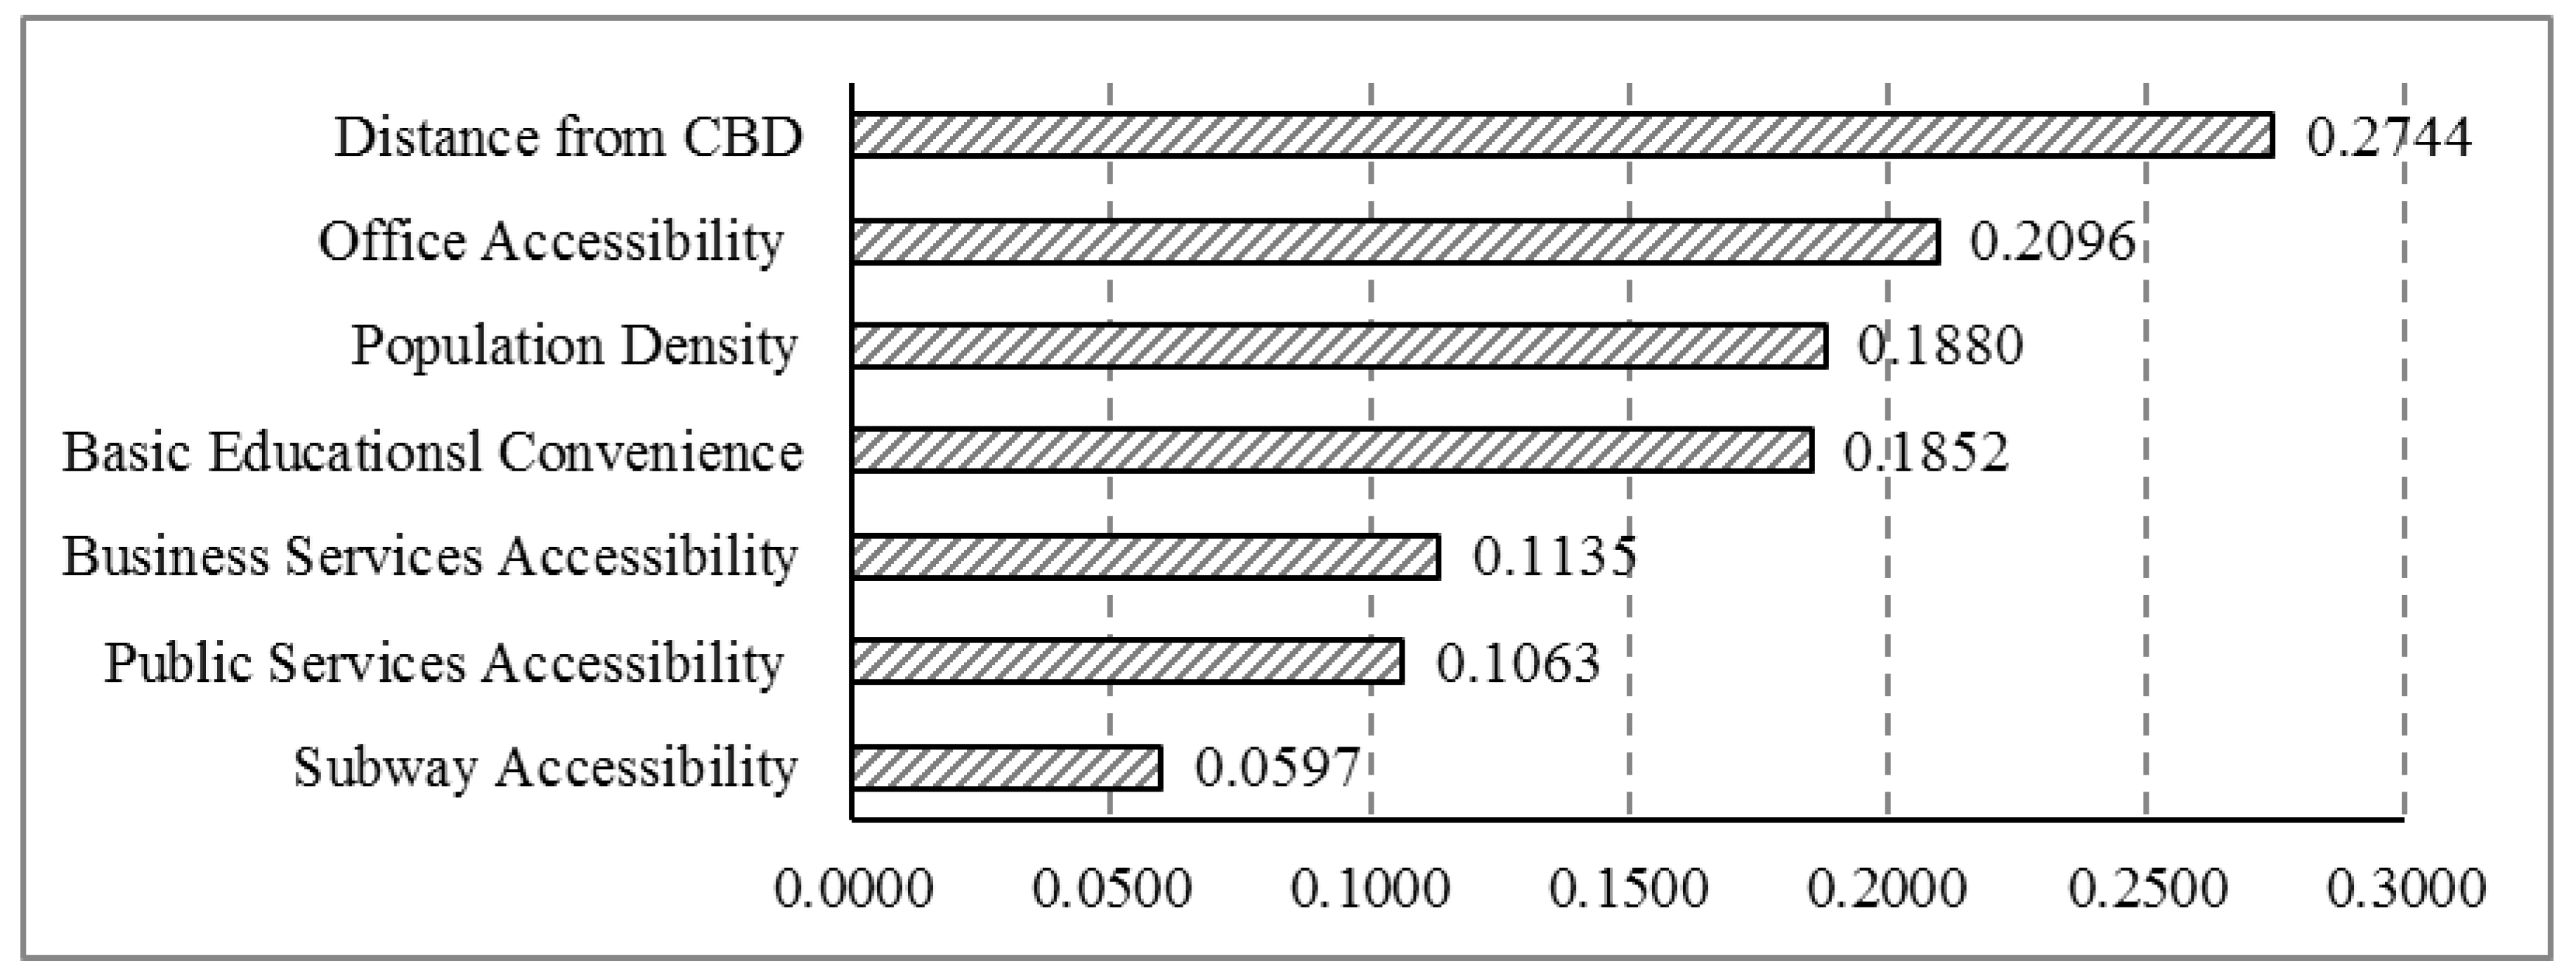
The results of the geodetector’s factor detector proved that all seven influencing factors have an impact on the housing vacancy rate, but the degree is different, distance from CBD has the strongest influence, while subway accessibility has the weakest influence. The results show that the housing vacancy rate in Guangzhou is influenced by a variety of factors and more factors can be further analyzed in the future.
6.2. Policy Implications
In order to solve the problem of vacant houses and alleviate the housing pressure, the conclusion of this study provides a reference for government departments to formulate relevant policies. (1) In areas with serious housing vacancy issues, such as the suburbs, restriction of large-scale real estate development, strict control of the number of houses, and avoidance of oversupply are recommended. However, the vacancy rate in city centers is low, which indicates that the housing demand in such locations is high. Relevant departments should provide more housing for buyers/renters, ensure the housing supply, and ease housing pressure. For example, the housing demand can be met by increasing the plot ratio of urban areas. (2) We also recommend guiding developers to develop rationally and avoid blindly developing large and high-priced houses in pursuit of profits, resulting in the mismatch of the supply and demand structure. (3) For areas with high vacancy due to the remote nature of the location, we recommend further strengthening the construction of housing infrastructure facilities and providing convenient transportation, mature and perfect facilities for residents, and so on, to meet residents’ demand for convenience in relation to work and daily life. (4) Finally, we recommend suppressing some developers’ speculation, over-selling, and so on, activities that result in a large number of vacant houses.


