Abstract
Historical villages represent a highly vulnerable cultural heritage; their preservation can be ensured thanks to technological innovations in the field of geomatics and information systems. Among these, Geographical Information Systems (GISs) allow exploiting heterogeneous data for efficient vulnerability assessment, in terms of both time and usability. Geometric attributes, which currently are mainly inferred by visual inspections, can be extrapolated from data obtained by geomatic technologies. Furthermore, the integration with non-metric data ensures a more complete description of the post-seismic risk thematic mapping. In this paper, a high-performance information system for small urban realities, such as historical villages, is described, starting from the 3D survey obtained through the integrated management of recent innovative geomatic sensors, such as Unmanned Aerial Vehicles (UAVs), Terrestrial Laser Scanners (TLSs), and 360º images. The results show that the proposed strategy of the automatic extraction of the parameters from the GIS can be generalized to other case studies, thus representing a straightforward method to enhance the decision-making of public administrations. Moreover, this work confirms the importance of managing heterogeneous geospatial data to speed up the vulnerability assessment process. The final result, in fact, is an information system that can be used for every village where data have been acquired in a similar way. This information could be used in the field by means of a GIS app that allows updating the geospatial database, improving the work of technicians. This approach was validated in Gabbiano(Pieve Torina), a village in Central Italy affected by earthquakes in 2016 and 2017.
1. Introduction
Historical villages, which often represent a tourist attraction thanks to their cultural and architectural value [1], are not immutable due to their inherent vulnerabilities, often being threatened by natural disasters. This is the reason why humans are investing heavily in preserving this artistic and cultural heritage. Preserving such places means, first and foremost, documentation and knowledge; the means to achieve this ambitious objective involves mapping and digitization of the existing buildings and implementing interventions and projects aimed to safeguard them [2,3]. In the case of historical villages, this cultural heritage is highly vulnerable, and their preservation is a race against time; there is, thus, a need to make this process as efficient and fast as possible. Recent technological innovations can boost this process, through geomatic techniques [4] and information systems [5].
It is no coincidence that themes, such as safe and resilient urban settlements, as well as risk prevention measures related to natural disasters are included in the list of Sustainable Development Goals of the 2030 Agenda signed by the UN member countries, indicated, respectively, by SDG Nos. 11 and 13 [6]. This implies that this is not an approach linked to a specific area, but also concerns other countries, and, therefore, this process of safeguarding can and should be replicated for all vulnerable realities, such as the historic Italian villages threatened by earthquakes.
Over the last 70 years, there have been more than 10,000 victims of hydrogeological and seismic phenomena have been recorded in Italy; the economic damage over the same period is estimated to be about EUR 290 billion, with an annual average of about EUR 4 billion, increasing over time [7]. To this end, in September 2016, the government launched the Casa Italia mission [8], a multi-year plan to promote the country’s safety in the face of natural hazards. Intervening to promote safety, moreover, means reducing the potential damage of future events. From an environmental point of view, by working on the quality of the often outdated building stock, it is possible to improve the overall safety of urban systems at the same time. From a cultural point of view, seismic, landslide, and flooding phenomena not only destroy people and things, but also parts of cultural heritage that is unique in the world. From an economic point of view, a vast plan of measures in the housing sector would have a multiplier effect on other sectors such as construction, which is structurally in crisis.
Thanks to the joint work of Italian public bodies, such as Istituto Nazionale di Statistica (ISTAT), Istituto Nazionale di Geofisica e Vulcanologia (INGV), Istituto Superiore per la Protezione e la Ricerca Ambientale (ISPRA), and Ministero per i Beni e le Attività Culturali (MiBAC), a first map of the risks of Italian municipalities (updated in 2018) has been drawn with the aim of providing an updated picture of Italian municipalities on the basis of quality variables and indicators, which allow an overview of the risks of exposure to natural events through the integration of data from different institutional sources [9]. This map is drawn on an open-source Geographic Information System (GIS) platform, an information system that manages and stores data and information related to the various areas exposed to different natural hazards.
In addition, in recent years, in Italy, there has been a substantial updating of the Technical Regulations (NTC 2018 [10]) of civil engineering works, which are in line with the European Technical Regulations (Eurocodes), and the progress made by science and technology, during recent national and international tragedies, has placed in designers’ hands cognitive tools of great reliability. These are regulations governing the design, execution, and testing of buildings in order to guarantee public safety at the established safety levels. These regulations are also constantly updated thanks to the use of a special technical sheet, the Agibilità e Danno nell’Emergenza Sismica (AeDES) sheet [11], which is compiled by the Civil Protection Department for the detection of damage, the definition of emergency measures, and the post-seismic assessment, and therefore vulnerability, of buildings. In this approach, the post-earthquake damage area is analysed by visual inspections by skilled specialists, including an expert evaluation of the damages, their extent, and the associated possibility for repair and reconstruction [12].
Given the above, the following gaps and research challenges are highlighted:
- The open-source GIS platform that is used for the risk maps of Italian municipalities’ archive data refers only to the municipal scale; therefore, it does not go into the details of each building that composes the single urban reality. In order to guarantee a more detailed representation of the built environment, each municipal technical office, especially those of small historical villages, must be able to prepare a GIS map that can then be linked to the national map;
- Such GIS mapping of the risks of Italian municipalities is only represented on the two-dimensional plane. The three-dimensional representation of the individual urban realities provides a better overview of the buildings’ volumes, allowing more accurate information. This can be ensured through the use of geomatic survey tools, which allow the generation of 3D models of buildings (Digital Surface Models (DSMs)) and the territory (Digital Terrain Models (DTMs));
- AeDES data sheets are documents that are compiled during in situ surveys of buildings, mainly entrusted on visual inspections. Once compiled, they are then stored in a database managed by the Civil Protection and shared with the municipalities. The latter are often not provided with a municipal GIS map. The insertion or connection of these documents to a GIS system would further enrich the information useful to obtain a more detailed and precise urban mapping (always taking into account the issue of privacy for the protection of private property of buildings) and thus offer a better representation of vulnerabilities.
In this light, the aim of this research work is to tackle the above-mentioned challenges, by developing a high-performance information system for small urban realities, such as historical villages, starting from the 3D survey obtained through the integrated management of recently innovative geomatic sensors such as the Unmanned Aerial Vehicle (UAV), the Terrestrial Laser Scanner (TLS), and the 360º images. In other words, this study is aimed at exploiting heterogeneous geomatics data in an efficient way, in terms of time and usability by using the open-source software Quantum GIS (QGIS). Complementary to this, this article develops a new methodology that allow to extract, in an automatic way, part of those parameters required for evaluating the vulnerability of the buildings, in this case for post-earthquake assessment. The results show that the proposed strategy of automatic extraction of parameters from the GIS can be generalized to other case study, thus representing a straightforward method for enhancing the decision making by the public administrations. Moreover, this work confirms the importance of managing heterogeneous geospatial data to speed up the vulnerability assessment. Finally, the proposed approach outperforms the visual inspection one, as it makes data more reliable and based on quantitative analyses.
The reminder of the paper is structured as follows: Section 2 illustrates a general overview about the use of GIS tools for emergency management applied to urban environment and shows how the data for the building assessment after seismic events are collected. Section 3 introduces the case study and describes the steps of methodology of work, starting from the data acquisition through geomatic techniques integration to the multi-data management in an open-source GIS tool. Section 4 highlights the results obtained, whose are discussed in Section 5, where also conclusions and future works are outlined.
2. Related Works
GIS platforms are containers for spatial information which, when properly managed, lead to the creation of query-able data systems, up to the creation of cartographic products at different territorial scales (e.g., geo-environmental maps) and for different purposes (e.g., thematic maps). The literature presents a plethora of works exploiting GIS for several domains, including private/public gardens [13], spatial analysis [14], decision making [15], and photovoltaic plants [16,17]. In other words, GIS allows visualising, combining, and managing heterogeneous data from different acquisition techniques sensor network sources, insomuch warranting data sharing and interoperability [18]. Nowadays, emergency management plans or conservation actions at building level are entrusted on 3D data, high-resolution photogrammetric images, cadastral data, urban planning data, building mapping (just to mention some), hitherto performed largely manually. Example of this interoperability, within the field of heritage conservation, could be found in the work carried out by Sánchez-Aparicio et al. [19] on which it is developed a GIS platform able to integrate 3D point clouds, 360º images, inspection forms, and a wireless sensor network to manage the preventive conservation of heritage places.
At urban level, the management of emergency plans could be considered as a priority since they provide the necessary information for the designing of prevention and mitigation actions. In the field of urban safety, seismic, fire and flood risks, which can cause serious consequences, must inevitably be taken into account in order to plan prevention actions and adopt protection measures for the population [20]. The integration of risk plans into a GIS platform represents an efficient and effective solution towards risk mitigation at the urban scale, allowing administrative authorities to define interventions for a more accurate and comprehensive emergency planning strategies. Ortiz et al. in their studies on the historical centre of Seville (Spain) use a GIS framework for designing risk maps through the spatial analysis of hazards (structural, environmental, anthropogenic), vulnerability maps and test of characterization [21,22]. The integration of all this information allows to create a suitable strategy for prioritising preservation efforts. In the same line, Saha et al. uses the GIS platform for generating a multi-hazard susceptibility mapping for evaluating a cultural heritage site in the Himalayan region (India) [23].
With regard to seismic risk, many applications of data management through a GIS platform can be found in the literature, motivated by its versatility, and especially due to the open-source way of sharing information (e.g., QGIS, WebGIS). The evaluation of seismic vulnerability, urban resilience, and recovery strategies has been largely performed with GIS, in order to to obtain the typological characterization of the surveyed buildings. As an example, in [24], authors proposed a methodology to create the seismic map identifying the building assessments and vulnerability. Moreover, a seismic risk evaluation method in a district level is proposed by [25]. The model assesses the seismic vulnerability using GIS for the definition of a vulnerability map. Furthermore, a geographical information system to study the seismic vulnerability of Tehran to an earthquake by taking into account different categories of information is proposed by [26] and a GIS-oriented procedure using geological and geotechnical parameters and also the vulnerability of buildings and the effects of their collapsing, is suggested by [27]. An interested reader can find similar experiments in [28], where the authors defined a cross-mapping about vulnerability, damage scenarios and buildings exposure based on a multi-level procedure for earthquake disaster prevention. The same approach was adopted by Salazar and Ferreira which confirmed the multiple components of seismic risk to be managed within the GIS tool [29]. GIS platform is also suitable and useful for planning safety interventions and optimal routes for the accessibility of a certain area; the main novelty in this case was the assignment of priorities [30]. In the specific case of seismic analysis of buildings, there are several studies that address the issue of seismic vulnerability on a number of parameters describing individual building properties [31,32]. These studies are typically addressed by the structural engineering sector that perform specific analyses of building stability. The results obtained from these analyses are useful for mapping the seismic assessment of buildings in an urban settlement and only in few cases are GIS tools used to draw thematic maps [33]. It is worthwhile to mention the works carried out by Indirli et al. in which they propose the use of a GIS approach supported by the laser scanning technology and in-field works (AeDES forms) as a quick survey tool for pre/post-earthquake building inventories in the Italian region of Abruzzo [34,35].
In comparison with these previous works, the present work aims at improving at different levels:
- 1.
- The integration of additional geomatic techniques, such as the use of Structure from Motion (SfM) approach for the creation of high-resolution 3D point clouds of the roofs or the use of 360º images for the generation of quick virtual environments to support the inspections;
- 2.
- The automatic extraction of geometrical parameters and attributes required for the seismic risk assessment;
- 3.
- The use of GIS app to support the in situ data acquisition.
3. Materials and Methods
The aim of this work is to implement a GIS-based approach combining data from geomatic surveys and other non-metric data for the building assessment of a historical village after seismic events. In particular, point clouds are obtained from LIDAR (Light Detection and Ranging) and photogrammetric surveys from UAVs (Unmanned Aerial Vehicles). They are georeferenced using GCPs (Ground Control Points), obtained from GNSS (Global Navigation Satellite System) surveys, and combined. The laser scanner used is equipped with a digital camera which provides 360° images. As outputs of the data processing phase, the orthophoto is generated from the photogrammetric data, while DSM (Digital Surface Model), DTM (Digital Terrain Model), and building contours are extracted from the unified point cloud. Then, orthophotos, DSM, DTM, building contours, unified point cloud, 360° images and AeDES sheets are together collected and included in an open source GIS (QGIS). Finally, DSM, DTM and building contours are exploited to automate the extraction of information related to geometric parameters concerning the buildings, through Python scripts developed by the authors that interact with the data and objects in QGIS.
This methodological pipeline, described above, is summarized in Figure 1.
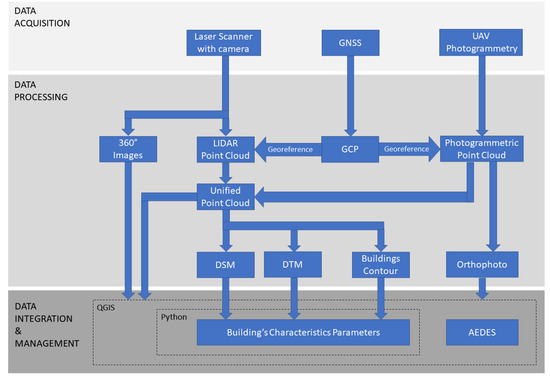
Figure 1.
Methodology workflow.
3.1. Case Study
The seismic crater defined following the recent earthquakes that hit Central Italy (2016, 2017) covers a very large area including 140 municipalities in four Italian regions, an area classified with a high seismic risk index (Figure 2). This area is characterized by a predominantly hilly and mountainous context of great landscape value and the urban realities present are mainly represented by small villages that are an example of tangible heritage for their historical, architectural and traditional-popular richness. To see these small towns lost and abandoned would be a great loss for the country, not only in terms of tourism, but also in cultural and economic terms.
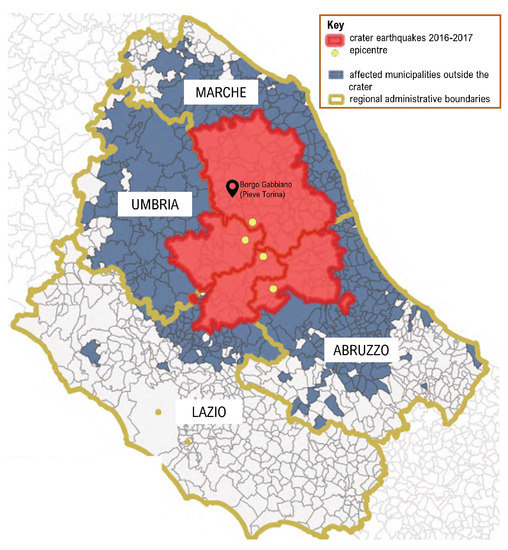
Figure 2.
Map of the seismic crater in Central Italy after earthquakes 2016–2017 (source: report curated by Ufficio Speciale Ricostruzione, January 2020) and identification of the site of interest Gabbiano (Pieve Torina, Italy).
The village Gabbiano (Pieve Torina), located within the earthquake crater in the Marche region (Figure 2), was identified as a case study for this research project on the implementation of a multi-data GIS system for building assessment. The village stands on a small hillside and consists in a small urban core, of about 21 building units in 12 clusters, of two-three storey buildings. These buildings are made up by two-three leaf irregular masonry covered by a timber structure with ceramic tiles.
After the seismic events the village has suffered significant damages on which part of the structures have collapsed, showing in-plane and out-of-plane mechanisms (Figure 3) and is still an area at risk and, therefore, uninhabited, being necessary the use of remote sensing strategies for generating the data required for the post-earthquake evaluation.
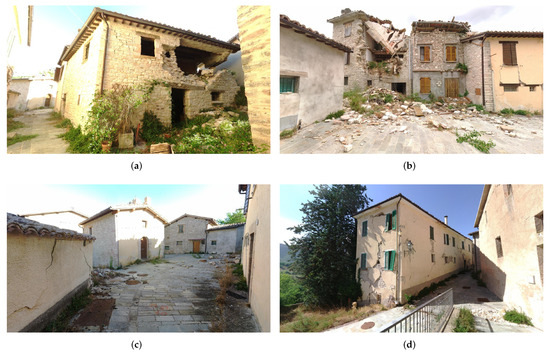
Figure 3.
Damaged buildings in Gabbiano (Pieve Torina, Italy) on which is possible to observe different typologies of collapse. (a) Example of collapses stone Façade, (b) example of roof collapsed in stone buildings, (c) example of small urban area with cracks and (d) example of more recent building with cracks.
3.2. Technical Documentation
In Italy, inspection campaigns made by the Civil Protection are carried out with the aid of the first level damage detection, emergency intervention and usability assessment form for ordinary buildings in post-seismic emergencies (AeDES) [11,36]. The AeDES sheets were used for the first time by the Marche region in its original version during the 1997 Umbria-Marche earthquake. It was therefore used during the 2009 Abruzzo earthquake and subsequently in the 2012 Emilia earthquake and therefore became not only de facto but also an official reference tool for the expeditious survey of damages, the definition of damage, the definition of emergency measures and the post-seismic assessment of ordinary buildings [11].
This technical data sheet is used to provide an assessment of the building’s condition state and is composed of 8 sections which are structured as follows:
- 1.
- Building identification. In this section the building is found by its geographical coordinates and cadastral information. Moreover, a map of the structural aggregate is required and the building identification;
- 2.
- Building description. Floor numbers, average floor height, average square meters for each floor, approximate date of construction, type of use, etc., are required in Section 2;
- 3.
- Structural typology. Description of vertical structural parts and horizontal structural parts;
- 4.
- Damage to structural elements and emergency measures already carried out. This section must include the level of damage for each structural element and which kind of measures has already been taken;
- 5.
- Damage to non-structural elements and emergency measures already carried out;
- 6.
- External hazard due to other constructions, networks, slopes and emergency measures carried out;
- 7.
- Soil and foundation. In this section must be reported if there are slopes and damages to foundation;
- 8.
- Assessment of accessibility. By assessing the risks, the technician should be able to decide if the building is accessible or not.
As can be seen, all these data are entered through an on-site visual inspection by qualified operators. They are mostly non-metric data, but some of this required information can be documented with the support of geomatics tools and collected to create mappings on information systems, such as GIS.
3.3. Data Acquisition and Processing
As it was stated in the previous section, part of the parameters used by the AeDES methodology implies the necessity of having geometrical data (i.e., measurements) of the buildings. In accordance with that, we propose an efficient strategy for virtualizing the village by using the approaches suggested by the European preventive conservation project HeritageCARE [37], namely:
- 1.
- Photogrammetry with UAV for the digitisation of building roofs;
- 2.
- Terrestrial laser scanning and spherical images for the digitisation of the vertical envelop of the buildings.
All these methodologies are complemented by the use of GNSS points in order to georeference the products obtained. For the GNSS survey, a “Zenith35 Pro TAG” from GeoMax was used to acquire the coordinates of 10 points on roads and outdoor pavements, to be used as Ground Control Points (GCP), in about 15 min (Figure 4). In RTK (Real Time Kinematic) mode, the receiver has a horizontal accuracy of 8 mm ± 1 ppm (rms) and a vertical accuracy of 15 mm ± 1 ppm (rms) [38]. All the points captured by the GNSS were placed in the coordinate system WGS 84/UTM zone 33N (EPSG:32633).
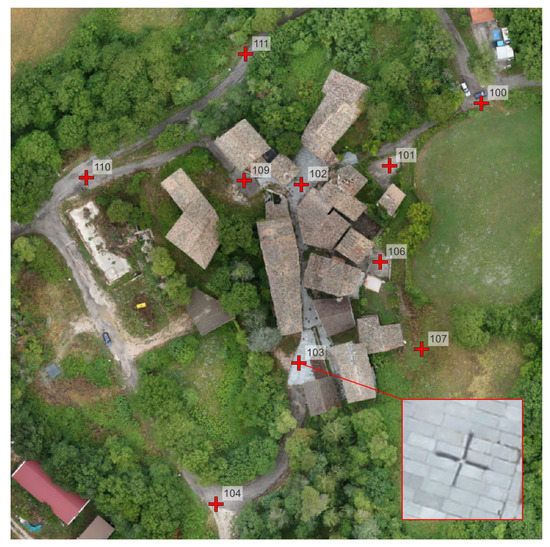
Figure 4.
Ground control point example.
The aerial photogrammetry was carried out by using the “SR-SF6” VTOL UAV by Skyrobotic [39] with a Sony “DSC-QX100” camera mounted as payload. This camera is equipped with a mm sensor with 20.2 MPix [40] and a lens with a focal length setting of mm. Using the Skydirector app [39], the flight of the UAV was planned to execute 7 photogrammetric strips in nadiral direction at progressive altitudes following the course of the terrain, which presented a difference in height of about 30 m, to maintain a distance of at least 50 m from the objects to be surveyed, with 65% overlap and 60% side lap on an area of about 30,000 m2 (Figure 5). A total of 108 aerial photos were captured, covering the whole area of the survey and the 10 reference points. The average GSD of this flight was about 1.54 cm and the time spent for this flight was about 14 min.

Figure 5.
SkyDirector app used for UAV flight plan.
The photos acquired during the aerial photogrammetric survey were processed by using a SfM approach [41]. This approach allows us to obtain a 3D point cloud model and an orthophoto of the surveyed area. The inner orientation of the camera was carried out by using a self-calibration approach, considering a Fraser camera model (Table 1) [42]. The external orientation of the cameras was performed by using the self-calibration approach, as well as a bundle adjustment. During this stage the coordinates of the GNSS points were used as Ground Control Points (GCP). As a result, a photogrammetric model with an RMS error of 4.82 cm was obtained (Table 2). Then, a Semi-global Matching stage was performed with the aim of obtaining the dense point cloud [43]. This point cloud was made up by 75,027,126 points, allowing to obtain a true orthophoto with a GSD of 1.54 cm (Figure 6). The total processing time of this phase was about 3 h and 30 min.

Table 1.
Inner parameters of the camera before and after the self-calibration.
Table 2.
GCP residual errors (X—Easting, Y—Northing, Z—Altitude, Image—Reprojection Error).
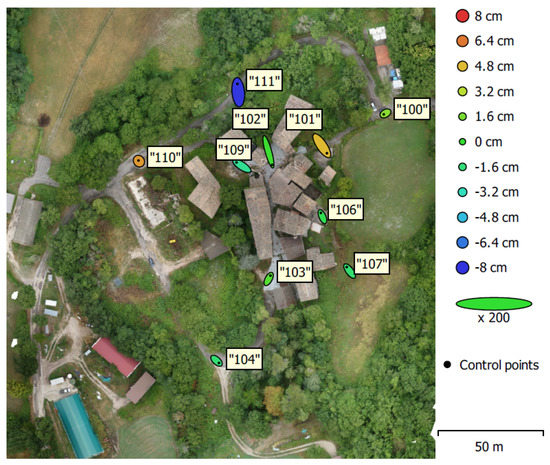
Figure 6.
Orthophoto of the surveyed area with GCP locations, Z error represented by ellipse colour and X, Y errors represented by the ellipse shape.
On the other hand, the terrestrial digitisation of the buildings was performed by using the light-weight laser scanner Faro Focuss 70. This laser scanner is based on the phase shift physical principle with a measurement range from 0.6 to 70 m, a capture rate from 122,000 to 976,000 points per second and a nominal accuracy of 1 mm at 25 m in normal conditions of illumination and reflectivity. A total of 151 scans along the streets of the village, for a total acquisition campaign of about 3 days in an area of about 10,000 m2, were required in order to obtain a full 3D point cloud of the site (Figure 7).
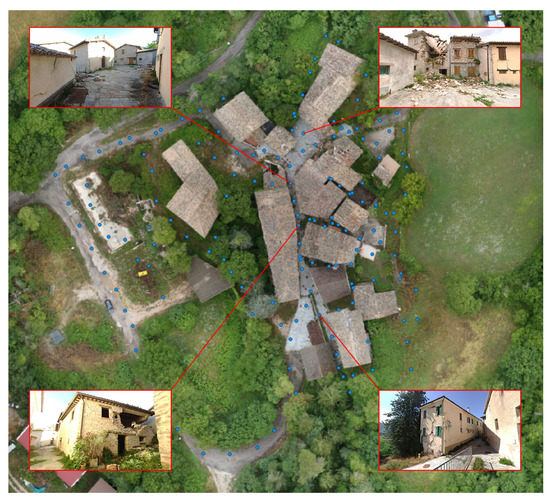
Figure 7.
360° images linked in QGIS.
All the scan stations were registered in a local coordinate system by using the Iterative Closest Point (ICP) algorithm [44], obtaining a 3D point cloud made up by 673,355,488 points. (Figure 8). In parallel to each scan, it was captured a spherical image by using the integrated camera of the laser scanner. This image allows us to colourise the point cloud, as well as to create a simple virtual environment to support the on-site inspection (Figure 7). The 3D point cloud obtained by the laser scanner was georeferenced with the GNSS points by using a 6 parameter Helmert transformation, which resulted in an RMS of 6.82 cm (Table 3). The whole processing of the LIDAR scans required approximately one day.
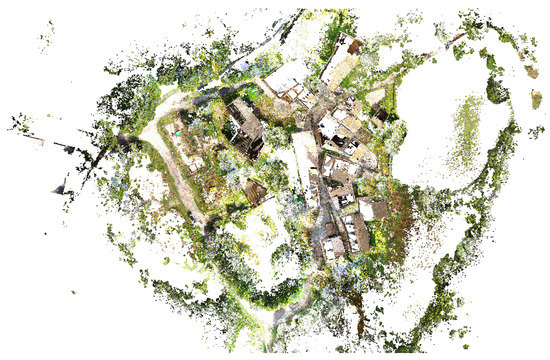
Figure 8.
Point cloud obtained from the terrestrial LIDAR survey (top view).
Table 3.
Residual error of the reference points in the terrestrial LIDAR survey.
The point cloud from the aerial photogrammetric survey was then exported and combined with the point cloud from the terrestrial LIDAR survey, resulting in a unified point cloud of 748,362,614 points (Figure 9). Using the Cloud Compare software, from the unified point cloud, the Digital Terrain Model (DTM) and the Digital Surface Model (DSM) in raster format were generated. These data will be used for the computation of the buildings’ parameters explained in Section 3.4.
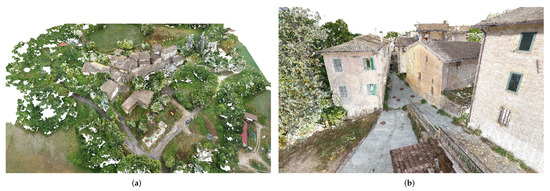
Figure 9.
Unified point cloud: (a) Aerial view and (b) Street view.
3.4. Data Integration and Management
Once the survey and processing of the point cloud and spherical images is complete, it becomes clear which information can be extracted from the data. Since the aim of this work is to develop a pipeline for helping an expedited seismic evaluation at urban scale, only the exterior of the village was surveyed. Additionally, many of the buildings were severely damaged by the last seismic events in the area and it was not possible to access safely to their interior.
The idea is to satisfy the demand for a complete model by collecting and linking all geometric and non-geometric data in a geo-database. In this case, the open-source software Quantum GIS (QGIS) was used.
The data collected into QGIS were:
- Orthophoto as a raster layer;
- DSM (Digital Surface Model) as a raster layer;
- DTM (Digital Terrain Model) as a raster layer;
- Building contours as a vectorial polygon layers;
- AeDES sheets as a table with no geometry data;
- Spherical images from LiDAR scans as a vectorial points layer;
- Unified point cloud (currently implemented only for visualization purposes).
This software allowed us to develop Python scripts to both improve the user experience and allow the automatic extraction of some parameters concerning the characteristics of the buildings.
Some of these layers are related to each other simply by spatial coordinates and reference systems (raster and vectorial layers with geometry data), while other data are linked via table attributes.
For instance, the AeDES datasheets are related to the buildings with both tables containing the fields “Sheets” and “Parcels”, with the possibility that a single AeDES sheet may relate to multiple parcels and that multiple AeDES sheets may have been produced for a parcel during the life of the building. Therefore, a function has been implemented using a script, which allows to filter the AeDES table by selecting a building in the map or in the building’s table. This filter will show the AeDES sheets with the same sheet and at least one of the parcels of the selected building. Then, to open the file of each AeDES sheet (usually in PDF format) from the table, a simple QGIS action was implemented.
Similarly, for 360° images has been implemented a python script to allow to open them using an external viewer, by simply clicking on them on the map or in their table. In this case the viewer used is the open-source software FSP viewer [45].
The different information sources captured during the digitisation campaign allow us to automatise the computation of four parameters that are often used, together with other input parameters, for performing expedient seismic vulnerability assessments. This represents only a starting point, future work may attempt to automate the calculation of the other necessary parameters.
A crucial aspect is that the developed scripts work in any kind of urban scenario, obviously assuming that the validity of these parameters for the seismic assessment depends on the constructive typology of the buildings. These parameters are:
- 1.
- Number of floors of each building;
- 2.
- Shape regularity in plan;
- 3.
- Planimetric position of the building in relation to the cluster;
- 4.
- Presence of adjacent buildings with different heights in the cluster, in relation to the examined building.
3.4.1. Number of Floors
The first of the parameters extracted is the number of floors in each building. Using the raster layers (orthophoto, DTM, and DSM), it is simply estimated through the following steps.
- 1.
- Extraction of the median of the DSM values and the minimum of the DTM values, falling within the contours of each building. This can be done thanks to the QGIS “zonal statistics” algorithm, which, for each zone of a polygonal vector layer, can perform different statistics about the values of the pixels of a raster layer lying in that zone.
- 2.
- Calculation of the the floor number as the difference between DSM median and DTM minimum, divided by the expected floor height and approximated to the nearest integer.
3.4.2. Shape Regularity in Plan
The second parameter is the shape regularity in plan. The script checks that two of the conditions prescribed by NTC 2018 [10] for regularity in plan (Paragraph 7.2.1) are checked (Figure 10).
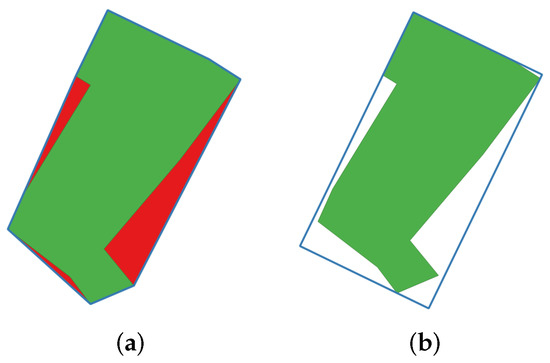
Figure 10.
Shape regularity in plan conditions: (a) Convex hull in blue. Red area <5% of green area. (b) Minimum circumscribed rectangle in blue. Ratio of the rectangle sides <4.
- 1.
- The contour of the building is convex or the areas between the contour and the circumscribed convex line are less than 5% of the contour area.
- 2.
- The ratio of the sides of the rectangle circumscribed around the contour of the building is <4.
To verify these conditions, the script uses only the contours of the buildings (vectorial polygon layer) and, exploiting the QGIS “convex hull” and “oriented minimum bounding box” algorithms, creates the polygons described by the two conditions, respectively, and checks them.
3.4.3. Planimetric Position into the Cluster
The two remaining parameters concern the clustered buildings only. One is the planimetric position of the building in relation to the cluster (“Centre”, “Angle”, or “End”, Figure 11). Using only the building contour layer, it is computed for each building with the following steps.
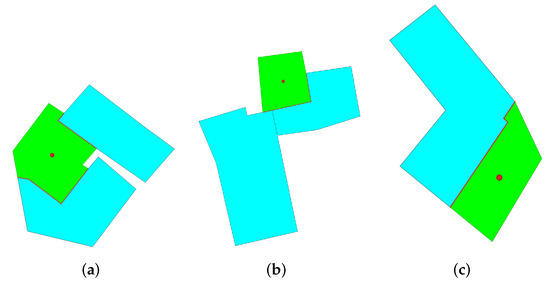
Figure 11.
Examples of planimetric positions into the cluster: (a) “Centre”, (b) “Angle”, (c) “End”. Examined building in green, adjacent buildings in cyan, centroid as a red point, contact segments as red lines.
- 1.
- Identification of adjacent buildings exploiting the selection rule “extract by location”. This rule creates a new vector layer that only contains features from the first vectorial input layer, that matches the selected relative position conditions with regard to the features of the second vectorial input layer. It is worth to mention that if there are not buildings adjacent to the examined one, the script move on to the next building without performing further processing;
- 2.
- Computation of the centroid of the examined building using the QGIS algorithm with the same name. The centroid is the barycentre of the polygon;
- 3.
- Extraction of the boundaries of the examined building and the adjacent ones, using the QGIS “boundary” algorithm, which transform the polygon layers in polylines layer;
- 4.
- Identification of the common boundaries between the examined building and the adjacent ones, exploiting the QGIS “intersection” algorithms which, in the case of two layers of polylines as input, returns only the overlapping polylines as output;
- 5.
- Separation of the contact segments through the QGIS algorithm “explode lines”, which allow to divide the polylines of the common boundaries into single lines;
- 6.
- Examination of each contact segment to establish its contact direction and its validity. The contact direction is perpendicular to the segment, towards the examined building. The validity is based on the position of the centroid of the examined building in relation to the contact segment. The contact segment is valid if the centroid lies on the side facing the examined building and is between the perpendicular lines passing through the start and end of the segment;
- 7.
- Recovery of pairs of segments with similar contact directions (within a certain tolerance) for which the centroid was on the side facing the examined building but not between the mentioned perpendicular lines. The pair of segments is recovered if the centroid was on different sides with respect to the lines perpendicular to the two segments. In this case the average of the two contact directions is considered valid;
- 8.
- Computation of the maximum angle difference between all possible pairs of valid contact directions (≤180°);
- 9.
- Determination of the plan position of the building in the cluster based on the calculated maximum angle difference. “Centre” if angle > (180°—tolerance), “Angle” if (180°—tolerance) ≥ angle > (90°—tolerance) or “End” if (90°—tolerance) ≥ angle.
3.4.4. Presence of Adjacent Buildings with Different Heights
The last parameter determines whether there are buildings with a different height adjacent to the one under examination, considering a certain tolerance (Figure 12). The script uses the building contour layer and the DSM layer to determine it with the following steps.
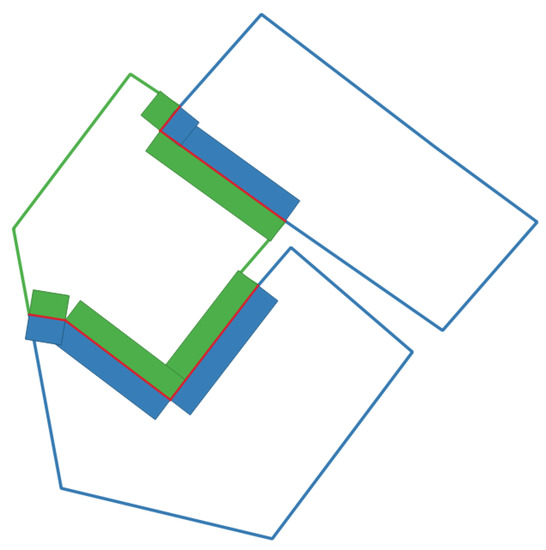
Figure 12.
Determination of the presence of adjacent buildings with different heights: examined building as a green line, adjacent buildings as blue lines, contact segments as red lines, buffer towards the examined building as green zones and buffer towards the adjacent buildings as blue zones.
- 1.
- Same steps 1, 3, 4, and 5 (skipping step 2) as for the previous parameter in Section 3.4.3, to extract the contact segments with the adjacent buildings;
- 2.
- Creation of two buffers for each segment, one on the side of the examined building and one on the side of the adjacent building, exploiting the QGIS algorithm “single sided buffer”, which extrude the lines of the input layer for a selected distance towards the chosen side, and return a polygonal vectorial layer;
- 3.
- Calculation of the two medians of the DSM values falling into the two buffers, exploiting the same “zonal statistics” algorithm described in the step 1 of Section 3.4.1;
- 4.
- If the difference between the two medians is too great, considering a certain tolerance, for at least one contact segment, it means that there are buildings with a different height.
4. Results
This section will present the outcomes of this work. In particular, in Section 4.1 the integration within the GIS of all the data previously described will be illustrated, while Section 4.2 will present the results of the geometric parameters of the buildings that have been automatically extracted using the developed Python script, that is openly available in Zenodo at https://doi.org/10.5281/zenodo.6398968 and in GitHub at https://github.com/FabioPiccinini/pyvulnerability (last access 25 April 2022).
4.1. Integration of Information
As it was stated in Section 3.4, the QGIS framework developed by this work should be able to integrate different type of information (i.e., raster, vectorial, 3D point clouds, and 360º images) (Figure 13 and Figure 14).
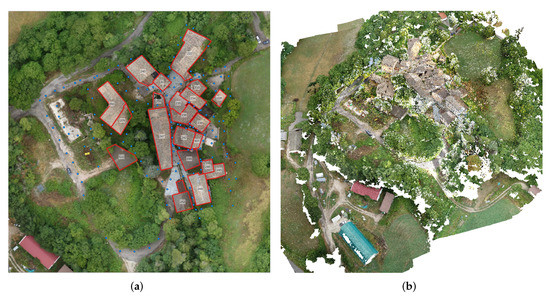
Figure 13.
Data in QGIS: (a) Polygons of buildings and points of 360° images on the orthophoto (b) Point cloud visualisation in a 3D map.
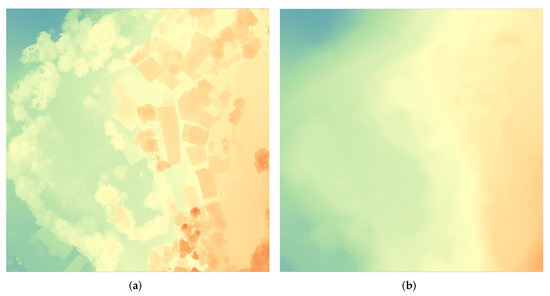
Figure 14.
Data in QGIS: (a) DSM and (b) DTM, with a spectral false colour scale.
The raster information was directly integrated into the platform. The first information source was the orthophoto created by the aerial photogrammetry. Then, 360º images were introduced into the QGIS project as a point vectorial layer, stored in a shapefile, visible above the aerial orthophoto. This shapefile has direct links to each panorama. Thanks to this, if the user wants to virtually consult one building it can be done by just clicking on the point, the project will run FSP viewer to open the associated panorama. This type of information allows to evaluate the type of collapse mechanism of the building, as well as the different constructive solution adopted during its construction. Figure 3a shows an example of collapsed building made up by a two-leaf masonry wall with a timber structure. At the first floor the building shows some iron ties that prevent the out-of-plane deformation of part of the structure. However, the upper part of the structure has collapse due to the formation of an out-of-plane mechanism. Concerning the 3D point cloud, in the current version of QGIS (3.22) only its visualisation in both 2D and 3D map is supported (Figure 13b).
Additionally to this geometrical information, the geospatial database links each building with its associated AeDES sheet (Figure 15). The table displays the files path and, thanks to a simple QGIS action, it is possible to open them with the O.S. default application.
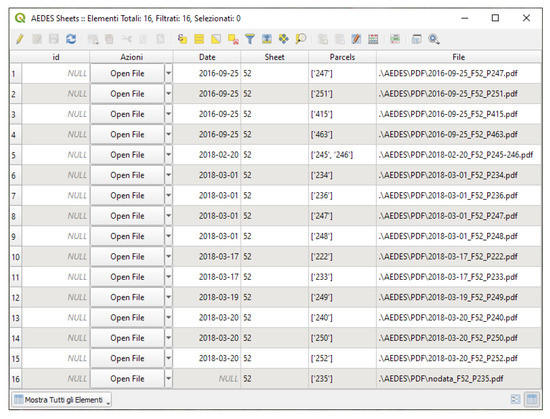
Figure 15.
Attribute table of the AeDES sheets.
The office work was complemented by the app Qfield [46], allowing to edit and manage the different shapefiles of the project by using an Android smartphone or tablet (Figure 16). This application could be used in field with the aim of improving the work carried out by the technicians.
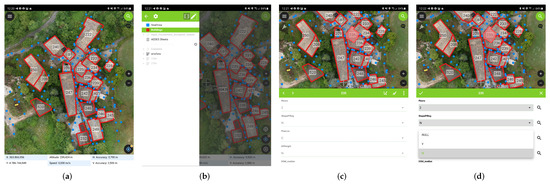
Figure 16.
Screenshots of the Qfield application with the data generated inside the QGIS project: (a) General view of the cadastral layer, the orthophoto and the point layer that represents the different scan stations; (b) View of the project tree; (c) Appearance of the app when the user consult the data contained in a shapefile; and (d) Appearance of the app when the user edits a field.
4.2. Automatic Extraction of Parameters
Once all the geometrical data were uploaded to the QGIS platform it was possible to automatically calculate the four geometrical parameters defined in Section 3.4. All these parameters are stored within the geospatial database, as is shown in Figure 17.
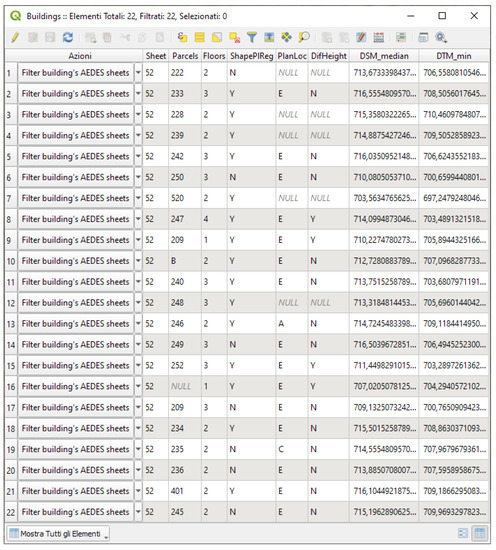
Figure 17.
Attribute table of the buildings, showing the calculated parameters.
As mentioned in Section 3.4.1, the process to extract the first parameter also automatically computes the median value of the DSM and the minimum value of the DTM for each building and store them in the attribute table, as can be seen in Figure 17. The output of the floor parameter calculation is shown by the thematic map in Figure 18a.
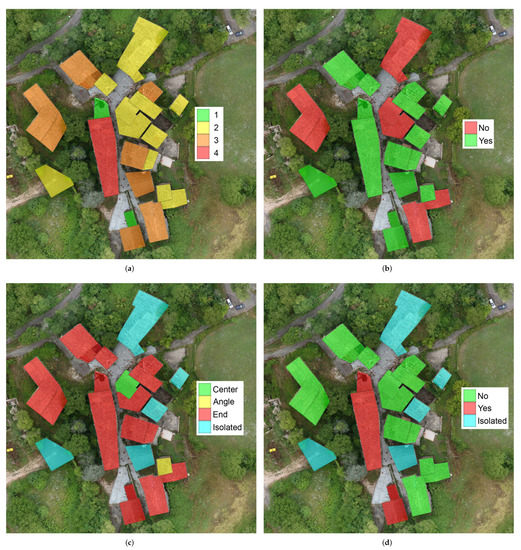
Figure 18.
Thematic maps of the four extracted parameters of the buildings, shown in QGIS: (a) Number of floors (b) Shape regularity in plan (c) Planimetric location in the cluster (d) Presence of adjacent buildings with different height.
The results of the second parameter, concerning the shape regularity in plan of the building, are displayed by the thematic map in Figure 18b. There are 7 buildings out of 22 with no regularity in shape. These buildings are coloured in red, while all the buildings which fulfils the geometrical conditions for shape regularity from the Italian regulation NTC 2018 [10] are coloured in green.
Another parameter extracted, useful for studying the vulnerability of a building is the planimetric position of the building related to its adjacent buildings. The classification shows four different scenarios, classified as “centre”, “angle”, “end”, and “isolated” building. The algorithm calculates how the buildings must be classified so in the thematic map in Figure 18c they are visible, respectively, in green, yellow, red, and cyan colour. The general overview from the top shows that there is not a specific criterion used for the building structures of village Gabbiano. Thanks to this automation it can be highlighted how buildings are classified. Apart from the five “isolated” buildings, only one is classified as “centre” and one is classified as “angle”. All the others are considered as “end” in their respective cluster.
The last parameter automatically calculated concerned the adjacent building height difference. Two pairs of buildings have a considerable difference in height. They are all displayed with the letter Y (yes) in the attribute table and in red colour in the dedicated thematic map in Figure 18d. All the 13 buildings in green may be considered with almost no height difference. The five isolated buildings, in cyan, cannot be considered in this calculation as there are no adjacent buildings to be compared with.
5. Discussion and Conclusions
This work aims at improving the methodology presented by Indirli et al. [34,35] for the integration of the AeDES inspection forms (used for quick post-seismic evaluations) into a GIS framework. It will help the management of historic centres after an earthquake, since the AeDES datasheets are produced only after the buildings have been damaged. This approach is suitable for historic villages affected by earthquakes and which are threatened by new earthquakes in the future as they are located in a high-risk territory. The collected information are suitable for prevention of such villages thanks to the fact that such data can help for example for the vulnerability index determination. These improvements were the following ones: (i) the use of additional geomatic tools; (ii) the automatization of some geometrical parameters; and (iii) the use of the Qfield app for improving the in-field work of the technicians. Regarding the first one, we propose the use of aerial photogrammetry (SfM and UAV) for the generation of aerial orthophotos, as well as for capturing the information of the roofs. Additionally, we have introduced the use of 360º images as a quick virtual resource for evaluating the collapse mechanism and construction system of the buildings. This virtual resource is integrated directly into the QGIS platform allowing to load directly the 360º image by means of the FSP viewer. The information generated by the aerial photogrammetry, namely 3D point cloud, is integrated with a TLS point cloud allowing to obtain a complete digitisation of the village. This digitisation required a total of 4 days, 3 h, and 34 min. Concerning the second improvement, we have developed several Python scripts that calculates in a automatic way four different parameters, enhancing the performance of the traditional AeDES approach. Finally, we propose the use of the Qfield app which allow to modify and manage all the information in situ. This aspect is considered critical since the AeDES approach is mainly based on visual inspection in field. The aspect we have mainly focused on is related to seismic vulnerability indexes, but the explained approach can be extended to other architectural or engineering purposes. The work described can be applied also for other parameters in function of the requirements, for instance focusing on ground parameters or system installations. As a concluding remark, it is worthwhile to note that the proposed methodology fulfils with the European SENDAI framework for disaster risk reduction [47] in at least two of four basic principles: (i) Understanding disaster risk and (iv) enhancing disaster preparedness for effective response, and to “Build Back Better” in recovery, rehabilitation and reconstruction. This is not trivial, and the introduction of Geomatic integrated survey as a current practice for increasing the knowledge of villages represents a fundamental step forwards. In this sense, we propose the use of panoramic images, terrestrial laser scanning, and aerial photogrammetry by means of the SfM approach. These combination of strategy proves to be the best combination in terms of efficiency/data acquired. Future works will be focused on different topics: (i) the development of new algorithms for the automatic extraction of additional geometrical parameters; (ii) the use of the geometrical data for generating simplified BIM models; and (iii) the development of a Spatial Data Infrastructure. Regarding the first and second topic, we have planned to improve the automatic extraction of geometrical parameters by exploiting the 3D point cloud obtained by the TLS. In this sense, it will be used the RANSAC Shape Detector approach [48] for extracting the different vertical walls and roof planes. Then, this segmentation will be compared with the original planes, allowing to evaluate the presence of out-of-plane mechanism, as well as deflections of the structure, as well as to serve as the base for 3D modelling (BIM). This question will allow to combine the GIS and BIM approaches in a unique framework. With respect to the Spatial Data Infrastructure we have planned to scale up the approach developed in this work to a manage model on internet. This model will be a Spatial Data Infrastructure within the INSPIRE framework. In this tool we have planned to maintain the main data sources (AeDES sheets, 360º images, orthophotos, DSM) in order to facilitate the work of the technicians without using 3D models.
Author Contributions
Conceptualization, Fabio Piccinini, Alban Gorreja and Francesco Di Stefano; methodology, Fabio Piccinini, Roberto Pierdicca and Luis Javier Sanchez Aparicio; software, Fabio Piccinini; validation, Fabio Piccinini and Luis Javier Sanchez Aparicio.; formal analysis, Fabio Piccinini; investigation, Fabio Piccinini; resources, Fabio Piccinini; data curation, Fabio Piccinini; writing—original draft preparation, Fabio Piccinini, Alban Gorreja, Francesco Di Stefano; writing—review and editing, Alban Gorreja, Francesco Di Stefano, Roberto Pierdicca and Luis Javier Sanchez Aparicio; visualization, Luis Javier Sanchez Aparicio; supervision, Luis Javier Sanchez Aparicio and Eva Savina Malinverni. All authors have read and agreed to the published version of the manuscript.
Funding
This research was partially founded within the framework of the regional project “RICOSTRUZIONE SMART DEI BORGHI STORICI”, which has been financed by the “PROGRAMMA OPERATIVO REGIONALE DEL FONDO EUROPEO DI SVILUPPO REGIONALE POR FESR MARCHE 2014–2020”.
Institutional Review Board Statement
Not applicable.
Informed Consent Statement
Not applicable.
Data Availability Statement
The developed Python script is openly available in Zenodo and GitHub at https://doi.org/10.5281/zenodo.6398968 (last access 18 December 2021).
Acknowledgments
The authors would like to thank Flyengineering s.r.l. for financing the access to the Doctoral Program and Courses program. We also thank the Eredipaci s.r.l., ImpresaCalzolari s.r.l., Flyengineering s.r.l. and EIG s.r.l. for providing the datasets used for this research.
Conflicts of Interest
The authors declare no conflict of interest.
References
- Malihah, E.; Komariah, S.; Utami, N.; Prakarsa, E. Cultural tourism: Commercialization or preservation? Promoting Creative Tourism: Current Issues in Tourism Research. In Proceedings of the 4th International Seminar on Tourism (ISOT 2020), Bandung, Indonesia, 4–5 November 2020; p. 89. [Google Scholar]
- Masciotta, M.; Morais, M.; Ramos, L.; Oliveira, D.; Sánchez-Aparicio, L.J.; González-Aguilera, D. A Digital-based Integrated Methodology for the Preventive Conservation of Cultural Heritage: The Experience of HeritageCare Project. Int. J. Archit. Herit. 2021, 15, 844–863. [Google Scholar] [CrossRef]
- Marra, A.; Trizio, I.; Fabbrocino, G. Digital Tools for the Knowledge and Safeguard of Historical Heritage. In Civil Structural Health Monitoring; Rainieri, C., Fabbrocino, G., Caterino, N., Ceroni, F., Notarangelo, M.A., Eds.; Springer International Publishing: Cham, Switzerland, 2021; pp. 645–662. [Google Scholar]
- Nex, F.; Rinaudo, F. LiDAR or Photogrammetry? Integration is the answer. Ital. J. Remote Sens. 2011, 43, 107–121. [Google Scholar] [CrossRef] [Green Version]
- Noszczyk, T.; Gawronek, P. Remote Sensing and GIS for Environmental Analysis and Cultural Heritage. Remote Sens. 2020, 12, 3960. [Google Scholar] [CrossRef]
- Sustainable Development Goals of the 2030 Agenda. Available online: https://sdgs.un.org/goals. (accessed on 1 December 2021).
- Rapporto Sulla Promozione Della sicurezza dai Rischi Naturali del Patrimonio Abitativo, Presidenza del Consiglio dei Ministri, Giugno 2017. Available online: https://www.casaitalia.governo.it/generali/approfondimenti/rapporto-sulla-promozione-della-sicurezza/ (accessed on 1 December 2021).
- Dipartimento Casa Italia. Available online: https://www.casaitalia.governo.it/generali/ (accessed on 1 December 2021).
- Mappa dei Rischi dei Comuni Italiani. Available online: https://www.istat.it/it/mappa-rischi (accessed on 1 December 2021).
- Norme Tecniche per le Costruzioni (NTC2018); Ministero delle Infrastrutture e dei Trasporti: Roma, Italy, 2018.
- Baggio, C.; Bernardini, A.; Colozza, R.; Corazza, L.; Della Bella, M.; Di Pasquale, G.; Dolce, M.; Goretti, A.; Martinelli, A.; Orsini, G.; et al. Field Manual for Post-Earthquake Damage and Safety Assessment and Short Term Countermeasures (AeDES); European Commission—Joint Research Centre—Institute for the Protection and Security of the Citizen: Bruxelles, Belgium, 2007; p. 22868. [Google Scholar]
- Kassem, M.M.; Mohamed Nazri, F.; Noroozinejad Farsangi, E. The seismic vulnerability assessment methodologies: A state-of-the-art review. Ain Shams Eng. J. 2020, 11, 849–864. [Google Scholar] [CrossRef]
- Malinverni, E.; Chiappini, S.; Pierdicca, R. A geodatabase for multisource data management applied to cultural heritage: The case study of Villa Buonaccorsi’s historical garden. Int. Arch. Photogramm. Remote Sens. Spat. Inf. Sci. 2019, 42, 771–776. [Google Scholar] [CrossRef] [Green Version]
- Rossi, L.; Ajmar, A.; Paolanti, M.; Pierdicca, R. Vehicle trajectory prediction and generation using LSTM models and GANs. PLoS ONE 2021, 16, e0253868. [Google Scholar]
- Malinverni, E.S.; Pierdicca, R.; Colosi, F.; Orazi, R. Dissemination in archaeology: A GIS-based StoryMap for Chan Chan. J. Cult. Herit. Manag. Sustain. Dev. 2019, 9, 500–519. [Google Scholar] [CrossRef]
- Li, X.; Lv, Z.; Hu, J.; Zhang, B.; Yin, L.; Zhong, C.; Wang, W.; Feng, S. Traffic Management and Forecasting System Based on 3D GIS. In Proceedings of the 2015 15th IEEE/ACM International Symposium on Cluster, Cloud and Grid Computing, Shenzhen, China, 4–7 May 2015; pp. 991–998. [Google Scholar] [CrossRef]
- Piccinini, F.; Pierdicca, R.; Malinverni, E.S. A Relational Conceptual Model in GIS for the Management of Photovoltaic Systems. Energies 2020, 13, 2860. [Google Scholar] [CrossRef]
- Chiappini, S.; Fini, A.; Malinverni, E.; Frontoni, E.; Racioppi, G.; Pierdicca, R. Cost Effective Spherical Photogrammetry: A Novel Framework for the Smart Management of Complex Urban Environments. Int. Arch. Photogramm. Remote Sens. Spat. Inf. Sci. 2020, 43, 441–448. [Google Scholar] [CrossRef]
- Sánchez-Aparicio, L.J.; Masciotta, M.G.; García-Alvarez, J.; Ramos, L.F.; Oliveira, D.V.; Martín-Jiménez, J.A.; González-Aguilera, D.; Monteiro, P. Web-GIS approach to preventive conservation of heritage buildings. Autom. Constr. 2020, 118, 103304. [Google Scholar] [CrossRef]
- Ferreira, T.M.; Vicente, R.; Raimundo Mendes da Silva, J.A.; Varum, H.; Costa, A.; Maio, R. Urban fire risk: Evaluation and emergency planning. J. Cult. Herit. 2016, 20, 739–745. [Google Scholar] [CrossRef] [Green Version]
- Ortiz, P.; Antunez, V.; Martín, J.M.; Ortiz, R.; Vázquez, M.A.; Galán, E. Approach to environmental risk analysis for the main monuments in a historical city. J. Cult. Herit. 2014, 15, 432–440. [Google Scholar] [CrossRef]
- Ortiz, R.; Ortiz, P.; Vázquez, M.; Martín, J. Integration of georeferenced informed system and digital image analysis to asses the effect of cars pollution on historical buildings. Constr. Build. Mater. 2017, 139, 320–333. [Google Scholar] [CrossRef]
- Saha, A.; Pal, S.C.; Santosh, M.; Janizadeh, S.; Chowdhuri, I.; Norouzi, A.; Roy, P.; Chakrabortty, R. Modelling multi-hazard threats to cultural heritage sites and environmental sustainability: The present and future scenarios. J. Clean. Prod. 2021, 320, 128713. [Google Scholar] [CrossRef]
- Gonzalez, A.; Basaglia, A.; Spacone, E.; Brando, G. A Qgis Plugin for the Seismic Vulnerability Assessment of Urban Centers: Application to the City of Popoli in Abruzzo (Italy); SAHC: Barcelona, Spain, 2021. [Google Scholar]
- Sauti, N.S.; Daud, M.E.; Kaamin, M.; Sahat, S. GIS spatial modelling for seismic risk assessment based on exposure, resilience, and capacity indicators to seismic hazard: A case study of Pahang, Malaysia. Geomat. Nat. Hazards Risk 2021, 12, 1948–1972. [Google Scholar] [CrossRef]
- Rezaie, F.; Panahi, M. GIS modeling of seismic vulnerability of residential fabrics considering geotechnical, structural, social and physical distance indicators in Tehran using multi-criteria decision-making techniques. Nat. Hazards Earth Syst. Sci. 2015, 15, 461–474. [Google Scholar] [CrossRef] [Green Version]
- Karimzadeh, S.; Miyajima, M.; Hassanzadeh, R.; Amiraslanzadeh, R.; Kamel, B. A GIS-based seismic hazard, building vulnerability and human loss assessment for the earthquake scenario in Tabriz. Soil Dyn. Earthq. Eng. 2014, 66, 263–280. [Google Scholar] [CrossRef]
- Vettore, M.; Donà, M.; Carpanese, P.; Follador, V.; da Porto, F.; Valluzzi, M.R. A Multilevel Procedure at Urban Scale to Assess the Vulnerability and the Exposure of Residential Masonry Buildings: The Case Study of Pordenone, Northeast Italy. Heritage 2020, 3, 1433–1468. [Google Scholar] [CrossRef]
- F. Salazar, L.G.; Ferreira, T.M. Seismic Vulnerability Assessment of Historic Constructions in the Downtown of Mexico City. Sustainability 2020, 12, 1276. [Google Scholar] [CrossRef] [Green Version]
- Francini, M.; Artese, S.; Gaudio, S.; Palermo, A.; Viapiana, M.F. To support urban emergency planning: A GIS instrument for the choice of optimal routes based on seismic hazards. Int. J. Disaster Risk Reduct. 2018, 31, 121–134. [Google Scholar] [CrossRef]
- Romis, F.; Caprili, S.; Salvatore, W.; Ferreira, T.M.; Lourenço, P.B. An Improved Seismic Vulnerability Assessment Approach for Historical Urban Centres: The Case Study of Campi Alto di Norcia, Italy. Appl. Sci. 2021, 11, 849. [Google Scholar] [CrossRef]
- Ortega, J.; Vasconcelos, G.; Rodrigues, H.; Correia, M. A vulnerability index formulation for the seismic vulnerability assessment of vernacular architecture. Eng. Struct. 2019, 197, 109381. [Google Scholar] [CrossRef]
- Vicente, R.; Ferreira, T.; Maio, R.; Varum, H.; Costa, A.A.; Costa, A.; Oliveira, C.S.; Estêvão, J.M.C. Seismic vulnerability assessment of existing masonry buildings: Case study of the old city centre of Faro, Portugal. In Proceedings of the 2nd European Conference on Earthquake Engineering and Seismology, Istanbul, Turkey, 25–29 August 2014; pp. 1–9. [Google Scholar]
- Indirli, M.; Bruni, S.; Candigliota, E.; Geremei, F.; Immordino, F.; Moretti, L.; Abate, D.; Furini, G.; Pierattini, S.; Screpanti, A.; et al. Assessment of historic centres through a multidisciplinary approach based on the simultaneous application of Remote Sensing, GIS and quick procedures for survey and vulnerability evaluation: The Arsita case. In Proceedings of the 5th International Congress “Science and Technology for the Safeguard of Cultural Heritage in the Mediterranean Basin”, Istanbul, Turkey, 22–25 November 2011. [Google Scholar]
- Indirli, M.; Marghella, G.; Marzo, A.; Moretti, L.; Formisano, A. The proposal of a pre/post-earthquake “holistic & digital” quick survey tool for smart geo-referenced digital building inventories. In Proceedings of the SE-50 EEE (Skopje Earthquake 50 Years of European Earthquake Engineering) Conference, Skopje, Macedonia, 29–31 May 2013. [Google Scholar]
- Di Pasquale, G.; Goretti, A. Functional and economic vulnerability of residential buildings affected by recent Italian earthquakes. In Proceedings of the X National Conference of Seismic Engineering in Italy, Potenza-Matera, Potenza, Italy, 9–13 September 2001; Volume 913. [Google Scholar]
- Ramos, L.; Masciotta, M.; Morais, M.J.; Azenha, M.; Cunha Ferreira, T.; Pereira, E.; Lourenco, P. HeritageCARE: Preventive Conservation of Built Cultural Heritage in the South-West Europe. 2018. Available online: https://www.taylorfrancis.com/chapters/edit/10.1201/9781351014793-16/heritagecare-preventive-conservation-built-cultural-heritage-south-west-europe-ramos-masciotta-morais-azenha-ferreira-pereira-louren%C3%A7o (accessed on 25 April 2022). [CrossRef]
- GeoMax Zenith35 PRO BRO 849551 0916 en LR. Available online: https://geomax-positioning.com/-/media/files/geomax/downloads/products/gnss/zenith35/geomax%20zenith35%20pro%20bro%20849551%200916%20en%20lr.ashx?la=en&hash=12876B33E88473A55C6298DC60C7FFCC (accessed on 6 November 2020).
- Datasheet SRSF6 Skyrobotic. Available online: http://www.skyrobotic.com/wp-content/uploads/2015/09/Datasheet-SRSF6_Skyrobotic.pdf (accessed on 6 November 2020).
- DSC-QX100 Specifications. Available online: https://www.sony.co.uk/electronics/support/compact-cameras-dsc-qx-series/dsc-qx100/specifications (accessed on 6 November 2020).
- Gonzalez-Aguilera, D.; López-Fernández, L.; Rodriguez-Gonzalvez, P.; Hernandez-Lopez, D.; Guerrero, D.; Remondino, F.; Menna, F.; Nocerino, E.; Toschi, I.; Ballabeni, A.; et al. GRAPHOS–open-source software for photogrammetric applications. Photogramm. Rec. 2018, 33, 11–29. [Google Scholar] [CrossRef] [Green Version]
- Fraser, C. Multiple focal setting self-calibration of close-range metric cameras. Photogramm. Eng. Remote Sens. 1980, 46, 1161–1171. [Google Scholar]
- Hirschmuller, H. Stereo Processing by Semiglobal Matching and Mutual Information. IEEE Trans. Pattern Anal. Mach. Intell. 2008, 30, 328–341. [Google Scholar] [CrossRef] [PubMed]
- Besl, P.J.; McKay, N.D. Method for registration of 3-D shapes. Sensor Fusion IV: Control Paradigms and Data Structures; Schenker, P.S., Ed.; International Society for Optics and Photonics, SPIE: Bellingham, WA, USA, 1992; Volume 1611, pp. 586–606. [Google Scholar] [CrossRef]
- FSP Viewer. Available online: http://www.fsoft.it/FSPViewer/ (accessed on 26 December 2021).
- QField—Efficient Field Work Built for QGIS. Available online: https://qfield.org/ (accessed on 28 December 2021).
- Maly, E.; Suppasri, A. The Sendai framework for disaster risk reduction at five: Lessons from the 2011 great East Japan earthquake and tsunami. Int. J. Disaster Risk Sci. 2020, 11, 167–178. [Google Scholar] [CrossRef] [Green Version]
- Schnabel, R.; Wahl, R.; Klein, R. Efficient RANSAC for Point-Cloud Shape Detection. Comput. Graph. Forum 2007, 26, 214–226. [Google Scholar] [CrossRef]
Publisher’s Note: MDPI stays neutral with regard to jurisdictional claims in published maps and institutional affiliations. |
© 2022 by the authors. Licensee MDPI, Basel, Switzerland. This article is an open access article distributed under the terms and conditions of the Creative Commons Attribution (CC BY) license (https://creativecommons.org/licenses/by/4.0/).