
Structural Differences of PM2.5 Spatial Correlation Networks in Ten Metropolitan Areas of China


Abstract
:1. Introduction
2. Materials and Methods
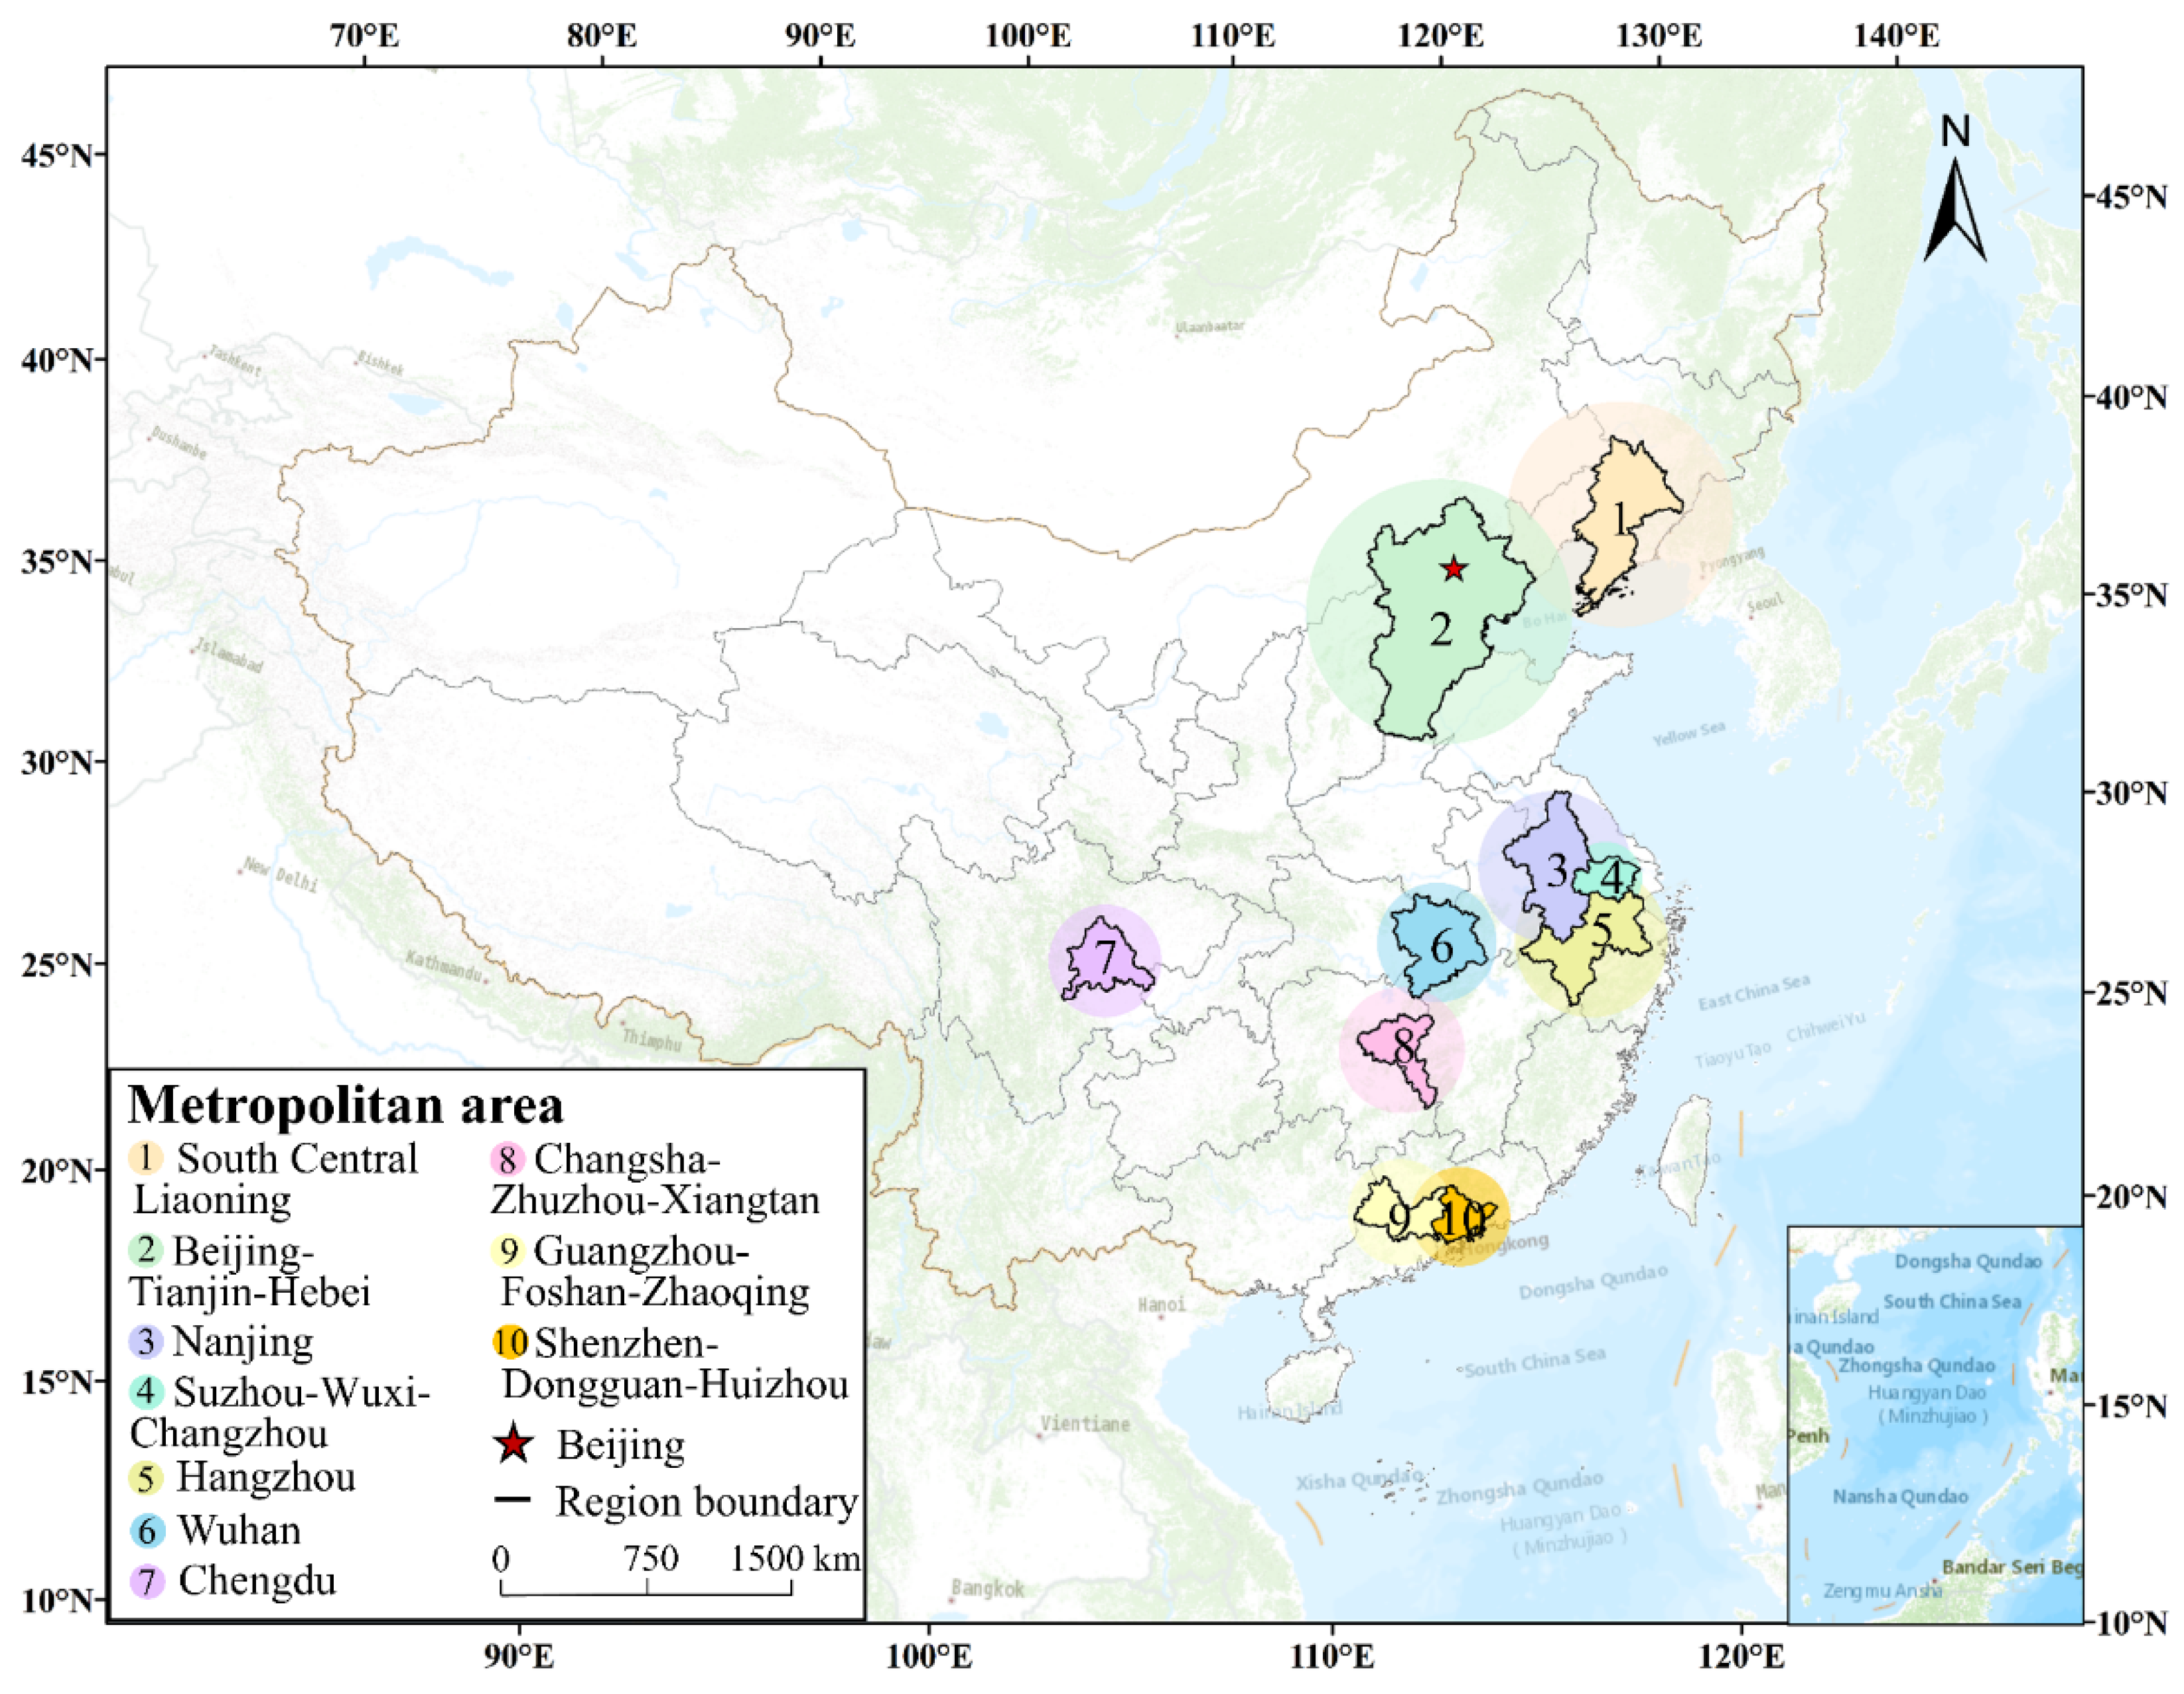
2.1. Study Area
2.2. Data Sources
2.3. Methods
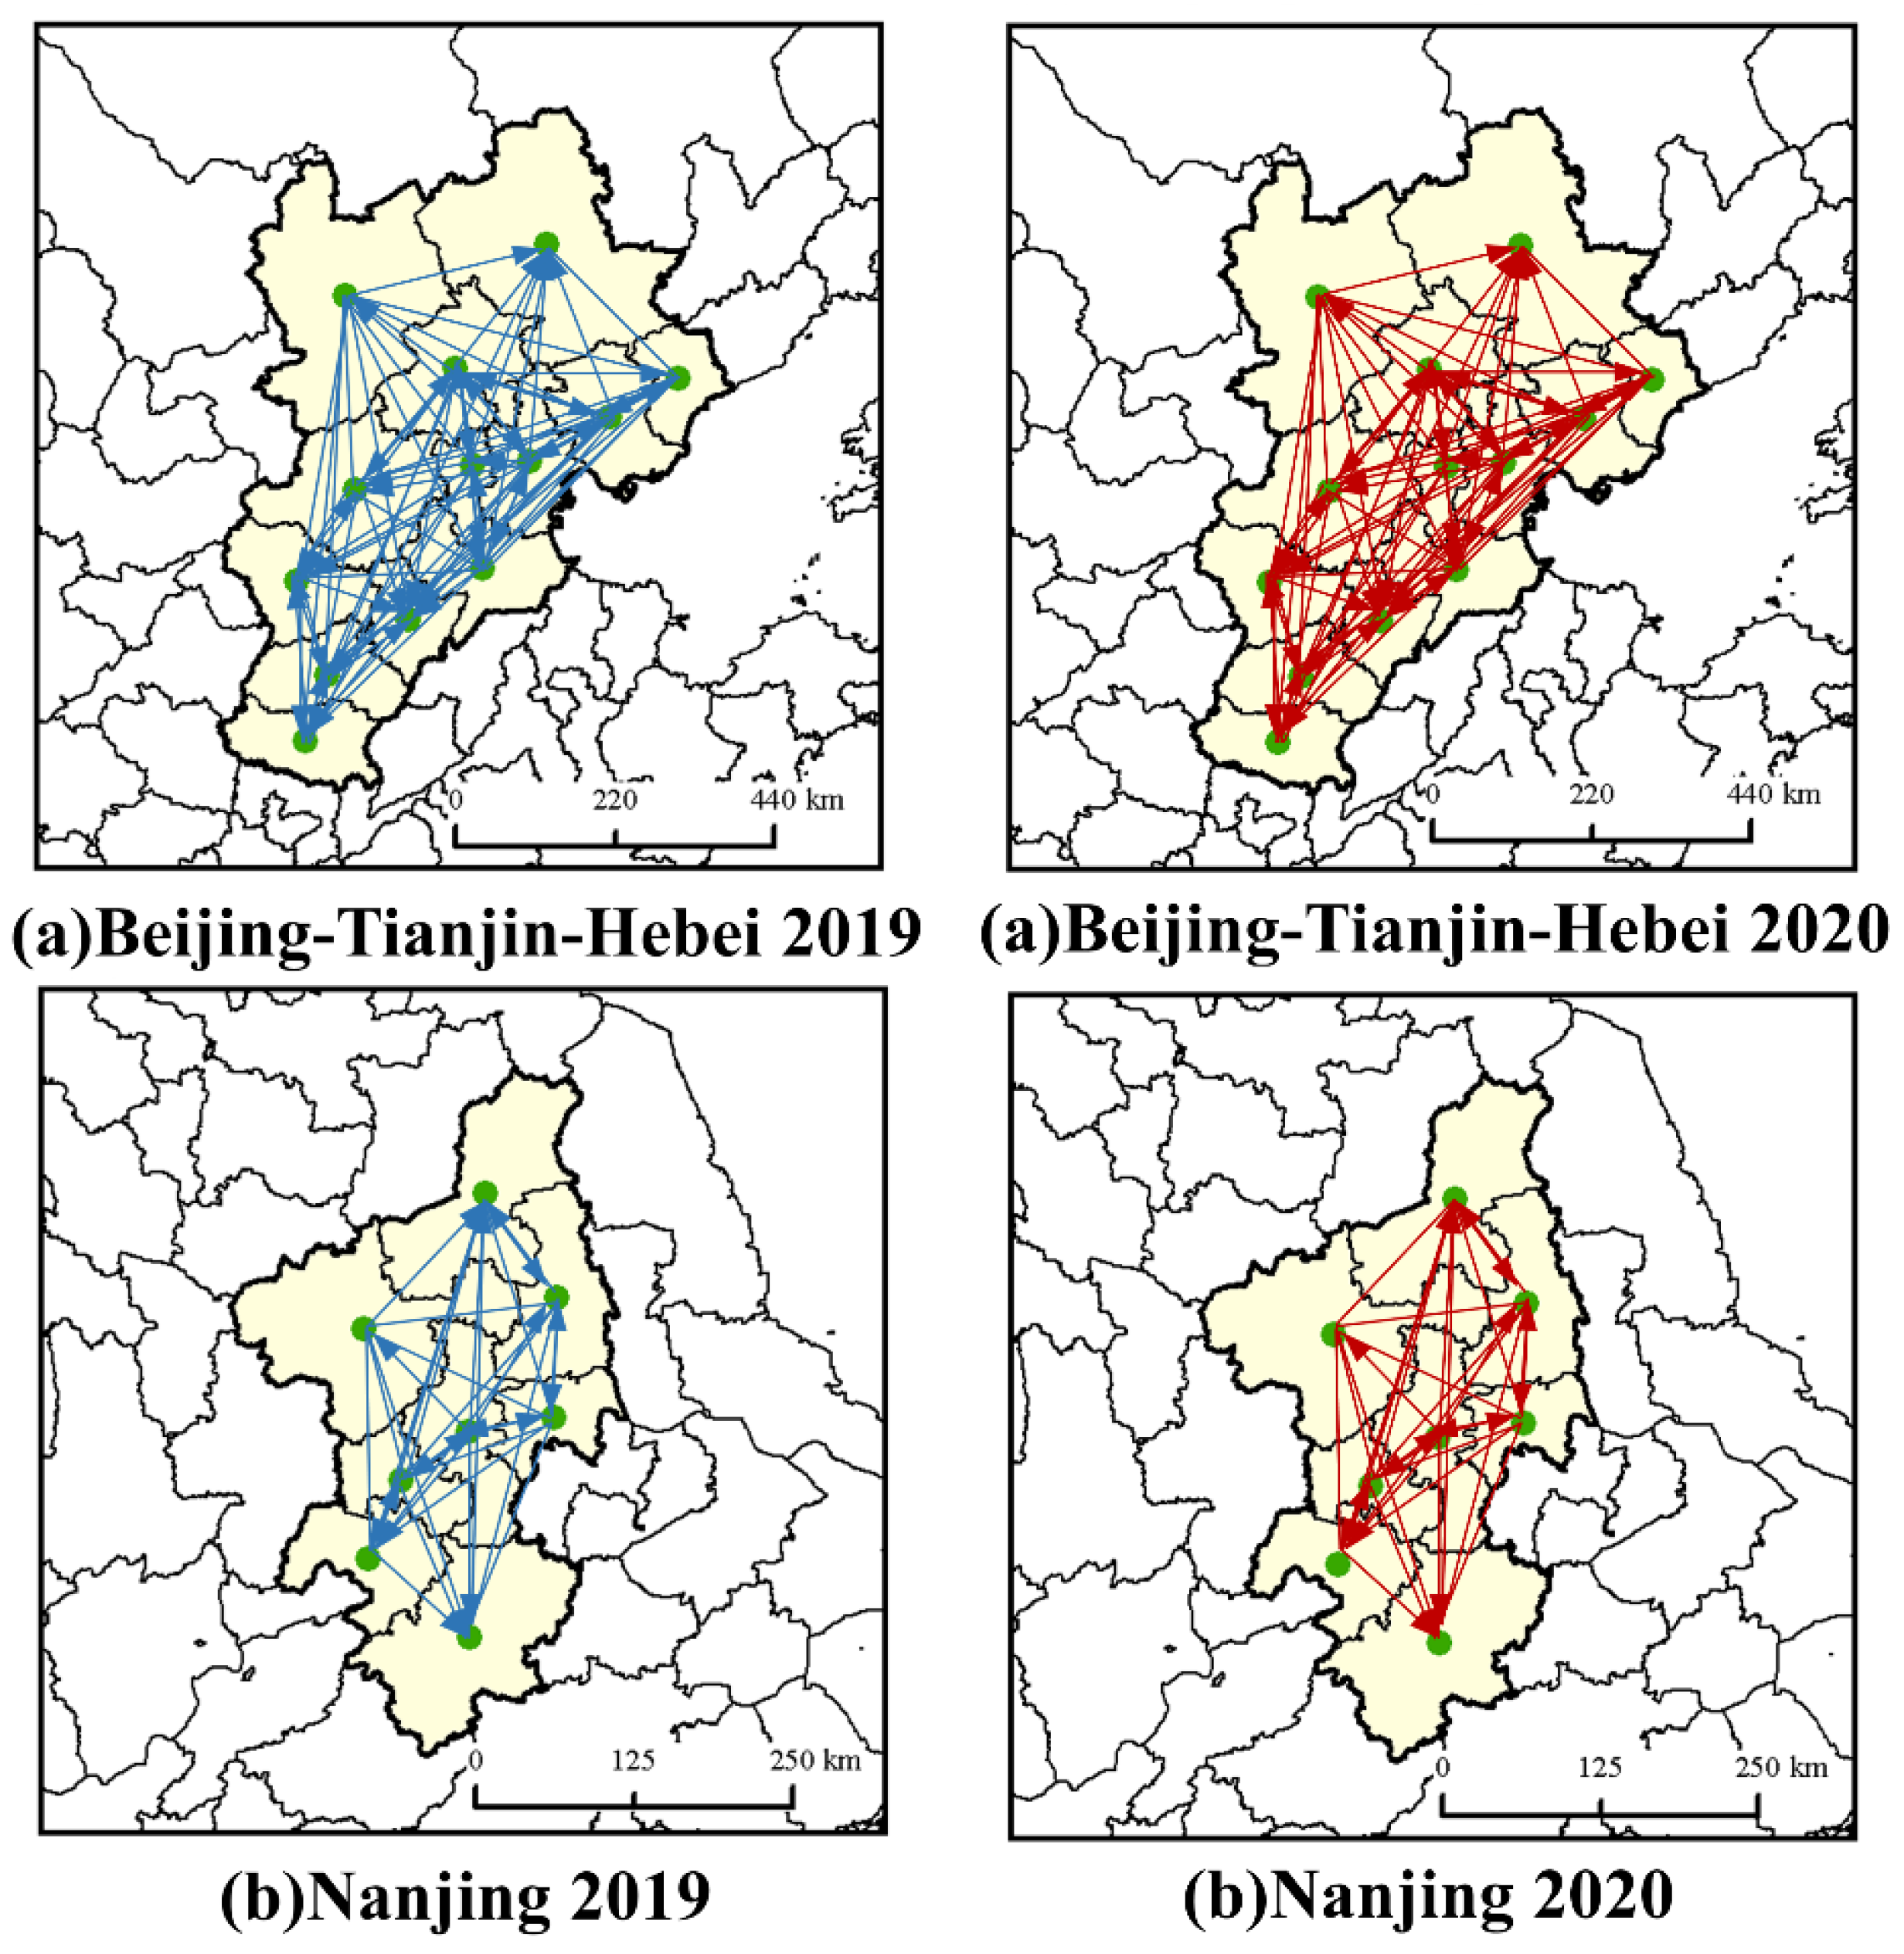
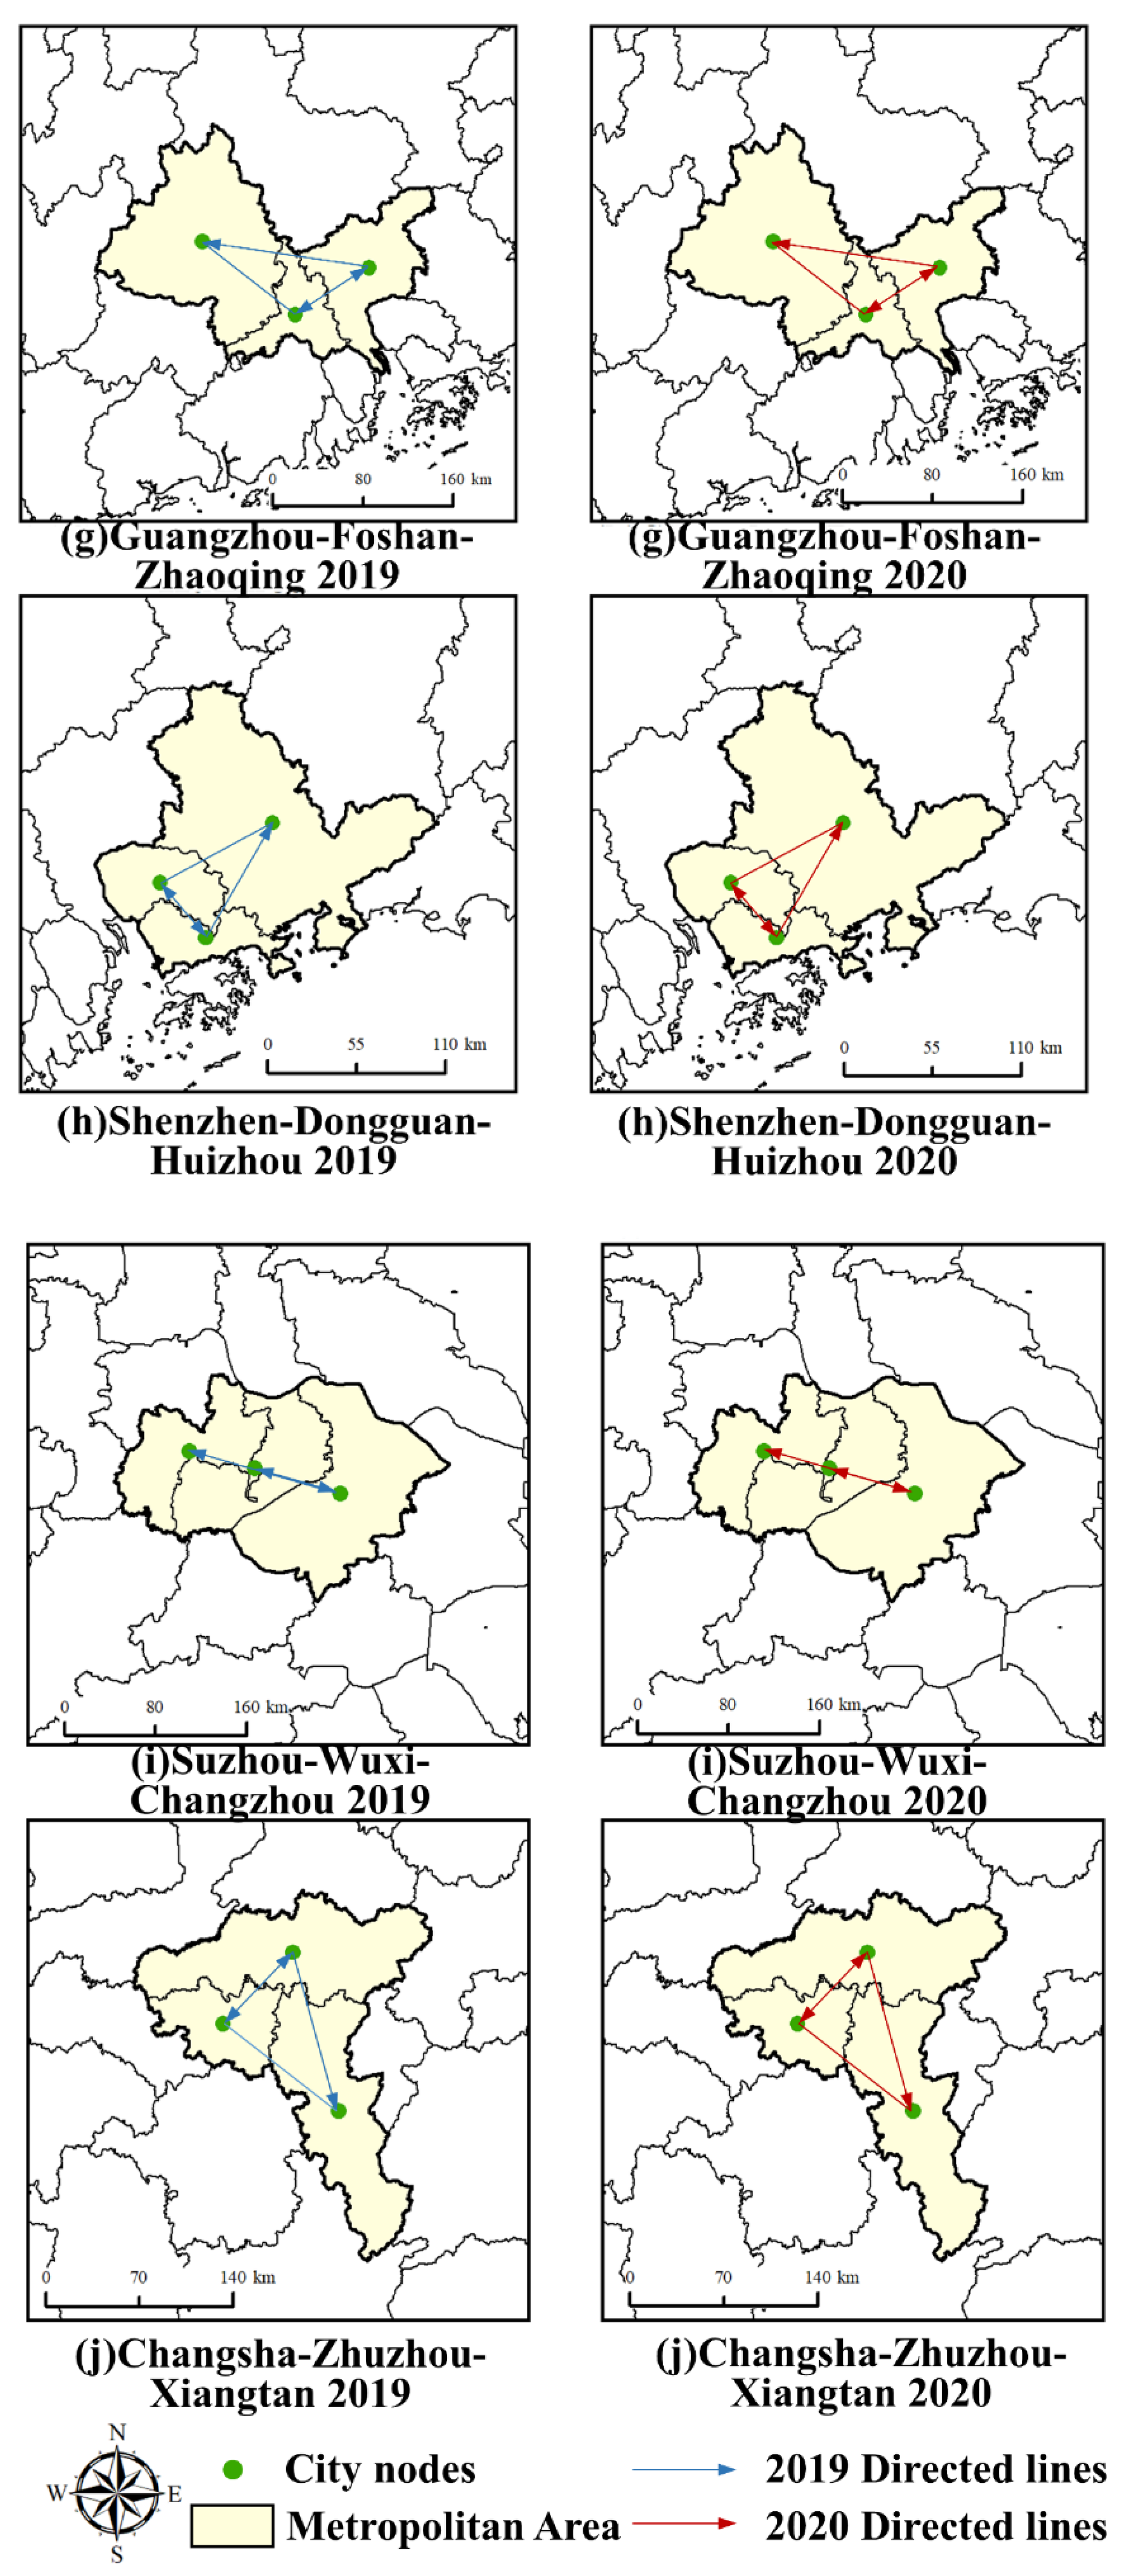
2.3.1. Construction of the Spatial Correlation Network
2.3.2. Analysis of Overall Network Characteristics
2.3.3. Analysis of the Network Node Characteristics
2.3.4. Analysis of Influencing Factors
3. Results
3.1. Overall Network Characteristics
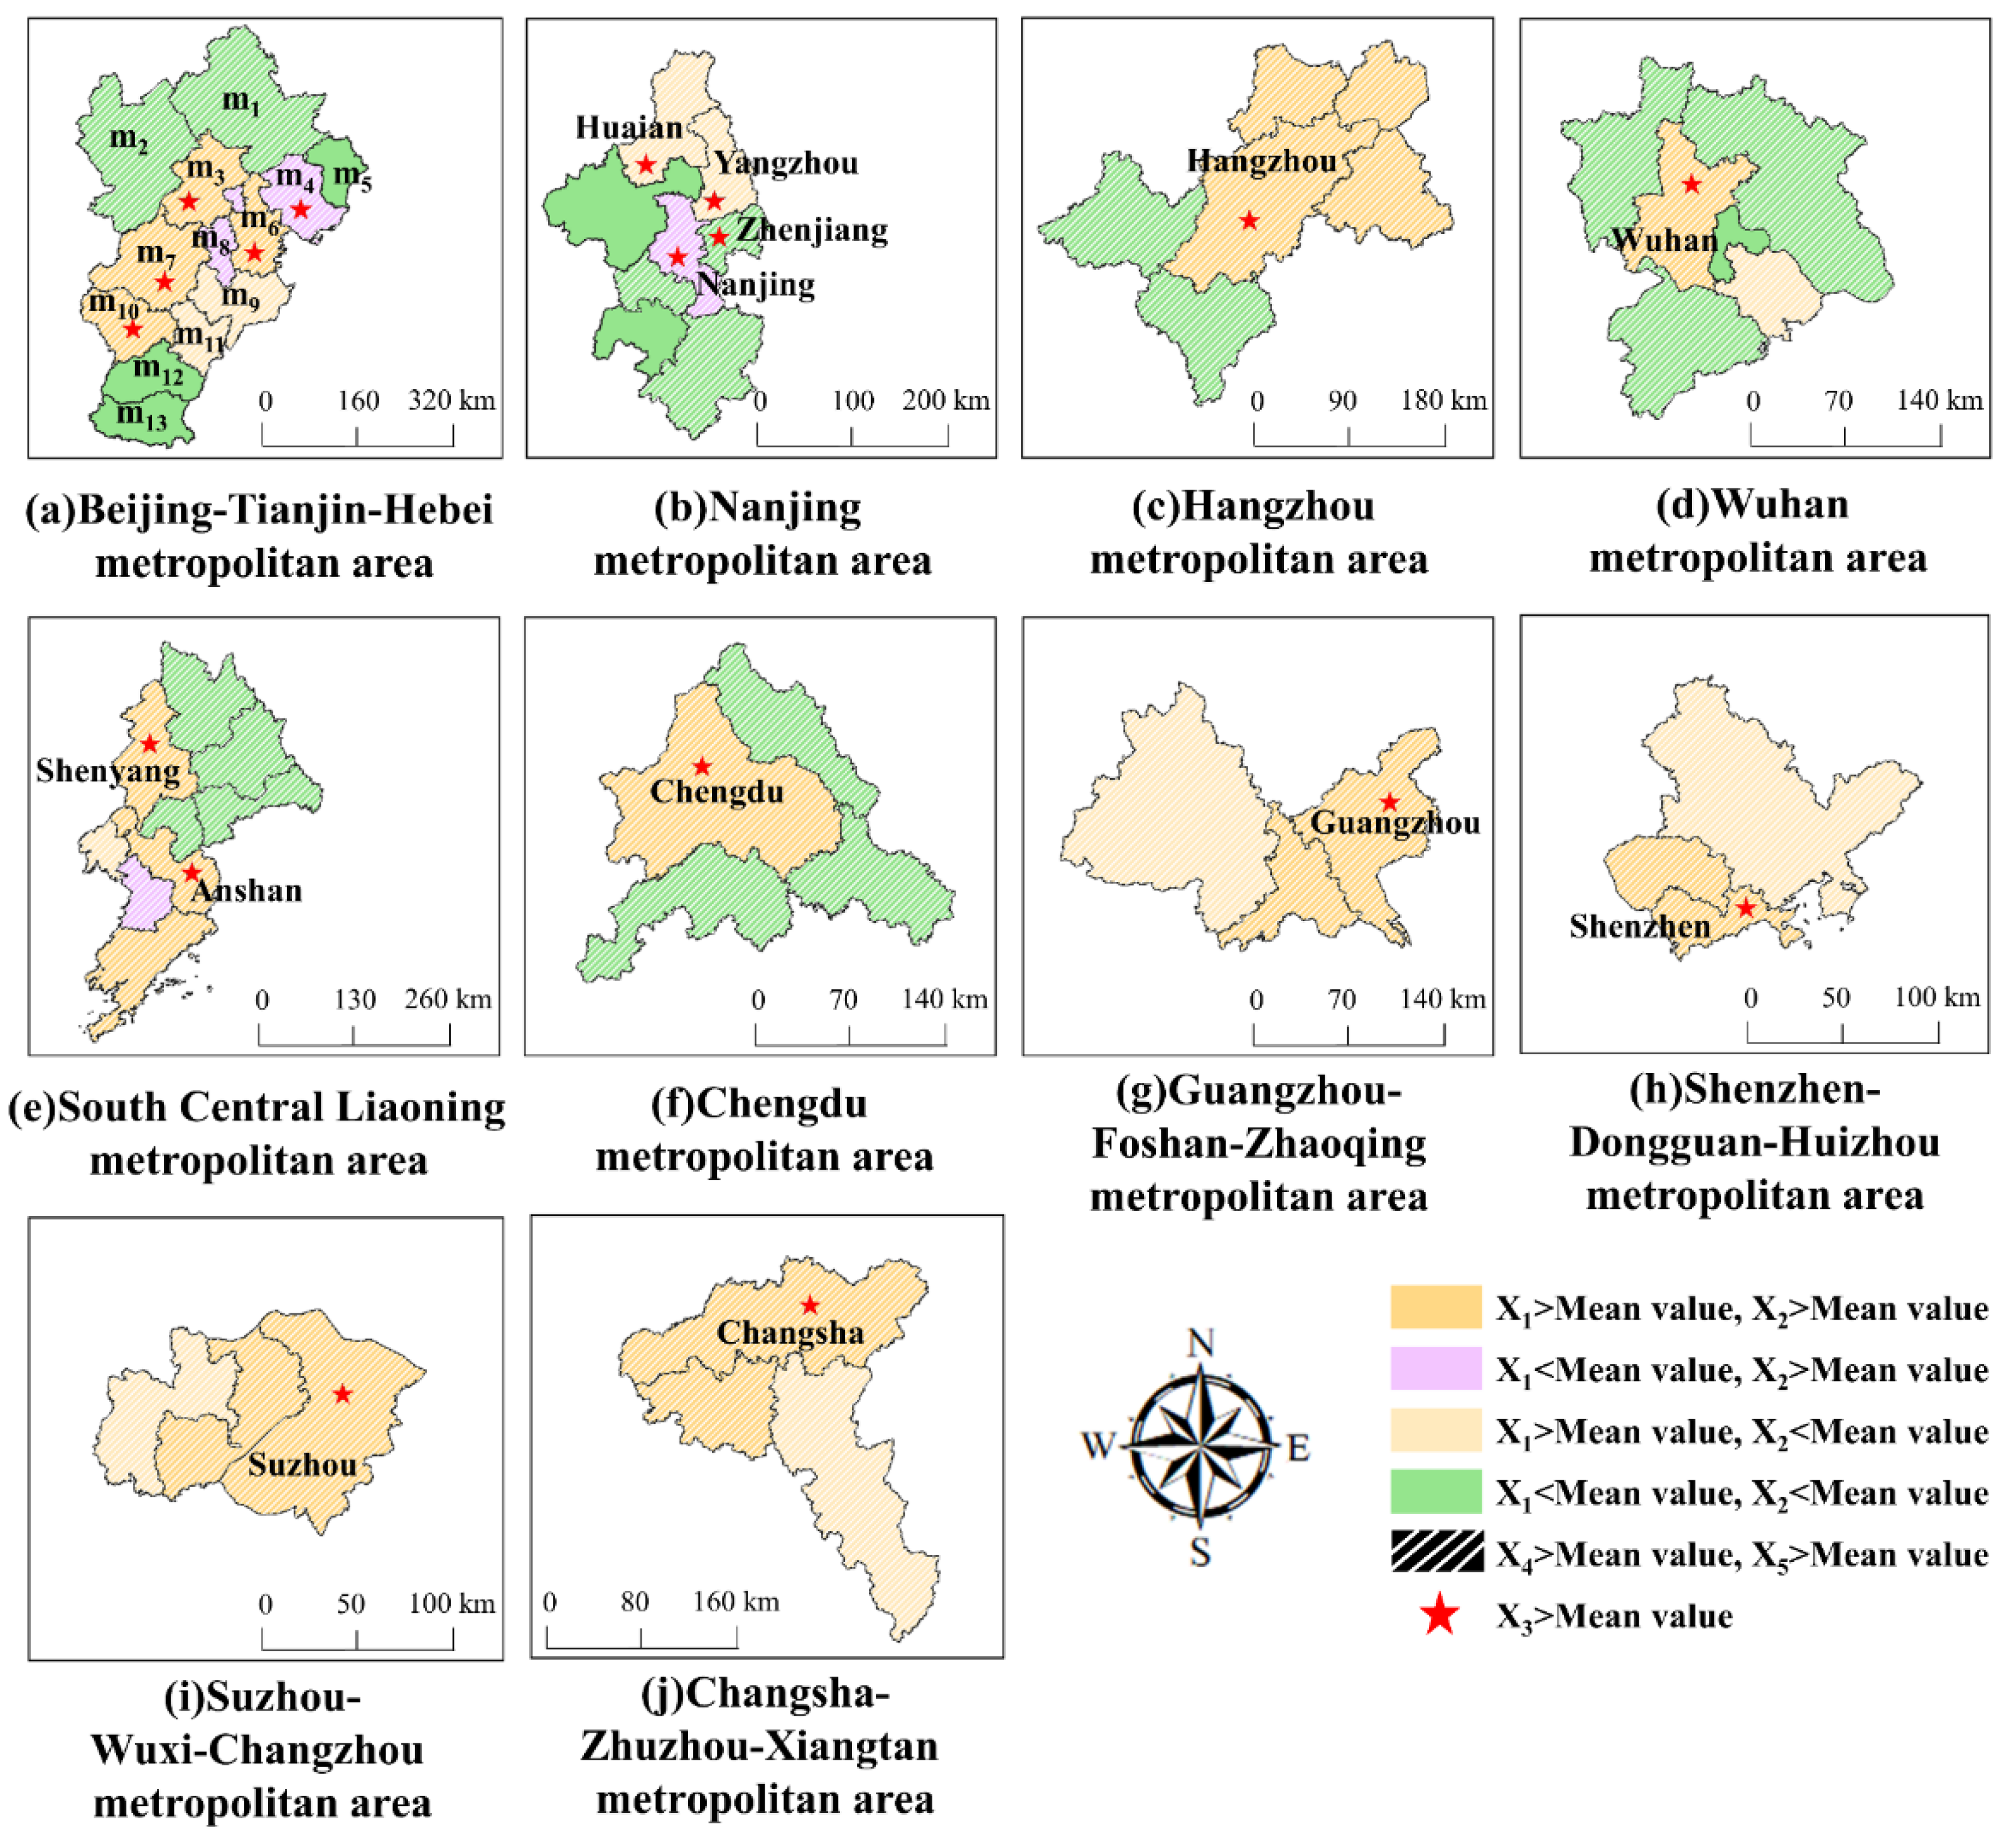
3.2. Centrality Analysis
3.3. Analysis of Influencing Factors of Spatial Correlation
4. Discussion
5. Conclusions
Author Contributions
Funding
Institutional Review Board Statement
Informed Consent Statement
Data Availability Statement
Acknowledgments
Conflicts of Interest
References
- Kumari, M.; Somvanshi, S.S.; Zubair, S. Estimation of Air Pollution Using Regression Modelling Approach for Mumbai Region, Maharashtra, India. In Remote Sensing and GIScience: Challenges and Future Directions; Kumar, P., Sajjad, H., Chaudhary, B.S., Rawat, J.S., Rani, M., Eds.; Springer International Publishing: Cham, Switzerland, 2021; pp. 229–247. [Google Scholar] [CrossRef]
- ul-Haq, Z.; Rana, A.D.; Tariq, S.; Mahmood, K.; Ali, M.; Bashir, I. Modeling of tropospheric NO2 column over different climatic zones and land use/land cover types in South Asia. J. Atmos. Sol.-Terr. Phys. 2018, 168, 80–99. [Google Scholar] [CrossRef]
- Islam, K.M.A.; Adnan, M.S.G.; Zannat, K.E.; Dewan, A. Spatiotemporal dynamics of NO2 concentration with linear mixed models: A Bangladesh case study. Phys. Chem. Earth 2022, 103119. [Google Scholar] [CrossRef]
- Lamsal, L.N.; Martin, R.V.; Parrish, D.D.; Krotkov, N.A. Scaling relationship for NO2 pollution and urban population size: A satellite perspective. Environ. Sci. Technol. 2013, 47, 7855–7861. [Google Scholar] [CrossRef] [PubMed]
- Omrani, H.; Omrani, B.; Parmentier, B.; Helbich, M. Spatio-temporal data on the air pollutant nitrogen dioxide derived from Sentinel satellite for France. Data Brief 2020, 28, 105089. [Google Scholar] [CrossRef]
- Gao, L.N.; Tao, F.; Ma, P.L.; Wang, C.Y.; Kong, W.; Chen, W.K.; Zhou, T. A short-distance healthy route planning approach. J. Transp. Health 2022, 24, 101314. [Google Scholar] [CrossRef]
- Yu, X.; Wong, M.S.; Kwan, M.P.; Nichol, J.E.; Zhu, R.; Heo, J.; Chan, P.W.; Chin, D.C.W.; Kwok, C.Y.T.; Kan, Z. COVID-19 infection and mortality: Association with PM2.5 concentration and population density-an exploratory study. ISPRS Int. J. Geo-Inf. 2021, 10, 123. [Google Scholar] [CrossRef]
- Huang, X.; Tang, G.; Zhang, J.; Liu, B.; Liu, C.; Zhang, J.; Cong, L.; Cheng, M.; Yan, G.; Gao, W.; et al. Characteristics of PM2.5 pollution in Beijing after the improvement of air quality. J. Environ. Sci. 2021, 100, 1–10. [Google Scholar] [CrossRef]
- Harper, A.; Baker, P.N.; Xia, Y.; Kuang, T.; Zhang, H.; Chen, Y.; Han, T.L.; Gulliver, J. Development of spatiotemporal land use regression models for PM2.5 and NO2 in Chongqing, China, and exposure assessment for the CLIMB study. Atmos. Pollut. Res. 2021, 12, 101096. [Google Scholar] [CrossRef]
- Wu, H.; Zhang, Y.-F.; Han, S.-Q.; Wu, J.; Bi, X.-H.; Shi, G.-L.; Wang, J.; Yao, Q.; Cai, Z.-Y.; Liu, J.-L.; et al. Vertical characteristics of PM2.5 during the heating season in Tianjin, China. Sci. Total Environ. 2015, 523, 152–160. [Google Scholar] [CrossRef]
- Gu, J.; Bai, Z.; Li, W.; Wu, L.; Liu, A.; Dong, H.; Xie, Y. Chemical composition of PM2.5 during winter in Tianjin, China. Particuology 2011, 9, 215–221. [Google Scholar] [CrossRef]
- Wang, H.; Tian, M.; Chen, Y.; Shi, G.; Liu, Y.; Yang, F.; Zhang, L.; Deng, L.; Yu, J.; Peng, C.; et al. Seasonal characteristics, formation mechanisms and source origins of PM2.5 in two megacities in Sichuan Basin, China. Atmos. Chem. Phys. 2018, 18, 865–881. [Google Scholar] [CrossRef] [Green Version]
- Zhou, L.; Zhou, C.; Yang, F.; Che, L.; Wang, B.; Sun, D. Spatio-temporal evolution and the influencing factors of PM2.5 in China between 2000 and 2015. J. Geogr. Sci. 2019, 29, 253–270. [Google Scholar] [CrossRef] [Green Version]
- Wang, Y.; Wang, M.; Huang, B.; Li, S.; Lin, Y. Estimation and analysis of the nighttime PM2.5 concentration based on lj1-01 images: A case study in the pearl river delta urban agglomeration of china. Remote Sens. 2021, 13, 3405. [Google Scholar] [CrossRef]
- Chen, M.; Guo, S.; Hu, M.; Zhang, X. The spatiotemporal evolution of population exposure to PM2.5 within the Beijing-Tianjin-Hebei urban agglomeration, China. J. Clean. Prod. 2020, 265, 121708. [Google Scholar] [CrossRef]
- Yan, J.W.; Tao, F.; Zhang, S.Q.; Lin, S.; Zhou, T. Spatiotemporal distribution characteristics and driving forces of PM2.5 in three urban agglomerations of the yangtze river economic belt. Int. J. Environ. Res. Public Health 2021, 18, 2222. [Google Scholar] [CrossRef]
- Zhao, L.; Zhang, X.; Zhao, F. The impact of high-speed rail on air quality in counties: Econometric study with data from southern Beijing-Tianjin-Hebei, China. J. Clean. Prod. 2021, 278, 123604. [Google Scholar] [CrossRef]
- Zhu, W.; Wang, M.; Zhang, B. The effects of urbanization on PM2.5 concentrations in China’s Yangtze River Economic Belt: New evidence from spatial econometric analysis. J. Clean. Prod. 2019, 239, 118065. [Google Scholar] [CrossRef]
- Kübler, D. Introduction: Metropolitanisation and metropolitan governance. Eur. Politi. Sci. 2012, 11, 402–408. [Google Scholar] [CrossRef]
- Habibi, R.; Alesheikh, A.A.; Mohammadinia, A.; Sharif, M. An assessment of spatial pattern characterization of air pollution: A case study of CO and PM2.5 in Tehran, Iran. ISPRS Int. J. Geo-Inf. 2017, 6, 270. [Google Scholar] [CrossRef] [Green Version]
- Park, S.H.; Ko, D.W. Investigating the effects of the built environment on PM2.5 and PM10: A case study of Seoul Metropolitan city, South Korea. Sustainability 2018, 10, 4552. [Google Scholar] [CrossRef] [Green Version]
- Shisong, C.; Wenji, Z.; Hongliang, G.; Deyong, H.; You, M.; Wenhui, Z.; Shanshan, L. Comparison of remotely sensed PM2.5 concentrations between developed and developing countries: Results from the US, Europe, China, and India. J. Clean. Prod. 2018, 182, 672–681. [Google Scholar] [CrossRef]
- Wong, P.Y.; Lee, H.Y.; Zeng, Y.T.; Chern, Y.R.; Chen, N.T.; Candice Lung, S.C.; Su, H.J.; Wu, C. Da Using a land use regression model with machine learning to estimate ground level PM2.5. Environ. Pollut. 2021, 277, 116846. [Google Scholar] [CrossRef] [PubMed]
- Chen, X.; Li, F.; Zhang, J.; Zhou, W.; Wang, X.; Fu, H. Spatiotemporal mapping and multiple driving forces identifying of PM2.5 variation and its joint management strategies across China. J. Clean. Prod. 2020, 250, 119534. [Google Scholar] [CrossRef]
- Tiwari, A.; Aljoufie, M. Modeling spatial distribution and determinant of PM2.5 at micro-level using geographically weighted regression (GWR) to inform sustainable mobility policies in campus based on evidence from King Abdulaziz university, Jeddah, Saudi Arabia. Sustainability 2021, 13, 12043. [Google Scholar] [CrossRef]
- Yu, M.Y.; Xu, Y.; Li, J.Q.; Lu, X.C.; Xing, H.Q.; Ma, M.L. Geographic detector-based spatiotemporal variation and influence factors analysis of PM2.5 in shandong, china. Pol. J. Environ. Stud. 2021, 30, 463–475. [Google Scholar] [CrossRef]
- Su, Y.; Yu, Y.Q. Spatial association effect of regional pollution control. J. Clean. Prod. 2019, 213, 540–552. [Google Scholar] [CrossRef]
- Zhang, A.; Qi, Q.; Jiang, L.; Zhou, F.; Wang, J. Population Exposure to PM2.5 in the Urban Area of Beijing. PLoS ONE 2013, 8, e63486. [Google Scholar] [CrossRef] [Green Version]
- Woodruff, T.J.; Parker, J.D.; Schoendorf, K.C. Fine particulate matter (PM2.5) air pollution and selected causes of postneonatal infant mortality in California. Environ. Health Perspect. 2006, 114, 786–790. [Google Scholar] [CrossRef] [Green Version]
- Han, L.; Zhou, W.; Li, W.; Li, L. Impact of urbanization level on urban air quality: A case of fine particles (PM2.5) in Chinese cities. Environ. Pollut. 2014, 194, 163–170. [Google Scholar] [CrossRef]
- Ng, S.K.W. (Chief Research Officer of Civic Exchange, Hongkong, China); Fung, J.C.H. (Head and Professor in Division of Environment and Department of Mathematics at the Hong Kong University of Science and Technology, Hongkong, China); Lau, N.T. (PhD in Chemical Engineering, now with the Division of Environment, the Hong Kong University of Science and Technology, Hongkong, China); Lau, A.K.H. (Professor of the Division of Environment and the Department of Civil and Environmental Engineering, Director of the Atmospheric Research Center, and Director of the Environmental Central Facility) Unpublished Work, 2015.
- Tong, Z.; Whitlow, T.H.; Macrae, P.F.; Landers, A.J.; Harada, Y. Quantifying the effect of vegetation on near-road air quality using brief campaigns. Environ. Pollut. 2015, 201, 141–149. [Google Scholar] [CrossRef]
- Witkowska, A.; Lewandowska, A.U.; Saniewska, D.; Falkowska, L.M. Effect of agriculture and vegetation on carbonaceous aerosol concentrations (PM2.5 and PM10) in Puszcza Borecka National Nature Reserve (Poland). Air Qual. Atmos. Heath 2016, 9, 761–773. [Google Scholar] [CrossRef] [PubMed] [Green Version]
- Jeanjean, A.P.R.; Monks, P.S.; Leigh, R.J. Modelling the effectiveness of urban trees and grass on PM2.5 reduction via dispersion and deposition at a city scale. Atmos. Environ. 2016, 147, 1–10. [Google Scholar] [CrossRef] [Green Version]
- Ma, P.; Tao, F.; Gao, L.; Leng, S.; Yang, K.; Zhou, T. Retrieval of Fine-Grained PM2.5 Spatiotemporal Resolution Based on Multiple Machine Learning Models. Remote Sens. 2022, 14, 599. [Google Scholar] [CrossRef]
- Zhang, X.; Cheng, C. Temporal and Spatial Heterogeneity of PM2.5 Related to Meteorological and Socioeconomic Factors across China during 2000–2018. Int. J. Environ. Res. Public Health 2022, 19, 707. [Google Scholar] [CrossRef]
- Jing, Z.; Liu, P.; Wang, T.; Song, H.; Lee, J.; Xu, T.; Xing, Y. Effects of meteorological factors and anthropogenic precursors on PM2.5 concentrations in cities in China. Sustainability 2020, 12, 3550. [Google Scholar] [CrossRef]
- Zoran, M.A.; Savastru, R.S.; Savastru, D.M.; Tautan, M.N. Assessing the relationship between surface levels of PM2.5 and PM10 particulate matter impact on COVID-19 in Milan, Italy. Sci. Total Environ. 2020, 738, 139825. [Google Scholar] [CrossRef]
- Hajiloo, F.; Hamzeh, S.; Gheysari, M. Impact assessment of meteorological and environmental parameters on PM2.5 concentrations using remote sensing data and GWR analysis (case study of Tehran). Environ. Sci. Pollut. Res. 2019, 26, 24331–24345. [Google Scholar] [CrossRef]
- Xu, G.; Ren, X.; Xiong, K.; Li, L.; Bi, X.; Wu, Q. Analysis of the driving factors of PM2.5 concentration in the air: A case study of the Yangtze River Delta, China. Ecol. Indic. 2020, 110, 105889. [Google Scholar] [CrossRef]
- Gu, W.; Xu, Y.; Lei, G. Research on the Regulation of Industrial Structure in the Mid-Southern Liaoning Urban Agglomeration from the Perspective of Spatial Connection; Springer: Singapore, 2022; ISBN 9789811625022. [Google Scholar]
- Wang, M.; Zhang, X.; Yan, X. Modeling the climatic effects of urbanization in the Beijing-Tianjin-Hebei metropolitan area. Theor. Appl. Climatol. 2013, 113, 377–385. [Google Scholar] [CrossRef]
- Wang, Y.H.; Hu, B.; Ji, D.S.; Liu, Z.R.; Tang, G.Q.; Xin, J.Y.; Zhang, H.X.; Song, T.; Wang, L.L.; Gao, W.K.; et al. Ozone weekend effects in the Beijing-Tianjin-Hebei metropolitan area, China. Atmos. Chem. Phys. 2014, 14, 2419–2429. [Google Scholar] [CrossRef] [Green Version]
- Min, M.; Lin, C.; Duan, X.; Jin, Z.; Zhang, L. Spatial distribution and driving force analysis of urban heat island effect based on raster data: A case study of the Nanjing metropolitan area, China. Sustain. Cities Soc. 2019, 50, 101637. [Google Scholar] [CrossRef]
- Xiong, L.; Li, J.; Xia, T.; Hu, X.; Wang, Y.; Sun, M.; Tang, M. Risk reduction behaviors regarding PM2.5 exposure among outdoor exercisers in the Nanjing metropolitan area, China. Int. J. Environ. Res. Public Health 2018, 15, 1728. [Google Scholar] [CrossRef] [PubMed] [Green Version]
- Yirsaw, E.; Wu, W.; Shi, X.; Temesgen, H.; Bekele, B. Land Use/Land Cover change modeling and the prediction of subsequent changes in ecosystem service values in a coastal area of China, the Su-Xi-Chang region. Sustainability 2017, 9, 1204. [Google Scholar] [CrossRef] [Green Version]
- Naess, P. Residential location, travel, and energy use in the Hangzhou Metropolitan Area. J. Transp. Land Use 2010, 3, 27–59. [Google Scholar] [CrossRef]
- He, S.; Su, Y.; Shahtahmassebi, A.R.; Huang, L.; Zhou, M.; Gan, M.; Deng, J.; Zhao, G.; Wang, K. Assessing and mapping cultural ecosystem services supply, demand and flow of farmlands in the Hangzhou metropolitan area, China. Sci. Total Environ. 2019, 692, 756–768. [Google Scholar] [CrossRef]
- Gao, X.; Zhang, A.; Sun, Z. How regional economic integration influence on urban land use efficiency? A case study of Wuhan metropolitan area, China. Land Use Policy 2020, 90, 104329. [Google Scholar] [CrossRef]
- Wang, T.; Li, H.; Huang, Y. The complex ecological network’s resilience of the Wuhan metropolitan area. Ecol. Indic. 2021, 130, 108101. [Google Scholar] [CrossRef]
- Wang, X.; Teng, M.; Huang, C.; Zhou, Z.; Chen, X.; Xiang, Y. Canopy density effects on particulate matter attenuation coefficients in street canyons during summer in the Wuhan metropolitan area. Atmos. Environ. 2020, 240, 117739. [Google Scholar] [CrossRef]
- Liu, D.; Clarke, K.C.; Chen, N. Integrating spatial nonstationarity into SLEUTH for urban growth modeling: A case study in the Wuhan metropolitan area. Comput. Environ. Urban Syst. 2020, 84, 101545. [Google Scholar] [CrossRef]
- Li, Z.; Jiang, W.; Wang, W.; Lei, X.; Deng, Y. Exploring spatial-temporal change and gravity center movement of construction land in the Chang-Zhu-Tan urban agglomeration. J. Geogr. Sci. 2019, 29, 1363–1380. [Google Scholar] [CrossRef] [Green Version]
- Liu, H.X.; Li, Y.P.; Yu, L. Urban agglomeration (Guangzhou-Foshan-Zhaoqing) ecosystem management under uncertainty: A factorial fuzzy chance-constrained programming method. Environ. Res. 2019, 173, 97–111. [Google Scholar] [CrossRef] [PubMed]
- Zhang, X.; Sun, Y. Investigating institutional integration in the contexts of Chinese city-regionalization: Evidence from Shenzhen–Dongguan–Huizhou. Land Use Policy 2019, 88, 104170. [Google Scholar] [CrossRef]
- PM2.5 Historical Data. PM2.5 Historical Data—Air Quality Index Historical Data—China Air Quality Online Monitoring and Analysis Platform Historical Data. Available online: https://www.aqistudy.cn/historydata/ (accessed on 7 April 2022).
- Washington University in St.Louis. GWRPM25|Supported by Box. Available online: https://wustl.app.box.com/v/ACAG-V5GL02-GWRPM25 (accessed on 7 April 2022).
- National Bureau of Statistics. Available online: http://www.stats.gov.cn (accessed on 7 April 2022).
- China Statistical Information Website. Available online: http://www.tjcn.org (accessed on 7 April 2022).
- Shi, Y.; Ren, C.; Lau, K.K.L.; Ng, E. Investigating the influence of urban land use and landscape pattern on PM2.5 spatial variation using mobile monitoring and WUDAPT. Landsc. Urban Plan. 2019, 189, 15–26. [Google Scholar] [CrossRef]
- Yoo, E.H.; Pu, Q.; Eum, Y.; Jiang, X. The impact of individual mobility on long-term exposure to ambient PM2.5: Assessing effect modification by travel patterns and spatial variability of pm2.5. Int. J. Environ. Res. Public Health 2021, 18, 2194. [Google Scholar] [CrossRef]
- Weather+. Historical Weather Query|Historical Weather Forecast Query|Historical Temperature Query|Past Weather Query—Historical Weather Query Network. Available online: https://lishi.tianqi.com/ (accessed on 7 April 2022).
- Fan, Y.; Ding, X.; Hang, J.; Ge, J. Characteristics of urban air pollution in different regions of China between 2015 and 2019. Build. Environ. 2020, 180, 107048. [Google Scholar] [CrossRef]
- Liu, X.; Xia, S.; Yang, Y.; Wu, J.; Zhou, Y.; Ren, Y. Spatiotemporal dynamics and impacts of socioeconomic and natural conditions on PM2.5 in the Yangtze River Economic Belt. Environ. Pollut. 2020, 263, 114569. [Google Scholar] [CrossRef]
- Shogrkhodaei, S.Z.; Razavi-termeh, S.V.; Fathnia, A. Spatio-temporal modeling of PM2.5 risk mapping using three machine. Environ. Pollut. 2021, 289, 117859. [Google Scholar] [CrossRef]
- Zhang, B.; Jiao, L.; Xu, G.; Zhao, S.; Tang, X.; Zhou, Y.; Gong, C. Influences of wind and precipitation on different-sized particulate matter concentrations (PM2.5, PM10, PM2.5–10). Meteorol. Atmos. Phys. 2018, 130, 383–392. [Google Scholar] [CrossRef]
- Wang, J.; Ogawa, S. Effects of meteorological conditions on PM2.5 concentrations in Nagasaki, Japan. Int. J. Environ. Res. Public Health 2015, 12, 9089–9101. [Google Scholar] [CrossRef]
- Song, J.; Feng, Q.; Wang, X.; Fu, H.; Jiang, W.; Chen, B. Spatial association and effect evaluation of CO2 emission in the Chengdu-Chongqing urban agglomeration: Quantitative evidence from social network analysis. Sustainability 2019, 11, 1. [Google Scholar] [CrossRef] [Green Version]
- Chang, I.C. Identifying leading nodes of PM2.5 monitoring network in taiwan with big data-oriented social network analysis. Aerosol Air Qual. Res. 2019, 9, 2844–2864. [Google Scholar] [CrossRef]
- Shao, J.; Ge, J.; Feng, X.; Zhao, C. Study on the relationship between PM2.5 concentration and intensive land use in Hebei Province based on a spatial regression model. PLoS ONE 2020, 15, e0238547. [Google Scholar] [CrossRef] [PubMed]
- Shen, W.; Liang, H.; Dong, L.; Ren, J.; Wang, G. Synergistic CO2 reduction effects in Chinese urban agglomerations: Perspectives from social network analysis. Sci. Total Environ. 2021, 798, 149352. [Google Scholar] [CrossRef] [PubMed]
- Chuang, M.T.; Chou, W.H.; Chang, C.H. Examining the key drivers for regional revitalization based upon social network analysis: A case study of Badouzi in Taiwan. Mar. Policy 2021, 133, 104754. [Google Scholar] [CrossRef]
- Latora, V.; Marchiori, M. A measure of centrality based on network efficiency. New J. Phys. 2007, 9, 188. [Google Scholar] [CrossRef]
- Gao, Y.; Sun, D.; Zhang, J. Study on the impact of the COVID-19 pandemic on the spatial behavior of urban tourists based on commentary big data: A case study of nanjing, china. ISPRS Int. J. Geo-Inf. 2021, 10, 678. [Google Scholar] [CrossRef]
- Zhang, D.; Lu, Y.; Tian, Y. Spatial Association Effect of Haze Pollution in Cheng-Yu Urban Agglomeration. Sci. Rep. 2020, 10, 9753. [Google Scholar] [CrossRef]
- Zhang, J.; Luo, Y. Degree Centrality, Betweenness Centrality, and Closeness Centrality in Social Network. In Proceedings of the 2017 2nd International Conference on Modelling, Simulation and Applied Mathematics (MSAM2017); Atlantis Press: Dordrecht, The Netherlands, 2017; Volume 132, pp. 300–303. [Google Scholar] [CrossRef] [Green Version]
- Li, Y.; Zhang, Y.; Lee, C.C.; Li, J. Structural characteristics and determinants of an international green technological collaboration network. J. Clean. Prod. 2021, 324, 129258. [Google Scholar] [CrossRef]
- Zhang, W.; Zhuang, X.; Lu, Y.; Wang, J. Spatial linkage of volatility spillovers and its explanation across G20 stock markets: A network framework. Int. Rev. Financ. Anal. 2020, 71, 101454. [Google Scholar] [CrossRef]
- Wu, X.; Wang, L.; Zheng, H. A network effect on the decoupling of industrial waste gas emissions and industrial added value: A case study of China. J. Clean. Prod. 2019, 234, 1338–1350. [Google Scholar] [CrossRef]


| Metropolitan Areas | Cities |
|---|---|
| South Central Liaoning | Tieling, Shenyang, Fushun, Benxi, Liaoyang, Panjin, Anshan, Yingkou, Dalian |
| Beijing-Tianjin-Hebei | Chende, Zhangjiakou, Beijing, Tangshan, Qinhuangdao, Tianjin, Baoding, Langfang, Cangzhou, Shijiazhuang, Hengshui, Xingtai, Handan |
| Nanjing | Huaian, Yangzhou, Chuzhou, Zhenjiang, Ma’anshan, Wuhu, Xuancheng |
| Suzhou-Wuxi-Changzhou | Suzhou, Changzhou, Wuxi |
| Hangzhou | Jiaxing, Huzhou, Hangzhou, Shaoxing, Huangshan, Quzhou |
| Wuhan | Xiaogan, Huanggang, Wuhan, Ezhou, Huangshi, Xianning |
| Chengdu | Deyang, Chengdu, Ziyang, Meishan |
| Changsha-Zhuzhou-Xiangtan | Changsha, Zhuzhou, Xiangtan |
| Guangzhou-Foshan-Zhaoqing | Guangzhou, Foshan, Zhaoqing |
| Shenzhen-Dongguan-Huizhou | Shenzhen, Dongguan, Huizhou |
| Data Type | Data Name | Unit | Description |
|---|---|---|---|
| Air quality | PM2.5 | μg/m3 | Describes the main object in the study |
| Economy | GDP | billion yuan | Describes the economic development of the city |
| Population | Permanent population | ten thousand people | Describes the distribution of the urban population |
| Population density | person/km2 | ||
| Industry | The proportion of secondary industry | % | Describe the industrial structure of the city |
| The proportion of tertiary industry | % | ||
| Technology | Patent granted | piece | Describe the level of science and technology of the city |
| Meteorological | Mean annual maximum temperature | °C | - |
| Metropolitan Areas | The Number of Nodes | The Number of Relationships | |
|---|---|---|---|
| 2019 | 2020 | ||
| Beijing-Tianjin-Hebei | 13 | 45 | 45 |
| Nanjing | 8 | 17 | 16 |
| Hangzhou | 6 | 12 | 12 |
| Wuhan | 6 | 8 | 8 |
| South Central Liaoning | 9 | 26 | 23 |
| Chengdu | 4 | 5 | 4 |
| Guangzhou-Foshan-Zhaoqing | 3 | 3 | 3 |
| Shenzhen-Dongguan-Huizhou | 3 | 3 | 3 |
| Suzhou-Wuxi-Changzhou | 3 | 3 | 3 |
| Changsha-Zhuzhou-Xiangtan | 3 | 3 | 3 |
| Metropolitan Areas | X1 | X2 | X3 | X4 | X5 |
|---|---|---|---|---|---|
| Beijing-Tianjin-Hebei | 28.85 | 28.85 | 6.70 | 20.91 | 42.66 |
| Nanjing | 29.46 | 29.46 | 15.48 | 31.05 | 46.09 |
| Hangzhou | 40.00 | 40.00 | 6.67 | 34.35 | 54.96 |
| Wuhan | 26.67 | 26.67 | 8.33 | 30.97 | 47.04 |
| South Central Liaoning | 34.03 | 34.03 | 6.37 | 33.12 | 48.08 |
| Chengdu | 37.50 | 37.50 | 12.50 | 43.51 | 56.88 |
| Guangzhou-Foshan-Zhaoqing | 50.00 | 50.00 | 16.67 | 55.56 | 66.67 |
| Shenzhen-Dongguan-Huizhou | 50.00 | 50.00 | 16.67 | 55.56 | 66.67 |
| Suzhou-Wuxi-Changzhou | 50.00 | 50.00 | 16.67 | 55.56 | 66.67 |
| Changsha-Zhuzhou-Xiangtan | 50.00 | 50.00 | 16.67 | 55.56 | 66.67 |
| Metropolitan Areas | 2019 | 2020 | ||||||||||
|---|---|---|---|---|---|---|---|---|---|---|---|---|
| L | S | T | H | P | A | L | S | T | H | P | A | |
| Beijing-Tianjin-Hebei | 0.398 *** | 0.155 * | −0.295 ** | −0.182 ** | 0.063 | 0.435 *** | 0.390 *** | 0.235 ** | −0.351 ** | −0.185 ** | 0.013 | 0.491 *** |
| Nanjing | 0.543 *** | 0.197 | −0.785 ** | −0.005 | −0.205 | 0.044 *** | 0.564 *** | 0.099 | −0.007 *** | 0.010 | 0.064 | 0.094 *** |
| Hangzhou | 0.332 ** | −0.395 * | 0.928 ** | −0.438 * | 0.316 * | 0.385 *** | 0.718 *** | −0.009 | 0.322 | −0.047 | 0.155 | 0.251 * |
| Wuhan | 0.243 ** | −0.371 *** | 0.074 | 0.001 | −0.328 * | 0.860 | 0.073 | −0.177 ** | −0.296 | 0.001 | −0.131 | 0.223 ** |
| South Central Liaoning | 0.736 *** | −0.081 | −0.045 | 0.039 | −0.010 | 0.165 * | 0.484 *** | −0.212 ** | 0.245 * | 0.020 | −0.350 ** | 0.379 ** |
| Chengdu | 0.104 | −0.064 | 0.818 | 0.049 | 0.225 ** | −0.347 ** | −0.240 | 0.572 * | −0.654 | −0.151 ** | −0.151 ** | 0.882 ** |
| Guangzhou-Foshan-Zhaoqing | 0.001 | 0.231 | −0.001 | 0.001 | −0.233 | 0.485 | 0.001 | 0.208 | −0.003 | 0.001 | −0.233 | 0.546 |
| Shenzhen-Dongguan-Huizhou | 0.001 | 0.567 | 0.000 | 0.000 | 0.112 | −0.011 | 0.001 | 0.384 | −0.001 | 0.001 | −0.263 | 0.493 |
| Suzhou-Wuxi-Changzhou | 0.056 | −0.001 | −0.048 | −0.029 | −0.138 | 0.619 | 0.001 | −0.001 | −0.000 | 0.001 | −0.216 | 0.621 |
| Changsha-Zhuzhou-Xiangtan | 0.001 | 0.081 | 0.083 | 0.001 | −0.208 | 0.674 | 0.001 | 0.160 | 0.125 | 0.009 | −0.330 | 0.714 |
| Metropolitan Areas | GDP (Billion Yuan) | The Proportion of Secondary Industry (%) | The Proportion of Tertiary Industry (%) | Patent Granted (Piece) |
|---|---|---|---|---|
| Beijing-Tianjin-Hebei | 6532.63 | 34.20 | 55.72 | 22,323 |
| Nanjing | 4860.61 | 45.5 | 48.51 | 17,981 |
| Hangzhou Wuhan | 5453.82 | 42.62 | 53.13 | 12,233 |
| 4125 | 41.93 | 47.22 | 10,591 | |
| South Central Liaoning Chengdu | 2335.25 | 41.72 | 49.21 | 4757 |
| 5482.32 | 37.11 | 50.96 | 16,194 | |
| Guangzhou-Foshan-Zhaoqing | 12,462.6 | 41.08 | 52.06 | 46,982 |
| Shenzhen-Dongguan-Huizhou | 13,688.2 | 48.25 | 49.93 | 92,893 |
| Suzhou-Wuxi-Changzhou | 13,139.2 | 46.99 | 51.64 | 49,140 |
| Changsha-Zhuzhou-Xiangtan | 5737.73 | 45.58 | 48.78 | 12,543 |
Publisher’s Note: MDPI stays neutral with regard to jurisdictional claims in published maps and institutional affiliations. |
© 2022 by the authors. Licensee MDPI, Basel, Switzerland. This article is an open access article distributed under the terms and conditions of the Creative Commons Attribution (CC BY) license (https://creativecommons.org/licenses/by/4.0/).
Share and Cite
Zhang, S.; Tao, F.; Wu, Q.; Han, Q.; Wang, Y.; Zhou, T. Structural Differences of PM2.5 Spatial Correlation Networks in Ten Metropolitan Areas of China. ISPRS Int. J. Geo-Inf. 2022, 11, 267. https://doi.org/10.3390/ijgi11040267
Zhang S, Tao F, Wu Q, Han Q, Wang Y, Zhou T. Structural Differences of PM2.5 Spatial Correlation Networks in Ten Metropolitan Areas of China. ISPRS International Journal of Geo-Information. 2022; 11(4):267. https://doi.org/10.3390/ijgi11040267
Chicago/Turabian StyleZhang, Shuaiqian, Fei Tao, Qi Wu, Qile Han, Yu Wang, and Tong Zhou. 2022. "Structural Differences of PM2.5 Spatial Correlation Networks in Ten Metropolitan Areas of China" ISPRS International Journal of Geo-Information 11, no. 4: 267. https://doi.org/10.3390/ijgi11040267
APA StyleZhang, S., Tao, F., Wu, Q., Han, Q., Wang, Y., & Zhou, T. (2022). Structural Differences of PM2.5 Spatial Correlation Networks in Ten Metropolitan Areas of China. ISPRS International Journal of Geo-Information, 11(4), 267. https://doi.org/10.3390/ijgi11040267