Article

The Point Cloud Semantic Segmentation Method for the Ming and Qing Dynasties’ Official-Style Architecture Roof Considering the Construction Regulations

School of Geomatics and Urban Spatial Informatics, Beijing University of Civil Engineering and Architecture, Beijing 100044, China
*
Author to whom correspondence should be addressed.
ISPRS Int. J. Geo-Inf. 2022, 11(4), 214; https://doi.org/10.3390/ijgi11040214
Submission received: 9 March 2022 / Revised: 17 March 2022 / Accepted: 19 March 2022 / Published: 22 March 2022
(This article belongs to the Special Issue Heritage Building Information Modeling: Theory and Applications)

Abstract

:
Point cloud semantic segmentation has played an important role in the scan-to-BIM process of the Ming and Qing Dynasties’ official-style architecture roof. To overcome the complexity of roof components’ shape and the scale differences between different roof component types, a point cloud semantic segmentation method for the MQDOAs roof considering the construction regulations is proposed in this paper. This method is composed of two stages. In the first stage, the features from the construction rules of MQDOAs, including the normalized symmetrical distance (NSD), relative height (RH) and local height difference (LHD), are extracted alongside the regular geometric features. To lower the influence of scale differences, a multi-scale feature connection strategy is also applied to construct the feature classification vector. In the second stage, RF method is applied to classify the point cloud. To verify the efficiency of the proposed method, we took the Hall of Complete Harmony as the study case. The experiments showed that our method achieved segmentation result in overall classification accuracy and reached 96.8%.

1. Introduction

The Ming and Qing Dynasties’ official-style architectures (MQDOAs) are considered the last peak of Chinese architectural history and were the important components of the ancient Chinese architectural system [1,2]. Suffering from weathering, fires and rotting, a mass of MQDOAs with wooden structural frame has disappeared. To preserve historical buildings, using the 3D point cloud, which provides precise geometric coordinates (X, Y, Z) in the form of millions of points, to record the shape of the cultural heritage has become one of the most efficient methods [3,4,5]. The captured original point cloud lacked structured information, such as semantics and hierarchy between parts, which disturbed the usage of point cloud in other application fields [6,7,8]. Hence, how to segment the point cloud into the sub dataset with semantic meaning has become a research hotspot.
Traditionally, the segmentation of the 3D point cloud is manually processed by using a digital workstation in a practice project. Apart from being time consuming, manual intervention for subdividing the datasets brings a certain degree of subjectivity [9]. Developing automatic or semi-automatic procedures for point cloud segmentation has become the consensus. Nowadays, automated point cloud segmentation methods have been proposed by researchers and achieve good performance [10,11,12].
However, it was still a challenge to segment the MQDOAs point cloud into the correct categories. On the one hand, the types of components composed of the MQDOAs were large, and the shapes of the components varied greatly. Only relying on the geometric features which are used in other architectural heritages made it difficult to meet the segmentation requirements [13]. On the other hand, the scale differences between different types of components also damaged the segmentation accuracy. The MQDOAs roof acted as a peculiarly characteristic and ornate part, and was the most complicated. Hence, the research on how to segment the point cloud of the MQDOAs roof into the categories had great significance.

1.1. Related Works

Traditional point cloud segmentation is the process of dividing the point cloud into multiple homogeneous regions which have the same properties [14]. Based on the different design mechanisms, Nguyen, A. and Le B. [15] divided the point cloud segmentation techniques into five categories: edge based, region based, attributes based, graph based and model based. Xie Y. et al. [16] classified the point cloud segmentation approaches into four major groups: edge based, model fitting, region growing, and unsupervised clustering based. Although there was a minor difference between these two classification criteria, most point cloud segmentation methods mainly relied on the purely mathematical model, especially before the appearance of the supervised learning methods.
In the field of culture heritage, plenty of traditional point cloud segmentation methods have been proposed. Wang Y. and Shi H. [17] proposed a multi-primitive segmentation method for the segmentation of column, planar and sphere based on the local sample. Hough transform (HT) was used to detect planes, cylinders and spheres [18]. To construct the BIM of the Milan Cathedral, Fassi F. et al. [19] extracted the plane and cylinder based on the region growing. Traditional point cloud segmentation methods performed well in man-made structures with regular geometrical shapes and allowed fast running time. However, in the process of segmenting the MQDOAs, some limitations were not ignored. On the one hand, the number of components consisting of MQDOAs was very large, and the shape of some components was irregular. It was difficult to choose the proper geometric model to fit objects. On the other hand, due to the absence of the supervised prior knowledge, the segmented point cloud had no strong semantic information. This semantic information was necessary in the scan-to-BIM process. To overcome these limitations, the researchers paid more attention to supervised learning methods for the point cloud semantic segmentation.
The supervised learning method can build an accurate predictive model for the segmentation of point cloud by learning the features from the given training data. In nature, they were a type of reasoning techniques. Therefore, besides obtaining the semantic label of each point, the supervised learning methods were more robust to noise, uneven density, and occlusions in the point cloud data compared with the traditional point cloud segmentation methods. Nowadays, machine learning (ML) techniques and deep learning (DL) techniques are the popular supervised learning point cloud segmentation methods [20,21,22,23]. From the perspective of AI, DL belongs to ML. The main difference between ML and DL techniques is whether or not the features are handcrafted [16].
Based on individual or contextual features, the ML techniques can be divided into individual point cloud semantic segmentation methods and statistical context methods [24]. The process of individual point cloud semantic segmentation methods mainly contains four stages—neighborhood selection, feature extraction, feature selection and semantic segmentation—as was summarized in Ref. [25]. Many mature methods which can complete specific functions in each stage have been proposed. Neighborhood selection decides the radius of the features calculation. Because the dimensions of different components from architectural heritages are different, with a fixed radius, it is difficult to meet the requirement of calculating the different components’ features. To obtain the best scale, Grilli E. et al. [26] calculated the features at different scales. According to the importance of the selected features based on the random forest (RF), the optimal radii for the different features were determined. To overcome the scale limitation, another strategy was proposed in [27]. In this method, the full-resolution point cloud firstly was subsampled into a low resolution level, and the subsampled point cloud was segmented into the categories at large scale; subsequently, the classified results were transferred to higher resolution data through the nearest neighborhood algorithm; at last, the higher resolution point cloud was further segmented into the new classes. In the stage of feature extraction and selection, plenty of works demonstrated that proper features can promote segmentation accuracy [28,29]. Because the different types of historical architectures have different appearances, it is necessary to design proper segmentation features, aiming at the different historical architectures. Nowadays, the most popular features mainly contain covariance features and other geometric features in the field of architecture heritage. However, whether these features are applicable to the Chinese ancient architectures should be explored. Moreover, considering that the construction of MQDOAs followed certain rules, the features from the construction regulation should be used in the segmentation process. In the stage of semantic segmentation, various classifiers have been proposed [30,31,32]. The experimental results showed that the RF classifier can obtain good performance in the robustness and accuracy of segmentation [33].
The statistical context methods mainly rely on the contextual features of points. Generally, this type of method is used in the post processing of individual point cloud semantic segmentation methods and can smooth the classification results. The conditional random fields are the most widely used context model [12]. Although the segmentation accuracy is increased, the time consumption of the statistical context methods is too large in practice.
Among the DL approaches, PointNet and its later improvement PointNet++ [34,35] were considered as pioneer works. Compared with the regular supervise machine learning, the DL methods do not need to design the features. A good review related on cloud segmentation based on DL can be seen in Ref. [36]. In the field of the architecture heritage, P. R. et al. [37] proposed a DL framework for cultural heritage based on the DGCNN. Y. Ji et al. [38] modified the DGCNN for the segmentation of the MQDOAs roof. The segmentation accuracy of the modified DGCNN performed better than PointNet, DGCNN and LDGCNN, and reached 87.14%.
Although the architectural heritage classification methods based on deep learning performed efficiently, the DL approaches significantly rely on the training datasets. Nowadays, the published datasets, such as ModelNet 40 [39], KITTI [40], Sydney Urban Objects [41], Semantic3D [42], S3DIS [43] and ArCH [37], were mainly collected from urban environments. There are still no published datasets focusing on MQDOAs with an adequate level of detail. This limited the usage of deep learning in the point cloud segmentation of the MQDOAs roof.

1.2. The Motivation and Contribution

In our previous work [29], the roof was extracted from the entire point cloud of MQDOAs. To further support the scan to BIM process, the 3D point cloud of MQDOAs roof was segmented into the sub-class with semantic information in this paper. Due to the absence of a point cloud dataset of the MQDOAs roof with an adequate level of detail, a standard machine learning method based on RF was applied. Considering that the construction of the Ming and the Qing Dynasties’ official-style architecture followed certain rules, which can be searched for in YingzaoFashi (Building Standards) [44] of the Song Dynasty or Gongchengzuofazeli (Structural Regulations) [45] published by Qing, we propose a point cloud segmentation method. The main contributions of this paper are listed as follows:
(1)
In addition to regular geometric features, other features from the construction regulations of MQDOAs roof were extracted and applied in this method.
(2)
A multi-scale feature vector strategy was proposed to lower the influence of the scale.
The research in this paper is organized as follows: (1) Section 2 gives a brief introduction of the study case; (2) in Section 3, the proposed method is given; (3) the experimental results are shown to demonstrate the efficiency of the approach in Section 4; (4) finally, a conclusion is conducted in Section 5.

2. Study Case

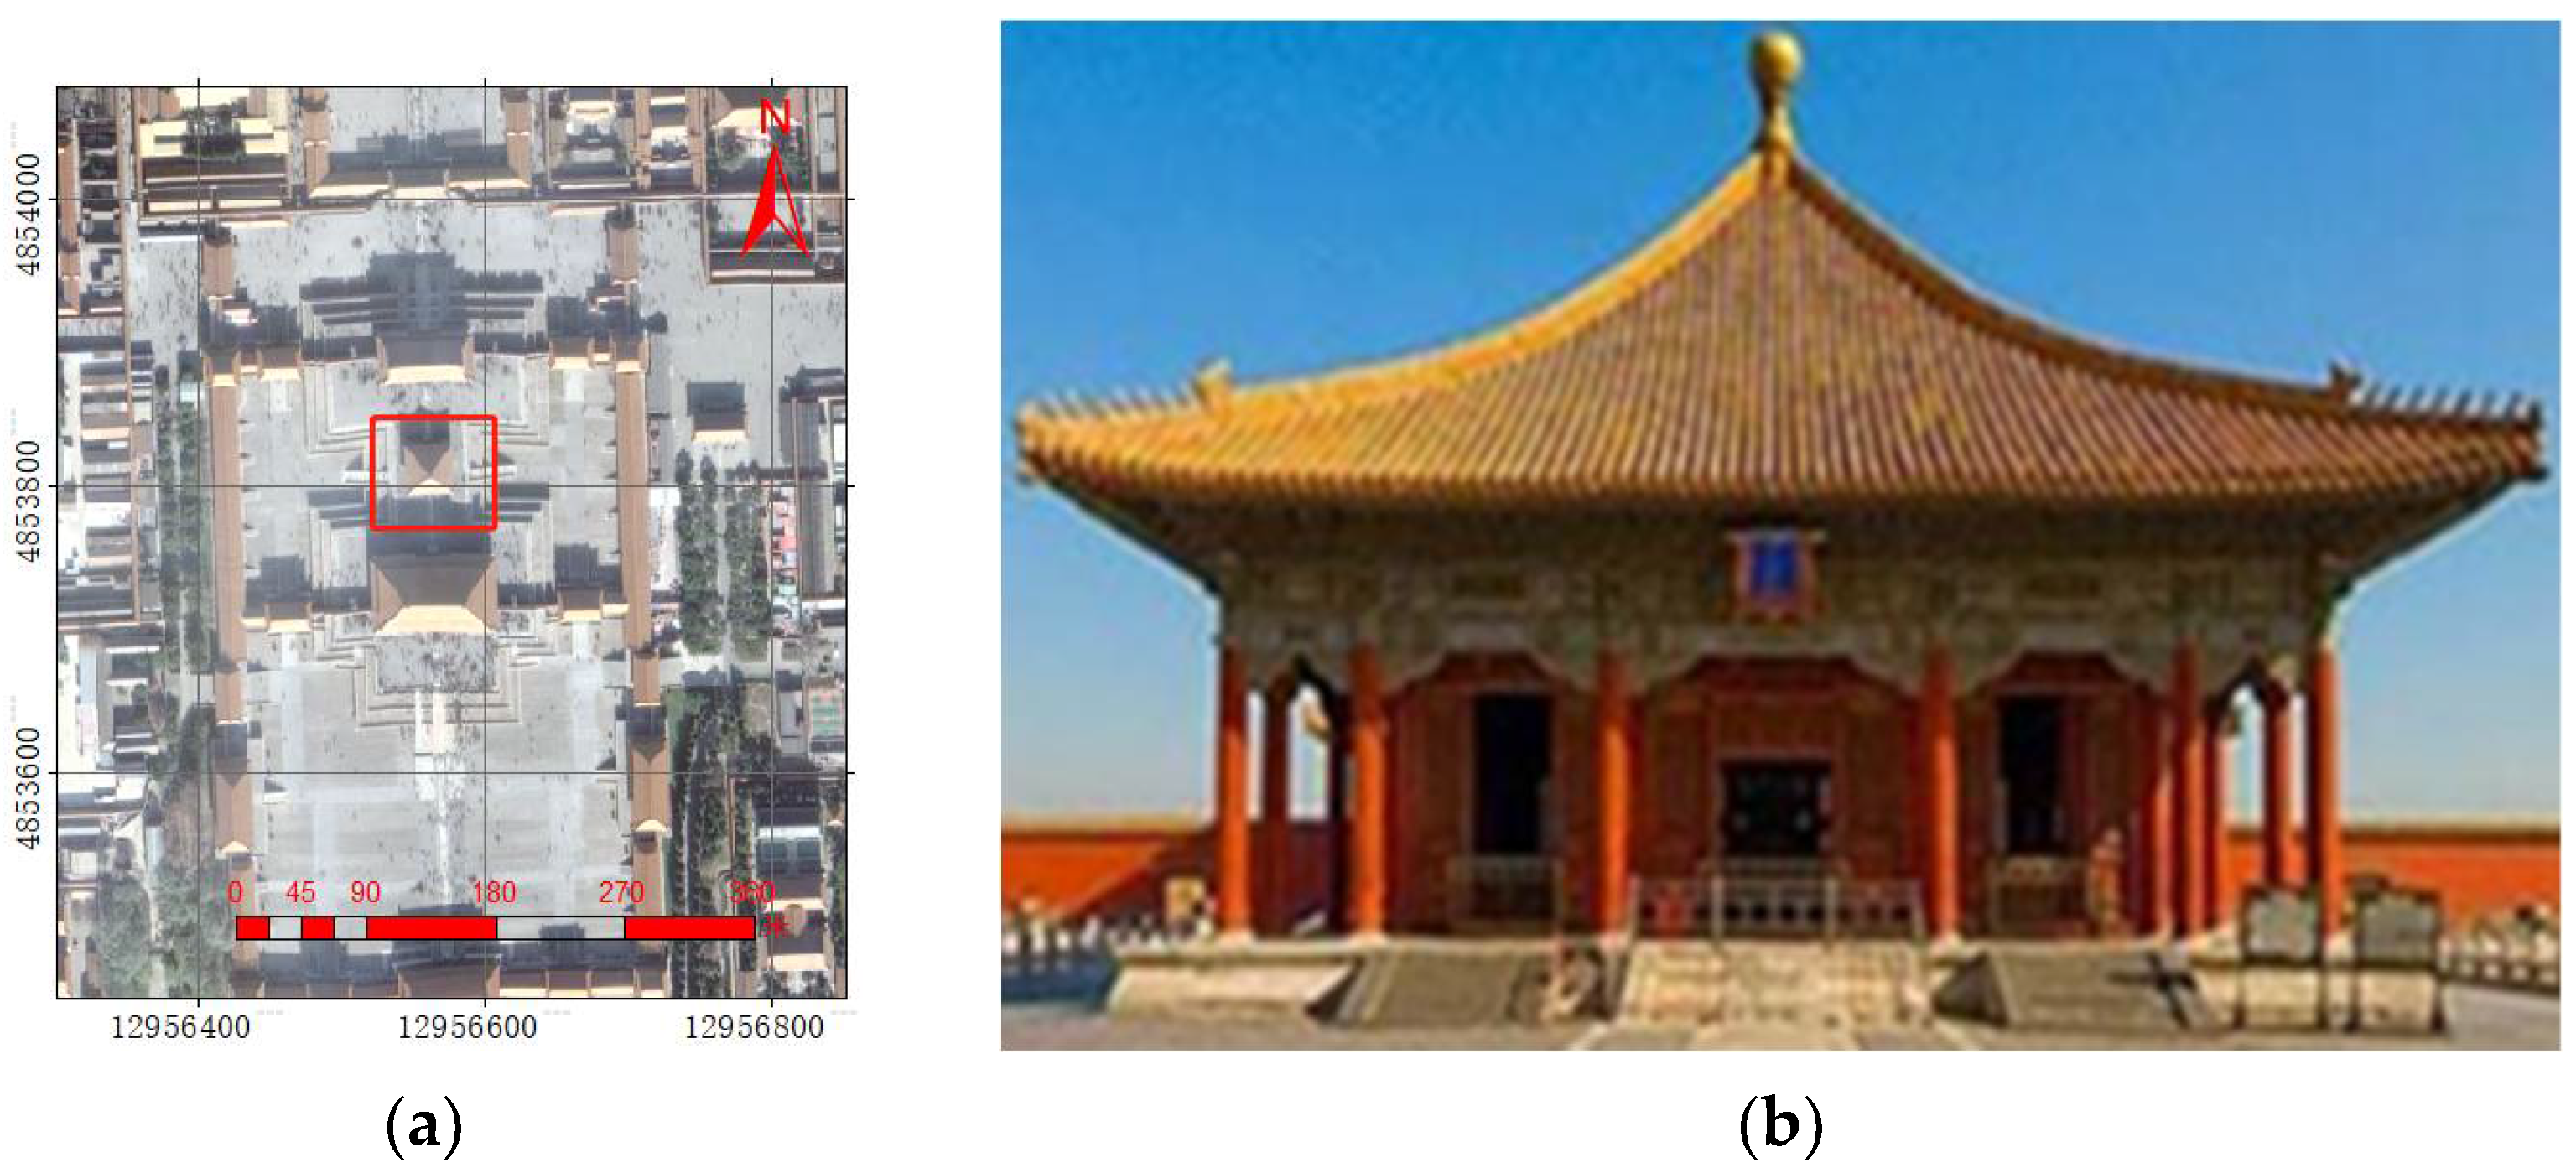
2.1. Hall of Complete Harmony

The Hall of Complete Harmony (中和殿) with a single-eave pyramidal roof is located between the Hall of Supreme Harmony (太和殿) and the Hall of Preserved Harmony (保和殿) on the central axis of the Forbidden City (Figure 1a). It is one of the most famous examples of the Ming and Qing Dynasties’ official-style architecture (Figure 1b), and is known as one of Three Great Halls of the Forbidden City. Built in 1420, the Hall of Complete Harmony was square in plane, and covered an area of approximately 580 m 2 , with 3 rooms wide and 3 rooms deep, respectively. The maximum height from the top of the baoding to the ground was 19 m.
The roof of the Hall of Complete Harmony has four slopes. Each slope is covered with yellow glazed tiles, including round tiles (筒瓦) and flat tiles (板瓦) which are distributed in the form of staggered parallel rows. The drip tiles (滴水), eave tiles (瓦当), lianyan (连檐) and rafters are located at the roof eaves, respectively. The number of vertical ridges which intersect at a copper tire gilded baoding (宝顶) is equal to the number of the slopes. Different types of zoushou (走兽) are distributed at the ends of the ridges. Four taoshou are at the four roof corners. Figure 2 shows the various components constituting the roof.

2.2. 3D Survey

To meet the requirement of the maintenance and other protection, a digital documentation project of the Hall of Complete Harmony was carried out by the Imperial Palace administration in 2010. In the process, the point clouds from 96 scan stations were respectively captured with the help of the terrestrial laser scanning (TLS) system Leica HDS6000. To register the data from various angles, a local coordinate system was defined as a benchmark to unify all the independent coordinates into one coordinate system. Relying on the commercial software package Leica Cyclone 6.0, the registration of point clouds from different scan stations was completed. The process is listed as follows:
(1)
Selected the fitted spherical centers of target balls which were located in the overlapping area between different scan stations as the registration features.
(2)
Calculated the transformation parameters based on the feature points.
(3)
Transformed the coordinates of target points to the reference coordinates system.
After merging scans, the average error of the target balls used as registration features was less than 2   mm and the root mean square (RMS) error of overlap points between different scan stations was about 2.25   cm . Although there was some noise around the eave tiles, the overall quality of the point cloud was still very high and could be used for the semantic segmentation directly. The captured point cloud of the Hall of Complete Harmony was shown in Figure 3. The point cloud density of the Hall of Complete Harmony was 43,416 points / m 2. To support the process of the Scan-to-BIM, we divided the roof components into nine classes: zoushou, ridge, flat tile, baoding, taoshou, lianyan, rafter, drip tile and round tile.

3. Our Proposed Methods

As is shown in Figure 4, the semantic segmentation process mainly contained two parts:
(1)
A multi-scale classification features vector, which contained the geometric features at the different scales and the features from the construction regulations, was constructed (see Section 3.1).
(2)
Random forest was applied to fit a prediction model by the selected training data with semantic labels and predicted the test data (see Section 3.2).
Figure 4. The semantic segmentation process in this paper.
Ijgi 11 00214 g004

3.1. Multi-Scale Classification Features Vector Construction

3.1.1. Single-Scale Feature Generation Based on Points

The construction of the Ming and the Qing Dynasties’ official-style architecture followed certain rules which resulted in the distribution of roof components of buildings in the Ming and Qing Dynasties also obeying some arrangement laws. Hence, in addition to the regular geometric features, which were widely used in other works [17,19,31], the features that came from the construction regulation are also designed in this section.
(1)
The regular geometric features
The covariance features were the popular geometric features in the segmentation of point clouds and mainly contained the linearity, planarity, sphericity, normal change rate, etc. They were the shape descriptors obtained as a combination of the eigenvalues extracted from the covariance matrix. Assuming that C P represents the neighborhood covariance matrix of point p , C P can be calculated by Equation (1)
C P = 1 | N K | p i N k ( p i p ¯ ) ( p i p ¯ ) T
where p ¯ = 1 | N K | p i N k p i , and N k represents the number of the points. A set of positive eigenvalues λ i ( λ 1 > λ 2 > λ 3 ) is computed; then, the covariance features can be calculated according to the positive eigenvalues (or normalized eigenvalues).
Besides the covariance features, other geometric features, such as the verticality and roughness, are often applied in the point cloud classification process in the field of the architectural heritage. Plenty of works have demonstrated that proper features can promote the accuracy of the results [20,28]. However, selecting the proper features is a difficult task. On the one hand, the selected geometric features can express the shape of classification objects; on the other hand, these features should have differences.
To select the proper features for the semantic segmentation of the MQDOAs roof, a feature selection process was conducted as follows:
  • At first, we analyzed the shape of each type of roof component;
  • We tested the various geometric features that appeared in the previous work based on the former analysis results;
  • At last, we selected the proper features from the experimental results through the visual inspection.
Through trial and error, linearity, planarity, sphericity, normal change rate, verticality and roughness were extracted as the semantic segmentation features in this paper. The used features are shown in Table 1 and Figure 5.
(2)
Features from construction regulations
Based on the construction regulations, the components were arranged symmetrically along the symmetry axis of buildings (Figure 6a) and the topological relationship of the different types of components was relatively fixed (Figure 6b). Although the coordinates can describe the arrangement law of the roof components, the points of different component categories were staggered in the 3D space. Only relying on the coordinates ( X ,   Y ,   Z ) was difficult to meet the classification requirement. For example, zoushou must be on the ridges. However, the points belonged to ridge may be higher than the points of zoushou in some areas.
Considering that the shape of each section line along (or perpendicular to) the main direction of the buildings was similar (Figure 6c) and the arrangements of the roof components along the section line were also the same (Figure 6d), the relative locations, including the normalized symmetrical distance (NSD), which is the normalized distance from a point to the symmetry axis of the MQDOAs and the relative height (RH), were extracted from the section lines as the classification features.
As shown in Figure 6c, L i is a section line along the main direction of the building and p i n ( x i n y i n z i n ) is a point that belongs to L i . The feature N S D i n of this point is calculated as follows:
N S D i n = 2 d i n l i
where l i is the length of L i on the XOY plane, d i n is the distance from a point to the symmetry axis of the MQDOAs. Obviously, the NSD is the same, and the point class is the same. Moreover, the NSD of roof components located at the outermost contour of the roof is nearly 1 for each section line. On the XOY plane, the staggered phenomenon of points is lower.
Supposed that p i l ( x i l y i l z i l ) and p i h ( x i h y i h z i h ) are the lowest and highest points on L i , separately; and p i m ( x i m y i m z i m ) represents the lowest point located in the middle area of this section line. The feature R H i n of the point p i n ( x i n y i n z i n ) is described in (7).
R H i n = { z i n z i m i f   z i n z i m ( z i n z i l ) / ( z m a x m z i l ) i f   z i n < z i m
In this equation, z m a x m represents the highest point of the whole roof. Based on this equation, the staggered phenomenon of points from different roof components can be efficiently lowered at the Z axis. In particular, we have the following:
(1)
Along the Z direction, the main difference between L i and L j is the height caused by the ab section (Figure 6c). On the section line L i , if h a b is added to the height from p i l to p i m , the normalized height of points which are lower than p i m will become almost the same as that of the points which are lower than p j m on L j . Hence, when a point is lower than p i m , we can normalize to the highest section line.
(2)
When the point p i n is higher than p i m , this point should belong to the ridge or zoushou. This is applicable to the other section line.
The arrangement of the flat tiles and round tiles also show a strong regularity in a local area along the section line. As shown in Figure 7, P 1 and P 2 are the points on the flat tile and the round tile, separately. Obviously, the points that belong to the flat tile are at the bottom of the local area between the two round tiles, and the height of these points is almost the same. Hence, the local height difference (LHD) between a point and the lowest point within a local area of the current point along the section line was applied in this paper. The size of the local area can be defined as being double the width of the round tile. The LHD of the n t h point on the i t h section line is expressed as follows:
L H D i n = Z i n Z i n l
where Z i n l is the height of the lowest point within a local area of the current point on the section line. Figure 8 shows the extracted features’ results along the section line. Notably, the section line perpendicular to the main direction of the building is extracted and the features are also calculated in this method.

3.1.2. Multi-Scale Feature Vector Construction

To lower the influence of scale, we applied a multi-scale feature vector for the semantic segmentation of the MQDOAs roof. The process of constructing the multi-scale feature vector is listed as follows:
(1)
We took different neighborhood size s to calculate the geometric feature vector of the current segmented point.
(2)
We connected geometric feature vectors at the selected scales and the features from the construction regulation into a long classification feature vector to form the multi-scale classification feature vector of the current segmented point.
The computational time grows with the increase in the search radii. Hence, it was impossible to calculate the geometric features at all scales. To determine the selected scales set S , a simple strategy is given here. This strategy is described as follows:
(1)
Set the initial scale s 0 .
(2)
Calculate the single-scale geometric feature vector at the current scale.
(3)
Input the calculated single-scale geometric feature vector into the classifier and compare the classification accuracy of the target data. If the classification accuracy at the current scale is higher than that at the previous scale, preserve the current scale into S and proceed to step (4); otherwise, output the selected scales set S .
(4)
Increase the current scale according to the specified interval and turn to step 2.
Notably, from the perspective of machine learning, the validation data were used for scales selection. However, the point cloud of other Ming and Qing Dynasties’ official-style architectures with a detailed roof was hard to acquire, thus the data to be segmented for testing were used in this paper.

3.2. Data Training and Classifying Based on Random Forest

3.2.1. Random Forest

Random forest (RF) was first proposed by Leo Breiman and Adele Cutler [45] and it has been widely used in point cloud classification field of the culture heritage [26]. This classifier makes use of the multiple trees to train and predict samples. In the training stage, it inputs both the class labels and the extracted features to fit a prediction model and predict the other points without class labels.
As was described in [28], the RF has three advantages:
(1)
RF is considered a highly accurate and robust method because of the number of decision trees participating in the process.
(2)
RF can avoid the over-fitting problem, as it takes the average of all the predictions, which cancel out the biases.
(3)
RF offers a useful feature selection indicator (the relative importance or contribution of each feature in the prediction), which can help us estimate the optimal feature vector.
In this paper, we selected the Scikit Learn Python library (version 0.24.1) [46] to carry out the classification program. Considering several parameters (such as n_estimators, oob_score and max_depth, etc.) which were involved in this module, the default parameters were applied so that the generalization can be further increased.

3.2.2. Feature Selection

In addition to the geometric features (including linearity, planarity, sphericity, verticality, normal change rate and roughness), the features NSD, RH and LHD that were selected, X, Y and Z were also employed as the segmentation features in this paper. As described in Section 3.1, we constructed the multi-scale classification features vector.

3.2.3. Supervised Classification

After the feature selection, the training samples with the selected feature set were utilized to train the RF classifier, and the classifier was used to predict the labels of unlabeled points.

4. Experiments

4.1. Test Data and Evaluation Criteria

To evaluate the performance of the proposed method, the 3D survey data of the Hall of Complete Harmony was applied. Before the experiment, the roof was extracted from the 3D survey data and each point was labeled into the corresponding categories proposed in Section 2.1 by manual processing. The annotated class is shown in Figure 9.
We divided the roof into two parts: one part was regarded as the training data and the other part was used for the test data. The training set should contain all types of roof components. Considering the symmetric structure of the roof, the train data were mainly selected along the main direction of the building as is shown in Figure 10. Because taoshou is only located at the corners of the roof, some points located at the corners must be selected; otherwise, the taoshou will be incorrectly segmented. The point cloud statistics of the training set and test set are shown in Table 2.
For evaluation, we employed four commonly used measures: overall accuracy (OA), precision, recall and F 1 _ score . They are computed as follows:
Precision = TP ( TP + FP )
Recall = TP ( TP + FN )
F 1 _ score = 2 × Recall × Precision Precision + Recall
OA = TP + FN TP + FP + TN + FN
where TP = true positive (sum of the values in the diagonal position), FP = false positive (sum of the values in the column without the main diagonal one), TN = true negative, and FN = false negative (sum of the values in the row without the main diagonal one).

4.2. Experimental Results and Analysis

The MQDOAs roof is composed of all types of tiles. Among them, the thickness of the tiles is about 2.5   cm . So, we took 2   cm as the initial scale. Then, we increased the scale from 5   cm to 0.2   m gradually. The classification accuracy was calculated under different scales. When the scale was 0.2   m , the classification accuracy was lower than that under the scale of 0.1   m . Hence, in the experiment, the geometric features were calculated within s 1 = 0.02   m , s 2 = 0.05   m ,   s 3 = 0.1   m and s 4 = 0.2   m , respectively. To verify the advantage of the proposed method, we connected the geometric feature vectors based on the different scale combinations (including s 0 , s 0 + s 1 , s 0 + s 1 + s 2 , s 0 + s 1 + s 2 + s 3 ) and the proposed features to form a long dimension feature vector as the input features for the point cloud classification of the MQDOAs roof.
Moreover, two optimal feature vectors were also selected according to the importance rank of features based on the RF. The first optimal feature vector came from a pure multi-scale geometric feature vector without the proposed features based on the scale combination of s 0 + s 1 + s 2 + s 3 and a multi-scale feature vector, including the proposed features based on the scale combination of s 0 + s 1 + s 2 + s 3 in our experiment. The first optimal feature vector included Z, roughness (0.2), normal change rate (0.2), verticality (0.2), normal change rate (0.1), verticality (0.1), normal change rate (0.05), planarity (0.05) and sphericity (0.05); the second optimal feature vector contained Z, roughness (0.2), sphericity (0.2), verticality (0.2), verticality (0.1), normal change rate (0.05), planarity (0.05), LHD1 and LHD2 (which were extracted from the section line along and perpendicular to the main direction of building).
A comparative test was carried out on the combination of different scales. The classification results are shown in Table 3 and Table 4.
The segmentation result of the Hall of Complete Harmony’s roof is shown in Figure 11. Table 4 shows that the highest OA reached 96.8% when the proposed features were added at the s0 + s1 + s2 scales. Besides the OA, a rigid evaluation index, the average value of F1_score, was also applied to lower the impact of the quantitative variation of points within different categories in performance evaluation. As is shown in Figure 12, the lowest average value of F1_score was 62.2% only relying on the regular geometric features at the s0 scale, and the highest average value of F1_score (92.4%) still occurred when the proposed features were added at the s0 + s1 + s2 scales. Obviously, when the proposed features were added, the average F1_score was higher than that only relying on the regular geometric features at the same scale or the scale combination. On the other hand, the multi-scale feature connection strategy also improved the average F1_score.
The experimental results showed that the segmentation accuracy obtained after adding our proposed features and applying the multi-scale long feature vectors was significantly better than that of relying on the covariance features and single scale. Both the proposed features and multi-scale feature connection strategy can improve the point cloud classification accuracy.

4.3. Impact of Proposed Features

As was shown in Figure 13, at the same scale or scale combinations, the classification accuracies increased when the proposed features were input into the RF classifier. The max difference of classification accuracy between the regular geometric feature vector and the combination of regular geometric and proposed features accrued at s 0 scale and reached 19.4%. The minimum difference of classification accuracy accrued at s0 + s1 + s2 + s3 scale combination and reached 2.2%. In the case of using single-scale features, the classification accuracy only relying on the geometric features ranged from 74.1% to 87.1%, while the fluctuation of classification accuracy was less than 3% when the proposed features were added. This showed that the features from the construction regulations not only increased the classification accuracy, but also could lower the influence of the scales on the classification accuracy.
In addition to the overall accuracy, the proposed features also obtained good performance on the classification accuracy of each class. As shown in Figure 14, except the class zoushou, the F 1 _ score of the other classes was higher than that without the proposed features. Although the F 1 _ score of zoushou was lower, the highest difference was less than 5% at the same scale. This showed that the proposed features had good performance on the classification of the roof point cloud.

4.4. Influence of Different Scale Combinations

As shown in Figure 14, the highest classification accuracy based on the single-scale geometric feature vector was 87.1% and the lowest classification accuracy based on the multi-scales geometric features was 88.4%. Similarly, when the proposed features were added, the lowest classification accuracy of multi-scale long feature vectors was also higher than the highest classification accuracy of single-scale features vectors. Hence, compared with the single-scale feature vectors, the multi-scale long feature vectors (such as s 0 + s 1 , s 0 + s 1 + s 2 , s 0 + s 1 + s 2 + s 3 ) performed better when the same features were applied.
The classification accuracies based on two sets of optimal feature vector were 92.9% and 96%. They were still lower than 94.4% and 96.6%. In nature, the optimal features are generated from the combination of multi-scale features (s0 + s1 + s2 + s3). Some unimportant features may be ignored. However, these unimportant features play an important role in the class which contains few points [47]. This optimal-features strategy may reduce the segmentation accuracy of these classes. As shown in Figure 15, the difference of F 1 _ score of taoshou between the optimal features the segmentation accuracy increased. Although the optimal-features strategy can reduce the time consumption, the multi-scale was essential for the fine point cloud segmentation of the MQDOAs roof.
For the combinations of scales, the strategy of connecting single-scale feature vectors into multi-scale feature vectors was not that the more numerous the scales, the more beneficial it was to improve the classification accuracy. As can be seen from Figure 13, the combination of three scales ( s 0 + s 1 + s 2 ) had the highest segmentation accuracy in the comparison test rather than the combination of four scales s 0 + s 1 + s 2 + s 3 .
The best experimental result of the multi-scale feature vector including the proposed features occurred at the s 0 + s 1 + s 2 scales, and the scales combination was consistent with our proposed scale combination strategy. In fact, the classification accuracy increased from the scale s 0 to s 3 . When the scale was equal to 0.2   m , the segmentation accuracy declined. The combination of scales s 0 + s 1 + s 2 can be regarded as the optimal scale combination. However, the experimental result of multi-scale feature vector without the proposed features showed a different conclusion. Although the segmentation accuracy also declined only relying on the pure geometric features when the scale was equal to 0.2   m , the optimal scales combination was s 0 + s 1 + s 2 + s 3 , rather than s 0 + s 1 + s 2 . These experimental results showed the proposed scale selection strategy can be close to the optimal result and may not achieve the optimal result in some cases.

5. Conclusions

Considering the complexity of MQDOAs roof and the scale differences between different component types, the proposed method applied a multi-scale features vector for the point cloud segmentation of MQDOAs roof. The highlights of this work are listed as follows:
(1)
The features, including RH, NSD and LHD, were selected for the point cloud sematic segmentation of the Ming and Qing Dynasties’ official-style architecture roof, and the corresponding feature extraction methods were proposed.
(2)
For the fine segmentation of the MQDOAs roof, the multi-scale feature vector was essential, and the scale connection strategy was given in this paper.
(3)
The experimental results showed that our proposed method can achieve good performance and has robustness after the proposed features are added and the multi-scale strategy is applied.
Although our proposed method was not tested on the additional point cloud data of other MQDOAs roofs, due to the absence of data, the algorithm can achieve the presented results for other MQDOAs roofs, theoretically. This is mainly because the components which form the roofs are almost the same, and the distribution of components is also similar.
Additionally, it is worth noting that the classification of the Ming and Qing Dynasties’ official-style architecture was not the primary goal of our work. We hoped to reconstruct a historical building information model (HBIM) of the Ming and Qing Dynasties’ official-style architecture, automatically. In previous work [48], the method reconstructing the decorative components based on a template library was given. The future work will include (1) partial occlusion component information extraction (such as flat tiles); (2) the parameterization of components; (3) the HBIM reconstruction mechanism; and (4) using various strategies to ensure that the point cloud can be processed in memory.

Author Contributions

Conceptualization, Youqiang Dong; methodology, Youqiang Dong; software, Yihao Li; validation, Miaole Hou and Yihao Li; formal analysis, Yihao Li; investigation, Yihao Li; resources, Miaole Hou; data curation, Yihao Li; writing—original draft preparation, Youqiang Dong and Yihao Li; writing—review and editing, Youqiang Dong; supervision Miaole Hou; project administration, Miaole Hou; funding acquisition, Miaole Hou. All authors have read and agreed to the published version of the manuscript.

Funding

This research was funded by National Key Research and Development Program of China (2019YFC1520800); Scientific Research Project of Beijing Educational Committee (KM202110016005); Beijing Postdoctoral Research Foundation (21009920004); Beijing Municipal Education Commission (KZ202110016021); Young Beijing Scholars Project (04147521504).

Institutional Review Board Statement

Not applicable.

Informed Consent Statement

Not applicable.

Conflicts of Interest

The authors declare no conflict of interest.

References

  1. Zhang, D. Cultural Symbols in Chinese Architecture. Archit. Des. Rev. 2019, 1, 2–17. [Google Scholar] [CrossRef]
  2. Armani, S.; Arbi, E. A Comparative Study on Chinese Architecture in Peninsular Malaysia and Mainland China. J. Des. Built Environ. 2014, 14, 1. [Google Scholar]
  3. Hu, Q.; Wang, S.; Fu, C.; Ai, M.; Yu, D.; Wang, W. Fine Surveying and 3D Modeling Approach for Wooden Ancient Architecture via Multiple Laser Scanner Integration. Remote Sens. 2016, 8, 270. [Google Scholar] [CrossRef] [Green Version]
  4. Yang, X.; Grussenmeyer, P.; Koehl, M.; Macher, H.; Murtiyoso, A.; Landes, T. Review of built heritage modelling: Integration of HBIM and other information techniques. J. Cult. Herit. 2020, 46, 350–360. [Google Scholar] [CrossRef]
  5. Hu, Z.; Qin, X. Extended interactive and procedural modeling method for ancient Chinese architecture. Multimed. Tools Appl. 2020, 80, 5773–5807. [Google Scholar] [CrossRef]
  6. Xu, S.; Vosselman, G.; Elberink, S.O. Multiple-entity based classification of airborne laser scanning data in urban areas. ISPRS J. Photogramm. Remote Sens. 2014, 88, 1–15. [Google Scholar] [CrossRef]
  7. Zhu, Q.; Li, Y.; Hu, H.; Wu, B. Robust point cloud classification based on multi-level semantic relationships for urban scenes. ISPRS J. Photogramm. Remote Sens. 2017, 129, 86–102. [Google Scholar] [CrossRef]
  8. Malinverni, E.S.; Pierdicca, R.; Paolanti, M.; Martini, M.; Morbidoni, C.; Matrone, F.; Lingua, A. Deep learning for semantic segmentation of 3D point cloud. ISPRS—Int. Arch. Photogramm. Remote Sens. Spat. Inf. Sci. 2019, XLII-2/W15, 735–742. [Google Scholar] [CrossRef] [Green Version]
  9. Teruggi, S.; Grilli, E.; Russo, M.; Fassi, F.; Remondino, F. A Hierarchical Machine Learning Approach for Multi-Level and Multi-Resolution 3D Point Cloud Classification. Remote Sens. 2020, 12, 2598. [Google Scholar] [CrossRef]
  10. Vosselman, G. Point cloud segmentation for urban scene classification. ISPRS Int. Arch. Photogramm. Remote Sens. Spat. Inf. Sci. 2013, XL-7/W2, 257–262. [Google Scholar] [CrossRef] [Green Version]
  11. Weinmann, M.; Jutzi, B.; Mallet, C. Feature relevance assessment for the semantic interpretation of 3D point cloud data. ISPRS Ann. Photogramm. Remote Sens. Spat. Inf. Sci. 2013, II-5/W2, 313–318. [Google Scholar] [CrossRef] [Green Version]
  12. Niemeyer, J.; Rottensteiner, F.; Soergel, U. Contextual classification of lidar data and building object detection in urban areas. ISPRS J. Photogramm. Remote Sens. 2014, 87, 152–165. [Google Scholar] [CrossRef]
  13. Morbidoni, C.; Pierdicca, R.; Paolanti, M.; Quattrini, R.; Mammoli, R. Learning from Synthetic Point Cloud Data for Historical Buildings Semantic Segmentation. J. Comput. Cult. Herit. 2020, 13, 34. [Google Scholar] [CrossRef]
  14. Grilli, E.; Menna, F.; Remondino, F. A Review of Point Clouds Segmentation and Classification Algorithms. Int. Arch. Photogramm. Remote Sens. Spat. Inf. Sci. 2017, XLII-2/W3, 339–344. [Google Scholar] [CrossRef] [Green Version]
  15. Nguyen, A.; Le, B. 3D Point Cloud Segmentation: A survey. In Proceedings of the 2013 6th IEEE Conference on Robotics, Automation and Mechatronics (RAM), Manila, Philippines, 12–15 November 2013; pp. 225–230. [Google Scholar]
  16. Xie, Y.; Tian, J.; Zhu, X.X. Linking Points with Labels in 3D: A Review of Point Cloud Semantic Segmentation. IEEE Geosci. Remote Sens. Mag. 2020, 8, 38–59. [Google Scholar] [CrossRef] [Green Version]
  17. Wang, Y.; Shi, H. A Segmentation Method for Point Cloud Based on Local Sample and Statistic Inference. Commun. Comput. Inf. Sci. 2015, 48, 274–282. [Google Scholar]
  18. Vosselman, G.; Gorte, B.G.H.; Sithole, G.; Rabbani, T. Recognizing structure in laser scanning point clouds. In Proceedings of the ISPRS working group VIII/2: Laser Scanning for Forest and Landscape Assessment, Freiburg, Germany, 3–6 October 2004; pp. 33–38. [Google Scholar]
  19. Fassi, F.; Achille, C.; Fregonese, L. Surveying and modelling the main spire of Milan Cathedral using multiple data sources. Photogramm. Rec. 2011, 26, 462–487. [Google Scholar] [CrossRef]
  20. Weinmann, M.; Jutzi, B.; Hinz, S.; Mallet, C. Semantic point cloud interpretation based on optimal neighborhoods, relevant features and efficient classifiers. ISPRS J. Photogramm. Remote Sens. 2015, 105, 286–304. [Google Scholar] [CrossRef]
  21. Li, Z.; Zhang, L.; Tong, X.; Du, B.; Wang, Y.; Zhang, L.; Zhang, Z.; Liu, H.; Mei, J.; Xing, X.; et al. A three-step approach for TLS point cloud classification. IEEE Trans. Geosci. Remote Sens. 2016, 54, 5412–5424. [Google Scholar] [CrossRef]
  22. Maturana, D.; Scherer, S. Voxnet: A 3D convolutional neural network for real-time object recognition. In Proceedings of the IEEE/RSJ International Conference on Intelligent Robots and Systems (IROS), Hamburg, Germany, 28 September–2 October 2015; pp. 922–928. [Google Scholar]
  23. Wang, W.; Yu, R.; Huang, Q.; Neumann, U. Sgpn: Similarity group proposal network for 3D point cloud instance segmentation. In Proceedings of the IEEE Conference on Computer Vision and Pattern Recognition, Salt Lake City, UT, USA, 18–23 June 2018; pp. 2569–2578. [Google Scholar]
  24. Weinmann, M.; Schmidt, A.; Mallet, C.; Hinz, S.; Rottensteiner, F.; Jutzi, B. Contextual classification of point cloud data by exploiting individual 3D neigbourhoods. ISPRS Ann. Photogramm. Remote Sens. Spatial Inf. Sci. 2015, I-3/W4, 271–278. [Google Scholar] [CrossRef] [Green Version]
  25. Landrieu, L.; Raguet, H.; Vallet, B.; Mallet, C.; Weinmann, M. A structured regularization framework for spatially smoothing semantic labelings of 3D point clouds. ISPRS J. Photogramm. Remote Sens. 2017, 132, 102–118. [Google Scholar] [CrossRef] [Green Version]
  26. Grilli, E.; Farella, E.M.; Torresani, A.; Remondino, F. Geometric features analysis for the classification of cultural heritage point clouds. ISPRS Int. Arch. Photogramm. Remote Sens. Spat. Inf. Sci. 2019, XLII-2/W15, 541–548. [Google Scholar] [CrossRef] [Green Version]
  27. Grilli, E.; Dininno, D.; Petrucci, G.; Remondino, F. From 2D to 3D supervised segmentation and classification for cultural heritage applications. ISPRS—Int. Arch. Photogramm. Remote Sens. Spat. Inf. Sci. 2018, 2, 399–406. [Google Scholar] [CrossRef] [Green Version]
  28. Grilli, E.; Remondino, F. Classification of 3D Digital Heritage. Remote Sens. 2019, 11, 847. [Google Scholar] [CrossRef] [Green Version]
  29. Dong, Y.; Hou, M.; Xu, B.; Li, Y.; Ji, Y. Ming and Qing Dynasty Official-Style Architecture Roof Types Classification Based on the 3D Point Cloud. ISPRS Int. J. Geo-Inf. 2021, 10, 650. [Google Scholar] [CrossRef]
  30. Lodha, S.K.; Kreps, E.J.; Helmbold, D.P.; Fitzpatrick, D.N. Aerial lidar data classification using support vector machines (svm). In Proceedings of the Third International Symposium on 3D Data Processing, Visualization, and Transmission, Chapel Hill, NC, USA, 14–16 June 2006; pp. 567–574. [Google Scholar]
  31. Lodha, S.K.; Fitzpatrick, D.M.; Helmbold, D.P. Aerial lidar data classification using adaboost. In Proceedings of the Sixth International Conference on 3-D Digital Imaging and Modeling, Montreal, QC, Canada, 21–23 August 2007; pp. 435–442. [Google Scholar]
  32. Lodha, S.K.; Fitzpatrick, D.M.; Helmbold, D.P. Aerial lidar data classification using expectation maximization. In Proceedings of the SPIE Electronic Imaging 2007, San Jose, CA, USA, 28 January 2007. [Google Scholar] [CrossRef] [Green Version]
  33. Grilli, E.; Ozdemir, E.; Remondino, F. Application of machine and deep learning strategies for the classification of heritage point clouds. Int. Arch. Photogramm. Remote Sens. Spat. Inf. Sci. 2019, XLII-4/W18, 447–454. [Google Scholar] [CrossRef] [Green Version]
  34. Charles, R.Q.; Su, H.; Kaichun, M.; Guibas, L.J. PointNet: Deep Learning on Point Sets for 3D Classification and Segmentation. In Proceedings of the Conference on Computer Vision and Pattern Recognition (CVPR), Honolulu, HI, USA, 21–26 July 2017; pp. 77–85. [Google Scholar]
  35. Qi, C.R.; Yi, L.; Su, H.; Guibas, L.J. PointNet++: Deep Hierarchical Feature Learning on Point Sets in a Metric Space. In Proceedings of the Conference on Neural Information Processing Systems (NIPS), Long Beach, CA, USA, 24 January 2019. [Google Scholar]
  36. Zhang, J.; Zhao, X.; Chen, Z.; Lu, Z. A review of deep learning-based semantic segmentation for point cloud. IEEE Access 2019, 7, 179118–179133. [Google Scholar] [CrossRef]
  37. Pierdicca, R.; Paolanti, M.; Matrone, F.; Martini, M.; Morbidoni, C.; Malinverni, E.S.; Frontoni, E.; Lingua, A.M. Point Cloud Semantic Segmentation Using a Deep Learning Framework for Cultural Heritage. Remote Sens. 2020, 12, 1005. [Google Scholar] [CrossRef] [Green Version]
  38. Ji, Y.; Dong, Y.; Hou, M.; Qi, Y.; Li, A. An extraction method for roof point cloud of ancient building using deep learning framework. ISPRS—Int. Arch. Photogramm. Remote Sens. Spatial Inf. Sci. 2021, XLVI-M-1-2021, 321–327. [Google Scholar] [CrossRef]
  39. Wu, Z.; Song, S.; Khosla, A.; Yu, F.; Zhang, L.; Tang, X.; Xiao, J. 3D shapenets: A deep representation for volumetric shapes. In Proceedings of the IEEE Conference on Computer Vision and Pattern Recognition, Boston, MA, USA, 7–12 June 2015; pp. 1912–1920. [Google Scholar]
  40. Geiger, A.; Lenz, P.; Stiller, C.; Urtasun, R. Vision meets Robotics: The KITTI Dataset. Int. J. Robot. Res. 2013, 32, 1231–1237. [Google Scholar] [CrossRef] [Green Version]
  41. De Deuge, M.; Quadros, A.; Hung, C.; Douillard, B. Unsupervised feature learning for classification of outdoor 3D scans. In Proceedings of the Australasian Conference on Robitics and Automation, Sydney, Australia, 2–4 December 2013; Volume 2, p. 1. [Google Scholar]
  42. Hackel, T.; Savinov, N.; Ladicky, L.; Wegner, J.D.; Schindler, K.; Pollefeys, M. SEMANTIC3D.NET: A new large-scale point cloud classification benchmark. ISPRS Ann. Photogram. Remote Sens. Spat. Inf. Sci. 2017, IV-1-W1, 91–98. [Google Scholar]
  43. Armeni, I.; Sener, O.; Zamir, A.R.; Jiang, H.; Brilakis, I.; Fischer, M.; Savarese, S. 3D semantic parsing of large-scale indoor spaces. In Proceedings of the IEEE Conference on Computer Vision and Pattern Recognition, Las Vegas, NV, USA, 27–30 June 2016; pp. 1534–1543. [Google Scholar]
  44. Li, J. Yingzao Fashi. Dongjing; Song Dynasty of China, 1103. p. 112. Available online: https://max.book118.com/html/2017/0903/131618398.shtm (accessed on 13 October 2021).
  45. Qing Department of Qing Dynasty. Qing Gong Bu Gongcheng Zuofa Zeli; Beijing, Qing Dynasty of China, 1733. Available online: https://max.book118.com/html/2018/1107/5124101044001330.shtm (accessed on 13 October 2021).
  46. Breiman, L. Random Forests. Mach. Learn. 2001, 45, 5–32. [Google Scholar] [CrossRef] [Green Version]
  47. Available online: https://scikit-learn.org/stable/ (accessed on 13 October 2021).
  48. Huo, P.; Hou, M.; Dong, Y.; Li, A.; Ji, Y.; Li, S. A Method for 3D Reconstruction of the Ming and Qing Official-Style Roof Using a Decorative Components Template Library. ISPRS Int. J. Geo-Inf. 2020, 9, 570. [Google Scholar] [CrossRef]
Figure 1. (a) The location of the Hall of Complete Harmony; (b) the Hall of Complete Harmony.
Ijgi 11 00214 g001
Figure 2. The components comprising the Hall of Complete Harmony roof.
Ijgi 11 00214 g002
Figure 3. (a) The overview of the captured point cloud; (b) the interior of the Hall of Complete Harmony; (c) the roof; (d) the details of the roof eave.
Ijgi 11 00214 g003
Figure 5. (a) Verticality; (b) linearity; (c) roughness; (d) normal change rate; (e) planarity; (f) sphericity.
Ijgi 11 00214 g005
Figure 6. (a) The top view of the Hall of Complete Harmony; (b) the placements of the components on the xoy plane; (c) the section lines; (d) the distribution of roof components along the section line.
Ijgi 11 00214 g006
Figure 7. The local details of round tile and flat tile on the section line along (and perpendicular to) the main direction.
Ijgi 11 00214 g007
Figure 8. The extracted (a) NSD; (b) RH and (c) LHD from the section line along the main direction of the building.
Ijgi 11 00214 g008
Figure 9. The annotated point clouds of Hall of Complete Harmony roof.
Ijgi 11 00214 g009
Figure 10. The selected test data and train data.
Ijgi 11 00214 g010
Figure 11. The segmentation results based on the feature vector based on the scales combination of s 0 + s 1 + s 2 .
Ijgi 11 00214 g011
Figure 12. The comparison of average F1_score with different features.
Ijgi 11 00214 g012
Figure 13. The comparison of classification accuracy with different features.
Ijgi 11 00214 g013
Figure 14. The F 1 _ score of each class based on the single-scale features.
Ijgi 11 00214 g014
Figure 15. The F 1 _ score of each class based on the optimal feature vector and the feature vector including geometric features and proposed features at the.
Ijgi 11 00214 g015
Table 1. The used regular geometric features.
FeaturesFeature DescriptionFormulas
LinearityIt can distinguish the ridge. λ l = λ 1     λ 2 λ 1 (2)
PlanarityIt can facilitate the identification of lianyan and rafter. λ p = λ 2     λ 3 λ 1 (3)
SphericityIt reflected the shape of baoding, round tile and zoushou. λ s = λ 3 λ 1 (4)
Normal change rateIt was used for classifying the ridge, round tile and flat tile. λ c = λ 3 λ 1   +   λ 2   +   λ 3 (5)
VerticalityIt was essential to distinguish ridge, rafter and lianyan. λ v = 1 n z (6)
RoughnessIt highlighted the surface of taoshou. λ r = | A x   +   B y   +   C z   +   D | A 2   +   B 2   +   C 2 (7)
Table 2. Experimental data.
ZoushouRidgeFlat TileBaodingTaoshouLianyanRafterDrip TileRound Tile
Train data25,812253,541453,61680,59119,41420,28619,00524,5141,105,952
Test data48,2431,561,2842,731,81893,81323,208164,130173,129179,8366,759,117
Table 3. The experimental results based on different scales only relying on the regular geometric features.
Scales CombinationMetricsZoushouRidgeFlat TileBaodingTaoshouLianyanRafterDrip TileRound TileAverage
Value
s0precision0.550.750.580.860.10.750.780.690.830.654
recall0.470.390.750.970.050.740.690.620.820.611
F10.50.520.660.910.070.740.730.650.820.622
OA 0.741
s1precision0.680.850.810.920.110.810.770.750.890.732
recall0.60.570.930.930.050.810.740.710.910.694
F10.640.680.860.930.070.810.750.730.90.708
OA 0.858
s2precision0.770.940.780.930.260.760.810.780.90.770
recall0.880.830.850.940.140.740.720.770.90.752
F10.820.880.810.930.180.750.760.780.90.757
OA 0.871
s3precision0.770.950.70.980.350.850.860.830.890.798
recall0.830.90.750.950.190.820.780.780.880.764
F10.80.920.730.960.250.830.820.80.880.777
OA 0.846
s0 + s1precision0.580.860.830.930.20.820.790.710.920.738
recall0.550.730.930.920.110.790.660.750.920.707
F10.560.790.880.920.140.810.720.730.920.719
OA 0.884
s0 + s1 + s2precision0.770.960.870.960.450.850.840.810.950.829
recall0.890.890.950.910.260.80.70.850.940.799
F10.820.920.90.930.330.820.760.830.950.807
OA 0.925
s0 + s1 + s2 + s3precision0.870.970.880.980.550.920.930.870.970.882
recall0.940.960.950.940.30.890.820.90.950.850
F10.90.960.910.960.390.90.870.890.960.860
OA 0.944
Optimal feature vectorprecision0.750.970.850.970.40.880.880.840.960.833
recall0.950.950.920.960.660.870.810.860.930.879
F10.830.960.890.970.50.870.850.850.950.852
OA 0.929
Table 4. The experimental results based on different scales and features.
Scales CombinationMetricsZoushouRidgeFlat TileBaodingTaoshouLianyan RafterDrip TileRound TileAverage
Value
s0precision0.450.940.910.980.650.890.950.810.960.838
recall0.910.870.950.980.530.920.880.810.950.867
F10.60.90.930.980.590.910.910.810.950.842
OA 0.935
s1precision0.470.960.920.980.750.930.930.860.970.863
recall0.930.90.970.980.510.930.920.860.960.884
F10.620.930.940.980.610.930.920.860.960.861
OA 0.949
s2precision0.720.980.930.980.850.920.950.880.970.909
recall0.930.950.960.980.640.910.920.890.970.906
F10.810.960.950.980.730.910.930.880.970.902
OA 0.96
s3precision0.630.970.910.980.790.920.950.880.970.889
recall0.940.960.950.980.590.930.910.890.960.901
F10.8750.970.930.980.680.930.930.890.970.892
OA 0.953
s0 + s1precision0.750.980.940.990.820.940.950.910.980.918
recall0.960.980.960.990.630.910.920.910.970.914
F10.840.980.950.990.710.930.940.910.980.914
OA 0.966
s0 + s1 + s2precision0.740.980.930.980.820.960.960.930.980.920
recall0.970.980.970.990.750.940.930.920.970.936
F10.840.980.950.980.780.950.940.920.980.924
OA 0.968
s0 + s1 + s2 + s3precision0.790.980.930.980.810.950.960.920.980.922
recall0.970.980.970.980.710.940.920.930.970.930
F10.870.980.950.980.750.950.940.920.970.923
OA 0.966
Optimal feature vectorprecision0.550.970.930.980.490.920.860.850.980.837
recall0.960.960.960.960.820.890.840.850.970.912
F10.70.970.950.970.610.90.850.850.970.863
OA 0.96
Publisher’s Note: MDPI stays neutral with regard to jurisdictional claims in published maps and institutional affiliations.

