1. Introduction
Due to the rapid advances in technology, and the disruptive expansion of industrial sites and manmade structures, modern society has witnessed startling transitions in land utilization, from natural green spaces and other agricultural areas, e.g., forest, horticulture, and crop fields, into various forms of buildings, e.g., factories, commercial arcades, and residences [
1,
2,
3]. In fact, city planning regulations are normally implemented that specifically determine how land in an area may be utilized, mainly to control and prevent adverse consequences. In addition, these regulations often address the zoning of appropriate areas [
4,
5,
6]. One of their most important provisions is the designation of the minimum size and number of green spaces to be provided in each area [
7,
8,
9]. In particular, because factories are one of the primary sources of various environmental problems, e.g., air pollution, dust particles, smoke, and odor pollution [
10,
11,
12], a specified quantity of green space must be maintained in areas in which factories are densely situated. These forms of pollution can be seriously harmful to the health of nearby humans and animals. In particular, Particulate Matter (PM) 2.5 is one of the critical forms of air pollution that has been progressively causing health-related problems worldwide [
13,
14,
15]. In Thailand, several local studies have shown that Bangkok and Chiangmai are most affected by PM 2.5 [
16,
17]. They also found that wildfires, building construction, electricity generation, industrial activities, and transportation play the most important roles in the PM 2.5 problem. Since PM 2.5 poses an imminent risk to public health, a short-term solution is to promote mask wearing in affected cities. However, to date, this has only temporarily lessened the personal risks. According to the recent literature on resolving the PM 2.5 problem, it is agreed that increasing green space areas, especially in cities and industrial locations, can most effectively improve the situation [
18,
19]. Research findings suggest that increasing green space areas in cities produces significant quantities of fresh air and atmospheric moisture. Moreover, trees in these areas can absorb harmful small particles. Hence, the greater the size of green space areas, the greater the reduction in these particles [
20,
21].
In current practice, expanding or controlling green space areas in Thailand is implemented via regulations. Once these regulations are issued, the authorized agencies, i.e., provincial offices, regional environment offices, and local administrative organizations, are responsible for monitoring areas within their jurisdiction [
22,
23]. In particular, they have to compile reports on green space areas based on both ground surveys and map digitization via Google Earth software [
24,
25]. Nonetheless, this method has several shortcomings. First, the method requires overwhelming human and financial resources to access and explore entire areas. This usually results in data that are too outdated to have a reasonable value. Furthermore, no standardized archiving system presently exists to enable the collaboration of various agencies. Therefore, it is not possible to synchronize this information, produce relevant reports, and publish these reports in real time. To address these issues, many attempts have been made in the literature to detect and monitor green space areas by integrating Geoinformatics and Remote Sensing (RS) technologies. To this end, various types of satellite imagery, a number of computerized visual processing algorithms, and even procedures relying on manual inspections, have recently been proposed. A review and discussion of the state-of-the-art approaches are presented in the following.
2. Review of Related Literature
Considerable research has been undertaken on developing geographical information systems (GIS) and investigating their application to green space area management. The most recent literature on the topic has been thoroughly reviewed and grouped into three main categories. These are: the detection and monitoring of green space areas and their changes by means of satellite image analysis; determining suitable sites for the development of green space areas; the implementation of green space area databases and relevant software applications. Detailed insights and a discussion of the most recent advances are presented below.
To remotely examine green space areas, a range of satellite imaging modalities have been employed, e.g., Landsat [
26,
27,
28], Sentinel-2 [
29,
30,
31,
32,
33,
34], and multimodal fusion between SPOT and Sentinel-2 [
35]. In [
34], exposure to green space at the national scale was assessed across 303 cities in China. It was shown that the green space provisioning policy played an important role in the coverage (or inequality) of green space. When analyzing Landsat 8 images, for instance, the Normalized Difference Vegetation Index (NDVI) is often suggested for differentiating green space from urban areas within the study region [
26,
27]. Although they have been found to be viable, these methods are unable to delineate smaller areas, such as private property and small public parks, due to the limited spatial resolution of Landsat. Moreover, they lack an interoperable digital platform that enables real-time data analysis and presentation. Another imaging modality that has attracted significant interest, especially for this application, is Sentinel-2. Several machine learning (ML) strategies have been adopted in the analyses. For instance, the Support Vector Machine (SVM) and Marine Predators Algorithm (MPA) have been adopted to differentiate between green space and non-green space areas, with 93% accuracy. Another study taking a similar approach uses Maximum Likelihood Classification (MLC) to classify Land Use and Land Cover (LULC) into four groups, i.e., water, tree cover, impervious, and non-woody vegetation [
30]. Of these groups, tree cover and non-woody vegetation are considered green space. In that study, a comparison between classified LULC with digitization is presented, but accuracy assessments are not reported. In addition to NDVI, other variants of normalized difference indexes have also been considered. For instance, the Normalized Difference Built-up Index (NDBI) was found to be capable of detecting green and non-green spaces [
33]. In their study, the ratio between green and non-green space areas is displayed on a map. As in the previous work, however, numerical assessments of detection accuracies are not reported. Another research group analyzed Sentinel-2 images and classified them into four LULC groups [
32]. Unlike in [
31], these groups are water, built-up, vegetation, and bare soil, and only vegetation is considered green space. The study’s notable feature is the fusion of data between different imaging modalities. More specifically, the results obtained from Sentinel-2 image analysis were then correlated with those from Green View Index (GVI) analysis of Street View pictures. Using this approach, the accuracy of green space area detection was greatly improved. However, the correlation between these modalities relies on manual mapping because a dedicated platform for data management is not implemented. Moreover, the resultant reports cannot be queried for specific criteria or in real time.
Further research developed a technique for LULC detection for the monitoring of urban area expansion and the reduction in green space areas [
35]. With this technique, satellite imagery acquired by SPOT and Sentinel-2 were analyzed. In their experiments, LULC classification accuracy was as high as 90%. However, the technique was impeded by the relatively low spatial resolution of the modality, i.e., at only 10–20 m. In addition, green space areas at specific locations, especially those privately owned, could not be verified. Their platform was also unable to store and visualize data in real time.
The issue concerning the use of analytical methods to determine appropriate areas for green space development has been addressed in the literature. These methods focused on areas that would allow public access to green spaces. A notable work [
36] taking this approach integrated GIS with Analytical Hierarchical Processing (AHP) to determine an optimal weight for each contributing factor. The weights considered were LULC, distance from road, distance from historical place, distance from park, distance from stream, slope, and soil type, and population density. The resultant weighted combination categorized an area into four levels of suitability for development, i.e., from the most suitable to the least suitable. Another important work in this field [
37] applied GIS to analyze the relationship between the distance of residents from green space areas and their quality of life. These findings are beneficial for the management and planning of individual green space areas.
Similar to this research, a database management system for green space areas has previously been developed [
38,
39]. In that work, a GIS software package was utilized for digitizing the areas from high-resolution satellite images. Digitalization accuracy was assessed and confirmed with the use of GPS devices to conduct ground surveys at target locations. Although the accuracy reported was as high as 95%, the study was undermined by several factors. Firstly, it is well accepted that manual digitization is prone to errors, and is tedious and time consuming. Because the platform did not allow the public or other users to contribute to the task, updating the statuses of the exhaustive green spaces imposed a regular and tremendous workload and level of accountability on the agency in charge. Furthermore, the data were unable to be published to interested parties in real time. Therefore, any planning or decisions that were made based on the current presentation, may have been outdated immediately.
To alleviate existing problems and limitations, this paper proposes a novel geospatial system for managing green space areas, based on GIS and DL technologies. The main purposes for this system were to monitor and control changes in land utilization that could have an environmental impact. Thus, the aim of this study was to develop a geospatial platform for green space area management that would enable interested parties to participate in the exchange of relevant information. Emphases were placed on the reliability of public data, their seamless integration with official reports, and their coverage, so as to veritably support managerial decision making and planning. The developed system is self-contained and covers basic functions, e.g., secured authentication, role-based user management, graphical interface tools for area digitization, and augmented maps for real-time reports and visualization. In addition, since the system relies on crowdsource data, it therefore features artificial intelligent (AI)-based data screening and verification to maintain data integrity. More specifically, our main contribution was to adopt a recent yet fully developed deep learning architecture to pre-screen user-submitted green space areas, based on their photograph, to remove any erroneous or irrelevant submissions. Furthermore, before these submissions can be committed into the databases, the areas are subjected to additional automated verifications through satellite image analysis and LULC data. Emphases were placed on relieving the administrator from having to inspect large amount of data, accelerating data management, and enhancing report generation in real time.
3. Materials and Methods
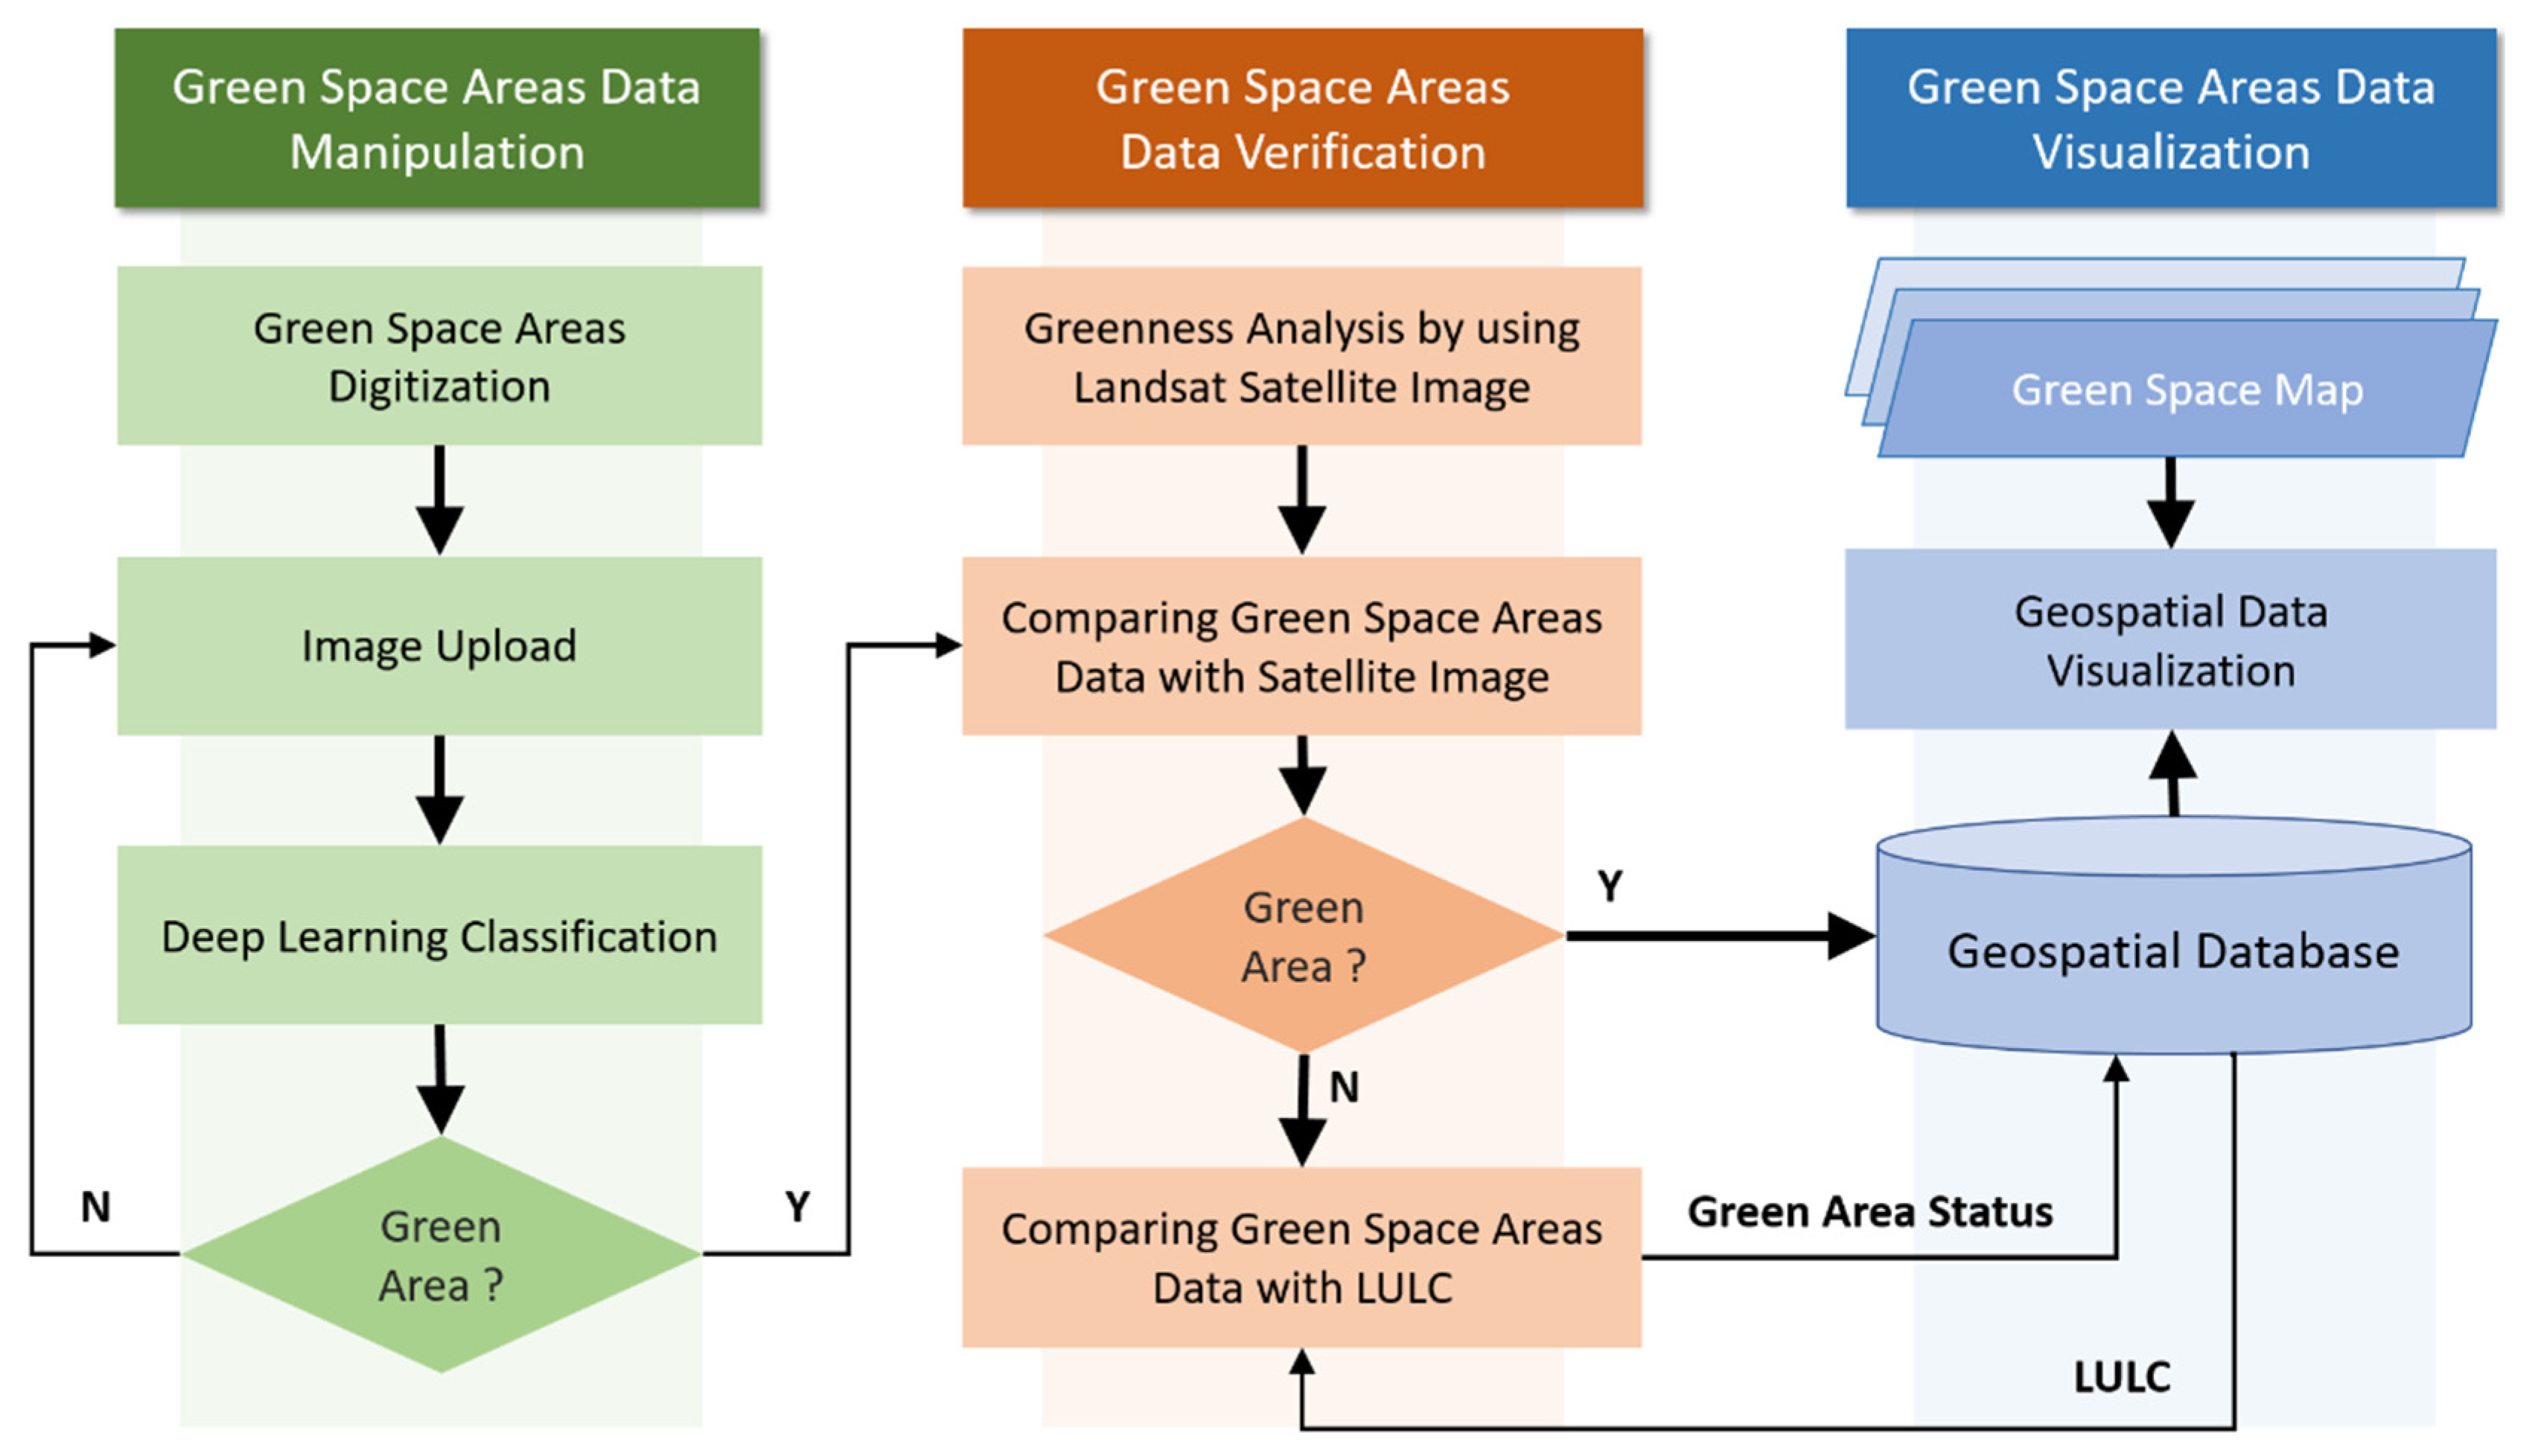
The conceptual diagram of the proposed green space areas’ management platform is depicted in
Figure 1. The first module allowed for submission of green space data by their users, by means of map digitalization. Associated green space attributes and the photograph taken at the area were then uploaded to the system. Initial pre-screening was conducted through automatic classification on this photographs using deep learning algorithm. If the photograph was found to not contain any green space areas, the submission was denied and users were able to resubmit another that did. Then, the successful submission was added to the system with its geolocation. Subsequently, the second module verified this record once again by fusing Landsat 8 satellite image at coinciding geolocation with user digitized area. If the greenness value within the area was not less than a specified criterion, it was confirmed as a green space area and then stored in the database. Otherwise, it was subject to verification against LULC data by a system administrator. The third module involved back-end data management and visualization. This featured intuitive geospatial reporting and visualization. The detailed descriptions and analyses of these modules are provided in the following subsections.
3.1. Data Collection and Preparation
In the experiments and development of geospatial platform in this study, data of green space areas have been employed, consisting of both spatial and attribute data. These included data submitted by users, acquired from Landsat 8 satellite images, provided by Google Earth Engine data catalogue, and official ground surveys. Their detailed descriptions are listed in
Table 1. To elucidate the merits of the system, Surat Thani was chosen as study area. This is because the city hosts a number of industrial sites where factory buildings and manufacturing plants are located. Hence, this area requires the most up to date data of green space areas to derive the management scheme that conform to government specifications.
3.2. Green Space Image Classification
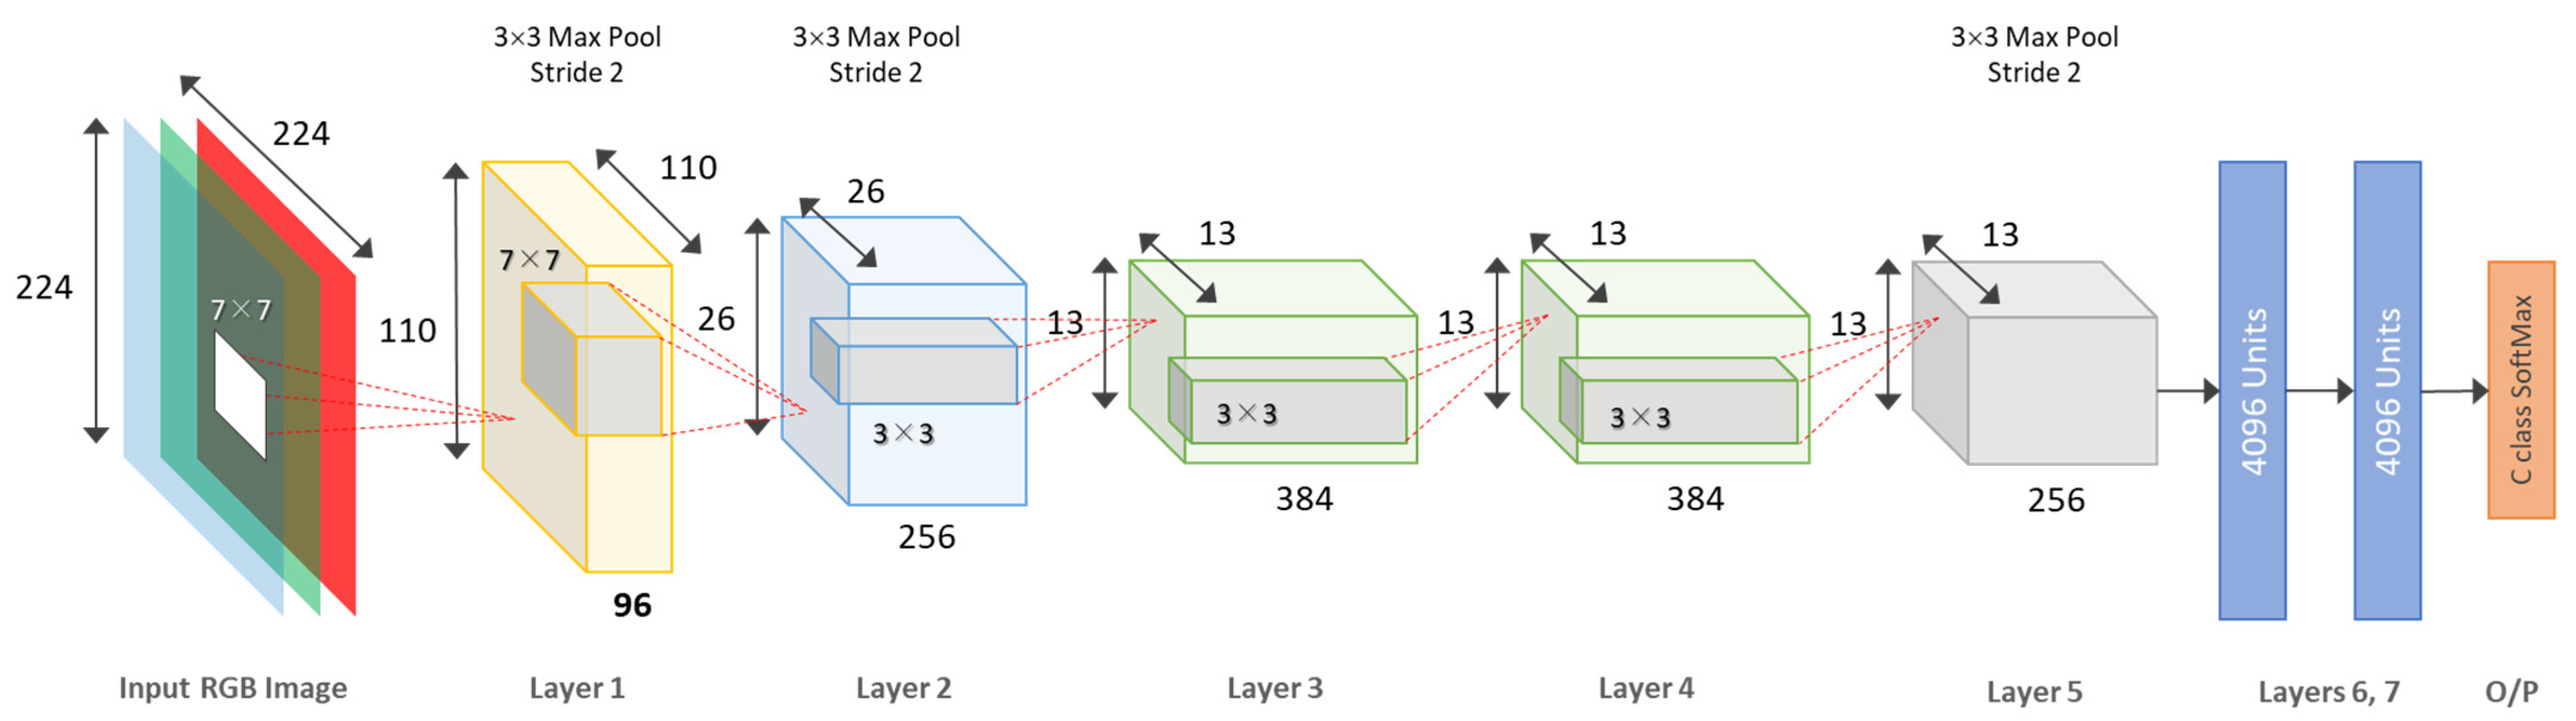
To ensure validity of geospatial data, this research adopted deep learning technique to inspect user-uploaded images and determine whether they were of green space areas. Indeed, there are quite a few studies in the literature that similarly made an initial pre-screening in various applications, for instances, oil-palm plantation areas’ identification [
40], flood [
41] and wildfire incidents’ verification [
42], etc. In the current setting, the ZFNet deep learning model [
43], as depicted in
Figure 2, was employed. The model was trained with 1000 images of both green space and non-green space areas, obtained from Google image indices. Each image consisted of 224 × 224 pixels so as to match ZFNet input layer. The number of target classes (
num_classes,
C) was set to 2, i.e., green space and non-green space. Their labels were tagged by Google image search indices. To control how the neural network adjusted its weights, learning rate (
learning_rate) and acceleration (
momentum) were set to 0.01 and 0.9, respectively. The model reached its optimum at 100 iterations (
epochs). The resultant model was validated by using 10-fold cross-validation and tested against images in both groups; each consisted of different 100 instances. The accuracy assessment of the deep learning model was then made by comparing its classification with visual annotation. If the photograph was in fact of green space area, an uploaded image and its actual geolocation were admitted to the database.
It is worth emphasizing that classification accuracy short of 100 percent is inadequate in practice. Therefore, after pre-screening, each green space image was subjected to additional 2-step verification, i.e., by image-based greenness analysis and/or manual inspection, as described in the following subsections.
Advantage of AI was that it relieved an operator of the initial screening against invalid submissions. In fact, a prominent DL model can be chosen as an alternative, with varying accuracies. However, any misclassification would be rectified during subsequent verifications. Therefore, benchmarking their performance falls out of scope of this paper.
3.3. Greenness Analysis and Verification
For an uploaded submission, its geolocation was used to query the corresponding Landsat 8 images. Then, the proposed system computed its NDVI statistics within the corresponding user digitized area, at a specific time interval. The values that indicated the greenness ratio of the area were normalized between 0 and 1. The higher the values, the more the greenness ratio present in the area. As the first step of verification, if user-submitted data correlated well with the corresponding greenness ratio by NDVI analysis, the system would automatically update the status of that entry to being a green space area, otherwise, its status remained unchanged. The update made at this stage would be further verified manually by the system administration, as described in the following sub-section.
3.4. Green Space Area Verification by Administrator
This stage of verification was required to maintain data integrity, especially in a case where user-submitted green space area did not correlate with greenness results after satellite image analysis at the coinciding location. This could result from misclassification, satellite data not being up to date, or, simply, an intended misuse of the system. To confirm that the submitted data were indeed of green space areas, the proposed system presented the administrator with the current land use and land cover data, with which they could compare, and approve the submission, accordingly. Alternatively, in the absence of such data, onsite expedition or survey report could be considered instead.
3.5. System Analysis and Design
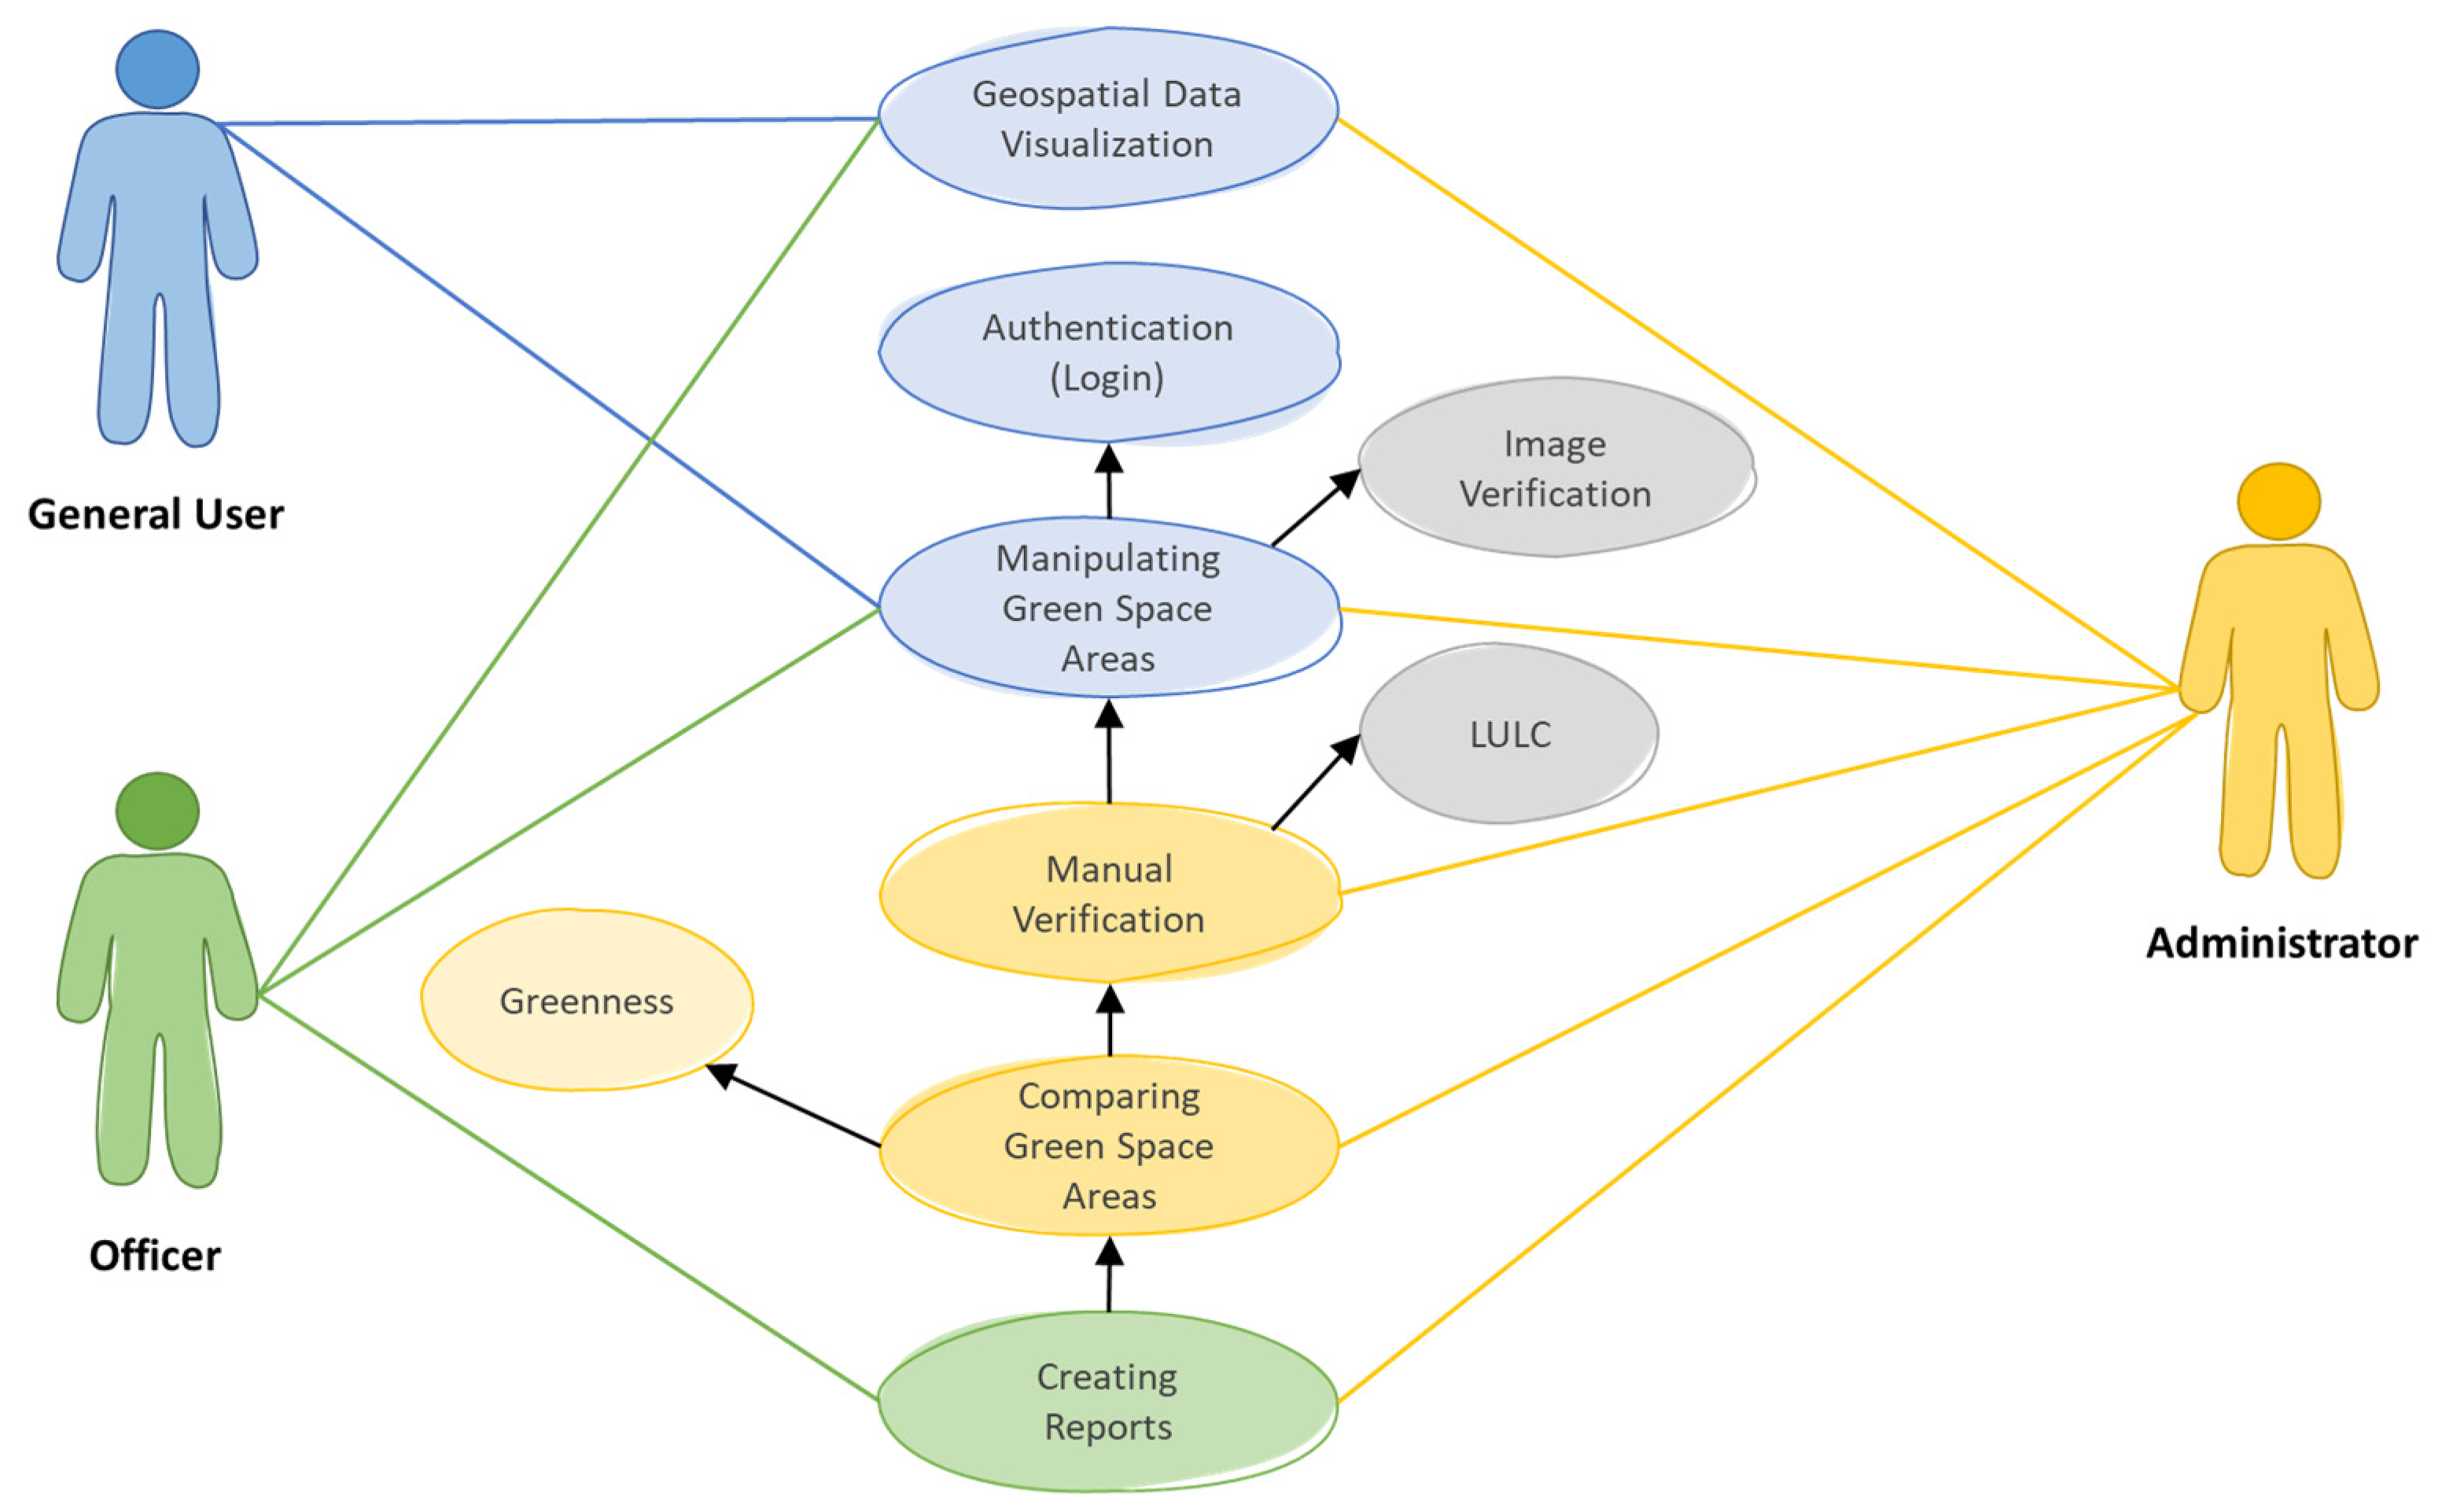
With the proposed system, users were categorized by their roles into three groups, which were general user, officer, and administrator. Following scenario analysis, the respective use case diagram is derived and illustrated in
Figure 3.
Firstly, a general user can make a spatial query regarding green space areas without having to log in to the system. However, should they require to modify (i.e., add, edit, and delete) their previously submitted data, authentication is needed. In this case, the data stored by other general users are not affected. An officer maintains a similar set of roles as a general user and has the ability to generate reports on green space areas. Holding the highest privilege, an administrator can perform all functions available to both a general user and an officer. Moreover, they can verify and approve the status of green space areas, suggested by either of the other groups. To this end, land use and land cover data are taken into account, with or without onsite survey, to ensure the validity of (user-provided) data and, thus, the system’s integrity is maintained.
The geospatial system was then implemented by using various computerized tools and language as follows. All relevant data, including spatial data, were stored in and managed by coupled PostgreSQL and PostGIS databases. The application was web-based and written in Python language with Node.js, Leaflet, and JavaScript frameworks and TensorFlow library.
4. Results
This section presents the experimental results and demonstrates the merits of the proposed system. It is divided into three parts, which are the classification of green space areas using deep learning, geospatial platform for managing green space areas, and greenness analysis of the green space areas.
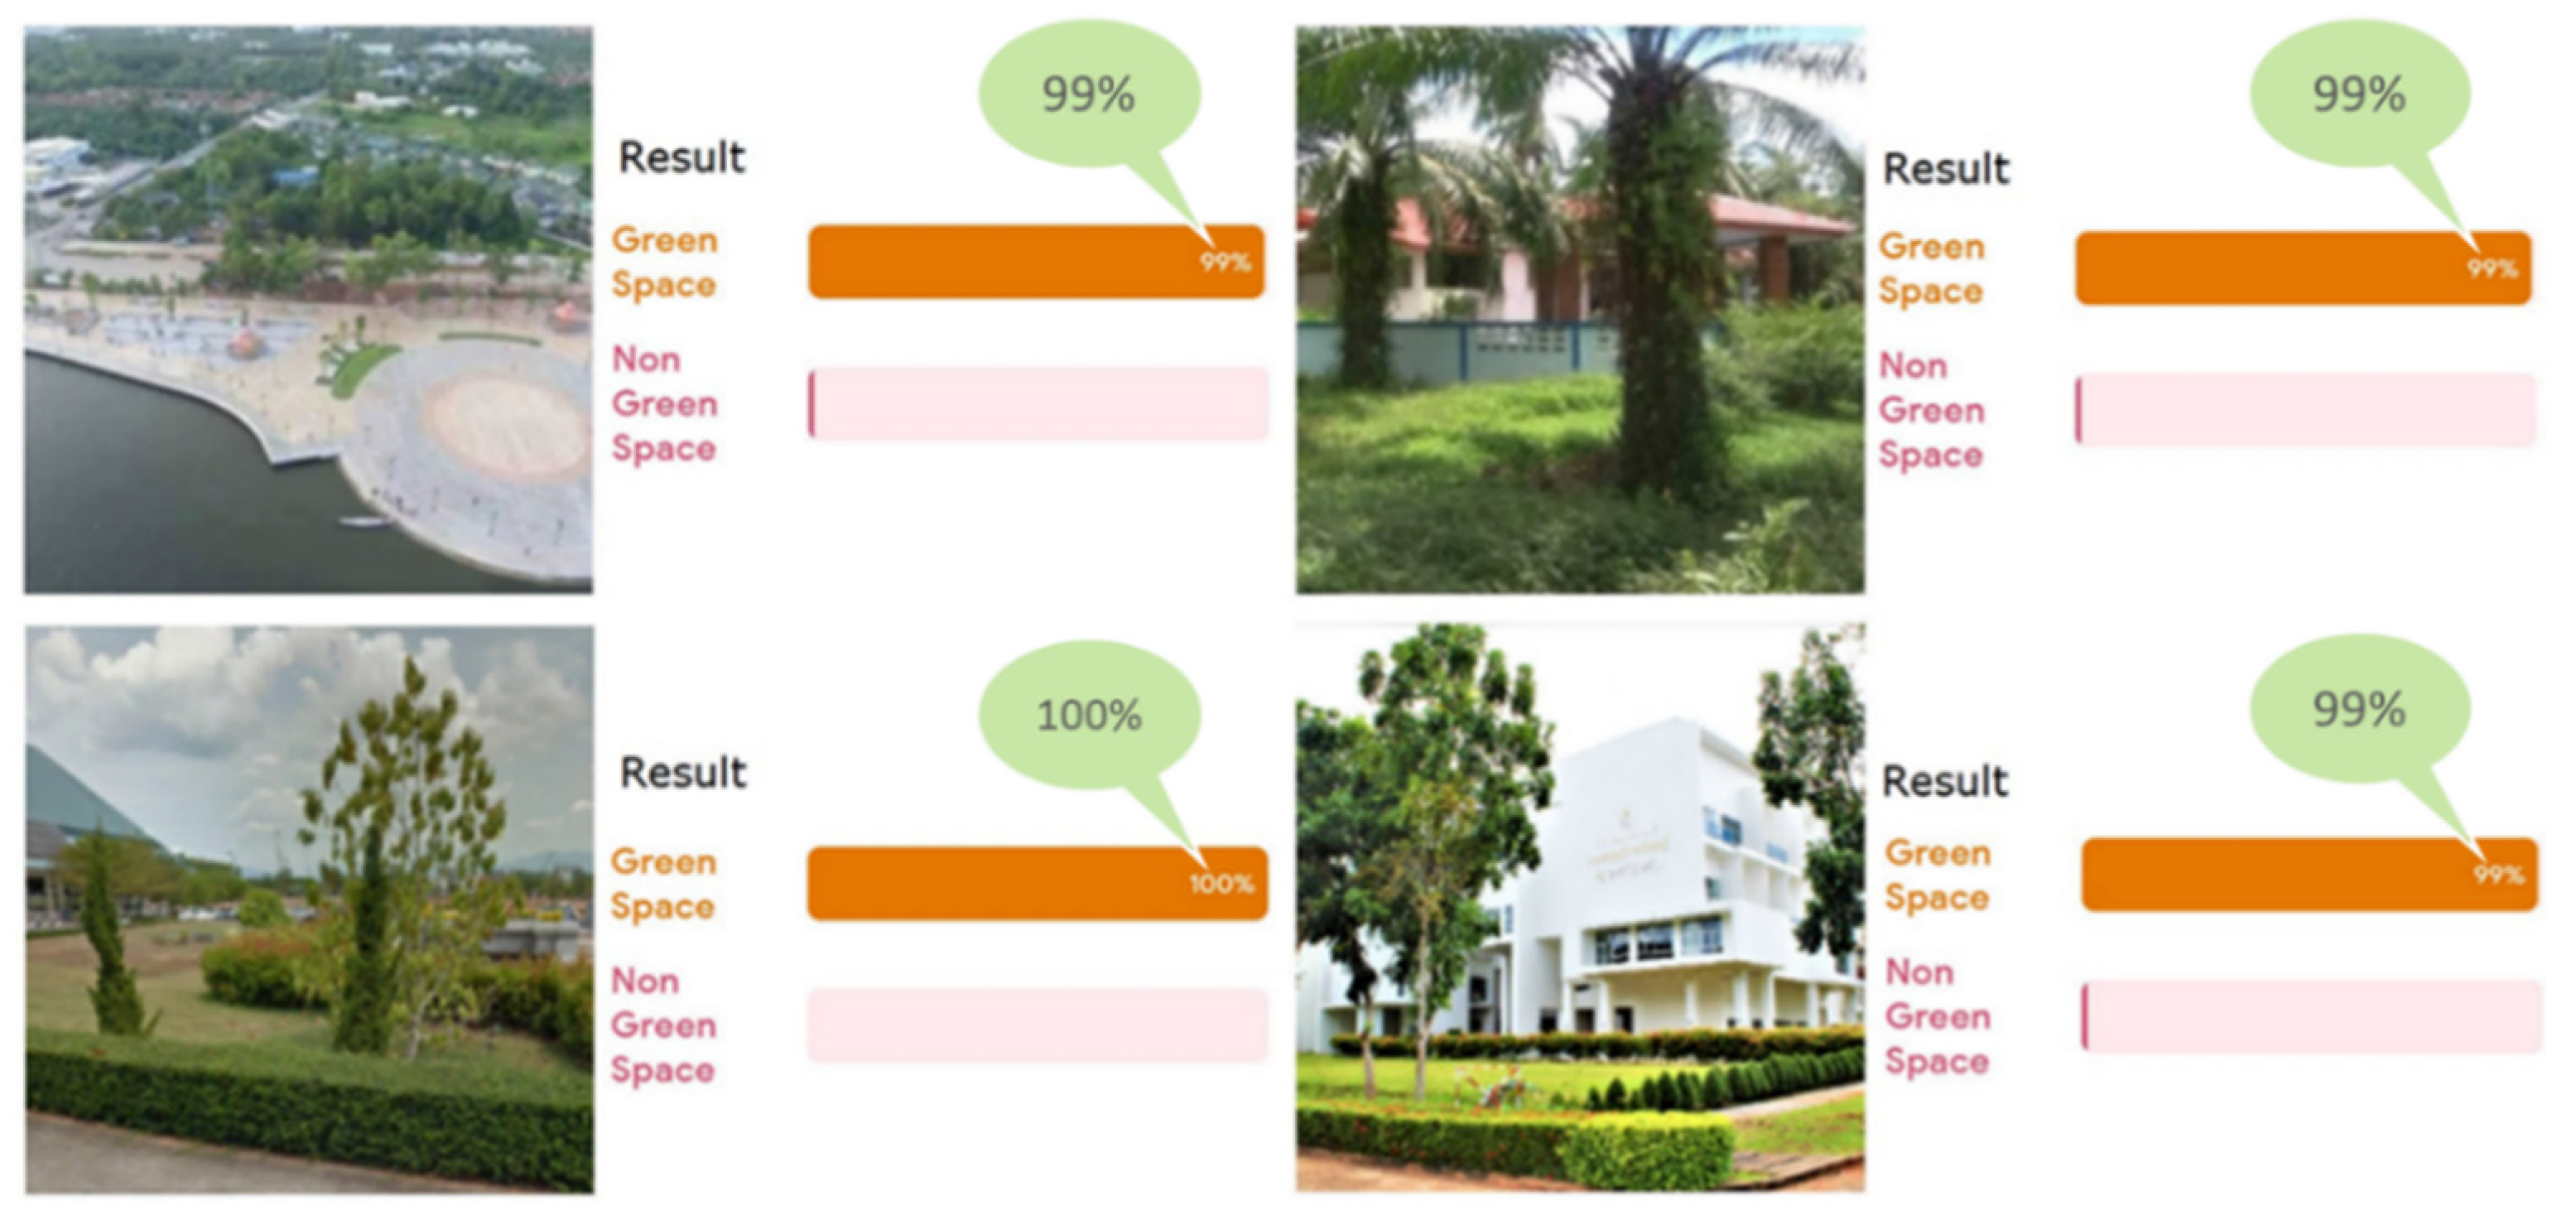
As an initial screening, a user-uploaded image was first classified into either of the two classes, i.e., Green Space or Non-Green Space. Selected classification examples are shown in
Figure 4 and
Figure 5. In the former, there are various green space areas present at the scene, such as a public park, agricultural plot, and bailey, whereas in the latter, there is a manmade construction site, house, building, and airport surroundings. To validate this classification, the results were compared against field survey data. The accuracy assessments are reported in
Table 2. It was found that the overall accuracy was 93.50% (92.50%) with 0.87 (0.85) Kappa. As for individual classes, the precision (user’s accuracy) of the non-green space areas’ classification was 94.86% (93.81%), higher than that of the other class, 92.23% (91.26). However, the recalls (producer’s accuracy) were contrary to this result, with values of 92.00% (91.00%) and 95.00% (94.00%), respectively. The numbers before and inside the parentheses show the results from the seen (1000 images) and unseen (100 images) datasets, respectively. It is evident from these results that deep learning classification was an effective means of pre-screening user-submitted images; hence, it was able to relieve the system administrator of having to eliminate a large amount of irrelevant data.
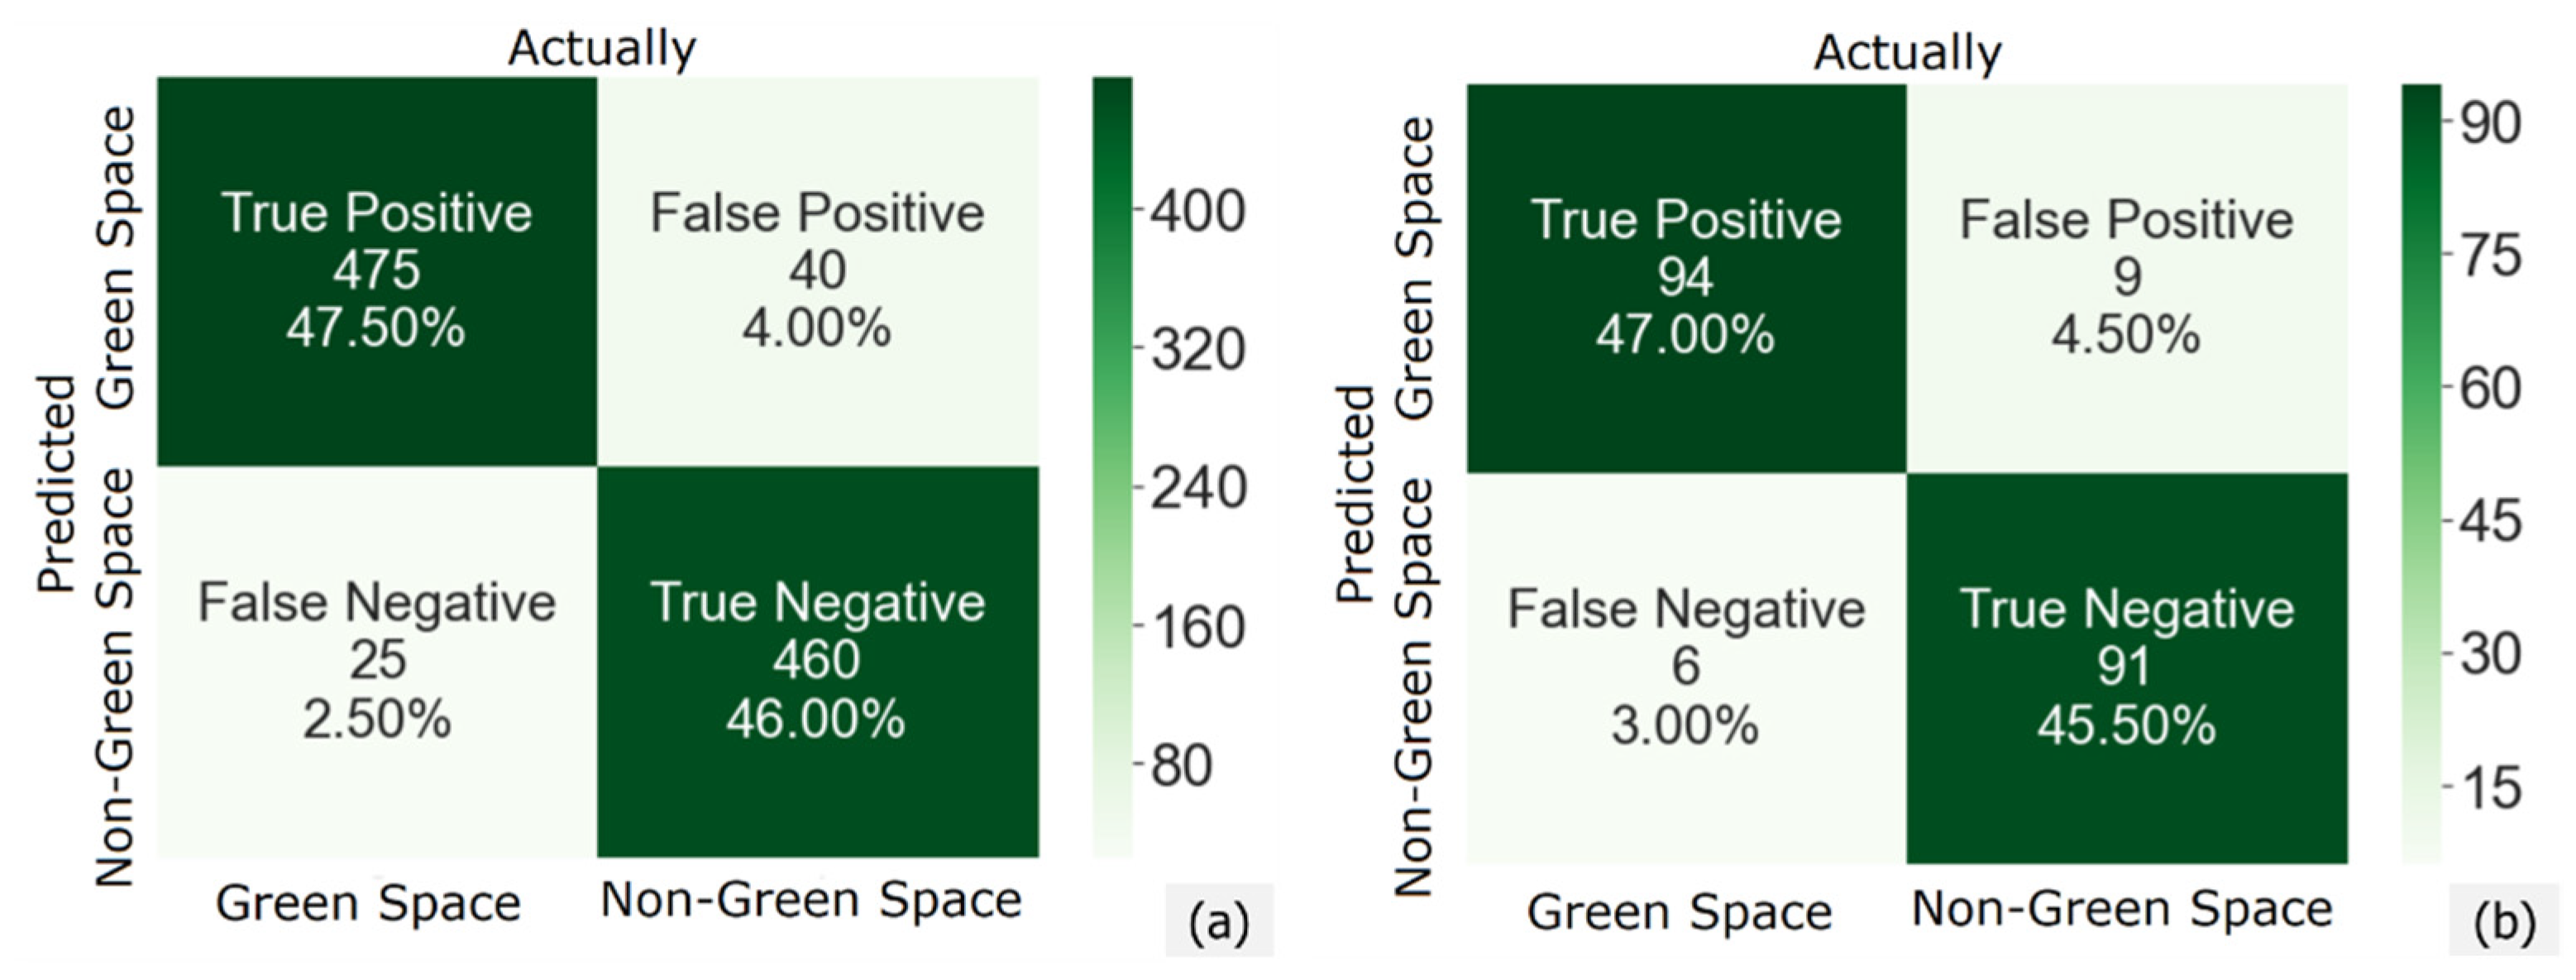
Analyses by means of a confusion matrix of the labelling of the two classes are presented in
Figure 6. DL initial screening was tested on 1000 images drawn from the training set. This contained images of green (500) and non-green (500) areas. The positive class is selected to be the green space areas.
Figure 6a shows the numbers of correctly classified instances as 475 (47.50% true positive, TP) and 460 (46.00% true negative, TN), for green and non-green spaces, respectively. The number of images incorrectly classified were 25 (2.50% false negative, FN) and 40 (4.00% false positive, FP), which was able to be predicted as they were the opposite classes. Likewise, the same network was also tested on 200 images from the (unseen) dataset. This consisted of 100 images per class.
Figure 6b shows the number of correctly classified instances as 94 (47.00% TP) and 91 (45.50% TN), for green and non-green spaces, respectively. Those incorrectly classified were 6 (3.00% FN) and 9 (4.50% FP) instances, able to be predicted due to being the opposite classes.
To demonstrate the merits of the geospatial platform for managing green space areas, a number of practical modules are evaluated and discussed below. Firstly, a user logs into the system by providing their login name and password. After valid authentication, the user is associated with a role, previously registered to their account, as described in
Figure 3. In addition, all previously submitted data, updates, and verifications are uniquely indexed to their identification. However, a non-member (or a general user) has no registered account. Therefore, they can only make a query and visualize stored green space areas but are unable to manage or make any change to these data.
Once logged into the system, the user is redirected to its main web page, from which four main functionalities are presented, as displayed in
Figure 7. These functions are data manipulation, visualization, verification, and report generation. However, access rights to these functions are granted on the basis of the role-based policy. With data manipulation, both spatial data and attribute data can be managed. A green space area can be digitized on the map by using the provided drawing tools (left). The drawn area can then be associated with attribute data, i.e., green space types, total area, green space area, geolocation (latitude and longitude), and the photograph of the surroundings taken onsite. Upon submission, the photograph is analyzed by the abovementioned deep learning module. Unless it is classified as (containing) a green space area, the user is alerted by a warning message and has to submit a new photograph. Once completed, all submitted data are stored in the database and displayed on the screen. In addition, if the area is annotated as a green space area, its geolocation is subsequently used to make a spatial query into the corresponding Landsat 8 image, by which the greenness of the coinciding area is analyzed. If its greenness value is no less than 0.50, the green space area is successfully verified and rendered accordingly, when invoking visualization. Otherwise, it is set as pending manual verification by a system administrator.
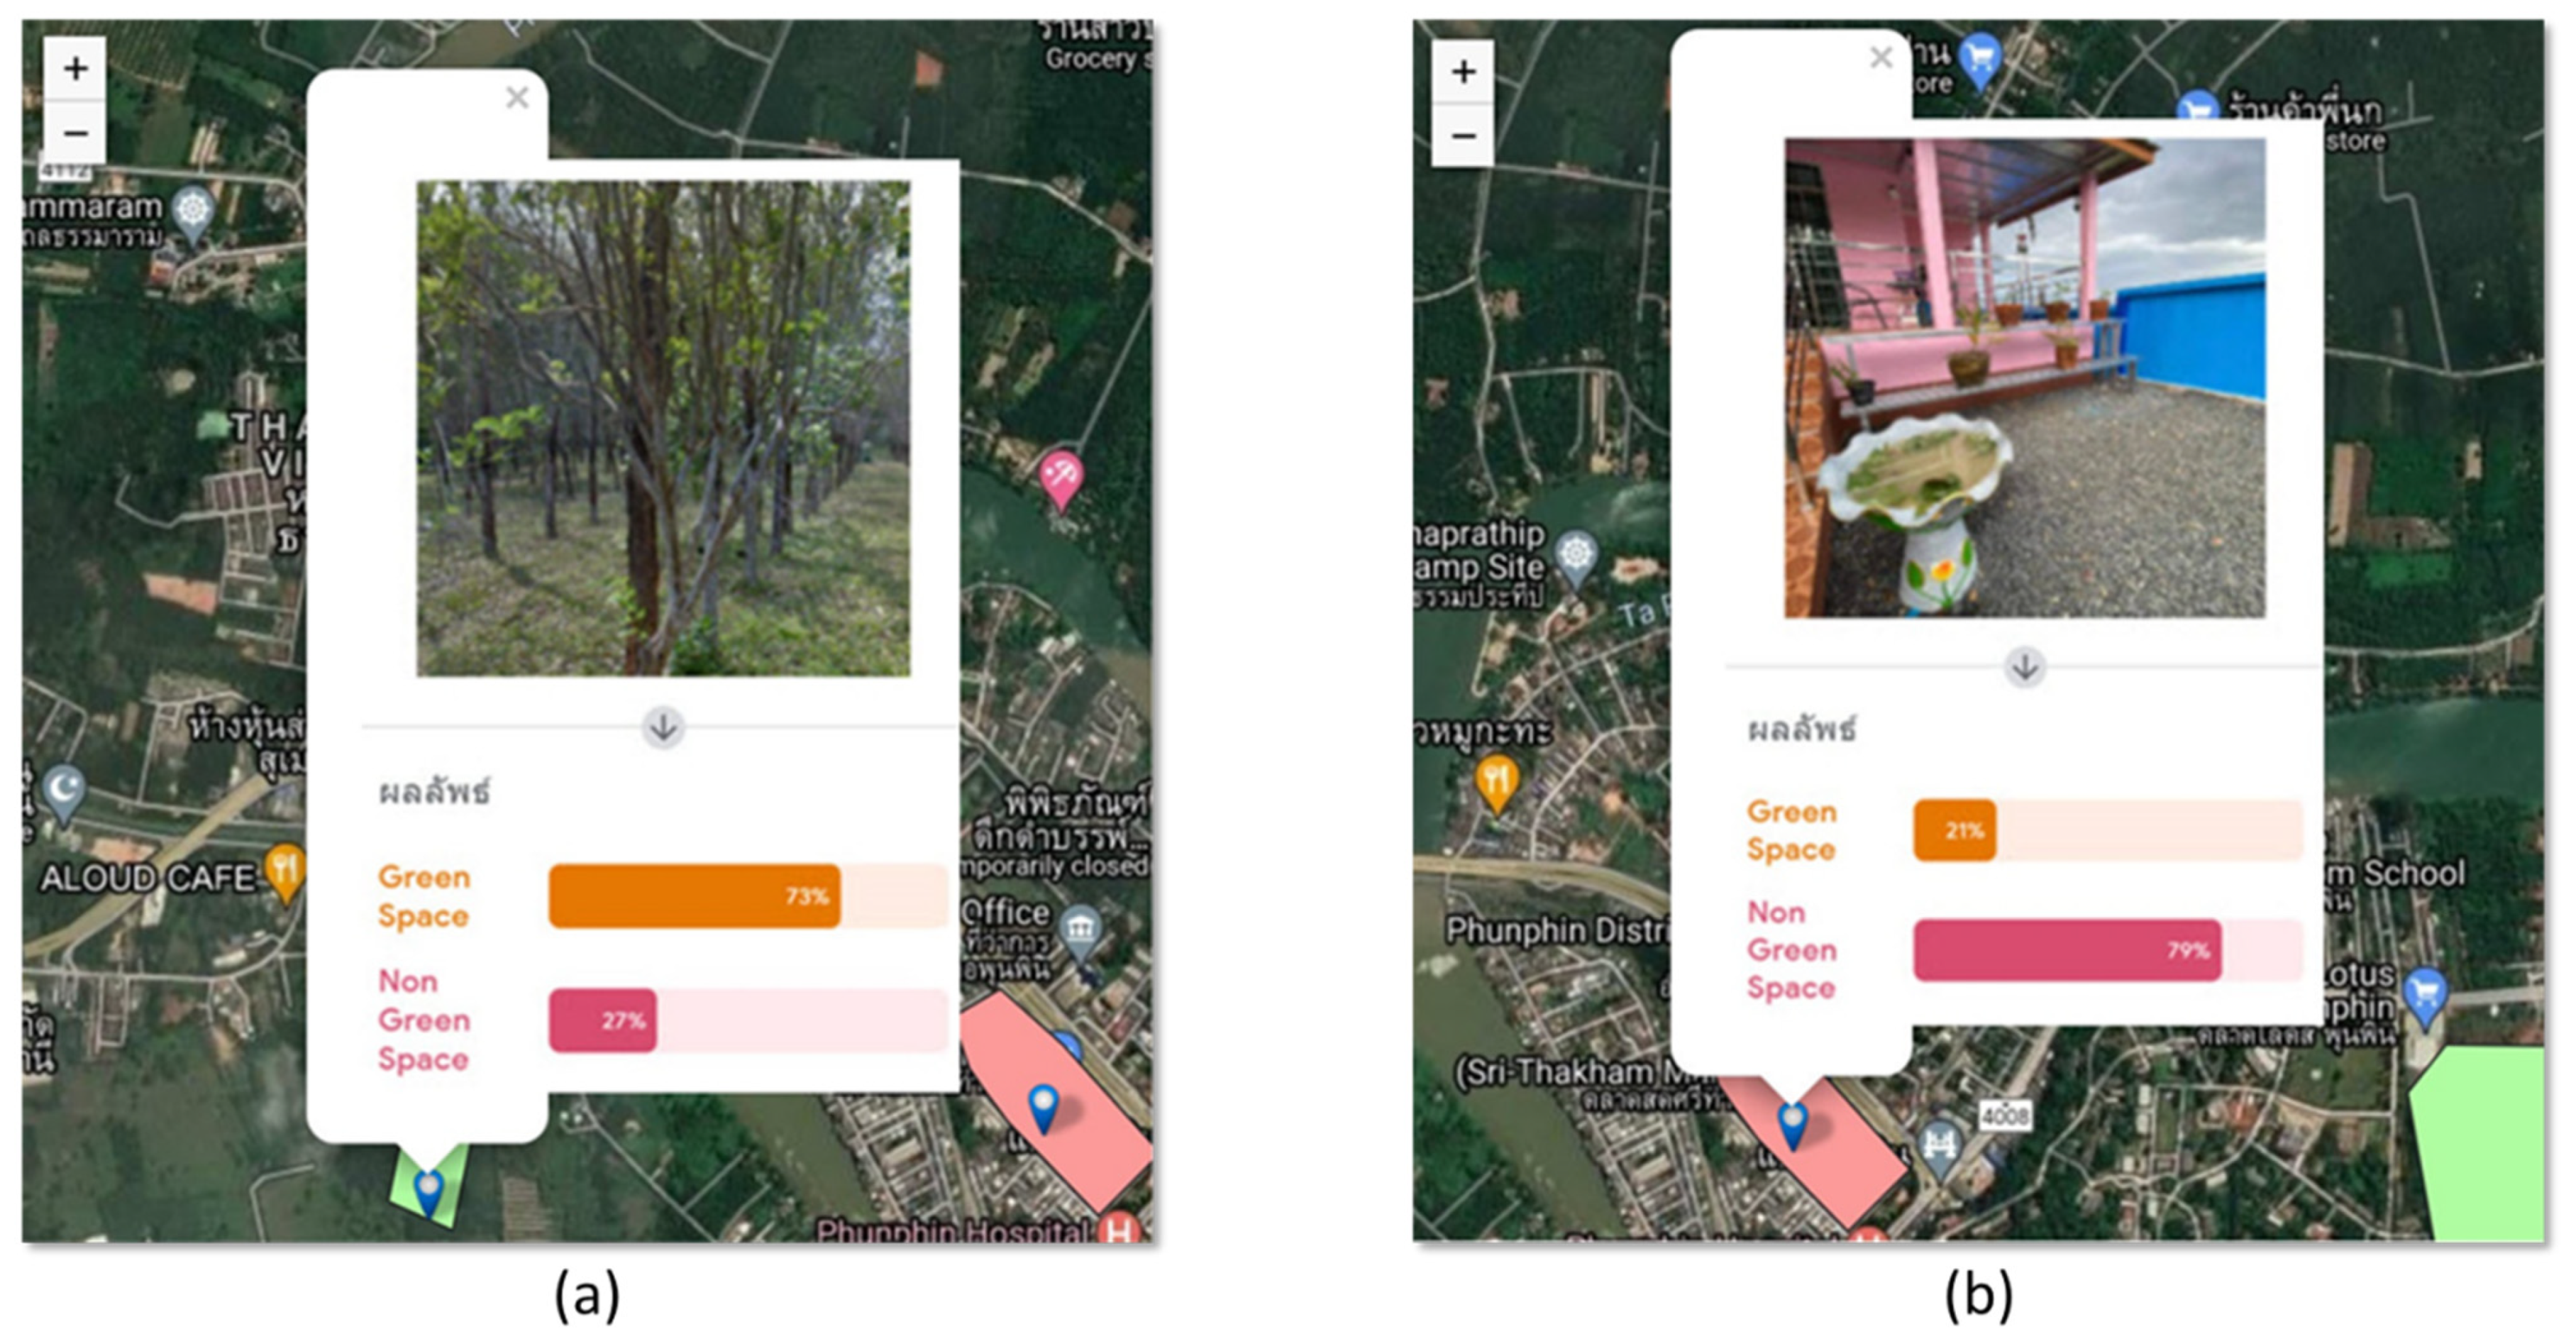
Data verification processes are illustrated in
Figure 8 and
Figure 9. Two selected examples of initial classification by deep learning are shown in
Figure 8a,b. The former photograph is of an area that contains green space, while the latter is of an area that did not.
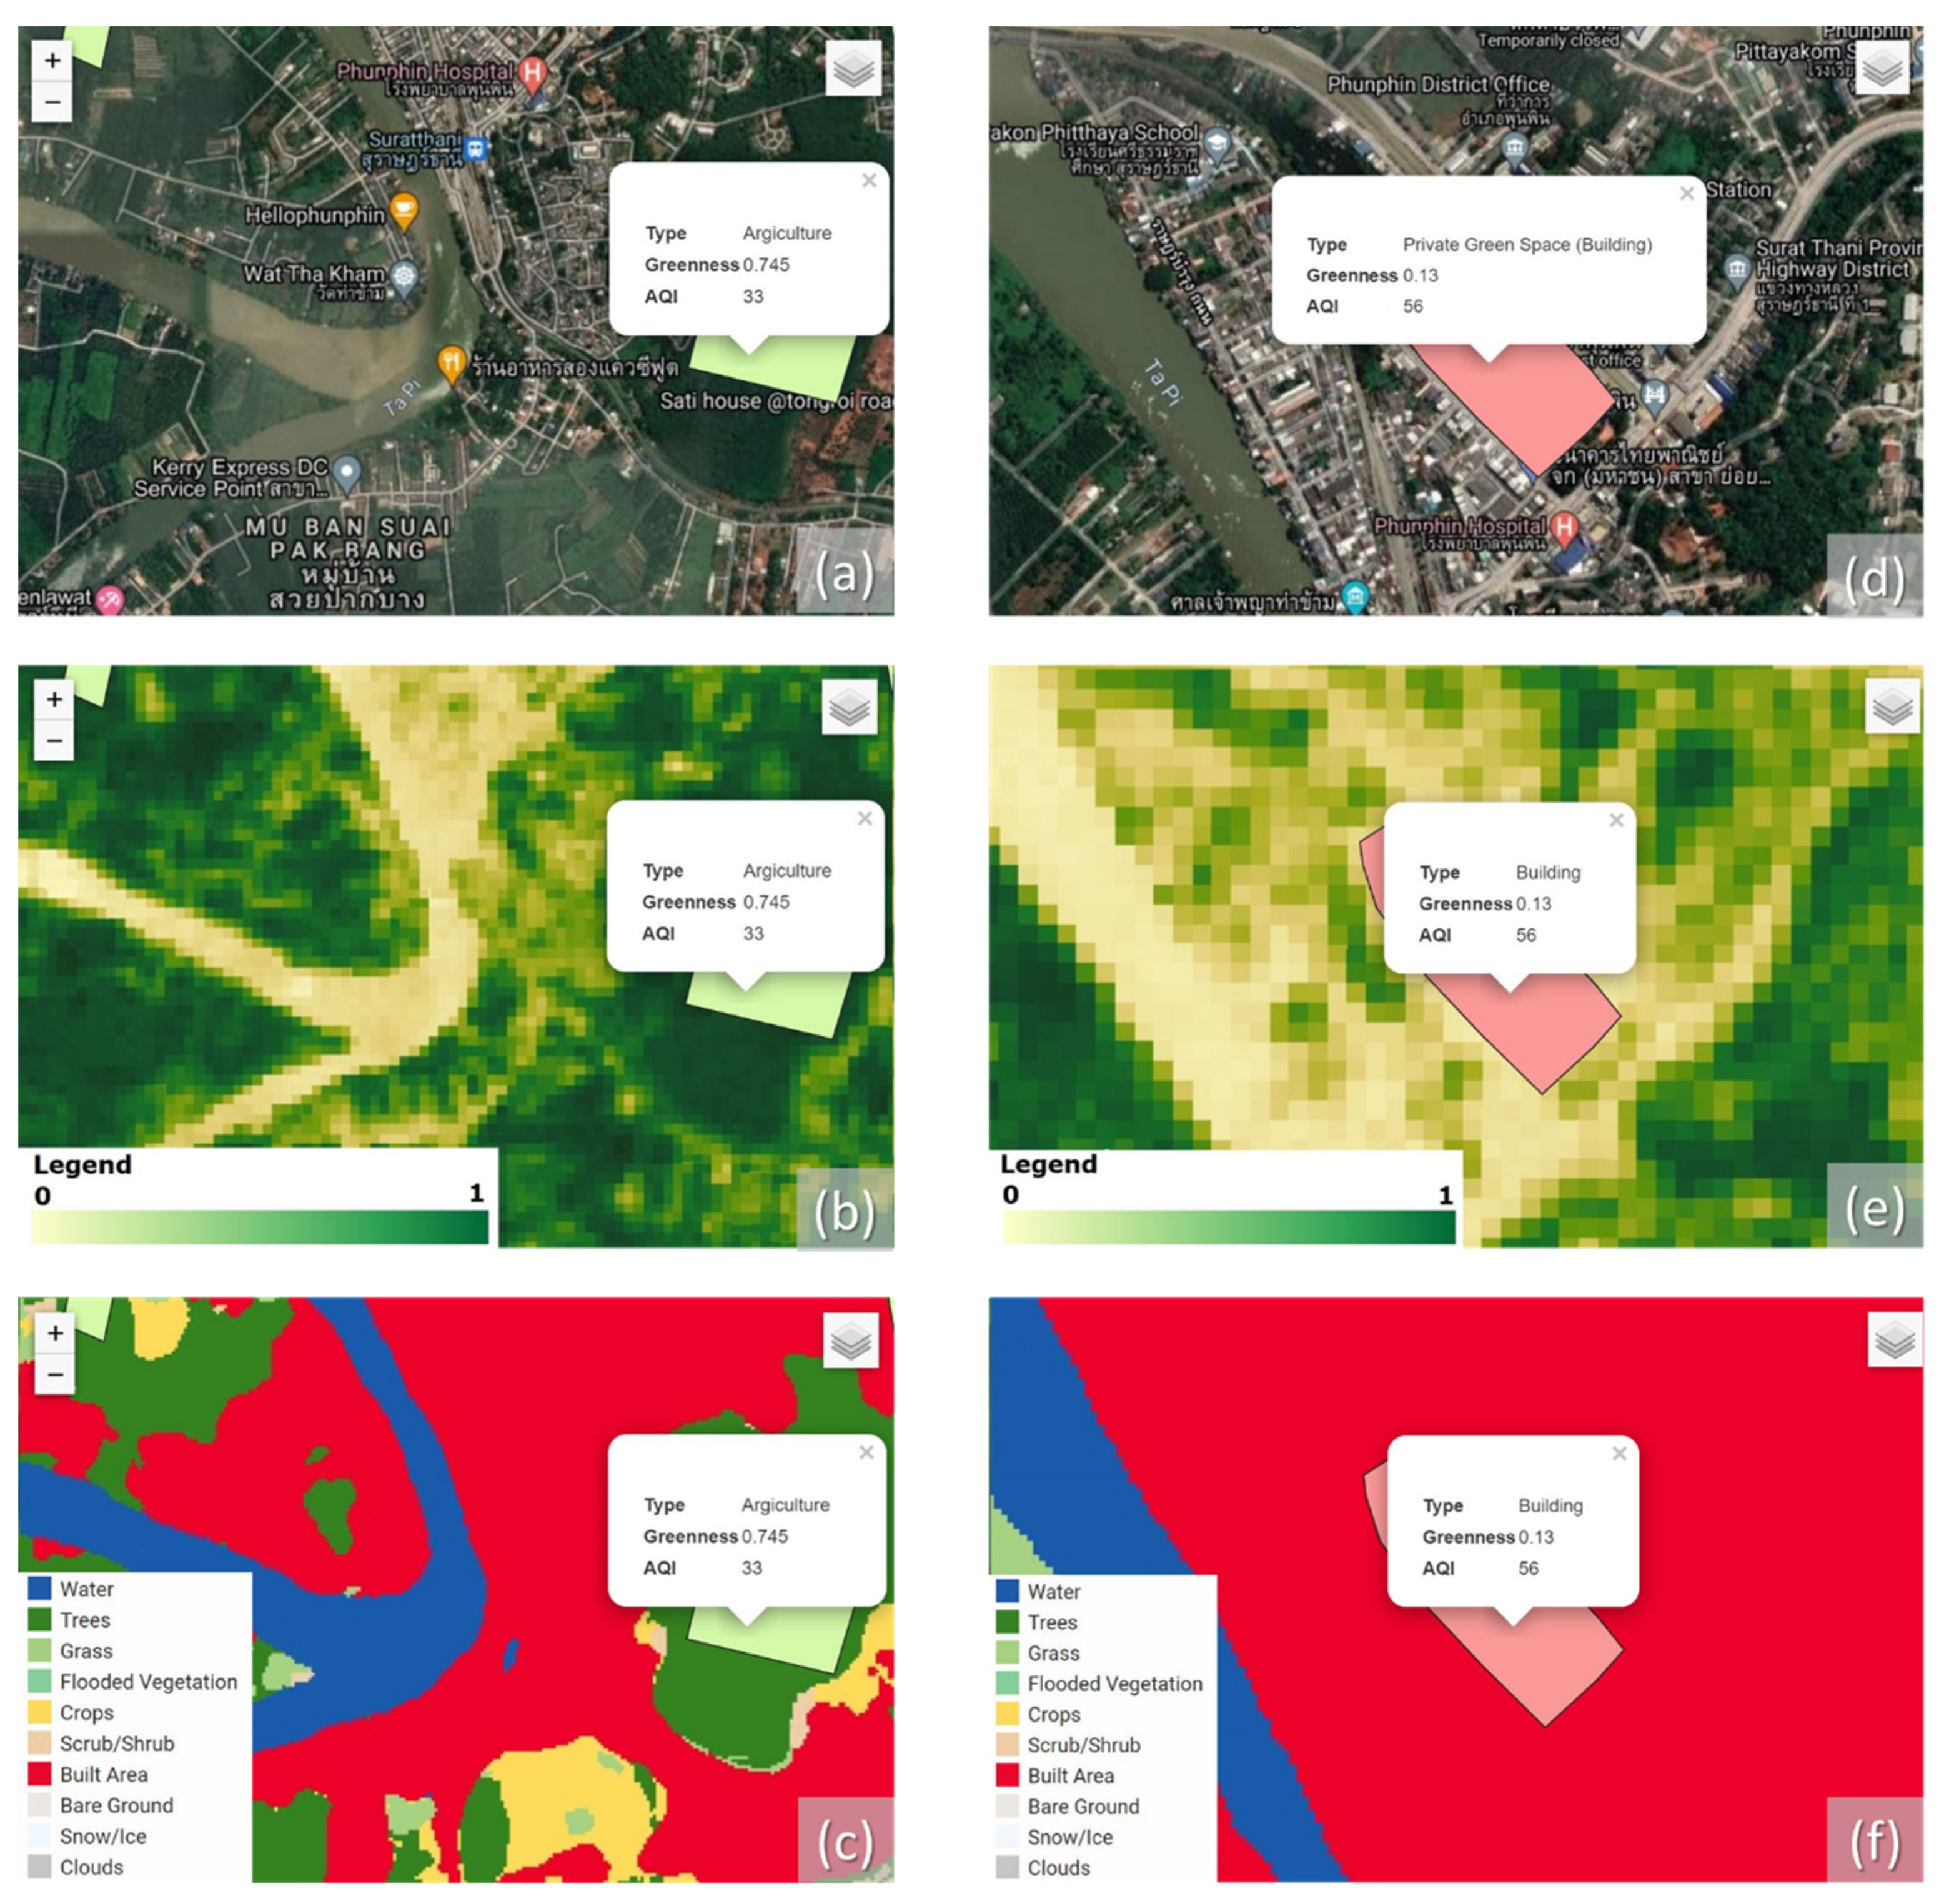
Figure 9a illustrates a green space area manually digitized and then overlaid on a Google hybrid satellite image view.
Figure 9b renders the same area in false colors, based on greenness values. It is evident that this area is indeed of a green space type since its greenness value is not less than 0.50 (0.745). Moreover, overlaid with LULC data, as depicted in
Figure 9c, the area coincides with ”trees”, and is, hence, verified as a green space. Similar verification is also illustrated in
Figure 9d–f, except that the sample is of a non-green space. Notably, not only is the digitized area’s greenness value lower than 0.50 (0.130), as shown in
Figure 9d,e, but the LULC map also indicates that it is in fact a “built (urban) area”, as shown in
Figure 9f. Thus, while the submitted sample in
Figure 9a–c was automatically verified due to its high greenness value, that in
Figure 9d–f still required further inspection by a system administrator, who could then either deny this sample or annotate it due to its contradicting information compared to LULC data.
Finally, the report generation module summarizes and exports meaningful data in various forms, such as tables, graphs, and overlays on an augmented map. This includes, for example, the information on green space areas owned by individuals or at a specific site.
Figure 10 shows a tabular report listing all the green space areas at a selected industrial site. It describes each area with a unique ID, name, type, and size. The rows rendered with a green background are areas that met the criteria or whose sizes conformed to the regulations, while the others rendered in red are those that did not. It was found that this presentation enables an official to promptly determine whether a territory or an industrial area is yet to comply.
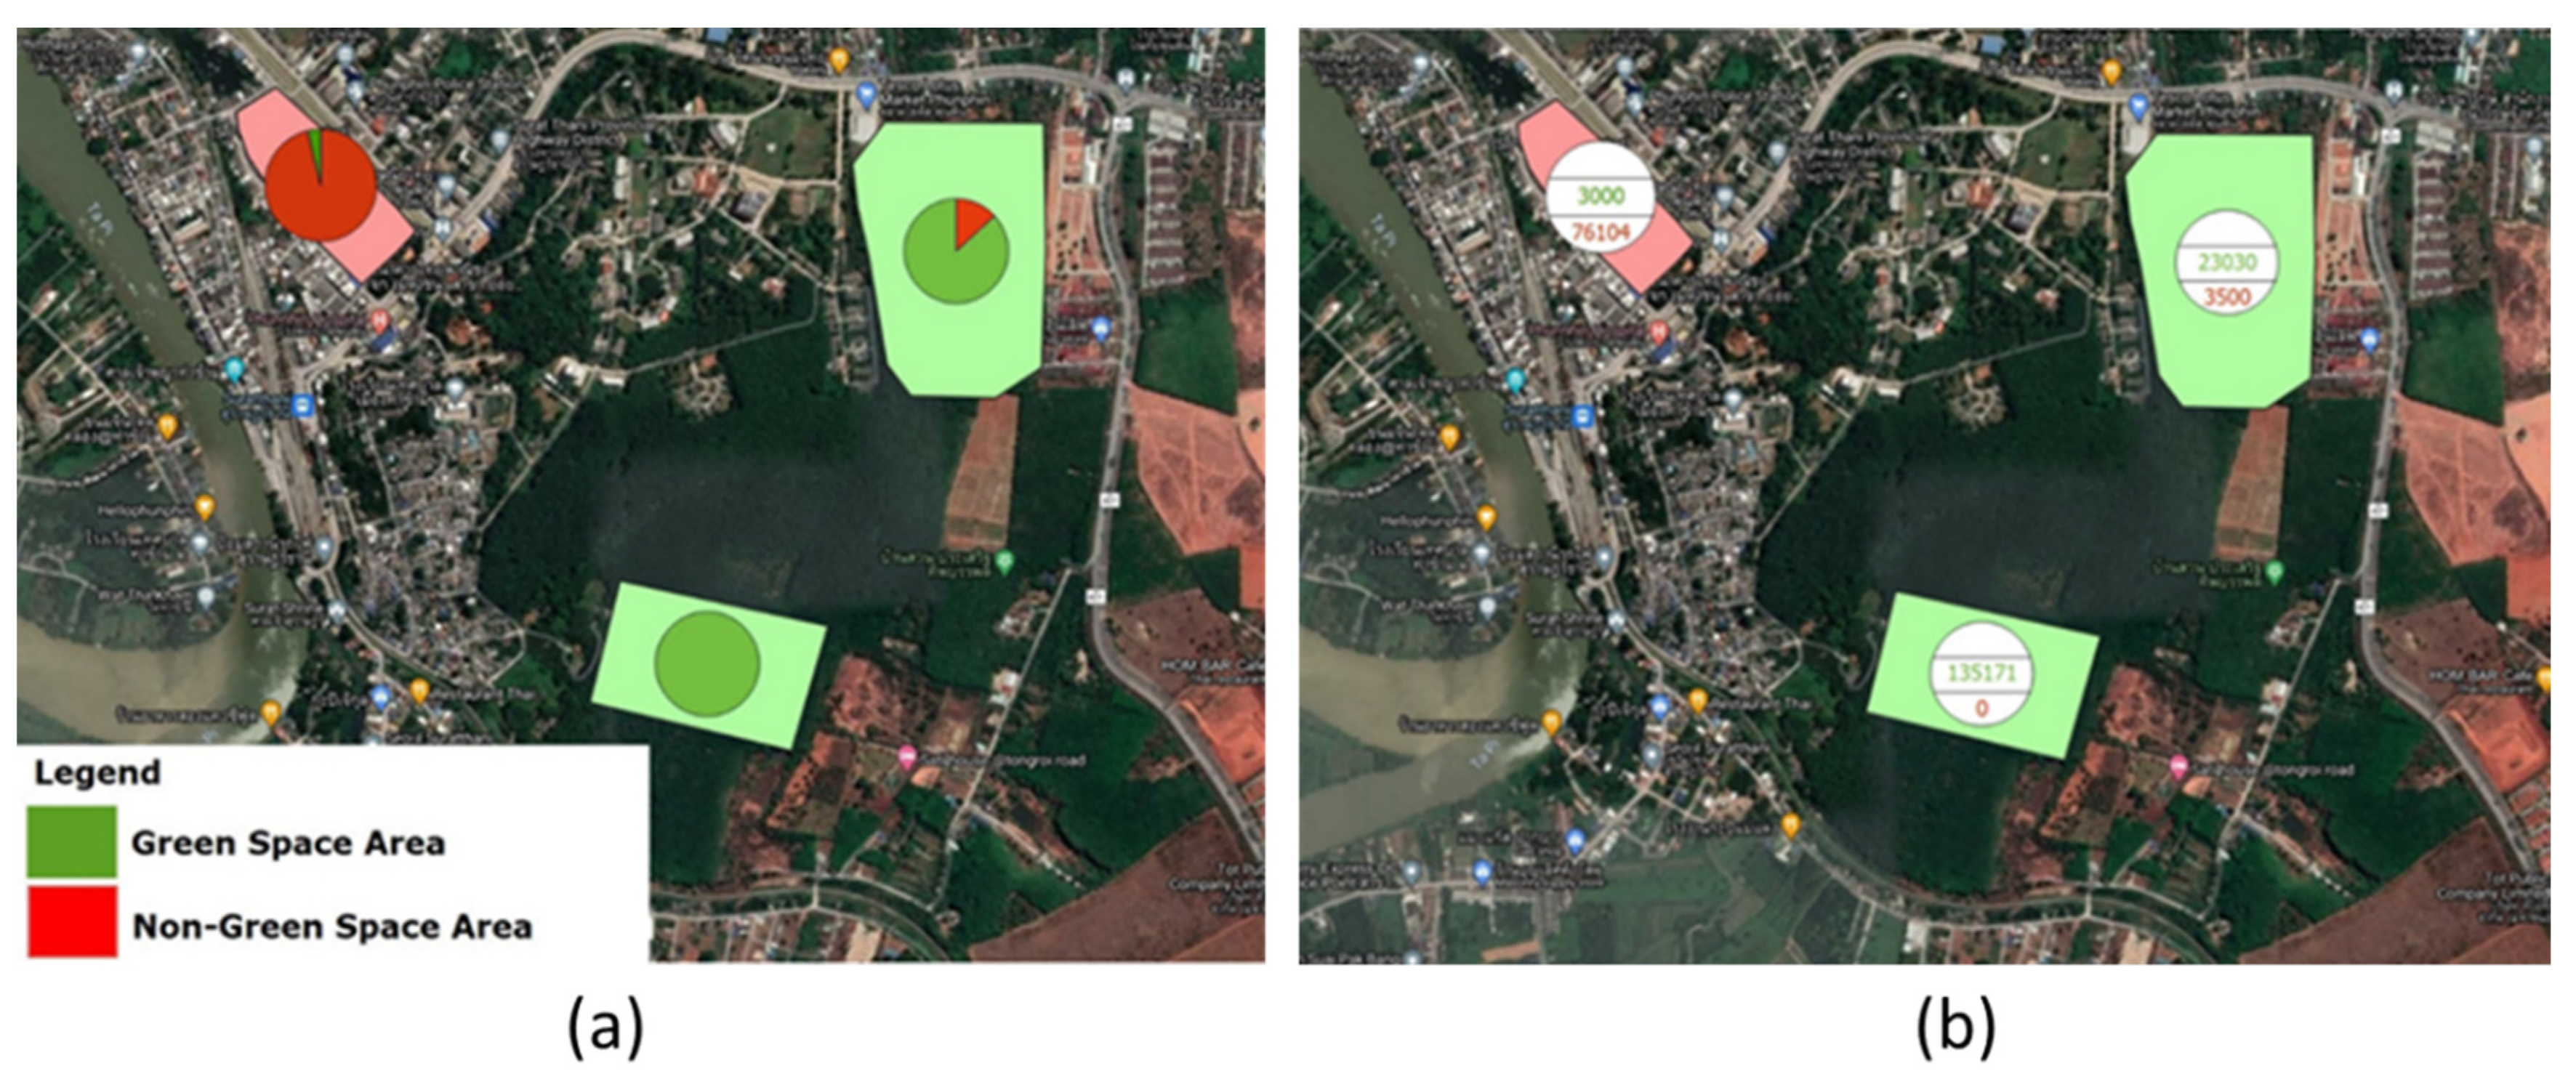
Graphical reports can be overlaid on the map or plotted on a dashboard next to one. For example,
Figure 11 illustrates a pie chart (a) or numeric diagram (b) on a digitalized area, revealing the ratio between its green space and non-green space areas, in green and red colors, respectively. The latter is expressed in square meters (sq. m.). Alternatively, an enhanced map with green spaces rendered with similar false colors can be visualized and used by authorized bodies for various purposes, such as city planning, preparing Environmental Impact Assessment (EIA) reports, and devising Sustainable Development Goals (SDG), etc.
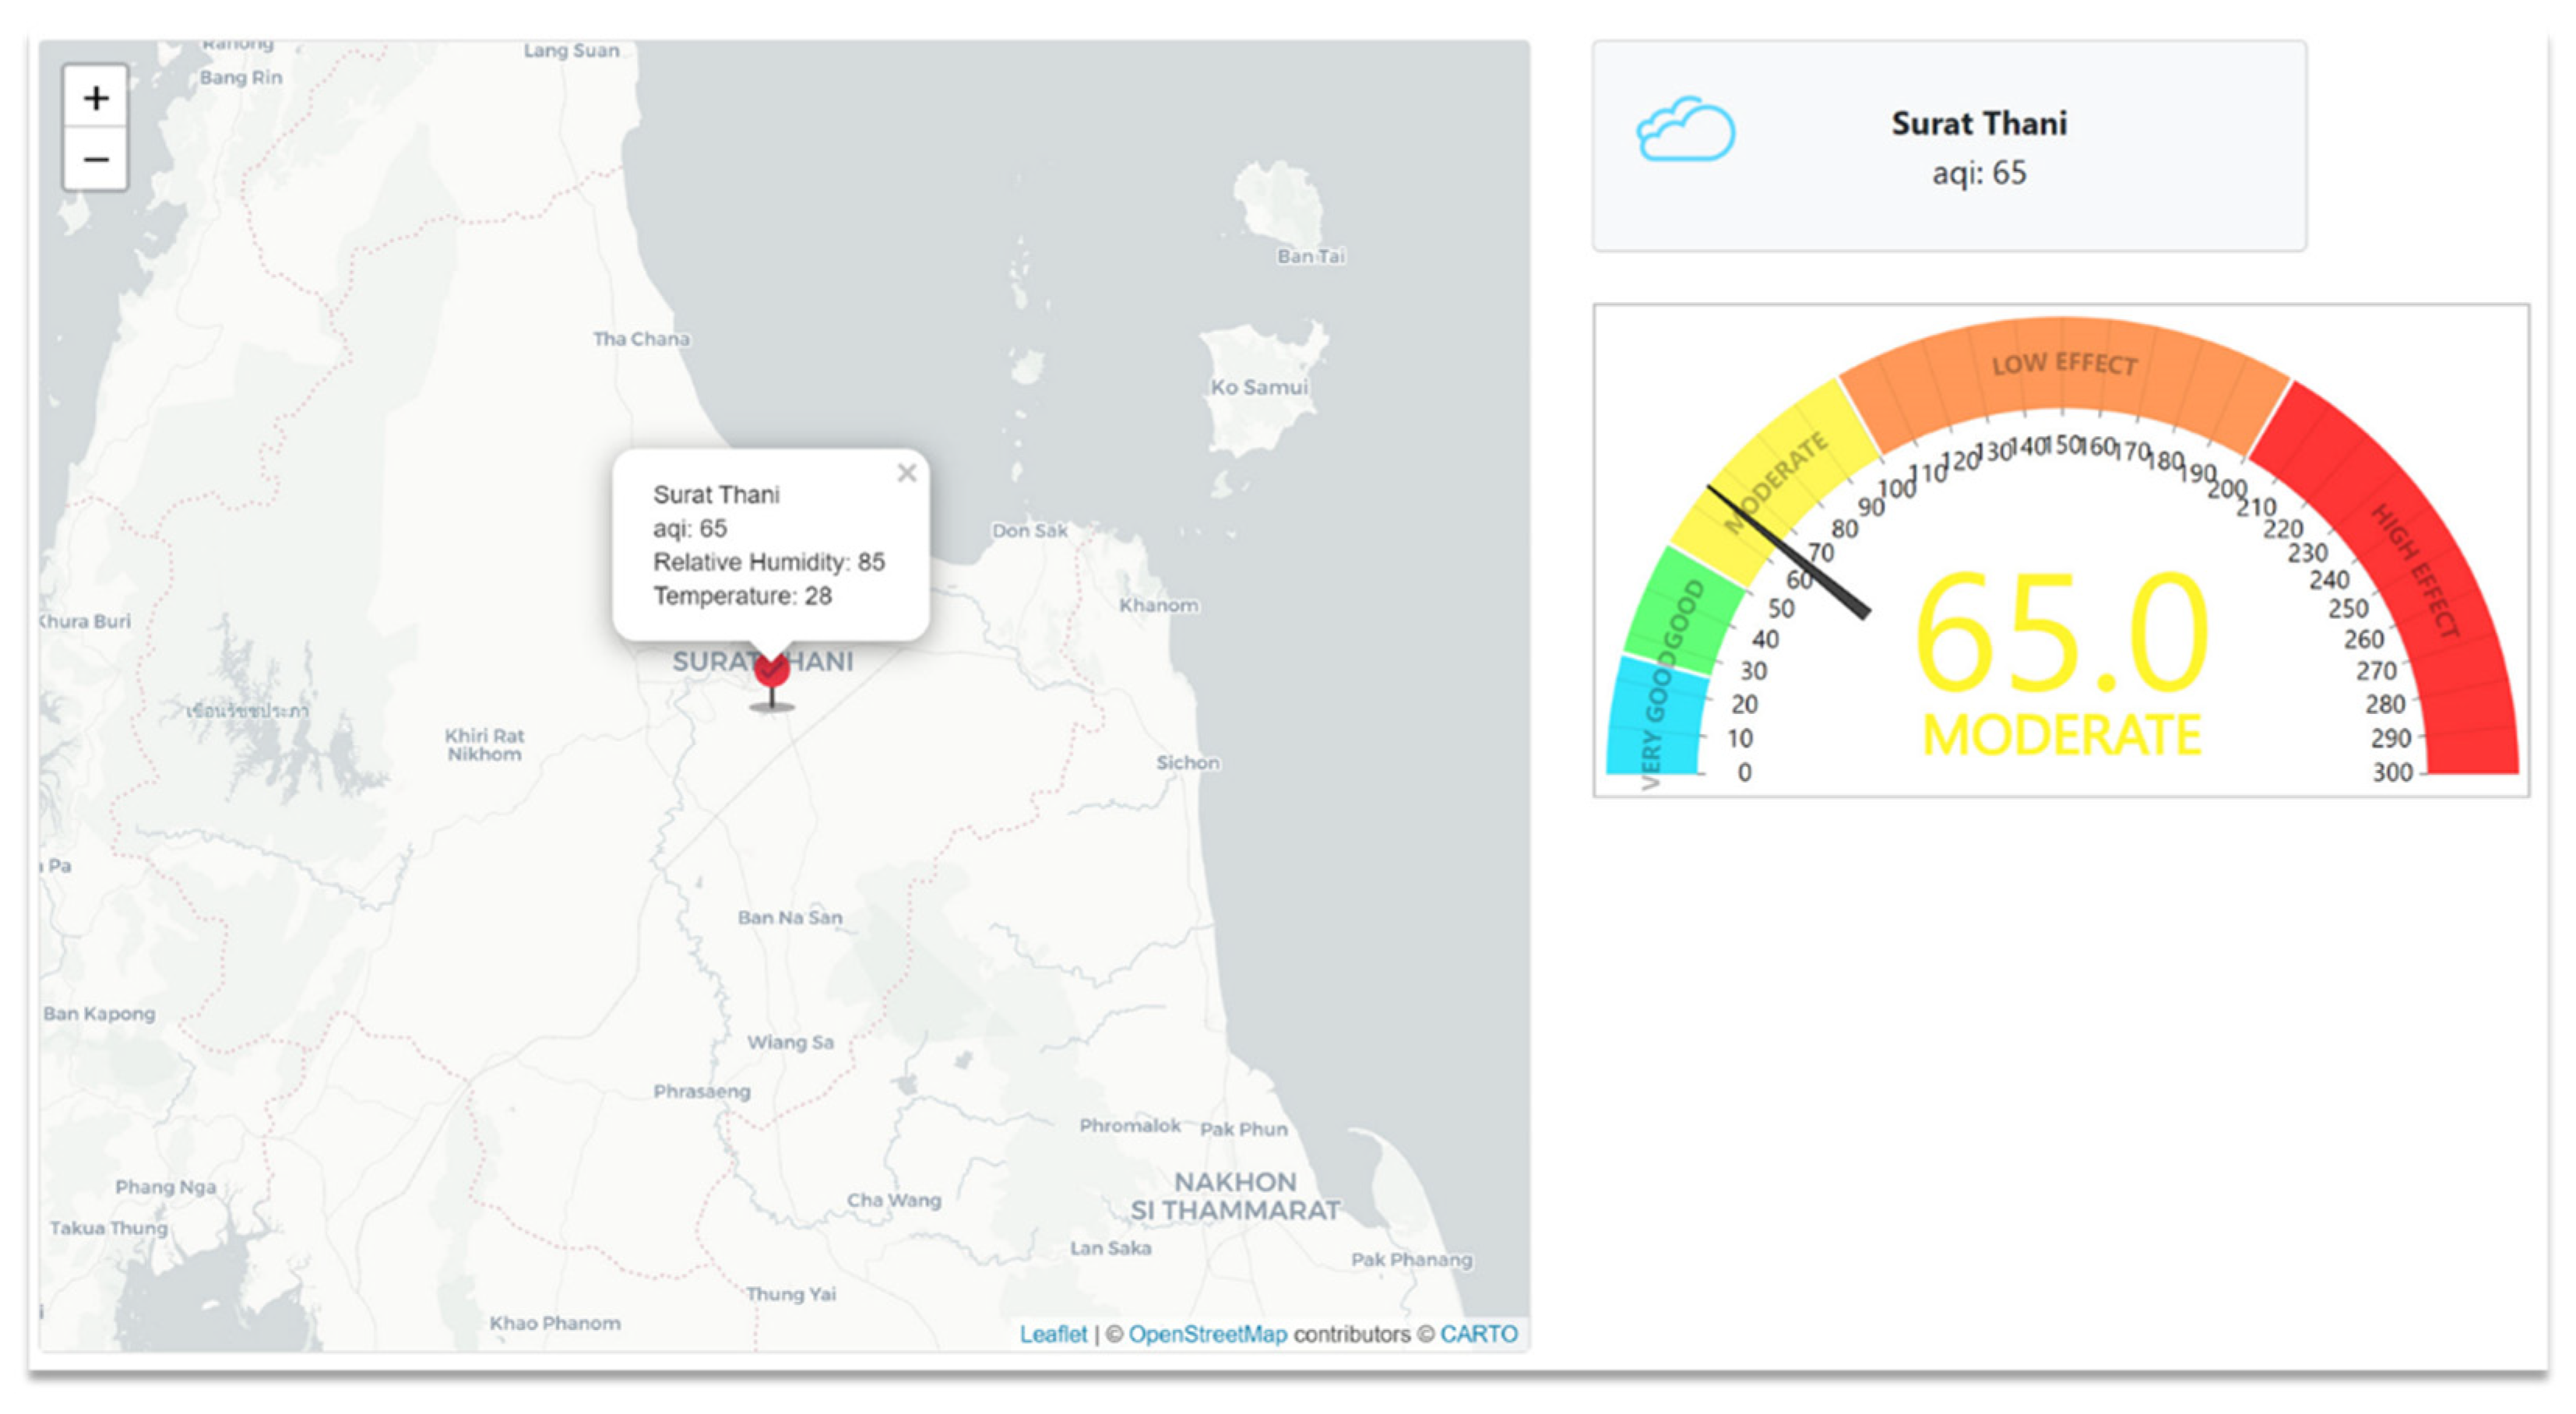
Apart from extensive green space management and reporting, the proposed geospatial system also allows an extension to include air quality data. To this end, the Air Quality Index (AQI) could be imported and monitored to assess air pollution in the selected areas. The map in
Figure 12 is an area whose LULC data was of urban type. Its AQI is shown, as a metering dashboard next to the map, at a moderate level of 65.0 (yellow). At this AQI level, people can usually continue activities in the open air. At levels above 100, however, their health could be harmfully affected, while for those above 200, avoiding such activities is strongly recommended due to severe air pollution. Thus, it is believed that integrating these data with the green space areas data could not only benefit public monitoring and planning but also support the devising of an appropriate city plan, as well as preventive and mitigative measures against future air pollutions, due to the lack of a plan.
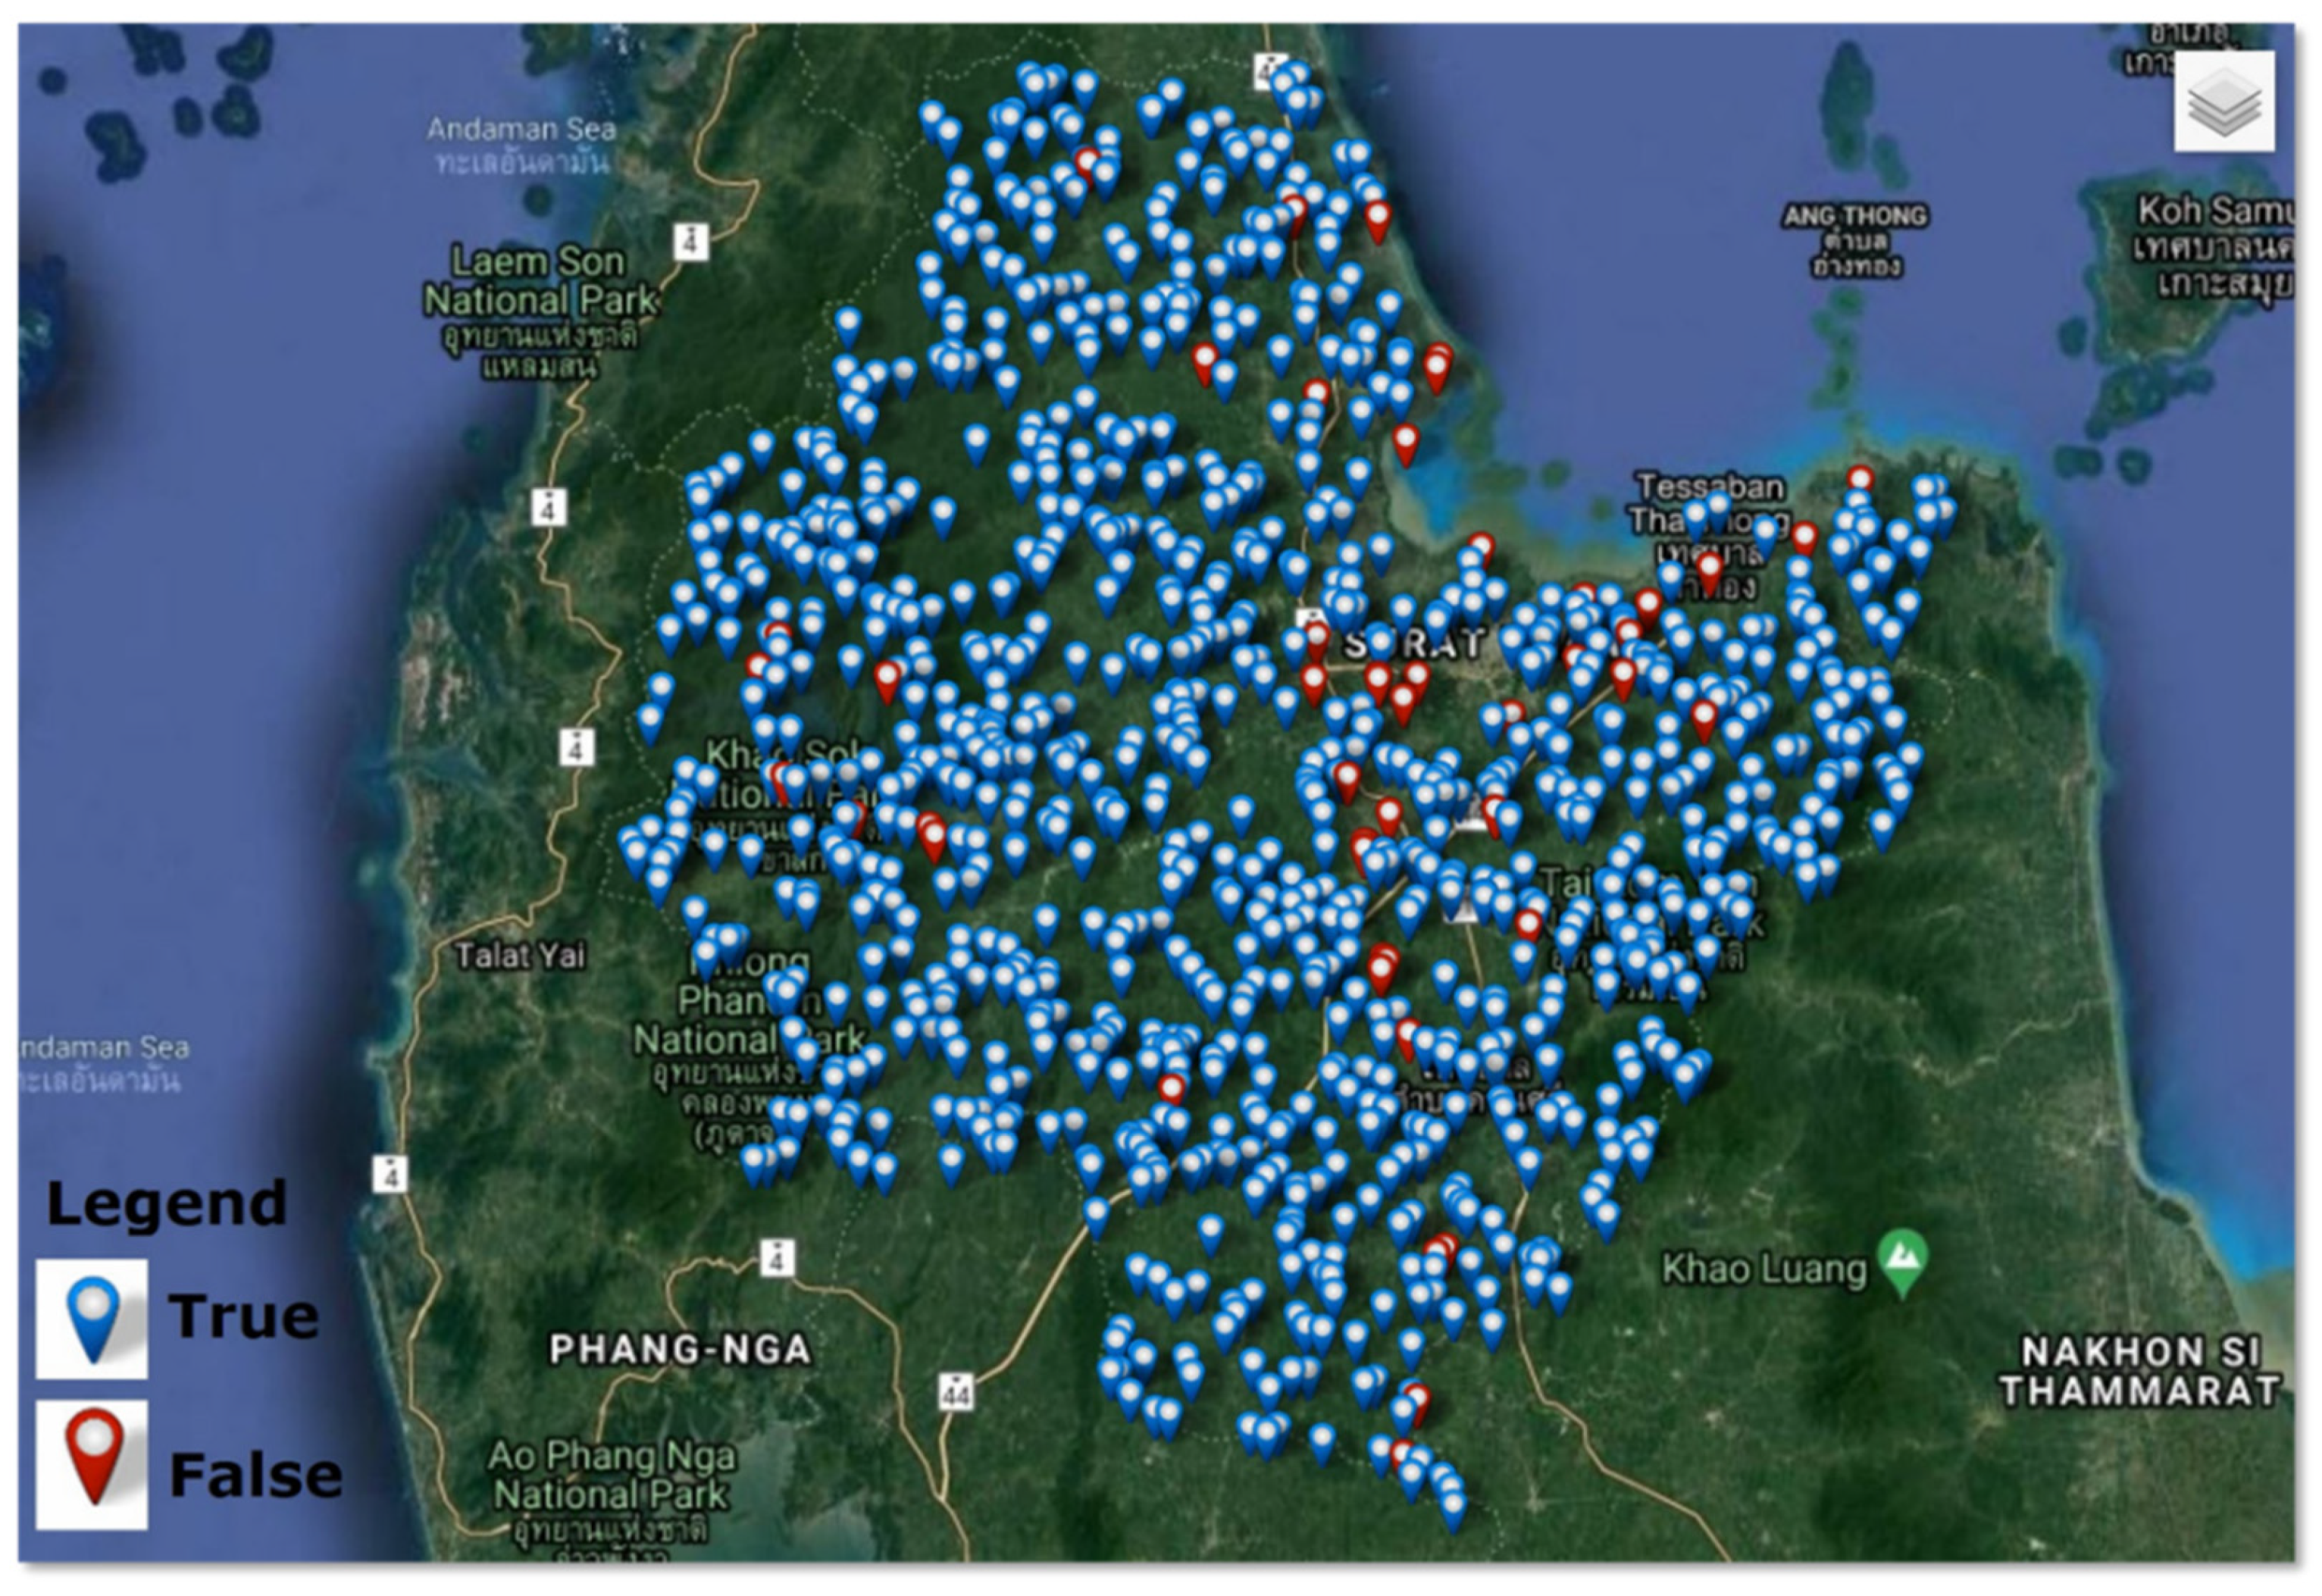
It is evident that the greenness analysis on Landsat 8 images and LULC data plays a crucial part in the two-step verification of green space area submissions. If this is unable to confirm a submission, then manual inspection is necessary. The amount of uncertainty that occurs at this stage can vary depending on the certainty of the greenness values. Therefore, to assess their accuracy, both the greenness values and LULC data are compared against official field survey data (ground truth). To this end, 1000 data points, as shown in
Figure 13, were evaluated. Plotted on the map are blue and red pins, indicating, respectively, correctly, and incorrectly classified points, using greenness analysis.
Table 3 lists the detailed accuracy metrics, obtained by greenness analysis (top) and LULC (bottom) methods. For greenness analysis, the overall accuracy was 97.50% with 0.94 Kappa. It can be noted that the accuracy of the green space class was higher than the non-green space class. A similar observation can be made on the results from LULC data. Its overall accuracy was 96.10% with 0.91 Kappa, which was slightly lower than its counterpart. However, as with the greenness analysis, LULC can confirm green space areas with greater accuracy than non-green space areas.
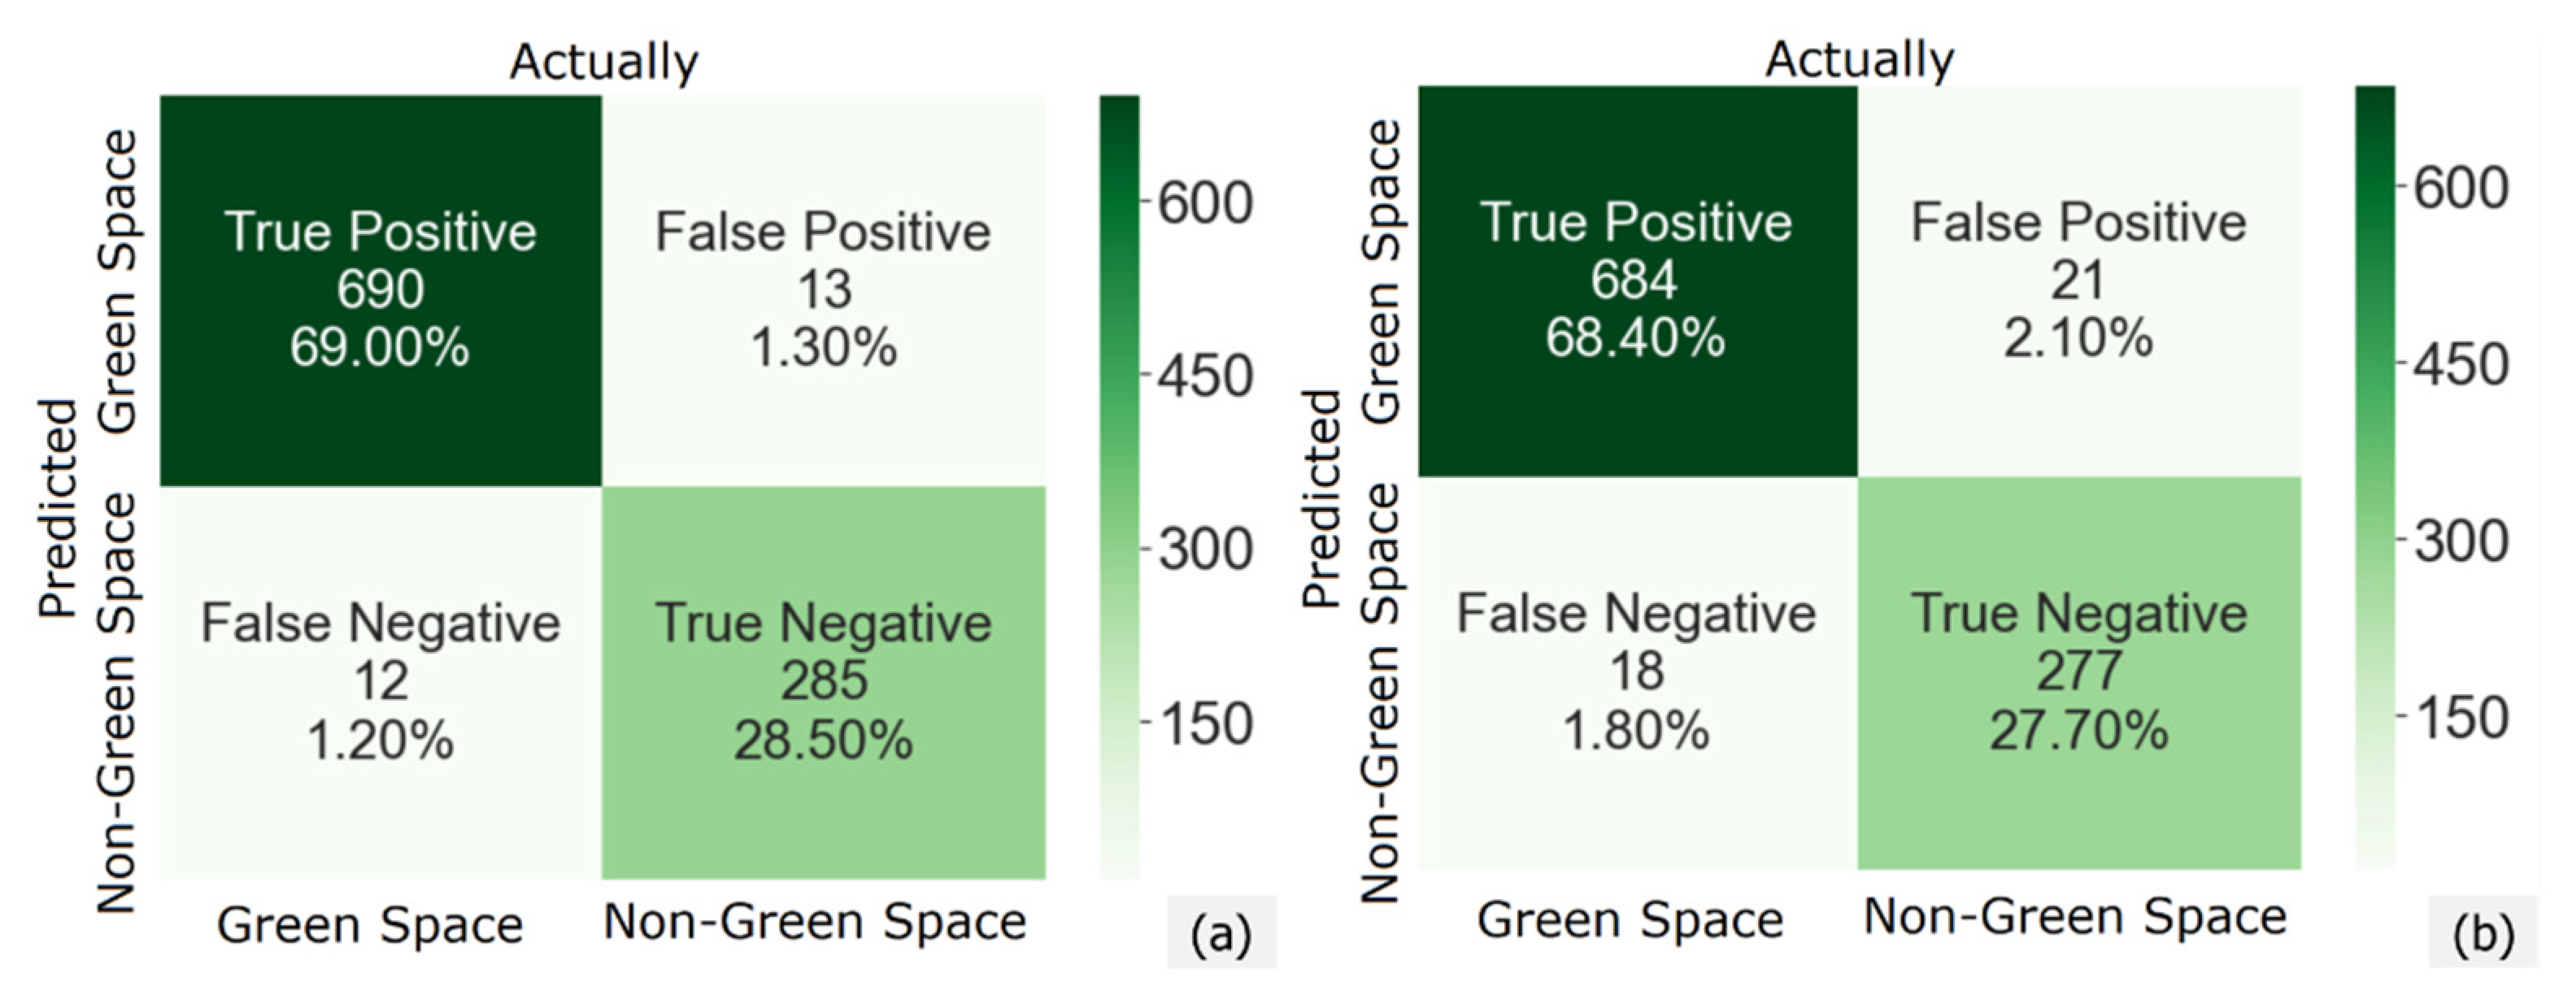
The analysis of green space verification by analyzing the greenness value on a Landsat 8 satellite image is illustrated in
Figure 14a, while that using LULC data is illustrated in
Figure 14b. Out of 1000 locations, 702 were green space areas, while the other 298 were not. It is clear from these figures that the greenness analysis outperformed its LULC counterpart. The greenness analysis exhibited a slightly higher TP (69.00% vs. 68.40%) and TN (28.50% vs. 27.70%) and, of course, lower FP (1.20% vs. 1.30%) and FN (1.80% and 2.10%).
Since both methods were highly accurate, it is safe to conclude that they could be equally well employed to automatically verify user submissions. Subsequent manual verification was required only in a few remaining cases. Moreover, since greenness values were computed from Landsat 8 images they were renewed regularly. However, this depends on the satellite acquisition periods. Unlike the proposed scheme, conventional survey data were updated much less frequently, sometimes once every 3 years. Therefore, the proposed geospatial system ensured the most reliable and most up to date references for green space area verification for any given submission period.
It is also worth pointing out that the imaging data involved in the greenness analyses consisted of both photographic (
Section 3.2) and satellite (
Section 3.3) measurements. Moreover, they were acquired in different coordinate systems, i.e., real world, and geographical. In the present study, these data could only be fused by DL labelling (
Section 3.1) or visual interpretation (
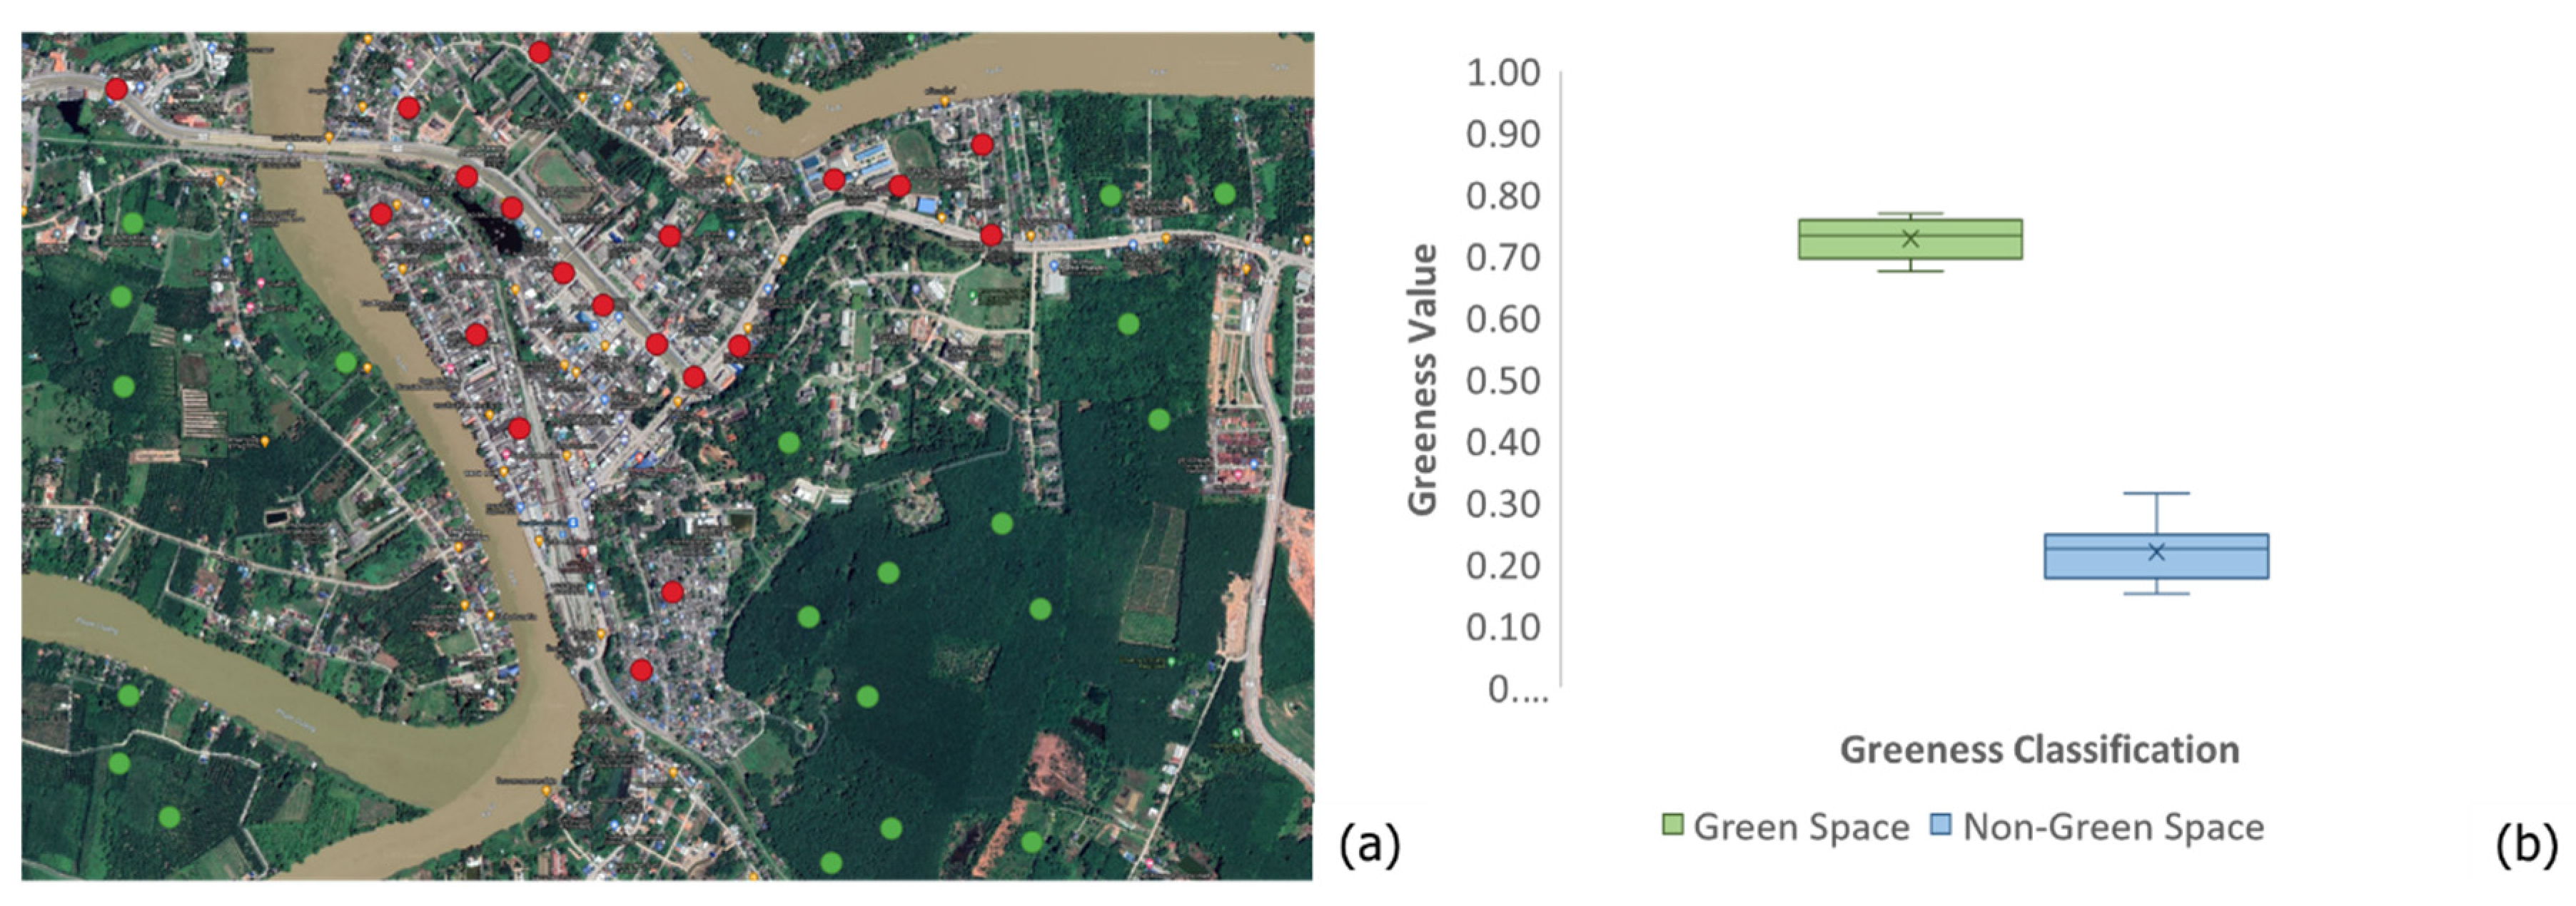
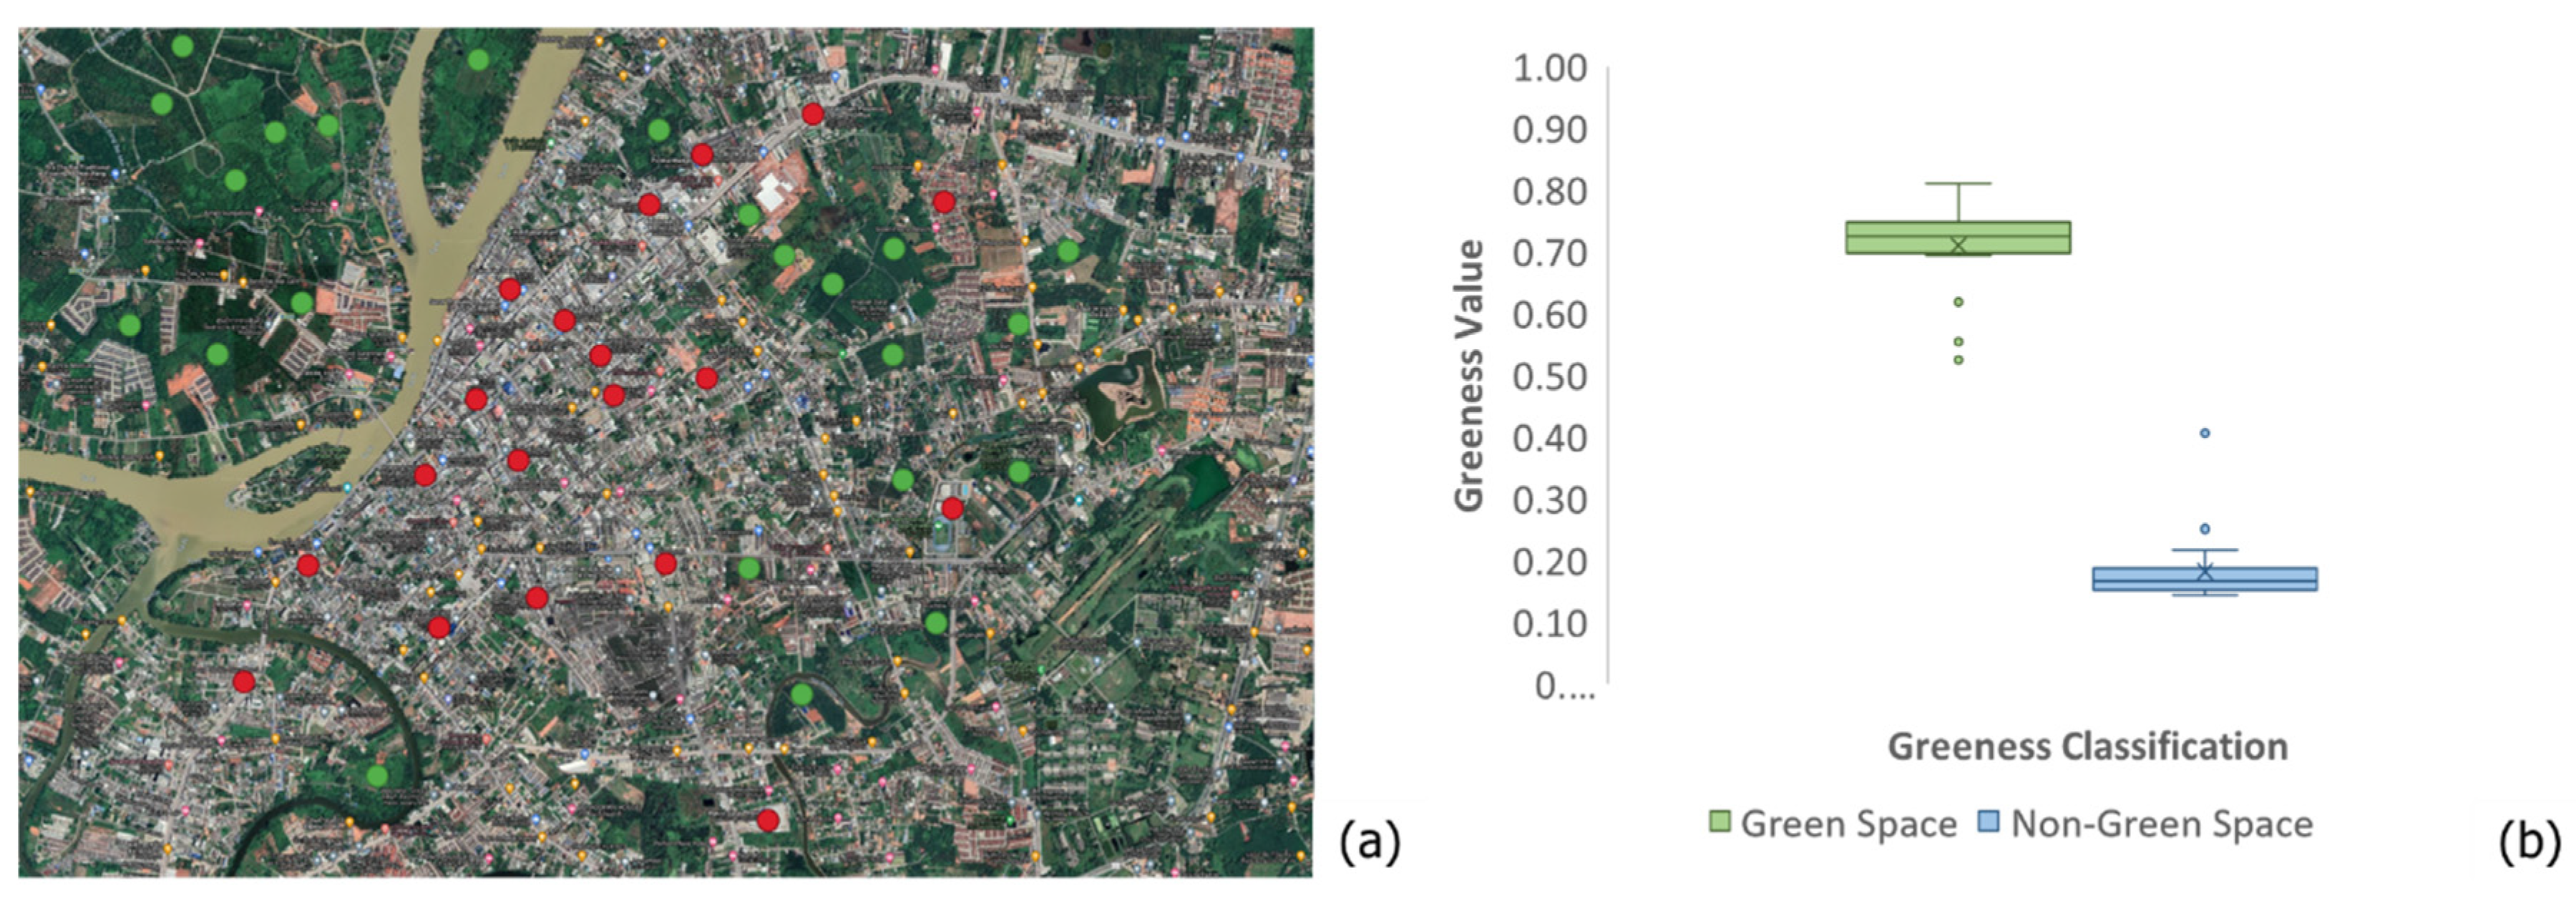
Section 3.4), based on their geolocation. Therefore, another experiment was carried out to assess the correlation between Landsat 8- and photographic-based greenness values. A total of 80 sites of green and non-green spaces in Phunphin and Muang districts, Surat Thani province were examined. Only the sites where verification was agreed by both DL and a human observer were included. There were 20 sites per class per district. As depicted in
Figure 15a and
Figure 16a, green and red circles represent green and non-green site, respectively.
Figure 15b and
Figure 16b show Box-Whisker plot of the greenness value distributions in both classes. It is evident that the value of 0.50 is a suitable threshold for both districts. In Phunphin district, the range of greenness values for green space was between 0.67 and 0.77 (0.73 ± 0.032), while that for non-green space was between 0.15 and 0.32 (0.22 ± 0.040). Similarly, in Muang district, the range of greenness values for green space was between 0.52 and 0.81 (0.71 ± 0.068), while that for non-green space was between 0.14 and 0.41 (0.18 ± 0.057).
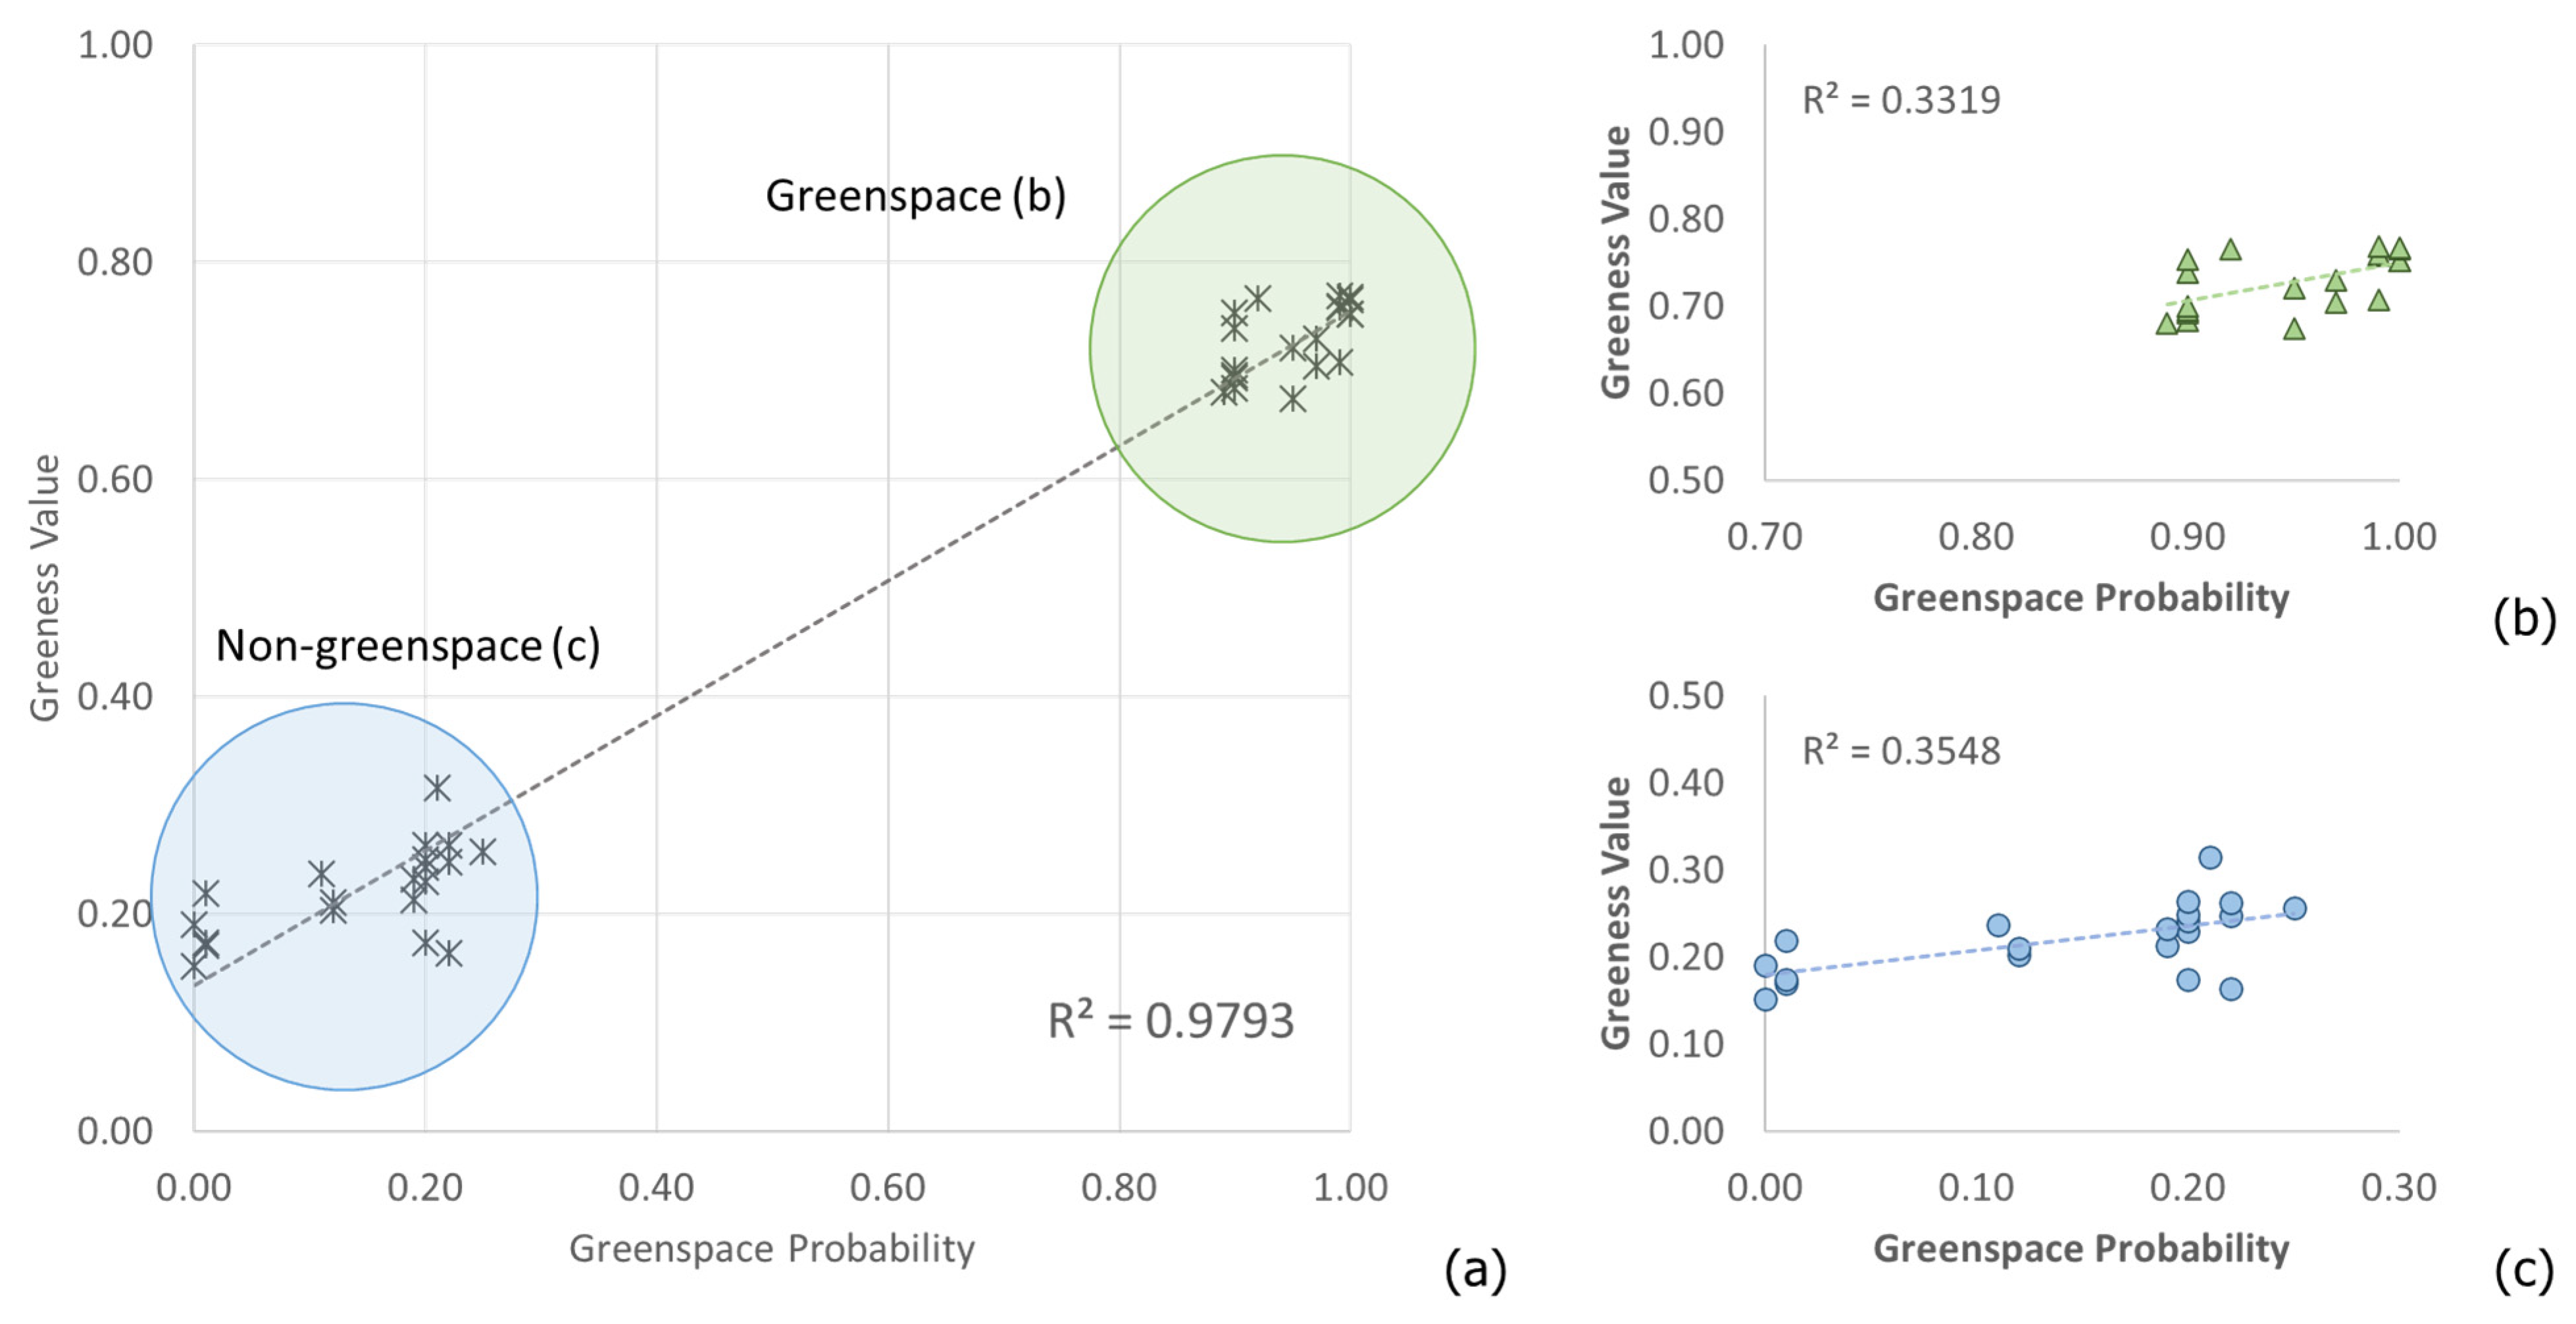
In addition to binary classification, to determine whether greenness features discovered by DL from photographic images were relevant to those features extracted from satellite images, the correlation between classification likelihood and greenness values was assessed.
Figure 17a depicts a scatter plot showing the correlation between class probability, prior to the SoftMax layer of ZFNet (x-axis), and greenness value, calculated from a Landsat 8 satellite image (y-axis) at the same geolocation. It was revealed that, for both green space and non-green space classes, the class probability and greenness values were highly correlated, with a correlation coefficient (r) of 0.9896. This finding suggests that for a valid submission, a green space’s likelihood of being verified could be delegated equally well to either DL class probability or greenness value. Accordingly, the order in which they were considered depended on practicalities within the scenario. In the present workflow, DL preceded the other verification modules due to its lighter weight, it being much more intuitive for the end user, and the minimal access necessary to the image database. It should be noted, however, that DL class probability was unable to predict the greenness value that well, and vice versa, as indicated by relatively small coefficients of determination (R
2) for within-class regression, shown in
Figure 17b,c. This is due to them having different measurements and because DL was trained as a binary classification network, while greenness values are normalized scalar indices.
5. Discussion
This paper presents the development of a volunteered geographic information platform for managing green space areas, based on RS and off-the-shelf AI technology. It integrated geospatial data, which were not only from official reports but also from natural light sources and multispectral imagery generated by non-GIS professional users. The integrity of these “eyes on the ground” data were maintained by both DL-based initial screening of submitted digital photographs and satellite image analyses. The assessment of the ZFNet revealed that it could distinguish green space (positive class) and non-green space (negative class) photos at 93.50% accuracy with 0.87 Kappa. Specifically, it could correctly classify 47.50% of positive (TP) and 46.00% of negative (TN) instances, leaving merely 2.50% and 4.00% incorrect judgements from the two classes, respectively. These pre-labelled instances were then subjected to another stage of RS-based verification by means of analyzing Landsat 8 satellite images. To this end, normalized greenness analysis was calculated over a user-digitized area, where a value of no less than 0.50 was considered as being green space. The numerical assessment showed that it could correctly classify these areas at 97.50% accuracy with 0.94 Kappa. Due to standard differential spectral indices, it is anticipated that the 0.50 threshold could be equally well applied to areas other than that considered in this paper.
Similarly to the proposed platform, some existing studies on green space had previously analyzed remote sensing data [
26,
27,
28,
29,
30,
31,
32,
33,
34]. In particular, the recent works in [
26,
27] had also detected green space areas by examining Landsat 8 satellite images. Nevertheless, the present work made improvements to the existing studies by incorporating crowdsourced geospatial data. As such, it overcame limitations presented by low-resolution satellite images and, hence, was able to discover smaller green space areas, e.g., those privately owned. Moreover, a versatile DL network was employed to pre-screen volunteered data, preventing invalid submissions from being recorded in the system. To further strengthen data entry, any inconclusive records were able to be verified using the RS-based greenness analysis described above or by comparing against LULC data. Therefore, any involved parties were ensured of not only up to date data, but also a relevant and reliable geospatial database of valid green space areas. Similar to our work, the study by Baučić [
32] also fused multisource data. Therein, LULC data and the Green View Index (GVI), both obtained from Sentinel-2 images, were fused to outline green space areas. Unlike the proposed platform, the method described in [
32] was impeded by having to fuse these data manually, and thus was prohibited from being involved in more focused and larger scale applications.
The experimental results reported herein further demonstrate that the proposed geospatial system could alleviate existing shortcomings of previous methods [
32,
38]. Firstly, the developed web-based platform supports a role-based policy that allowed different user groups to participate in information exchange at varying capacities. While green space areas’ data management could be performed in real time, their integrity was ensured by the novel automatic two-step verification. During pre-screening, deep learning was employed to eliminate irrelevant submissions by classifying the attached photographs of the respective area. Successfully admitted data were then subjected to automatic verification by greenness analysis based on satellite imagery. If the greenness value contradicted the data submitted by the user, the area was then compared against LULC data for confirmation. This process ensured an administrator did not have to inspect each area manually against even less frequent survey data. The accuracy for this proposed method was between 96.10% and 97.50%, which was higher than accuracy values reported in previous works [
30,
35,
38]. The resultant green space data were stored in the efficient spatial and attribute databases so that relevant reports could be queried and exported in a range of formats. Although only one city was demonstrated in this study, there was no apparent loss in its ability to be generalized to other areas, provided that geolocation, Google Maps, and Landsat 8 images are also available in other areas of interest.
The main advantage of AI technology for managing green space areas is evident in it its pre-screening module as it enabled a much more extensive and broader coverage of volunteered data, without a substantial risk of an overwhelming need for manual verification afterward. Any remaining deviations were detected by subsequent two-step verifications, namely by satellite image-based greenness analysis and by comparing to LULC data.


