Article

Acceptance of GIS within ERP System: Research Study in Higher Education

1
Faculty of Economics and Business, University of Maribor, 2000 Maribor, Slovenia
2
Department of Management, Financial University under the Government of the Russian Federation, 125167 Moscow, Russia
*
Author to whom correspondence should be addressed.
ISPRS Int. J. Geo-Inf. 2022, 11(2), 83; https://doi.org/10.3390/ijgi11020083
Submission received: 29 November 2021 / Revised: 20 January 2022 / Accepted: 21 January 2022 / Published: 24 January 2022

Abstract

:
GIS is often used in companies where employees already use enterprise information systems/enterprise resource planning (ERP) systems and where both systems are used simultaneously. This article is a research study of GIS acceptance by users using GIS, not as a stand-alone tool, but as an integrated tool into the ERP system. The research was conducted using the Technology Acceptance Model (TAM), one of the most often used research models for researching behavioral intention and actual use of information systems. For this research study, TAM has been modified and extended with external factors. The main research objective is to identify determinants of GIS acceptance and the attitude of individuals toward using GIS integrated with ERP systems. The structural equation model with partial least squares (PLS) method was used to analyze collected survey data. The study researched 12 external factors in the TAM model, out of which 10 were found significant. The most important factors that impact behavioral intention to use ERP-GIS systems are perceived usefulness of ERP-GIS systems and attitude toward using GIS, followed by education and training about ERP-GIS systems and perceived enjoyment using ERP-GIS systems.

1. Introduction

Geographic information systems (GIS) have become very important tools in many areas in recent years, including resource management and utilization in many industries [1]. GISs are sometimes referred to as computer tools, but sometimes they are defined as information systems consisting of software and database [2]. There are two types of geodata—raster geodata and vector data [3]. Raster data can be distinguished by the content—, i.e., imagery, height models, land use classes, population data, temperature, etc. Vector data (also referred to as feature data) represent individual objects that are modeled as geometries of a certain location and depend on the geometric dimension of the objects modeled [4]. A feature class can consist of points, lines, or polygons. For geodata use, special formats support the delivery of spatially and/or thematically limited extracts of data in a dataset. Among others, raster analysis in GIS comprises terrain analysis, hydrologic analysis, surface modeling, surface interpolation, multi-criteria analysis, image classification, etc. [4]. Their functionality to capture, analyze, visualize, and model territories with large volumes of spatial data open many possibilities for their use in different areas. Besides environmental issues (e.g., weather forecasting climatic change [5], flood modeling [6]), there are also several areas of economic issues (e.g., cost–distance analysis and optimal routes, location–allocation analysis, land suitability modeling, etc.) (for example [7,8,9,10]). A special area of GIS functionality is spatial statistics, in which exploratory techniques for describing and modeling spatial distributions, patterns, processes, and relationships are used [11]. There are three options for spatial visualization [12]. The most elementary options for spatial visualization are choropleth maps. The intensity of the phenomenon is expressed using a color fill or raster/pattern in a polygon, converted to a unit of the surface of the observed territory. The second option for spatial visualization is cartograms, and thematic maps, which enable the visualization of variables such as population, travel time, GNP, etc. The third option for spatial visualization is proportional symbols, which use points or lines to visualize the distinct variable. GIS functionality was traditionally used for urban planning, utility management, ecosystems modeling, transportation, and infrastructure planning [13,14]. Besides these, many areas have recently emerged, especially used in business processes of companies in different industries, i.e., marketing, facilities management, taxation issues, real estate business, etc. (for example, [15,16,17]).
Recently GIS is often used in companies by users in different business areas where employees already use enterprise business information systems such as project management information systems, customer relationship management systems (CRM), enterprise resource planning systems (ERP), etc. In one of the earliest articles [18] referring to the use and integration of GIS in information systems supporting business activity, the computer-supported project management in the Port Authority in New York/New Jersey was studied. The article analyzed and discussed the importance of computer-supported project management, including GIS integrated with project management information systems and enterprise information systems. It was argued that the integration of mentioned information systems provides necessary information for project managers to manage their tasks more efficiently and effectively. Integrating GIS with more complex Enterprise information systems such as Enterprise resource planning systems (ERP) opens additional dimensions while, typically, ERP systems are used to support the entire company, not only a project or distinct business area. ERP systems are information systems that an organization can use to manage all business data and make them available for employees in all business areas for their daily business activities [19]. Until recently, GIS systems remain relatively isolated technology, as mentioned above, to capture, store, check and display data related to geographical positions. Therefore, existing enterprise information systems architectures often separate ERP systems and GIS [20], and in many cases, business processes and spatial processes are perceived as distinct processes [21]. As most business data have a spatial or geographic dimension that can be georeferenced for visualization on a GIS map, their interpretation through a spreadsheet or similar method is not adequate [22]. This integration can bring many advantages by integrating ERP systems functionality, especially their workflow management features, with GIS for location-based information management. An example of such integration is studied in an article dealing with the necessity of integrating ERP systems and GIS in tourism [23]. The article describes and analyzes the benefits of an integrated tourism information system. Its architecture and functionality are explained. The linking of spatial information in the ERP system is explained, and a spatially integrated information framework for tourism is described. In past years, the interest in integrating GIS with ERP systems has been growing significantly [24]. By visualizing spatial dimensions of business data, earlier hidden relationships, patterns, and connections are visible and understandable for managers. In such a way, GIS can support their decision-making at a higher and advanced level.
The usefulness of information systems is not determined only by their functionality, but also by the level of their acceptance by users. To get more benefits from information systems and increase the efficiency and effectiveness of information system use, organizations should be aware of the factors that impact employee acceptance [25]. The Technology Acceptance Model (TAM) is, among the models known, the model which is used most often for researching the behavioral intention of employees and their actual use of information systems in companies. It is often argued that TAM improves understanding of how influences on actual use of information systems could improve information systems used [26]. The literature review has shown that several studies on users’ adoption of information systems in past years, and many of them focused on ERP systems, where research has been based on TAM, have been published. A review also showed that almost all studies have focused on ERP systems’ business modules and not on other tools and modules that enhance business modules. Very few studies have researched the acceptance of GIS by users. Studies researching the usefulness of GIS in connection with ERP systems where GIS is integrated with ERP business modules are even more seldom. This study aims to research the acceptance of GIS, which is integrated with ERP systems.
The research study was based on the TAM, which has been modified and extended for the purpose of the study [27,28,29], especially regarding external factors in the TAM research model. The present research focuses on the acceptance of GIS integrated with ERP by students of the last year of the bachelor e-business specialization within the business administration study program. This research study was conducted within a study program where students use ERP systems and where the GIS integrated with the ERP business module was included. Students were involved as ERP users/employees in a company with the purpose to assess the acceptance of ERP-GIS integrated module. More than 200 students have been addressed to voluntary participation in the survey after explaining to them the purpose of the survey. They were asked to fill in the questionnaire anonymously after completing the module of classes where they learned about the GIS functionality within the ERP system; 154 students participated. The main research objective is to identify determinants of GIS acceptance and the attitude of individuals toward using GIS integrated with ERP systems. From the methodological side, we have used the structural equation (SEM) model with the partial least squares (PLS) method for analyzing the data.
The paper is structured as follows: a literature review on GIS and ERP integration, a literature review about the acceptance of these systems, research methodology, results and analysis, discussion, and the conclusion.

2. Theoretical Background

2.1. Integration of GIS and ERP Systems

Geographical information systems (GIS) are computer tools for creating and visualizing digital maps [2]. NCGIA (National Center for Geographic Information and Analysis) defines GIS as a system that supports and enables design, modeling, analysis, and visualization of georeferenced data to use in solving problems regarding planning and management of different resources [30]. GIS enables the representation and integration of spatial information. The data referenced in GIS tools and presented in maps may relate to natural sciences such as biological, physical, chemical domains as well as other sciences such as social, environmental, economic, or any other properties of the earth’s surface. GIS tools support mapping, querying, modeling, and analyzing, with the use of large quantities of diverse data, using a single database (for example [4,31]). GIS strength and popularity are thus connected with its ability to combine large quantities of environmental information and its functionality offered by GIS tools, which enable the research of diverse data [32].
We conducted a bibliometric analysis to get insights into research in this area. The overview of bibliographic units indexed in Scopus was obtained on 12 November 2021. Scopus is Elsevier’s database of citations and abstracts of bibliographic publications, which was introduced in 2004 to encourage experts and institutions in research work and the use of the results of scientific findings. It is a highly regarded collection of abstracts and citations of research results published in peer-reviewed publications, especially in scientific journals [33].
Based on keywords »GIS« and »Enterprise Resource Planning«, the search revealed 47 bibliographic units, as presented by Figure 1.
The number of bibliographic units was detected from 1998 onwards, and the research opus fluctuated over the years. If we look at the content, there is also a visible transition from a greater emphasis on the GIS system to systems where a high level of connection and interaction between the two systems, GIS, and ERP, can be observed. Even before 1998, the research attempts to connect GIS with the planning in enterprises and, generally, with information systems to support decision making exist.
Early research studies in this area have focused on managing resources in different business areas. In one of the earliest research attempts, research focused on the development of the GIS in Australia, with the purpose of developing tools providing decision support for resource planning and effective utilization of GIS [34]. Another example focusing on spatial economics is the article of Walford [35]. It deals with the distribution of tourist farms in the UK, which is an important part of the rural tourism system. The geographical characteristics of the tourist farms’ environment can significantly contribute to the diversification of tourist farms and to the identification of individual accommodation. The information system, which connects rural tourist accommodation with the exceptional characteristics of the location, such as natural sights, cultural heritage sites, and the like, enables the diversification of the characteristics of individual accommodation. At the same time, it allows the analysis of patterns of influence of micro-location and characteristics of adjacent areas on tourist accommodation, and thus on the planning of further development of areas and rural tourism.
A highly cited article by Li et al. [36] that directly connects GIS and ERP systems in companies is dealing with construction waste management. The utilization of a global positioning system (GPS) and GIS technology to reduce construction waste, with barcoding information systems for the management of construction materials and equipment, is proving to be very effective in reducing on-site waste. Similarly, a highly cited article from the oil industry emphasizes the importance of a high degree of integration of individual systems in comprehensive information systems. Research in this area for a diversified oil company supplying oil derivatives from distribution centers to many customers [37] found that it was possible to successfully link a supply chain management application with GIS and ERP systems to gain an innovative decision support tool.
In recent research, an even greater emphasis is on information systems that utilize GIS and incorporate it with ERP systems, often focusing on specific characteristics of the organization. The recent research [38] focuses on ERP systems for water management that uses GIS to develop an efficient water management system targeting the general objectives of water security. Smart water management systems consist of several strategic methods and tools, and this research confirms that such a connection can help build an efficient water management system, thus reducing the threat to water resources, consequently leading to water loss and higher production and distribution costs.
Similarly, the advantages of incorporating GIS into ERP systems are highlighted in the research of Morales et al. [39]. This research focuses on an information system of a platform that would provide process management in agriculture, specifically in Spain, to produce wine with a protected geographical indication. This type of platform is based on the principles of ERP systems and geolocation information from land related to the protected geographical indication. Research has confirmed that the benefits of using such information systems are multifaceted. On the one hand, the platform provided access to agricultural data and geolocated information in real-time, and on the other hand, it provides management tools to the individual or organization, the holder of agricultural activity, which enables the future development of agricultural systems.
When analyzing the integration of GIS and ERP systems in organizations, the advantages of such integration are particularly emphasized [40]. Through integration, the employee in the organization who use systems can visualize ERP business data inside the GIS tools and can get direct access to the GIS functionality provided by tools inside the ERP system [41]. A user of integrated systems can get support on a higher level while he/she is empowered to make decisions by visualizing the information from both systems simultaneously on the workstation [42]. As support is provided on an advanced level, switching between systems is not needed anymore. Abou-Ghanem and Arfay [22] pointed out that integrating GIS into ERP systems offers features that fall into the three categories:
  • Adding geo attributes for business decisions by linking business data with geo data.
  • Integrating business functionality from ERP system with geo functionality from GIS provides mixed functionality, which is accessible to all software components.
  • Combining business and spatial information and functionality to all levels of users.
GIS and ERP integration enables new business transaction scenarios or improves the execution of existing business transactions that use the combined functionality of both systems. GIS and ERP integration can utilize an ERP-centric approach, GIS-centric approach, and composite ERP/GIS approach [42,43]. In the GIS-centric approach, the map is the main user interface, and business data from ERP is accessed from the map, so the user typically selects features and retrieves business ERP data or updates it using the ERP transaction module. The ERP-centric approach, on the other hand, embeds a map within the ERP user interface. The map, in this case, has less GIS functions and available tools than in a GIS-centric approach, but still allows event-based business retrieval of ERP data. The composite ERP/GIS approach uses services of both GIS and ERP systems, and the user interface is designed according to the functionality of the business task, with the map providing a central or supporting role.
Integrated GIS and ERP systems support business processes and provide functionalities such as [44]:
  • Decisions regarding product distribution and management of transport costs by mapping relationships between customers and plant/storage locations.
  • Decisions where to define optimal location of new production facilities according to selected criteria.
  • Managing supply chain and/or distribution from a geographic viewpoint.
  • Managing service activities by analysis of response time by regions.
  • Decisions regarding customers by analyzing their habits from the viewpoints of attributes such as preference for a product and visualizing them on the map or mixing them with demographic data for better marketing and sales.

2.2. Acceptance of Information Systems by Users

The successful use of information systems and information technology depends not only on how successful the implementation has been in organizations, but above all on its efficient and successful use by users after implementation. Researchers use several theoretical research models to study the acceptance of information systems and information technology. The most popular models used are: the Theory of Diffusion of Innovation (DIT; [45]), the Theory of Task-Technology (TTF; [46]), the Theory of Planned Behavior (TPB; [47]), the Theory of Reasoned Action (TRA; [48]), Decomposed Theory of Planned Behavior [49], the Technology Acceptance Model (TAM; [50,51]) and extensions TAM 2 [52], TAM 3 [53], Unified Theory of Acceptance and Use of Technology (UTAUT; [54]), etc., see [55,56].
To explore the end-user acceptance of information systems, TAM and its latest versions have proven to be the most promising among the above-mentioned research models [26,27,28,29,57,58,59,60]. The power of the TAM is confirmed by many studies that highlight its wide applicability to various technologies [61]. In TAM, two beliefs are initially important for the acceptability of systems and technology [50]. These beliefs are perceived usefulness (PUS) and perceived ease of use (PEU). TAM determined perceived usefulness (PUS) is the point to which an information system user believes that the work with a particular information system would improve its performance, while perceived ease of use (PEU) is defined as the point to which the information system user considers that the work with the certain information system will not require additional work [50]. These two beliefs further positively influence the information system user’s attitude about the use of particular information systems (ATU), which in turn affects the information system user’s behavioral intention regarding the work with the particular information systems (BIU). The behavioral intention of using a particular information system (BIU) is further positively linked to its real use. In the model, TAM has also highlighted the relationship between perceived ease of use (PEU) and perceived usefulness (PUS), as the work saved for the reason that improved perceived ease of use can be reallocated, allowing information system users to do more work at the same time and with the same effort. Perceived usefulness (PUS) is also positively related to the behavioral intention of using a particular information system (BIU) because if users perceive greater usability of a particular information system, they will be more likely to intend to use that information system [51].
Basic TAM and its extended versions have been used to research the acceptability of different information systems (e.g., [61,62,63]). Although TAM is used in a variety of different information systems, TAM additions and/or modifications are required in the analysis of specific information technology [59]. Marangunić and Granić [61], based on a comprehensive literature review (85 scientific publications), pointed out that despite progress in discovering new factors that have a significant impact on the basic variables of TAM, there are many unexplored parts of the application of the model that can contribute to its predictive power. They added that they could highlight four main ways of TAM implementations for research in the future: moderating the role of various variables, including additional variables in TAM, researching actual use, and exploring the target group of older adults.
Additionally, in the area of ERP systems, some studies have been done on the acceptance of ERP systems by companies’ employees [26,28,29,60,63,64,65,66,67,68,69,70,71,72,73,74]. An evaluation of previous ERP research related to TAM shows that various research has explored ERP system acceptance [75,76] where researchers have explored different views of the ERP use, usually focusing on a limited number of external factors that can involve the ERP acceptance at different stages of the ERP system life cycle [26,57,58,59,60,67,69,70,77,78,79,80,81,82,83,84].
Most ERP acceptability studies focus on the system’s acceptance by companies’ employees. Research studies designed to analyze the factors influencing students to adopt an ERP system are rare. One of the earliest research projects conducted among students regarding the ERP system analyzed students’ readiness to change (gender, computational self-efficacy, and perceived ERP system benefits) regarding the purpose of behavior intention to work with ERP system (BIU) in the year 2006 [85]. The research conducted in 2007 focused on a case study at a medium-sized university, where the relationship between training, satisfaction, and perceived usefulness (PUS), perceived ease of use (PEU), efficiency, and effectiveness of using the ERP system was studied [79]. Another research conducted in 2009 explored the following determinants of computational self-efficacy in multimedia use software: students’ cognitive engagement, computational fear, organizational support, as well as prior experience [86]. Sternad Zabukovšek et al. [71,72,87,88,89] examined the economics and business students’ acceptance of ERP systems and the impact of external factors that shape their goals to utilize this expertise in their upcoming professional careers. The Sternad Zabukovšek et al. extended version of the TAM-based research model has been built up from three detected second order (multidimensional) external factors. Research results showed that some external factors of these three second order (multidimensional) factors were a vital part in determining students’ attitude towards the adoption of ERP systems.
When researching acceptance of GIS using TAM, we found that although there are studies that report about the adoption of GIS by users, they do not relate to GIS integration with ERP systems, but merely to the acceptance of GIS as such. The research reports are found in various areas, such as studying readiness to use GIS in the private health system for better management in the perspective of the COVID-19 pandemic [90] or in natural disaster management [91], if we mention only two of the most recent studies.
GIS integrated with ERP system and the acceptance of such system by users was the focus of single research, found in Scopus (as of 23 November 2021), where the acceptance was assessed by the acceptance test (not TAM modeling) [92]. The research highlights the importance of GIS in the management of maritime freight terminals, which were not yet integrated with ERP systems at the time of the research. Therefore, the researchers proposed the inclusion of a GIS module within the ERP system and presented the integrated system possibilities. Acceptance rates were reported to be high in Indonesian sea freight ports.

3. Research Model and Methodology
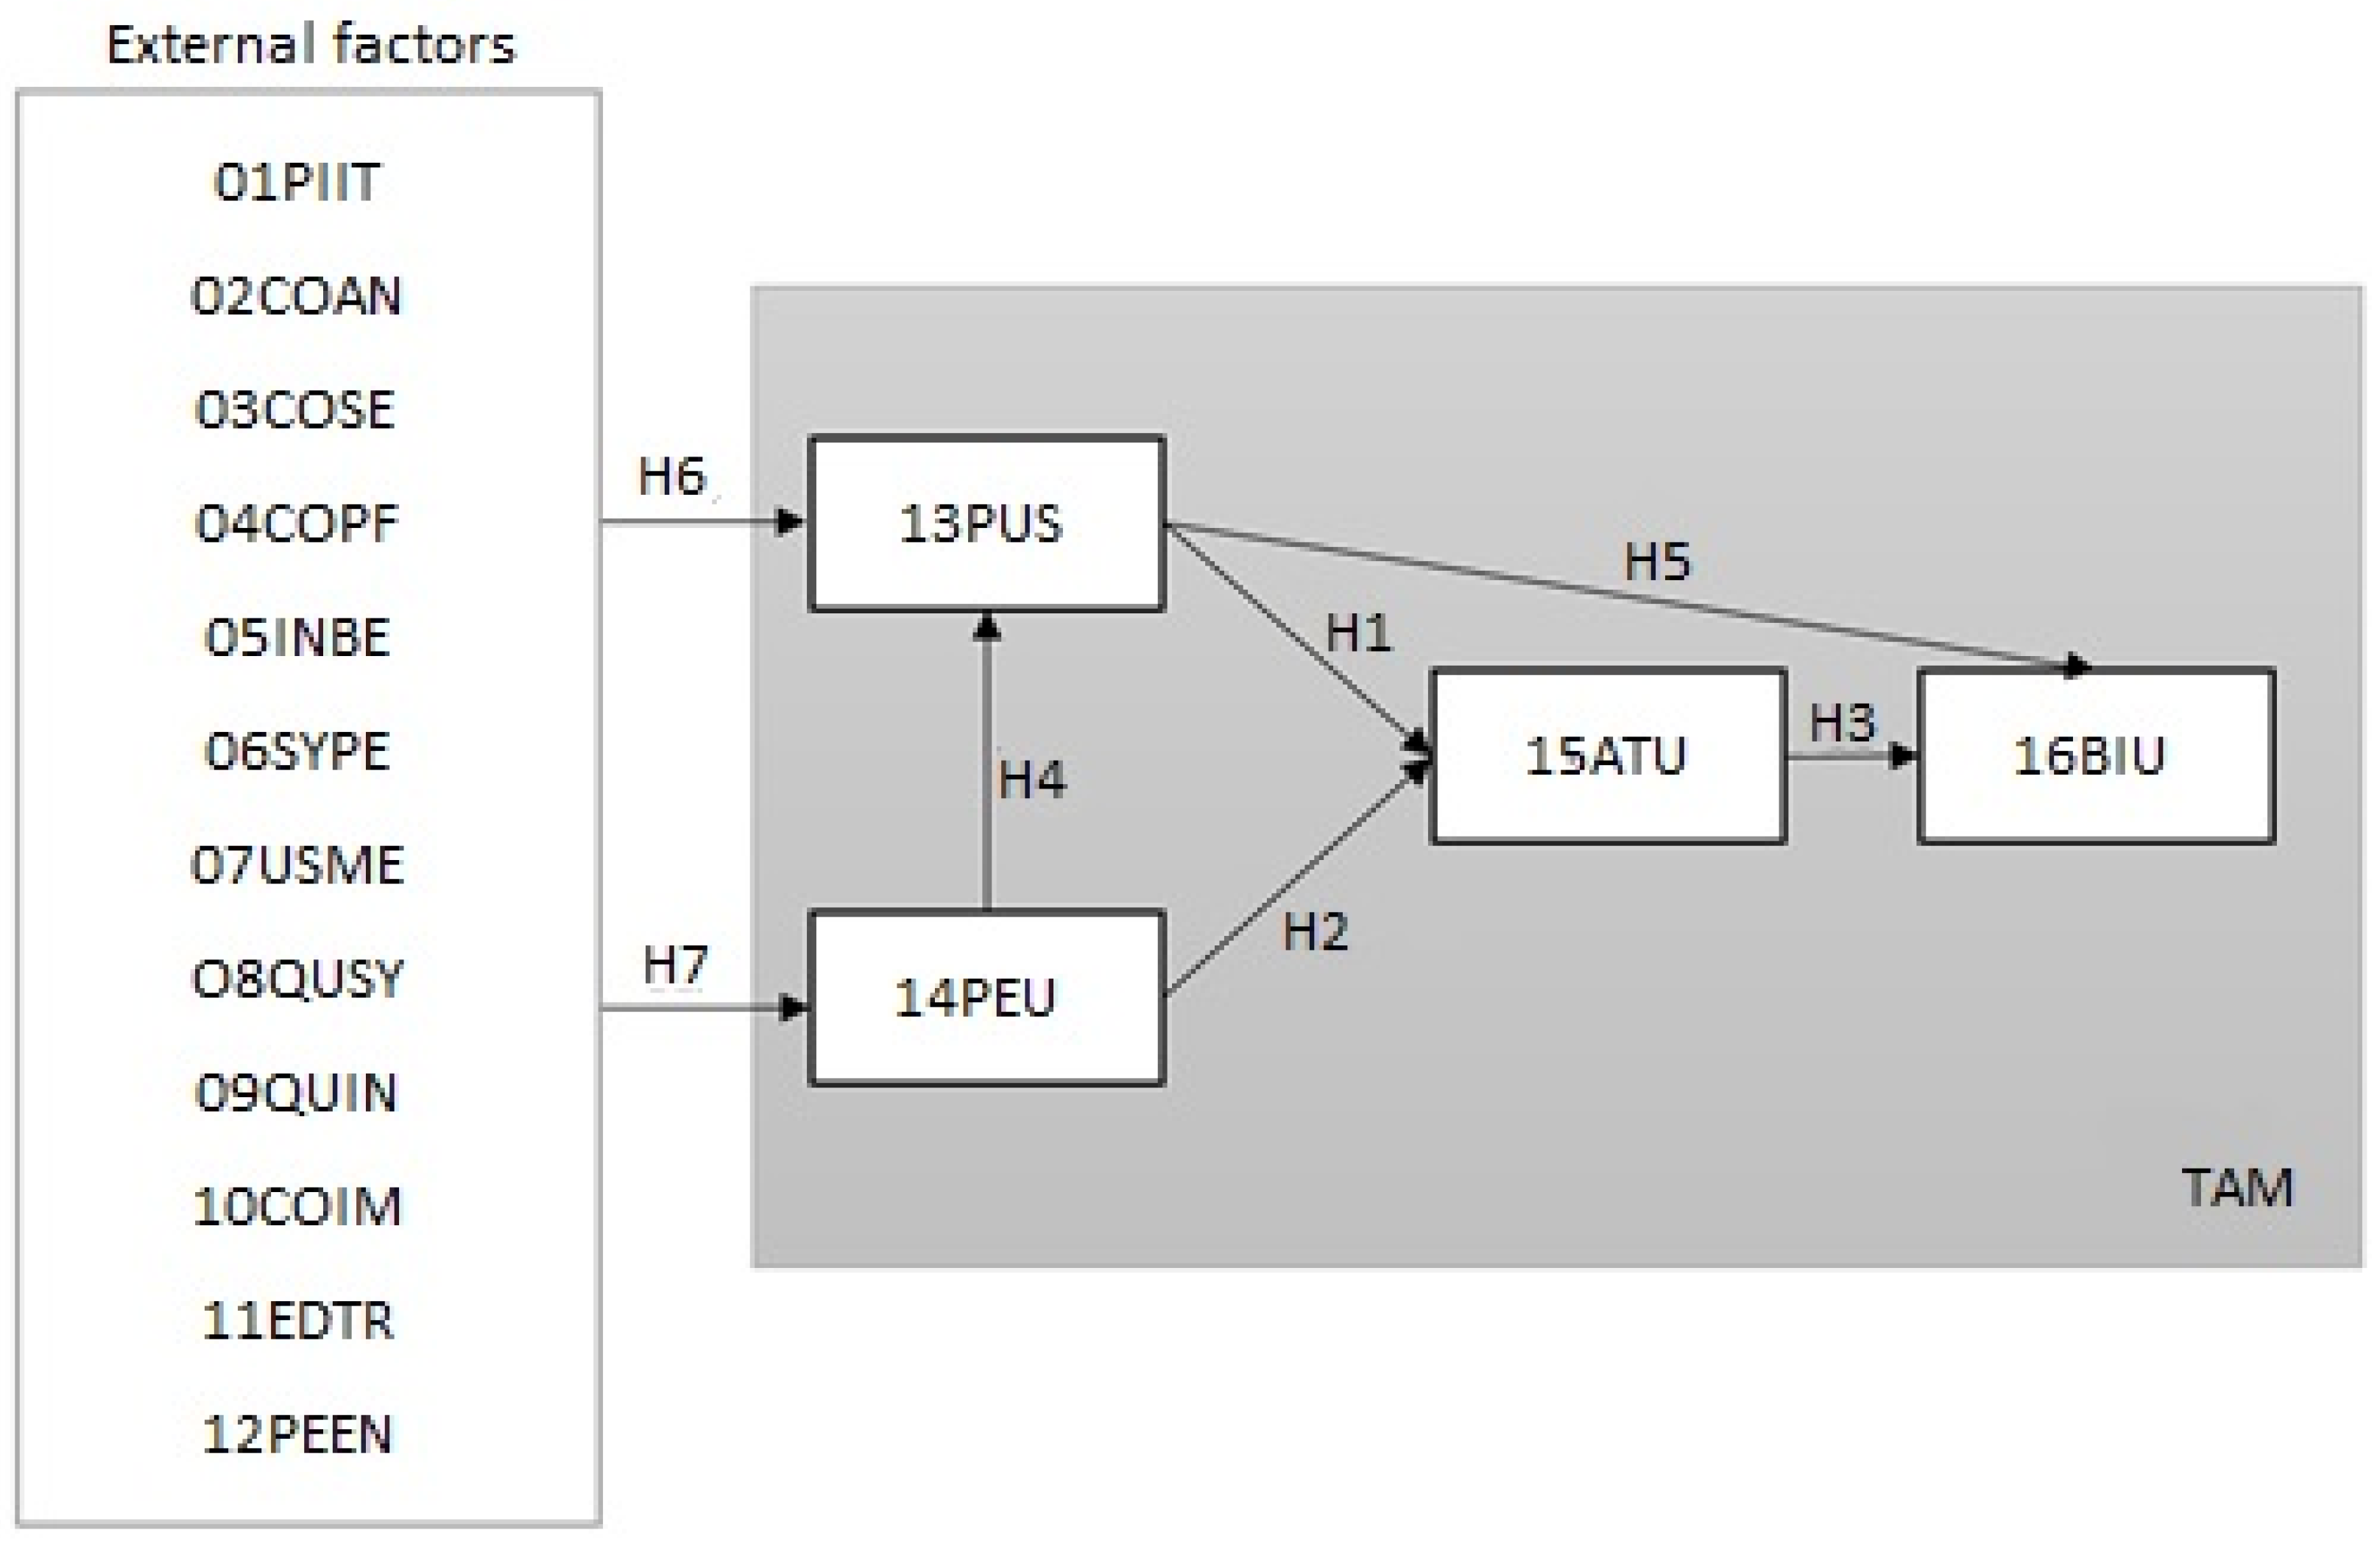
3.1. Research Model

Firstly, we based our research on the Sternad Zabukovšek et al. [71,72,87,88,89] extended version of TAM; it includes five classical hypothesized impacts of factors of the basic TAM model [50,51], which can be seen in Figure 2 (grey part in Figure 2; variables are described in Table 1 below):
Hypothesis 1 (H1).
Factor perceived usefulness ERP-GIS system (13PUS) positively influences internal factor attitude toward using ERP-GIS system (15 ATU).
Hypothesis 2 (H2).
Factor perceived ease of use ERP-GIS system (14PEU) positively influences internal factor attitude toward using ERP-GIS system (15 ATU).
Hypothesis 3 (H3).
Factor attitude toward using ERP-GIS system (15 ATU) positively influences internal factor behavioral intention to use ERP-GIS system (16BIU).
Hypothesis 4 (H4).
Factor perceived ease of use ERP-GIS system (14PEU) positively influences internal factor perceived usefulness ERP-GIS system (13PUS).
Hypothesis 5 (H5).
Factor perceived usefulness ERP-GIS system (13PUS) has a positive influence on factor behavioral intention to use ERP-GIS system (16BIU).
Secondly, the proposed research model includes hypothesized influences of external factors on the antecedents of one’s attitude towards ERP–GIS and one’s behavioral intentions for ERP–GIS future use. This part of the model is based on findings in the past research [87,88] that were focused on ERP acceptance, not on GIS. However, nevertheless, the results suggested that external factors may play a significant role in outlining one’s attitudes towards using ERP systems. Authors developed a model where eleven external first-order factors affect perceived usefulness (13PUS) and perceived ease of use (14PEU), but this impact was indirect—through the three second order (multidimensional) factors. Therefore, the direct effects of first-order external factors were not analyzed. In our research, additionally, the twelfth external factor was included in the model—namely, perceived enjoyment (12PEEN), as proposed by Venketesh and Bala [53]. This part of the model allows us to examine the direct influence of i-th first-order external factor itself (i = 1, 2, …, 12) on the perceived usefulness of ERP-GIS system (13PUS) and perceived ease of use of ERP-GIS system (14PEU) of the basic TAM, as follows:
Hypothesis 6 (H6).
The i-th external factor has a positive influence on perceived usefulness of ERP-GIS system (13PUS), i = 1, 2, …, 12.
Hypothesis 7 (H7).
The i-th external factor has a positive influence on perceived ease of use of ERP-GIS system (14PEU), i = 1, 2, …, 12.
The suggested research model is shown in Figure 2.
An additional goal of our research is to assess the possibility if there are also certain interdependencies among the external factors that may lead to the fact that some external factors do not have an explicit impact on the internal factors of the basic TAM model, but an indirect influence through other external factors.

3.2. Methodology

The questionnaire was prepared in three steps. The questionnaire is based on Sternad Zabukovšek et al. [87,88], where we adjusted the measurement scales of the factors to match the ERP-GIS systems. As already mentioned, the additional external factor was included, named perceived enjoyment of ERP-GIS system (12PEEN). The factors’ definitions are presented in Table 1.
For all items, we used a 7-point Likert scale (where 1 means “strongly disagree” to 7, which means “strongly agree”). In the first step, we included four factors of the fundamental TAM model offered by Davis [50] and Davis et al. [51]. This includes perceived usefulness of ERP-GIS systems (PUS), perceived ease of use of ERP-GIS systems (PEU), attitude to ERP-GIS system use (ATU), and behavioral intention to use ERP-GIS systems (BIU) that were adapted for this study. We did not include factor use of ERP-GIS systems (Use) because students did not have practical interaction with the ERP-GIS system; they just participated in the lecture and presentations regarding the use of ERP-GIS systems. In the second step, the questionnaire was pilot analyzed with 3 teachers and 21 students who participated in project Spationomy [111] and had knowledge of ERP-GIS systems. Based on the results of the pilot analysis, some changes involving the order of words have been made for better understanding. After that (the third step), over 200 students of the E-business course at the Faculty of Economics and Business, University of Maribor, participated in the survey. In the introduction to the questionnaire, we presented the research, the survey, and the data collection and processing process to the respondents—students. All respondents were free to choose to participate. The research itself, its purpose, and the planned publication of the results were properly presented to the students before data collection. Data collection took place without the collection of personal data or identification codes. In this research, we received 154 questionnaires, but we removed 33 of them due to the missing data. The sample involved 121 respondents. After the one-hour lecture on the importance of ERP-GIS system integration, we collected the data. Students also previously attended the course regarding ERP systems and business processes (namely sales, purchase, and manufacturing processes), which also included practical use of an ERP system in a computer lab where they acted as employees in a simulation company and they conducted business transactions using Microsoft Dynamics NAV modules and using SAP modules [112]. Due to this, they were familiar with the functionality of ERP systems, and they were aware of how important the use of ERP systems in the business world today was. Therefore, they were familiar with the functionality of ERP systems, but have not yet used GIS. On that basis, the teacher presented them with some selected companies with a large amount of data saved in the ERP systems, including geographic (spatial) parameters, where visualizing data on maps is more relevant than just viewing data itself. If companies want to visualize data on maps inside ERP systems, they have to combine their ERP system with the GIS system. Students were introduced to examples of the ERP-GIS system integration usage in various industries, and the advantages of the use of the integrated systems were presented, along with the possibilities of how to quickly get information for business decision-making with the help of maps and spatial data. This is exactly the situation that employees using ERP in firms are facing, when GIS as a new functionallty integrated in ERP, is introduced in their working environment.
The aim of our research was not to asses learning outcomes in a study process, but to consider students involved as users/employees in a company. As already mentioned, our research is aimed at assessing the acceptance of ERP-GIS modules by users of ERP, and we employ the TAM research model, as described in this chapter of the article.
The sample included 34.7% (42) of men and 65.3% (79) of women who answered the questionnaire. Most of the students were between 20 and 24 years old, who had been using a computer on average for 11.7 years. They began computer training and education on average six years ago, so it is important to assume they having the computer literacy skills. They came across business information systems on average three years ago when they enrolled in the study program, so it is important to assume their business skills. Additionally, a great share of them had between one and three years of work experience (53.44%; 53 students). Students self-assessed the level of their computer skills, where 5 students (4.1%) indicated a low level, 18 students (34.7%) an average level, 42 (34.7%) slightly more than average, 45 (37.2%) very high, and 11 students (9.1%) most of the computer skills. They also assessed their knowledge of GIS-ERP systems before starting the course. The majority of students, 67 (55.4%), did not know GIS-ERP systems at all, or they knew ERP-GIS systems poorly (29.6%, 36 students), and consequently had no practical experience with GIS-ERP systems. Further, 38% (46 students) answered that for them, this is a new field, while 44.6% (54 students), however, were familiar with the GIS-ERP system on a very low or medium level.

4. Results

The Partial Least Squares Structural Equation Modeling (PLS-SEM) method has become interesting among researchers. It can be used to develop complex models with several factors, indicators, and structural paths. In addition, the PLS-SEM method is a method of a cause-and-effect approach to SEM that allows prediction in the estimation of statistical models whose structures are designed to present a cause-and-effect description [113,114]. Hair et al. [114] added that the method allows an explanation of the research model and prediction, which is the foundation for the development of organizational implications. They also pointed out that PLS-SEM should be chosen when: the analysis tests the theoretical research model from a forecast view; a complex research model that includes many factors, indicators, or relationships; a small population limits sample size; distribution problems are a concern (e.g., lack of normality), etc. In the PLS-SEM method, the research model is evaluated in three parts. Firstly, the evaluation of the external model is conducted, where the measurement model is evaluated; secondly, the evaluation of the inner model, which we also call a structured model, and thirdly, dipper analysis with IPMA method, is conducted. We used SmartPLS software [115] for analysis and followed the guidelines of the authors Hair et al. [114,116] and Garson [117].

4.1. Measurement Model

Our model is a reflective model, graphically presented with the arrows pointing from the factor to the indicator variables, representing the assumption that the one-dimensional basic factor determines the values of the measured values and representative variables of the indicator [117]. A reflective measurement model should be evaluated against four measurements: (1) indicator reliability, (2) internal consistency reliability, (3) convergent validity, and (4) discriminant validity.
Indicator reliability is measured by the square of standardized indicators of external (outer) loadings. It represents how much variation in an item is expressed by the factor—this is the variance derived from the item. If the reflective indicator loading is higher than 0.70, then the indicator reliability is higher than 0.50. In Table 2, we can see that all values of indicator loadings are higher than 0.70 and that all values of indicator reliability are higher than 0.50, providing acceptable indicator reliability.
The Cronbach’s alphas and/or the composite reliability measures are identified for internal consistency reliability. The Cronbach’s alpha represents how closely the set of test items is related as a group, while the composite reliability represents the total amount of the true score variance in comparison with the total variance of the score of the scale [118]. The Cronbach’s alpha is the lower limit, while composite reliability is the upper limit. Both measures should have a minimum of 0.70 (0.60 in exploratory research). If the values of these measures are between 0.60 and 0.70, then they are considered as acceptable values; if the values are equal or greater than 0.70, they are considered as satisfactory values; and if the values are equal to or greater than 0.80, then considered as good values. Table 3 shows that almost all values except two Cronbach’s alpha values are higher than 0.70, which represent satisfactory values of internal consistency reliability. Two Cronbach’s alpha values are below 0.70 but above 0.60, which is acceptable for exploratory research such as ours. Additionally, all composite reliability values are higher than 0.80, which represents good values of internal consistency reliability. Both measures show good internal consistency reliability for our exploratory research.
Convergent validity shows the extent to which factors congregate to illustrate the variance of their indicators. Reflective indicators are thought of as a separate process toward measuring the same factor in a sampling model, so the items (indicators) of a particular reflective factor should have a huge total part of the variance. Measures of convergent validity reflective factors are external loadings of the items (indicators) and the extracted average variance (AVE). External (outer) loadings are also known as indicator reliability, which we checked above and are of an acceptable level for our research model (see Table 2). The second measure is the AVE, which is specified as the large mean value of the squared loadings for the factor indicators and can be explained as a total of the square loads distributed by the number of items. The AVE values have to be 0.50 or higher. All AVE values in our research model are higher than 0.50 (see Table 3). Indicator reliability values and AVE values are satisfactory, so we can confirm the convergent validity.
Garson [117] pointed out that AVE could also be applied to verify discriminant validity by the traditional Fornell–Larcker [119] principle, and additionally, the cross-loadings of indicators are checked. To satisfy the criterion of Fornell–Larcker [119], the square root of AVE values on diagonal must be higher than other factors, which are in correlation with the observed factor. Cross-loadings criteria could also be useful in establishing discriminant validity. Even more, cross-loadings can be seen as a substitute measure to AVE for reflective models [117]. External (outer) loadings should be over 0.70, and cross-loadings should be under 0.30. All loadings in our research model are higher than 0.70 (see Table 2), and cross-loadings are below 0.30. (The Fornell–Larcker table and table of cross-loadings are available from authors, by request). In the latest research, researchers (e.g., [114,120]) point out that the Heterotrait–Monotrait (HTMT) ratio describes discriminant validity better and that one should use HTMT to assess it. HTMT values are described as the mean values of the items (indicators) correlation among factors relative to the (geometric) mean of the average correlations for the items (indicators) determining the equal factor. The HTMT value of each indicator should be lower than the value of 1. Henseler et al. [120] pointed out that discriminatory validity is questionable if HTMT values are above 0.90 for conceptually similar factors or above 0.85 for conceptually different constructs. Their proposed threshold is 0.85. All HTMT values of our research model are below 0.90, which is presented in Table 4. As some HTMT values in Table 4 are between 0.85 and 0.95, we also checked the upper limit of the 95% confidence interval of HTMT values, which must be lower than 1. All HTMT confidence interval upper values for our research model are below 1 (see Table 2). All three criteria of discriminant validity meet requirements.
Our research model meets the criteria of the reflective measurement model, so in the next step, we can evaluate the structural model.

4.2. Structural Model
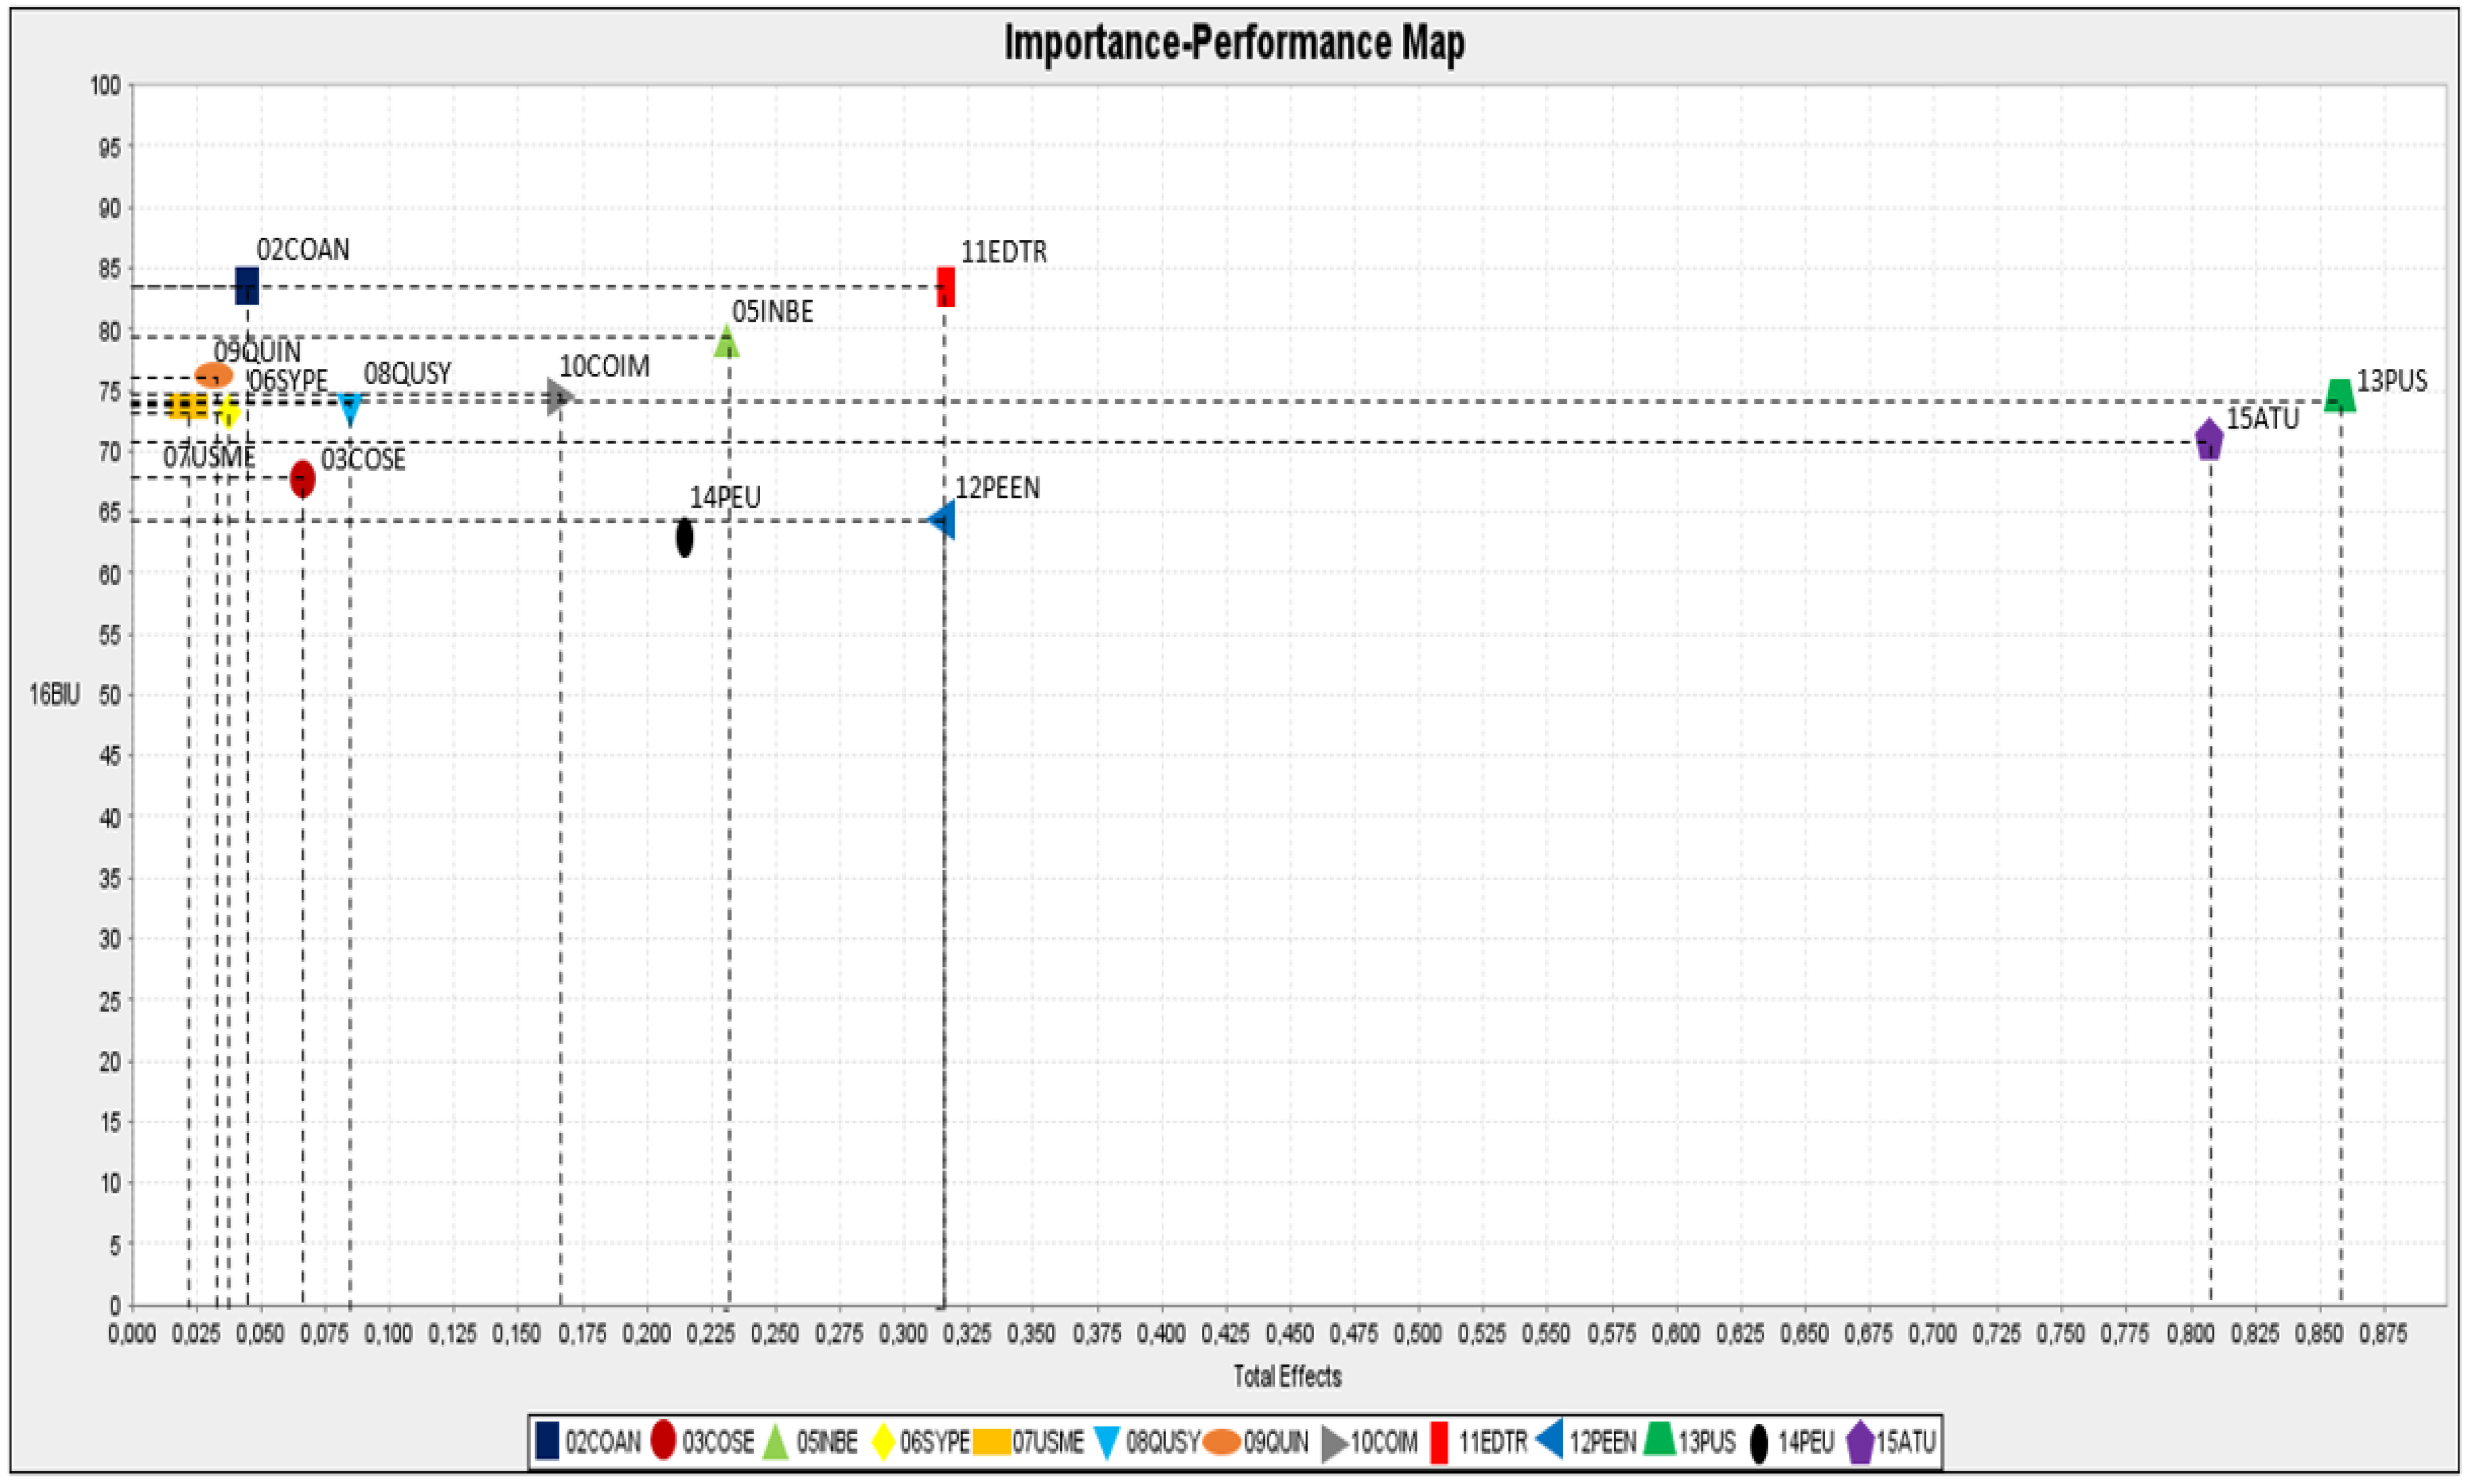
For the structural model, standard measures assessments are (1) coefficient of determination (R2), (2) the measure Q2 as well as (3) the path’s coefficients’ statistical significance (relevance).
However, before evaluating the structural model, Hair et al. [114] pointed out that collinearity should be checked via inner variance inflation factor (VIF) values (they should be less than 3). All our VIF values are below 3, which shows that collinearity is not an issue. (VIF values calculations are available from the authors by request.)
The R2 is the measure of the explanatory power of the research model and measures the variation, which is described in every one of the endogenous factors. Endogenous factors are determined or changed through their relationships with other factors within the research model, and they are the opposite of exogenous factors—independent factors. The thresholds are 0.75 for substantial, 0.50 for moderate, and 0.25 for weak impact. We calculated the average R2 of our research model, which is 0.515. From Table 5, we can see that four factors, namely perceived quality of ERP-GIS systems (08QUSY; R2 = 0.688), perceived usefulness of ERP-GIS system (13PUS; R2 = 0.553), attitude toward using ERP-GIS system (15ATU; R2 = 0.556) and behavioral intention to use ERP-GIS system (16BIU; R2 = 0.590) have a moderate impact, and two factors, namely individual benefits (05INBE; R2 = 0.251) and perceived ease of use ERP-GIS system (14PEU; R2 = 0.452), have a weak impact. We can conclude that two external factors, namely computer anxiety (02COAN) and computer self-efficacy (03COSE), explain 25.1% of the variance in external factor individual benefits (05INBE; R2 = 0.251). External factors system performance (06SYPE), user manuals (07USME), and quality of ERP-GIS information (09QUIN) explain 68.8% variance in external factor perceived quality of ERP-GIS systems (08QUSY; R2 = 0.688). The external factors community impact (10COIM), education and training about ERP-GIS systems (11EDTR), and perceived enjoyment of ERP-GIS systems (12PEEN) explain 55.3% of the variance in factor perceived usefulness of ERP-GIS system (13PUS; R2 = 0.553). External factors quality of ERP-GIS systems (08QUSY) and perceived enjoyment to ERP-GIS systems (12PEEN) explain 45.2% of factor perceived ease of use of ERP-GIS system (14PEU; R2 = 0.452). The factors perceived usefulness of ERP-GIS system (13PUS) and perceived ease of use of ERP-GIS system (14PEU) explain 55.6% of variances in factor attitude toward using ERP-GIS system (15ATU; R2 = 0.556). Finally, the factors perceived usefulness of ERP-GIS System (13PUS) and attitude toward using ERP-GIS system (15ATU) explain 59.0% of the variance for factor behavioral intention to use ERP-GIS system (16BIU; R2 = 0.590).
Another criterion for evaluating the predictive accuracy of the PLS path model is Q2 values based on the blindfolding technique. The blindfolding technique eliminates individual points in the matrix of the data matrix, imputes the removed points with the average, and evaluates the parameters of the model. Q2 value higher than 0.50 shows large predictive relevance, a value higher than 0.25 shows medium predictive relevance, and 0 shows small predictive relevance of the PLS path model. All Q2 values in our research model are higher than 0, where the average value is 0.348, which reflects the medium predictive relevance for our research model. Factor behavioral intention to use ERP-GIS system (16BIU) has large predictive relevance (Q2 = 0.520); factors perceived quality of ERP-GIS systems (08QUSY; Q2 = 0.438), perceived usefulness of ERP-GIS system (13PUS; Q2 = 0.339), perceived ease of use of ERP-GIS system (14PEU; Q2 = 0.286) and attitude toward using ERP-GIS system (15 ATU; Q2 = 0.323) have medium predictive relevance, and individual benefits (05INBE) has small predictive relevance (Q2 = 0.179) in our research model (see Table 5).
PLS-SEM relies on a nonparametric procedure named bootstrapping to examine the significance of path coefficients. Bootstrapping method randomly takes subsamples from the initial data setting (by replacement). The subsample is then applied to evaluate the PLS path model, where the procedure is repeated until many random subsamples (e.g., 5000) are generated [116]. Path coefficients (β) confirm that the relationship among the two factors is strong if the path coefficients (β) value is greater than 0.1. t-statistic value is the basis for determining whether the independent variable has a statistically significant effect on the dependent variable in the research model. At 5% significance, t-statistic value must be greater than value 1.96 [121]. The strength of significance is assessed by the p-values, where p < 0.001 shows strong significance, p < 0.01 shows moderate significance, p < 0.05 shows the weak significance, and p ≥ 0.05 shows no significance. Table 6 shows the values of path coefficients (β) and statistical significance of path coefficients (t-statistics) for our research model. In Table 6, external factors of personal innovativeness toward IT (01PIIT) and computer playfulness (04COPF) are not shown, as they do not have a statistically significant effect on any factor of basic TAM. Graphical results in Figure 3 show values of path coefficients (β) and t-statistic values (in brackets) on arrows, and R2 values in rectangles together with the name of factors.
It can be concluded that the path coefficients in the basic TAM show a strong significant impact of perceived usefulness of ERP-GIS system (13PUS) on attitude toward using ERP-GIS system (15ATU; β = 0.383, p < 0.001), as well as of the perceived ease of use of ERP-GIS system (14PEU) on attitude toward using ERP-GIS system (15ATU; β = 0.289, p < 0.001). Furthermore, the factor perceived usefulness of ERP-GIS system (13PUS) strongly significantly effects behavioral intention to use ERP-GIS system (16BIU; β = 0.298, p < 0.001). Attitude toward using ERP-GIS system (15ATU) strongly significantly influences behavioral intention to use ERP-GIS system (16BIU; β = 0.545, p < 0.001). The impact of the perceived ease of use of ERP-GIS system (14PEU) on the perceived usefulness of ERP-GIS system (13PUS; β = 0.023, p > 0.05) is not statistically significant, although it is one of the relationships in basic TAM. In Figure 3, this relationship is marked as a dotted arrow. Factors of personality traits (computer anxiety (02COAN) and computer self-efficacy (03COSE)) have a significant effect on attitude toward using ERP-GIS system (indirectly through factor individual benefits (05INBE), (15ATU; β = 0.275, p < 0.001), but has no statistical effect on perceived usefulness of ERP-GIS system (13PUS; β = 0.089, p > 0.05) and perceived ease of use of ERP-GIS system (14PEU; β = 0.044, p > 0.05). In Figure 3, these two relationships are marked as dotted arrows, as well.
All factors relating to the teaching process and the environment of the faculty: community impact (10COIM), education and training about ERP-GIS systems (11EDTR), and perceived enjoyment of ERP-GIS systems (12PEEN) have a significant effect on the perceived usefulness of the ERP-GIS system (13PUS). Community impact (10COIM) has the moderate statistical effect (13PUS; β = 0.241, p < 0.01), education and training about ERP-GIS systems (11EDTR) have a strong statistical effect (13PUS; β = 0.310, p < 0.001) and perceived enjoyment of ERP-GIS systems (12PEEN) has a moderate statistical effect on perceived usefulness of ERP-GIS system (13PUS; β = 0.339, p < 0.01). It also has a strong statistical effect on the perceived ease of use of the ERP-GIS system (14PEU; β = 0.434, p < 0.001). System-technological factors, e.g., system performance (06SYPE), user manuals (07USME), and quality of ERP-GIS information (09QUIN), have a strong indirect effect (through the perceived quality of ERP-GIS systems (08QUSY)) on factor perceived ease of use ERP-GIS system (14PEU; β = 0.320, p < 0.001).
The standardized root means square residual (SRMR) measure is used to estimate the fit of the model and is described as the root mean square differences among the examined correlations and implied model correlations. A threshold value lower than 0.08 presents a good fit for the model. Our research model has an SRMR value of 0.078, which represents a good fit for our research model.

4.3. IPMA

Importance–performance map analysis (IPMA) expands the traditional reporting of PLS results of path coefficient (β). IPMA analysis adds a new aspect to the analysis, which considers the average values of the outcomes of the latent factors. Importance studies the absolute overall (total) effect on the final endogenous factor in the path diagram, while performance studies the size of the results of the latent factors [117]. Our factor of interest in the research model is behavioral intention to use the ERP-GIS system (16BIU). Results of our research model are presented in Table 7 and in Figure 4. In the column Importance in Table 7 (also on x-axis in Figure 4), we can see which factors are more important for factor behavioral intention to use ERP-GIS system (16BIU) as compared to others. They have a higher absolute total effect on the factor of interest. From Table 7 and Figure 4, we can see that the most important factors are perceived usefulness of ERP-GIS system (13PUS; value is 0.856) and attitude toward using ERP-GIS system (15ATU; value is 0.806), followed by perceived enjoyment using ERP-GIS systems (12PEEN; value is 0.317), and education and training about ERP-GIS systems (11EDTR; value is 0.315). Performance measures the size of the results, and the values are shown in column Performance in Table 7 and on y-axis in Figure 4. Factors have better performance if they have higher average latent factor scores, and these reflect stronger measurement paths. From Table 7 and Figure 4, we can see that factors perceived usefulness of ERP-GIS system (13PUS) with value 74.202 and attitude toward using ERP-GIS system (15ATU) with value 70.827 are very important. However, their performance level is not the highest. The highest performance value is observed for factor education and training about ERP-GIS systems (11EDTR; value is 83.360), followed by factor computer anxiety (02COAN; value is 83.522).

5. Discussion

In the conducted study, we first tested five classical hypothesized impacts of factors of the TAM model [50,51]. The results are consistent with other surveys on ERP acceptance by users (e.g., [27,28,29,60,67,68,70,71,73,74]). Moreover, results are also comparable with results in the field of ERP acceptance by students (e.g., [88,89,122]). The factors perceived usefulness of ERP-GIS system (13PUS) and perceived ease of use of ERP-GIS system (14PEU) have statistically significant strong effects on attitude of students toward use of ERP-GIS system (15ATU), with factor 13PUS having a stronger effect than 14PEU. The factors 13PUS and 14PEU describe more than half (55.6%) of the variance of factor 15ATU (R2 = 0.556). Earlier research conducted by Sternad Zabukovšek et al. [88], where authors researched the ERP systems acceptance by students of economics and business at the start and at the end of the course, shows similar findings, namely, the relationship between perceived usefulness and attitude toward using ERP system was statistically stronger than the connection among perceived ease of use and attitude toward using the ERP system in both investigated periods. However, the relationship became weaker at the end of the course. A similar study with the TAM model was conducted by Grandón et al. [122], who investigated the factors influencing students’ intention to use the ERP system. Data for the survey were gathered from students of two universities in two different countries who attended ERP courses over two time periods. The findings of this intercultural, longitudinal research show that factors perceived usefulness and perceived ease of use predict the behavioural intention to use ERP systems, with perceived usefulness being a stronger predictor. They found differences among students who have previous ERP system experience compared to students without experience, as they have a more positive perception of ERP system usefulness and ease of use. From all studies, we can conclude that factor perceived usefulness is more important than factor perceived ease of use. Therefore, this factor usually has a stronger effect on the factor attitude towards using IT/IS.
Perceived usefulness of ERP-GIS system in our research (13PUS) has a strong statistical effect on the behavioural intention for ERP-GIS system use (16BIU), while factor attitude toward using ERP-GIS system (15ATU) has an even stronger statistically significant effect on factor 16BIU. This is in line with other research (e.g., [77,87,88,123,124]). In TAM 2 [52] and TAM 3 [53], the factor attitudes toward using ERP-GIS was exposed as a mediator due to the weak relationship between constructs and intention to use [56]. However, in our study, it plays a very important role, as it has a stronger impact on behavioural intentions to use ERP-GIS systems (16BIU). If factor 15ATU was omitted from the model, then 13PUS and 14PEU would explain 48.6% of the variance of 16BIU (results can be obtained from the authors by request), while with it included in the model, 59.0% of the variance is explained. We argue that this is understandable since the perceived usefulness represents a motivation to use the ERP-GIS system. Therefore, we believe that it is very important to inspire students during the study process—to explain to them how useful and valuable ERP-GIS systems are for their future career and convey the topic of ERP-GIS understandably. As already mentioned, students surveyed in this research became familiar with the selected ERP systems, and it became routine work for them. We achieved this by teaching about business processes and using ERP systems through playing different roles. After that, we present to students the use of GIS. We demonstrated its business value to students through explanation and several videos of best business practices of using ERP-GIS integrated system.
Therefore, we can confirm hypotheses H1, H2, H3, and H5. Hypothesis H4 cannot be confirmed since factor perceived ERP-GIS system ease of use (14PEU) has no statistically significant impact on factor perceived usefulness of ERP-GIS system (13PUS). In past research, researchers have found that perceived ease of use has a statistically significant impact on perceived usefulness when users do not yet know the software system well and are at the beginning phase of its’ use [50,51,124]. Our research revealed that perceived usefulness (13PUS) could be significantly affected by the perceived ease of use (14PEU). Generally, it is important for users that IT/IS is easy to use, but when they learn about it, this relationship becomes weaker or not even statistically significant. Since students in our research were surveyed when they were familiar with how to work with an ERP system, this may be the reason for the non-statistically significant impact of 13PUS to 14PEU.
Secondly, an essential part of our research is also the identification of the direct impact of external factors on 13PUS and 14PEU, which are antecedents of the factor attitude toward the use of ERP-GIS systems (15ATU) and behavioural intention to use ERP-GIS systems (16BIU). Our research has revealed a statistically significant influence of all three factors of the group of students’ perceived support within the study process on 13PUS and/or 14PEU and direct or indirect impact of the group of system and technological factors on 14PEU, while five factors of the group of personal characteristics and information literacy had no important statistical impact on factors 13PUS and 14 PEU.
From Table 6 and Figure 3, we can see that the most important external factors are the three factors related to perceived support provided in the study process, namely community impact (10COIM), education and training about ERP-GIS systems (11EDTR), and perceived enjoyment using ERP-GIS systems (12PEEN), on 13PUS and 14PEU.
Perceived enjoyment using ERP-GIS systems (12PEEN) has a statistically strong effect on 13PUS and an even stronger statistically significant effect on 14PEU, confirming hypotheses H612 and H712. Factor perceived enjoyment using ERP-GIS systems (12PEEN) refers to the degree to which the student considers the use of the ERP-GIS system to be pleasant, enjoyable, interesting, and engaging.
Factor education and training about ERP-GIS systems (11EDTR) is the next important factor, which has a strong impact on the perceived usefulness of ERP-GIS systems (13PUS; hypothesis H713 is supported), but no statistical effect on perceived ease of use of ERP-GIS systems (14PEU; hypothesis H613 is not supported). The education and training allow students to get insight and experience regarding ERP-GIS systems. Bradley and Lee [79] and Sternad Zabukovšek et al. [87,88] also found that education and training satisfaction affects the perceived usefulness of an ERP system (13PUS). Therefore, we propose that educators make a great effort to develop and provide to students comprehensive teaching materials and try to explain to students in-depth the content related to ERP-GIS topics with simple examples from practice and try to provide them with practical assignments on the basis of which students will gain more detailed knowledge about ERP–GIS systems. Understanding ERP systems is a challenge for students, as most have no practical experience working in companies and do not understand the importance of making evidence-based business decisions [87,88]. With additional functionality through integrated GIS, comprehension difficulties increase as knowledge complexity increases.
Factor community impact (10COIM) has a moderate positive significant effect on the perceived ERP-GIS systems usefulness (13PUS; hypothesis H710 is supported), but not a significant effect on perceived ease of use of ERP-GIS systems (14PEU; hypothesis H610 is not supported). The community impact factor refers to the opinion of students’ important people such as teachers, other students, and experts involved in the educational and training process regarding the importance of students’ knowledge of the ERP-GIS system. Students seem to consider the opinions of people important to them [87].
Four external factors of system and technological characteristics included in the research model are system performance (06SYPE), user manuals (07USME), quality of ERP-GIS systems (08QUSY), and quality of ERP-GIS Information (09QUIN).
Research shows that only factor 08QUSY has a strong statistically significant impact on 14PEU (hypothesis H708 is supported), but it has no statistically important impact on 13PUS (hypothesis H608 is not supported). The other three factors had no direct statistical impact on 13PUS or 14PEU (hypotheses H606, H607, H609, H706, H707, and H709 are not supported). Since the interactions among these students’ perception-focused factors may exist, the indirect influence of these three factors was analysed. We found that all three factors directly impact 08QUSY, and thus have an indirect impact on 14PEU. System performance (06SYPE) has the strongest statistical impact on 08QUSY, followed by quality of ERP-GIS information (09QUIN) and user manuals (07USME). These findings are important, showing that the system performance, user manuals, and quality of ERP-GIS information influence the perception of the overall quality of ERP-GIS systems. Therefore, it is important that students use high performance-integrated ERP-GIS systems during their course work, that there are good user manuals available, as well as access to quality reports, screens, and other information within the ERP-GIS systems—all this has a very important impact on their perception of quality of ERP-GIS systems. These three factors explain 68.8% of the variance of factor 08QUSY. In previous research by Sternad Zabukovšek et al. [88], the indirect impact of these factors (through second-order factor) on 14PEU was identified (but not on 13PUS).
Five factors of personal characteristics and information literacy, namely personal innovativeness toward IT (01PIIT), computer anxiety (02COAN), computer self-efficacy (03COSE), computer playfulness (04COPF), and individual benefits (05INBE), do not have a statistically important impact on factors 13PUS and 14PEU (hypotheses H6,01, H6,02, H6,03, H6,04, H6,05, H7,01, H7,02, H7,03, H7,04, and H7,05 are not supported). For this reason, we examined the impact of these five external factors directly on 15ATU and 16BIU (not only on their antecedents). We found that only individual benefits (05INBE) had a direct statistically significant effect on the 15ATU factor.
We further examined whether there are indirect influences of the remaining four factors of personal characteristics and information literacy via 05INBE on factors of the basic TAM. From Table 6 and Figure 3, we can see that computer anxiety (02COAN) and computer self-efficacy (03COSE) have a weak and moderate statistical effect on 05INBE and, therefore, an indirect impact on 15ATU. Factors personal innovativeness toward IT (01PIIT) and computer playfulness (04COPF) do not affect 05INBE or any of the factors of the basic model TAM. Therefore, these two factors were omitted from Figure 3. These results surprised us, as personal innovativeness, and perceived individual benefits in previous studies [87,88] were important factors, showing the indirect impact through second-order factors. Due to the complexity of understanding ERP-GIS systems, we believe that if an individual is not afraid of using computers on a personal level and is computer-efficient, he/she can also perform certain tasks in an ERP-GIS system, and hence, these two factors affect individual’s perceived benefits due to his/her knowledge of ERP-GIS systems; this has a further impact on individual’s attitude toward using ERP-GIS systems. Computer playfulness addresses an individual’s propensity for inventive, spontaneous, and imaginative interaction with ERP-GIS systems. At the same time, personal innovativeness toward IT represents a person’s preparedness to try a new IT/IS. We believe students are aware of the importance and complexity of ERP-GIS systems and because they do not use ERP-GIS systems as actual employees in their workplace, but only to gain knowledge about the use of ERP-GIS systems in the study process, these two factors 01PIIT and 04COPF are not important. Therefore, they have no statistically significant effect on any factor in the TAM model.
Based on IPMA, we can see that the most important factors shaping behavioral intentions to use ERP-GIS systems (16BIU) are the perceived ERP-GIS system usefulness (13PUS), and attitudes towards the use of ERP-GIS system (15ATU), but their performance is not high (see Table 7 and Figure 4).
Regarding importance, the perceived usefulness (13PUS) is in the first place, but regarding performance, it is in sixth place. These results are important and show that teachers have to focus on students’ perceived usefulness and its antecedents: education and training about ERP-GIS systems (11EDTR) and perceived enjoyment using ERP-GIS systems (12PEEN). The education and training factor’s performance is high (83.306), and it is in second place regarding performance, while the perceived enjoyment using ERP-GIS systems factor’s performance is low (64.716) and is in tenth place. These results suggest teachers should improve their performance by teaching students to use simple examples of using ERP-GIS systems and explaining their business decision-making results. It should attract students to find the use of ERP-GIS interesting, attractive and useful for further business careers.
As already mentioned, the second most important factor in attitudes towards using ERP-GIS system (15ATU), but its performance is even lower (tenth place regarding performance). We have to focus on its antecedents (besides the perceived usefulness) that are also equally important: factor of individual benefits (05INBE) with performance 78.868 (third place) and factor of perceived ease of use (14PEU), which performance is the lowest (63.051) among all factors. This implies that focus on 14PEU and its’ antecedents, especially on 12PEEN (already described above), while for 08QUSY, the importance is low (0.091; eighth place) as well is its’ performance (eighth place).
Our research has confirmed that the use of ERP-GIS as a learning platform is valuable—the analysis of influencing factors in the model and acting upon the results may increase the quality of the learning process. Monitoring student development and studying students’ views are not yet common practices of higher education institutions [71,72,87,88], so it can be described as an innovative method for teaching. Teachers can evaluate the progress of students’ behavioral intentions to use ERP-GIS systems to improve their teaching materials and teaching methods. Štrukelj et al. [125] pointed out that teachers help their students develop their competencies through innovative teaching methods. This may lead to better results of the study process for students and to more prepared graduates for a professional career. Given all the described positive aspects, this kind of innovation of higher education institutions is suggested.

6. Conclusions

Recently, GIS is increasingly used simultaneously with other enterprise information systems and has become integrated, especially with ERP systems and customer relationship management (CRM) systems. Due to this, a new type of GIS user emerges, and GIS is used in new ways in which the usage style of business-oriented users emerges. Employees in companies accustomed to using ERP and CRM systems have a different perception regarding the use of additional information systems, like GIS, as compared to other employees. Due to this, the skills, knowledge, and competencies of employees demanded by employers are focused on the use of new digital technologies in organizations of all industries, where the use of ERP systems is of great importance, and the use of GIS systems integrated into ERP systems is increasingly important.
The research study we conducted was a follow-up of a series of research studies in the area of ERP systems acceptance by students. In previous research studies, we researched the acceptance of two ERP systems, SAP and Microsoft Dynamics NAV.
The purpose of the research described in this article was to determine which external factors and to what extent influence students to accept GIS modules integrated into ERP-GIS systems within the e-business course while teaching them about selected ERP systems and the importance of GIS integration. We have used a TAM model, in which we examined twelve external factors and their importance in the process of shaping students’ acceptance of ERP-GIS integration. As Sternad Zabukovšek et al. [87] pointed out, studying the influence of additional external factors not only contributes to the development of the theory, but also helps to design teachers’ curriculum. The main difference between the studies of Sternad Zabukovšek et al. [87,88] and this study is that we examined not only which external factors are important for the adoption of ERP-GIS systems through second-order factors, but we also investigated the direct and indirect influence of twelve external (first-order) factors on the factors in the core TAM model and thus on the acceptance of ERP-GIS systems.
The conducted research showed several important results. First, the research revealed that only four external factors directly impact the internal factors perceived usefulness of ERP-GIS system (13PUS) and perceived ease of use of ERP-GIS system (14PEU). These external factors with direct impact are community impact (10COIM), education and training about ERP-GIS systems (11EDR), and perceived enjoyment of ERP-GIS systems (12 PEN), which can be grouped in the perceived support within the study process group of external factors, as described in Sternad Zabukovšek et al. [87,88], and perceived quality of ERP-GIS systems (08QUSY), which can be grouped in the system and technological characteristics group of external factors. All other external factors in this group, namely system performance (06SYPE), user manuals (07USME), and quality of ERP-GIS information (09QUIN), showed indirect impact via 08QUSY on internal factor 14PEU. An additional external factor, namely perceived enjoyment of ERP-GIS systems (12PEEN), which has never been included in previous research studies about ERP acceptance mentioned above, has a direct statistically significant impact on internal factors 13PUS and 14PEU. This finding supports the inclusion of this external factor into further TAM-based research.
Secondly, the next main results of our research are related to the importance of personal characteristics and information literacy in the process of shaping positive attitudes of students towards using an integrated ERP-GIS system. Research revealed that the external factors personal innovativeness toward IT (01PIIT) and computer playfulness (04COPF) are not statistically significant antecedents of factors of TAM model; also, the external factors computer anxiety (02COAN) and computer self-efficacy (03COSE) do not have a direct impact on the internal factors of the TAM model, but they have an indirect impact—through external factor individual benefits (05INBE), which has a statistically significant impact on attitude toward using ERP-GIS system (15ATU). Since the original basic TAM model supports the idea that all external factors have an impact on antecedents of attitudes (which is not the case in our research), we are convinced that this needs to be investigated further and more in-depth in future research studies.
Results show a good fit for our research model (SRMR), as well as important (medium) predictive relevance. Marangunić and Granić [61] emphasized that four main extensions of basic TAM should be considered in future research: (1) external predictors, (2) factors from other theories, (3) contextual factors that have moderating effects, such as cultural diversity and gender, and (4) measures of use. Our research addresses the first one.
Our research has important implications, especially in three areas. First, although this research is not aimed at assessing the achievements of course learning outcomes, it is important for the field of higher education, as well as for employee education in this field. The results show, for example, that the perceived enjoyment of using an ERP-GIS system has a positive effect on both users’ perceptions of ease of use and perceptions of system usefulness. This means that a first impression of how fun and “sparkling” a software tool is becomes crucial. The findings of this research can be very useful in organizing, structuring, and conducting a course on the learning process of ERP-GIS systems in higher education or as workshops in companies. Assessment of a course’s learning outcomes as part of a learning process is the possible extention of this research. Different learning approaches could be implemented and assessed [126].
Second, the research also provides insight into the “background” of the relationship that users develop towards a particular software solution, which means that from this point of view, the research is also important for software developers. Third, as GIS is a very important source of information for companies in the current world, which also sets the goals of sustainable and environmental development, the results of our research are also important for companies to employ employees with a positive attitude towards geographic information systems, which can be intertwined with the ERP systems used by organizations, pursuing their sustainable and environmental goals.
Although our study was not conducted on the sample of users in companies, but on the sample of e-business students in the final year of their study (where they have been using ERP systems with GIS modules and basic knowledge of business processes), it gives preliminary insight into the perception and attitudes of users using GIS in the business environment. Conclusions gained can be the basis for in-depth research in which employees who are using GIS modules integrated to ERP systems in companies have to be included. Related to this, our study could be considered a preliminary study. To get an in-depth insight into acceptance of GIS modules integrated to ERP systems, similar studies in companies have to be conducted.
The limitation of our research is that it was conducted on a sample of students, and different results may be revealed with different age groups of users and by users with more advanced knowledge of business processes and GIS functionality. Some researchers (e.g., [61,127,128]) pointed out that the results of studies have shown that age significantly influences the interaction with technology. We can also assume that a different level of knowledge is needed to use GIS modules in daily business activities influences the interaction with systems used.

Author Contributions

All authors were involved in all parts of paper writing. All authors wrote, revised, and approved the manuscript. Conceptualization, Simona Sternad Zabukovšek, Gaik Nalbandyan, Samo Bobek; methodology, Simona Sternad Zabukovšek, Polona Tominc; software, Simona Sternad Zabukovšek, Zdenko Deželak; validation, Simona Sternad Zabukovšek, Samo Bobek, Gaik Nalbandyan, Zdenko Deželak; formal analysis, Simona Sternad Zabukovšek, Polona Tominc; investigation, Simona Sternad Zabukovšek, Samo Bobek, Polona Tominc, Gaik Nalbandyan; data curation, Polona Tominc, Gaik Nalbandyan; writing—original draft preparation, Simona Sternad Zabukovšek, Polona Tominc, Samo Bobek; writing—review and editing, Samo Bobek, Gaik Nalbandyan, Zdenko Deželak; visualization, Simona Sternad Zabukovšek, Zdenko Deželak; supervision, Simona Sternad Zabukovšek, Samo Bobek, Polona Tominc; project administration, Zdenko Deželak; funding acquisition, Simona Sternad Zabukovšek, Samo Bobek, Polona Tominc. All authors have read and agreed to the published version of the manuscript.

Funding

The authors acknowledge the financial support from the Slovenian Research Agency (research core funding No. P5-0023). This research was funded by the European Union, Erasmus+ programme, grant number 2019-1-CZ01-KA203-061374. The Government of the Russian Federation also supports the research, state task to the Financial University for 2021 “Industry Digitalization as a Production Efficiency Improvement Tool” (No 121090800124-6).

Informed Consent Statement

Not applicable.

Data Availability Statement

The data presented in this study are available on request from the corresponding author.

Conflicts of Interest

The authors declare no conflict of interest.

References

  1. Ye, H.; Brown, M.; Harding, J. GIS for All: Exploring the Barriers and Opportunities for Underexploited GIS Applications. OSGeo J. 2014, 13, 19–28. Available online: https://journal.osgeo.org/index.php/journal/article/view/209/181 (accessed on 23 December 2021).
  2. Maguire, D.J. An overview and definition of GIS. In Geographical Information Systems: Principles and Applications; Maguire, D.J., Goodchild, M.F., Rhind, D., Eds.; Wiley & Sons, Inc.: New York, NY, USA, 1991. [Google Scholar]
  3. Pászto, V.; Redecker, A.; Macků, K.; Jürgens, C.; Moos, N. Data Sources. In Spationomy; Pászto, V., Jürgens, C., Tominc, P., Burian, J., Eds.; Springer: Cham, Switzerland, 2020; pp. 3–38. [Google Scholar] [CrossRef] [Green Version]
  4. Burrough, P.A.; McDonell, R.A. Principles of Geographical Information Systems, 2nd ed.; Oxford University Press: Oxford, UK, 1998. [Google Scholar]
  5. Feidas, H.; Kontos, T.; Soulakellis, N.; Lagouvardos, K.A. GIS tool for the evaluation of the precipitation forecasts of a numerical weather prediction model using satellite data. Comput. Geosci. 2007, 33, 989–1007. [Google Scholar] [CrossRef]
  6. Brunner, M.I.; Slater, L.; Tallaksen, L.M.; Clark, M. Challenges in modeling and predicting floods and droughts: A review. WIREs Water 2021, 8, e1520. [Google Scholar] [CrossRef]
  7. Etherington, T.R. Least-Cost Modelling and Landscape Ecology: Concepts, Applications, and Opportunities. Curr. Landsc. Ecol. Rep. 2016, 1, 40–53. [Google Scholar] [CrossRef] [Green Version]
  8. El Baroudy, A.A. Mapping and evaluating land suitability using a GIS-based model. CATENA 2016, 140, 96–104. [Google Scholar] [CrossRef]
  9. Mu, W.; Tong, D. Distance in Spatial Analysis: Measurement, Bias, and Alternatives. Geogr. Anal. 2020, 52, 511–536. [Google Scholar] [CrossRef]
  10. Lei, T.L. Integrating GIS and location modeling: A relational approach. Trans. GIS 2021, 25, 1693–1715. [Google Scholar] [CrossRef]
  11. Redecker, A.; Burian, J.; Moos, N.; Macků, K. Spatial Analysis in Geomatics. In Spationomy; Pászto, V., Jürgens, C., Tominc, P., Burian, J., Eds.; Springer: Cham, Switzerland, 2020; pp. 65–92. [Google Scholar] [CrossRef] [Green Version]
  12. Pánek, J. Spatial Visualisation. In Spationomy; Pászto, V., Jürgens, C., Tominc, P., Burian, J., Eds.; Springer: Cham, Switzerland, 2020; pp. 207–219. [Google Scholar] [CrossRef] [Green Version]
  13. Van Maarseveen, M.; Martinez, J.; Flacke, J. GIS in Sustainable Urban Planning and Management: A Global Perspective. In GIS in Sustainable Urban Planning and Management: A Global Perspective, 1st ed.; Van Maarseveen, M., Martinez, J., Flacke, J., Eds.; CRC Press: Boca Raton, FL, USA; Taylor and Francis Group: Abingdon, UK, 2018. [Google Scholar]
  14. Slavin, H.L. The Role of GIS in Land Use and Transport Planning. In Handbook of Transport Geography and Spatial Systems; Hensher, D.A., Button, K.J., Haynes, K.E., Stopher, P.R., Eds.; Emerald Group Publishing Limited: Bingley, UK, 2004; Volume 5, pp. 329–356. [Google Scholar] [CrossRef]
  15. Hess, R.; Rubin, R.; West, L. Geographic information systems as a marketing information system technology. Decis. Support Syst. 2004, 38, 197–212. [Google Scholar] [CrossRef]
  16. Matarneh, S.; Danso-Amoako, M.; Al-Bizri, S.; Gaterell, M.; Matarneh, R. Building information modeling for facilities management: A literature review and future research directions. J. Build. Eng. 2019, 24, 100755. [Google Scholar] [CrossRef] [Green Version]
  17. Olowu, D. Challenge of multi-level governance in developing countries and possible GIS applications. Habitat Int. 2003, 27, 501–522. [Google Scholar] [CrossRef]
  18. Zipf, P. Technology-Enhanced Project Management. J. Manag. Eng. 2000, 16, 34–39. [Google Scholar] [CrossRef]
  19. Botta-Genoulaz, V.; Millet, P.-A. A classification for better use of ERP systems. Comput. Ind. 2005, 56, 573–587. [Google Scholar] [CrossRef]
  20. Zabukovsek, S.S.; Tominc, P.; Bobek, S. Business Informatics Principles. In Spationomy; Pászto, V., Jürgens, C., Tominc, P., Burian, J., Eds.; Springer: Cham, Switzerland, 2020; pp. 93–118. [Google Scholar] [CrossRef] [Green Version]
  21. Treiblmayr, M.; Tso-Sutter, K.H.L.; Krüger, A. Interfacing business processes and spatial processes. In Proceedings of the 2011 IEEE International Conference on Spatial Data Mining and Geographical Knowledge Services 2011, Fuzhou, China, 29 June–1 July 2011; pp. 174–180. [Google Scholar] [CrossRef]
  22. Abou-Ghanem, M.; Arfaj, K.A. SAP/GIS Integration Case Studies & Techniques. 2008. Available online: https://api.semanticscholar.org/CorpusID:34234326 (accessed on 24 November 2021).
  23. Yan, L.; Wang, J.; Ma, Y.; Dou, J. The Enterprise Resource Planning (ERP) System and Spatial Information Integration in Tourism Industry—Mount Emei for Example. In Computational Science—ICCS 2002; Sloot, P.M.A., Hoekstra, A.G., Tan, C.J.K., Dongarra, J.J., Eds.; Springer: Berlin/Heidelberg, Germany, 2002; Volume 2331. [Google Scholar] [CrossRef] [Green Version]
  24. Kähkönen, T.; Maglyas, A.; Smolander, K. What Do We Know about ERP Integration? In Enterprise Information Systems; Hammoudi, S., Cordeiro, J., Maciaszek, L., Filipe, J., Eds.; Springer: Cham, Switzerland, 2014; Volume 190. [Google Scholar] [CrossRef]
  25. Ju, P.-H.; Wei, H.-L.; Tsai, C.-C. Model of Post-Implementation User Participation within ERP Advice Network. Asia Pac. Manag. Rev. 2016, 21, 92–101. [Google Scholar] [CrossRef]
  26. Costa, C.; Ferreira, E.; Bento, F.; Aparicio, A. Enterprise resource planning adoption and satisfaction determinants. Comput. Hum. Behav. 2016, 63, 659–671. [Google Scholar] [CrossRef]
  27. Sternad, S.; Gradišar, M.; Bobek, S. The Influence of External Factors on Routine ERP Usage. Ind. Manag. Data Syst. 2011, 111, 1511–1530. [Google Scholar] [CrossRef]
  28. Sternad, S.; Bobek, S. TAM-Based External Factors Related to ERP Solutions Acceptance in Organizations. Int. J. Inf. Syst. Proj. Manag. 2013, 1, 25–38. [Google Scholar] [CrossRef]
  29. Zabukovšek, S.S.; Bobek, S. ERP Business Solutions Acceptance in Companies. In Managing in Recovering Markets; Chatterjee, S., Singh, N., Goyal, D., Gupta, N., Eds.; Springer Proceedings in Business and Economics; Springer: New Delhi, India, 2015. [Google Scholar] [CrossRef]
  30. National Center for Geographic Information and Analysis (NCGIA), Core Curriculum-Geographic Information Systems. 1990. Available online: https://escholarship.org/uc/item/71p6229c (accessed on 24 November 2021).
  31. Lake, I.; Lovett, A.; Bateman, I.; Day, B. Using GIS and large-scale digital data to implement hedonic pricing studies. Int. J. Geogr. Inf. Sci. 2000, 14, 521–541. [Google Scholar] [CrossRef]
  32. Alzighaibi, A.; Mohammadian, M.; Talukder, M. Factors Affecting the Adoption of GIS Systems in the Public Sector in Saudi Arabia and Their Impact on Organizational Performance. J. Geogr. Inf. Syst. 2016, 8, 396–411. [Google Scholar] [CrossRef] [Green Version]
  33. ARDA Conference. List of Scopus Indexed Journals 2021–2022. 2021. Available online: https://www.ardaconference.com/blog/list-of-scopus-indexed-journals/ (accessed on 2 November 2021).
  34. Cocks, K.D.; Walker, P.A.; Parvey, C.A. Evolution of a continental-scale geographical information system. Int. J. Geogr. Inf. Syst. 1988, 2, 263–280. [Google Scholar] [CrossRef]
  35. Walford, N. Patterns of development in tourist accommodation enterprises on farms in england and wales. Appl. Geogr. 2001, 21, 331–345. [Google Scholar] [CrossRef]
  36. Li, H.; Chen, Z.; Yong, L.; Kong, S.C.W. Application of integrated GPS and GIS technology for reducing construction waste and improving construction efficiency. Autom. Constr. 2005, 14, 323–331. [Google Scholar] [CrossRef]
  37. Gayialis, S.P.; Tatsiopoulos, I.P. Design of an IT-driven decision support system for vehicle routing and scheduling. Eur. J. Oper. Res. 2004, 152, 382–398. [Google Scholar] [CrossRef]
  38. Cococeanu, A.L.; Man, T.E. Water Security Safeguarded by Safe, Secure and Smart Water Management Solutions. In Water Safety, Security and Sustainability; Vaseashta, A., Maftei, C., Eds.; Springer: Cham, Switzerland, 2021. [Google Scholar] [CrossRef]
  39. Morales, D.A.; Sánchez-Bravo, P.; Lipan, L.; Cano-Lamadrid, M.; Issa-Issa, H.; del Campo-Gomis, F.J.; López Lluch, D.B. Designing of an enterprise resource planning for the optimal management of agricultural plots regarding quality and environmental requirements. Agronomy 2020, 10, 1352. [Google Scholar] [CrossRef]
  40. Carriço, N.; Ferreira, B.; Barreira, R.; Antunes, A.; Grueau, C.; Mendes, A.; Covas, D.; Monteiro, L.; Santos, J.; Brito, I. Data integration for infrastructure asset management in small-medium size water utilities. Water Sci. Technol. 2020, 82, 2737–2744. [Google Scholar] [CrossRef]
  41. Pick, J.B. Geo-Business: GIS in the Digital Organization, 1st ed.; John Wiley & Sons: Hoboken, NJ, USA, 2008. [Google Scholar]
  42. Treiblmayr, M.; Scheider, S.; Krüger, A.; Linden, M. Integrating GI with non-GI services--showcasing interoperability in a heterogeneous service-oriented architecture. Geoinformatica 2012, 16, 207–220. [Google Scholar] [CrossRef]
  43. Pick, J. Geographic Information Systems: A Tutorial and Introduction. Commun. Assoc. Inf. Syst. 2004, 14, 16. [Google Scholar] [CrossRef]
  44. Horwitt, E. ERP and GIS Integration Brings Spatial Dimensions to Key Business Apps, SearchERP. Available online: https://searcherp.techtarget.com/news/1373664/ERP-and-GIS-integration-brings-spatial-dimension-to-key-business-apps (accessed on 24 November 2021).
  45. Rogers, E.M. Diffusion of Innovations; Free Press: New York, NY, USA, 1995. [Google Scholar]
  46. Goodhue, D.L.; Thompson, R.L. Task-Technology Fit and Individual Performance. MIS Q. 1995, 19, 213–236. [Google Scholar] [CrossRef]
  47. Ajzen, I. The Theory of Planned Behavior. Organ. Behav. Hum. Decis. Processes 1991, 50, 179–211. [Google Scholar] [CrossRef]
  48. Fishbein, M.; Ajzen, I. Belief, Attitude, Intention, and Behavior: An Introduction to Theory and Research; Addison-Wesley Pub. Co.: Reading, MA, USA, 1995; Available online: https://www.bibsonomy.org/bibtex/2b6936c6cef57987fdc1282fb78d9dd27/griesbau (accessed on 30 October 2021).
  49. Taylor, S.; Todd, P.A. Understanding Information Technology Usage: A Test of Competing Models. Inf. Syst. Res. 1995, 6, 144–176. [Google Scholar] [CrossRef]
  50. Davis, F.D. Perceived Usefulness, Perceived Ease of Use, and User Acceptance of Information Technology. MIS Q. 1989, 13, 319–340. [Google Scholar] [CrossRef] [Green Version]
  51. Davis, F.D.; Bagozzi, R.P.; Warshaw, P.R. User acceptance of computer technology: A comparison of two theoretical models. Manag. Sci. 1989, 35, 982–1003. [Google Scholar] [CrossRef] [Green Version]
  52. Venkatesh, V.; Davis, F.D. A Theoretical Extension of the Technology Acceptance Model: Four Longitudinal Field Studies. Manag. Sci. 2000, 46, 186–205. [Google Scholar] [CrossRef] [Green Version]
  53. Venkatesh, V.; Bala, H. Technology acceptance model 3 and a research agenda on interventions. Decis. Sci. 2008, 39, 273–315. [Google Scholar] [CrossRef] [Green Version]
  54. Venkatesh, V.; Morris, M.G.; Davis, G.B.; Davis, F.D. User Acceptance of Information Technology: Toward a Unified View. MIS Q. 2003, 27, 425–478. [Google Scholar] [CrossRef] [Green Version]
  55. Awa, H.O.; Ukoha, O.; Emecheta, B.C. Using T-O-E theoretical framework to study the adoption of ERP solutions. Cogent Bus. Manag. 2016, 3, 1–23. [Google Scholar] [CrossRef]
  56. Lai, P.C. The literature review of technology adoption models and theories for the novelty technology. J. Inf. Syst. Technol. Manag. 2017, 14, 21–38. [Google Scholar] [CrossRef] [Green Version]
  57. Lee, D.H.; Lee, S.M.; Olson, D.L.; Chung, S.H. The Effect of Organizational Support on ERP Implementation. Ind. Manag. Data Syst. 2010, 110, 269–283. [Google Scholar] [CrossRef]
  58. Sun, Y.; Bhattacherjee, A.; Ma, Q. Extending Technology Usage to Work Settings: The Role of Perceived Work Compatibility in ERP Implementation. Inf. Manag. 2009, 46, 351–356. [Google Scholar] [CrossRef]
  59. Calisir, F.; Gumussoy, C.A.; Bayram, A. Predicting the behavioural intention to use enterprise resource planning systems–An exploratory extension of the technology acceptance model. Manag. Res. News 2009, 32, 597–613. [Google Scholar] [CrossRef]
  60. Mayeh, M.; Ramayah, T.; Mishra, A. The Role of Absorptive Capacity, Communication and Trust in ERP Adoption. J. Syst. Softw. 2016, 119, 58–69. [Google Scholar] [CrossRef]
  61. Marangunić, N.; Granić, A. Technology acceptance model: A literature review from 1986 to 2013. Univ. Access Inf. Soc. 2015, 14, 81–95. [Google Scholar] [CrossRef]
  62. Wibowo, M.P. Technology Acceptance Models and Theories in Library and Information Science Research. Libr. Philos. Pract. 2019, 1–14. Available online: https://digitalcommons.unl.edu/libphilprac/3674 (accessed on 2 November 2021).
  63. Semenoff, J. How and Why?: Explaining the Factors that Influence ERP System usage from the End-Users Perspective: A Literature Review, Information Systems. Master’s Thesis, University of Jyväskylä, Jyväskylä, Finland, 2020. Available online: https://jyx.jyu.fi/handle/123456789/69822 (accessed on 2 November 2021).
  64. Shih, Y.-Y.; Huang, S.-S. The Actual Usage of ERP Systems: An Extended Technology Acceptance Perspective. J. Res. Pract. IT 2009, 41, 263–276. Available online: https://search.informit.org/doi/10.3316/informit.276855354758490 (accessed on 2 November 2021).
  65. Erasmus, E.; Rothmann, S.; van Eeden, C. A structural model of technology acceptance. SA J. Ind. Psychol. 2015, 41, 12. [Google Scholar] [CrossRef]
  66. Rajan, C.A.; Baral, R. Adoption of ERP system: An empirical study of factors influencing the usage of ERP and its impact on end user. IIMB Manag. Rev. 2015, 27, 105–117. [Google Scholar] [CrossRef] [Green Version]
  67. Scholtz, B.; Mahmud, I.; Ramayah, T. Does usability matter? An analysis of the impact of usability on technology acceptance in ERP settings. Interdiscip. J. Inf. Knowl. Manag. 2016, 11, 309–330. [Google Scholar] [CrossRef] [Green Version]
  68. Al-hadi, M.A.; Al-Shaibany, N.A. An Extended ERP model for Yemeni universities using TAM model. Int. J. Eng. Comput. Sci. 2017, 6, 22084–22096. [Google Scholar] [CrossRef]
  69. Klaus, T.; Changchit, C. Sandbox Environments in an ERP System Context: Examining User Attitude and Satisfaction. Electron. J. Inf. Syst. Eval. 2020, 23, 34–44. [Google Scholar] [CrossRef]
  70. Putri, A.D.; Lubis, M.; Azizah, A.H. Analysis of Critical Success Factors (CSF) in Enterprise Resource Planning (ERP) Implementation using Extended Technology Acceptance Model (TAM) at Trading and Distribution Company. In Proceedings of the 2020 4rd International Conference on Electrical, Telecommunication and Computer Engineering (ELTICOM), Medan, Indonesia, 3–4 September 2020; pp. 129–135. [Google Scholar] [CrossRef]
  71. Sternad Zabukovšek, S.; Kalinic, Z.; Bobek, S.; Tominc, P. SEM–ANN based research of factors’ impact on extended use of ERP systems. Cent. Eur. J. Oper. Res. 2019, 27, 703–735. [Google Scholar] [CrossRef]
  72. Zabukovsek, S.S.; Bharadwaj, S.S.; Bobek, S.; Strukelj, T. Acceptance Model-Based Research on Differences of Enterprise Resources Planning Systems Use in India and the European Union. Eng. Econ. 2019, 30, 326–338. [Google Scholar] [CrossRef] [Green Version]
  73. Koksalmis, G.H.; Damar, S. An Empirical Evaluation of a Modified Technology Acceptance Model for SAP ERP System. Eng. Manag. J. 2021, 1–16. [Google Scholar] [CrossRef]
  74. Zabukovsek, S.S.; Bobek, S.; Štrukelj, T. Employees’ attitude toward ERP system’s use in Europe and India: Comparing two TAM-based studies. In Cross-Cultural Exposure and Connections: Intercultural Learning for Global Citizenship; Birdie, A.K., Ed.; Apple Academic Press, Cop.: Oakville, ON, Canada; Palm Bay, FL, USA, 2021; pp. 29–69. [Google Scholar] [CrossRef]
  75. Schlichter, B.R.; Kraemmergaard, P. A comprehensive literature review of the ERP research field over a decade. J. Enterp. Inf. Manag. 2010, 23, 486–520. [Google Scholar] [CrossRef]
  76. Huang, T.; Yasuda, K. Reinventing ERP Life Cycle Model: From Go-Live to Withdrawal. J. Enterp. Resour. Plan. Stud. 2016, 2016, 331270. [Google Scholar] [CrossRef] [Green Version]
  77. Nah, F.F.; Tan, X.; Teh, S.H. An Empirical Investigation on End-Users’ Acceptance of Enterprise Systems. Inf. Resour. Manag. J. 2004, 17, 32–53. [Google Scholar] [CrossRef] [Green Version]
  78. Amoako-Gyampah, K.; Salam, A. An extension of the technology acceptance model in an ERP environment. Inf. Manag. 2004, 41, 731–745. [Google Scholar] [CrossRef]
  79. Bradley, J.; Lee, C.C. ERP Training and User Satisfaction: A Case Study. Int. J. Enterp. Inf. Syst. 2007, 3, 33–50. [Google Scholar] [CrossRef] [Green Version]
  80. Hsieh, J.J.P.A.; Wang, W. Explaining Employees’ Extended Use of Complex Information Systems. Eur. J. Inf. Syst. 2007, 16, 216–227. [Google Scholar] [CrossRef] [Green Version]
  81. Kwahk, K.-Y.; Lee, J.N. The Role of Readiness for Change in ERP Implementation: Theoretical Bases and Empirical Validation. Inf. Manag. 2008, 45, 474–481. [Google Scholar] [CrossRef]
  82. Bueno, S.; Salmeron, J.L. TAM-based success modeling in ERP. Interact. Comput. 2008, 20, 515–523. [Google Scholar] [CrossRef]
  83. Uzoka, F.M.E.; Abiola, R.O.; Nyangeresi, R. Influence of product and organizational constructs on erp acquisition using an extended technology acceptance model. Int. J. Enterp. Inf. Syst. 2008, 4, 67–83. [Google Scholar] [CrossRef] [Green Version]
  84. Youngberg, E.; Olsen, D.; Hauser, K. Determinants of professionally autonomous end user acceptance in an enterprise resource planning system environment. Int. J. Inf. Manag. 2009, 29, 138–144. [Google Scholar] [CrossRef]
  85. Shivers-Blackwell, S.; Charles, A. Ready, set, go: Examining student readiness to use ERP technology. J. Manag. Dev. 2006, 25, 795–805. [Google Scholar] [CrossRef]
  86. Scott, J.E.; Walczak, S. Cognitive Engagement with a Multimedia ERP Training Tool: Assessing Computer Self-Efficacy and Technology Acceptance. Inf. Manag. 2009, 46, 221–232. [Google Scholar] [CrossRef]
  87. Sternad Zabukovšek, S.; Picek, R.; Bobek, S.; Šišovska, I.; Tominc, P. Technology acceptance model based study of students´ attitudes toward use of enterprise resource planning solutions. J. Inf. Organ. Sci. 2019, 43, 49–71. [Google Scholar] [CrossRef]
  88. Sternad Zabukovšek, S.; Štrukelj, T.; Tominc, P.; Bobek, S. Factors Influencing Attitudes of Students Toward ERP Systems as Computer-Aided Learning Environments. In Handbook of Research on Enhancing Innovation in Higher Education Institutions; Babić, V., Nedelko, Z., Eds.; IGI Global: Hershey, PA, USA, 2020. [Google Scholar] [CrossRef]
  89. Sternad Zabukovšek, S.; Picek, R.; Bobek, S. MS dynamics NAV acceptance by business studies students. Ekon. Manag. Inovace 2019, 11, 50–61. Available online: http://www.emijournal.cz/ (accessed on 2 November 2021).
  90. Adeyelure, T.S. Geographical Information System Readiness Assessment Framework in the South African Private Health Sector for Pre- to Post-COVID-19 Pandemic Management. In Proceedings of the Sixth International Congress on Information and Communication Technology; Yang, X.S., Sherratt, S., Dey, N., Joshi, A., Eds.; Springer: Singapore, 2022; Volume 217. [Google Scholar] [CrossRef]
  91. Meechang, K.; Leelawat, N.; Tang, J.; Kodaka, A.; Chintanapakdee, C. The Acceptance of Using Information Technology for Disaster Risk Management: A Systematic Review. Eng. J. 2020, 24, 111–132. [Google Scholar] [CrossRef]
  92. Moertini, V.; Mukhti, J.; Setiawan, C. Web-based ERP System with GIS for Facilities Maintenance in Maritime Cargo Terminals. Int. J. Geoinform. 2018, 14, 77–88. [Google Scholar] [CrossRef]
  93. Agarwal, R.; Prasad, J. A conceptual and operational definition of personal innovativeness in the domain of information technology. Inf. Syst. Res. 1998, 9, 204–215. [Google Scholar] [CrossRef]
  94. Lu, J.; Yu, C.-S.; Liu, C.; Yao, J.E. Technology acceptance model for wireless internet. Internet Res. Electron. Netw. Appl. Policy 2003, 13, 206–222. [Google Scholar] [CrossRef] [Green Version]
  95. Yi, Y.M.; Fiedler, K.D.; Park, J.S. Understanding the role of individual innovativeness in the acceptance of IT-based innovativeness: Comparative analyses of models and measures. Decis. Sci. 2006, 37, 393–426. [Google Scholar] [CrossRef]
  96. Thompson, R.; Compeau, D.; Higgins, C. Intentions to use information technologies: An integrative model. J. Organ. End User Comput. 2006, 18, 25–46. [Google Scholar] [CrossRef] [Green Version]
  97. Turan, A.; Özbebek Tunç, A.; Zehira, C. A Theoretical Model Proposal: Personal Innovativeness and User Involvement as Antecedents of Unified Theory of Acceptance and Use of Technology. Procedia-Soc. Behav. Sci. 2015, 210, 43–51. [Google Scholar] [CrossRef] [Green Version]
  98. Arsanti, A.T.; Yuliasari, E. Personal Factors as Predictors of Intention to Use it. JMK 2018, 20, 129–136. [Google Scholar] [CrossRef] [Green Version]
  99. Hackbarth, G.; Gover, V.; Yi, M.Y. Computer playfulness and anxiety: Positive and negative mediators of the system experience effect on perceived ease of use. Inf. Manag. 2003, 40, 221–232. [Google Scholar] [CrossRef]
  100. Simsek, A. The Relationship between Computer Anxiety and Computer Self-Efficacy. Contemp. Educ. Technol. 2011, 2, 177–187. [Google Scholar] [CrossRef]
  101. Serenko, A.; Turel, O. Are MIS research instruments stable? An exploratory reconsideration of the computer playfulness scale. Inf. Manag. 2007, 44, 657–665. [Google Scholar] [CrossRef]
  102. Hsu, P.-F.; Yen, H.R.; Chung, J.-C. Assessing ERP post-implementation success at the individual level: Revisiting the role of service quality. Inf. Manag. 2015, 52, 925–942. [Google Scholar] [CrossRef]
  103. Rienzo, T.; Han, B. Does ERP Hands-On Experience Help Students Learning Business Process Concepts? Decis. Sci. J. Innov. Educ. 2011, 9, 177–207. [Google Scholar] [CrossRef]
  104. Insiti, M. ERP End-Users Business Productivity: A Field Study of SAP & Microsoft. 2007. Available online: https://www.calszone.com/documents/microsoft-dynamics-gp-vs-sap.pdf (accessed on 20 November 2021).
  105. Kositanurit, B.; Nqwenyama, O.; Osei-Bryson, K.M. An exploration of factors that impact individual performance in an ERP environment: An analysis using multiple analytical techniques. Eur. J. Inf. Syst. 2006, 15, 556–568. [Google Scholar] [CrossRef]
  106. Liu, L.; Ma, Q. Perceived system performance: A test of an extended technology acceptance model. J. Organ. End User Comput. 2006, 18, 1–24. [Google Scholar] [CrossRef]
  107. Kelley, H. Attributional Analysis of Computer Self-Efficacy. Ph.D. Thesis, The University of Western Ontario, London, ON, Canada, 2001. [Google Scholar]
  108. Venkatesh, V. User Acceptance of Information Technology: A Unified View; University of Minnesota: Minneapolis, MN, USA, 1998. [Google Scholar]
  109. Bradford, M. Modern ERP: Select, Implement and Use Today’s Advanced Business Systems; North Carolina State University: Raleigh, NC, USA, 2015. [Google Scholar]
  110. Venkatesh, V. Determinants of perceived ease of use: Integrating per-ceived behavioural control, computer anxiety and enjoyment into the tech-nology acceptance model. Inf. Syst. Res. 2000, 11, 342–365. [Google Scholar] [CrossRef] [Green Version]
  111. Spationomy. Available online: https://spationomy.mvso.cz/2.0/ (accessed on 20 November 2021).
  112. Selecthub. Available online: https://www.selecthub.com/erp-software/ (accessed on 20 November 2021).
  113. Wold, H.O.A. Soft Modeling: The Basic Design and Some Extensions. In Systems under Indirect Observations: Part II; Joreskog, K.G., Wold, H.O.A., Eds.; North-Holland: Amsterdam, The Netherlands, 1982; pp. 1–54. [Google Scholar]
  114. Hair, J.F.; Risher, J.J.; Sarstedt, M.; Ringle, C.M. When to use and how to report the results of PLS-SEM. Eur. Bus. Rev. 2019, 31, 2–24. [Google Scholar] [CrossRef]
  115. Ringle, C.M.; Wende, S.; Becker, J.-M. SmartPLS 3. Boenningstedt: SmartPLS GmbH. Available online: http://www.smartpls.com (accessed on 2 November 2021).
  116. Hair, J.F.; Hult, G.T.M.; Ringle, C.M.; Sarstedt, M. A Primer on Partial Least Squares Structural Equation Modeling (PLS-SEM), 2nd ed.; Sage: Thousand Oaks, CA, USA, 2017. [Google Scholar]
  117. Garson, G.D. Partial Least Squares: Regression and Structural Equation Models; Statistical Associates Publishers: Asheboro, NC, USA, 2016. [Google Scholar]
  118. Brunner, M.; SÜβ, H.-M. Analyzing the Reliability of Multidimensional Measures: An Example from Intelligence Research. Educ. Psychol. Meas. 2005, 65, 227–240. [Google Scholar] [CrossRef]
  119. Fornell, C.G.; Larcker, D.F. Evaluating structural equation models with unobservable variables and measurement error. J. Mark. Res. 1981, 18, 39–50. [Google Scholar] [CrossRef]
  120. Henseler, J.; Ringle, C.M.; Sarstedt, M. A new criterion for assessing discriminant validity in variance-based structural equation modeling. J. Acad. Mark. Sci. 2015, 43, 115–135. [Google Scholar] [CrossRef] [Green Version]
  121. Hair, J.F.; Black, W.C.; Babin, B.J.; Anderson, R.E. Multivariate Data Analysis, 7th ed.; Pearson Prentice Hall: Upper Saddle River, NJ, USA, 2009. [Google Scholar]
  122. Grandón, E.E.; Díaz-Pinzón, B.; Magal, S.R.; Rojas-Contreras, K. Technology Acceptance Model Validation in an Educational Context: A Longitudinal Study of ERP System Use. J. Inf. Syst. Eng. Manag. 2021, 6, 1–10. [Google Scholar] [CrossRef]
  123. Pijpers, G.G.M.; Montfort, K. An investigation of factors that influence senior executives to accept innovations in information technology. Int. J. Manag. 2006, 23, 11–23. Available online: https://www.proquest.com/scholarly-journals/investigation-factors-that-influence-senior/docview/233231200/se-2?accountid=28931 (accessed on 2 November 2021).
  124. Simon, S.J.; Paper, D. User acceptance of voice recognition technology:an empirical extension of the technology acceptance model. J. Organ. End User Comput. 2007, 19, 24–50. [Google Scholar] [CrossRef]
  125. Štrukelj, T.; Zlatanović, D.; Nikolić, J.; Sternad Zabukovšek, S. A cyber-systemic learning action approach towards selected students’ competencies development. Kybernetes 2019, 48, 1516–1533. [Google Scholar] [CrossRef]
  126. Hopkins, D. A Teacher’s Guide to Classroom Research, 4th ed.; Open University Press: Berkshire, England, 2008. [Google Scholar]
  127. Wagner, N.; Hassanein, K.; Head, M. Computer use by older adults: A multi-disciplinary review. Comput. Hum. Behav. 2010, 26, 870–882. [Google Scholar] [CrossRef]
  128. Charness, N.; Boot, W.R. Aging and Information Technology Use: Potential and Barriers. Curr. Dir. Psychol. Sci. 2009, 18, 253–258. [Google Scholar] [CrossRef]
Figure 1. A number of bibliographic units, indexed in Scopus, on 2 November 2021, keywords »GIS« and »Enterprise Resource Planning«.
Ijgi 11 00083 g001
Figure 2. Research model.
Ijgi 11 00083 g002
Figure 3. Structural model results.
Ijgi 11 00083 g003
Figure 4. Importance–performance map.
Ijgi 11 00083 g004
Table 1. Factors’ definition.
Latent Variables/FactorsDescriptionCodes for Measured Variables
(Indicators)
Sources
External Factors
Personal
innovativeness toward IT (01PIIT)
Represents a student’s preparedness to try a new IS/IT.PIIT1[93,94,95,96,97,98]
PIIT2
PIIT3
Computer anxiety
(02COAN)
Describes a student’s fear of using a computer (reversed).COAN1[54,86,99,100]
COAN2
Computer self-efficacy (03COSE)Represents the belief of students in their ability to perform a particular computing task.COSE1[52,54,64,100]
COSE2
COSE3
Computer playfulness (04COPF)Represents a student’s propensity for inventive, spontaneous, and imaginative interaction with IT/IS.COPF1[53,99,101]
COPF2
COPF3
Individual benefits
(05INBE)
Represents the perceived benefits due to students’ knowledge of ERP and GIS functionalities.INBE1[102,103]
INBE1
INBE1
INBE1
System performance
(06SYPE)
Describes the level to which a student thinks that the particular system is dependable as well as accessible through the standard operation.SYPE1[54,94,104,105,106]
SYPE2
SYPE3
SYPE4
User Manuals
(07USME)
Refers to the level to which students see inadequate user manuals and assistance as a reason for system failure.USME1[105,107]
USME2
Quality of ERP-GIS systems
(08QUSY)
Refers to the performance of tasks in ERP-GIS system in terms of ease of use, data quality, the need for integration, appropriate functionality, flexibility, reliability, etc.QUSY1[26,106]
QUSY2
QUSY3
QUSY4
Quality of ERP-GIS information
(09QUIN)
Refers to the quality of the output of ERP-GIS information, i.e., the excellence of reports and maps, computer screen, and other data generated by ERP-GIS systems.QUIN1[78,102]
QUIN2
QUIN3
QUIN4
Community impact
(10COIM)
It combines factors individual norms and social factors. It includes the individual’s perception that most individuals who are important to students think that students should or should not perform the behaviour in the issue.COIM1[54,59,68,84,96,107,108,109]
COIM2
COIM3
Education and training about ERP-GIS systems
(11EDTR)
Refers to the level to which the student considers that he/she has received sufficient official and unofficial education and guidance on the ERP-GIS system.EDTR1[78,79,82]
EDTR2
EDTR3
EDTR4
EDTR5
Perceived enjoyment of
ERP-GIS systems
(12PEEN)
It refers to the level to which the student thinks that the use of the ERP-GIS system will be pleasant in itself, except for system performance problems resulting from the use of the system.PEEN1[53,86,110]
PEEN2
PEEN3
PEEN4
PEEN5
PEEN6
PEEN7
PEEN8
Classical TAM factors
Perceived usefulness
ERP-GIS system
(13PUS)
Indicates the level at which a student thinks that the use of an ERP-GIS system would improve his/her job performance.PUS1[50]
PUS2
PUS3
PUS4
Perceived ease of use
ERP-GIS system
(14PEU)
Indicates the level at which the student thinks he will be able to use ERP-GIS without difficulty.PEU1[50]
PEU2
PEU3
PEU4
Attitude toward using
ERP-GIS system
(15ATU)
Indicates the level to which the student likes/dislikes the use of the ERP-GIS system.ATU1[50]
ATU2
ATU3
Behavioral intention to use ERP-GIS system
(16BIU)
Refers to the level to which the user was aware of plans to implement/not implement certain future behaviors.BIU1[50]
BIU2
BIU3
Table 2. Descriptive statistics, indicator reliability, and discriminant validity.
Latent
Factor
IndicatorsDescriptive StatisticsIndicator ReliabilityDiscriminant Validity
MeanStandard
Deviation
Indicator LoadingsIndicator
Reliability
HTMT Confidence Interval Does Not Include 1
>70>502.5%97.5%
01PIITPIIT14.6781.1800.8670.7520.7790.934
PIIT23.6671.4850.8220.6760.6840.892
PIIT34.9331.2580.8710.7590.7530.922
02COANCOAN15.8841.2480.8760.7670.7230.934
COAN26.1161.1730.9060.8210.7590.954
03COSECOSE15.1671.1310.7480.5600.5220.85
COSE24.7021.2310.7690.5910.5760.863
COSE35.3171.0120.8530.7280.7410.908
04COPFCOPF15.4071.0540.7770.6040.3670.897
COPF25.3551.0900.9070.8230.7640.949
COPF35.0251.2300.9170.8410.8330.979
05INBEINBE15.5610.9090.8000.6400.690.87
INBE15.7780.9460.9470.8970.9170.966
INBE15.6610.9200.8840.7810.8170.927
INBE15.8830.9110.8830.7800.8350.916
06SYPESYPE15.2330.9300.7560.5720.6320.838
SYPE25.4490.9590.8410.7070.7680.886
SYPE35.5690.7840.8380.7020.7560.887
SYPE45.2730.9240.8670.7520.8110.902
07USMEUSME15.4350.8730.8640.7460.7540.917
USME25.4160.9070.8510.7240.7520.905
08QUSYQUSY15.5830.9230.7800.6080.6280.871
QUSY25.4830.8720.8490.7210.7970.885
QUSY35.0581.0860.7750.6010.6690.843
QUSY45.4750.9000.8160.6660.7380.864
09QUINQUIN15.5380.7800.7970.6350.6470.864
QUIN25.5330.8120.8470.7170.7670.896
QUIN35.6580.7220.8480.7190.7780.893
QUIN45.5300.8580.8180.6690.7290.879
10COIMCOIM14.8081.2430.7940.6300.6690.866
COIM26.0770.9460.7860.6180.6250.861
COIM35.4311.3320.8340.6960.7010.902
11EDTREDTR16.0830.7670.8460.7160.7840.887
EDTR26.1770.8590.7470.5580.6360.83
EDTR36.1650.7640.7400.5480.5890.832
EDTR45.6051.0060.7130.5080.5410.807
EDTR55.9170.8190.7330.5370.580.827
12PEENPEEN15.3251.0540.7970.6350.7020.855
PEEN25.2331.0340.8370.7010.7530.887
PEEN35.1651.2150.8510.7240.7650.901
PEEN44.1641.3480.8170.6670.6930.885
PEEN54.6901.2560.8440.7120.7750.890
PEEN65.0341.1490.8920.7960.8450.927
PEEN74.7691.1530.8670.7520.8020.913
PEEN84.2631.3180.7820.6120.6580.855
13PUSPUS15.7670.8210.7630.5820.6220.843
PUS25.6780.8550.7900.6240.6930.855
PUS35.1451.0230.8540.7290.7840.898
PUS45.0341.0750.8250.6810.7050.888
14PEUPEU15.0261.0400.8540.7290.7930.900
PEU24.7061.2080.8900.7920.8380.924
PEU34.2941.2420.8150.6640.7030.885
PEU44.9071.0440.7360.5420.6060.816
15ATUATU15.9751.0080.7180.5160.5860.8
ATU25.0091.0400.8000.6400.6870.866
ATU34.7881.2160.8220.6760.7320.871
16BIUBIU14.8731.3270.9340.8720.8760.964
BIU24.5711.3580.9470.8970.9120.973
BIU34.6721.3050.9690.9390.9460.983
Table 3. Factors’ reliability and convergent validity.
Latent
Variable
Internal Consistency ReliabilityConvergent Validity
Cronbach’s AlphaComposite ReliabilityAVE
0.60–0.950.60–0.95>0.50
01PIIT0.8160.8900.729
02COAN0.7430.8860.795
03COSE0.7010.8340.626
04COPF0.8470.9020.756
05INBE0.9020.9320.775
06SYPE0.8440.8960.683
07USME0.6410.8480.736
08QUSY0.8190.8810.649
09QUIN0.8470.8970.685
10COIM0.7280.8470.648
11EDTR0.8130.870.574
12PEEN0.9380.9490.700
13PUS0.8230.8830.655
14PEU0.8450.8950.682
15ATU0.6810.8240.610
16BIU0.9460.9650.903
Table 4. Heterotrait–Monotrait (HTMT) ratio values.
Latent Variable01020304050607080910111213141516
01PIIT
02COAN0.443
03COSE0.4910.614
04COPF0.6250.6790.331
05INBE0.3700.4700.5190.276
06SYPE0.4390.2380.5320.442.592
07USME0.2480.1030.3860.3700.2450.663
08QUSY0.4400.2950.5600.3960.4830.8690.828
09QUIN0.4530.1850.4690.2040.3360.5600.5610.775
10COIM0.2690.2420.3650.2220.5230.460.2080.4280.437
11EDTR0.3940.3050.4270.2270.4730.5760.3440.6360.6400.777
12PEEN0.470.2930.5030.4440.6070.5910.5490.6520.5270.5770.505
13PUS0.3370.2460.4650.260.5570.5760.3440.5880.6020.7640.7400.687
14PEU0.4670.3420.4570.3750.4580.5200.3080.6710.4510.3200.3330.6800.441
15ATU0.4360.3070.5880.3580.7400.7150.5010.8680.6840.8480.7830.8950.8270.704
16BIU0.5060.2130.4480.2970.5130.5060.2390.5940.5580.5970.5340.6760.7240.5120.895
Table 5. R2 and Q2 values.
R2 ValueQ2 Value
Thresholds≥0.75—Substantial
≥0.50—Moderate
≥0.25—Weak
≥0.50—Large
≥0.25—Medium
≥0—Small
Factors
05INBE0.2510.179
08QUSY0.6880.438
13PUS0.5530.339
14PEU0.4520.286
15ATU0.5560.323
16BIU0.5900.520
Average0.5150.348
Table 6. Path coefficient analysis.
RelationshipsPath Coefficients
(β)
t-Statisticsp Values95% Confidence IntervalsSignificant (p < 0.05)
≥0.10≥1.96<0.001—Strong
<0.01—Moderate
<0.05—Weak
≥No Effect
[2.5%, 97.5%]Yes/No
02COAN → 05INBE0.2302.1690.030[0.026, 0.443]Yes
03COSE → 05INBE0.2652.8270.005[0.066, 0.435]Yes
05INBE → 13PUS0.0890.9650.335[−0.090, 0.270]No
05INBE → 14PEU0.0440.4300.667[−0.167, 0.229]No
05INBE → 15ATU0.2753.7930.000[0.134, 0.419]Yes
06SYPE → 08QUSY0.4396.5000.000[0.304, 0.569]Yes
07USME → 08QUSY0.2474.0770.000[0.129, 0.367]Yes
08QUSY → 14_PEOU0.3203.8490.000[0.164, 0.487]Yes
09QUIN → 08QUSY0.3414.9980.000[0.202, 0.470]Yes
10COIM → 13PUS0.2413.1160.002[0.083, 0.388]Yes
11EDTR → 13PUS0.3103.9450.000[0.145, 0.449]Yes
12PEEN → 13PUS0.3393.3440.001[0.135, 0.534]Yes
12PEEN → 14PEU0.4344.9270.000[0.228, 0.581]Yes
13PUS → 15 ATU0.3835.1300.000[0.233, 0.522]Yes
13PUS → 16 BIU0.2984.3170.000[0.150, 0.421]Yes
14PEU → 13PUS0.0230.2470.805[−0.148, 0.211]No
14PEU → 15ATU0.2894.4830.000[0.157, 0.409]Yes
15ATU → 16 BIU0.5458.5310.000[0.424, 0.664]Yes
Table 7. Importance–performance analysis.
ImportancePerformances
13PUS0.85674.202
15ATU0.80670.827
12PEEN0.31764.716
11EDTR0.31583.360
05INBE0.23178.866
14PEU0.21463.051
10COIM0.16574.616
08QUSY0.08473.542
03COSE0.06668.003
02COAN0.04483.522
06SYPE0.03873.194
09QUIN0.03376.150
07USME0.02173.762
Publisher’s Note: MDPI stays neutral with regard to jurisdictional claims in published maps and institutional affiliations.

