
Spatial-Temporal Water Balance Components Estimation Using Integrated GIS-Based Wetspass-M Model in Moulouya Basin, Morocco


Abstract
:1. Introduction
2. Materials and Methods
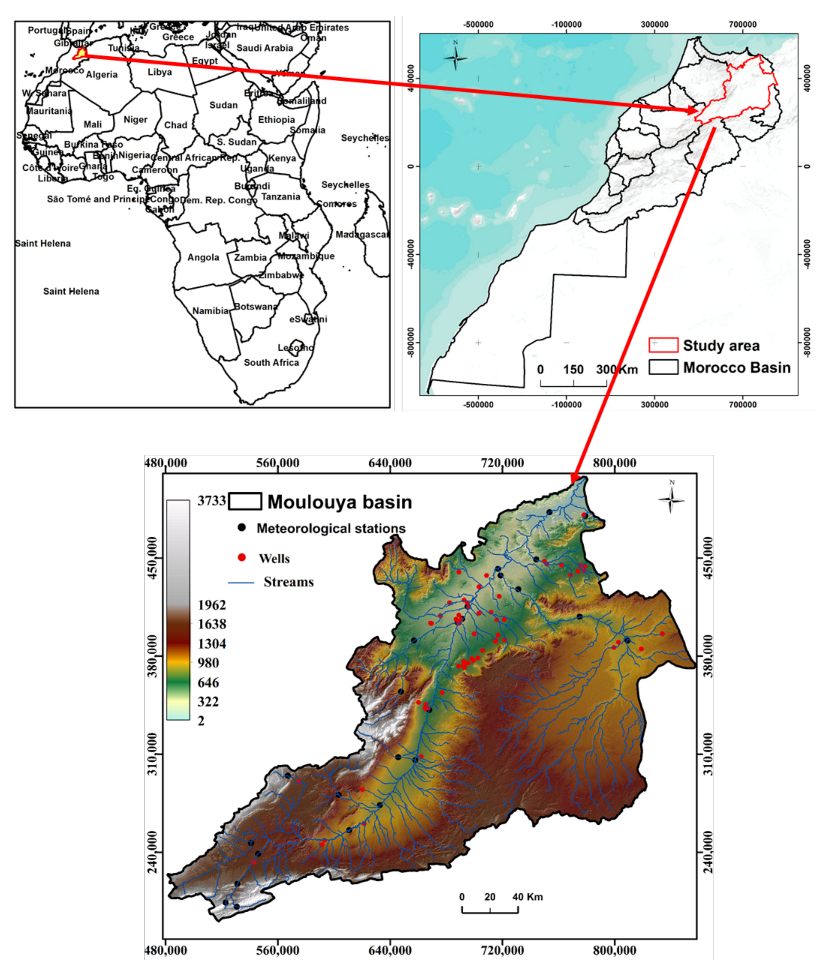
2.1. Study Area
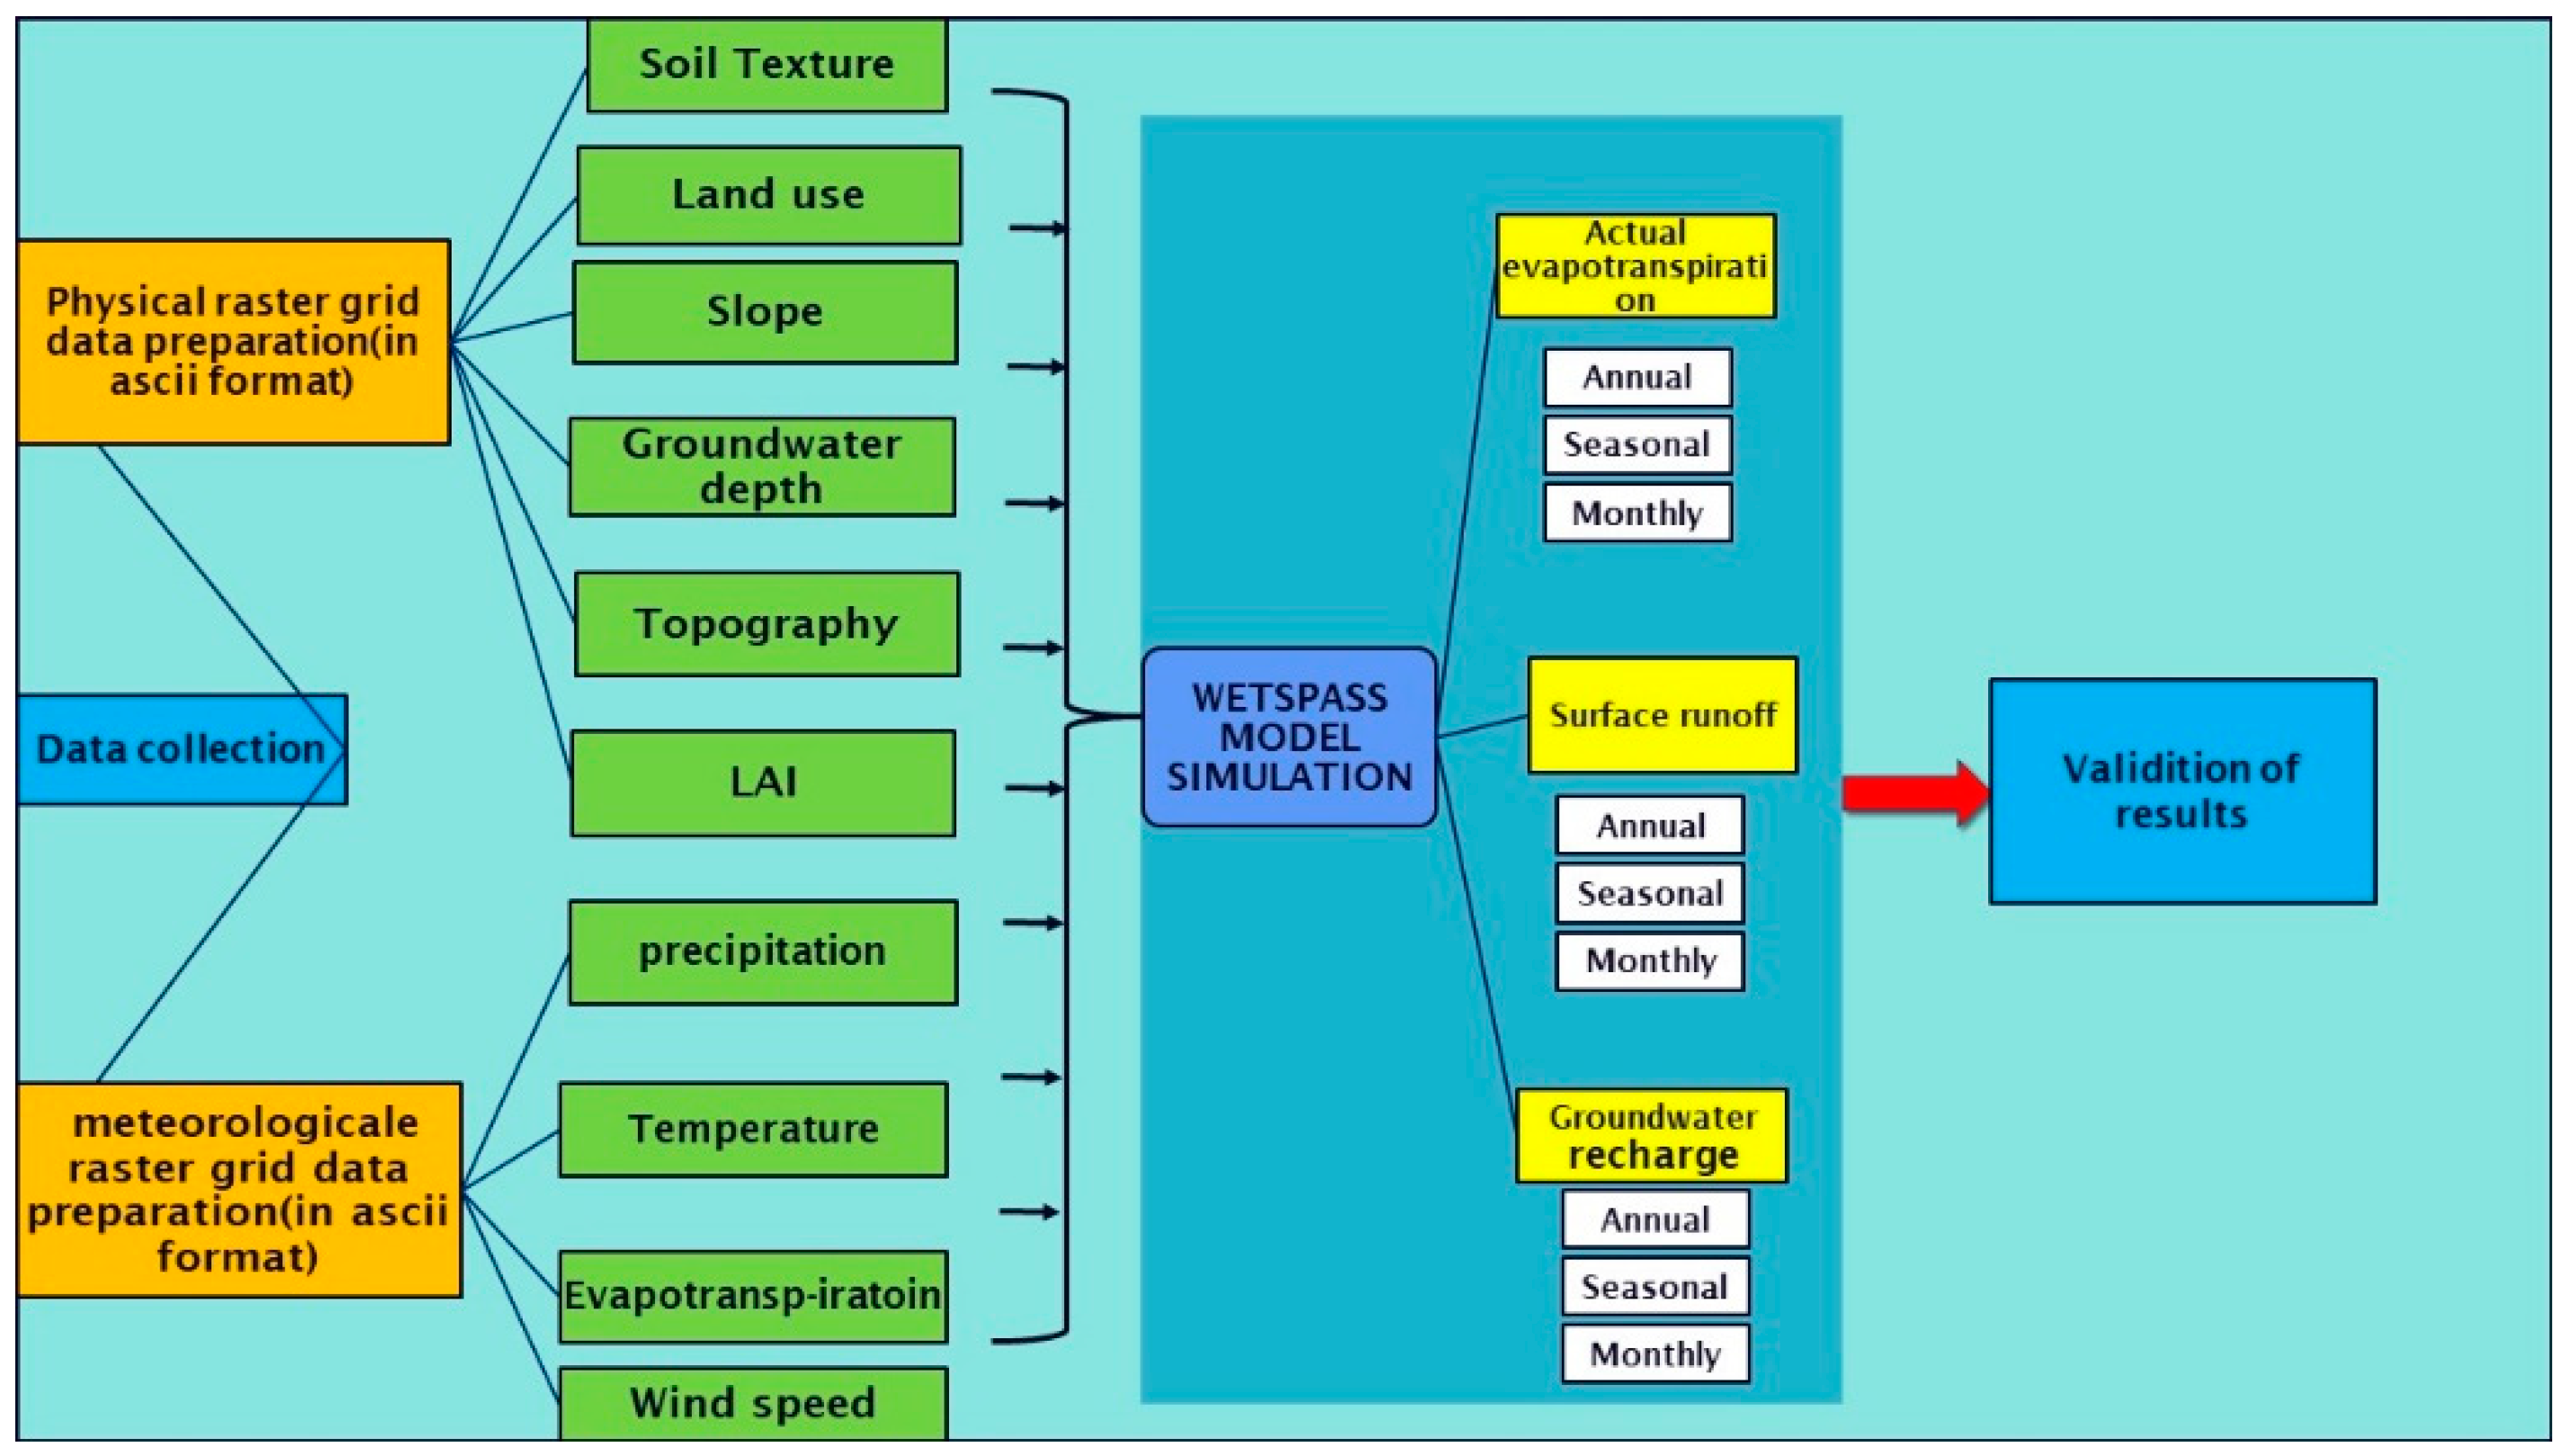
2.2. Hydrological Modelling (WetSpass-M)
2.3. Input Data
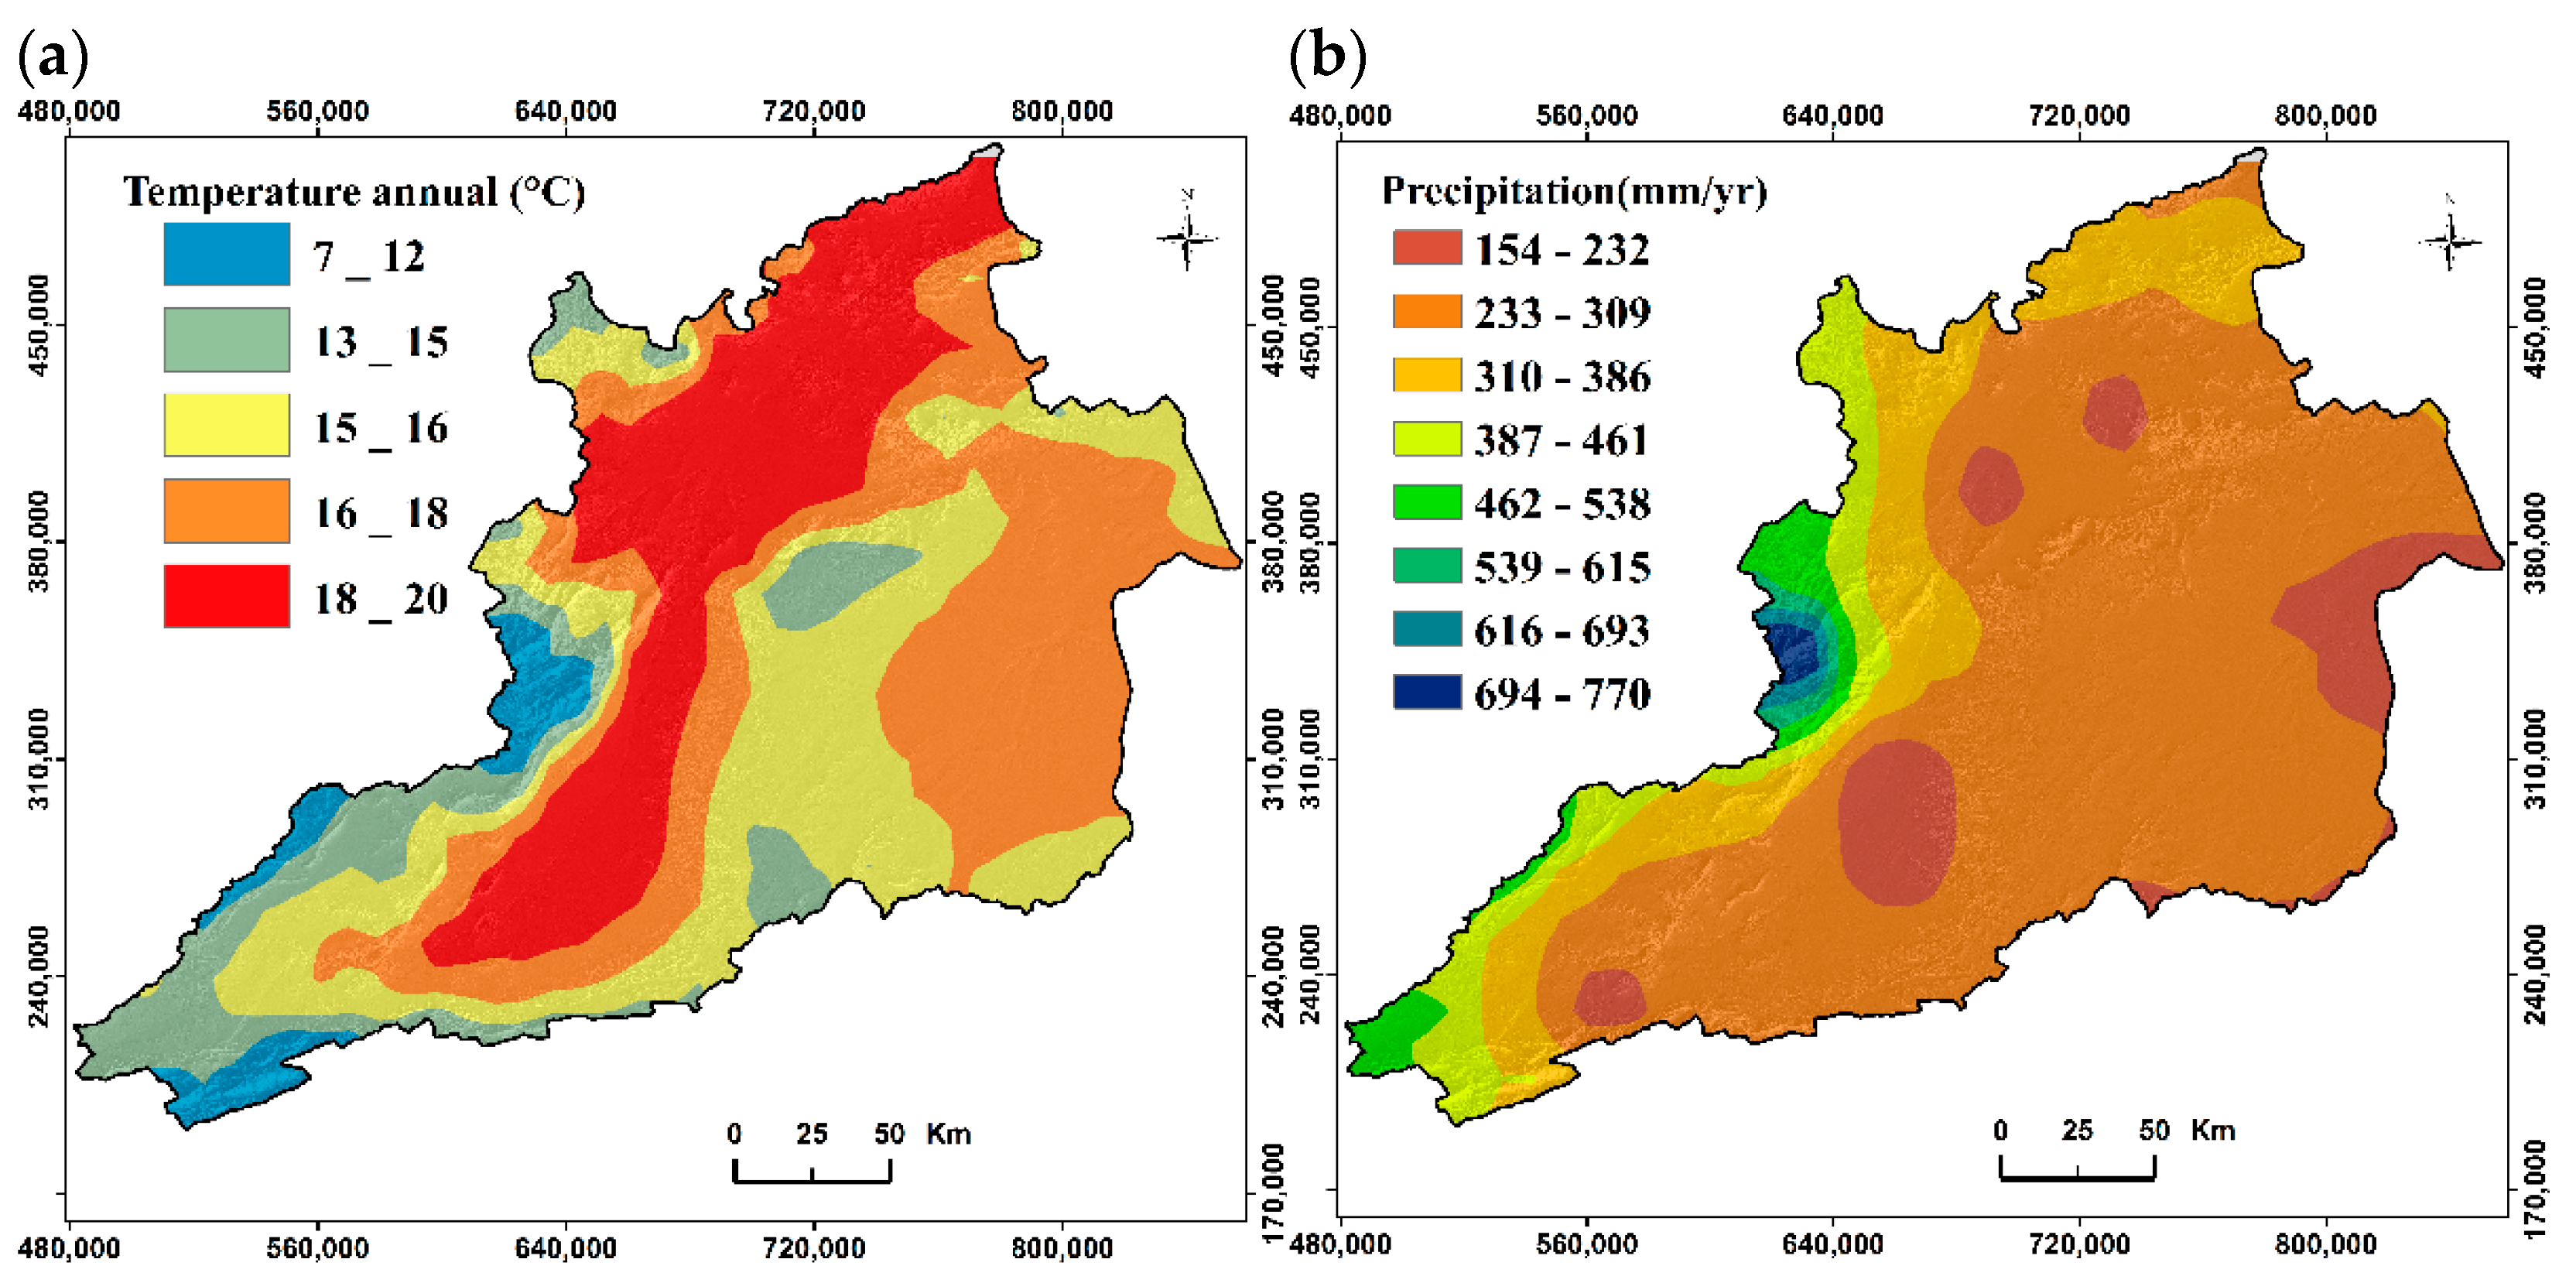
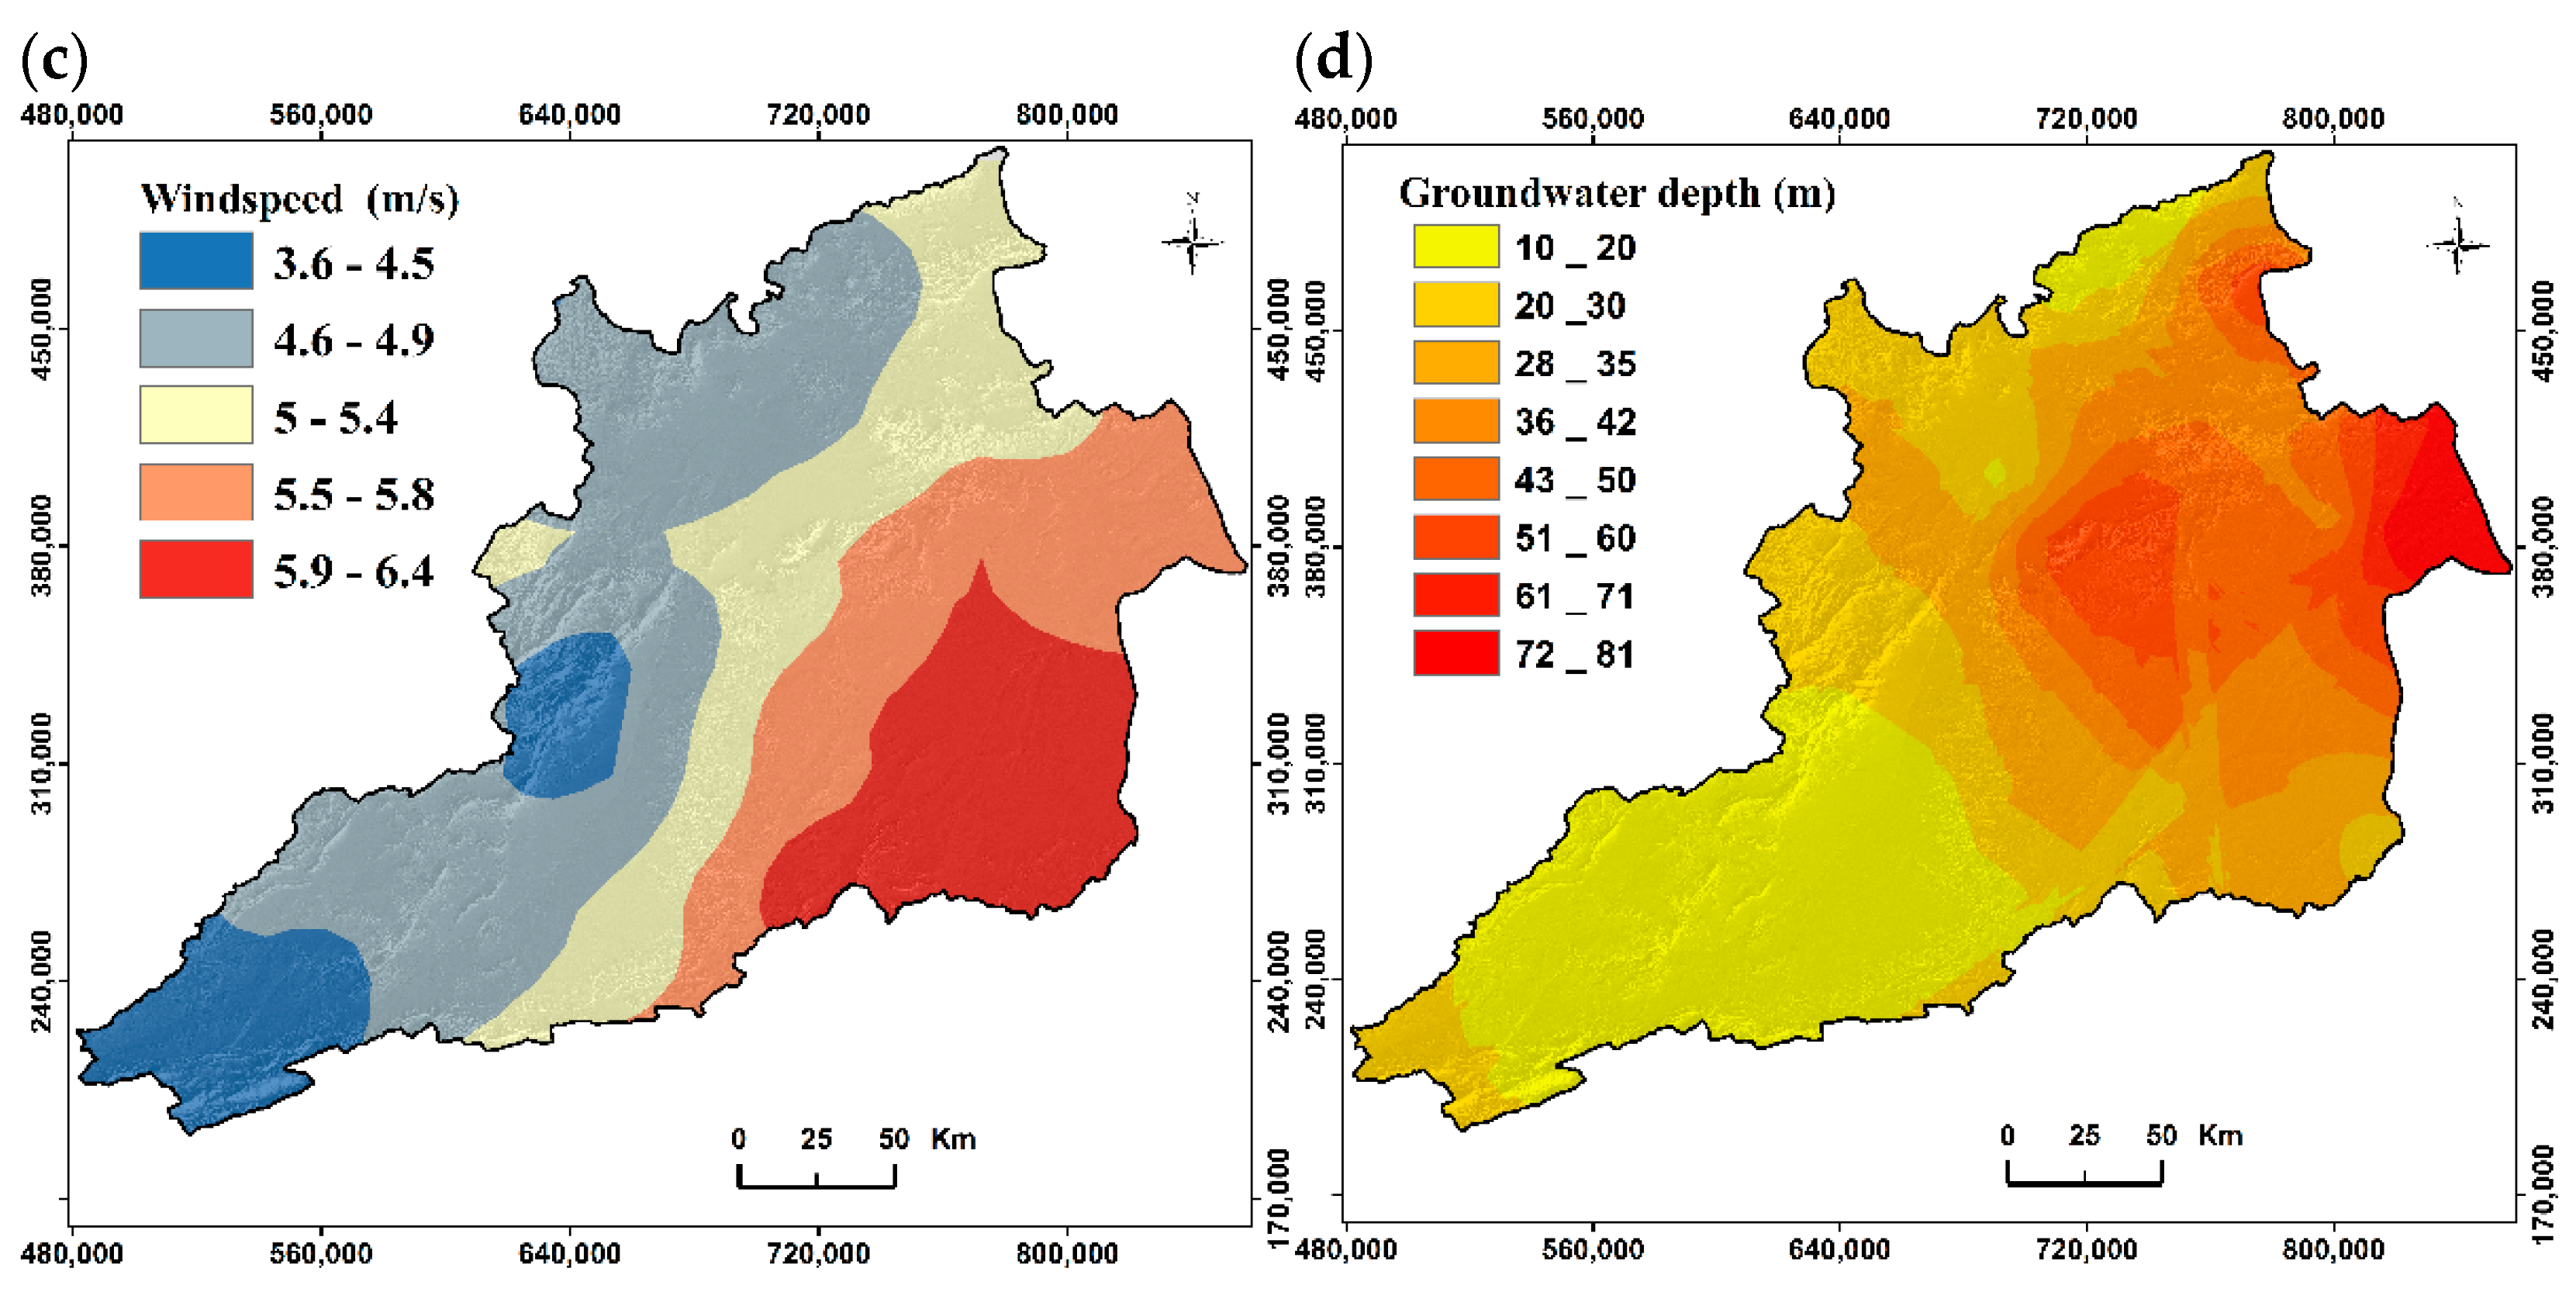
2.3.1. Meteorological Data
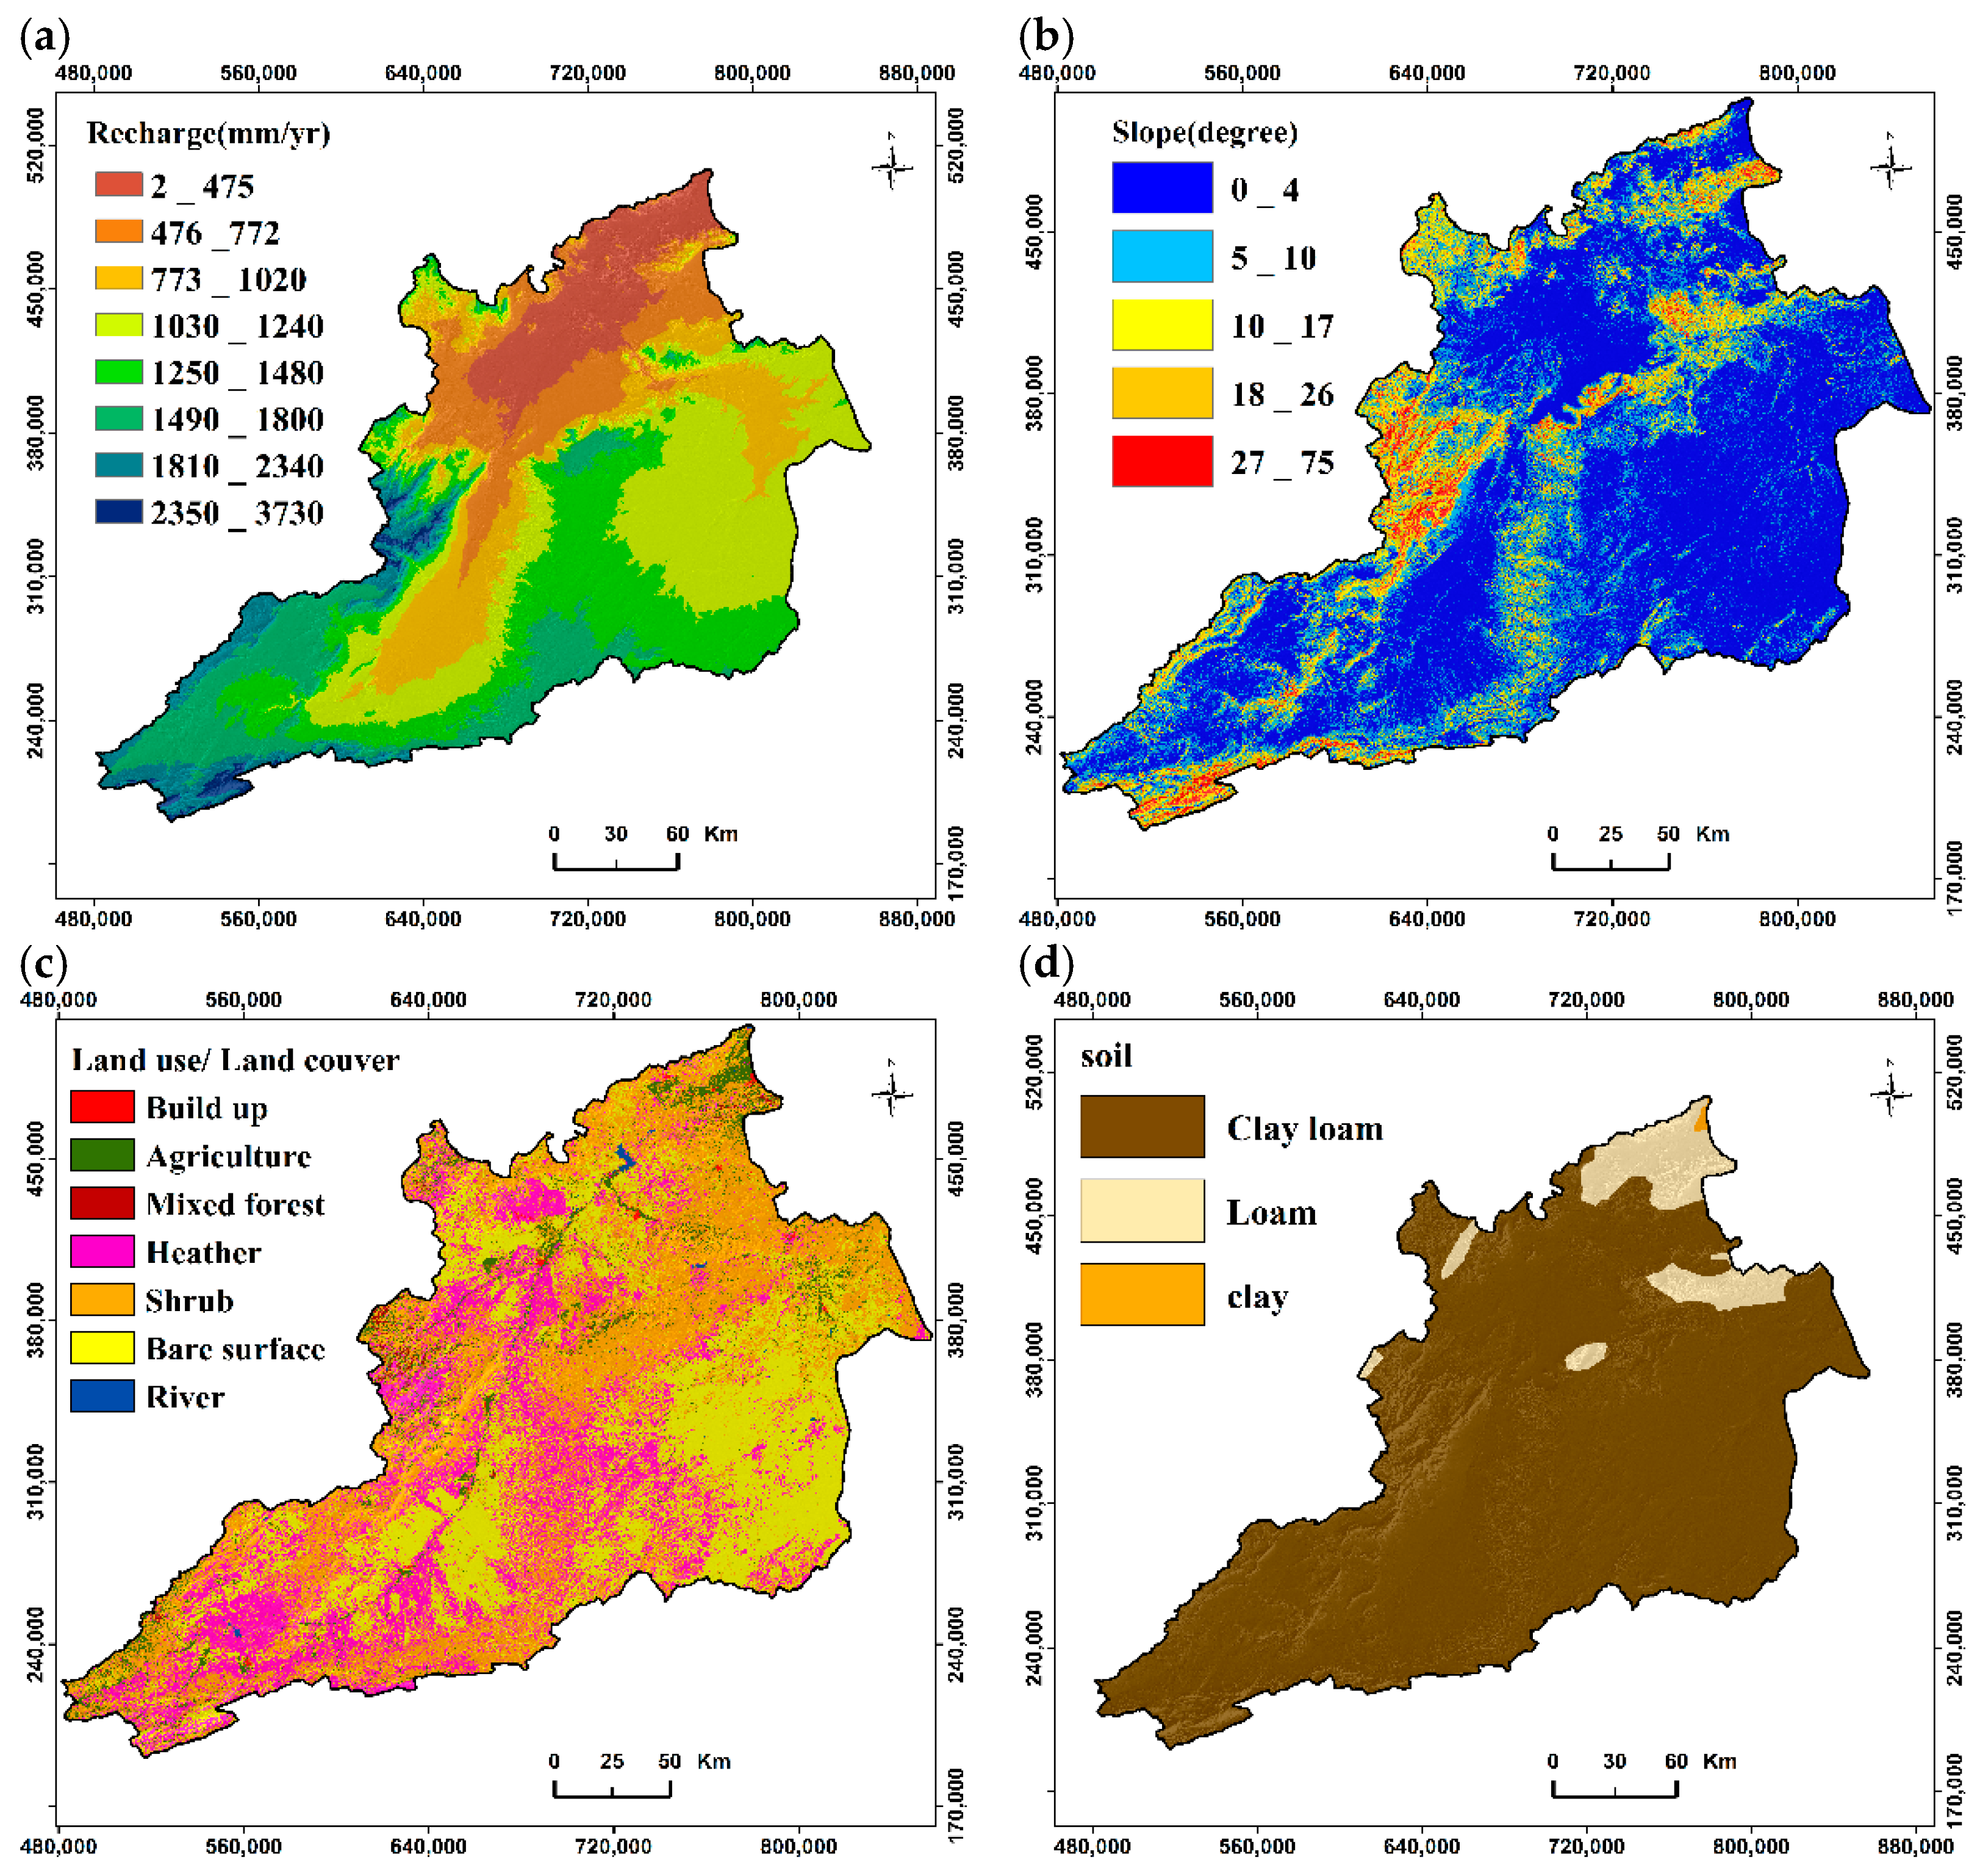
2.3.2. Topography and Slope
2.3.3. Land Use
2.3.4. Soil Data
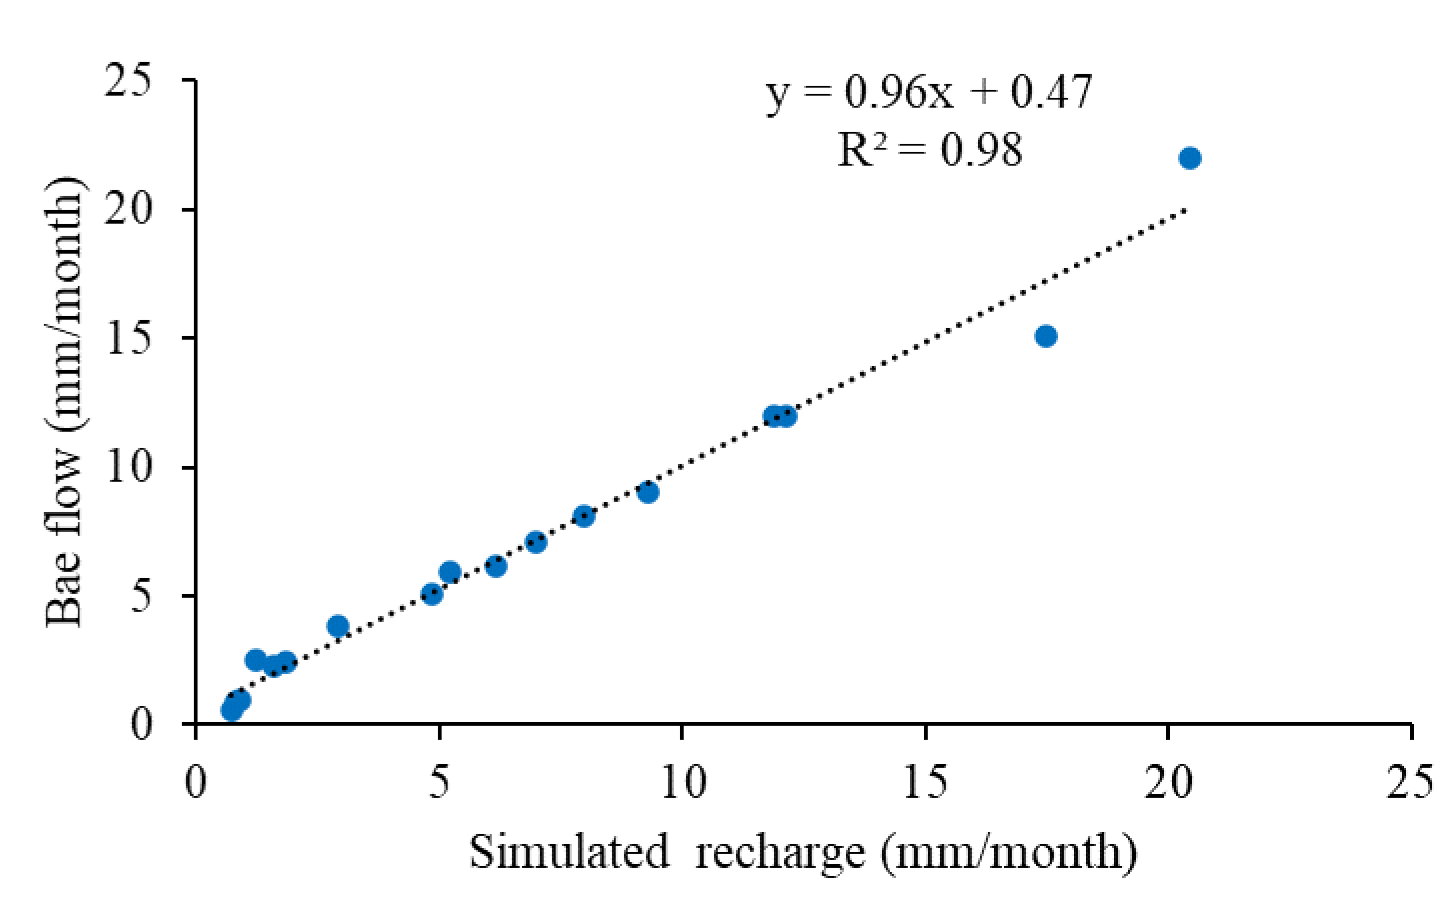
2.4. Validation of WetSpass-M Model
3. Results and Discussion
3.1. Validation of WetSpass-M Model
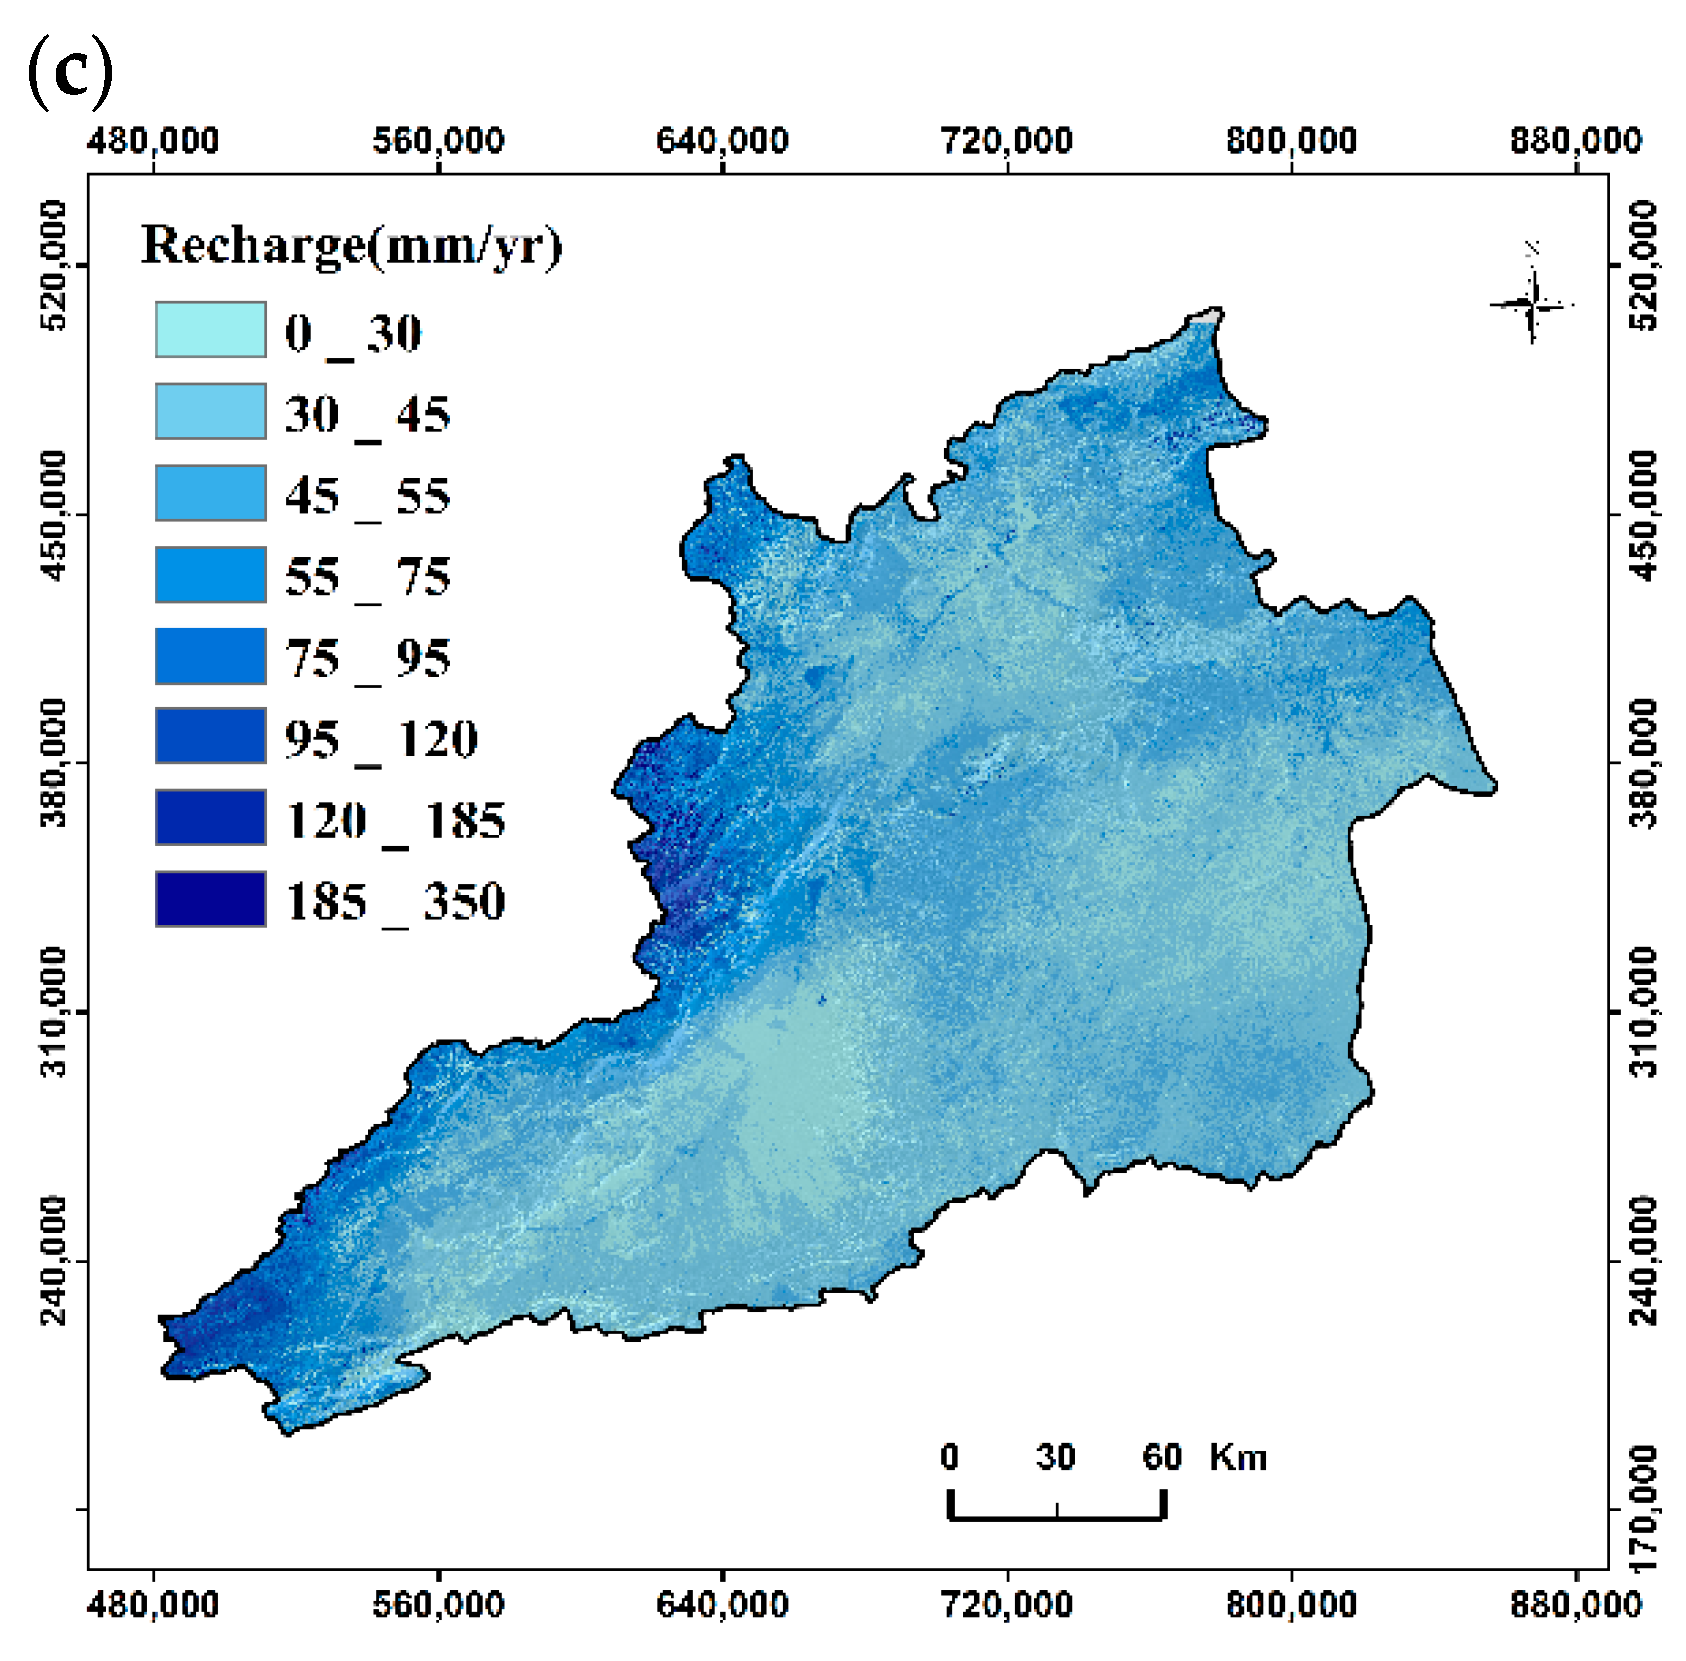
3.2. Water Balance Components
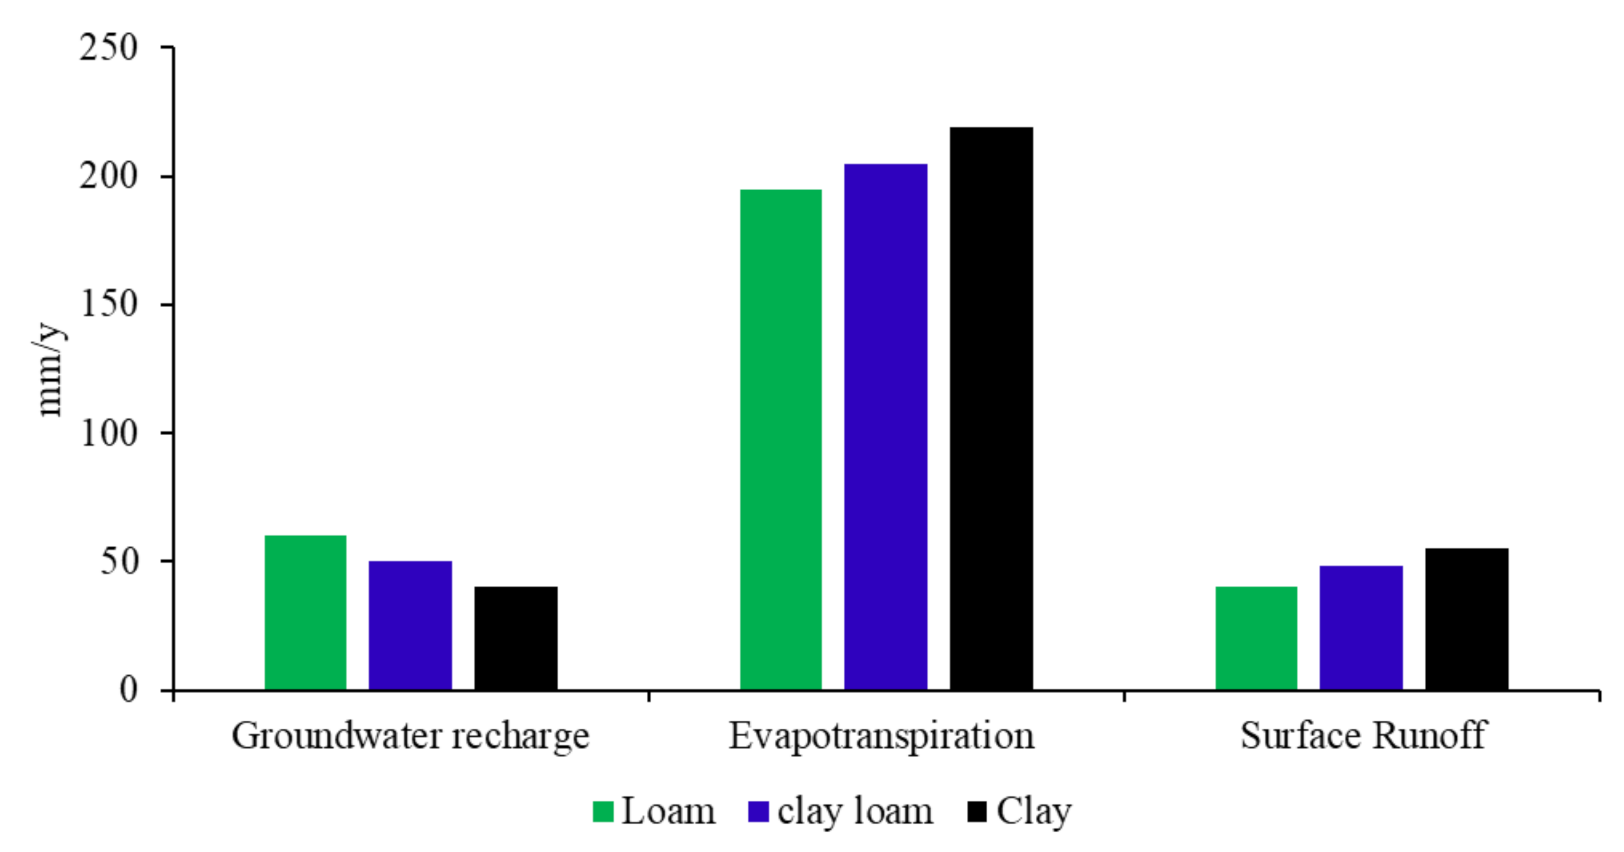
3.3. Water Balance Components under Different Land Use/Land Cover (LULC) Uses and Soil Textures
4. Conclusions
Author Contributions
Funding
Institutional Review Board Statement
Informed Consent Statement
Data Availability Statement
Acknowledgments
Conflicts of Interest
Appendix A
Appendix A.1. Interception
Appendix A.2. Surface Runoff
Appendix A.3. Evapotranspiration
Appendix A.4. Recharge
Appendix B

| LULC Classes | Soil Texture | ||||
|---|---|---|---|---|---|
| Sand | Sandy Loam | Loam | Average | St.Dev | |
| Build up | 177.6 | 182.7 | 174.1 | 178.1 | 3.5 |
| Agriculture | 214.6 | 203.1 | 193.1 | 203.6 | 8.8 |
| Mixed forest | 171.3 | 139.1 | 117.4 | 142.6 | 22.2 |
| Heather | 225.7 | 240.9 | 220.6 | 229.1 | 8.6 |
| Shrub | 228.8 | 232.3 | 221.3 | 227.5 | 4.6 |
| Bare areas | 173.5 | 206.9 | 183.5 | 187.9 | 14 |
| River | 526.1 | 578.9 | 569.6 | 558.2 | 23 |
| Average | 245.4 | 254.8 | 240 | ||
| St. dev | 116.9 | 135.9 | 138.4 | ||
| LULC Classes | Soil Texture | ||||
|---|---|---|---|---|---|
| Sand | Sandy Loam | Loam | Average | St.Dev | |
| Build up | 67.9 | 73.3 | 75 | 72 | 3 |
| Agriculture | 55 | 60 | 62 | 59 | 2.9 |
| Mixed forest | 90.2 | 92 | 95 | 92.4 | 2 |
| Heather | 26.3 | 33.6 | 35 | 31.6 | 3.8 |
| Shrub | 28.5 | 31 | 32 | 30.5 | 1.5 |
| Bare areas | 68.2 | 108.4 | 110 | 95.5 | 19.3 |
| River | 279.5 | 305.3 | 315 | 299.9 | 15 |
| Average | 87.9 | 100.5 | 103.4 | ||
| St. dev | 81 | 87.6 | 90.4 | ||
References
- IPCC. Climate Change 2001: The Scientific Basis. Contribution of Working Group 1 to the Third Assessment Report of the Intergovernmental Panel on Climate Change—Book Reviews; Houghton, J.T., Ding, Y., Griggs, D.J., Noguer, M., van der Linden, P.J., Da, X., Eds.; Cambridge Press, Cambridge University: Cambridge, UK; New York, NY, USA, 2001. [Google Scholar]
- Dezső, J.; Lóczy, D.; Salem, A.; Gábor, N. Floodplain Connectivity. In The Drava River: Environmental Problems and Solutions; Springer Science + Media: Cham, Switzerland, 2019; pp. 215–230. [Google Scholar]
- Arefaine, T.; Nedaw, D.; Gebreyohannes, T. Groundwater Recharge, Evapotranspiration and Surface Runoff Estimation Using WetSpass Modeling Method in Illala Catchment, Northern Ethiopia. Momona Ethiop. J. Sci. 2012, 4, 96–110. [Google Scholar]
- National Research Council (NRC). Water Implications of Biofuels Production in the United States; National Academies Press: Washington, DC, USA, 2008. [Google Scholar]
- Schilling, J.; Freier, K.P.; Hertig, E.; Scheffran, J. Climate change, vulnerability and adaptation in North Africa with focus on Morocco. Agric. Ecosyst. Environ. 2012, 156, 12–26. [Google Scholar] [CrossRef]
- Malki, M.; Choukr Allah, R.; Bouchaou, L.; Ait Brahim, Y.; Hirich, A.; Reichert, B. Evolution of Groundwater Quality in Intensive Agricultural Zone: Case of Chtouka-Massa Aquifer, Morocco. Arab. J. Geosci. 2016, 9, 1–4. [Google Scholar]
- Seif-Ennasr, M.; Hirich, A.; El Morjani, Z.E.A.; Choukr-Allah, R.; Zaaboul, R.; Nrhira, A.; Malki, M.; Bouchaou, L.; Beraaouz, E.H. Assessment of Global Change Impacts on Groundwater Resources in Souss-Massa Basin. In Water Resources in Arid Areas: The Way Forward; Springer: Berlin/Heidelberg, Germany, 2017; pp. 115–140. [Google Scholar]
- Bouchaou, L.; Choukr-Allah, R.; Hirich, A.; Seif-Ennasr, M.; Malki, M.; Abahous, H.; Bouaakaz, B.; Nghira, A. Climate Change and Water Valuation in Souss-Massa Region: Management and Adaptive Measures. Eur. Water 2017, 60, 203–209. [Google Scholar]
- Bouchaou, L.; Tagma, T.; Boutaleb, S.; Hssaisoune, M.; El Morjani, Z.E.A. Climate Change and Its Impacts on Groundwater Resources in Morocco: The Case of the Souss- Massa Basin. Clim. Chang. E. Groundw. Resour. A Glob. Synth. Find. Recomm. 2011, 2007, 129–144. [Google Scholar]
- Kadi, M.A.; Ziyad, A. Integrated Water Resources Management in Morocco. In Global Water Security; Springer: Singapore, 2018; pp. 143–163. [Google Scholar]
- Dihazi, A.; Jaiti, F.; Taktak, W.; kilani-Feki, O.; Jaoua, S.; Driouich, A.; Baaziz, M.; Daayf, F.; Serghini, M.A. Use of Two Bacteria for Biological Control of Bayoud Disease Caused by Fusarium Oxysporum in Date Palm (Phoenix Dactylifera L.) Seedlings. Plant Physiol. Biochem. 2012, 55, 7–15. [Google Scholar] [CrossRef]
- Salem, A.; Dezső, J.; El-Rawy, M.; Lóczy, D. Water Management and Retention Opportunities Along the Hungarian Section of the Drava River. In Recent Advances in Environmental Science from the Euro-Mediterranean and Surrounding Regions, Proceedings of the EMCEI 2019 2nd Euro-Mediterranean Conference for Environmental Integration (EMCEI-2), Sousse, Tunisia, 10–13 October 2019, 2nd ed.; Environmental Science and Engineering; Springer: Cham, Switzerland; pp. 1697–1702. [CrossRef]
- Lóczy, D.; Tóth, G.; Hermann, T.; Rezsek, M.; Nagy, G.; Dezső, J.; Salem, A.; Gyenizse, P.; Gobin, A.; Vacca, A.; et al. Perspectives of land evaluation of floodplains under conditions of aridification based on the assessment of ecosystem services. Hung. Geogr. Bull. 2020, 69, 227–243. [Google Scholar] [CrossRef]
- Anuraga, T.; Ruiz, L.; Kumar, M.M.; Sekhar, M.; Leijnse, A. Estimating groundwater recharge using land use and soil data: A case study in South India. Agric. Water Manag. 2006, 84, 65–76. [Google Scholar] [CrossRef]
- Batelaan, O.; De Smedt, F.; Triest, L. Regional groundwater discharge: Phreatophyte mapping, groundwater modelling and impact analysis of land-use change. J. Hydrol. 2003, 275, 86–108. [Google Scholar] [CrossRef]
- Salem, A.; Dezső, J.; Lóczy, D.; El-Rawy, M.; Slowik, M. Modeling Surface Water-Groundwater Interaction in an Oxbow of the Drava Floodplain. In Proceedings of the 13th International Conference on Hydroinformatics (HIC 2018), Palermo, Italy, 1–6 July 2018; Volume 3, pp. 1832–1840. [Google Scholar]
- El-Rawy, M.; Batelaan, O.; Buis, K.; Anibas, C.; Mohammed, G.; Zijl, W.; Salem, A. Analytical and Numerical Groundwater Flow Solutions for the FEMME-Modeling Environment. Hydrology 2020, 7, 27. [Google Scholar] [CrossRef]
- Zhang, D.; Madsen, H.; Ridler, M.E.; Refsgaard, J.C.; Jensen, K.H. Impact of uncertainty description on assimilating hydraulic head in the MIKE SHE distributed hydrological model. Adv. Water Resour. 2015, 86, 400–413. [Google Scholar] [CrossRef]
- Gumindoga, W.; Rientjes, T.; Haile, A.; Dube, T. Predicting streamflow for land cover changes in the Upper Gilgel Abay River Basin, Ethiopia: A TOPMODEL based approach. Phys. Chem. Earth Parts A/B/C 2014, 76-78, 3–15. [Google Scholar] [CrossRef]
- Manfreda, S.; Fiorentino, M.; Iacobellis, V. DREAM: A distributed model for runoff, evapotranspiration, and antecedent soil moisture simulation. Adv. Geosci. 2005, 2, 31–39. [Google Scholar] [CrossRef] [Green Version]
- Wang, G.; Zhang, Y.; Liu, G.; Chen, L. Impact of land-use change on hydrological processes in the Maying River basin, China. Sci. China Ser. D Earth Sci. 2006, 49, 1098–1110. [Google Scholar] [CrossRef]
- Batelaan, O.; Smedt, F.D. WetSpass: A Flexible, GIS Based, Distributed Recharge Methodology for Regional Ground-Water Modelling. In Impact of Human Activity on Groundwater Dynamics; Gehrels, H., Peters, J., Leibundgut, C., Eds.; International Association of Hydrological Sciences: Wallingford, UK, 2001; pp. 11–17. [Google Scholar]
- Zarei, M.; Ghazavi, R.; Vali, A.; Abdollahi, K. Estimating Groundwater Recharge, Evapotranspiration and Surface Runoff using Land-use data: A Case Study in Northeast Iran. Biol. Forum Int. J. 2016, 8, 196–202. [Google Scholar]
- Abu-Saleem, A.; Al-Zu’bi, Y.; Rimawi, O.; Alouran, N. Estimation of Water Balance Components in the Hasa Basin with GIS based WetSpass Model. J. Agron. 2010, 9, 119–125. [Google Scholar] [CrossRef] [Green Version]
- Al Kuisi, M.; El-Naqa, A. GIS based spatial groundwater recharge estimation in the Jafr basin, Jordan–Application of WetSpass models for arid regions. Rev. Mex. Cienc. Geol. 2013, 30, 96–109. [Google Scholar]
- Gebremeskel, G.; Kebede, A. Spatial estimation of long-term seasonal and annual groundwater resources: Application of WetSpass model in the Werii watershed of the Tekeze River Basin, Ethiopia. Phys. Geogr. 2017, 38, 338–359. [Google Scholar] [CrossRef]
- Gebreyohannes, T.; De Smedt, F.; Walraevens, K.; Gebresilassie, S.; Hussien, A.; Hagos, M.; Amare, K.; Deckers, J.; Gebrehiwot, K. Application of a spatially distributed water balance model for assessing surface water and groundwater resources in the Geba basin, Tigray, Ethiopia. J. Hydrol. 2013, 499, 110–123. [Google Scholar] [CrossRef]
- Ghouili, N.; Horriche, F.J.; Zammouri, M.; Benabdallah, S.; Farhat, B. Coupling WetSpass and MODFLOW for ground-water recharge assessment: Case study of the Takelsa multilayer aquifer, northeastern Tunisia. Geosci. J. 2017, 21, 791–805. [Google Scholar] [CrossRef]
- Armanuos, A.M.; Negm, A.; Yoshimura, C.; Valeriano, O.C.S. Application of WetSpass model to estimate groundwater recharge variability in the Nile Delta aquifer. Arab. J. Geosci. 2016, 9, 1–14. [Google Scholar] [CrossRef]
- Aish, A.M. Estimation of water balance components in the Gaza Strip with GIS based WetSpass model. Civ. Environ. Res. 2014, 6, 77–84. [Google Scholar]
- Salem, A.; Dezső, J.; El-Rawy, M. Assessment of Groundwater Recharge, Evaporation, and Runoff in the Drava Basin in Hungary with the WetSpass Model. Hydrology 2019, 6, 23. [Google Scholar] [CrossRef] [Green Version]
- Salem, A.; Dezső, J.; El-Rawy, M.; Loczy, D.; Halmai, Á. Estimation of Groundwater Recharge Distribution Using Gis Based WetSpass Model in the Cun-Szaporca Oxbow, Hungary. In Proceedings of the 19th International Multidisciplinary Scientific GeoConference SGEM 2019, Albena, Bulgaria, 28 June–7 July 2019; Volume 19, pp. 169–176. [Google Scholar]
- Salem, A.; Dezső, J.; El-Rawy, M.; Lóczy, D. Hydrological Modeling to Assess the Efficiency of Groundwater Replenishment through Natural Reservoirs in the Hungarian Drava River Floodplain. Water 2020, 12, 250. [Google Scholar] [CrossRef] [Green Version]
- Karlović, I.; Marković, T.; Vujnović, T.; Larva, O. Development of a Hydrogeological Conceptual Model of the Varaždin Alluvial Aquifer. Hydrology 2021, 8, 19. [Google Scholar] [CrossRef]
- Aslam, M.; Salem, A.; Singh, V.P.; Arshad, M. Estimation of Spatial and Temporal Groundwater Balance Components in Khadir Canal Sub-Division, Chaj Doab, Pakistan. Hydrology 2021, 8, 178. [Google Scholar] [CrossRef]
- Kadi, M.A. From Water Scarcity to Water Security in the Maghreb Region: The Moroccan Case. In Environmental Challenges in the Mediterranean 2000–2050; NATO Science Series IV; Marquina, A., Ed.; Kluwer Academic Publisher: Dordrencht, The Nertherlands, 2004. [Google Scholar]
- Amiri, M.; Salem, A.; Ghzal, M. Delineation of Groundwater Potential Zones Using Gis and Remote Sensing in Central Moulouya Basin, Morocco. In Proceedings of the MedGU-21, Istanbul, Turkey, 25–28 November 2021. [Google Scholar]
- Snoussi, M. Review of Certain Basic Elements for the Assessment of Environmental Flows in the Lower Moulouya; IUCN International Union for Conservation of Nature: Gland, Switzerland, 2004. [Google Scholar]
- Melhaoui, M. Integration of Biodiversity in the Decision-Making Process: Lessons Learnt from the Moulouya Projects; Centre for Mediterranean Cooperation, International Union for Conservation of Nature: Gland, Switzerland, 2010; Available online: http://cmsdata.iucn.org/downloads/moulouya_lessons_learned.pdf (accessed on 10 June 2021).
- Pastor, A.; Babault, J.; Owen, L.A.; Teixell, A.; Arboleya, M.-L. Extracting dynamic topography from river profiles and cosmogenic nuclide geochronology in the Middle Atlas and the High Plateaus of Morocco. Tectonophysics 2015, 663, 95–109. [Google Scholar] [CrossRef]
- Batelaan, O.; De Smedt, F. GIS-based recharge estimation by coupling surface–subsurface water balances. J. Hydrol. 2007, 337, 337–355. [Google Scholar] [CrossRef]
- Abdollahi, K.; Bashir, I.; Verbeiren, B.; Harouna, M.R.; Van Griensven, A.; Huysmans, M.; Batelaan, O. A distributed monthly water balance model: Formulation and application on Black Volta Basin. Environ. Earth Sci. 2017, 76, 198. [Google Scholar] [CrossRef]
- Köppen, W. Das Geographische System der Klimate. In Handbuch der Klimatologie; Köppen, W.P., Geiger, R.H., Eds.; Gebrüder Borntraeger: Berlin, Germany, 1936. [Google Scholar]
- Tekken, V.; Costa, L.; Kropp, J.P. Assessing the regional impacts of climate change on economic sectors in the low-lying coastal zone of Mediterranean East Morocco. J. Coast. Res. 2009, 1, 272–276. [Google Scholar]
- Simmers, I.; Hendrickx, J.M.H.; Kruseman, G.P.; Rushton, K.R. Recharge of Phreatic Aquifers in (Semi-) Arid Areas; Balkema, A.A., Ed.; IAH Publication: Hannover, Germany, 1997; ISBN 9789054106944. [Google Scholar]
- Tekken, V.; Kropp, J.P. Climate-Driven or Human-Induced: Indicating Severe Water Scarcity in the Moulouya River Basin (Morocco). Water 2012, 4, 959–982. [Google Scholar] [CrossRef] [Green Version]
- Magesh, N.S.; Chandrasekar, N.; Soundranayagam, J.P. Delineation of groundwater potential zones in Theni district, Tamil Nadu, using remote sensing, GIS and MIF techniques. Geosci. Front. 2012, 3, 189–196. [Google Scholar] [CrossRef] [Green Version]
- Rahmati, O.; Samani, A.N.; Mahdavi, M.; Pourghasemi, H.R.; Zeinivand, H. Groundwater potential mapping at Kurdistan region of Iran using analytic hierarchy process and GIS. Arab. J. Geosci. 2015, 8, 7059–7071. [Google Scholar] [CrossRef]
- Das, S.; Gupta, A.; Ghosh, S. Exploring groundwater potential zones using MIF technique in semi-arid region: A case study of Hingoli district, Maharashtra. Spat. Inf. Res. 2017, 25, 749–756. [Google Scholar] [CrossRef]
- Gupta, M.; Srivastava, P.K. Integrating GIS and remote sensing for identification of groundwater potential zones in the hilly terrain of Pavagarh, Gujarat, India. Water Int. 2010, 35, 233–245. [Google Scholar] [CrossRef]
- Kanagaraj, G.; Suganthi, S.; Elango, L.; Magesh, N.S. Assessment of groundwater potential zones in Vellore district, Tamil Nadu, India using geospatial techniques. Earth Sci. Inform. 2018, 12, 211–223. [Google Scholar] [CrossRef]
- Walker, G.R.; Zhang, L.; Ellis, T.W.; Hatton, T.J.; Petheram, C. Estimating impacts of changed land use on recharge: Review of modelling and other approaches appropriate for management of dryland salinity. Appl. Hydrogeol. 2002, 10, 68–90. [Google Scholar] [CrossRef]
- FAO; IHE Delft. Water Accounting + in the Awash RiverBasin; FAO WaPOR Water Accounting Reports; FAO: Rome, Italy, 2020. [Google Scholar]
- Ala-Aho, P.; Rossi, P.M.; Kløve, B. Estimation of temporal and spatial variations in groundwater recharge in unconfined sand aquifers using Scots pine inventories. Hydrol. Earth Syst. Sci. 2015, 19, 1961–1976. [Google Scholar] [CrossRef] [Green Version]
- Fetter, C.W. Applied Hydrogeology; Prentice Hall: Upper Saddle River, NJ, USA, 2001; Volume 17, 598p. [Google Scholar]
- CCI Land Cover. S2 Prototype Land Cover 20M Map of AFRICA. ESA. 2017. Available online: http://2016africalandcover20m.esrin.esa.int/ (accessed on 10 April 2021).
- Berhanu, B.; Melesse, A.M.; Seleshi, Y. GIS-based hydrological zones and soil geo-database of Ethiopia. Catena 2013, 104, 21–31. [Google Scholar] [CrossRef]
- SMEC. Hydrological Study of Tana Beles Sub-Basins, Part I; SMEC International PVT Ltd: Addis Ababa, Ethiopia, 2007. [Google Scholar]
- Fischer, G.; Nachtergaele, F.; Prieler, S.; van Velthuizen, H.T.; Verelst, L.; Wiberg, D. Global Agro-ecological Zones Assessment for Agriculture (GAEZ 2008); IIASA: Laxenburg, Austria; FAO: Rome, Italy, 2008. [Google Scholar]
- Eckhardt, K. How to construct recursive digital filters for baseflow separation. Hydrol. Process. 2005, 19, 507–515. [Google Scholar] [CrossRef]
- Lyne, V.; Hollick, M. Stochastic Time-Variable Rainfall-Runoff Modelling. In Proceedings of the Institute of Engineers Australia National Conference, Perth, WA, Australia, 10–12 September 1979; pp. 89–93. [Google Scholar]
- Nathan, R.J.; McMahon, T.A. Evaluation of automated techniques for base flow and recession analyses. Water Resour. Res. 1990, 26, 1465–1473. [Google Scholar] [CrossRef]
- Arnold, J.G.; Allen, P.M. Validation of automated methods for estimating baseflow and groundwater recharge from stream flow records. J. Am. Water Resour. Assoc. 1999, 35, 411–424. [Google Scholar] [CrossRef]
- Arnold, J.; Muttiah, R.; Srinivasan, R.; Allen, P. Regional estimation of base flow and groundwater recharge in the Upper Mississippi river basin. J. Hydrol. 2000, 227, 21–40. [Google Scholar] [CrossRef]
- Lim, K.J.; Engel, B.A.; Tang, Z.; Choi, J.; Kim, K.-S.; Muthukrishnan, S.; Tripathy, D. Automated Web GIS Based Hydrograph Analysis Tool, What. JAWRA J. Am. Water Resour. Assoc. 2005, 41, 1407–1416. [Google Scholar] [CrossRef]
- Alley, W.M.; Healy, R.W.; LaBaugh, J.W.; Reilly, T.E. Flow and Storage in Groundwater Systems. Sciences 2002, 296, 1985–1990. [Google Scholar] [CrossRef] [Green Version]
- Healy, R.; Scanlon, B. Groundwater Recharge. In Estimating Groundwater Recharge; Cambridge University Press: Cambridge, UK, 2010; pp. 1–14. [Google Scholar]
- Dezső, J.; Salem, A.; Lóczy, D.; Slowik, M.; Dávid, P. Randomly Layered Fluvial Sediments Influenced Groundwater-Surface Water Interaction. In Proceedings of the 17th International Multidisciplinary Scientific GeoConference SGEM 2017, Vienna, Austria, 27 June–6 July 2017; Volume 17, pp. 331–338. [Google Scholar]
- Singh, R.K.; Senay, G.B.; Velpuri, N.M.; Bohms, S.; Scott, R.L.; Verdin, J.P. Actual Evapotranspiration (Water Use) Assessment of the Colorado River Basin at the Landsat Resolution Using the Operational Simplified Surface Energy Balance Model. Remote Sens. 2013, 6, 233–256. [Google Scholar] [CrossRef] [Green Version]
- Horn, R.; Domżżał, H.; Słowińska-Jurkiewicz, A.; Van Ouwerkerk, C. Soil compaction processes and their effects on the structure of arable soils and the environment. Soil Tillage Res. 1995, 35, 23–36. [Google Scholar] [CrossRef]
- Defossez, P.; Richard, G. Models of soil compaction due to traffic and their evaluation. Soil Tillage Res. 2002, 67, 41–64. [Google Scholar] [CrossRef]
- Tilahun, K.; Merkel, B.J. Estimation of groundwater recharge using a GIS-based distributed water balance model in Dire Dawa, Ethiopia. Appl. Hydrogeol. 2009, 17, 1443–1457. [Google Scholar] [CrossRef]
- Gitika, T.; Ranjan, S. Estimation of Surface Runoff using NRCS Curve number procedure in Buriganga Watershed, Assam, India—A Geospatial Approach. Int. Res. J. Earth Sci. 2014, 2, 2321–2527. [Google Scholar]
- Zhang, Y.; Liu, S.; Cheng, F.; Shen, Z. WetSpass-Based Study of the Effects of Urbanization on the Water Balance Components at Regional and Quadrat Scales in Beijing, China. Water 2018, 10, 5. [Google Scholar] [CrossRef] [Green Version]
- Kahsay, G.H.; Gebreyohannes, T.; Gebremedhin, M.A.; Gebrekirstos, A.; Birhane, E.; Gebrewahid, H.; Welegebriel, L. Spatial groundwater recharge estimation in Raya basin, Northern Ethiopia: An approach using GIS based water balance model. Sustain. Water Resour. Manag. 2018, 5, 961–975. [Google Scholar] [CrossRef]
- Gebru, T.A.; Tesfahunegn, G.B. GIS based water balance components estimation in northern Ethiopia catchment. Soil Tillage Res. 2019, 197, 104514. [Google Scholar] [CrossRef]
- Zomlot, Z.; Verbeiren, B.; Huysmans, M.; Batelaan, O. Spatial distribution of groundwater recharge and base flow: Assessment of controlling factors. J. Hydrol. Reg. Stud. 2015, 4, 349–368. [Google Scholar] [CrossRef] [Green Version]
- Nie, W.; Yuan, Y.; Kepner, W.; Nash, M.S.; Jackson, M.; Erickson, C. Assessing impacts of Landuse and Landcover changes on hydrology for the upper San Pedro watershed. J. Hydrol. 2011, 407, 105–114. [Google Scholar] [CrossRef]
- De Groen, M.M.; Savenije, H.H.G. A monthly interception equation based on the statistical characteristics of daily rainfall. Water Resour. Res. 2006, 42, W12417. [Google Scholar] [CrossRef]
- Sutanto, S.J.; Wenninger, J.; Coenders-Gerrits, A.M.J.; Uhlenbrook, S. Partitioning of evaporation into transpiration, soil evaporation and interception: A comparison between isotope measurements and a HYDRUS-1D model. Hydrol. Earth Syst. Sci. 2012, 16, 2605–2616. [Google Scholar] [CrossRef] [Green Version]
- Bahremand, A.; De Smedt, F.; Corluy, J.; Liu, Y.B.; Poorova, J.; Velcicka, L.; Kunikova, E. WetSpa Model Application for Assessing Reforestation Impacts on Floods in Margecany–Hornad Watershed, Slovakia. Water Resour. Manag. 2007, 21, 1373–1391. [Google Scholar] [CrossRef]


| ID | Input Parameter | Sources | Resolution |
|---|---|---|---|
| 1 | DEM and slope | Shuttle Radar Topography Mission (SRTM) and own processing | 100 × 100 m |
| 2 | Temperature | MHBA and own processing | 100 × 100 m |
| 3 | Precipitation | MHBA and own processing | 100 × 100 m |
| 4 | Wind speed | MHBA and own processing | 100 × 100 m |
| 6 | LULC map | European Space Agency Sentinel2A Land Cover (ESA-S2-LC20) | 100 × 100 m |
| 7 | Soil texture | FAO database | 100 × 100 m |
| 8 | Groundwater depth | MHBA and own processing | 100 × 100 m |
| 9 | lookup table land use parameters | WetSpass-M model | |
| 10 | lookup table runoff coefficient | WetSpass-M model | |
| 11 | lookup table soil parameter | WetSpass-M model |
| Period | Value | Precipitation (mm) | Evapotranspiration (mm) | Runoff (mm) | Recharge (mm) |
|---|---|---|---|---|---|
| Annual | Range | 154–770 | 78–943 | 5–635 | 0–350 |
| Average | 298 | 209 | 44 | 45 | |
| Std. dev. | 81 | 48 | 40 | 22 | |
| Monthly | Range | 13–64 | 6–79 | 0–53 | 0–29 |
| Average | 25 | 17 | 4 | 4 | |
| Std. dev. | 7 | 4 | 13 | 2 | |
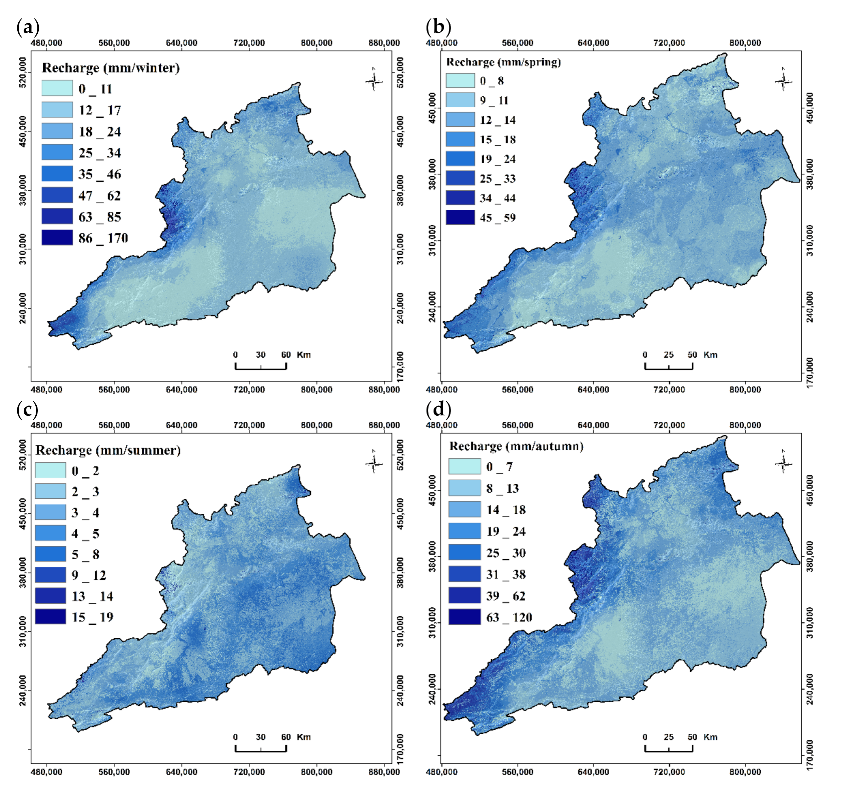
| Winter | Range | 30–398 | 15–305 | 1–287 | 0–171 |
| Average | 89 | 61 | 13 | 15 | |
| Std. dev. | 43 | 23 | 19 | 10 | |
| Spring | Range | 48–116 | 26–351 | 0–113 | 0–60 |
| Average | 75 | 57 | 7 | 11 | |
| Std. dev. | 10 | 11 | 7 | 4 | |
| Summer | Range | 14–42 | 7–104 | 0–41 | 0–19 |
| Average | 29 | 21 | 4 | 4 | |
| Std. dev. | 4 | 4 | 3 | 1 | |
| Autumn | Range | 42–239 | 22–224 | 1–217 | 0–116 |
| Average | 106 | 70 | 21 | 15 | |
| Std. dev. | 31 | 15 | 17 | 9 |
| LULC Classes | Soil Texture | ||||
|---|---|---|---|---|---|
| Sand | Sandy Loam | Loam | Average | St. Dev | |
| Build up | 51.3 | 55.5 | 50.3 | 52.3 | 2.3 |
| Agriculture | 75.4 | 64.6 | 58.5 | 66.2 | 7 |
| Mixed forest | 220.6 | 174.6 | 149.4 | 181.5 | 29.5 |
| Heather | 48.3 | 45.4 | 43.4 | 45.7 | 2 |
| Shrub | 50.3 | 45.3 | 44.4 | 46.7 | 2.6 |
| Bare areas | 30.8 | 26.8 | 21.3 | 26.3 | 3.9 |
| River | 0 | 0 | 0 | 0 | 0 |
| Average | 68.1 | 58.9 | 52.5 | ||
| St. dev | 65.8 | 51.1 | 43.6 | ||
Publisher’s Note: MDPI stays neutral with regard to jurisdictional claims in published maps and institutional affiliations. |
© 2022 by the authors. Licensee MDPI, Basel, Switzerland. This article is an open access article distributed under the terms and conditions of the Creative Commons Attribution (CC BY) license (https://creativecommons.org/licenses/by/4.0/).
Share and Cite
Amiri, M.; Salem, A.; Ghzal, M. Spatial-Temporal Water Balance Components Estimation Using Integrated GIS-Based Wetspass-M Model in Moulouya Basin, Morocco. ISPRS Int. J. Geo-Inf. 2022, 11, 139. https://doi.org/10.3390/ijgi11020139
Amiri M, Salem A, Ghzal M. Spatial-Temporal Water Balance Components Estimation Using Integrated GIS-Based Wetspass-M Model in Moulouya Basin, Morocco. ISPRS International Journal of Geo-Information. 2022; 11(2):139. https://doi.org/10.3390/ijgi11020139
Chicago/Turabian StyleAmiri, Mustapha, Ali Salem, and Mohamed Ghzal. 2022. "Spatial-Temporal Water Balance Components Estimation Using Integrated GIS-Based Wetspass-M Model in Moulouya Basin, Morocco" ISPRS International Journal of Geo-Information 11, no. 2: 139. https://doi.org/10.3390/ijgi11020139
APA StyleAmiri, M., Salem, A., & Ghzal, M. (2022). Spatial-Temporal Water Balance Components Estimation Using Integrated GIS-Based Wetspass-M Model in Moulouya Basin, Morocco. ISPRS International Journal of Geo-Information, 11(2), 139. https://doi.org/10.3390/ijgi11020139