Article

Investigating Human Travel Patterns from an Activity Semantic Flow Perspective: A Case Study within the Fifth Ring Road in Beijing Using Taxi Trajectory Data

1
College of Resources Environment and Tourism, Capital Normal University, Beijing 100048, China
2
3D Information Collection and Application Key Lab of Education Ministry, Capital Normal University, Beijing 100048, China
3
Beijing State Key Laboratory Incubation Base of Urban Environmental Processes and Digital Simulation, Capital Normal University, Beijing 100048, China
4
Beijing Laboratory of Water Resources Security, Capital Normal University, Beijing 100048, China
5
Nanjing Bureau of Planning and Natural Resources, Jiangning Branch, Nanjing 211100, China
6
State Key Laboratory of Resources and Environmental Information System, Institute of Geographical Sciences and Natural Resources Research, Chinese Academy of Sciences, Beijing 100101, China
*
Author to whom correspondence should be addressed.
ISPRS Int. J. Geo-Inf. 2022, 11(2), 140; https://doi.org/10.3390/ijgi11020140
Submission received: 16 December 2021 / Revised: 31 January 2022 / Accepted: 12 February 2022 / Published: 15 February 2022
(This article belongs to the Special Issue Mobility and Geosocial Networks)

Abstract

:
Massive taxi trajectory data can be easily obtained in the era of big data, which is helpful to reveal the spatiotemporal information of human travel behavior but neglects activity semantics. The activity semantics reflect people’s daily activities and trip purposes, and lead to a deeper understanding of human travel patterns. Most existing literature analyses of activity semantics mainly focus on the characteristics of the destination. However, the movement from the origin to the destination can be represented as the flow. The flow can completely represent the activity semantic and describe the spatial interaction between the origin and the destination. Therefore, in this paper, we proposed a two-layer framework to infer the activity semantics of each taxi trip and generalized the similar activity semantic flow to reveal human travel patterns. We introduced the activity inference in the first layer by a combination of the improved Word2vec model and Bayesian rules-based visiting probability ranking. Then, a flow clustering method is used to uncover human travel behaviors based on the similarity of activity semantics and spatial distribution. A case study within the Fifth Ring Road in Beijing is adopted and the results show that our method is effective for taxi trip activity inference. Six activity semantics and four activity semantics are identified in origins and destinations, respectively. We also found that differences exist in the activity transitions from origins to destinations at distinct periods. The research results can inform the taxi travel demand and provide a scientific decision-making basis for taxi operation and transportation management.

1. Introduction

With the rapid development of information and communication technologies (ICTs) and the widespread use of location-aware devices, there is an increasing availability of mobility data, such as vehicle GPS trajectory data, mobile phone records data and social media check-in data, which can offer high spatiotemporal resolution to observe human travel patterns at the individual level [1]. Although such fine-grained human mobility data include accurate location and temporal information, the semantic information relating to travel patterns and activity types is usually lacking [2,3,4,5]. Daily activity information is vital to understanding human travel behaviors because travel demands originate from people’s needs for participating in activities [6,7,8]. Previously, activity-based analysis in the literature derived from traditional travel surveys that recorded interviewees’ recollections of travel and activity information [2,9,10], namely when and where the respondent did what activities. Such travel surveys are also expensive and time-consuming. In contrast, massive GPS tracking data can effectively record individuals’ activities in real time and real space [11,12]. Taxis play an important role in public transportation systems in metropolises. Moreover, taxi trajectory data is a rich informative data source used to reveal travel patterns [13,14,15,16], identify urban functions [17,18,19,20,21], and discover urban structure [22,23,24]. However, many existing studies have focused on the spatial and temporal attributes of taxi trajectory data while ignoring activity semantic characteristics. Therefore, identifying activity semantics and inferring trip purposes from taxi trajectory data is an essential research topic, which can lead to a deeper understanding of human travel patterns.
Point-of-interest (POI) information provided powerful data support to identifying activity semantics. Previous work has proposed methods to infer activity semantics by associating a stop point with a candidate POI. Some studies focused on the geographic distance between the stop points and the candidate POIs. For example, Xie et al. [25] proposed a distance-based measure to join the taxi drop-off points with the nearest POI. Phithakkitnukoon et al. [26] proposed a count-based measure to associate the largest number of POIs taken in each grid with the activity semantics of the taxi stop point. Yue et al. [27] defined a simple buffer radius based on the shopping mall and considers the stop point near shopping malls as shopping semantic trips. Furthermore, a probability measurement has been used to reflect activity semantic. For instance, Furletti et al. [28] defined a spatiotemporal constraint resulting in the selection of candidate POIs within the maximum walking distance, and computed the visiting probability based on the gravity model and opening hours; Huang et al. [29] presented an approach using the spatiotemporal attractiveness of POIs, which was calculated by the POI size, to identify the activity from the trajectory; Gong et al. [2] introduced a Bayesian activity inference framework that takes both spatial and temporal constraints into consideration; Gong et al. [3] extended Gong’s work [2] by using spatiotemporal clustering, Bayesian probability, and Monte Carlo simulation; Li et al. [30] presented a framework for inferring trip purpose which considered comprehensive factors including distance, time, environment, activity type proportion, and the service capacity of the POIs.
These studies mainly relied on spatial and temporal constraints to select the candidate POI with the maximum visiting probability in order to infer the activity semantic. However, the geographic context was ignored, resulting in some mistakes in activity semantic inference. For example, a taxi drop-off at an airport area should be labelled as “transportation”. However, this location is surrounded by several internal affiliated restaurants, and sometimes wrongly inferred as “dining”, especially at lunch times.
To take the geographic context into consideration, some researchers [5,10,31,32,33] in-corporated word-embedding techniques to represent characteristics in a vector space. Yao et al. [34] first proposed a novel method integrating POIs with the Google Word2Vec model [35], computed the characteristic vector of each POI category based on the shortest path, and then used vectors and a k-means clustering method to extract the functional regions. However, the structure of geographic space differs substantially from the natural language; POIs in cities are distributed in geographical space, and near POIs are more strongly related to each other [36]. Therefore, converting POIs into sequence data directly has some limitations in explaining the spatial interactions between POIs. To solve the above problem, Yan et al. [37] considered the distance influence to extend the Word2Vec model to the Place2Vec model. However, the above mentioned studies do not consider the activity dynamic changes of POI attraction at different times when turning the POIs into a sequenced document. For example, people going to a shopping mall by taxi can be labeled as “shopping” activity in the evening but as “working” activity in the early morning. Therefore, the sequence data should be different if the individual’s drop-off is at the same location in the early morning or in the evening. By only considering the influence of distance, the sequence will be the same and cannot represent the activity dynamics.
Moreover, previous work has inferred trip activities using only drop-off positions and temporal information from taxi trajectory data. However, pick-up locations and time information are also closely associated with trip purposes. For example, “home” activities from the pick-up point and “work” activities from the drop-off point can help to focus on extracting an individual’s travel patterns for commute activities. The movement between the taxi pick-up point and the drop-off point can be regarded as a geographic flow and reflects the spatial interaction between two places. For example, Żochowska et al. [38] proposed a GIS-based method to assess the spatial integration of bike-sharing stations and adopted the traffic flows between the stations to describe the demand for bike-sharing ridership. Flow clustering can handle massive individual-level flows effectively and generalize spatial connections and mobility trends. Exploring the activity semantics from the perspective of flow is tightly coupled to the features of origin and destination, offers an insight on the complete trip, and better uncovers human travel patterns.
To close the mentioned research gaps, the main aim of this paper was to develop a two-layer framework to uncover human travel patterns from an activity semantic flow perspective. We integrated taxi trajectory data and POI data to infer the activity semantic of each taxi trip, and to generalize the similar activity semantic flow to reveal human travel behaviors. Within this framework, the activity semantic is obtained in the first layer. Specifically, we calculated Bayesian visiting probability-based ranking by extending Gong’s Bayesian inference model [2]. Then, word-embedding technology (the improved Word2vec model) was applied to build the latent representation of vectors of each pick-up point and drop-off point. Next, we used vectors and the Affinity Propagation Clustering method to annotate the activity semantics. In the second layer, an activity-based flow clustering method is applied to explore the spatiotemporal travel patterns of different activity semantic flows, which can be utilized for transport planning and management. To summarize, the contributions of this work are highlighted as follows:
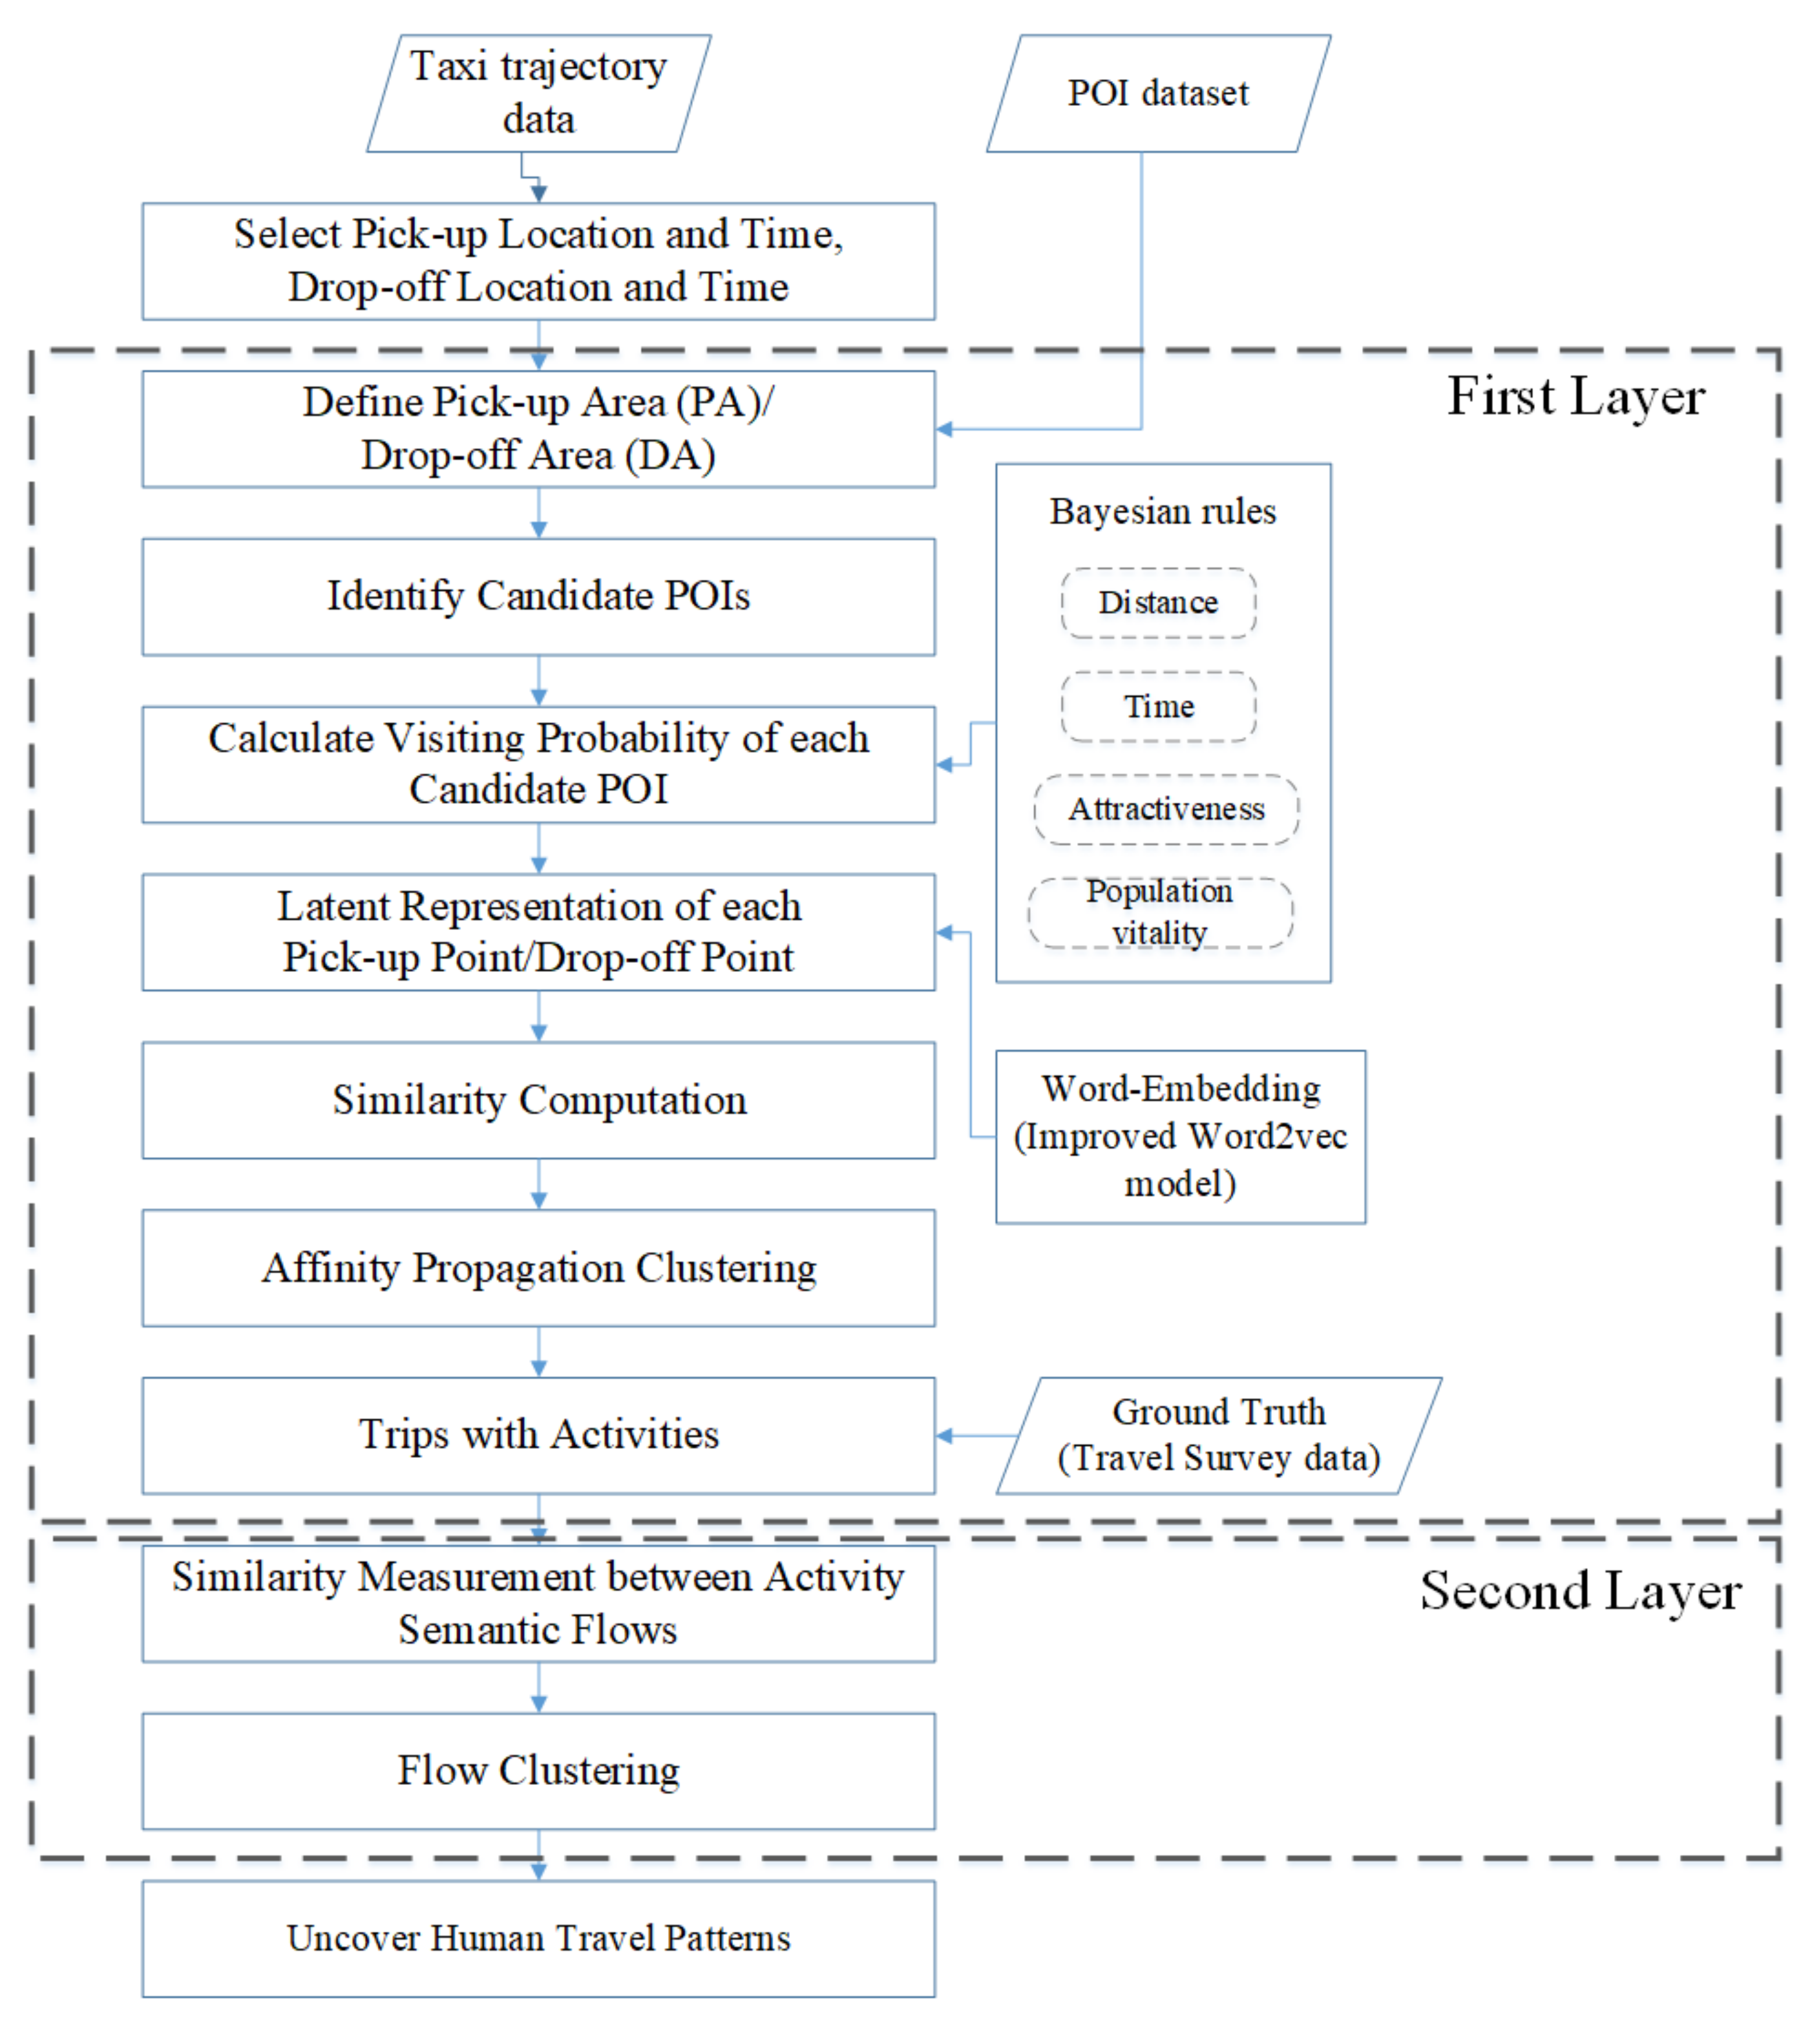
  • We propose a two-layer framework to effectively reveal human travel patterns based on activity semantic flows, which can describe the spatial interaction between the origin and destination and represent the activity semantics of both the origin and destination.
  • We consider the geographic context and the activity dynamics, integrating an improved Word2vec model and Bayesian rules-based visiting probability ranking when constructing the latent vector representation of each pick-up point and drop-off point.
The remainder of this paper is structured as follows. Section 2 introduces the study region and datasets. Section 3 presents the proposed two-layer framework methods. In Section 4, we discuss the activity semantic annotation, model validation results and un-cover the activity semantic flow patterns. All the place names mentioned in Section 4 are corresponded to Figure A1 of Appendix A. Finally, the conclusions of this paper are drawn, and future research directions are discussed in Section 5.

2. Study Area and Data Description
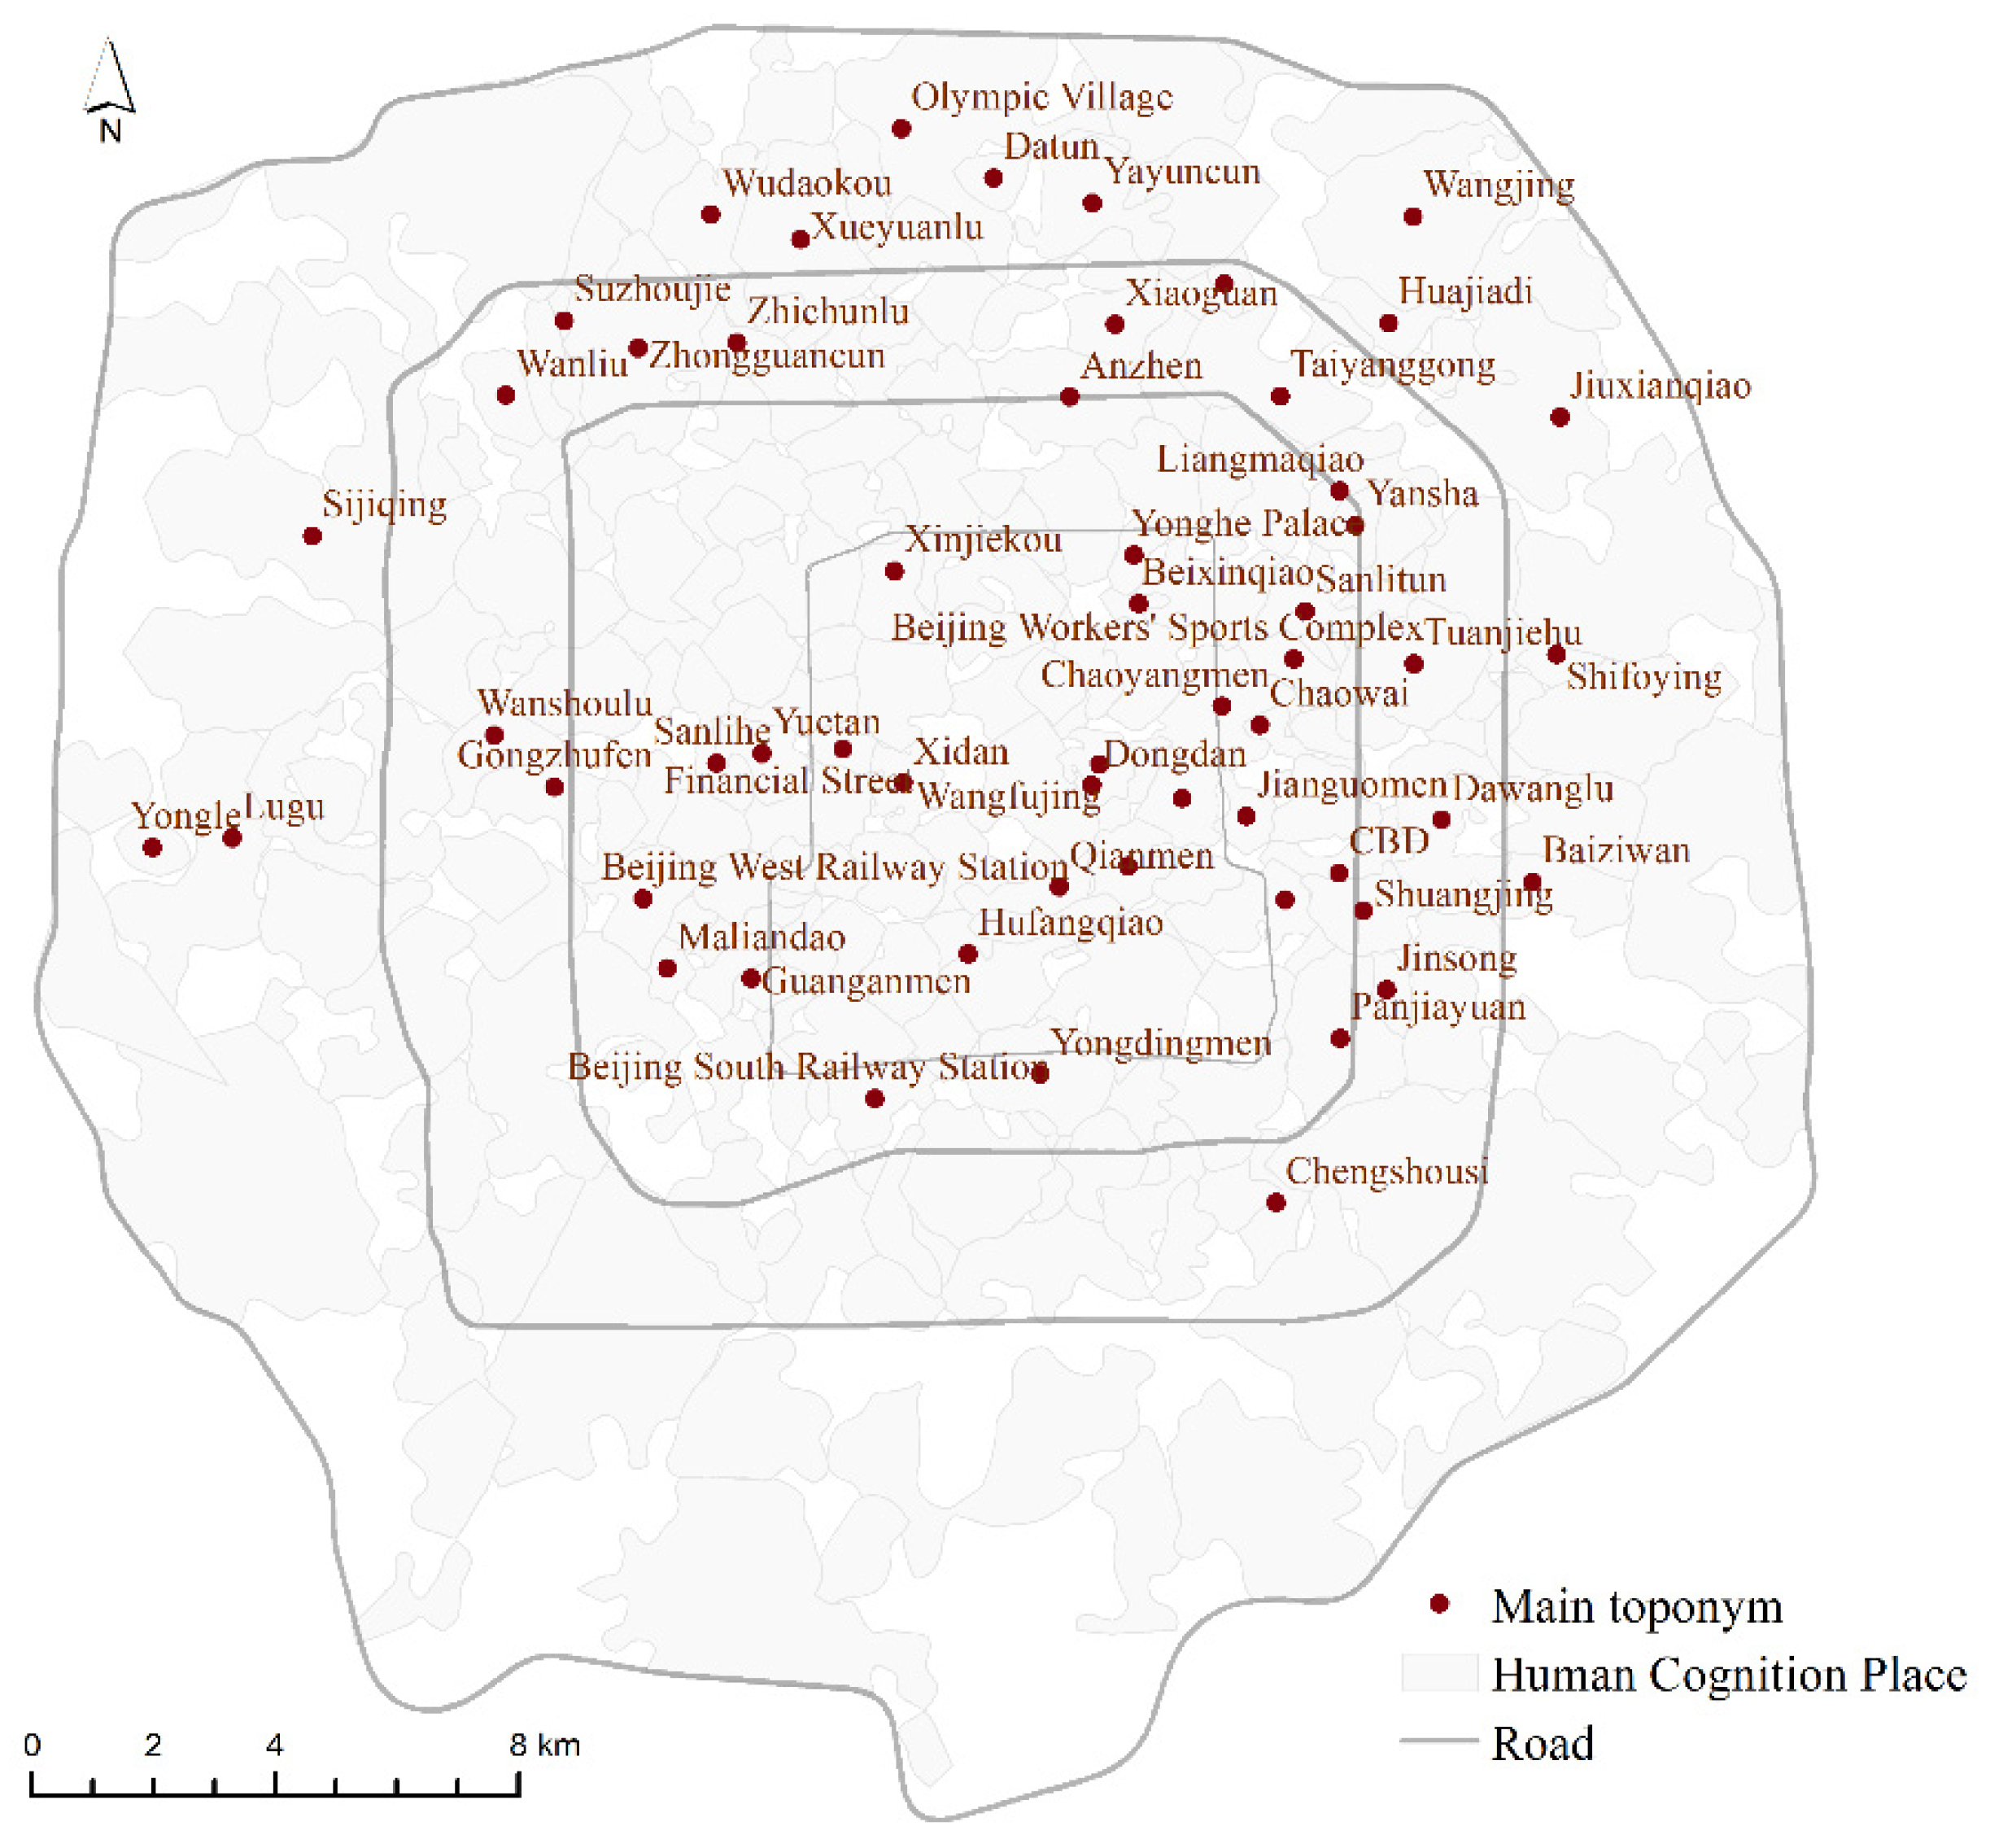
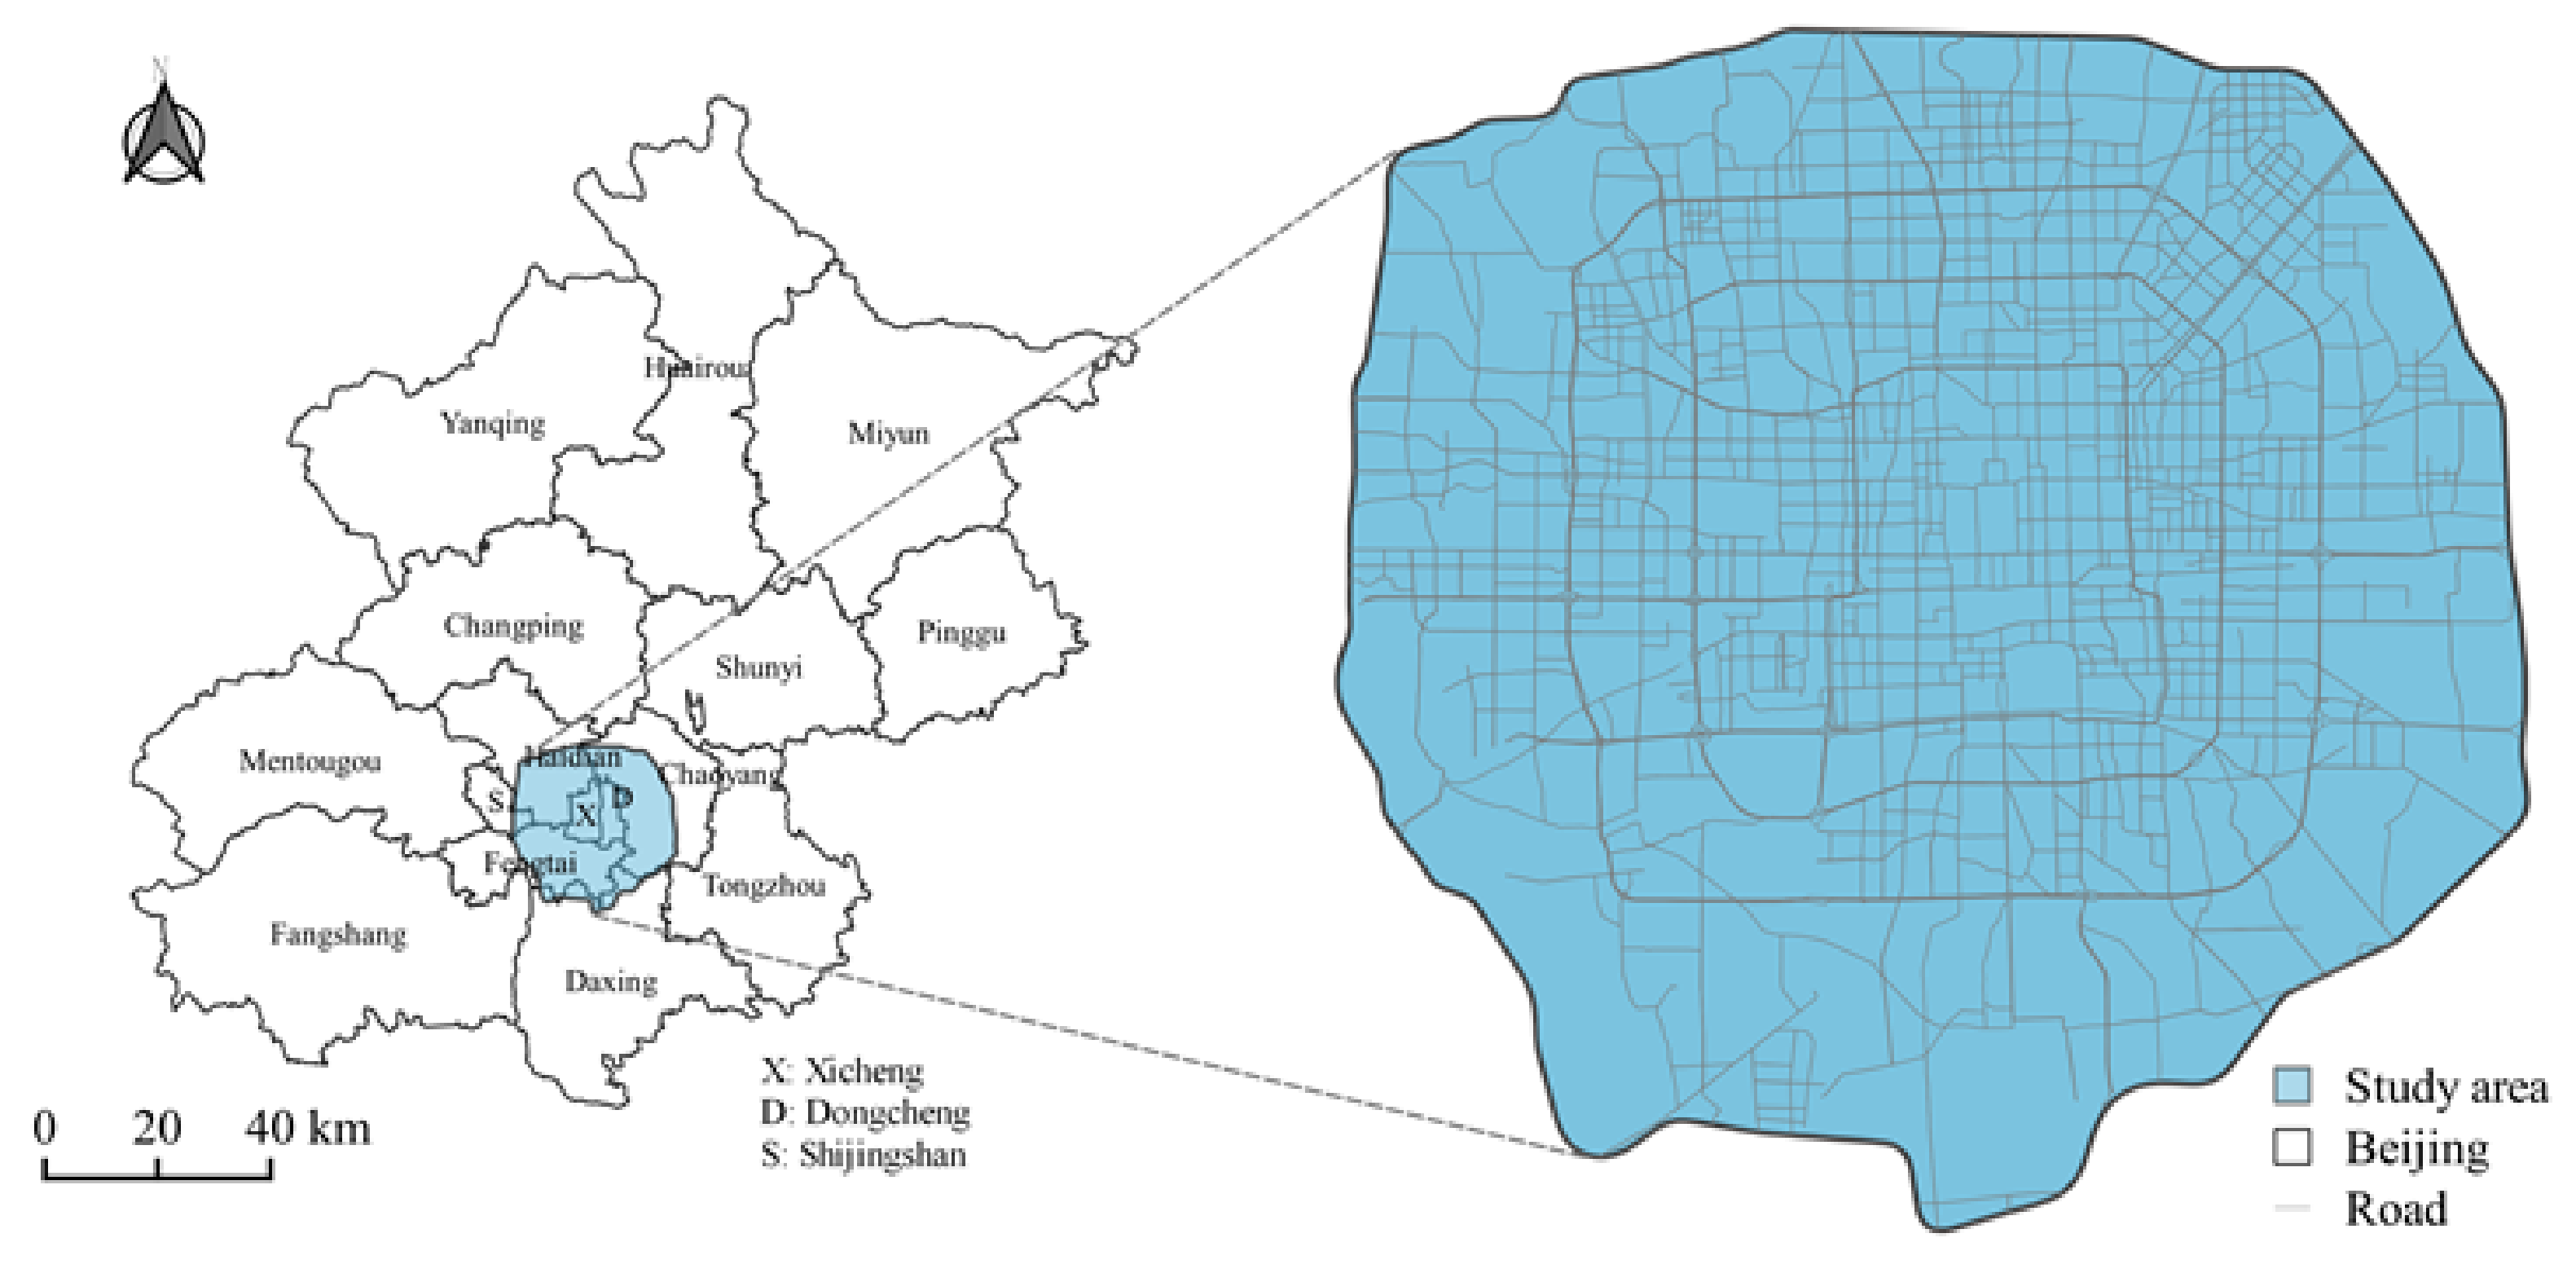
2.1. Study Area

This research focuses on a case study of Beijing, which is the capital of China and the political, cultural, and educational center. The region within the Fifth Ring Road in Beijing was selected as the research area (Figure 1). As of the end of 2020, the area within the Fifth Ring Road had a total area of approximately 668.65 km2, including six districts, and a resident population of more than 10 million. It is a suitable area with complete urban functions and includes the majority of human travel behaviors. The public transportation system in Beijing includes buses, subways, taxis, and bicycles. The report from the Fifth Comprehensive Survey on Urban Traffic in Beijing points out that public transportation caters to 48.0% of travel in its core urban area. Taxi services provide an important option for individuals’ travel accounting for about 10.0% of intra-urban travel. Traveling by taxi offers flexible routes and is more time-efficient than other modes of transportation [39,40].

2.2. Datasets

The taxi trajectory data were collected in Beijing Fifth Ring Road from 16 May (Monday) to 20 May (Friday) in 2016. The statuses of taxis are automatically sampled about every 10 s by GPS and the position accuracy is approximately 10 m. The taxicabs’ unique ID, longitude, latitude, timestamps, velocity, orientation, and whether passengers are being transported, are included in the raw taxi trajectory data. However, compared to the raw taxi trajectory, we are more concerned about the origin and destination position for each taxi trip. Hence, we aggregated the raw trajectory data with the taxi origin–destination (O–D) trip data relying on the status of passengers as pick-up and drop-off.
Meanwhile, data preprocessing is necessary. Firstly, we removed the invalid point caused by positioning errors or transfer errors. Secondly, we deleted the unreasonable trip data, which was less than 500 m or more than 100 km. Thirdly, abnormal taxi speeds of more than 120 km/h were also deleted. After cleaning, we obtained approximately 0.92 million taxi trips with the attributes shown in Table 1.
The POI data were collected from Gaode Map, a navigation company in China. The dataset contains 513,549 POIs. The properties of each POI include the ID, name, longitude, latitude, and category. Considering the taxi travel characteristics and urban functions, we reclassified the primary POIs into 10 categories, including home, work, transportation, dining, daytime recreation, nighttime recreation, tourist attraction, hotel, schooling, and medical service (Table 2).
The travel survey data records the taxi passengers’ pick-up and drop-off time, address, and trip purpose. Data from a total of 2112 individual trips in Beijing from September 2016 to January 2017 were collected and used as ground truth to reveal the effectiveness of the proposed model in this paper.

3. Method

3.1. Assumptions of the Proposed Method

To reveal the human travel patterns from the perspective of activity semantic flow, we proposed a two-layer framework. The flowchart of the proposed method is shown in Figure 2, and it can be divided into two parts. In the first layer, we used taxi O–D trip data and POI data to identify activity semantics and infer trip purposes (see Section 3.2). In the second layer, a flow clustering method is used to group similar activity semantic flow (see Section 3.3) and uncover the spatiotemporal distributions of the trips.

3.2. Activity Inference

The activity inference has four processes in total. We firstly established pick-up areas (PA) and drop-off areas (DA), respectively, and selected the candidate POIs (Section 3.2.1). Secondly, the Bayesian rules (Section 3.2.2) were used to compute the visiting probability of each candidate POI. However, the activity semantics of each trip not only depend on the single candidate POI’s visiting probability, but also rely on the geographic context and spatial co-occurrence relationships [37,41]. Therefore, based on the visiting probability ranking of each candidate POI, thirdly, we applied the improved Word2vec model to build the latent vector representation of each pick-up point and drop-off point (Section 3.2.3). Finally, we used the Affinity Propagation Clustering Algorithm [42] to cluster the similar pick-up points/drop-off points and annotate the activity semantics (Section 3.2.4).

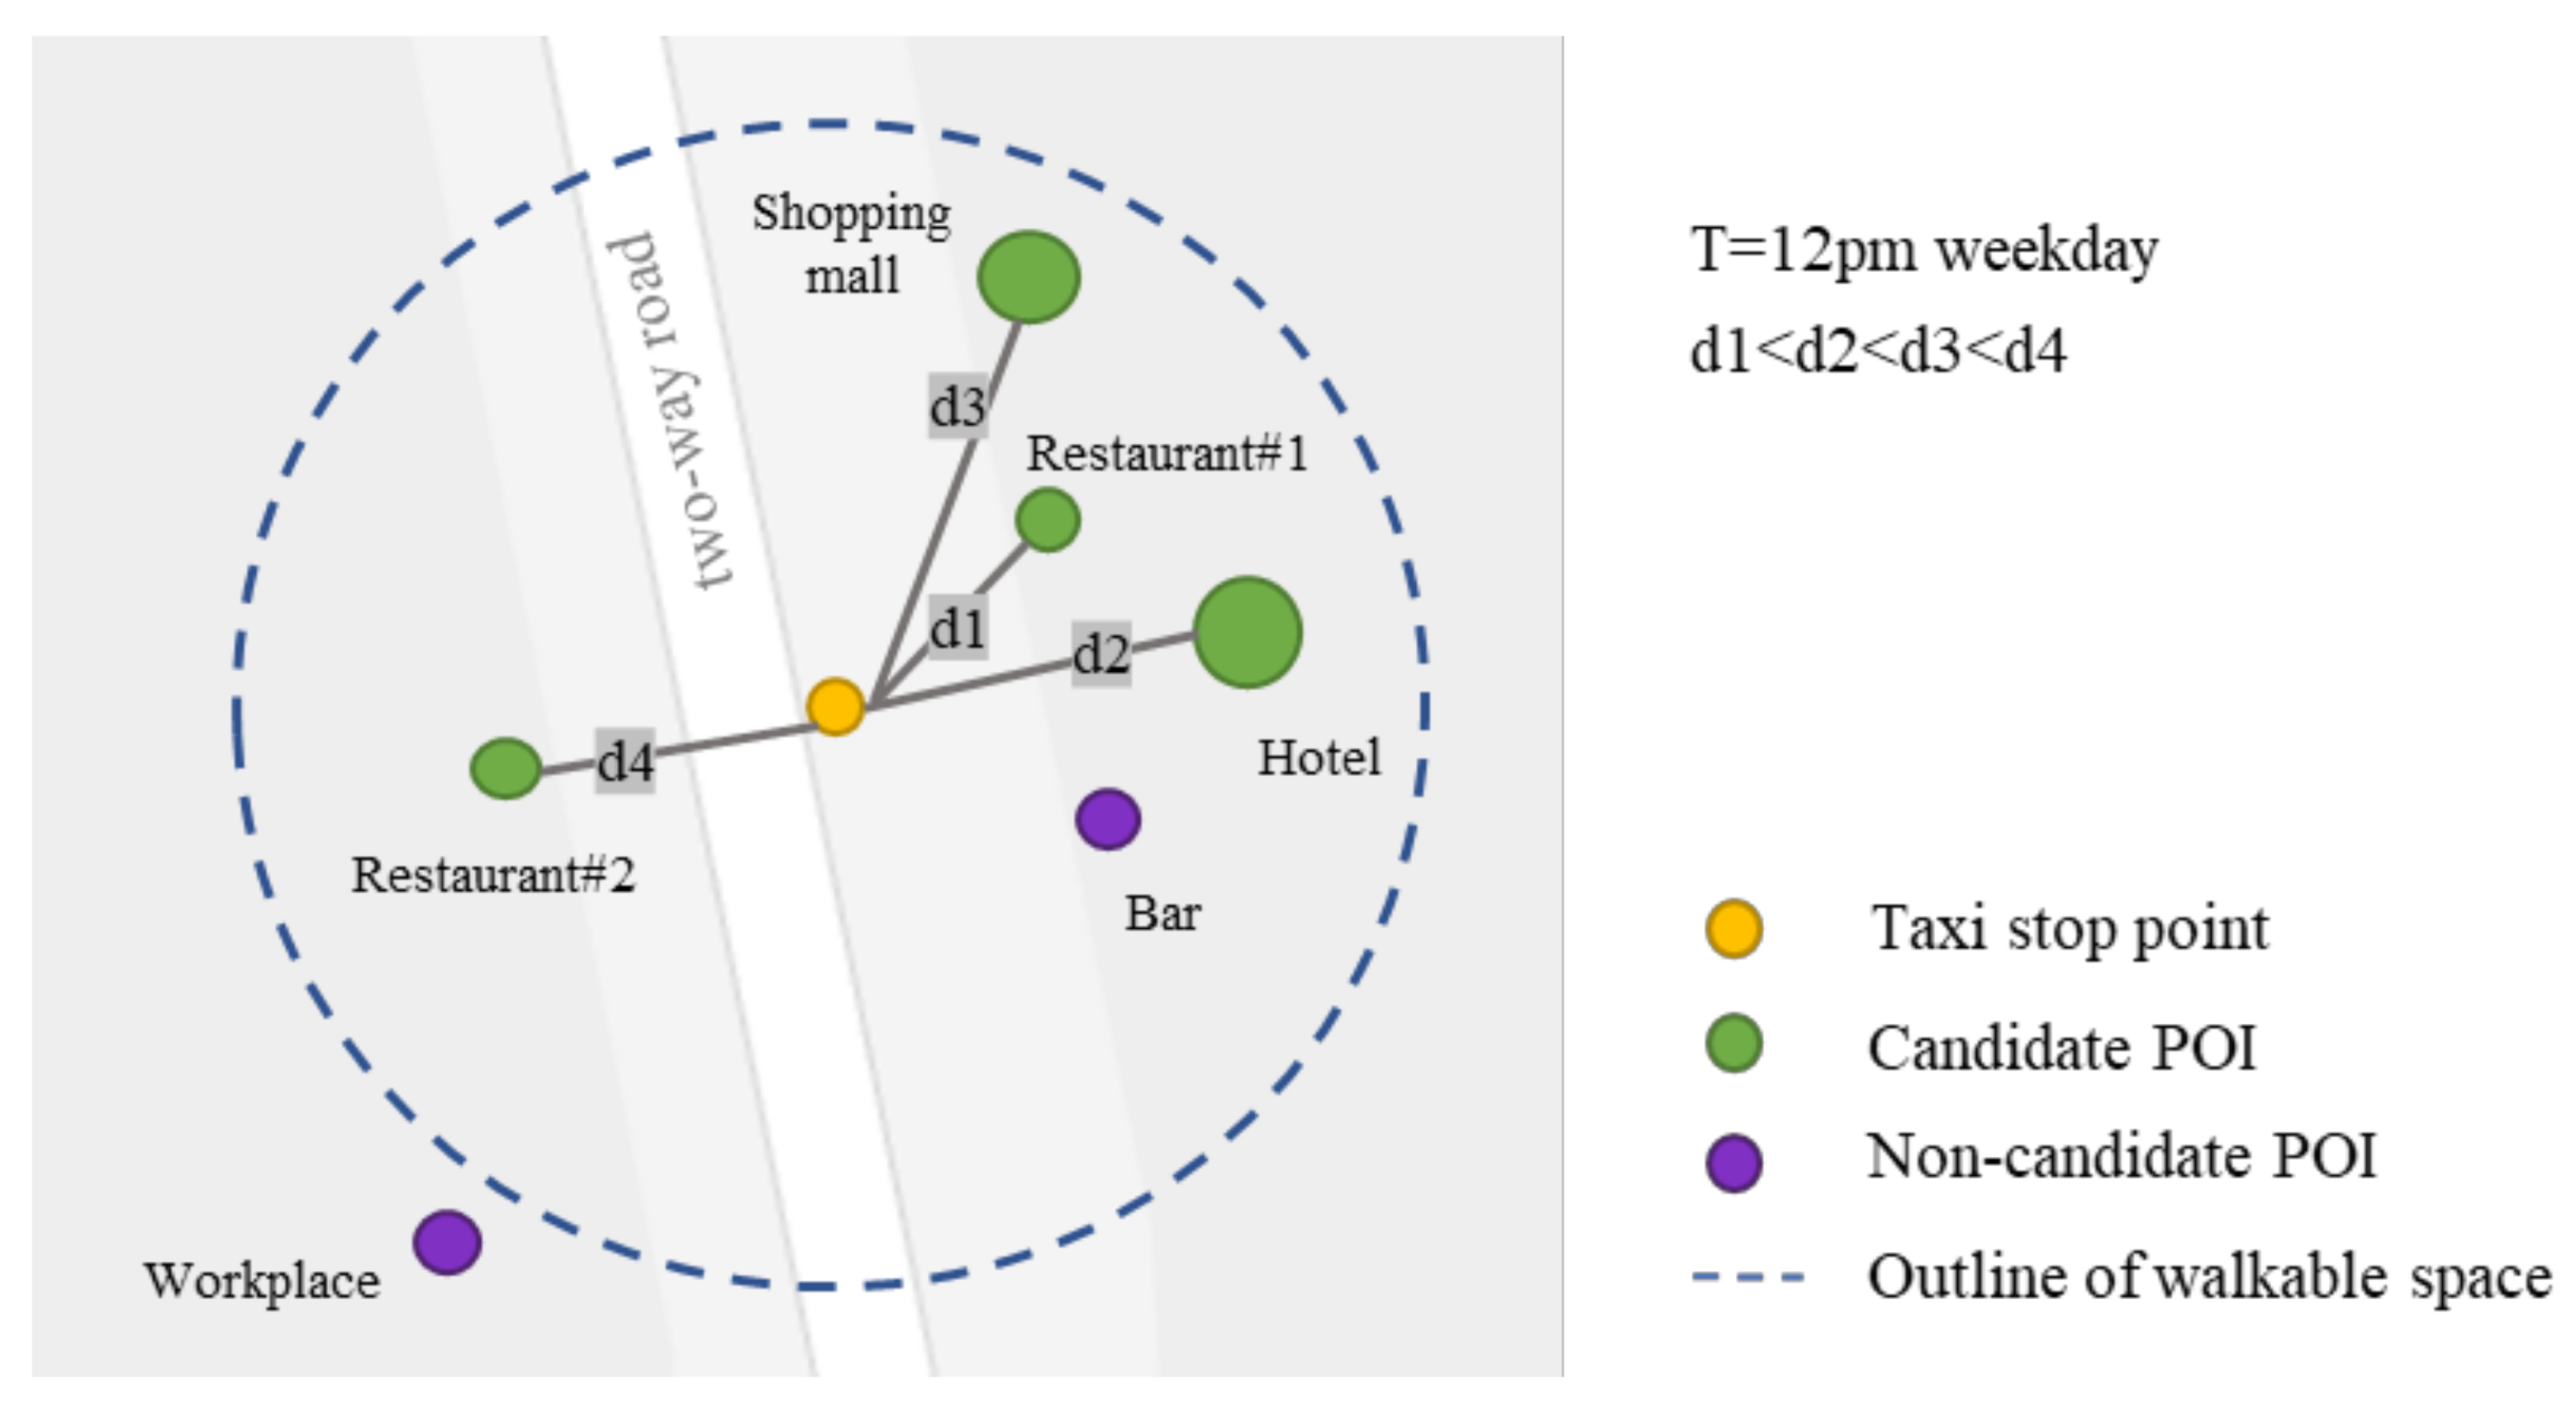
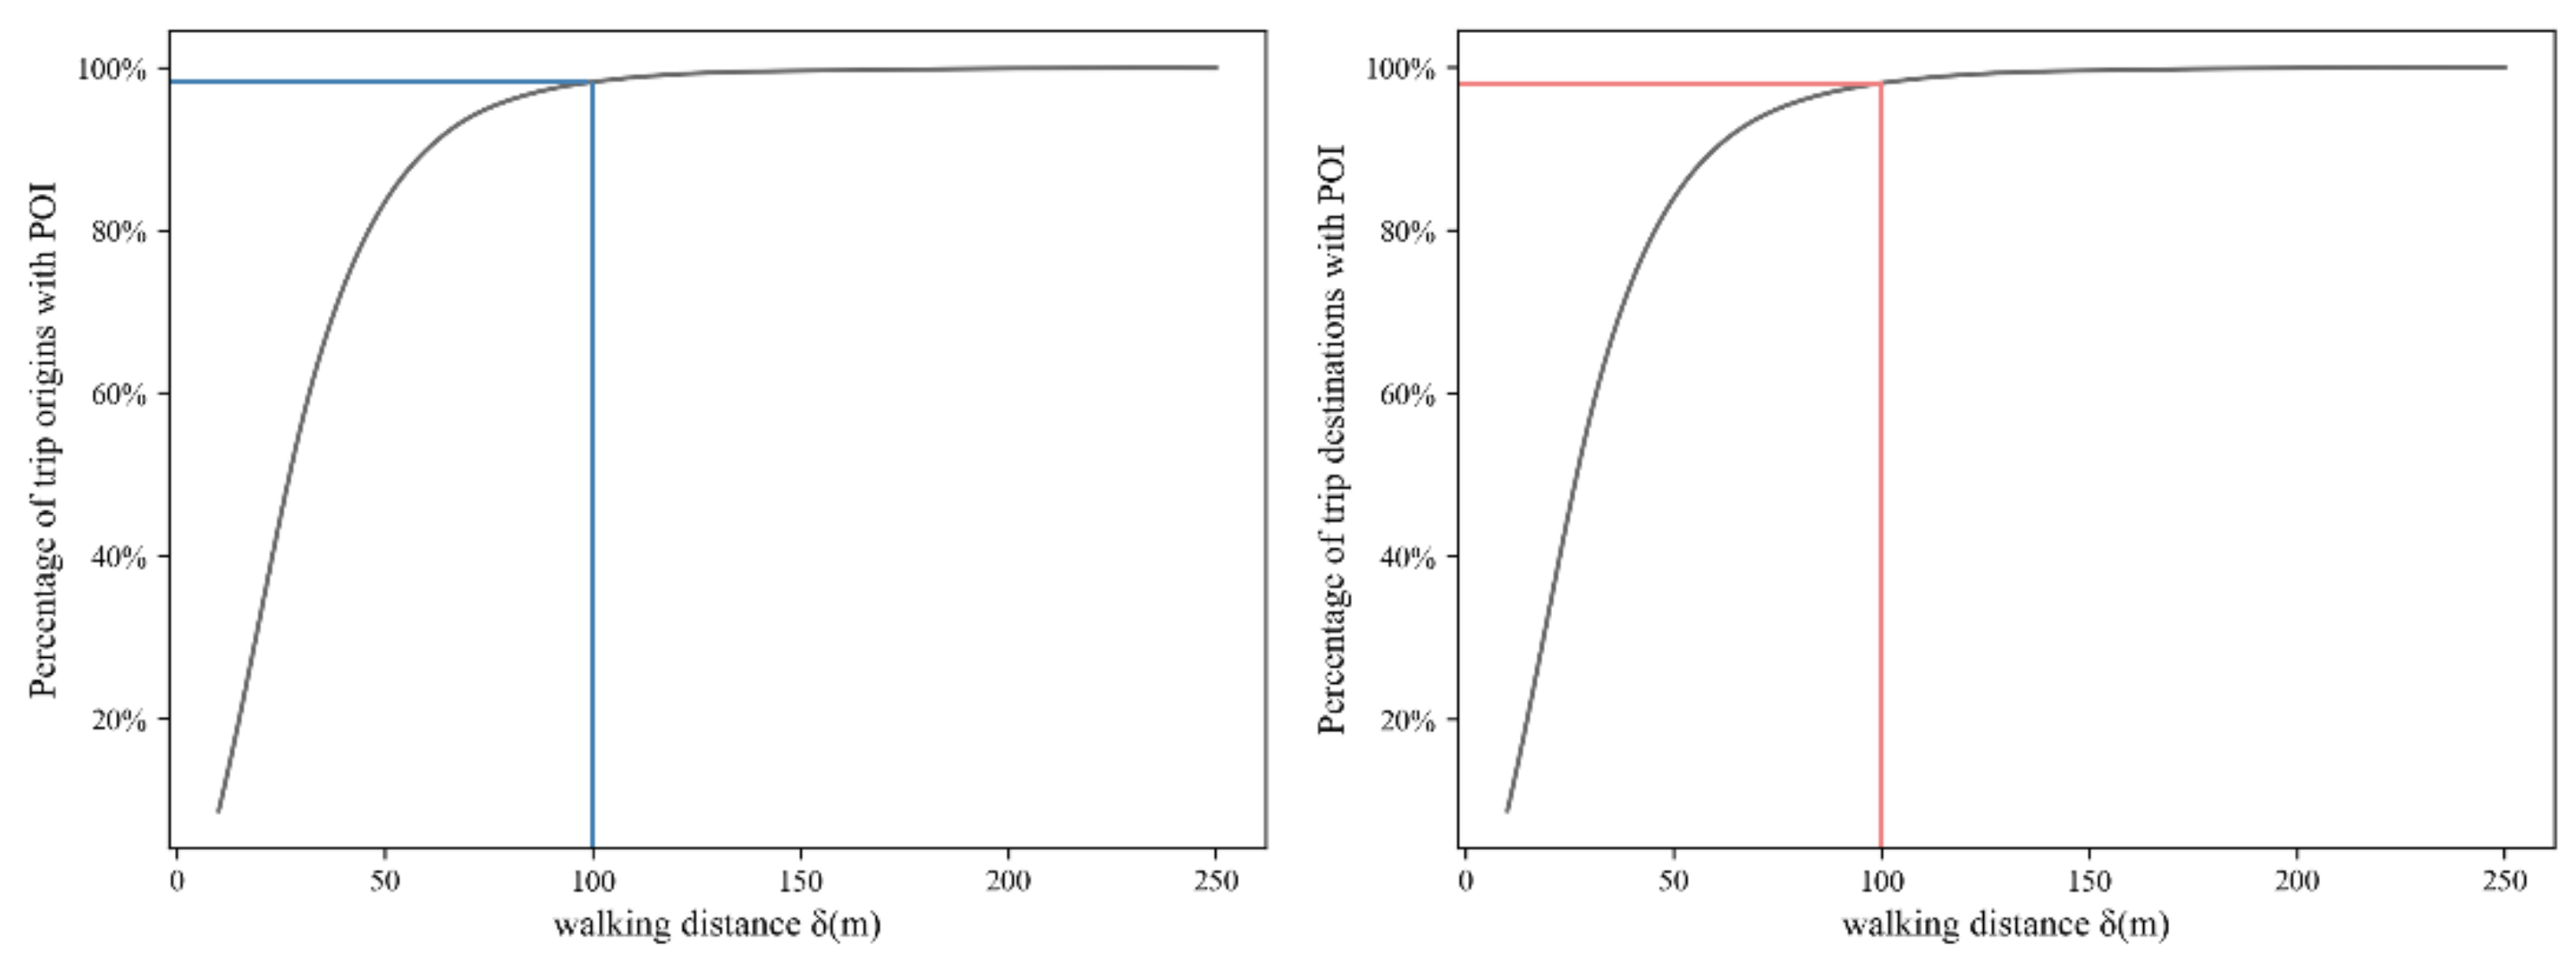
3.2.1. Pick-Up/Drop-Off Area

The taxi trajectory data contain the pick-up point and drop-off point. However, the recorded location is not the actual activity location. Thus, we cannot use these points as the origin or destination directly. For example, when users go from home to scenic spots, they must walk to the roadside to take a taxi, and then they must leave the taxi in the parking area and walk to the actual destination. Although people tend to take a taxi nearby, and drivers always drop off passengers as close to their destination as possible, the exact origin or destination is uncertain. Due to the presence of several candidate points distributed around the pick-up or drop-off location, therefore, the pick-up area (PA) and drop-off area (DA) were defined to select “candidate POIs”. In this study, we take the real road situation into consideration, allowing all points in the PA or DA within a real-time walking distance threshold   δ . The real-time walking distance was obtained using the Gaode Maps Application Programming Interface (API). As shown in Figure 3, since the existence of two-way roads, the POIs on the same side have a higher visiting probability than those on the opposite side. The percentage of pick-up points and drop-off points that could find at least one candidate POI with a δ ranging from 5 m to 250 m are shown in Figure 4. The curve remains stable when the maximum walking distance threshold δ reached approximately 100 m. Therefore, we set the maximum walking distance threshold as 100 m for both the pick-up points and drop-off points, to define the PA and DA in this study.

3.2.2. Bayesian Rules-Based Visiting Probability

The Bayesian rules were widely employed to compute the visiting probability of candidate POIs [2,3,30]. In this study, the visiting probability function to each candidate POI P i (i = 1, 2, 3, ……, n) is represented as follows:
P r P i | x , y , t = P r x , y | P i , t P r P i | t P r t P r x , y , t
where P r P i | x , y , t denotes the probability that a taxi passenger visited or will visit P i if the passenger is picked up or dropped off at the location x , y   at time t . P r x , y | P i , t denotes the probability that a person gets in or out of the taxi at the location x , y if he/she has visited or decided to visit P i at time t . P r P i | t is the probability of visiting P i at time t. P r t is the visiting probability at time t . P r x , y , t is the probability that a taxi passenger gets in or out of the taxi at the location x , y   at time t . The location and the time of pick-up or drop-off are conditionally independent, given the candidate POI P i and the distance between the pick-up or drop-off point and the candidate POI P i exhibiting the distance decay effect. Hence, the probability function becomes [2]:
P r P i | x , y , t = A i d x , y , P i β P r P i | t j = 1 n A j d x , y , P j β P r P j | t  
where A i is the attractiveness of the candidate POI P i . The parameter d is the real-time walking distance from the pick-up or drop-off location x , y to the candidate POI P i and β is the distance decay parameter. P r P i | t is the probability of visiting P i at time t. Compared to Gong’s method [2] that set the A i range from 1 to 4 manually, according to the experts’ advice, we use the Term Frequency-Inverse Document Frequency (TF-IDF) method [43,44] to reflect the attractiveness. In this study, we adopt β = 1.5 which is consistent with the existing literature [3,45,46]. Additionally, P r P i | t is affected by activity dynamics. For example, the probability of visiting a restaurant from 11:00 to 13:00 is higher than the probability of visiting workplaces at that time on weekdays. Likewise, the probability of visiting workplaces is higher than the probability of going to a restaurant from 8:00 to 10:00 on weekdays. Hence, social media check-in data are used here to reflect the vitality of different types of candidate POIs. Finally, P r P i | x , y , t ranges from 0 to 1, and the visiting probability of all the candidate POIs equal to 1 in the sum. In Figure 3 we present a schematic diagram of Bayesian rules-based activity inference. The non-candidate POIs (marked in purple) that are outside the walkable space or closed will not be considered. For the candidate POIs (marked in green), the circle sizes represent their attractiveness. If only considering the distance factor, restaurant #1 is the nearest candidate POI. If only considering the time factor, restaurant #1 and restaurant #2 are the places a person most likely goes to since it is lunch time on a weekday. If only considering the attractiveness of the POIs, the visiting probability of the hotel is higher than the others. However, considering the comprehensive factors including distance, time, and the attractiveness of the POIs, the ranking of the candidate POIs would be restaurant #1, hotel, shopping mall, restaurant #2.

3.2.3. Word2vec Model

Word-embeddings have become increasingly popular in Natural Language Processing (NLP) and are in fact, a special type of distributed word representation that are constructed by leveraging neural networks, mainly popularized after 2013, with the introduction of the Word2vec model [35]. The Word2vec model is usually framed as an unsupervised method, in that it does not require any manual annotation of the training data. The Word2vec model can represent words to dense and low-dimensional vector spaces, based on context relationships in documents, and similar context words are mapped to nearby points. Therefore, the distance between two word vectors can be used to measure their semantic similarity (e.g., “boat”–“ship”) [47]. Word2vec comes in two model architectures, the Continuous Bags-of-Words model (CBOW) and the Skip-Gram model. The CBOW model predicts the target words using its surrounding context words, whereas the Skip-Gram model aims to predict the surrounding context words given the target words.
As shown in Figure 3, the trip’s activity semantic should be inferred as “Dining” based on the maximum visiting probability of Bayesian rules. However, geographic context is ignored here. Few studies have investigated the latent co-occurrence relationships among different candidate POIs and how they spatially interact with each other to support the trip activity. For example, “Hotel Accommodation” activity is the spatial co-occurrence among “hotel”, “restaurant”, and “bar”, etc. Railway station contains a large number of restaurants, and the spatial co-occurrence among these POI types reflects Transportation activity. The advantage of the Word2vec model is in capturing this spatial context and co-occurrence relationships.
In this paper, we build analogous relationships between the PA/DA and documents. A textual document is composed of words, whereas a PA/DA is composed of the pick-up point/drop-off point and the candidate POIs. Therefore, in an analogy with the Word2vec model’s use of textual materials, we take the PA/DA as a document, the internal “taxi stop point” (pick-up point or drop-off point) as target words, and the internal “candidate POI” as context words. The hypothesis behind this states that: “taxi stop point” appears in the same contexts and shares the same activity semantic meaning. Therefore, we selected the CBOW model; the details of this method are described in [35].
Since the structure of geographic space differs substantially from the natural language, we further incorporate Bayesian visiting probability-based ranking instead of Euclidean distance, to build a sequence of each pick-up point and drop-off point. The advantage of using Bayesian visiting probability-based ranking is that we emphasize the activity dynamics. Compared to using distance-based ranking, the sequence of surrounding “candidate POIs” (context words) to “taxi stop point” (target words) differs during one day. Take the schematic diagram in Figure 3 as an example. When using probability-based ranking, “Hotel” is the closest context word to “taxi stop point” at midnight, and “Restaurant” is the closest context word to “taxi stop point” at noon. In contrast, when using distance-based ranking, “Restaurant” is always the closest context word to “taxi stop point” within a day. This means that by only considering the distance-based ranking, the sequence of “taxi stop points” will be the same within a day and cannot represent the activity dynamics. During the process of building the improved Word2vec model, we set the dimension of the word vectors to 200, the window size to 5, the number of iterations equal to 20, and the other parameters set to the recommended values.
After training the model, the cosine distance of “taxi stop point” vectors are calculated to indicate the similarity and higher similarity values, indicating stronger activity semantic similarity.

3.2.4. Activity Semantic Annotation

Based on the similarity obtained from the improved Word2vec model, we use the Affinity Propagation Algorithm to cluster the similar trips into the same group and then annotate activity semantics for each trip in three steps: (1) annotating each pick-up point with an activity; (2) annotating each drop-off point with an activity; (3) linking the O–D activity type to enrich the activity semantic of the trip. To annotate the activity semantic, we considered the following aspects [48]:
(1)
Internal density (ID). I D i j = N i j / N j .
(2)
External density (ED). E D i j = N i j / N i .
(3)
Temporal Distribution of different activities.
where N i j is the number of i t h POIs in j t h   activity, N i is the number of i t h POIs, and N j is the number of POIs in j t h activity.

3.3. Flow Clustering

The taxi O–D trip is a directed flow from the origin to the destination, which can reveal the travel patterns. In this paper, a taxi O–D flow is treated as a geometric object rather than as a separated pick-up point and drop-off point. In contrast to the traditional local space, these O–D flows form a flow space [49,50], and emphasize the spatial interactions of elements. Michael Batty argues that to understand space, we must understand flows [51]. Therefore, we explore spatial and temporal human travel patterns from the perspective of flow.
After the activity semantic annotation, we can obtain the taxi activity semantic flows. Each activity semantic flow can be expressed as f i = o x i , o y i , o a i , d x i , d y i , d a i , o d a i , where o x i , o y i and d x i , d y i are the spatial coordinates of the pick-up point and the drop-off point, respectively, and o a i and d a i are the origin and the destination activity semantics, respectively. o d a i is the activity semantic of f i .
In this paper, we proposed a flow clustering method based on the constraints of the O–D points’ location and activity semantic. Three principles should be considered to measure the spatial and semantic similarity between activity semantic flows:
(1)
Flows have the same activity semantic.
(2)
Flows are in spatial proximity to each other.
(3)
Flow lengths and directions are approximately equal.
Figure 5 shows six flows. Only f 1 and f 2 satisfy all the principles and are similar.
In our approach, a two-step strategy is adopted in which spatial flow clustering is conducted after activity inference. For spatial flow clustering, the key issue is the spatial similarity measurement between the flows. We use the following equation to calculate the spatial dissimilarity S D i j between f i and f j .
S D i j = s d i j o 2 + s d i j d 2
where,
s d i j o = d i s t O i , O j α × m i n l e n i , l e n j s d i j d = d i s t D i , D j α × m i n l e n i , l e n j
In the equations, s d i j o and s d i j d represent the origin spatial dissimilarity between f i and f j and the destination spatial dissimilarity between f i and f j , respectively. d i s t ( ) represents the Euclidean distance between the points. l e n i and l e n j returns the length of flow f i and f j , respectively. α is a size coefficient and the product of α and the shorter length equals the radius of the boundary circle. We select α = 0.3 which is consistent with the existing work [52,53]. The smaller S D i j is, the more similar the flows are. Subsequently, an agglomerative clustering framework is used to implement flow clustering, which merges activity semantic and spatially similar flows to form a hierarchy of flow clusters. The flow clustering process is shown in Algorithm 1. For more detailed parameter settings, please refer to [52].
Algorithm 1 Spatial Clustering of Activity Semantic Flow
Input: f = f i 1 i n —a set of activity flows; and
     α —the size coefficient.
Output: A set of spatial and activity flow clusters FC = F C i 1 i m .
Steps:
 1. Build kd-tree based on the midpoint of flow.
 2. Make each flow a unique cluster to initialize the original
flow clusters: FC = F C i and F C i = f i , 1 i n .
 3. For each flow f i , find its k i flows: k i is calculated by the midpoint-distance between f i and its flow. Midpoint-distances are within the range of 2 α l e n i . Generate k i   flow pairs f i ,   f j , where 1 j     k i .
 4. For each flow pair f i , f j ,
  4.1 Find the clusters F C i and F C j that f i and f j belong to.
  4.2 If F C i and F C j are different clusters,
   4.2.1 Compare the activity semantic,
   4.2.2 If F C i and F C j   have same activity semantic
    4.2.2.1 Calculate S D i j between F C i and F C j .
    4.2.2.2 If S D i j 1 , merge the two clusters: F C i F C i F C j and F C F C F C j .

4. Results

4.1. Activity Semantic Annotation Results

As mentioned in Section 3.2.4, the taxi trip origins and destinations are divided into six typical clusters and four typical clusters, respectively. Partial results for ID and ED are presented in Table 3 and temporal distribution is illustrated in Figure 6. Based on these results, we annotated each origin or destination with activity semantics as follows:
O1 and D1: Home-related. For O1: although “Dining” is the most characteristic POI category with this origin, “Home” has the highest ED. From Figure 6, we can see that O1 reaches the highest point between 6:00 a.m. and 8:00 a.m. In addition, “Dining” and “Schooling” are auxiliary POIs for residential areas. For D1: “Home” is most associated with D1 (ED is 99.1%), and the proportion of people arriving at D1 peaks occur at night. Thus, we annotated O1 and D1 as Home-related.
O2 and D2: Work-related. For O2: the most characteristic POI category is “Work”, which also has the highest ED. For D2: “Dining” and “Work” are regarded as workplaces. As shown in Figure 6, O2 peaked the highest in the evening, whereas D2 peaked the highest in the morning. Thus, we annotated O2 and D2 as Work-related.
O3 and D3: Transportation. “Dining” and “Transportation” are usually spatial co-occurrences, such as railway stations and airports. “Transportation” ED is 52.1% and 83.5% in origin and destination, respectively. Both O3 and D3 have slightly higher vitality in the daytime. Thus, we annotated O3 and D3 as Transportation.
O4 and D4: Recreation-related. In both ID and ED, “Dining” makes up the highest proportion of the POIs. In O4: the following two POI types are Nighttime and Daytime recreation, similarly, followed by “Hotel” and “Daytime Recreation” in D4. It is worth noting that the ED remained stable among these POIs. Thus, we use “Recreation” to aggregate these POIs.
O5: Hotel-Related. The most popular POI category in O5 is “Dining” but it is an auxiliary POI for “Hotel”. In addition, “Hotel” has the highest ED. Thus, we annotated O5 as Hotel-related.
O6: Medical-related. “Medical Service” is the significant POI type in O6. Meanwhile, the “Medical Service” associated with restaurants and hotels, is generally for arriving patients. Thus, we annotated O6 as Medical-related.

4.2. Comparisons of Inferred Activity Semantics from the Three Methods

We take the method proposed by Gong [2] and Yao [34] as Method I and Method II, respectively, to conduct the comparative experiments. In this study, a total of 2112 individual travel activity survey data, related to taxi travel in Beijing from September 2016 to January 2017, were collected and used as ground truth to reveal the effectiveness of our proposed method (Method III). We computed the proportions of activities generated by the mentioned three methods in Table 4. As can be seen from Table 4, the results of Method III match the travel survey data well. The proportion of Recreation activities in Method I and Method II are much greater than that from the travel survey. And the Transportation activities in Method I and Method II are much lower than those from the survey data, which account for 3.50% and 2.27%, respectively. We speculate that this is caused by the quality of the POI dataset. In Method I, the attractiveness of POIs is set manually, and POIs are specified to the same weight during the construction of the vector in Method II. The sequence of POIs in Method III considers dynamic changes during the construction of vectors. When using the travel survey data as a reference, we find that the performance of Method III exceeds that of the other two methods. Thus, the validated results reveal that Method III is effective for activity inference.

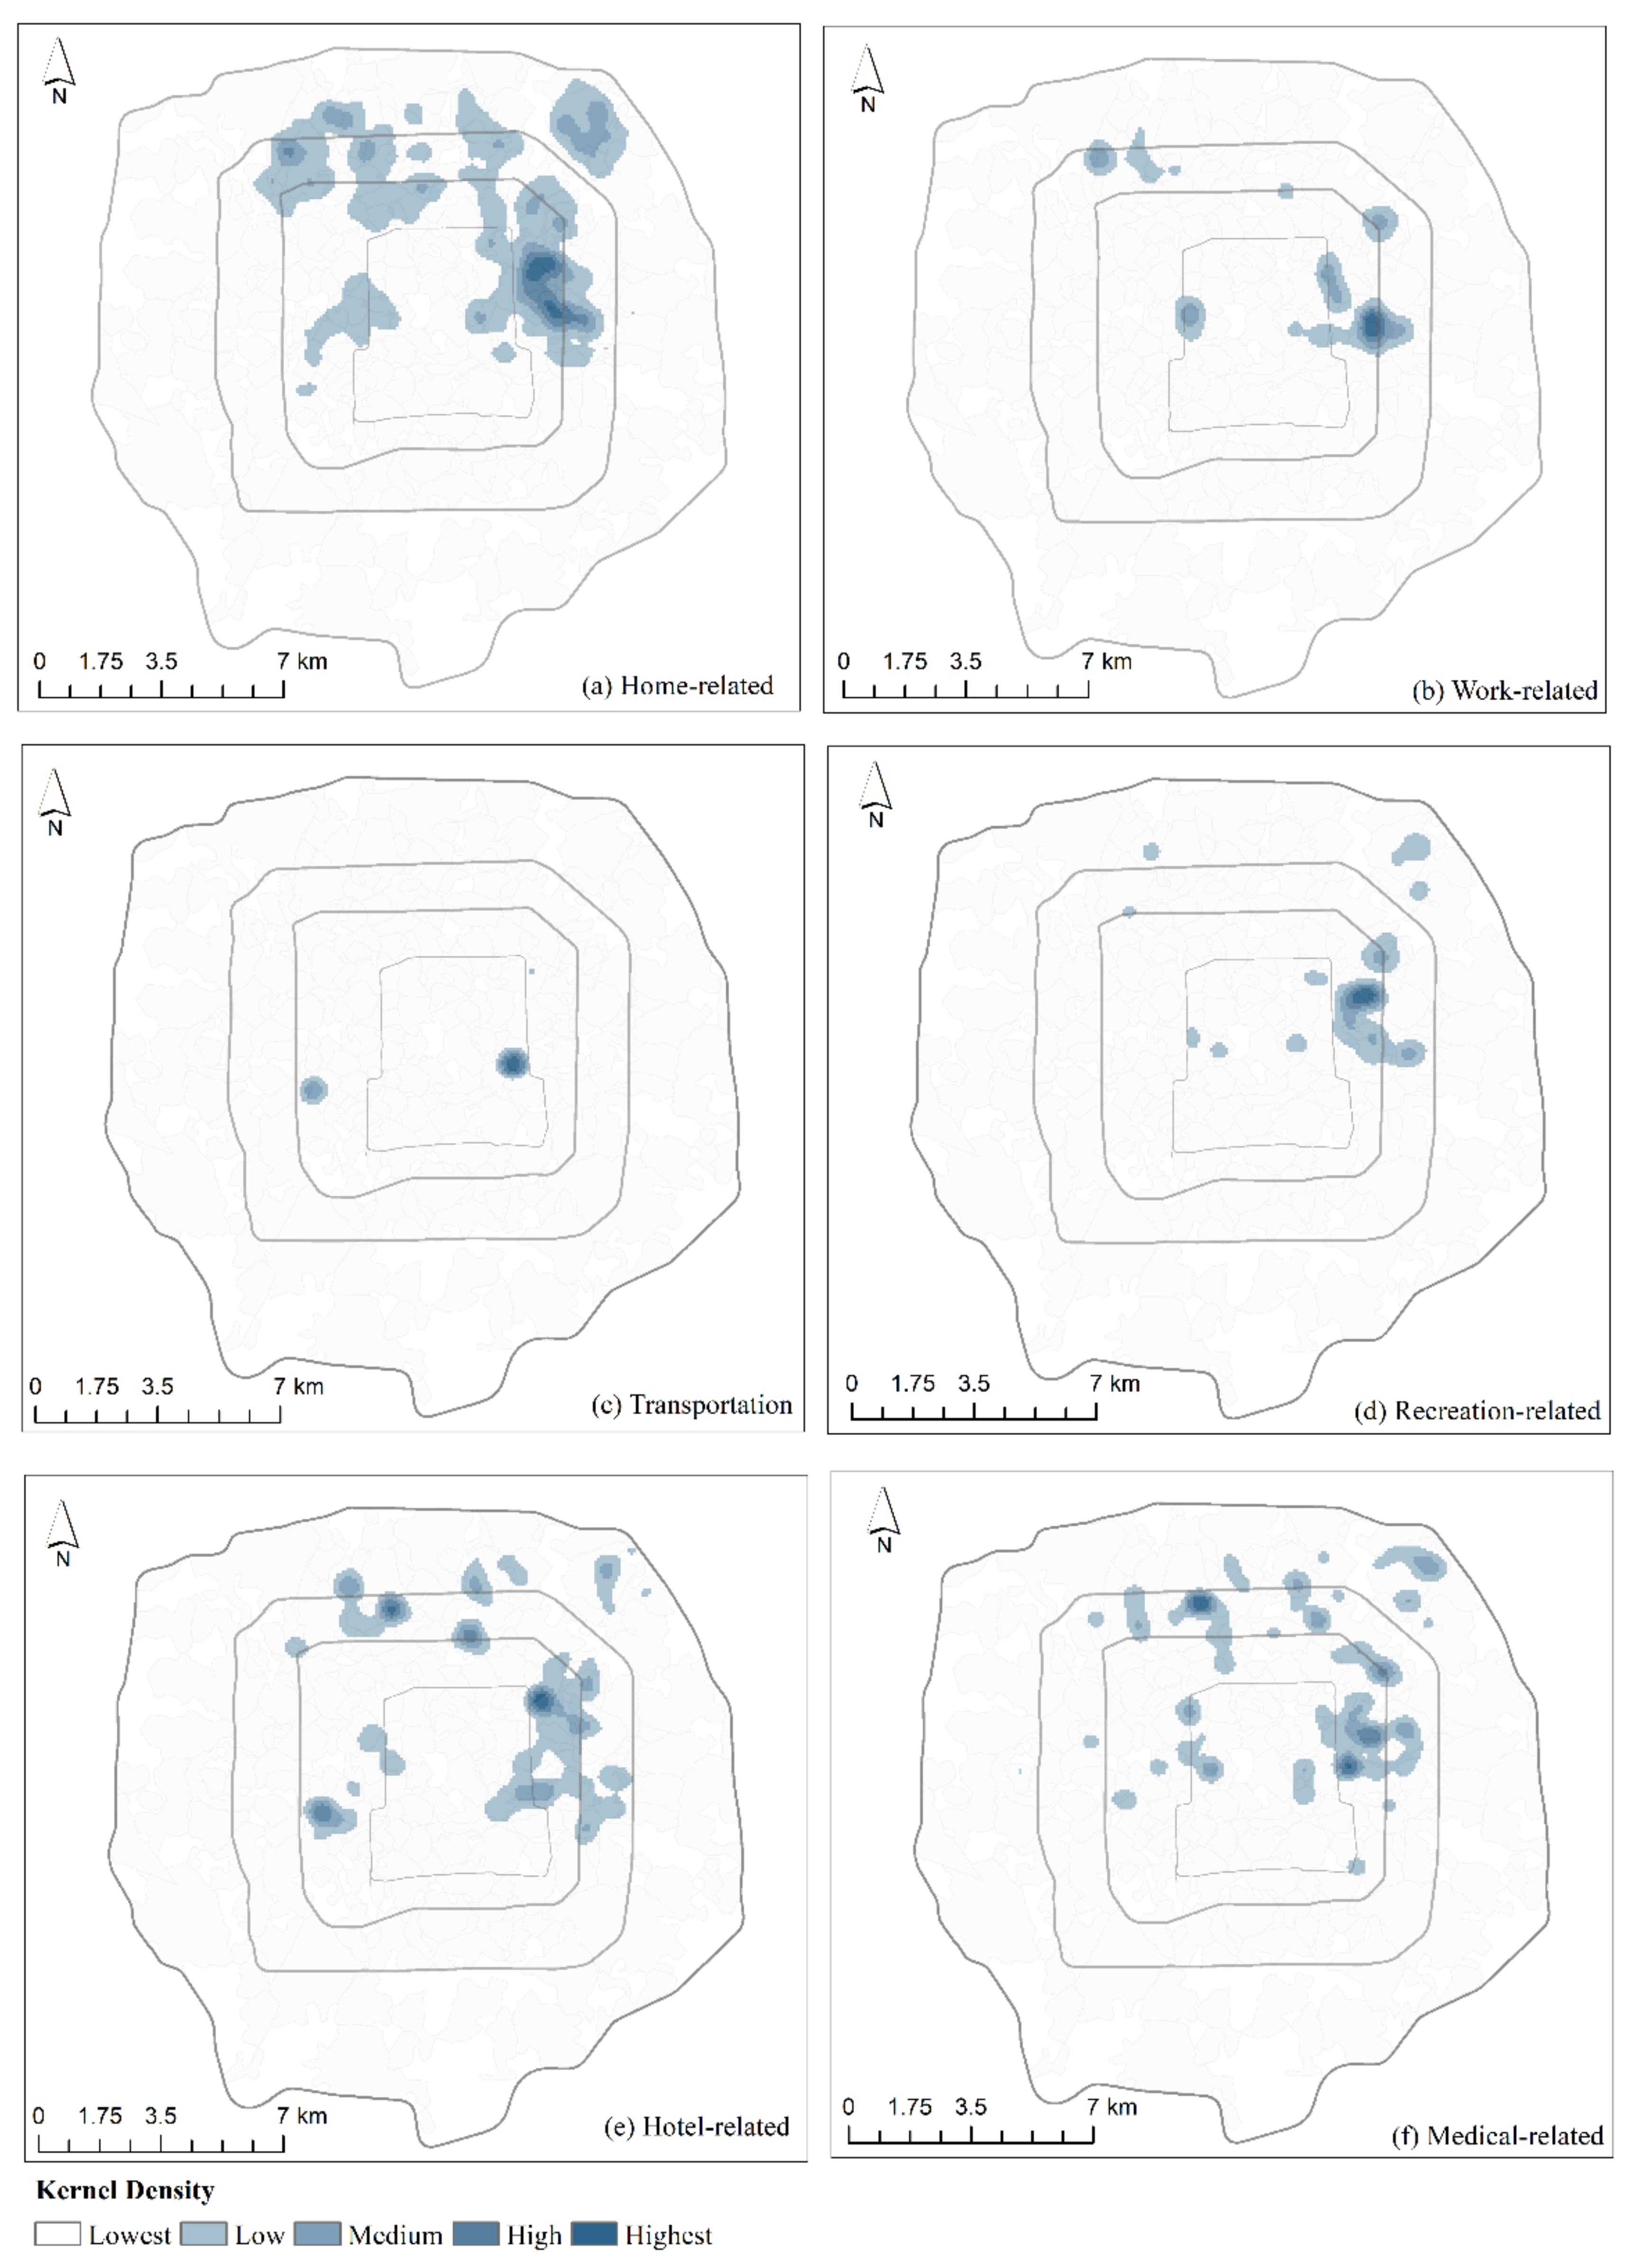
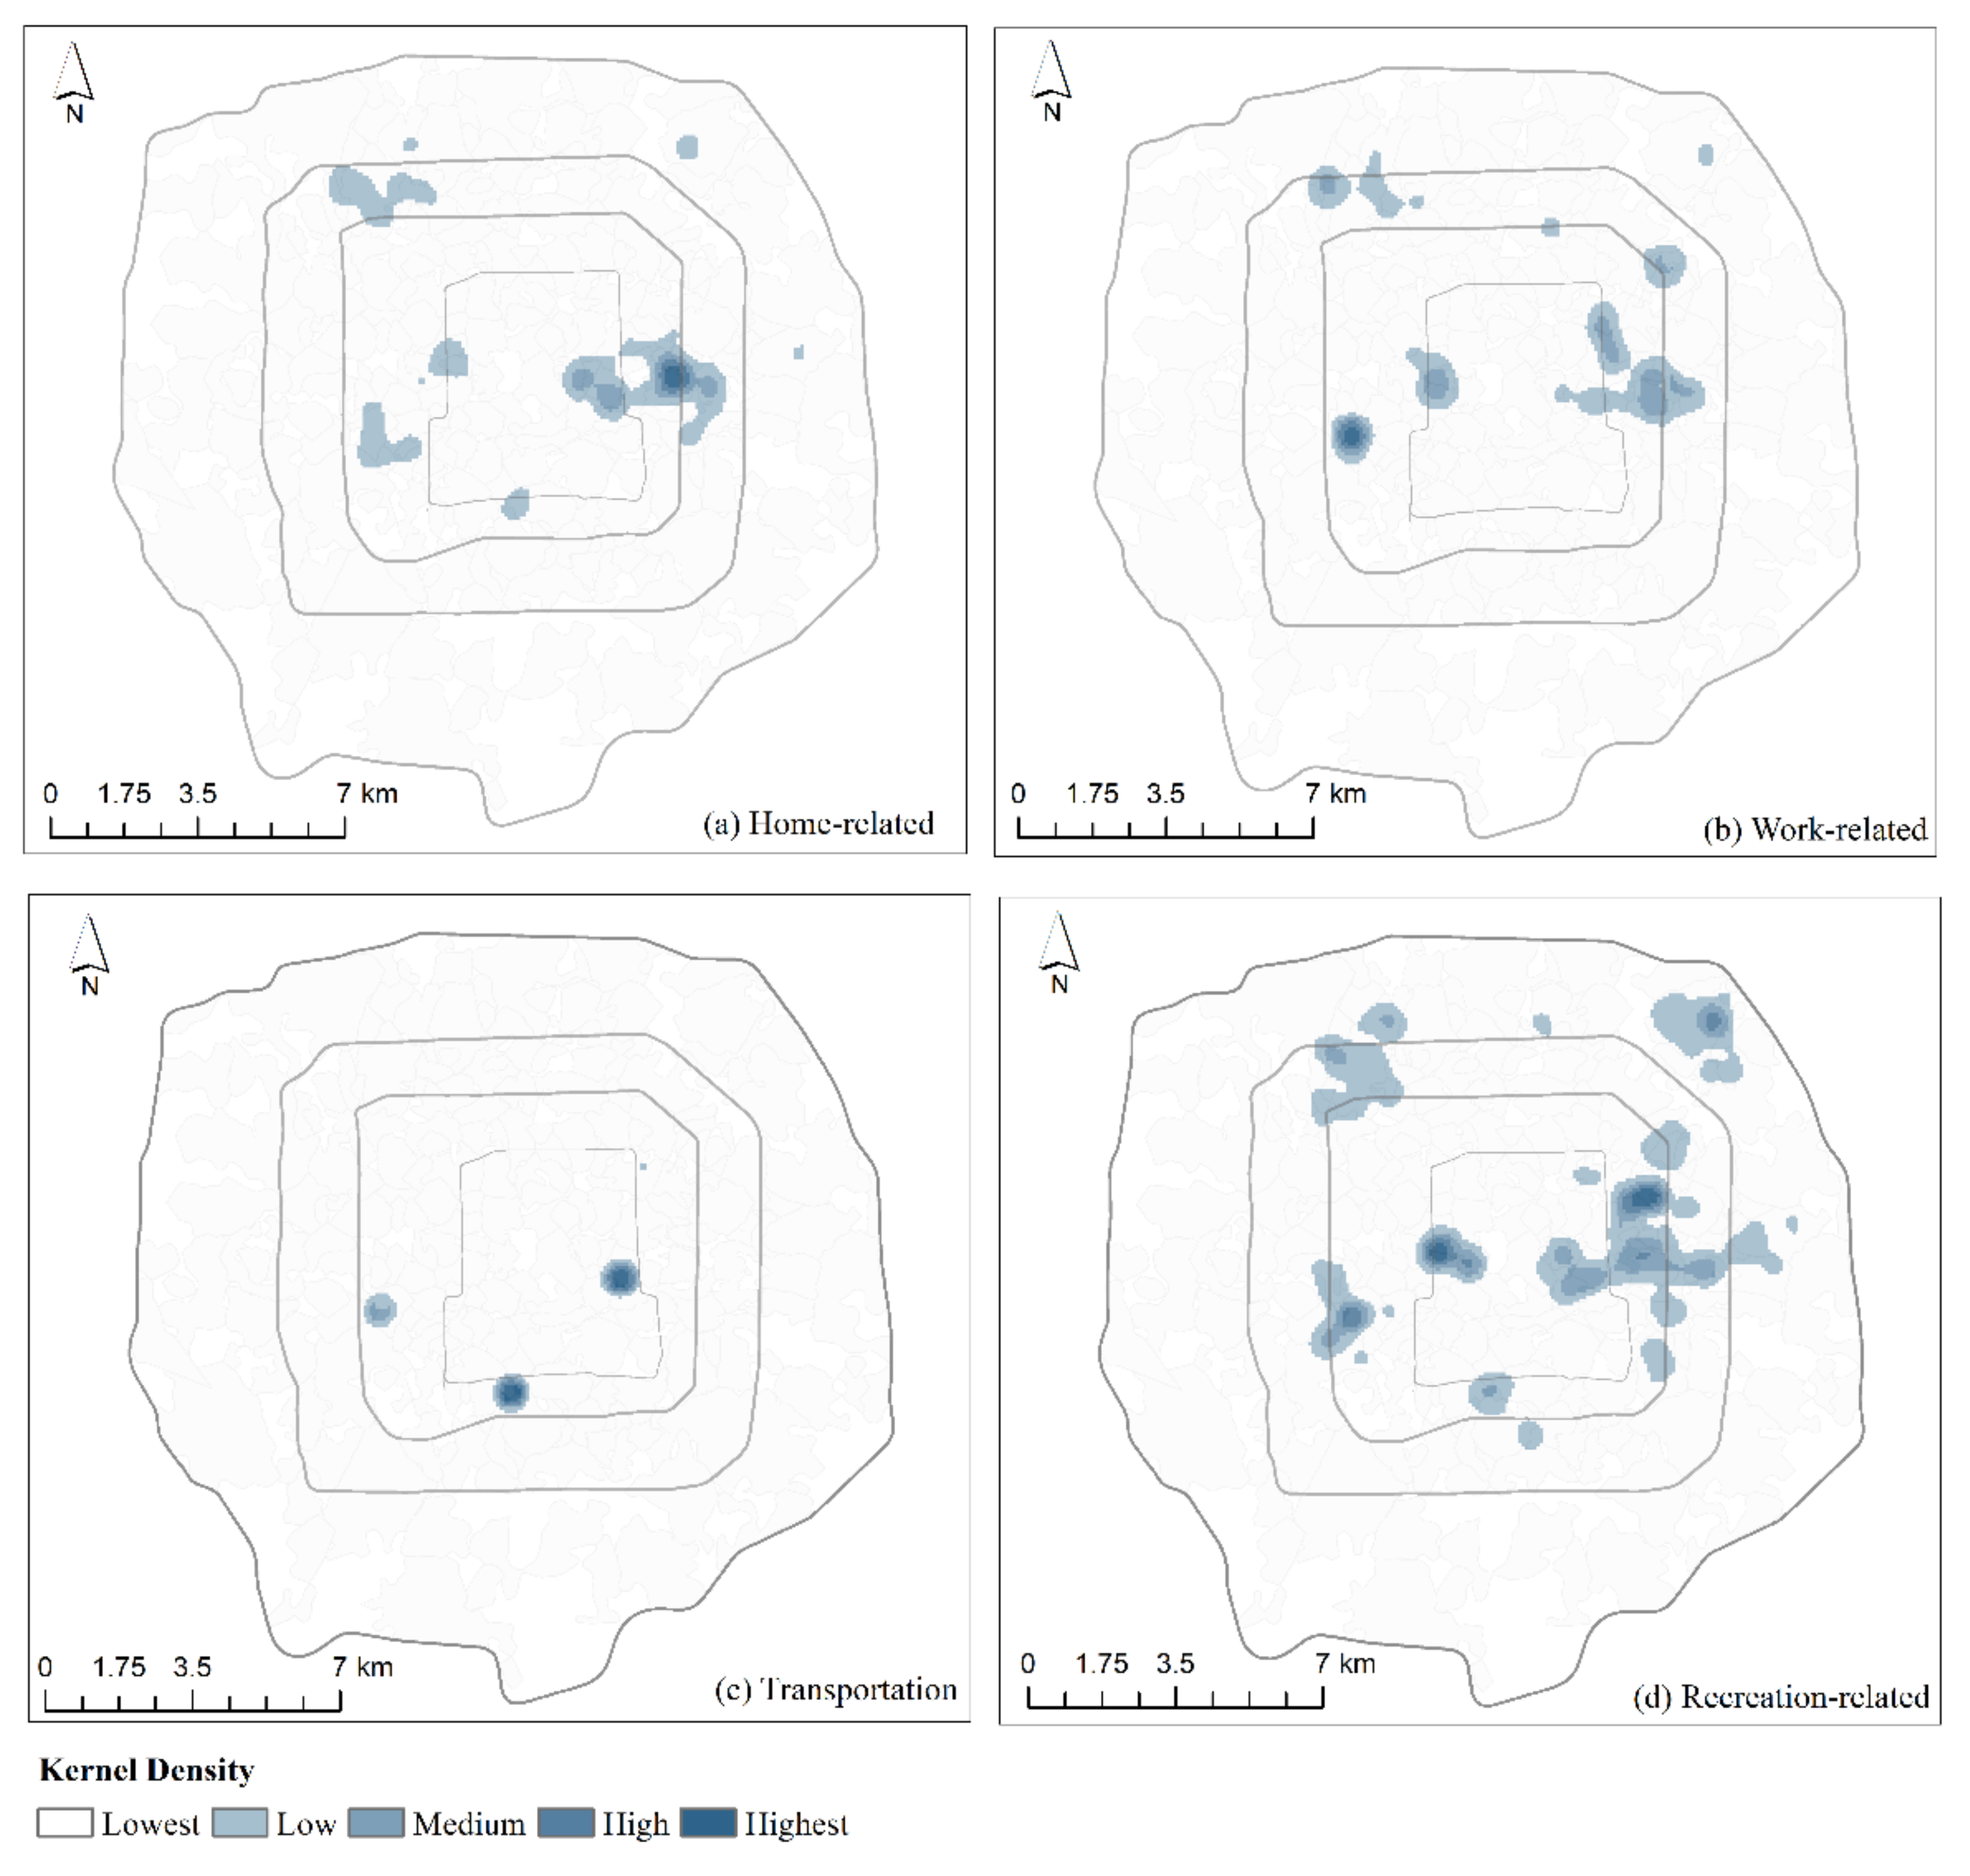
4.3. Spatial Distribution of Different Travel Activities

We map the hotspots of different activities using the kernel density estimation (KDE) method. Figure 7 represents the spatial density distribution of each identified activity of origin. Figure 7a,e, show that the areas of Home-related and Hotel-related activities, which are related to daily accommodation, are more widely distributed. Specifically, Home-related activities are concentrated in the major residential areas, such as Tuanjiehu, Dawanglu, Wangjing, Suzhoujie, and Yuetan. In contrast, Hotel-related activity is mainly distributed close to transportation hubs (Dongzhimen, Beijing West Railway Station and Beijing Railway Station), hospitals (Peking University Third Hospital and Anzhen Hospital) and work and business areas (Xidan, Dongdan and Wudaokou). Work-related activity (Figure 7b) is mainly located in CBD (Central Business District), Financial Street, Zhongguancun, and Liangmaqiao. High-tech enterprises and scientific research institutes are mostly concentrated in Zhongguancun, while Liangmaqiao includes the embassy district. The spatial pattern of Recreation-related activity (Figure 7d) is partly similar to that of Work-related activity; except for some commercial places, it is mainly distributed around Sanlitun, including shopping and dining plazas, bars, and a stadium. As shown in Figure 7c,f, the hotspot regions of Transportation and Medical-related activity are concentrated in specific locations. As for Transportation activity, the quantity is very small, which is distributed in Beijing West Railway Station and Beijing Railway Station. As for Medical-related activity, it is mainly concentrated around tertiary level-A hospitals and clinics, such as Peking University Third Hospital, Peking Union Medical College Hospital, Peking University People’s Hospital, and Beijing Children’s Hospital.
As illustrated in Figure 8, differences exist between destinations and origins. The activity semantics of destinations are less than that of origins. Four activities have been identified in the destination. Compared to origins, Home-related activity (Figure 8a) is much more concentrated in the destination. The Yongdingmen residential area found in the southern part of the study area, except Dawanglu, Wangjing, Suzhoujie, and Yuetan, is a densely residential area. Conversely, Recreation-related activity is distributed more widely than in the origin. Integrated places with the multi-functions of shopping, dining, and entertainment are identified, such as Sanlitun, Dongdan, Xidan, Financial Street, Zhongguancun, Wangjing, Gongzhufen, and Panjiayuan. Additionally, Wangfujing Pedestrian Street, the National Stadium, Yonghe Palace, 798 Art District, and other famous attractions all appear in these areas. Transportation activity (Figure 8c) and Work-related activity (Figure 8b) have similar spatial distribution to origin, respectively. As for Work-related activity, the workplaces near Beijing West Railway Station are discovered in the destination. It is interesting to note that Beijing South Railway Station is the hotspot of Transportation activity in the destination. However, we could not identify Beijing South Railway Station as the Transportation hotspot in the origin. The reason might be the existence of the phenomenon that people find it hard to take taxis at Beijing South Railway Station. This suggests that the relevant operators need to pay attention to the demand for taxi travel connections around Beijing South Railway Station. These results seem reasonable, which proves that our method is effective for inferring the activity semantic of taxi O–D trips.

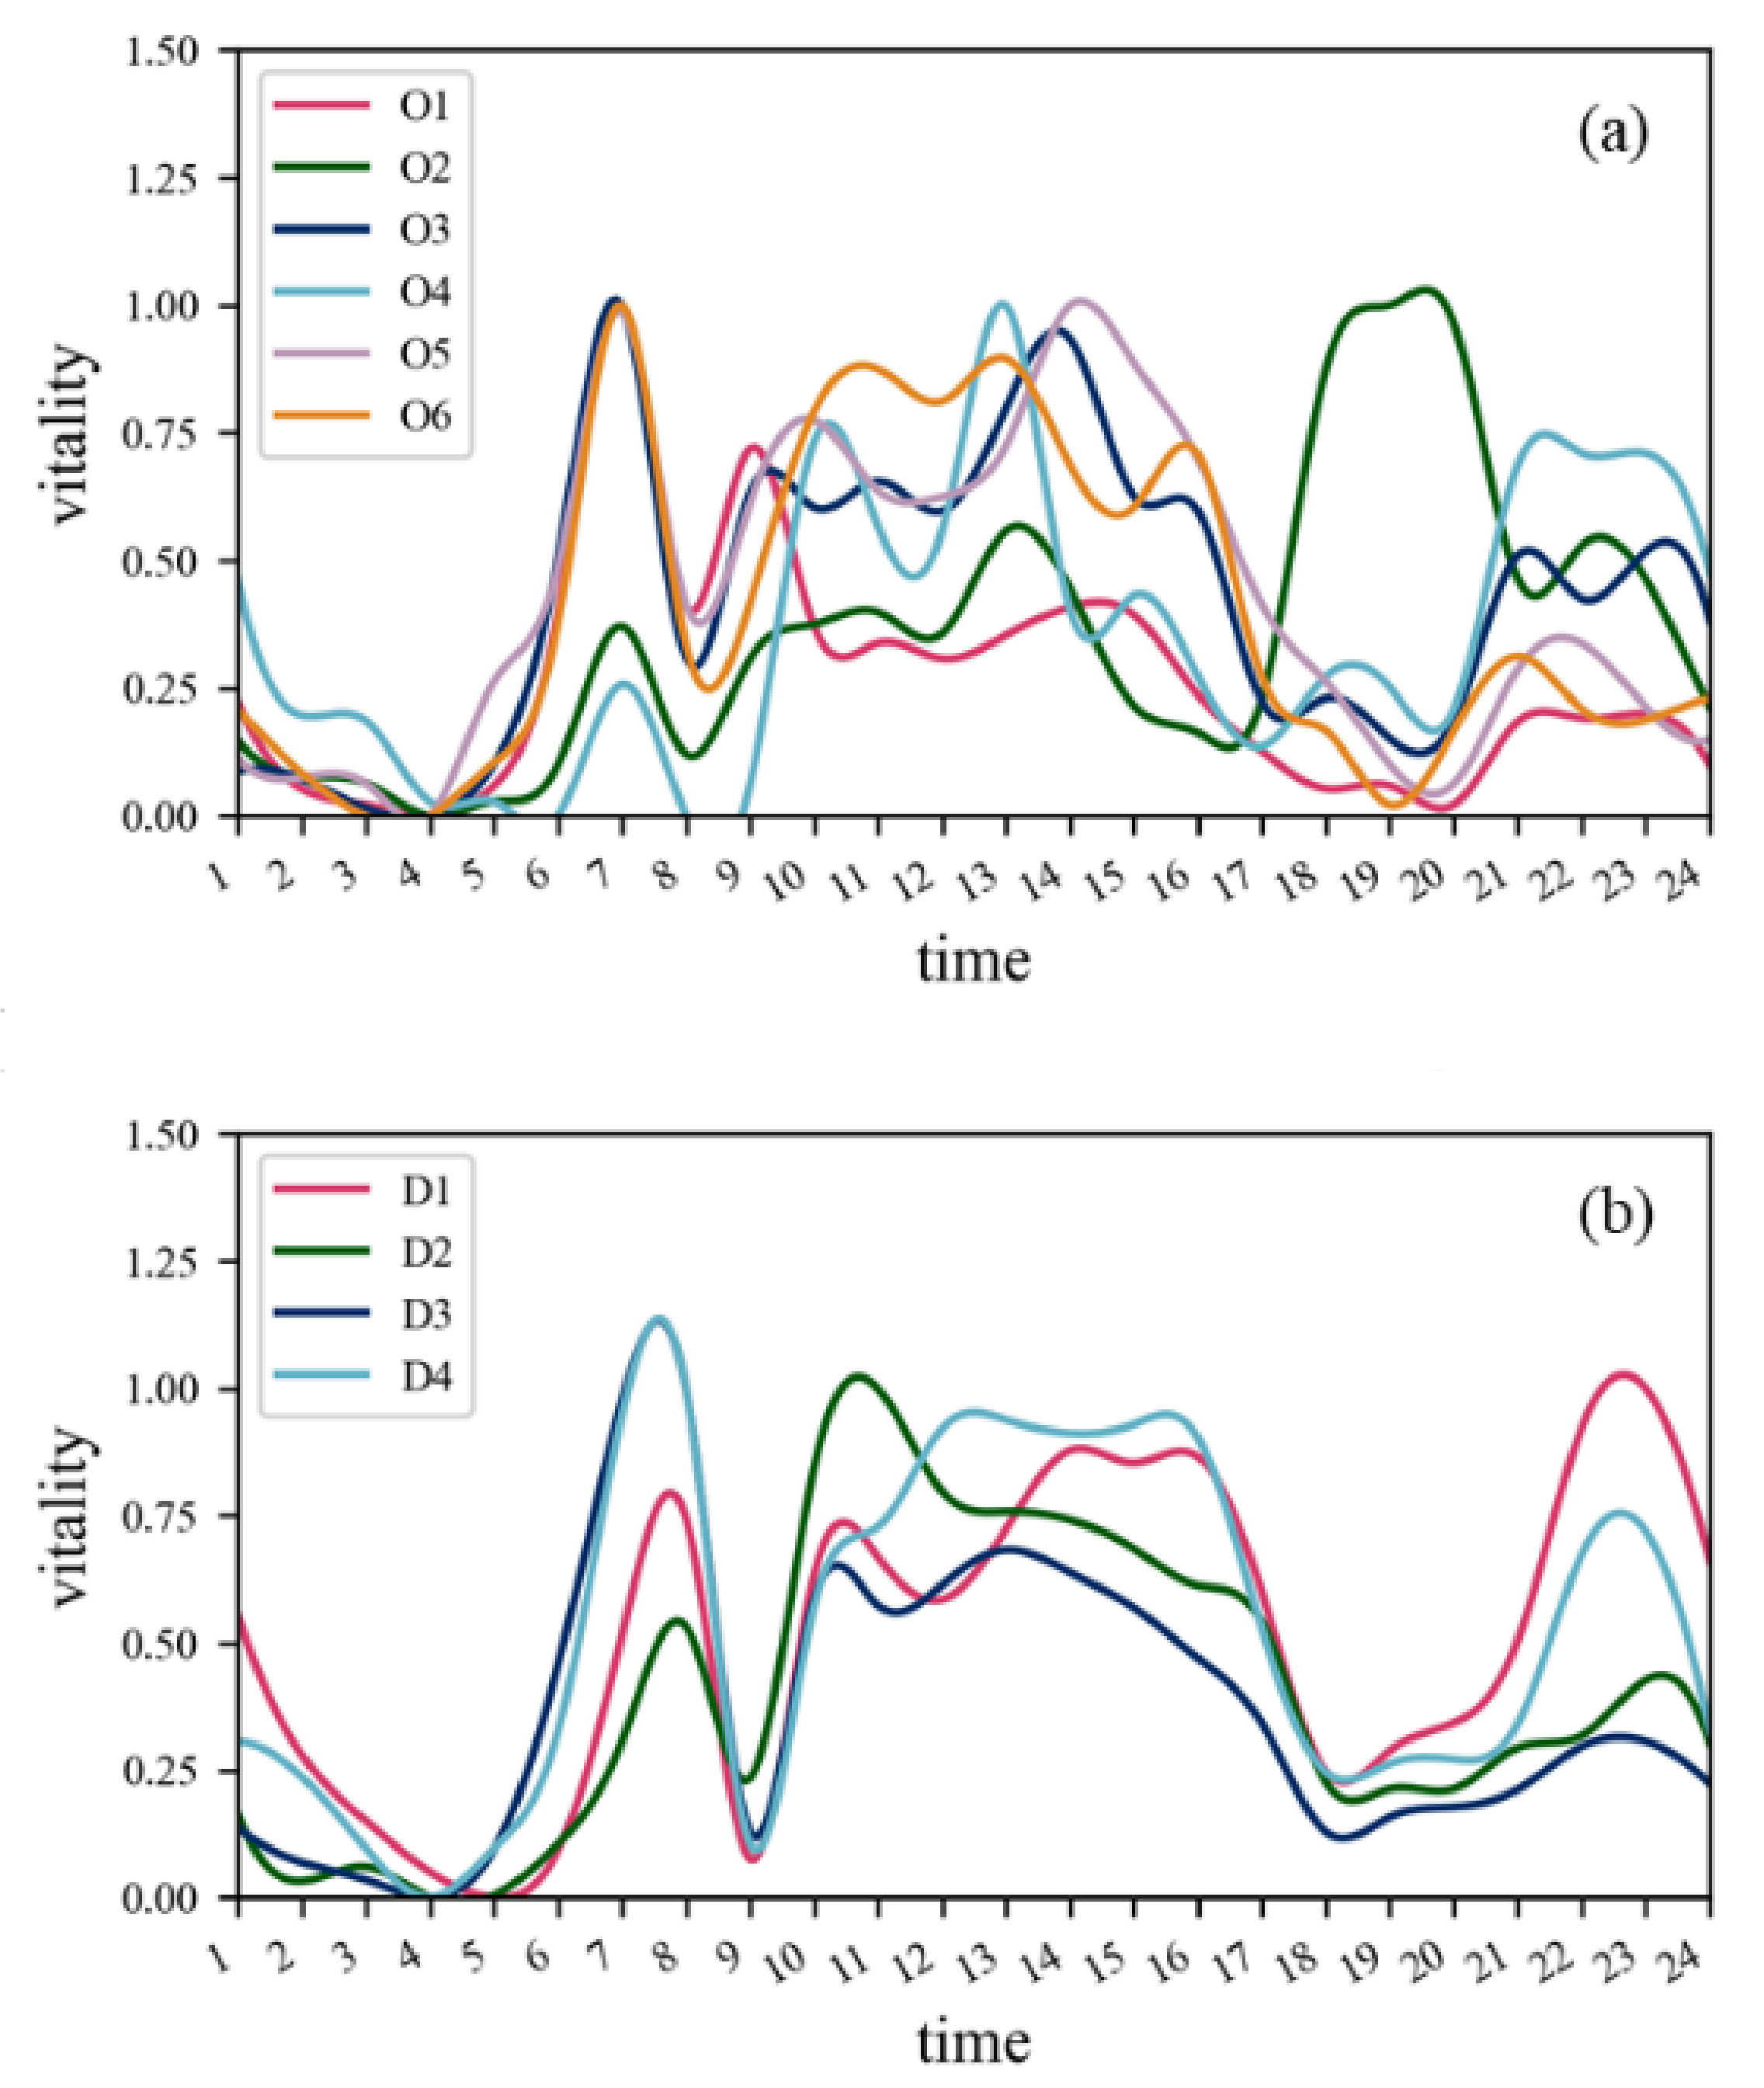
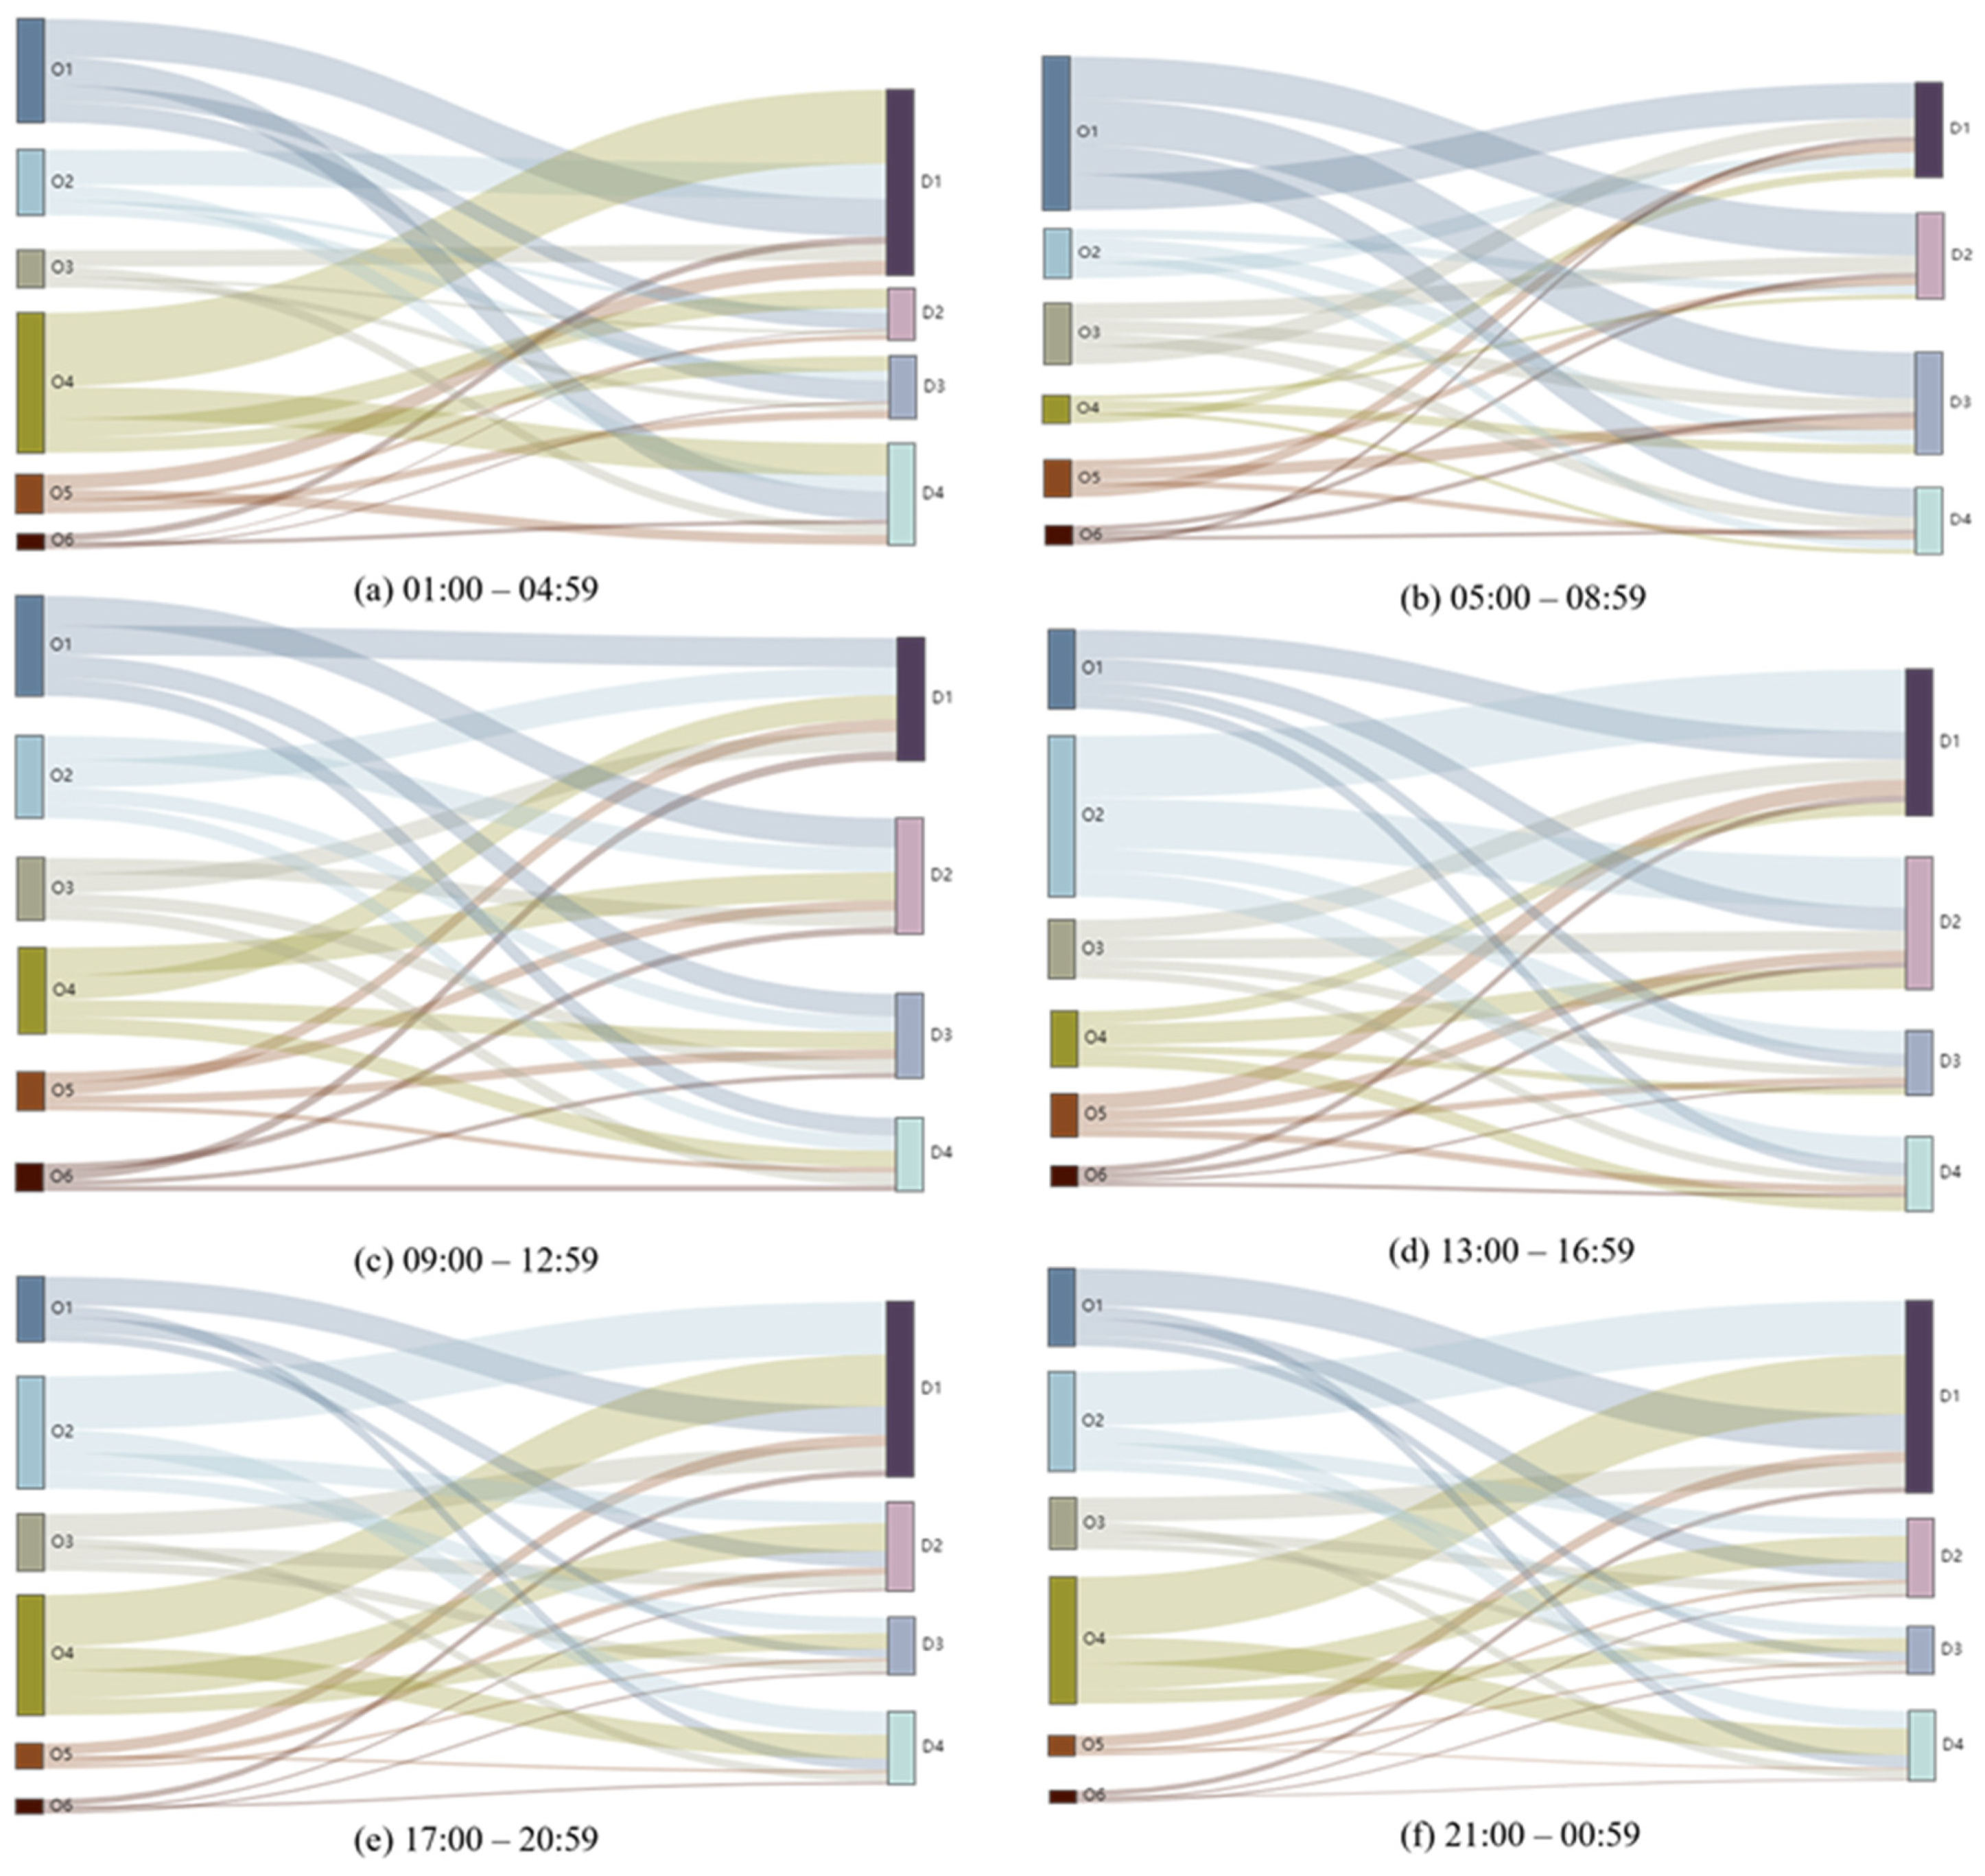
4.4. Spatiotemporal Patterns of Activity Semantic Flows

To better obtain spatial and temporal visualization results, we divided one day into six typical periods: dawn (01:00–04:59), early morning (05:00–08:59), morning (09:00–12:59), afternoon (13:00–16:59), evening (17:00–20:59), and midnight (21:00–00:59). The Sankey Diagram (Figure 9) is used to observe activity transitions from origins to destinations in the six distinct periods. Flow clustering allows us to analyze travel patterns given their spatial and activity semantic distribution. By mapping large activity semantic flow clusters, we find that the parameter α setting will affect the clustering results. If the parameter α is set too large, the clusters will be chaotic, whereas pattern loss will occur when the parameter α   is small. In this paper, the top 25 activity semantic flow clusters with α = 0.3 are retained to explore human travel patterns.
As shown in Figure 9a, many flows change from Recreation-related activity to Home-related activity during 01:00–04:59. Combination Figure 10a, shows that the activity semantic flow of “Recreation–Home” is mainly concentrated from Beijing Workers’ Sports Complex to Shifoying, Dawanglu and Shuangjing, and from Sanlitun to Dawanglu, Hufangqiao and Shuangjing. Meanwhile, working overtime is discovered in this period, around Liangmaqiao and Chaowai. After work, individuals return home, mainly from Liangmaqiao to Shuangjing and from Chaowai to Baiziwan. Partial “Home–Home” flow occurred from Beixinqiao to Xueyuanlu, where there might have been a social event or party.
Figure 9b shows the observed transitions between home and work and between home and transportation, indicating commuting and travel or business. In Figure 10b, for “Home–Transportation” activity, the destination is distributed in Beijing West Railway Station and Beijing South Railway Station. The origins are more dispersed than the destinations, and mainly distributed around Chongwenmen, Maliandao, Yuetan, Hepingli, and Dawanglu. The length of the “Home–Transportation” activity semantic flow is much longer than the others. Due to the irreplaceability of the railway station, the influence of distance on travel is less significant. As for “Home–Work” activity, large bidirectional spatial clusters exist between Liangmaqiao and CBD. Longer distance commute flow can also be identified from Wangjing to Dawanglu.
From 09:00 to 12:59, the activity transitions from origins to destinations have a relatively uniform distribution (Figure 9c). As shown in Figure 10c, the destinations are also concentrated in Beijing South Railway Station and Beijing West Railway Station, while the activity semantic of the origins is more diverse, except for “Home–Transportation” activity semantic flow, and the origins from Sanlihe and Xueyuanlu to Beijing South Railway Station denoted “Hotel–Transportation” activity semantic flow clusters. More longer distance commute flow clusters appeared in this period, such as from Sijiqing and Wangjing to Jianguomen, and from Sanlitun to Zhichunlu. Some Transportation activity semantic origins start from Beijing Railway Station and Beijing West Railway Station and end at a Work-related activity destination (Wanshoulu) and a Recreation-related activity destination (Qianmen), respectively.
In the afternoon period (13:00–16:59), the origins are mainly concentrated in the “Work-related” activity type, while the destination is mainly concentrated in Work-related activity and Home-related activity (Figure 9d). In Figure 10d, “Work–Work” activity semantic flow clusters also exist, with bidirectional connections between Liangmaqiao and CBD. This is also significant from Financial Street to CBD. People also tend to do “Recreation-related” activity around Wangjing and return home around CBD. We also found that some people who live in Zhongguancun will go to work at CBD, while some people who live around CBD will go to work at Zhongguancun. The reason might be Zhongguncun includes a large number of information technology-related workplaces and research institutes, while CBD mainly includes commercial-related workplaces.
As shown in Figure 9e, when people are off duty and return home, Work-related and Recreation-related are the main activities in origins, while destinations mainly related to Home-related activity. Figure 10e shows, after work, people who work at Zhichunlu will participate in Recreation-related activities at Beijing Workers’ Sports Complex, a famous area with shopping plazas, restaurants, bars, and a stadium. “Recreation–Home” activity semantic flow clusters are mainly distributed from Chaowai to Wanliu, from Xidan to Datunlu, and from Beijing Workers’ Sports Complex to Wangjing. Some people work overtime, and so commute flow also appears in this period. For example, “Work–Home” activity is concentrated from Chaowai and Dawanglu to Wangjing. The Transportation activity transitions happened from Beijing West Railway Station to Beijing Railway Station.
As shown in Figure 9f, the activity changes from origins to destination are similar to Figure 9e. Figure 10f indicates the activity semantic flow clusters are distributed more widely from 21:00 to 00:59, especially “Work–Home” activity and “Recreation–Home” activity. For example, individuals working at Chaoyangmen return to the Yongle residential area and individuals entertaining at Taiyanggong return to the Lugu residential area. CBD shows both Work-related activity and Recreation-related activity in this period. People working overtime at CBD return home around Beijing West Railway Station, while activity semantic flow cluster shows people entertaining at CBD returning home to Xinjiekou. We also find that people working overtime at Zhonguancun return home to Shaoyaoju along the fourth ring road. This might be related to the subway shutdown.
All of the findings are consistent with the well-known facts. Additionally, it is interesting to note that places show different activity semantics at different periods, such as Chaowai, CBD and Beijing West Railway Station.

5. Discussion and Conclusions

Inferring travel activity semantics and clustering flow patterns may contribute to a deeper understanding of human travel behavior and mobility, which can assist with transportation planning and management. In this paper, we proposed a two-layer framework to investigate human travel patterns from an activity semantic flow perspective.
In the first layer, we developed an activity inference method to infer trip activity semantics, based on the improved Word2vec model and Bayesian rules-based visiting probability ranking. The results demonstrate that taxi trip origins and destinations are divided into six and four typical activity semantic clusters, respectively. Specifically, the activities of origin are Home-related, Work-related, Transportation, Recreation-related, Hotel-related, and Medical-related, while the activities of destination are Home-related, Work-related, Transportation, and Recreation-related. Then, we compared inferred activity semantics from the three methods. The activity proportion of our method is close to the results of the travel survey data. The spatial distribution of the different activity semantic hotspots further reveals that our method is effective for taxi O–D trip activity inference. Our method takes geographic context and activity dynamics into consideration and can better infer some important activities with a low proportion of POIs but high attraction (such as a railway station) and represents the activity changes within a day.
Based on the obtained activity semantics, the flow clustering method is proposed to identify dominant activity semantic flow clusters and to investigate human travel patterns in the second layer.
Several conclusions and findings can be drawn from the spatial and temporal patterns of the different activities in the study area:
(1) Differences exist in the activity transitions from origins to destinations at distinct periods. From 01:00 to 04:59, “Recreation–Home” is the main activity semantic. Meanwhile, the phenomenon of working overtime is identified in this period. In the early morning (05:00–08:59), because of the morning peak, “Home–Work” and “Home–Transportation” occupied a large proportion of the observed activity, indicating commuting and travel or business flows. From 09:00 to 12:59, the activity transitions from origins to destinations has a relatively uniform distribution. In the afternoon (13:00–16:59), origins were mainly concentrated in Work-related activity, while destinations were mainly concentrated in Work-related activity and Home-related activity. From 17:00 to 20:59, when people are off duty and return home, “Work–Home” and “Recreation–Home” are the main activity semantics. In the midnight period (21:00–00:59), the activity changes from origins to destinations are similar to the previous period.
(2) From 01:00 to 04:59, activity semantic flow is concentrated in Beijing Workers’ Sports Complex and Sanlitun, which is characterized by Recreation-related activity and scattered to some residential areas, such as Shifoying and Dawanglu. In the daytime (05:00–16:59), the destination is mainly distributed in Beijing West Railway Station and Beijing South Railway Station, while origins are more dispersed than destinations. In addition, large bidirectional activity semantic flow clusters exist between Liangmaqiao and CBD, denoting “Home–Work” and “Work–Work” activity. Zhongguancun and CBD were also discovered as bidirectional activity semantic flow clusters which represent “Home–Work” activity. From 21:00 to 00:59, some commercial areas showed both recreation and work activity semantics (such as Chaowai) and indicate the activity dynamics.
(3) Because of the irreplaceability of the railway station, the activity semantic flows starting or ending at railway stations is much longer than others. One interesting finding is that we could not identify Beijing South Railway Station as the transportation hotspot in the origins. It is worth noting the phenomenon that people find it hard to take a taxi at Beijing South Railway Station.
This research provides a novel activity semantic flow perspective for understanding human travel patterns. However, there are some limitations regarding the data and approach. Firstly, combining multiple data sources will lead to more reliable activity inference results and human travel patterns. As a future study, we will involve area of interest (AOI) data in the method, which can help to infer travel activity more accurately. Meanwhile, it should be noted that taxi data inevitably encounters issues of representativeness [16]. Therefore, integrating mobile phone records data, transit smart card data, and social media check-in data, can describe different travel modes and reveal different human travel patterns more comprehensively. Secondly, we divided one day into six periods based on a fixed 4 h time interval. However, the time scale will influence human travel patterns. Therefore, in further work, we will develop a unified measurement of spatial-temporal-activity semantic similarity to cluster similar flows. Finally, this paper investigated human travel from the perspective of flow. However, the route choice between the origin and the destination is unknown. In future work, we can refer to the framework of the four-step model [54], and completely describe human travel behaviors.

Author Contributions

Conceptualization, Yusi Liu, Jing Zhang, Jun Xu; methodology, Yusi Liu, Xiang Gao; software, Yusi Liu, Xiang Gao; validation, Yusi Liu, Disheng Yi, Heping Jiang, Yuxin Zhao; formal analysis, Yusi Liu; resources, Jing Zhang; writing—original draft preparation, Yusi Liu; writing—review and editing, Yusi Liu, Disheng Yi, Jun Xu, Jing Zhang, Heping Jiang, Yuxin Zhao, Xiang Gao.; visualization, Yusi Liu, Disheng Yi, Heping Jiang, Yuxin Zhao; supervision, Jing Zhang. All authors have read and agreed to the published version of the manuscript.

Funding

This research was funded by the National Natural Science Foundation of China, grant number 42071376.

Institutional Review Board Statement

Not applicable.

Informed Consent Statement

Not applicable.

Data Availability Statement

Not applicable.

Acknowledgments

The authors would like to thank the anonymous reviewers for their useful comments and the editors for their editing assistance. We also thank Xinyu Wang for providing the technical support.

Conflicts of Interest

The authors declare no conflict of interest.

Appendix A

Figure A1. The main toponyms in human cognition in the study area.
Ijgi 11 00140 g0a1

References

  1. Liu, Y.; Liu, X.; Gao, S.; Gong, L.; Kang, C.; Zhi, Y.; Chi, G.; Shi, L. Social Sensing: A New Approach to Understanding Our Socioeconomic Environments. Ann. Assoc. Am. Geogr. 2015, 105, 512–530. [Google Scholar] [CrossRef]
  2. Gong, L.; Liu, X.; Wu, L.; Liu, Y. Inferring trip purposes and uncovering travel patterns from taxi trajectory data. Cartogr. Geogr. Inf. Sci. 2016, 43, 103–114. [Google Scholar] [CrossRef]
  3. Gong, S.; Cartlidge, J.; Bai, R.; Yue, Y.; Li, Q.; Qiu, G. Extracting activity patterns from taxi trajectory data: A two-layer framework using spatio-temporal clustering, Bayesian probability and Monte Carlo simulation. Int. J. Geogr. Inf. Sci. 2020, 34, 1210–1234. [Google Scholar] [CrossRef] [Green Version]
  4. Aslam, N.S.; Zhu, D.; Cheng, T.; Ibrahim, M.R.; Zhang, Y. Semantic enrichment of secondary activities using smart card data and point of interests: A case study in London. Ann. GIS 2021, 27, 29–41. [Google Scholar] [CrossRef]
  5. Liu, J.; Meng, B.; Wang, J.; Chen, S.; Tian, B.; Zhi, G. Exploring the Spatiotemporal Patterns of Residents’ Daily Activities Using Text-Based Social Media Data: A Case Study of Beijing, China. ISPRS Int. J. Geo-Inf. 2021, 10, 389. [Google Scholar] [CrossRef]
  6. Bhat, C.R.; Koppelman, F.S. Activity-Based Modeling of Travel Demand. In Handbook of Transportation Science; Springer: Boston, MA, USA, 2006; pp. 39–65. [Google Scholar] [CrossRef]
  7. Beecham, R.; Wood, J.; Bowerman, A. Studying commuting behaviours using collaborative visual analytics. Comput. Environ. Urban Syst. 2014, 47, 5–15. [Google Scholar] [CrossRef]
  8. Wu, L.; Zhi, Y.; Sui, Z.; Liu, Y. Intra-Urban Human Mobility and Activity Transition: Evidence from Social Media Check-In Data. PLoS ONE 2014, 9, e97010. [Google Scholar] [CrossRef] [Green Version]
  9. Liu, Y. Revisiting several basic geographical concepts: A social sensing perspective. Acta Geogr. Sin. 2016, 71, 564–575. [Google Scholar] [CrossRef]
  10. Chen, C.; Liao, C.; Xie, X.; Wang, Y.; Zhao, J. Trip2Vec: A deep embedding approach for clustering and profiling taxi trip purposes. Pers. Ubiquitous Comput. 2019, 23, 53–66. [Google Scholar] [CrossRef]
  11. Liu, Y.; Yao, X.; Gong, Y.; Kang, C.; Shi, X.; Wang, F.; Wang, J.; Zhang, Y.; Zhao, P.; Zhu, D.; et al. Analytical methods and applications of spatial interactions in the era of big data. Acta Geogr. Sin. 2020, 75, 1523–1538. [Google Scholar] [CrossRef]
  12. Wang, P.; Fu, Y.; Liu, G.; Hu, W.; Aggarwal, C. Human Mobility Synchronization and Trip Purpose Detection with Mixture of Hawkes Processes. In Proceedings of the 23rd ACM SIGKDD International Conference on Knowledge Discovery and Data Mining, New York, NY, USA, 13–17 August 2017; pp. 495–503. [Google Scholar] [CrossRef]
  13. Kang, C.; Liu, Y.; Wu, L. Delineating intra-urban spatial connectivity patterns by travel-activities: A case study of Beijing, China. In Proceedings of the 2015 23rd International Conference on Geoinformatics, Wuhan, China, 19–21 June 2015; pp. 1–7. [Google Scholar] [CrossRef] [Green Version]
  14. Yue, M.; Kang, C.; Andris, C.; Qin, K.; Liu, Y.; Meng, Q. Understanding the interplay between bus, metro, and cab ridership dynamics in Shenzhen, China. Trans. GIS 2018, 22, 855–871. [Google Scholar] [CrossRef]
  15. Gao, Y.; Cheng, J.; Meng, H.; Liu, Y. Measuring spatio-temporal autocorrelation in time series data of collective human mobility. Geo-Spat. Inf. Sci. 2019, 22, 166–173. [Google Scholar] [CrossRef] [Green Version]
  16. Liu, Y.; Kang, C.; Gao, S.; Xiao, Y.; Tian, Y. Understanding intra-urban trip patterns from taxi trajectory data. J. Geogr. Syst. 2012, 14, 463–483. [Google Scholar] [CrossRef]
  17. Liu, X.; Kang, C.; Gong, L.; Liu, Y. Incorporating spatial interaction patterns in classifying and understanding urban land use. Int. J. Geogr. Inf. Sci. 2016, 30, 334–350. [Google Scholar] [CrossRef]
  18. Zheng, Y.; Liu, L.; Wang, L.; Xie, X. Discovering Regions of Different Functions in a City Using Human Mobility and POIs Jing. In Proceedings of the 18th ACM SIGKDD International Conference on Knowledge Discovery and Data Mining, Beijing, China, 12–16 August 2012; p. 247. [Google Scholar]
  19. Tao, H.; Wang, K.; Zhuo, L.; Li, X. Re-examining urban region and inferring regional function based on spatial–temporal interaction. Int. J. Digit. Earth 2019, 12, 293–310. [Google Scholar] [CrossRef]
  20. Hu, S.; Gao, S.; Wu, L.; Xu, Y.; Zhang, Z.; Cui, H.; Gong, X. Urban function classification at road segment level using taxi trajectory data: A graph convolutional neural network approach. Comput. Environ. Urban Syst. 2021, 87, 101619. [Google Scholar] [CrossRef]
  21. Yi, D.; Yang, J.; Liu, J.; Liu, Y.; Zhang, J. Quantitative Identification of Urban Functions with Fishers’ Exact Test and POI Data Applied in Classifying Urban Districts: A Case Study within the Sixth Ring Road in Beijing. ISPRS Int. J. Geo-Inf. 2019, 8, 555. [Google Scholar] [CrossRef] [Green Version]
  22. Xu, J.; Li, A.; Li, D.; Liu, Y.; Du, Y.; Pei, T.; Ma, T.; Zhou, C. Difference of urban development in China from the perspective of passenger transport around Spring Festival. Appl. Geogr. 2017, 87, 85–96. [Google Scholar] [CrossRef]
  23. Yang, J.; Yi, D.; Qiao, B.; Zhang, J. Spatio-Temporal Change Characteristics of Spatial-Interaction Networks: Case Study within the Sixth Ring Road of Beijing, China. ISPRS Int. J. Geo-Inf. 2019, 8, 273. [Google Scholar] [CrossRef] [Green Version]
  24. Liu, X.; Gong, L.; Gong, Y.; Liu, Y. Revealing travel patterns and city structure with taxi trip data. J. Transp. Geogr. 2015, 43, 78–90. [Google Scholar] [CrossRef] [Green Version]
  25. Xie, K.; Deng, K.; Zhou, X. From trajectories to activities: A spatio-temporal join approach. In Proceedings of the 2009 International Workshop on Location Based Social Networks, Seattle, WA, USA, 3 November 2009; pp. 25–32. [Google Scholar] [CrossRef]
  26. Phithakkitnukoon, S.; Horanont, T.; Di Lorenzo, G.; Shibasaki, R.; Ratti, C. Activity-Aware Map: Identifying Human Daily Activity Pattern Using Mobile Phone Data. In Proceedings of the International Workshop on Human Behavior Understanding, Istanbul, Turkey, 22 August 2010; pp. 14–25. [Google Scholar] [CrossRef] [Green Version]
  27. Yue, Y.; Wang, H.-D.; Hu, B.; Li, Q.-Q.; Li, Y.-G.; Yeh, A.G. Exploratory calibration of a spatial interaction model using taxi GPS trajectories. Comput. Environ. Urban Syst. 2011, 36, 140–153. [Google Scholar] [CrossRef]
  28. Furletti, B.; Cintia, P.; Renso, C.; Spinsanti, L. Inferring human activities from GPS tracks. In Proceedings of the 2nd ACM SIGKDD International Workshop on Urban Computing, New York, NY, USA, 11 August 2013; pp. 1–8. [Google Scholar] [CrossRef]
  29. Huang, L.; Li, Q.; Yue, Y. Activity identification from GPS trajectories using spatial temporal POIs’ attractiveness. In Proceedings of the 2nd ACM SIGSPATIAL International Workshop on Location Based Social Networks, San Jose, CA, USA, 2 November 2010; pp. 27–30. [Google Scholar] [CrossRef]
  30. Li, S.; Zhuang, C.; Tan, Z.; Gao, F.; Lai, Z.; Wu, Z. Inferring the trip purposes and uncovering spatio-temporal activity patterns from dockless shared bike dataset in Shenzhen, China. J. Transp. Geogr. 2021, 91, 102974. [Google Scholar] [CrossRef]
  31. Liu, X.; Huang, Q.; Gao, S.; Xia, J. Activity knowledge discovery: Detecting collective and individual activities with digital footprints and open source geographic data. Comput. Environ. Urban Syst. 2021, 85, 101551. [Google Scholar] [CrossRef]
  32. Yao, Z.; Fu, Y.; Liu, B.; Hu, W.; Xiong, H. Representing Urban Functions through Zone Embedding with Human Mobility Patterns. In Proceedings of the Twenty-Seventh International Joint Conference on Artificial Intelligence (IJCAI-18), Stockholm, Sweden, 13–19 July 2018; pp. 3919–3925. [Google Scholar] [CrossRef] [Green Version]
  33. Zhai, W.; Bai, X.; Shi, Y.; Han, Y.; Peng, Z.-R.; Gu, C. Beyond Word2vec: An approach for urban functional region extraction and identification by combining Place2vec and POIs. Comput. Environ. Urban Syst. 2019, 74, 1–12. [Google Scholar] [CrossRef]
  34. Yao, Y.; Li, X.; Liu, X.; Liu, P.; Liang, Z.; Zhang, J.; Mai, K. Sensing spatial distribution of urban land use by integrating points-of-interest and Google Word2Vec model. Int. J. Geogr. Inf. Sci. 2017, 31, 825–848. [Google Scholar] [CrossRef]
  35. Mikolov, T.; Chen, K.; Corrado, G.; Dean, J. Efficient estimation of word representations in vector space. In Proceedings of the 1st International Conference on Learning Representations, ICLR 2013, Scottsdale, AZ, USA, 2–4 May 2013. [Google Scholar]
  36. Tobler, W.R. A Computer Movie Simulating Urban Growth in the Detroit Region. Econ. Geogr. 1970, 46, 234–240. [Google Scholar] [CrossRef]
  37. Yan, B.; Janowicz, K.; Mai, G.; Gao, S. From ITDL to Place2Vec—Reasoning about Place Type Similarity and Relatedness by Learning Embeddings from Aug-mented Spatial Contexts. In Proceedings of the 25th ACM SIGSPATIAL International Conference on Advances in Geographic Information Systems, Redondo Beach, CA, USA, 7–10 November 2017; p. 35. [Google Scholar] [CrossRef]
  38. Żochowska, R.; Jacyna, M.; Kłos, M.; Soczówka, P. A GIS-Based Method of the Assessment of Spatial Integration of Bike-Sharing Stations. Sustainability 2021, 13, 3894. [Google Scholar] [CrossRef]
  39. Beijing Municipal Commission of Transport (BMCT); Beijing Transport Institute (BTI). Fifth Comprehensive Survey on Urban Traffic in Beijing; Beijing Municipal Commission of Transport: Beijing, China, 2016.
  40. Wang, H.; Huang, H.; Ni, X.; Zeng, W. Revealing Spatial-Temporal Characteristics and Patterns of Urban Travel: A Large-Scale Analysis and Visualization Study with Taxi GPS Data. ISPRS Int. J. Geo-Inf. 2019, 8, 257. [Google Scholar] [CrossRef] [Green Version]
  41. Gao, S.; Janowicz, K.; Couclelis, H. Extracting urban functional regions from points of interest and human activities on location-based social networks. Trans. GIS 2017, 21, 446–467. [Google Scholar] [CrossRef]
  42. Frey, B.J.; Dueck, D. Clustering by Passing Messages between Data Points. Science 2007, 315, 972–977. [Google Scholar] [CrossRef] [Green Version]
  43. Ramos, J.; Eden, J.; Edu, R. Using TF-IDF to Determine Word Relevance in Document Queries. In Proceedings of the First Instructional Conference on Machine Learning, Piscataway, NJ, USA, 3–8 December 2003; pp. 1133–1142. [Google Scholar]
  44. Liu, K.; Qiu, P.; Gao, S.; Lu, F.; Jiang, J.; Yin, L. Investigating urban metro stations as cognitive places in cities using points of interest. Cities 2020, 97, 102561. [Google Scholar] [CrossRef]
  45. Kang, C.; Ma, X.; Tong, D.; Liu, Y. Intra-urban human mobility patterns: An urban morphology perspective. Phys. A Stat. Mech. Its Appl. 2012, 391, 1702–1717. [Google Scholar] [CrossRef]
  46. Gao, S.; Wang, Y.; Gao, Y.; Liu, Y. Understanding Urban Traffic-Flow Characteristics: A Rethinking of Betweenness Centrality. Environ. Plan. B Plan. Des. 2013, 40, 135–153. [Google Scholar] [CrossRef] [Green Version]
  47. Liu, K.; Gao, S.; Qiu, P.; Liu, X.; Yan, B.; Lu, F. Road2Vec: Measuring Traffic Interactions in Urban Road System from Massive Travel Routes. ISPRS Int. J. Geo-Inf. 2017, 6, 321. [Google Scholar] [CrossRef] [Green Version]
  48. Li, A.; Huang, Y.; Axhausen, K.W. An approach to imputing destination activities for inclusion in measures of bicycle accessibility. J. Transp. Geogr. 2020, 82, 102566. [Google Scholar] [CrossRef]
  49. Catells, M. The Informational City: Information Technology, Economic Restructuring, and the Urban-Regional Process; Blackwell: New York, NY, USA, 1989; pp. 480–482. [Google Scholar]
  50. Pei, T.; Liu, Y.; Guo, S.; Shu, H.; Du, Y.; Ma, T.; Zhou, C. Principle of big geodata mining. Acta Geogr. Sin. 2019, 74, 586–598. [Google Scholar] [CrossRef]
  51. Batty, M. The New Science of Cities; The MIT Press: Cambridge, MA, USA; London, UK, 2013. [Google Scholar]
  52. Gao, X.; Liu, Y.; Yi, D.; Qin, J.; Qu, S.; Huang, Y.; Zhang, J. A Spatial Flow Clustering Method Based on the Constraint of Origin-Destination Points’ Location. IEEE Access 2020, 8, 216069–216082. [Google Scholar] [CrossRef]
  53. Yao, X.; Zhu, D.; Gao, Y.; Wu, L.; Zhang, P.; Liu, Y. A Stepwise Spatio-Temporal Flow Clustering Method for Discovering Mobility Trends. IEEE Access 2018, 6, 44666–44675. [Google Scholar] [CrossRef]
  54. McNally, M.G. The Four Step Model. UC Irvine: Center for Activity Systems Analysis. 2018. Available online: https://escholarship.org/uc/item/0r75311t (accessed on 15 December 2021).
Figure 1. The study area within Fifth Ring Road in Beijing.
Ijgi 11 00140 g001
Figure 2. Framework of the proposed method: activity inference (First Layer); and flow clustering (Second Layer).
Ijgi 11 00140 g002
Figure 3. A schematic diagram of activity inference framework.
Ijgi 11 00140 g003
Figure 4. Percentage of origins and destinations that contain at least one POI within different walking distances.
Ijgi 11 00140 g004
Figure 5. Illustration of similar and dissimilar flows. Different colors denote different activity semantics. Boundary circles identify all similar flows whose origin and destination points are within the circle. f 3   is dissimilar to f 1 in direction. f 4 is dissimilar to f 1 in activity semantic. f 5 and f 6 are dissimilar to f 1 in length. Only f 2 is similar to f 1 .
Ijgi 11 00140 g005
Figure 6. Time distribution of different activities in origin (a) and destination (b).
Ijgi 11 00140 g006
Figure 7. The spatial distribution of different travel activities (origin).
Ijgi 11 00140 g007
Figure 8. The spatial distribution of different travel activities (destination).
Ijgi 11 00140 g008
Figure 9. Activity transitions from origins to destinations at different periods.
Ijgi 11 00140 g009
Figure 10. The spatial distribution of significant taxi activity semantic flow clusters at different periods. The flow color represents the activity semantic type, and the flow width is proportional to the number. O1 and D1: Home-related activity; O2 and D2: Work-related activity; O3 and D3: Transportation activity; O4 and D4: Recreation-related activity; O5: Hotel-related activity; O6: Medical-related activity.
Ijgi 11 00140 g010
Table 1. Sample records of taxi trips.
Taxi_idPick-Up
Location
Pick-Up TimeDrop-Off
Location
Drop-Off TimeLength
(km)
00efc27613968e2891adb0c93d1a6ae6116.51623, 39.910262016/5/16 11:23116.37353, 39.864472016/5/16 11:4713.22
51145e28389e5849dbf4dd49ed76c72d116.45577, 39.950002016/5/20 0:11116.30730, 39.922552016/5/20 0:3113.05
Table 2. POI category classification.
POI CategoryPOI Types in Gaode Map API
HomeResidential Area
WorkCompany, Famous Enterprise, Factory, Building, Industrial Park, Farming, Forestry, Animal Husbandry and Fishery Base
TransportationAirport Related, Railway Station, Coach Station, Subway Station, Bus Station
DiningChinese Food Restaurant, Foreign Food Restaurant, Fast Food Restaurant, Leisure Food Restaurant, Coffee House, Tea House, Ice-cream Shop, Bakery, Dessert House
Daytime
Recreation
Shopping Plaza, Sports Stadium, Golf Related, Game Center, Theatre and Cinema, Concert Hall, etc.
Nighttime
Recreation
KTV, Pub, Disco, etc.
Tourist AttractionPark and Square, Scenery Spot
HotelHotel, Hostel
SchoolingSchool, Research Institution, Training Institution, Driving School
Medical ServiceHospital, Special Hospital, Clinic, Emergency Center, Disease Prevention Institution, Pharmacy, Veterinary Hospital
Table 3. Overall POI density and ranking.
OriginPOIIDEDDestinationPOIIDED
O1Dining0.5770.252D1Dining0.5180.39
Schooling0.1230.314Work0.1850.431
Home0.0290.389Home0.0420.991
O2Work0.4210.649D2Dining0.4340.221
Dining0.3490.208Work0.2930.463
Daytime
Recreation
0.0240.311Schooling0.1170.371
O3Dining0.4650.067D3Dining0.4650.168
Transportation0.2290.521Transportation0.4550.835
Work0.1090.041Hotel0.0280.094
O4Dining0.7250.396D4Dining0.6680.221
Nighttime
Recreation
0.0330.394Hotel0.0710.212
Daytime
Recreation
0.0240.286Daytime
Recreation
0.0130.224
O5Dining0.4340.057
Hotel0.2330.312
Nighttime
Recreation
0.0230.083
O6Dining0.3850.019
Medical
Service
0.2140.257
Hotel0.0740.039
Table 4. Activity proportions of the three methods and travel survey data.
HomeWorkTransportationRecreationOthers
Travel Survey32.10%19.40%18.80%17.90%11.90%
Method I28%26%3.50%37.80%2.60%
Method II20.34%33.94%2.27%37.31%6.14%
Method III33%17.20%21.40%22%6.40%
Publisher’s Note: MDPI stays neutral with regard to jurisdictional claims in published maps and institutional affiliations.

