1. Introduction
As a link connecting urban spaces, public transportation plays an important role in the development of cities. It not only enriches people’s travel modes, but also promotes urban development and changes the pattern of cities. As part of the public transportation system, taxis and subways are two important modes in urban areas. Their interaction improves the performance of urban traffic. Li et al. [
1] verified this point of view and pointed out that a newly built subway station has an interactive relationship with the spatial distribution of taxi passenger flow around it.
Furthermore, the spatial-temporal distribution of taxi services often play an important reference role in studying urban development [
2]. In the daily driving of taxis, the Global Positioning System (GPS) loaded on it records a large amount of trajectory data, and because of its completeness, timeliness, and high accuracy, it is usually widely used in data mining, urban computing, intelligent traffic system, smart city planning, and so forth [
3].
Subway transport, as one of the major method for city public transport, its stations provide services such as transferring, parking, distribution and guidance, which is closely related to economy, politics, culture and society.
Since the selection of subway station location is an important part of the subway construction process, it even plays an important role in urban planning and future development of the city. The core elements that affect the station planning of urban rail transit line can be summarized as two points: (1) current situation and future traffic demand; (2) the character of the land use around urban rail transit stations [
4]. In addition, the construction of subway has the attributes of high construction cost, long construction period, high risk, and it is not easy to rebuild or relocate after completion, so the early selection of subway station location is very important. Besides, the current location is mainly based on population density, regional land use characteristics and traffic conditions, less considering the travel characteristics of urban residents, which leads to inconsistency between the location and people’s actual needs. For this reason, we propose a scientific and reasonable site selection to solve the above problems.
Based on the GPS trajectory data of taxis in Beijing and the data of the existing subway stations, this paper predicts the location of new subway stations to provide assistance for the site selection planning of future stations. For the driving trajectory of each taxi, we first calculate each passenger origin (O) and destination (D) during the subway operating hours to research current situation and future traffic demand. In addition, according to the coverage of the established subway stations, we classify the OD data and select the Gaussian Mixture Model (GMM) clustering algorithm for clustering to predict the regional scope and route planning of future stations. After that, we conduct a statistical analysis of land use characteristics in some of the predicted regions. The results of this study can be used to improve urban traffic planning.
In this paper, our main contributions are as follows:
We employed the weighted LeaderRank to rank subway stations, it consider the direction of passenger travel and the impact of the dynamic and complex network link relationship formed by passenger travel on the site;
We employed a clustering method based on the trajectory of taxi to predict the location of subway stations. The experimental results show that our method is helpful to determine the location of subway stations;
We proposed a method to select the best clustering parameters to better predict the location of stations. In addition, we further characterized the land use around predicted sites to find the law of land use for potential subway stations.
The rest of this paper is organized as follows.
Section 2 reviews the related work.
Section 3 gives the basic definitions of the paper.
Section 4 presents a model of predicting subway station.
Section 5 conducts data mining on the trajectory data of taxis, analyze and predict the location of Beijing subway stations. Finally,
Section 6 concludes the paper and provides future work.
2. Related Work
The traffic data mining is an important research topic in recent years. At present, the location selection of traffic stations in the transportation network mainly focuses on the following three aspects: the study on traffic data, identify important stations in the transportation network, the study on transport system planning and modeling. The works related to the above three aspects will be studied in the following sub-sections.
2.1. Study on Traffic Data
At present, traffic data have great research value which can reflect the current urban traffic conditions and can be used for city planning and the improvement of the city’s traffic system. For example, Liu et al. [
5] defined the Congestion Coefficient as the metric for reflecting the state of traffic congestion by using taxi GPS trajectories in order to improve urban traffic management. Croce et al. [
6] attempted to integrate data from models, traditional surveys and big data. They proposed a framework to estimate travel demand, which allows interactions and synergies among data derived from traditional surveys, floating car data derived from GPS, and traditional methods. Zhu et al. [
7] introduced a taxi OD and street datasets in Beijing to explore the spatio-temporal dynamic patterns of urban mobility on Beijing’s urban streets. In [
8], the authors used an improved DBSCAN algorithm to group similar points in each timeframe during the taxi trip. They proposed an approach to explore the movement patterns and the behavior of people. Antonio Comi et al. [
9] identified trips and subsequently for O-D estimation through sampling and statistics. Although there are many studies focused on a certain mode of public transportation, few studies on the intermodal relationship and mutual influence between multiple modes of transportation.
Some studies like Jiang et al. [
10] used negative binomial regression models to explore the relationship between taxi trips and subway ridership. In [
11], the authors designed a bus-subway transfer scheme recommendation system. This system gives different routes to the passenger and estimated travel time for each route by using historical and real-time bus GPS data and subway arrival station data.
Although the above researches consider the influence of existing modes of transportation, there are few studies on the development and planning of a certain traffic mode in the future. In order to fill this gap, this paper aims to explore the relationship between taxi and subway. We predict future subway lines and station locations through data mining on taxi trajectories.
2.2. Ranking Nodes in Complex Networks
For the research on the ranking nodes in complex networks, scholars have designed many sorting algorithms according to different practical problems [
12], mainly based on four problems; first is the number of node neighbors, such as the k-shell decomposition method [
13], second is considering the path between nodes; third is based on feature vectors, which not only considers the number of neighbor nodes but also considers the attributes of each node; fourth, based on dynamic network which takes into account the impact of changes in network nodes on the network. Among the node ranking methods based on feature vectors, the PageRank algorithm, and its improved algorithm LeaderRank as a directed network node importance ranking algorithm, are widely used in various fields of research, such as the ranking of the importance of web pages [
14], the ranking of power grid nodes [
15], Stock network ranking [
16], looking for influential spreaders in complex social networks [
17]. In addition, the LeaderRank algorithm adds background nodes on the basis of PageRank. It performs better than PageRank in terms of convergence speed and identifying important network nodes [
18]. Therefore, we try to apply this algorithm to the research of transportation network.
2.3. Transport System Planning and Modeling
Location selection has always been a concern of scholars. Traditional location methods need a lot of manpower and time costs. Many scholars [
19,
20,
21,
22] use mathematical modeling methods to study the location problem at this stage. This method not only saves time and manpower costs, but also improves the accuracy of the results to a certain extent.
The development of a transportation system project may involve the functional design of new infrastructure facilities such as roads, railways, airports; assessment of long-term investment programs; definition of circulation and regulation schemes for urban road networks; and design of strategies for new advanced traffic control and information systems, and so forth [
23]. Traditionally, the planning and design of transport systems is often done through mathematical models; G. Birgillito et al. [
24] analyzed a transport system in a discontinuous space—they investigated variables which influence passengers’ trip choices, and their relative weight in the discontinuous space model in order to plan and design procedures to improve the quality of mobility.
Subway station location is an important part of urban public transport, which directly affects urban traffic development and the travel efficiency of urban residents. In the existing research on subway station locations, Church and Clifford [
19] studied the method of rail transit location. They divided grids within the scope of the proposed rail transit line and developed a set of evaluation methods to score each grid. Finally, they used Dijkstra algorithm to select the path with the minimum weight value as the optimal path. Yang et al. [
25] found that metro alignment and station placement has bypassed the core of established communities by examining the price of transacted land parcels in relation to their distance to the nearest metro stations through regression models use a hedonic approach. Zhang et al. [
26] used the hidden Markov model and an Equilibrium Optimizer (EO) Algorithm to improve public transport network. This model was loaded using data from the evening rush hour aims to reduce cost (total displacement time) and increase feasible travels in public transport networks.
Follow up researchers consider the number of population, surrounding land use and other factors in the construction of the model, and use the theory of operational research to optimize the objective function of the model to find the best rail transit station. For example, Gendreau and Laporte [
20] use the Tabu Research method which divides the built rail lines into grids. They considered the impact of the urban rail transit station location plan on the line passenger flow attraction, the number and location of the station are optimized with the goal of maximizing the total population covered by the station. Chine and Steven [
21] established an optimization model of the distance between transportation stations based on the minimum total cost by considering the distribution of passenger travel density, the travel speed and time cost. Steven et al. [
22] have studied the coverage radius of the rail transit station and the situation of land development and utilization along the line. By analyzing the relationship between them, they established a linear regression analysis model based on these two factors to get the influential area of the rail transit line. Aleksander Król et al. [
27] presented an application of a genetic algorithm for two stages of a metro system design. The first stage determines the layout of metro stations through urban population density data, which optimally meets the transportation demands of the inhabitants. The second stage generates the optimal topology of lines connecting the stations, taking into account the minimization of construction costs.
Through the research on the site selection of rail transit stations, it is found that the current site selection is mainly based on population density [
20,
27], regional environment [
22] and traffic conditions [
21], lacking comprehensive consideration of various factors and less consideration of the travel characteristics of urban residents, which leads to the deviation between the site selection and people’s actual needs. Therefore, this paper is expected to effectively analyze the massive traffic data, mining people’s travel characteristics and use them as the basis for subway station location, so as to solve the problem of subway station location from the actual situation.
3. Definitions
In this section, the definitions of our approach are introduced and explained in detail.
Definition 1 (Flow Model). Let and be set of taxi OD flows and subway passenger flows. Then , represents a directed flow moves from origin station at time to the destination station at time , where , , and are name of subway station and are the coordinates of the origin and the destination respectively.
Definition 2 (subway Network)
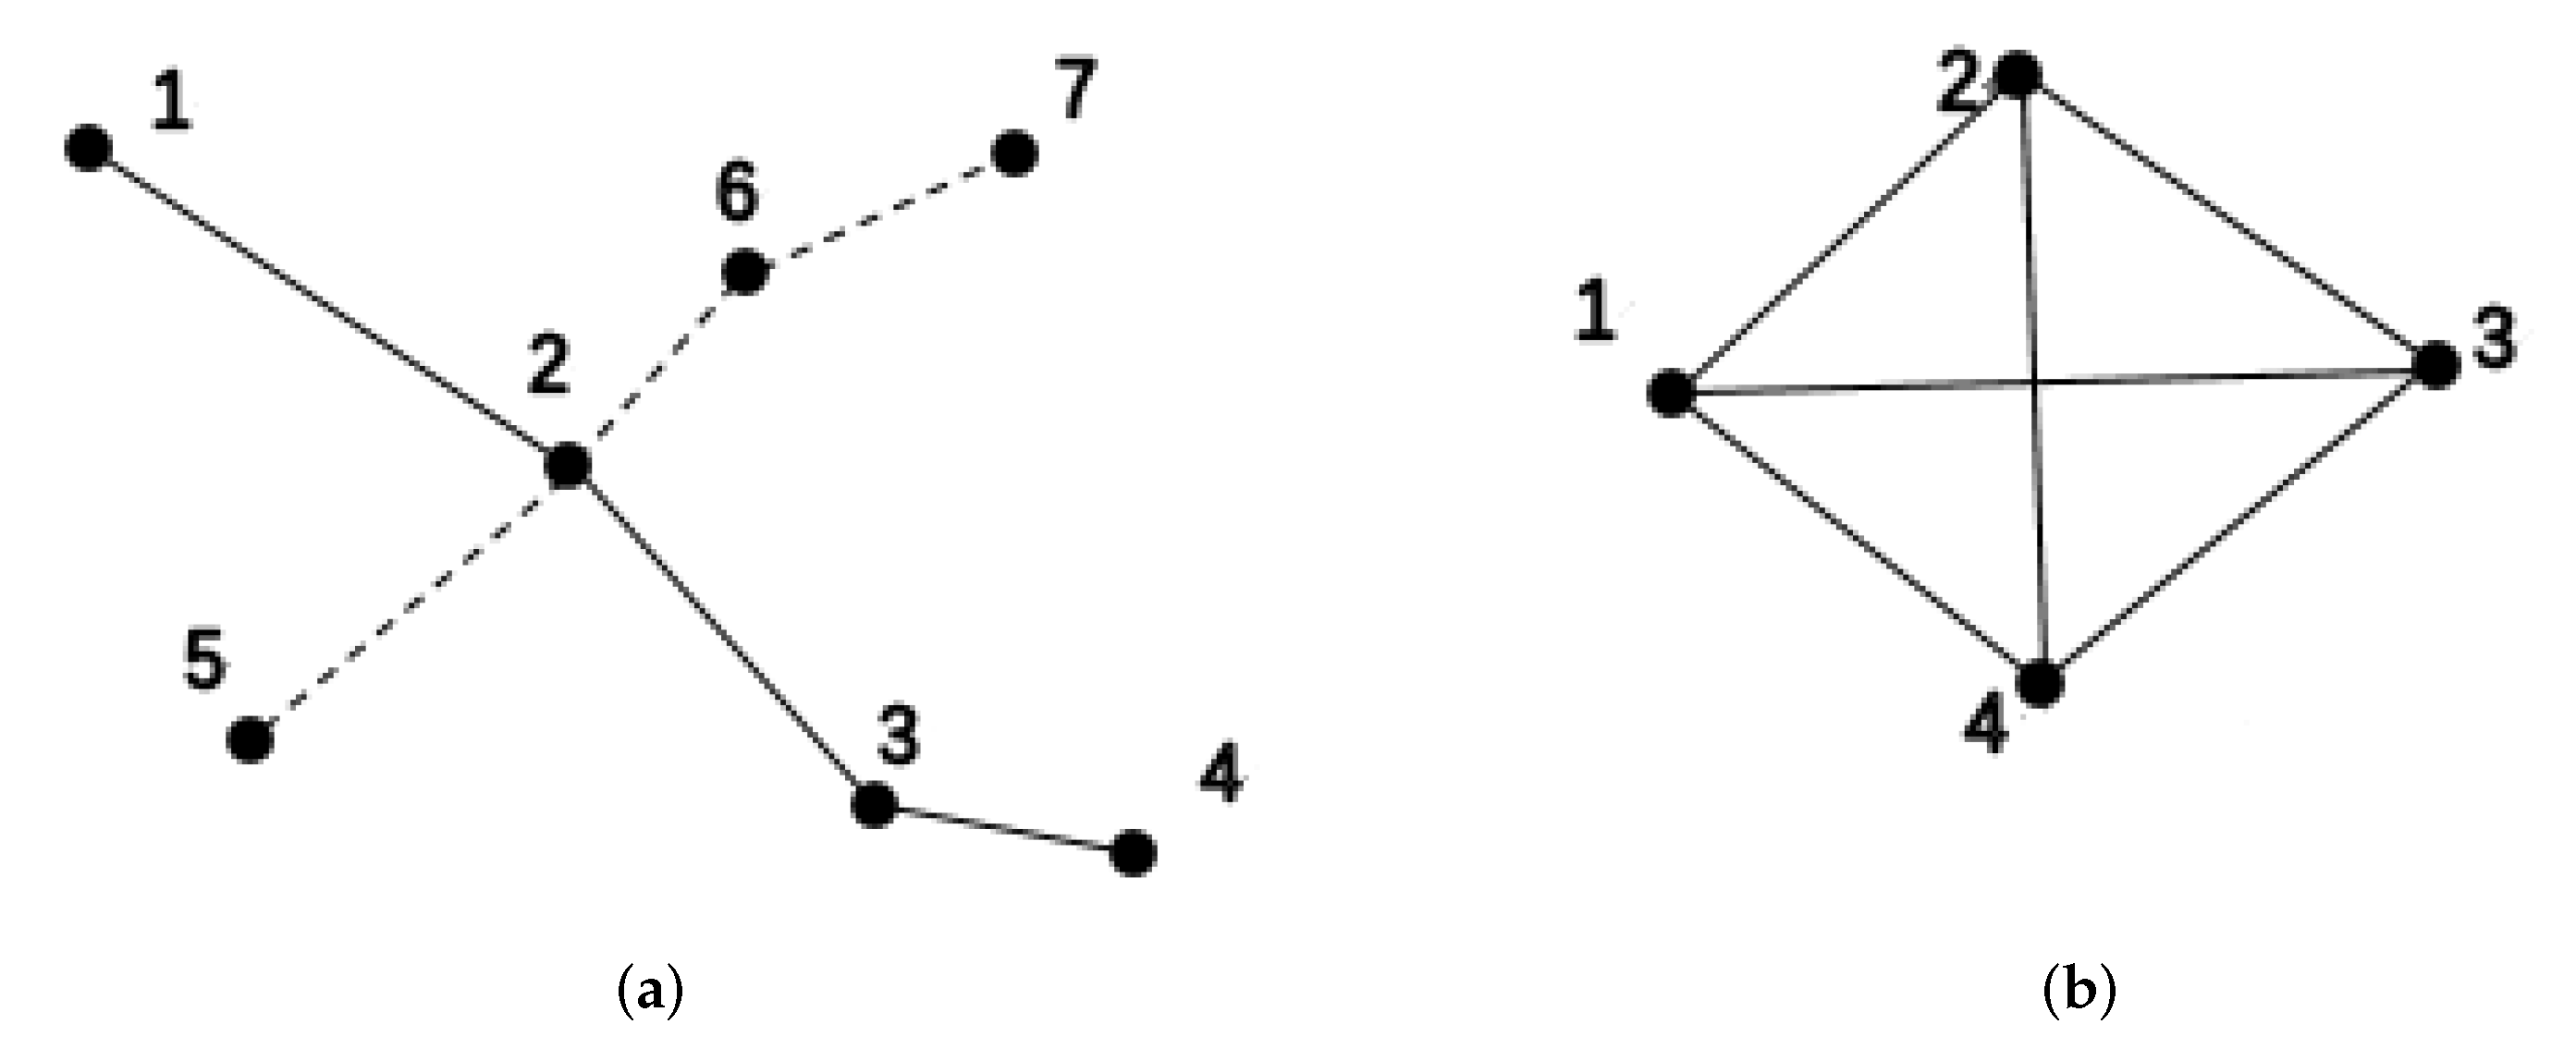
. There are two main topological descriptions for building complex transportation networks: space L and space P [28]. The space L method considers traffic stations as graph nodes. If two stations are adjacent on a certain traffic line, there is an edge connecting the two nodes. The space P method also considers a transportation station as a graph node. If there are accessible traffic lines between the two stations, then there is an edge connecting the two nodes. Figure 1 shows a simple subway network represented by two different descriptive methods. Obviously, the network constructed by the space L method is a sub network constructed by the space P method. Space L reflects the real state of the subway station network, only reflects that two stations are truly adjacent on a traffic line, while space P better reflects the connection state of the traffic network stations. Therefore, this paper uses the space P method to construct a weighted subway network.A weighted subway network consists of subway stations and weighted edges between them, expressed as , is a collection of stations, is a set with directed edges, is a set of directed edge weights, is the number of passengers flowing from station i to station j.
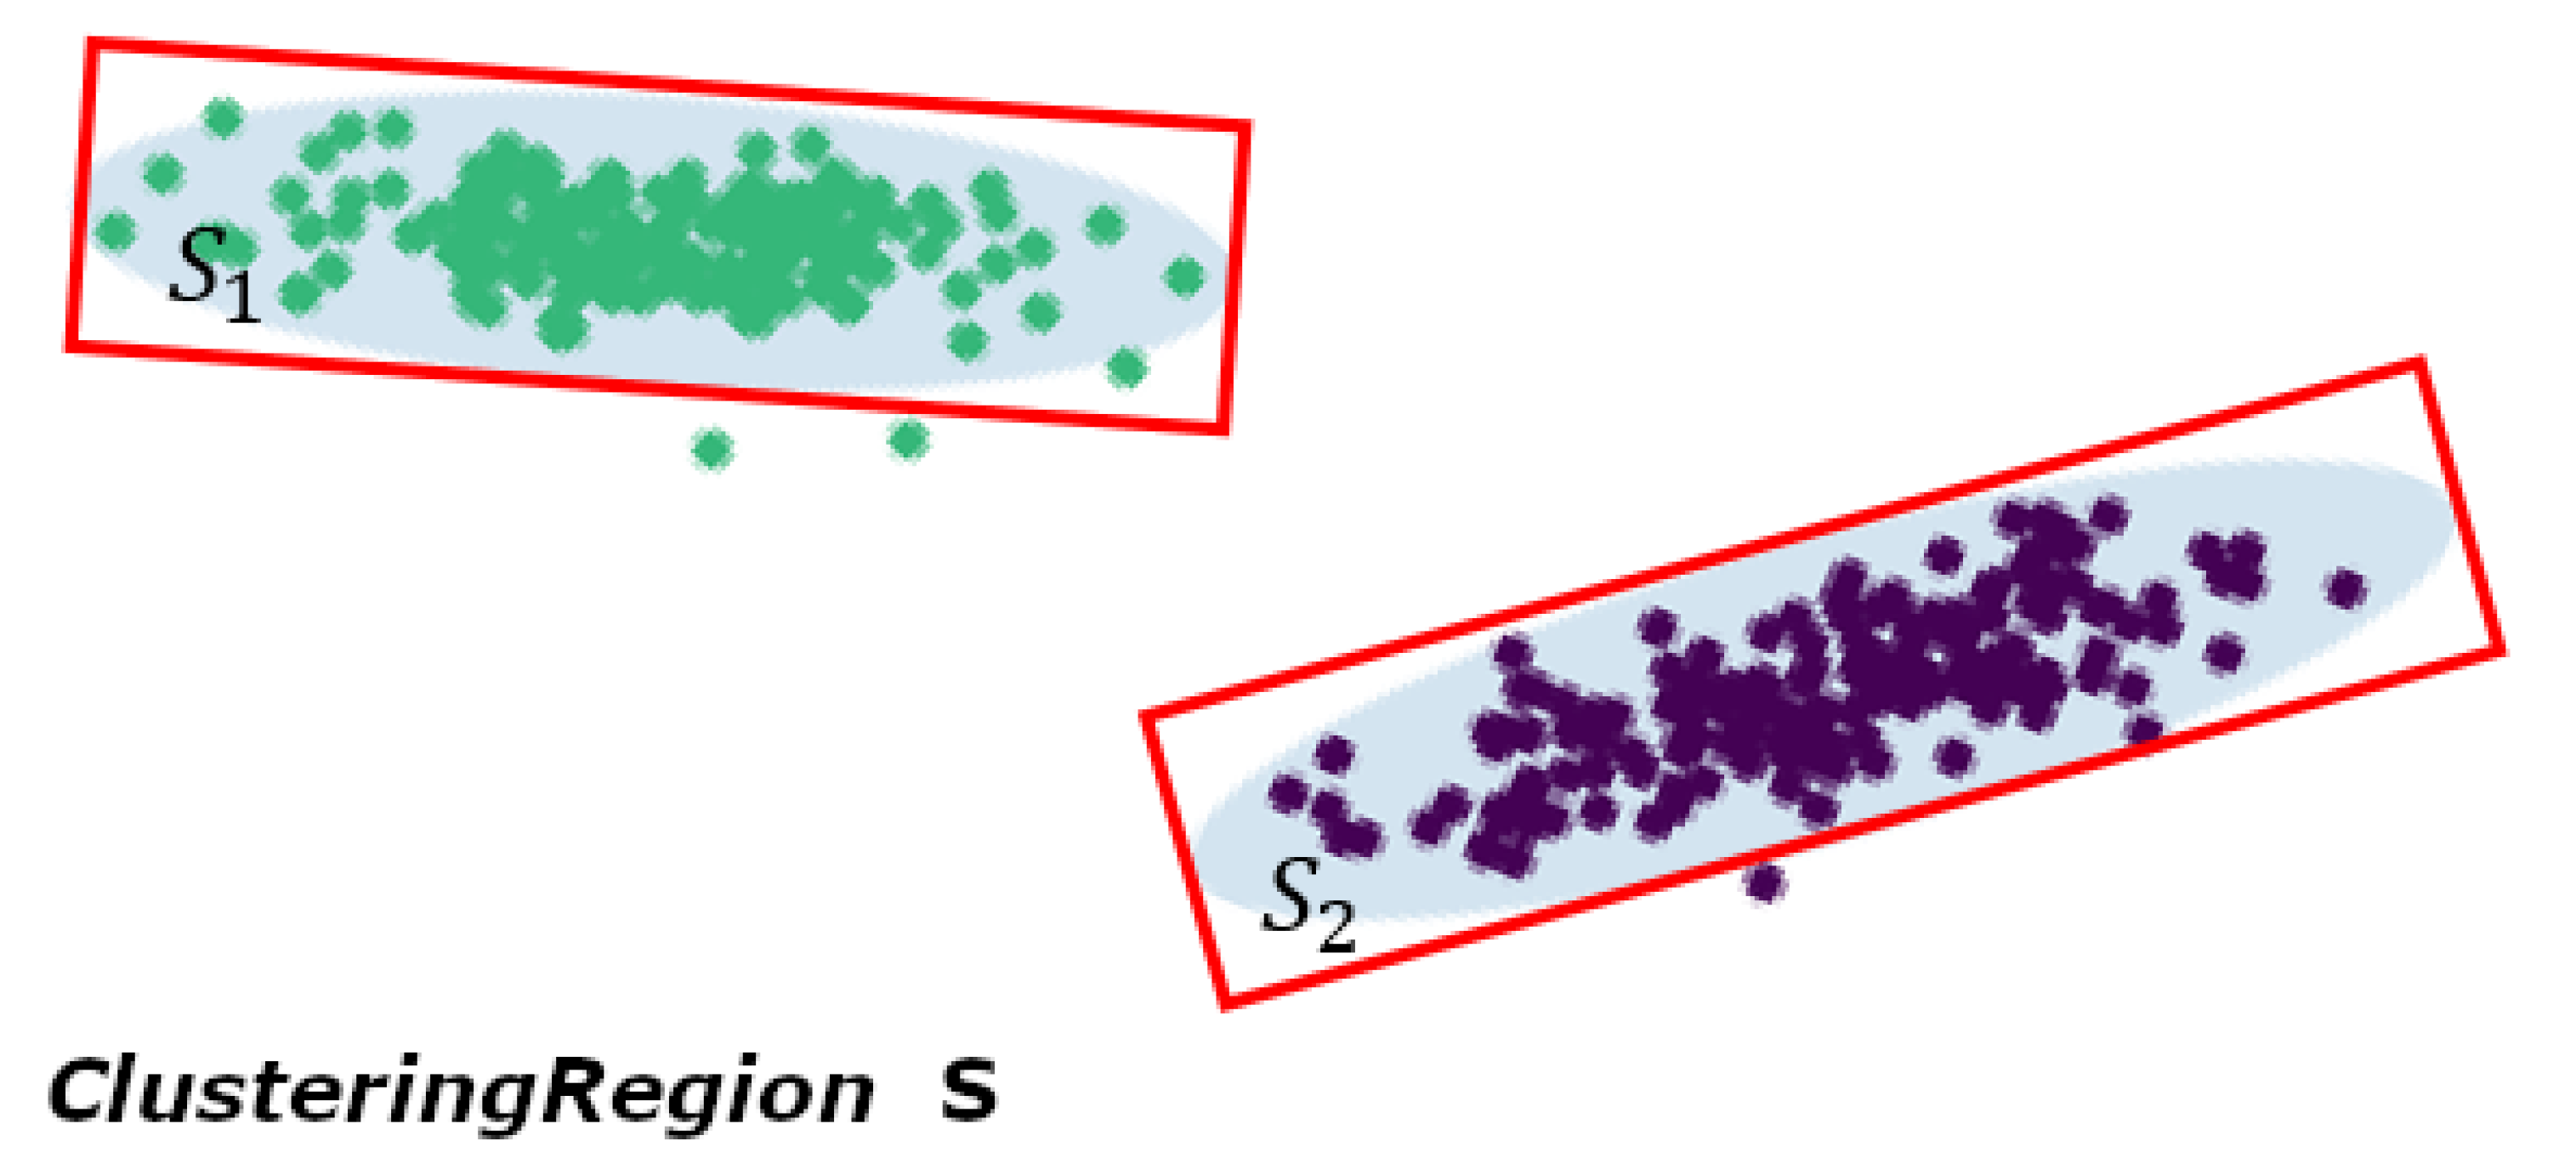
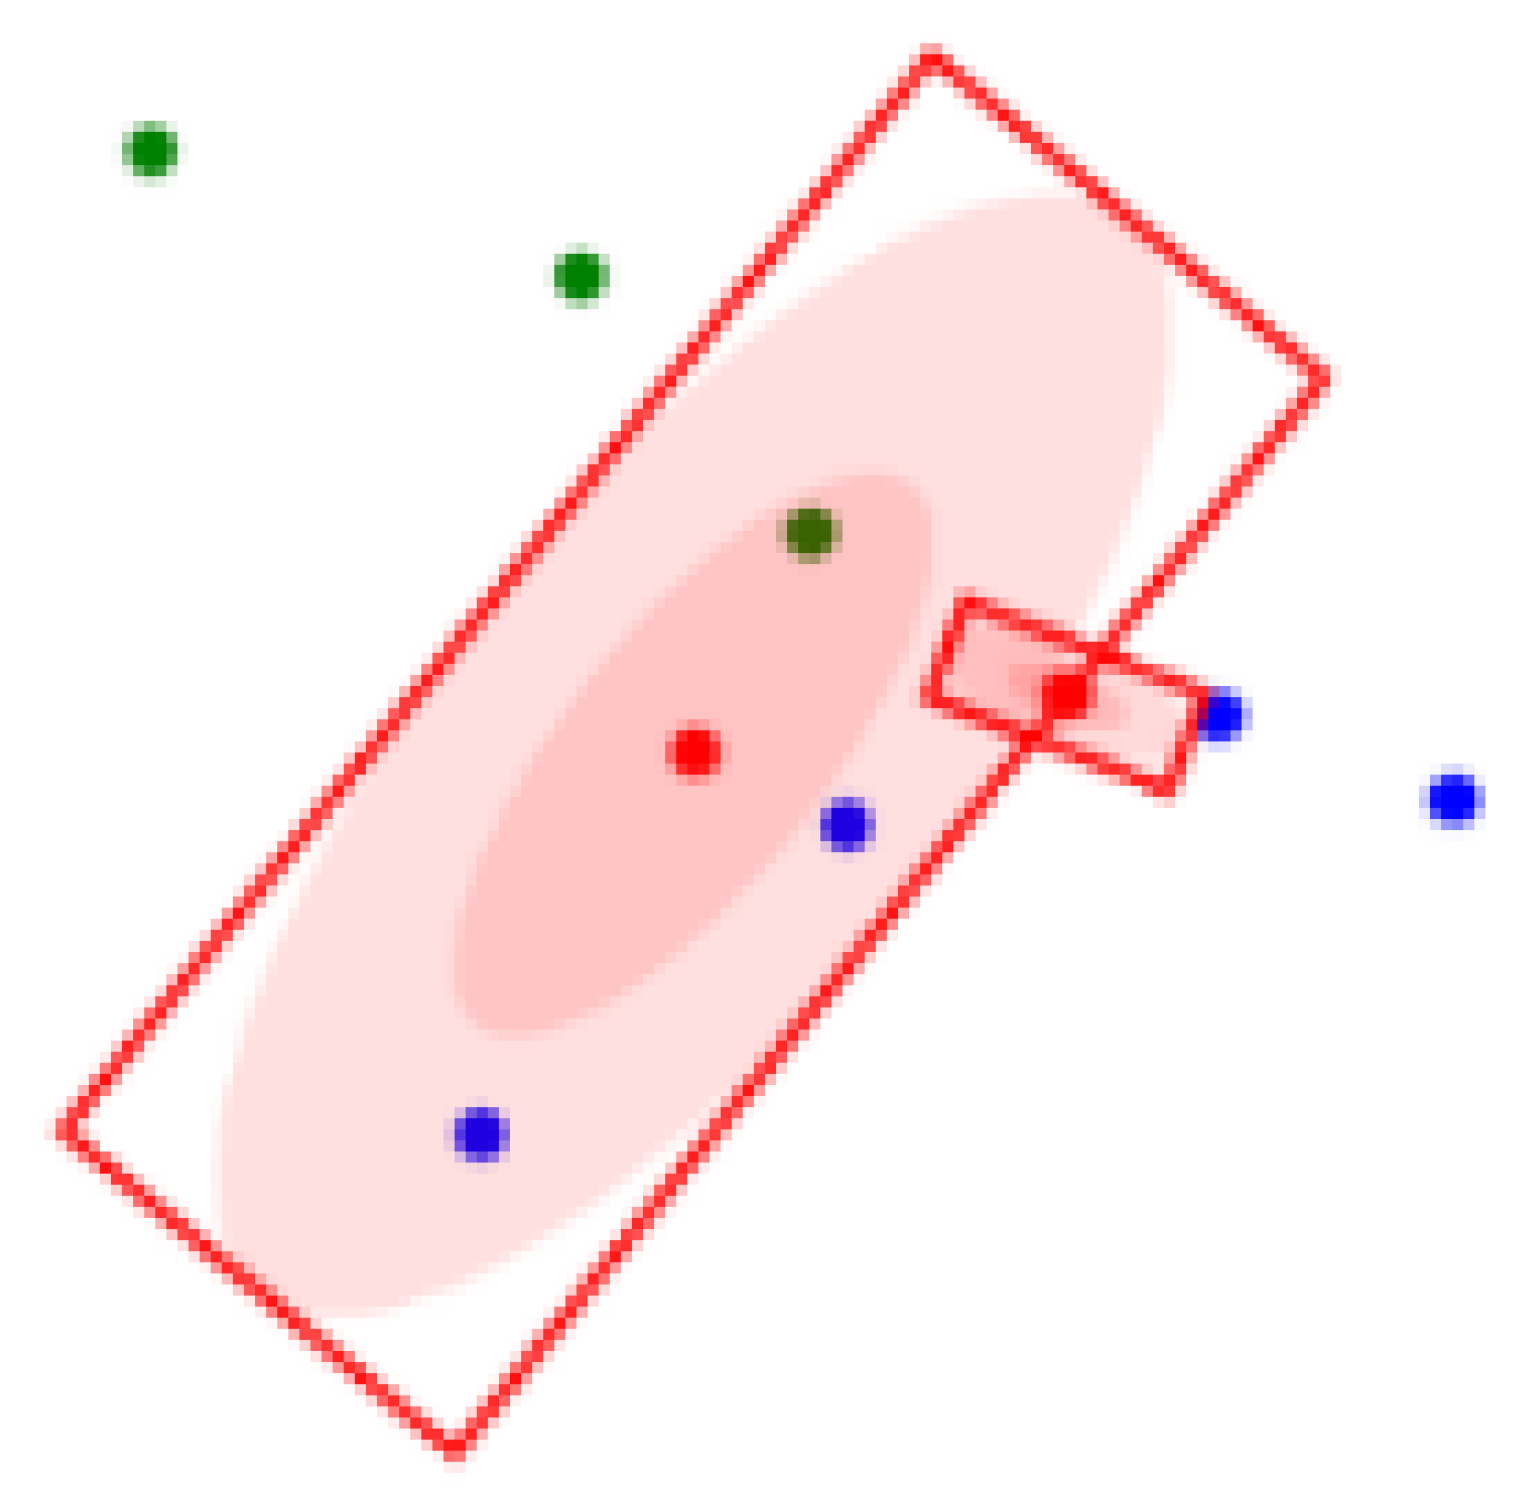
Definition 3. Let be a set of clustering regions. Then , where means the set of vertex coordinates of rectangular region, means the weight of Clustering region k. Figure 2 shows the definitions of with graphical examples. 4. Methodology
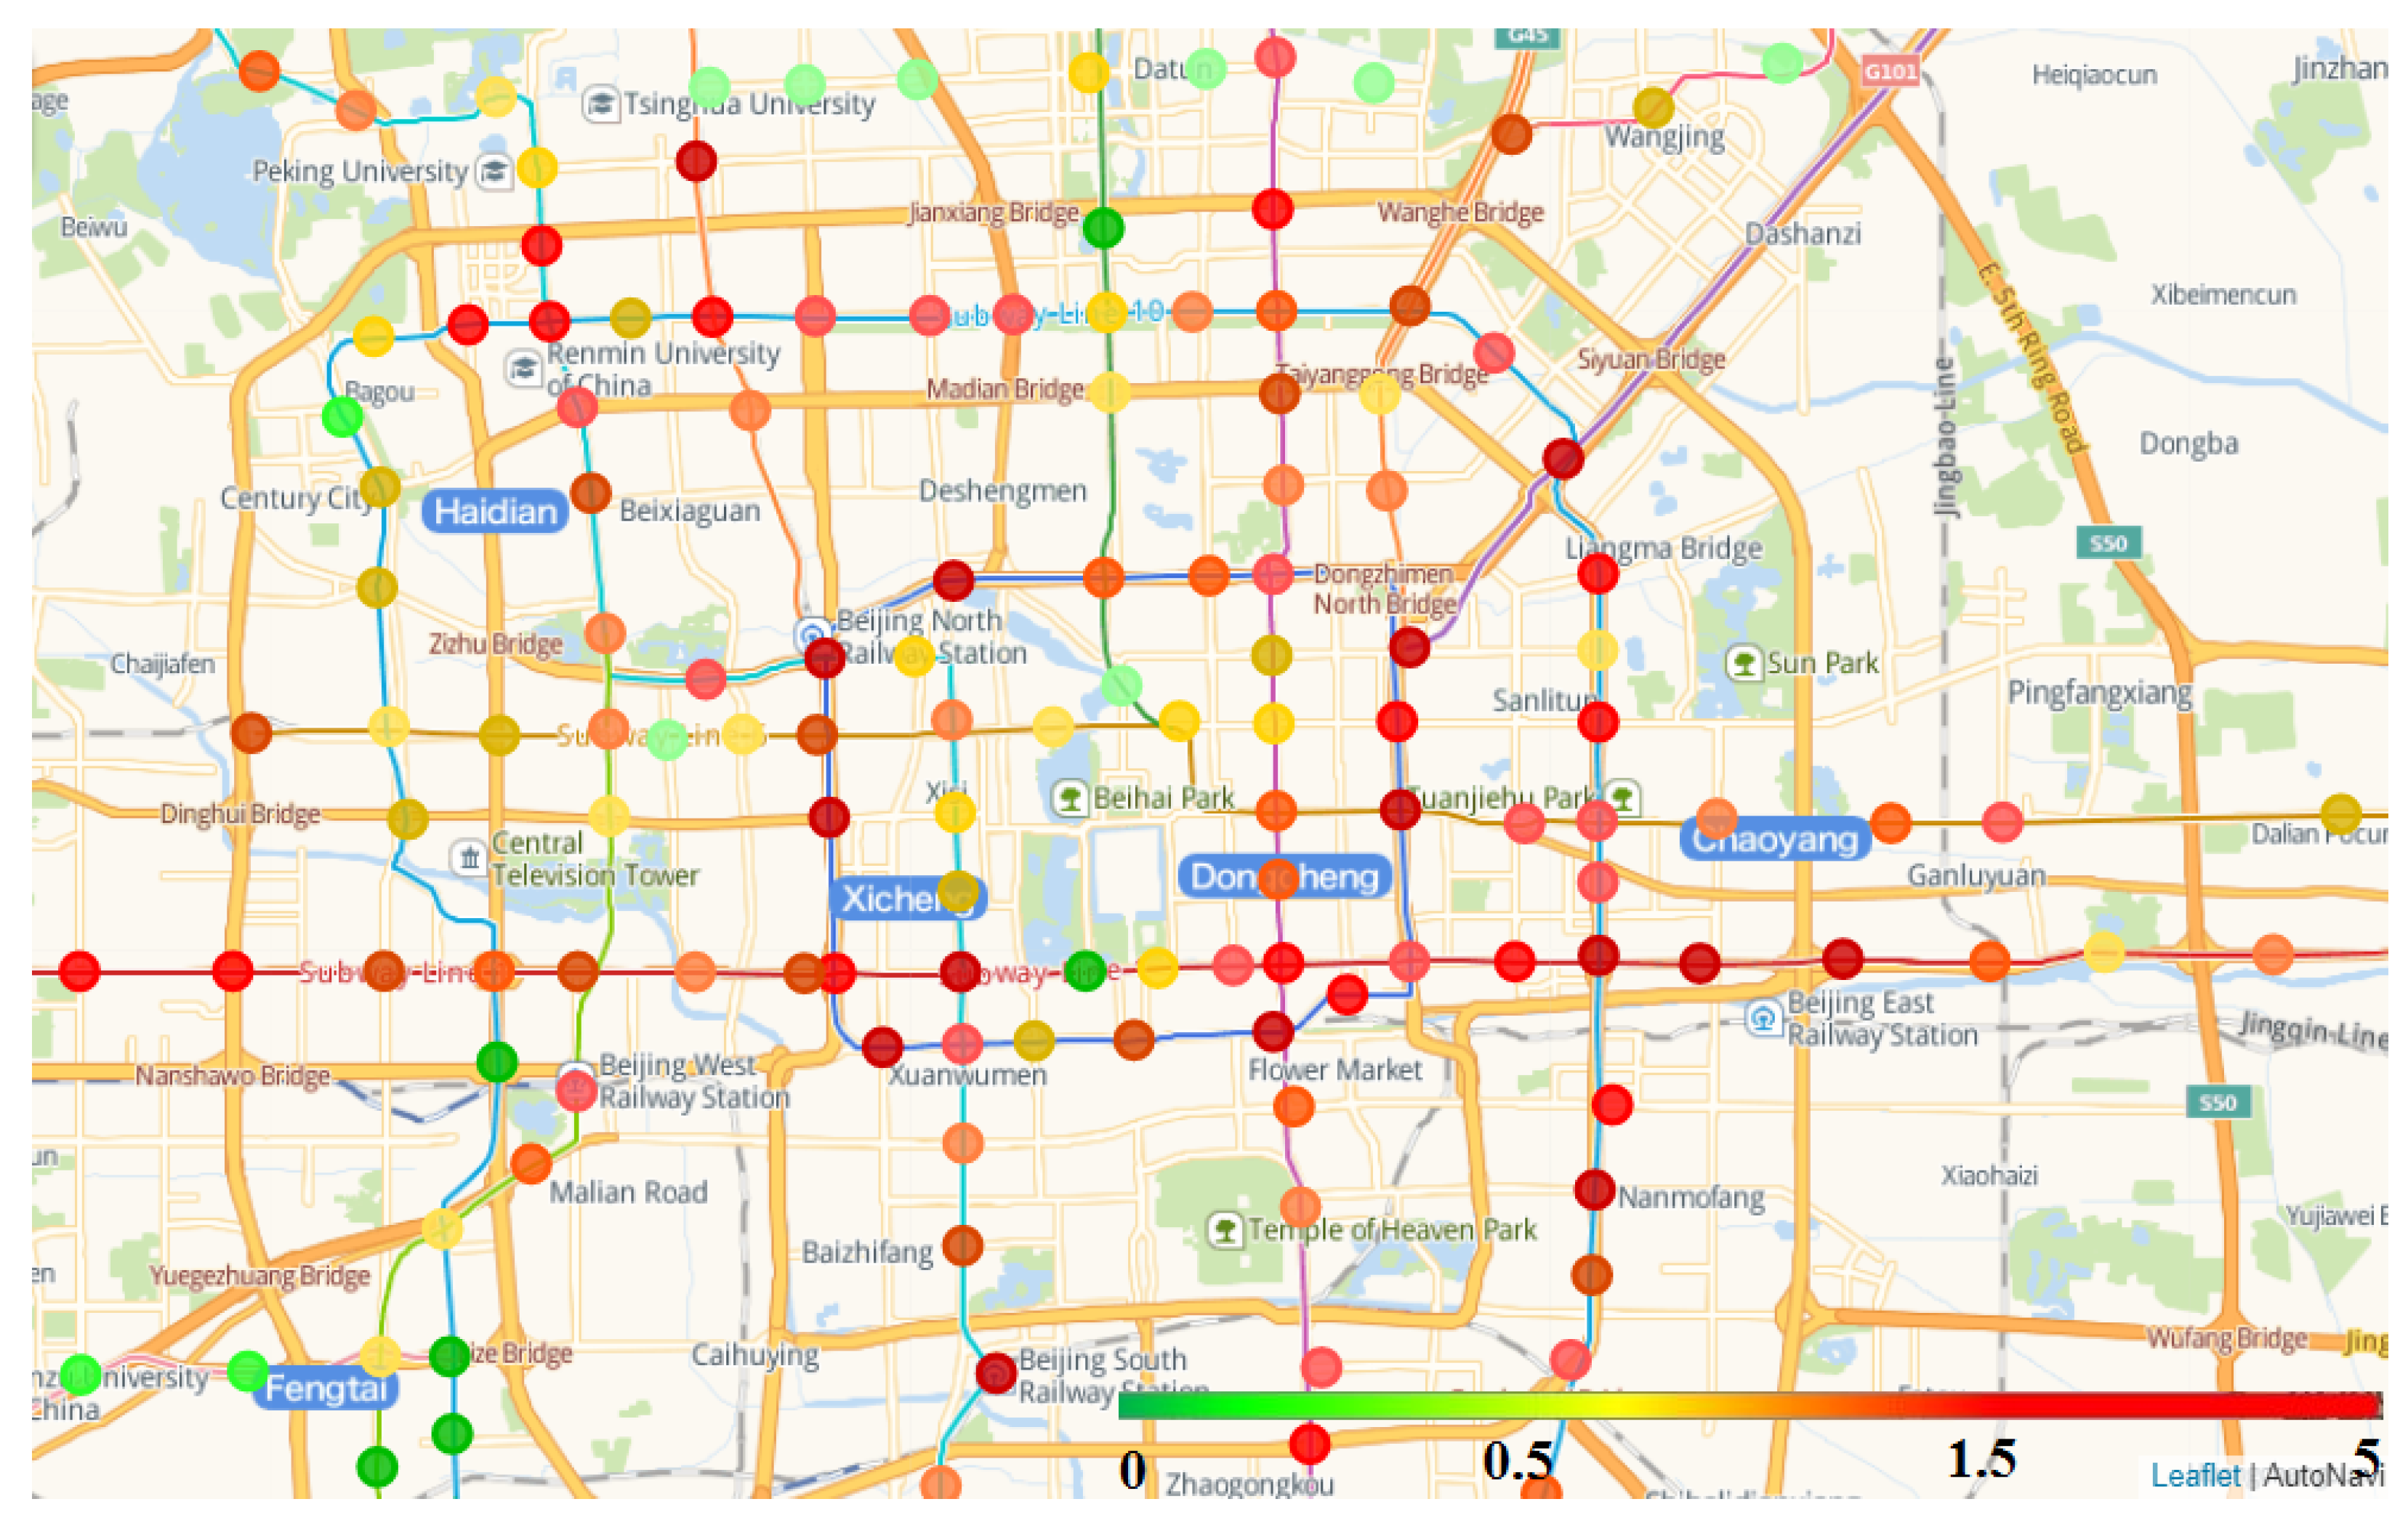
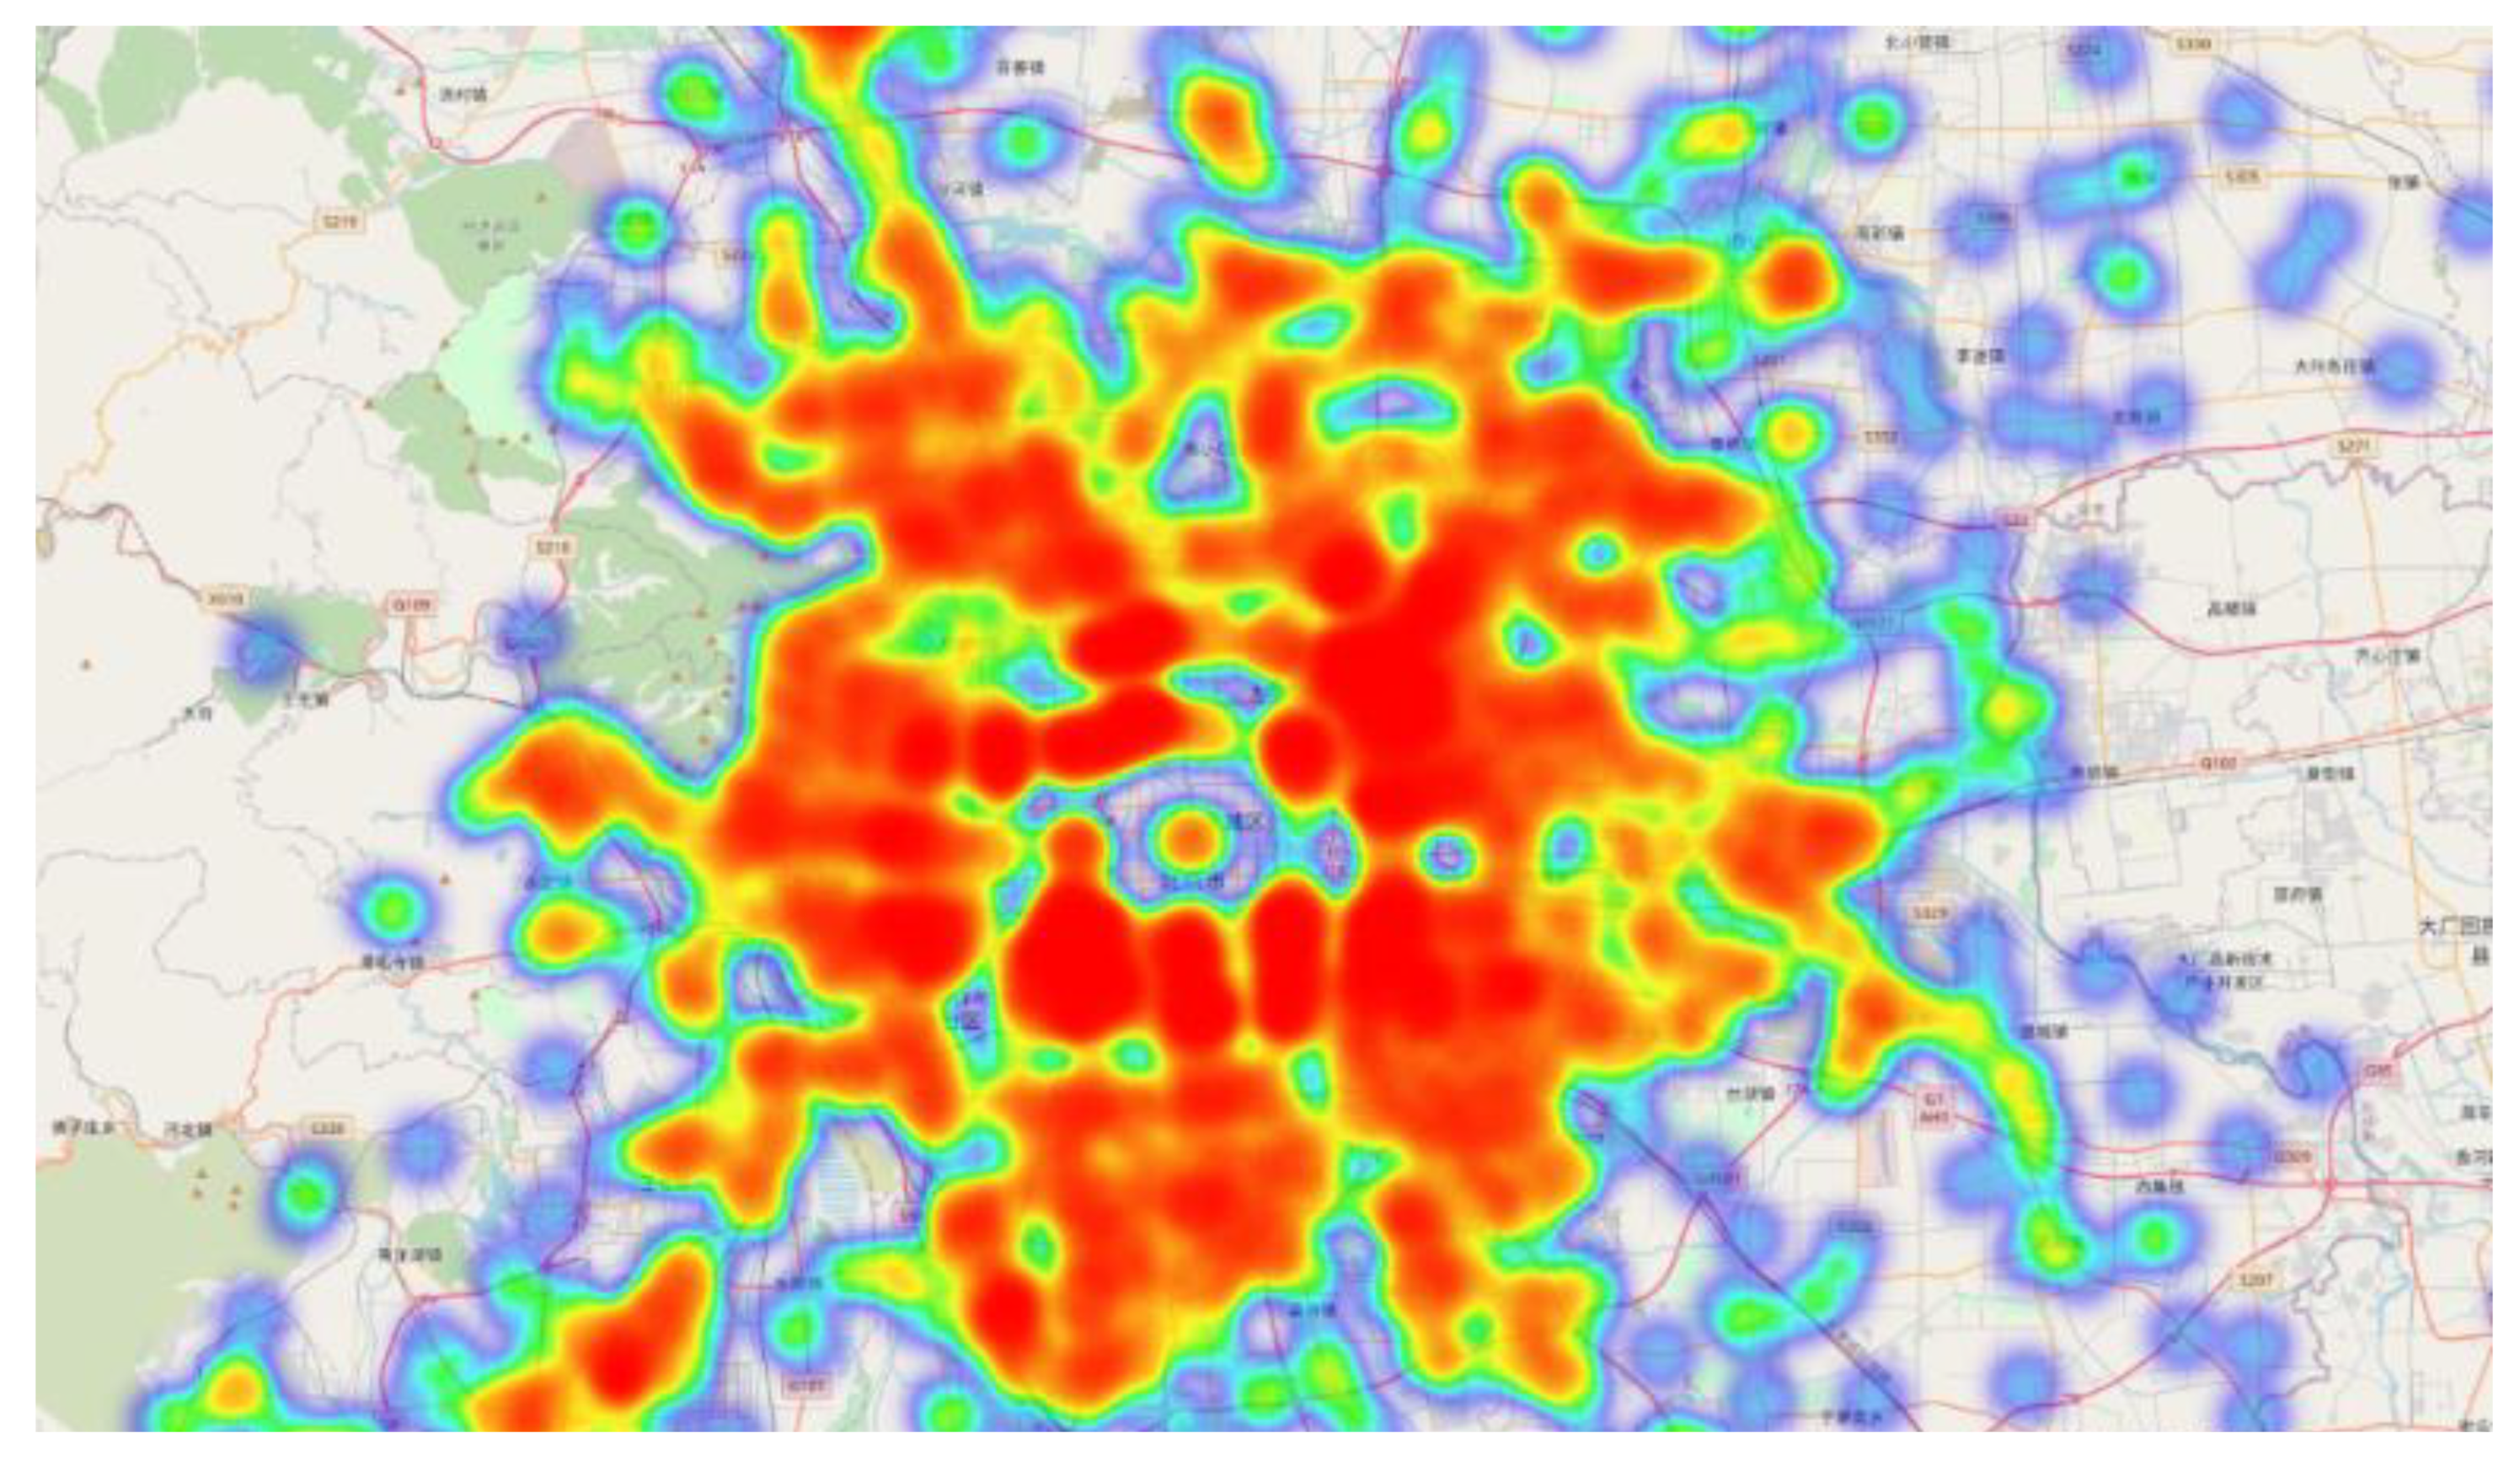
Because the OD distribution data of taxis is mainly affected by the density of the urban road network and the density of the urban POI, we assume that taxi OD data in Beijing is generally two-dimensional Gaussian distribution, that is, the closer to the city center, the higher the OD data density as shown in
Figure 3. It shows the distribution of pick-up and drop-offs in areas beyond the coverage of existing subway stations, the deeper the red color, the more trip demand in this area. On the other hand, beyond the coverage of existing subway stations, the places with high dense of pick-up and drop-off points have higher travel demand, meanwhile, the existing rail transit does not cover it, so it may become a new transit station. And our goal is to extract these areas by following method:
Classify the OD data of taxis according to the coverage of subway stations.
Do GMM clustering for OD data which are beyond the coverage, and study the influence of different parameters on the prediction results.
Through leaderank algorithm, get some special station, and select O or D data included in the coverage of this station for experiments, to predict the future extension of the station.
In addition, in order to verify the experimental effect of this method, we select the data of the subway site in 2013 and the taxi OD data in the same period as the experimental data, and use this method to predict the new site and planned site after 2013.
4.1. GMM Model
The GMM clustering method assumes that the spatial probability distribution of taxi OD data points can be approximated by multiple Gaussian distribution probability functions. It is a probability distribution model with the following form
where in Equation (
1)
,
,
is Gauss distribution density and
means the
kth component in the mixed model. For each sub model, we need to find the parameter
,
,
. That is, the expectation, covariance and weight of each sub model in the mixed model. However, these parameters can not be directly calculated by derivation. Therefore, we use Expectation-Maximization algorithm, which was summarized and proposed by Dempster et al. [
29] to iterate.
When we use the Gaussian mixture clustering method based on Python sklearn library, we need to determine the parameter the number of components
in GMM model. How to determine this parameter will be discussed in detail in
Section 5.5.
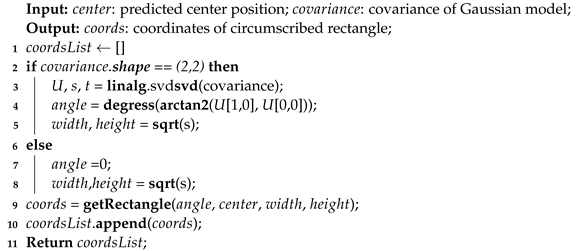
In addition, in order to visualize the clustering region as shown in
Figure 4, we get the circumscribed rectangle of the clustering region to make it convenient for our follow-up research through the following algorithm.
4.2. Weighted LeaderRank Passenger Flow Model
For evaluating the importance of stations through Auto Fare Collection(AFC) system data, the traditional method is to use statistical methods to calculate the number of people entering and leaving each station, and to rank the stations by the number of passenger flows. This method uses relatively static factors as the basis for site evaluation, and does not consider the direction of passenger travel and the impact of the dynamic and complex network link relationship formed by passenger travel on the site. The advantage of LeaderRank is that it considers the number of passengers at the station as well as the flow of passengers.
AFC system records passengers’ on-off station and time information, and the passengers flow between each station and station constitutes a directed weighted network, each station can be seen as a node in the network, while inbound and outbound stations in the AFC data can be seen as links to these nodes. Therefore, we will use weighted LeaderRank algorithm to quantify the importance of each subway station in the whole subway Network. For stations with higher Weighted LeaderRank (WLR) values, the station is busy throughout the subway network.
In this paper, we use Beijing subway as experimental case and define the weighted LeaderRank index equation for a station
i as:
where in Equations (
3) and (
4),
is the total passenger flow from station
j. This equation describes the process of allocating and acquiring values. When Equation (
3) iterates
times and tends to converge, the equation stops.
5. Analysis and Mining of Future Station Areas Based on Taxi OD
In this section, we will analyze and mining of future station areas based on taxi OD. First, the driving trajectory taxi are cleaned. Then, we calculate each passenger origin (O) and destination (D) during the subway operating hours. In addition, according to the coverage of the established subway stations, we classify the OD data and use Gaussian Mixture Model to predict the regional scope and route planning of future stations. Finally, we make statistical analysis of land use characteristics in some of the predicted regions.
5.1. Trajectory Data Cleanup
The trajectory data of the taxi comes from the GPS satellite positioning system on 21,590 taxis of a taxi company in Beijing. The data contains the driving data of each vehicle in June 2013 (terminal ID, license plate number, generation time, latitude and longitude, Speed, vehicle status, etc.).
Table 1 shows the structure of this data.
Taxi data preprocessing is divided into the following steps:
Because the GPS system has certain errors, it is necessary to correct the taxi’s GPS raw data to improve the GPS positioning accuracy. The longitude and latitude offsets are −0.002 456 degrees and 0.002 241 degrees, respectively;
We sorted taxi GPS data by license plate and dropped out exception data includes deleting attributes unrelated to the study in this paper, GPS status exception data, wrong license plate ID and wrong record time;
The approximate area of Beijing is located at 115.7 to 117.4 degrees longitude East and 39.4 to 41.6 degrees latitude north. In this area, we eliminated data collected from GPS trajectory data that is beyond the latitude and longitude boundaries in order to reduce data redundancy;
We obtained the travel OD data of taxis, and excluded the data whose travel time is outside the subway operating time (6:00–22:00). Each row of the finally obtained data includes the vehicle id, pick-up/drop-off time and location.
A complete service period of a taxi starts from the time when passengers get on and ends at the destination. In our experiment, the OD data also contains other attributes like ID, Start Time, pick-up location, End Time, drop-off location.
5.2. Beijing Subway Station
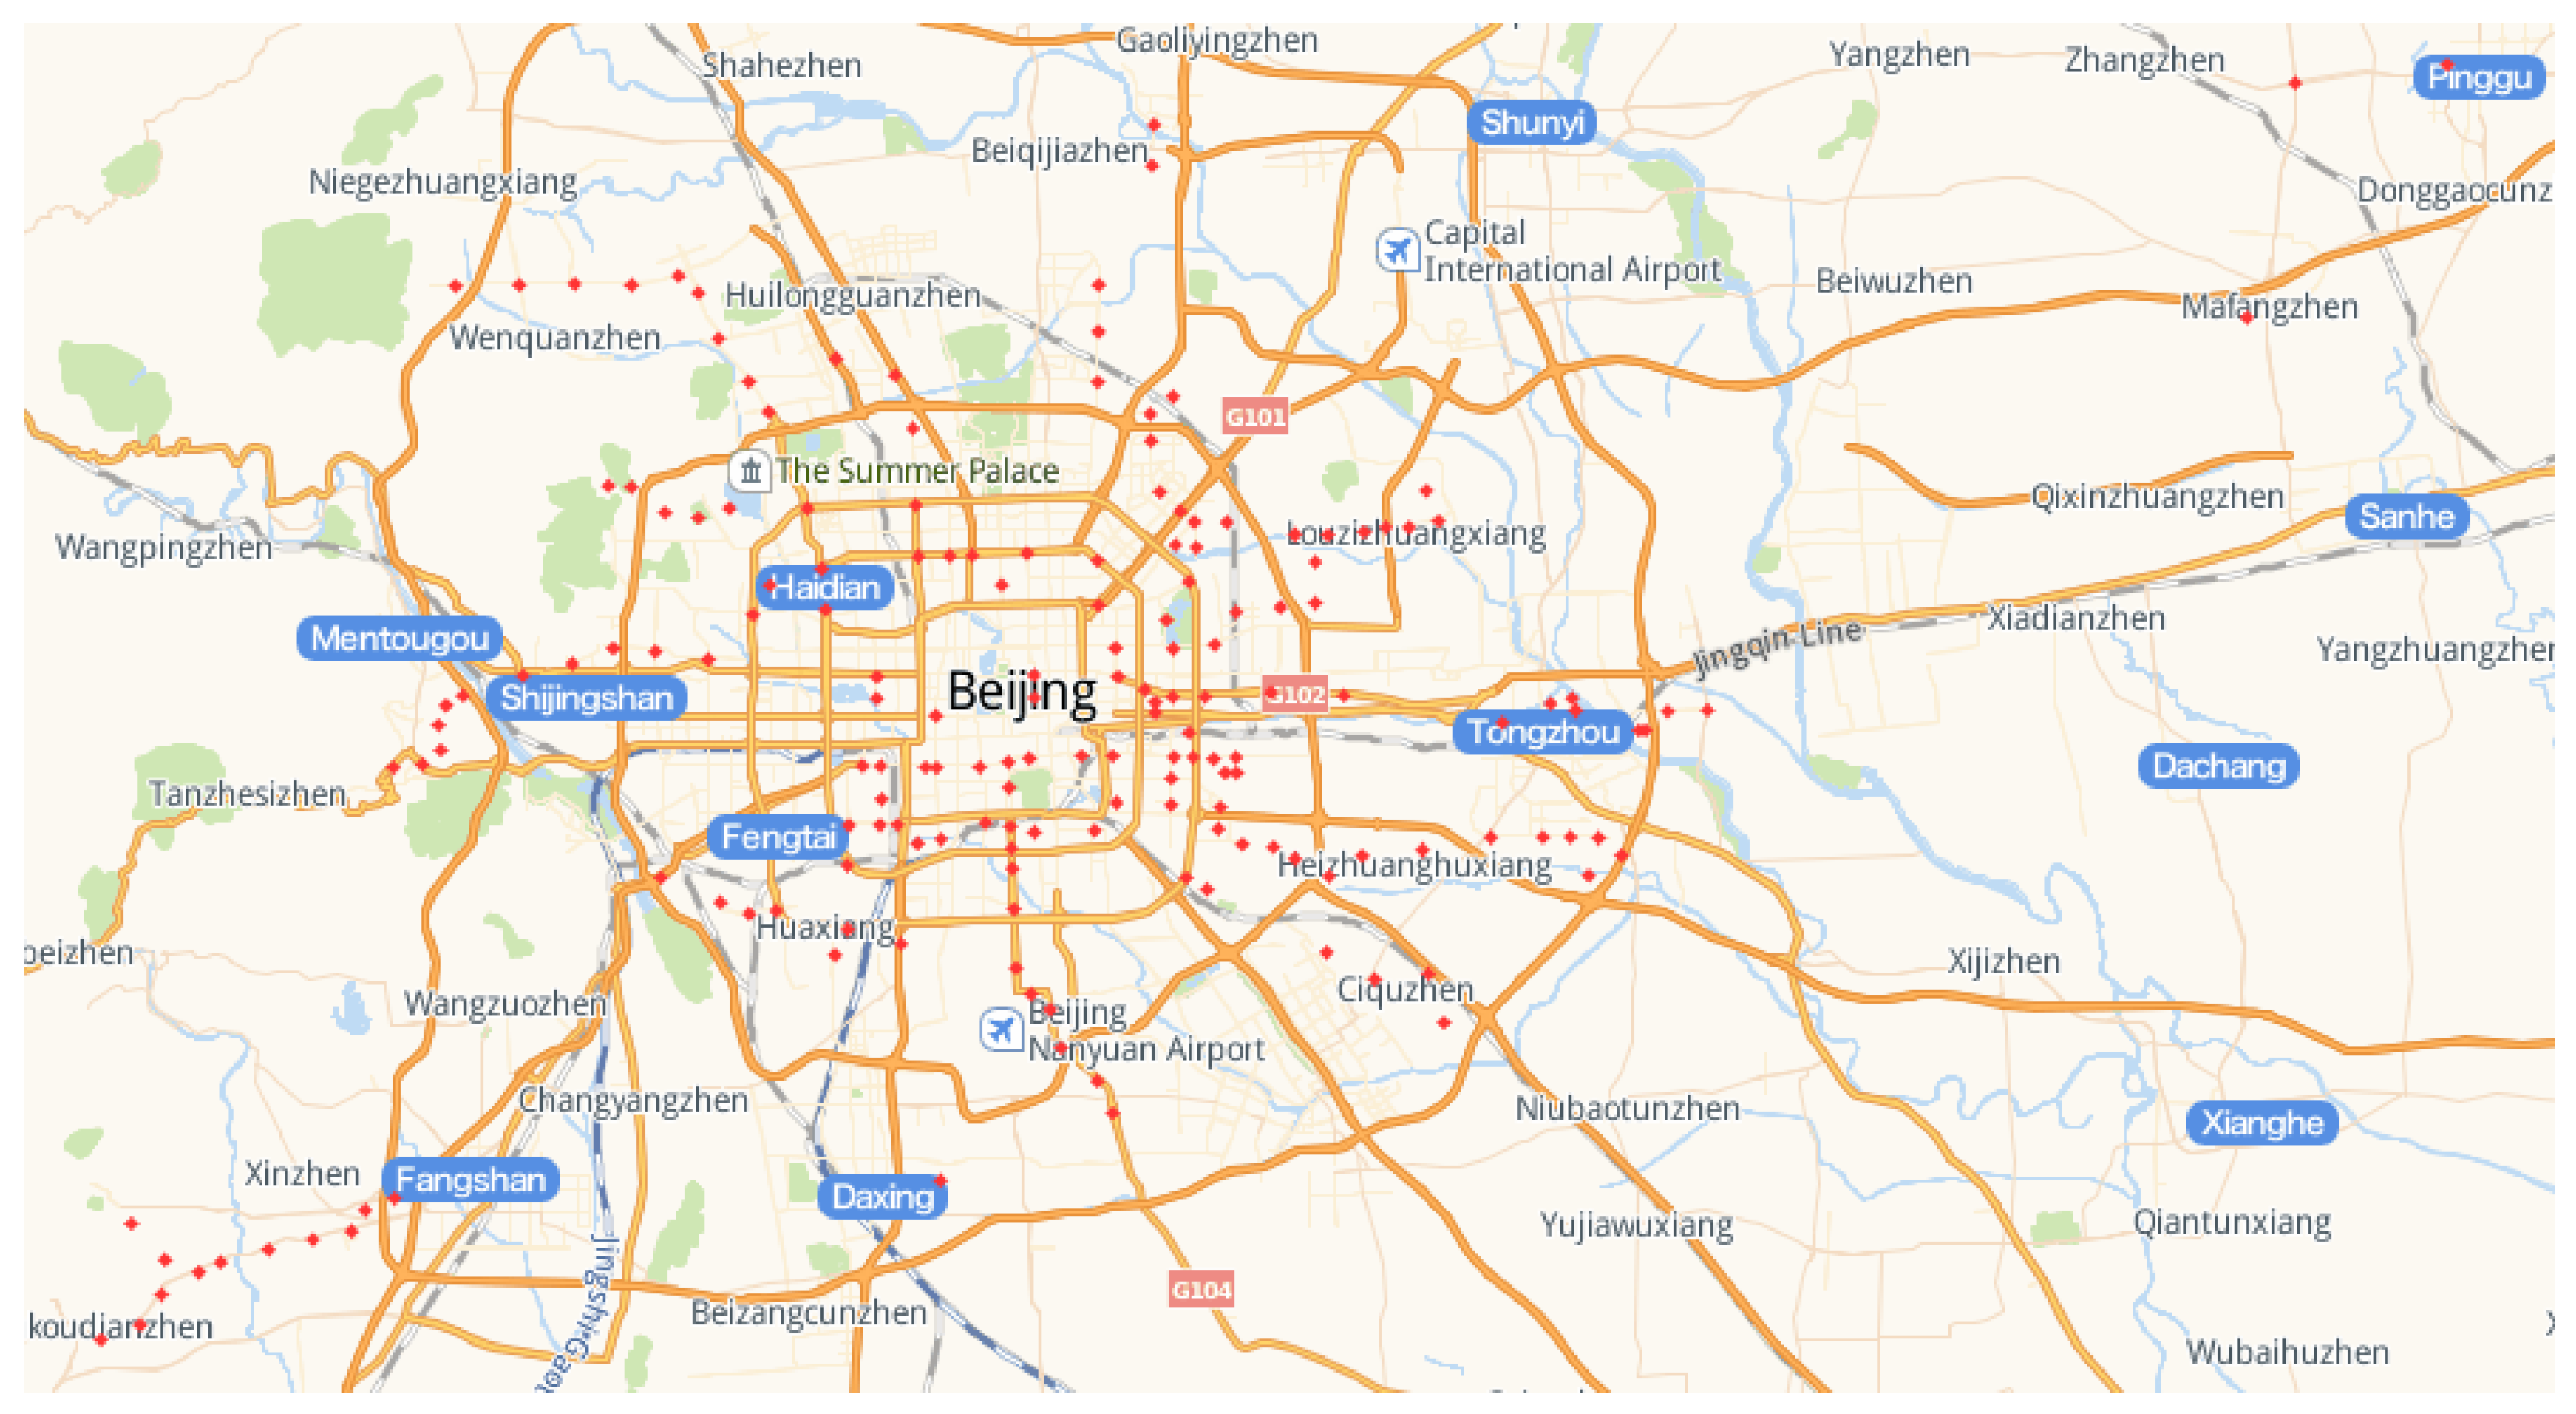
The subway station data in Beijing is obtained by capturing the information related to the Goode map. For our experiment, the new subway stations built from 2013 to 2020 (96 stations) and the planning subway stations (84 stations) as shown in
Figure 5.
According to the subway stations that have been built in 2013, we assume that the coverage area of the station is a circle with a radius of 1 kilometer, and we divided the data into four categories according to whether the taxi OD is within the all coverage areas as shown in
Table 2.
5.3. Taxi ODs Analysis
After preprocessing the trajectory data of 21,590 taxis in Beijing, we have obtained more than 4 million OD data of taxis. From
Table 2, we can see that about half of the data are picked up or dropped off which is outside the coverage of the subway stations, so we believe that the existing subway stations do not fully meet people’s travel requirements; in addition, 30% of the taxi business pick-up or drop positions are outside the coverage of the subway stations. Therefore, we can assume that some passengers choose to use the subway station as their destination (or departure point) and go to (or departure) areas that are not covered by the subway stations, while 16% of taxi business starting and disembarking points are outside the coverage of the subway station.
In general, the existing subway system does not fully meet people’s travel need, and a large proportion of people travel in areas outside the subway line coverage.
5.4. Location Prediction of Subway Stations
In this section, we will discuss how to use GMM model to select areas and sort existing subway stations with LeaderRank algorithm to predict future new subway lines and future extension of subway lines on the basis of existing subway stations.
From
Figure 3, we can see that the density of the data location points of the taxi ride decreases from the city center to the surroundings. From the perspective of the entire Beijing area, we can assume that the data presents a two-dimensional Gaussian state distribution, and for a small area, such as Chaoyang District, Dongcheng District, the data also present a Gaussian distribution. Therefore, this data type conforms to a mixed Gaussian distribution. In addition, we assume another situation, because some of our taxi OD data is outside the coverage of existing subway stations, and the higher denser of OD points are often have high possibility to build new subway stations, the distribution of the OD points also show a Gaussian distribution. For the data distributed in this form, we use Gaussian mixture model to cluster the data points, and predict and analyze the location area of the new subway station in the future.
First of all, through the weighted LeaderRank Equations (
3) and (
4), we calculate the LeaderRank score of each station.
Figure 6 shows the values of the LeadeRank for subway stations which built in 2013. The top 15 stations are as follows.
From
Table 3, a station with a higher LeaderRank score reflects its higher busyness in the subway network. Passengers are more likely to go from this station to other places or enter this station from outside areas. Therefore, it is necessary to establish a new station near the station to ease the passenger flow there, thereby extending the subway line.
5.5. Determining GMM Model Parameters
Bayesian information criterion (BIC) and Akaike information criterion (AIC) are commonly used to select model parameters. AIC and BIC both consider the covariance type and the number of components in the model. AIC chooses a good model to predict from the perspective of prediction, while BIC chooses the best model to fit the existing data from the perspective of fitting.
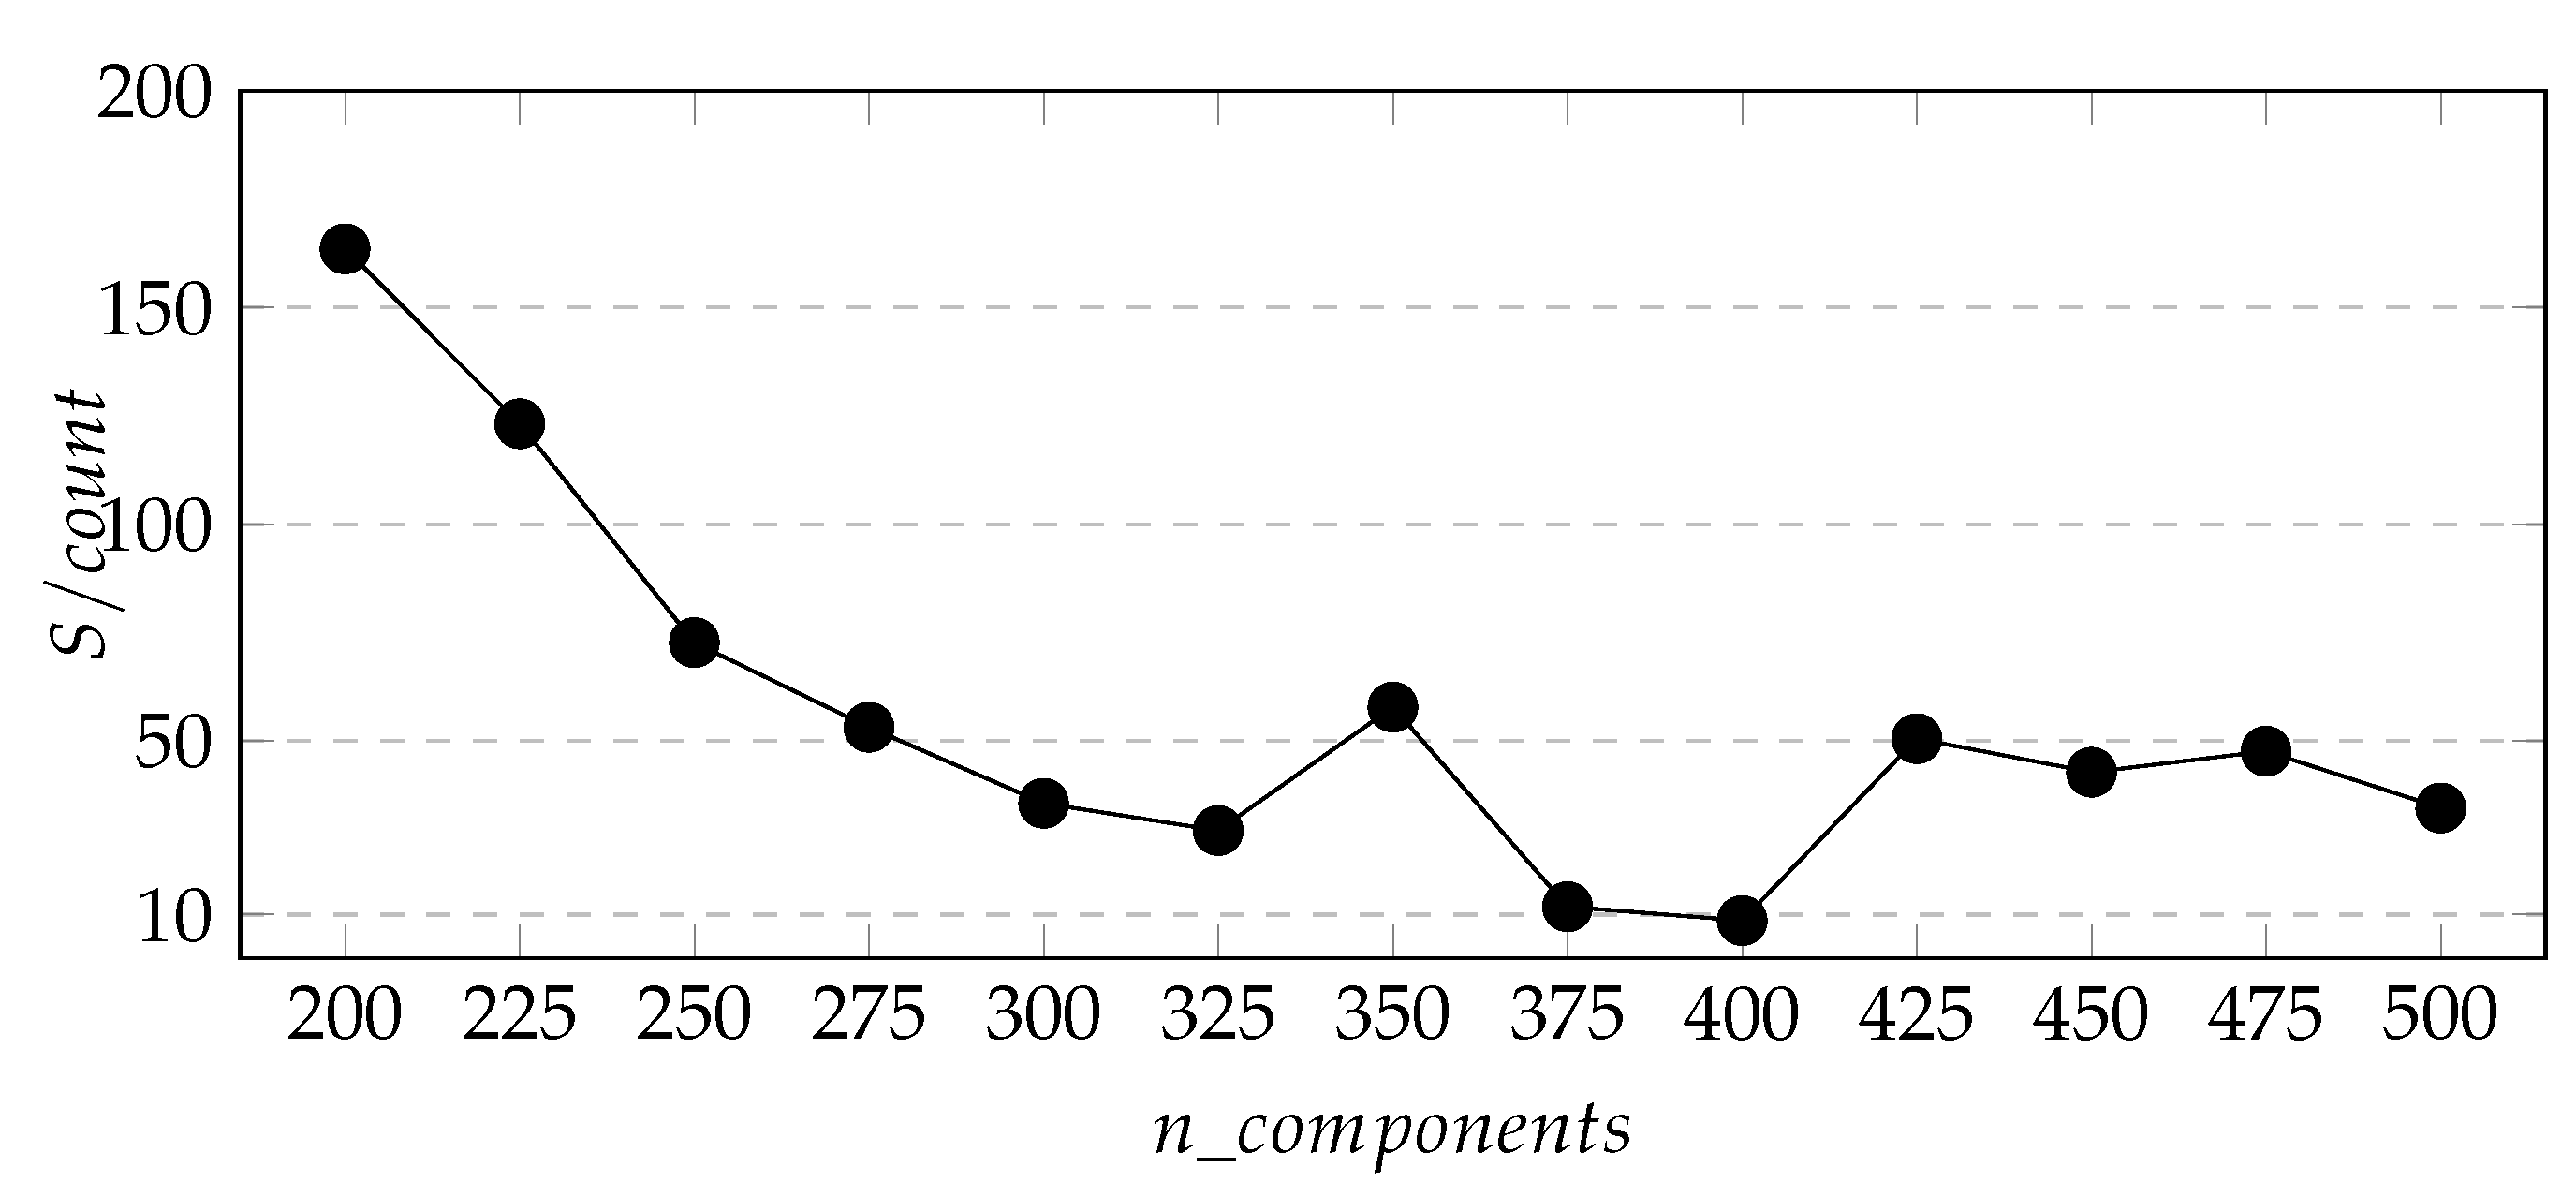
In practice, BIC is widely used, while in this study we plan to predict the 200 subway stations areas in the future. We obtained the clustering regions through the GMM model and Algorithm 1, sorted their weights in the mixed model and selected the
-200 regions. Considering how to select the appropriate parameter
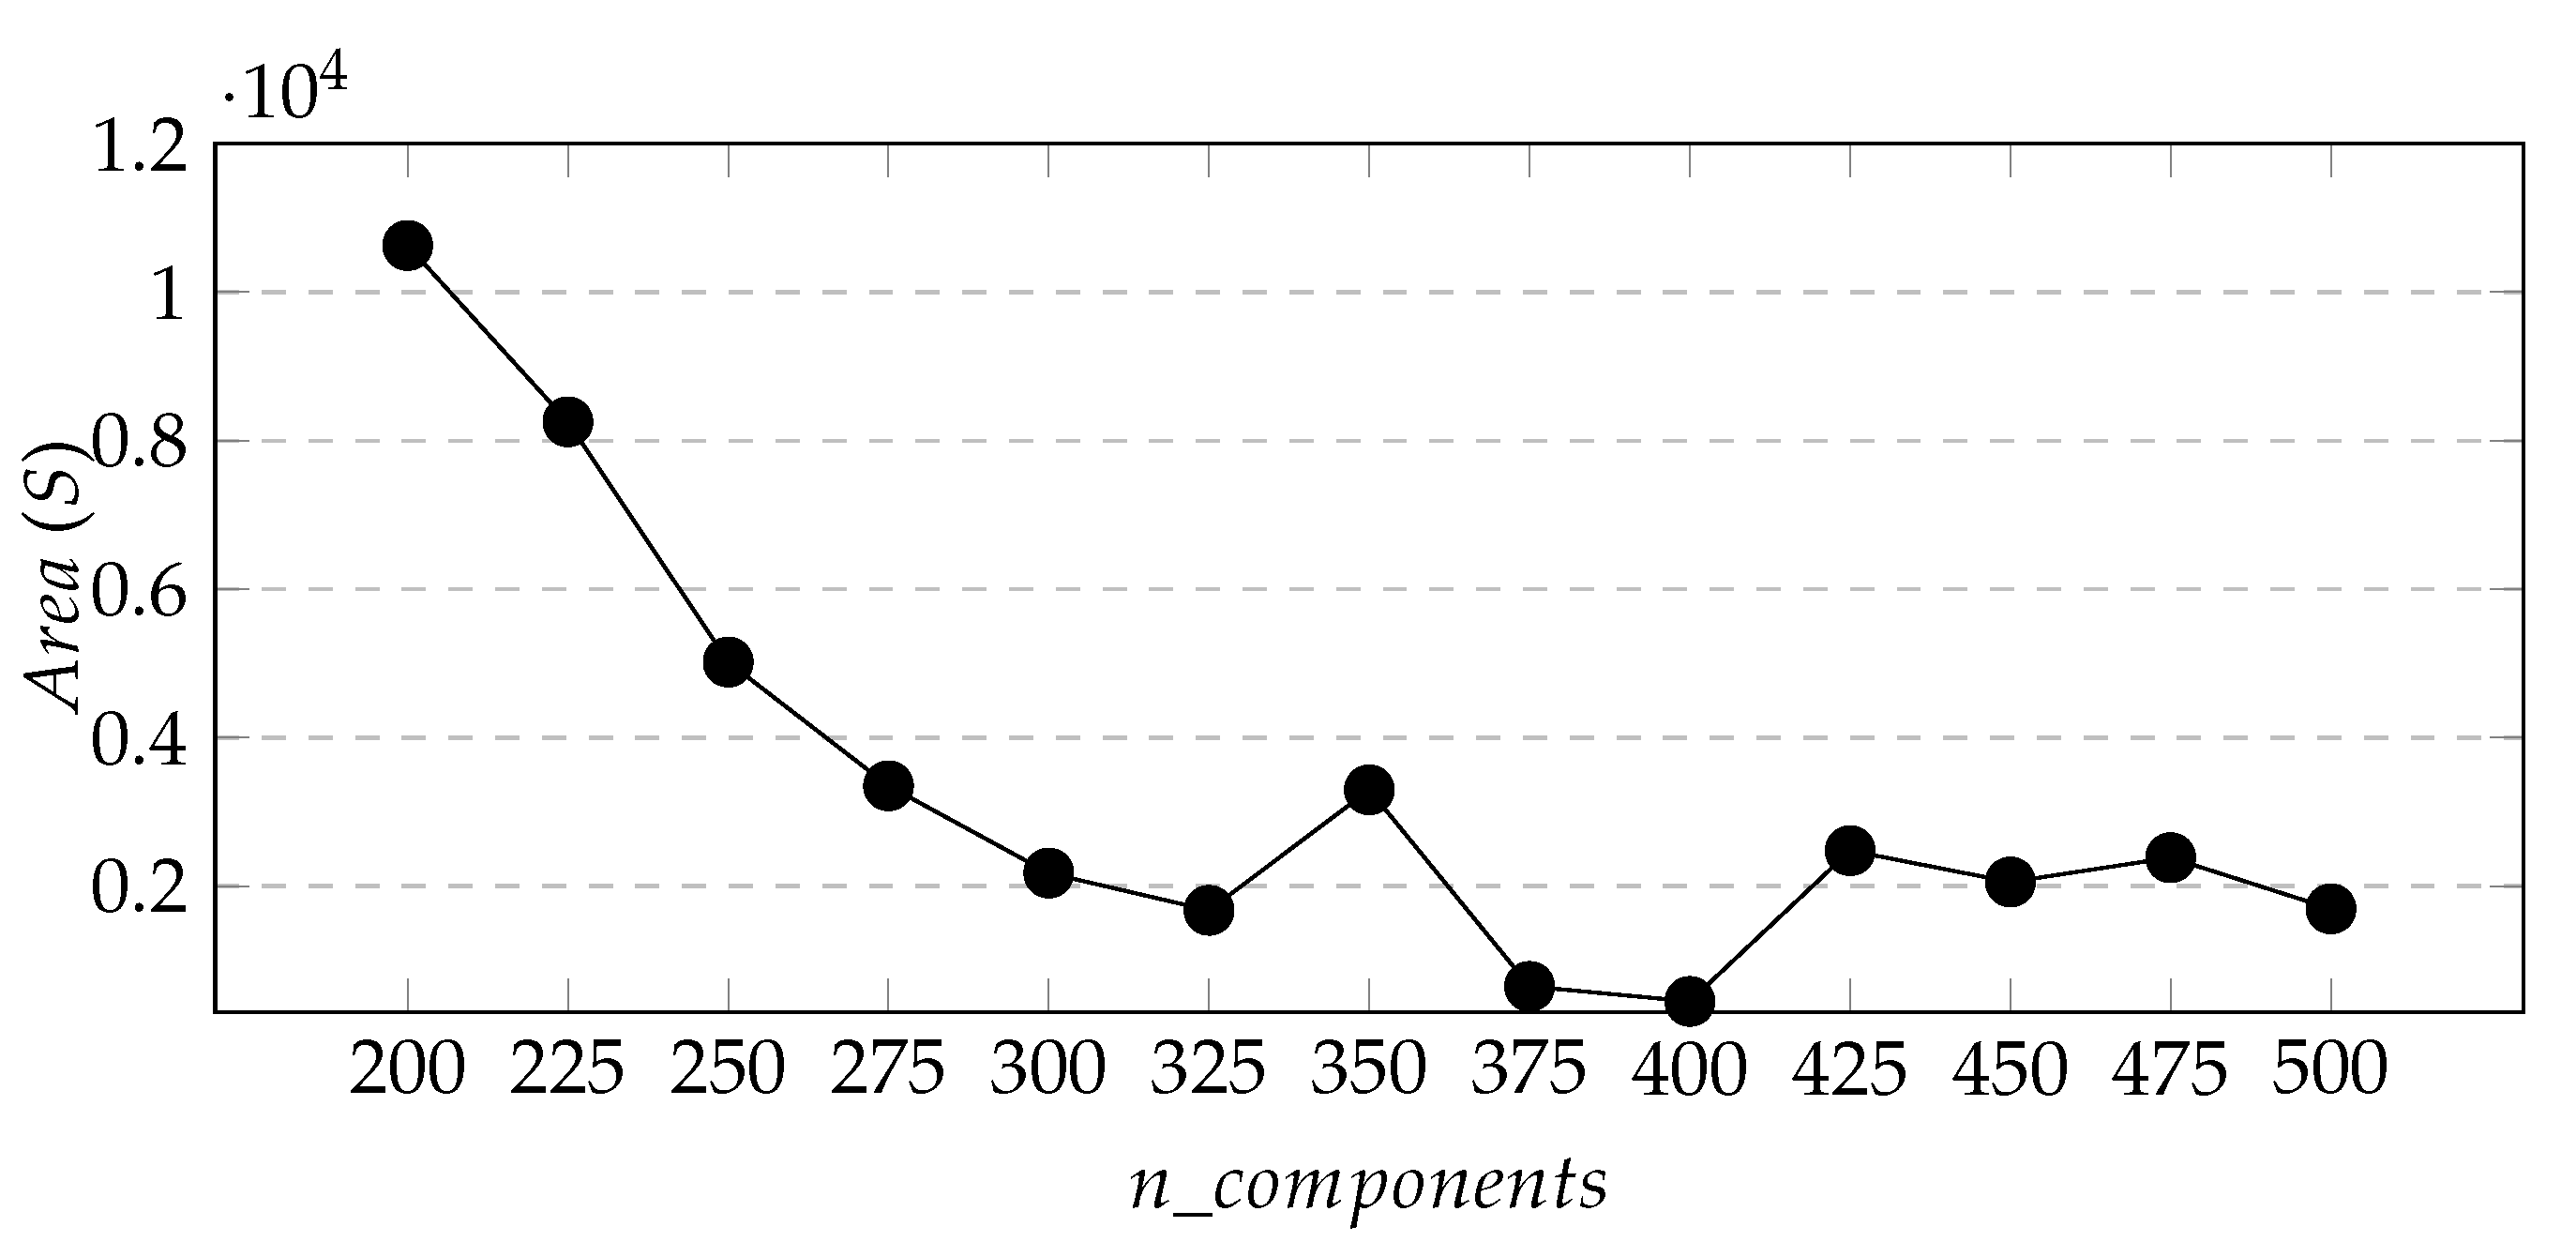
, so that as many of these 200 areas as possible will cover new subway stations in the future, while ensuring that the predicted total coverage is as small as possible. However, the BIC criterion does not solve this problem very well. In order to do this, we propose defining variables
as the number of actually subway stations we predict built from 2013 to 2020,
S as the area covered by all clustering regions, and
is the area occupied by each prediction station.
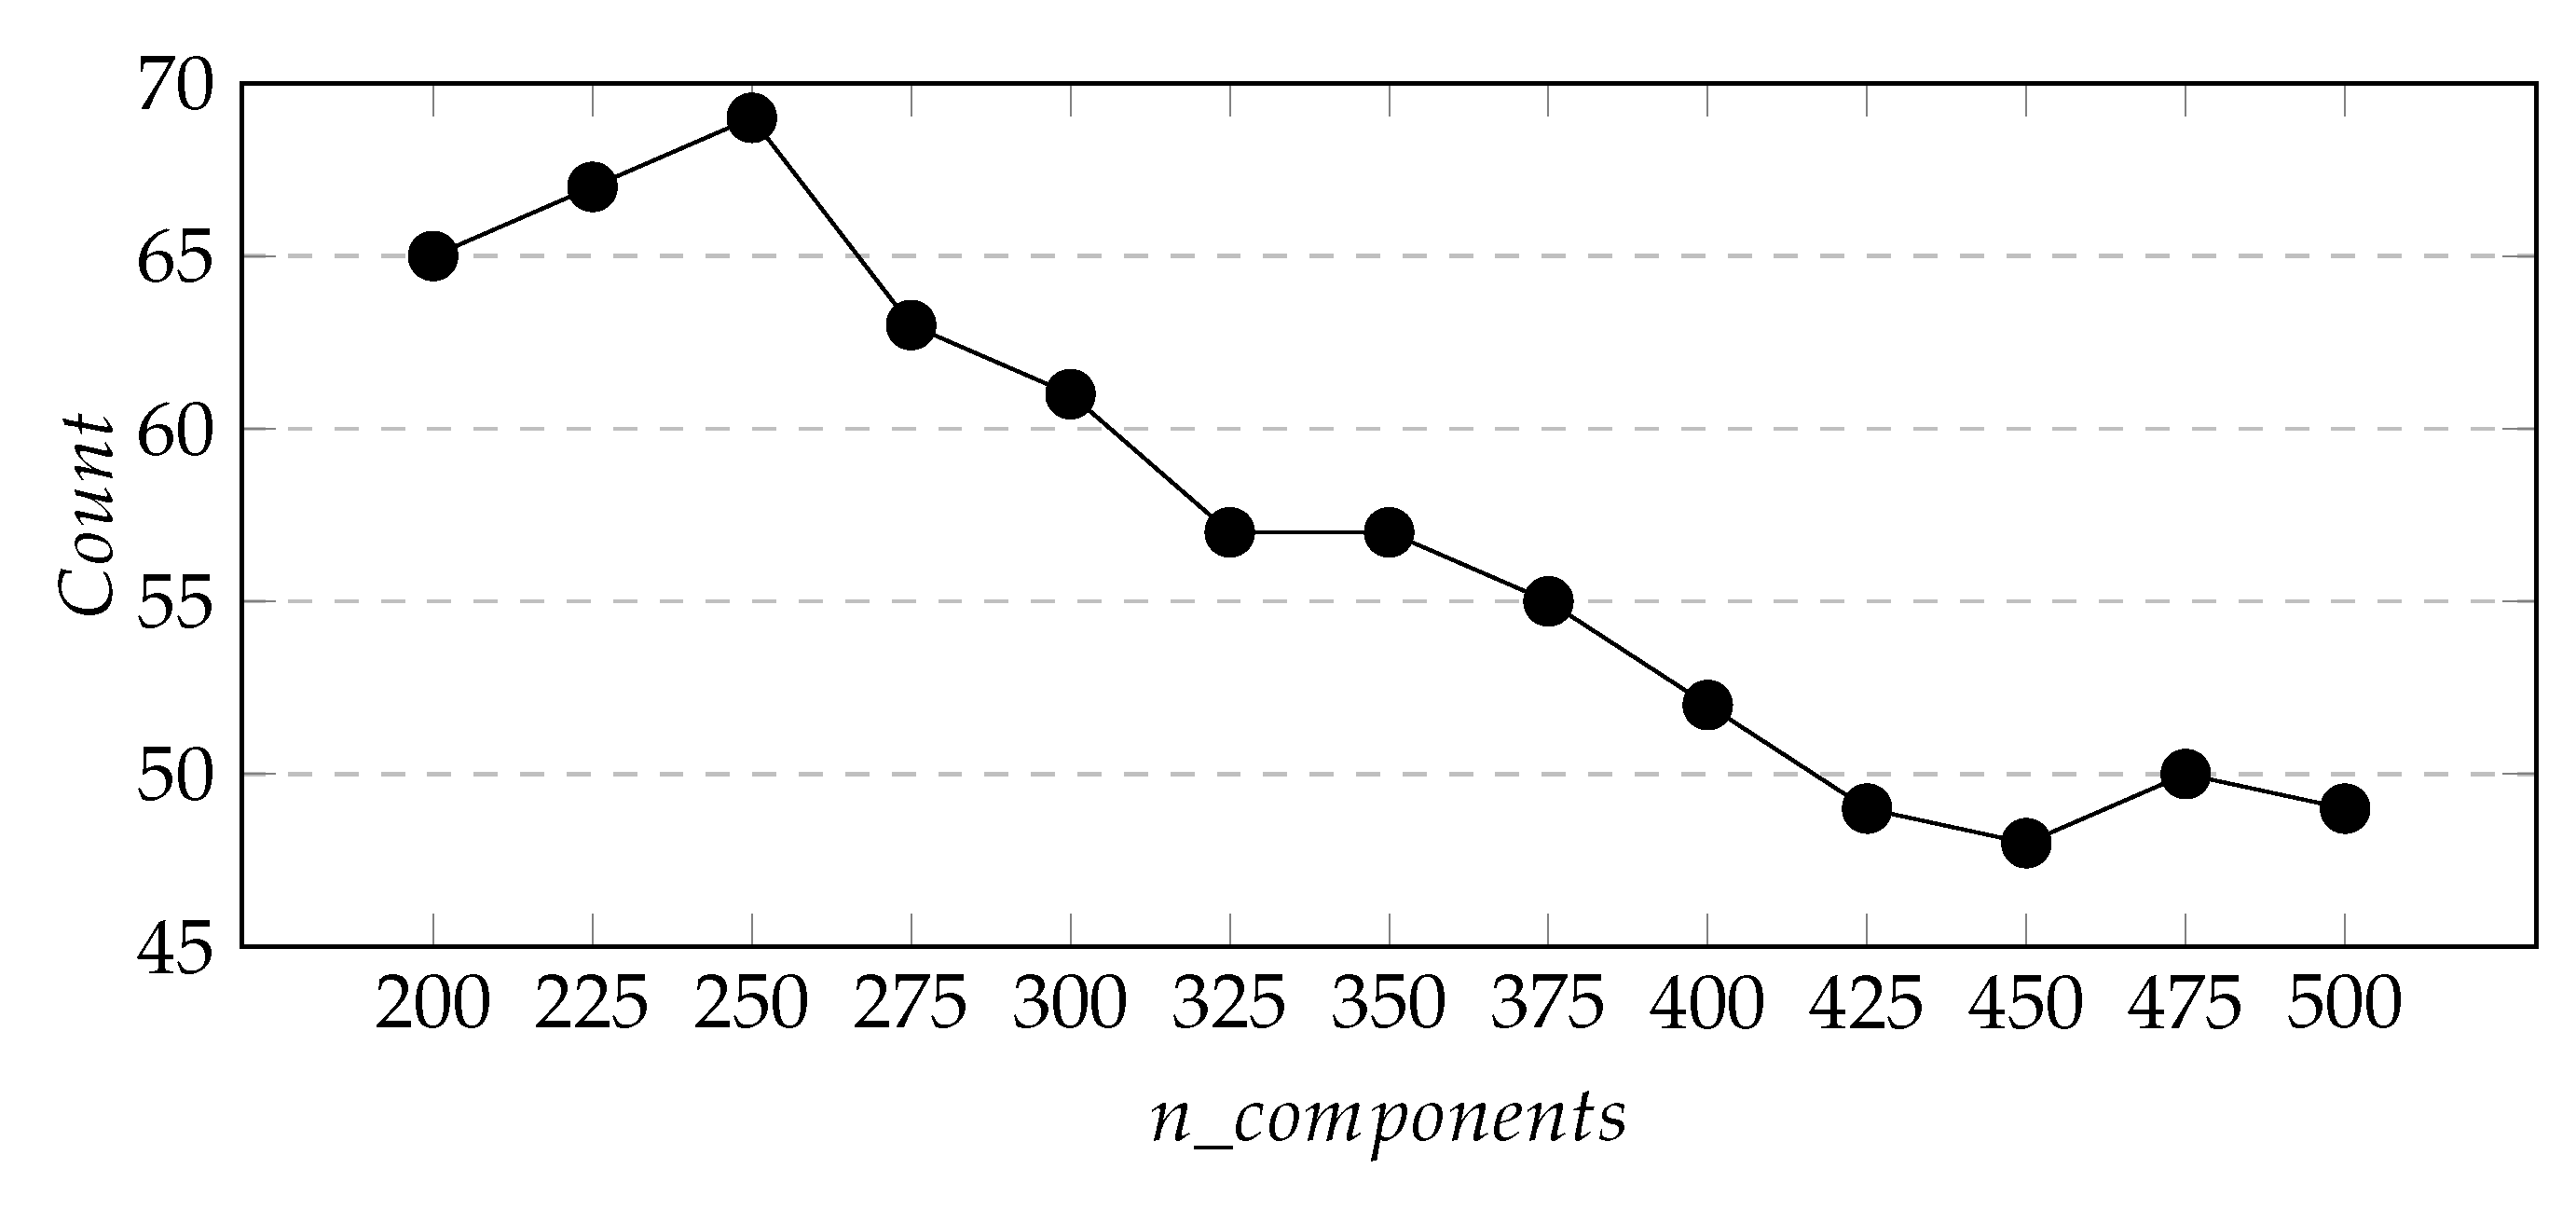
Figure 7,
Figure 8 and
Figure 9 respectively show the change curves of
,
S, and
with the value of
.The purpose of defining these two variables is to find appropriate parameters so that the number of new stations predicted by the whole city is the largest and the total area of the predicted area is the smallest.
| Algorithm 1 GetCoords. |
![Ijgi 11 00126 i001]() |
From
Figure 7 and
Figure 8, we can see that with the increase of
, the two curves generally show a downward trend, and the downward trend of
is more obvious. Besides, in
Figure 9 we found that the
index of the cluster result of
-200 is the smallest when
= 400, so we determine the cluster model parameter
= 400.
5.6. Results and Case Study
Figure 10 shows the clustering result we obtained according to the method in this paper. We rank 200 clustering regions according to their clustering weights and get the minimum circumscribed rectangular vertex coordinates of each region. We use these rectangles as a result of our prediction of future site locations. The prediction accuracy of the clustering results for the new subway stations after 2013 is 57.5% of which these include 68 stations has built after 2013 and 47 stations are being planned.
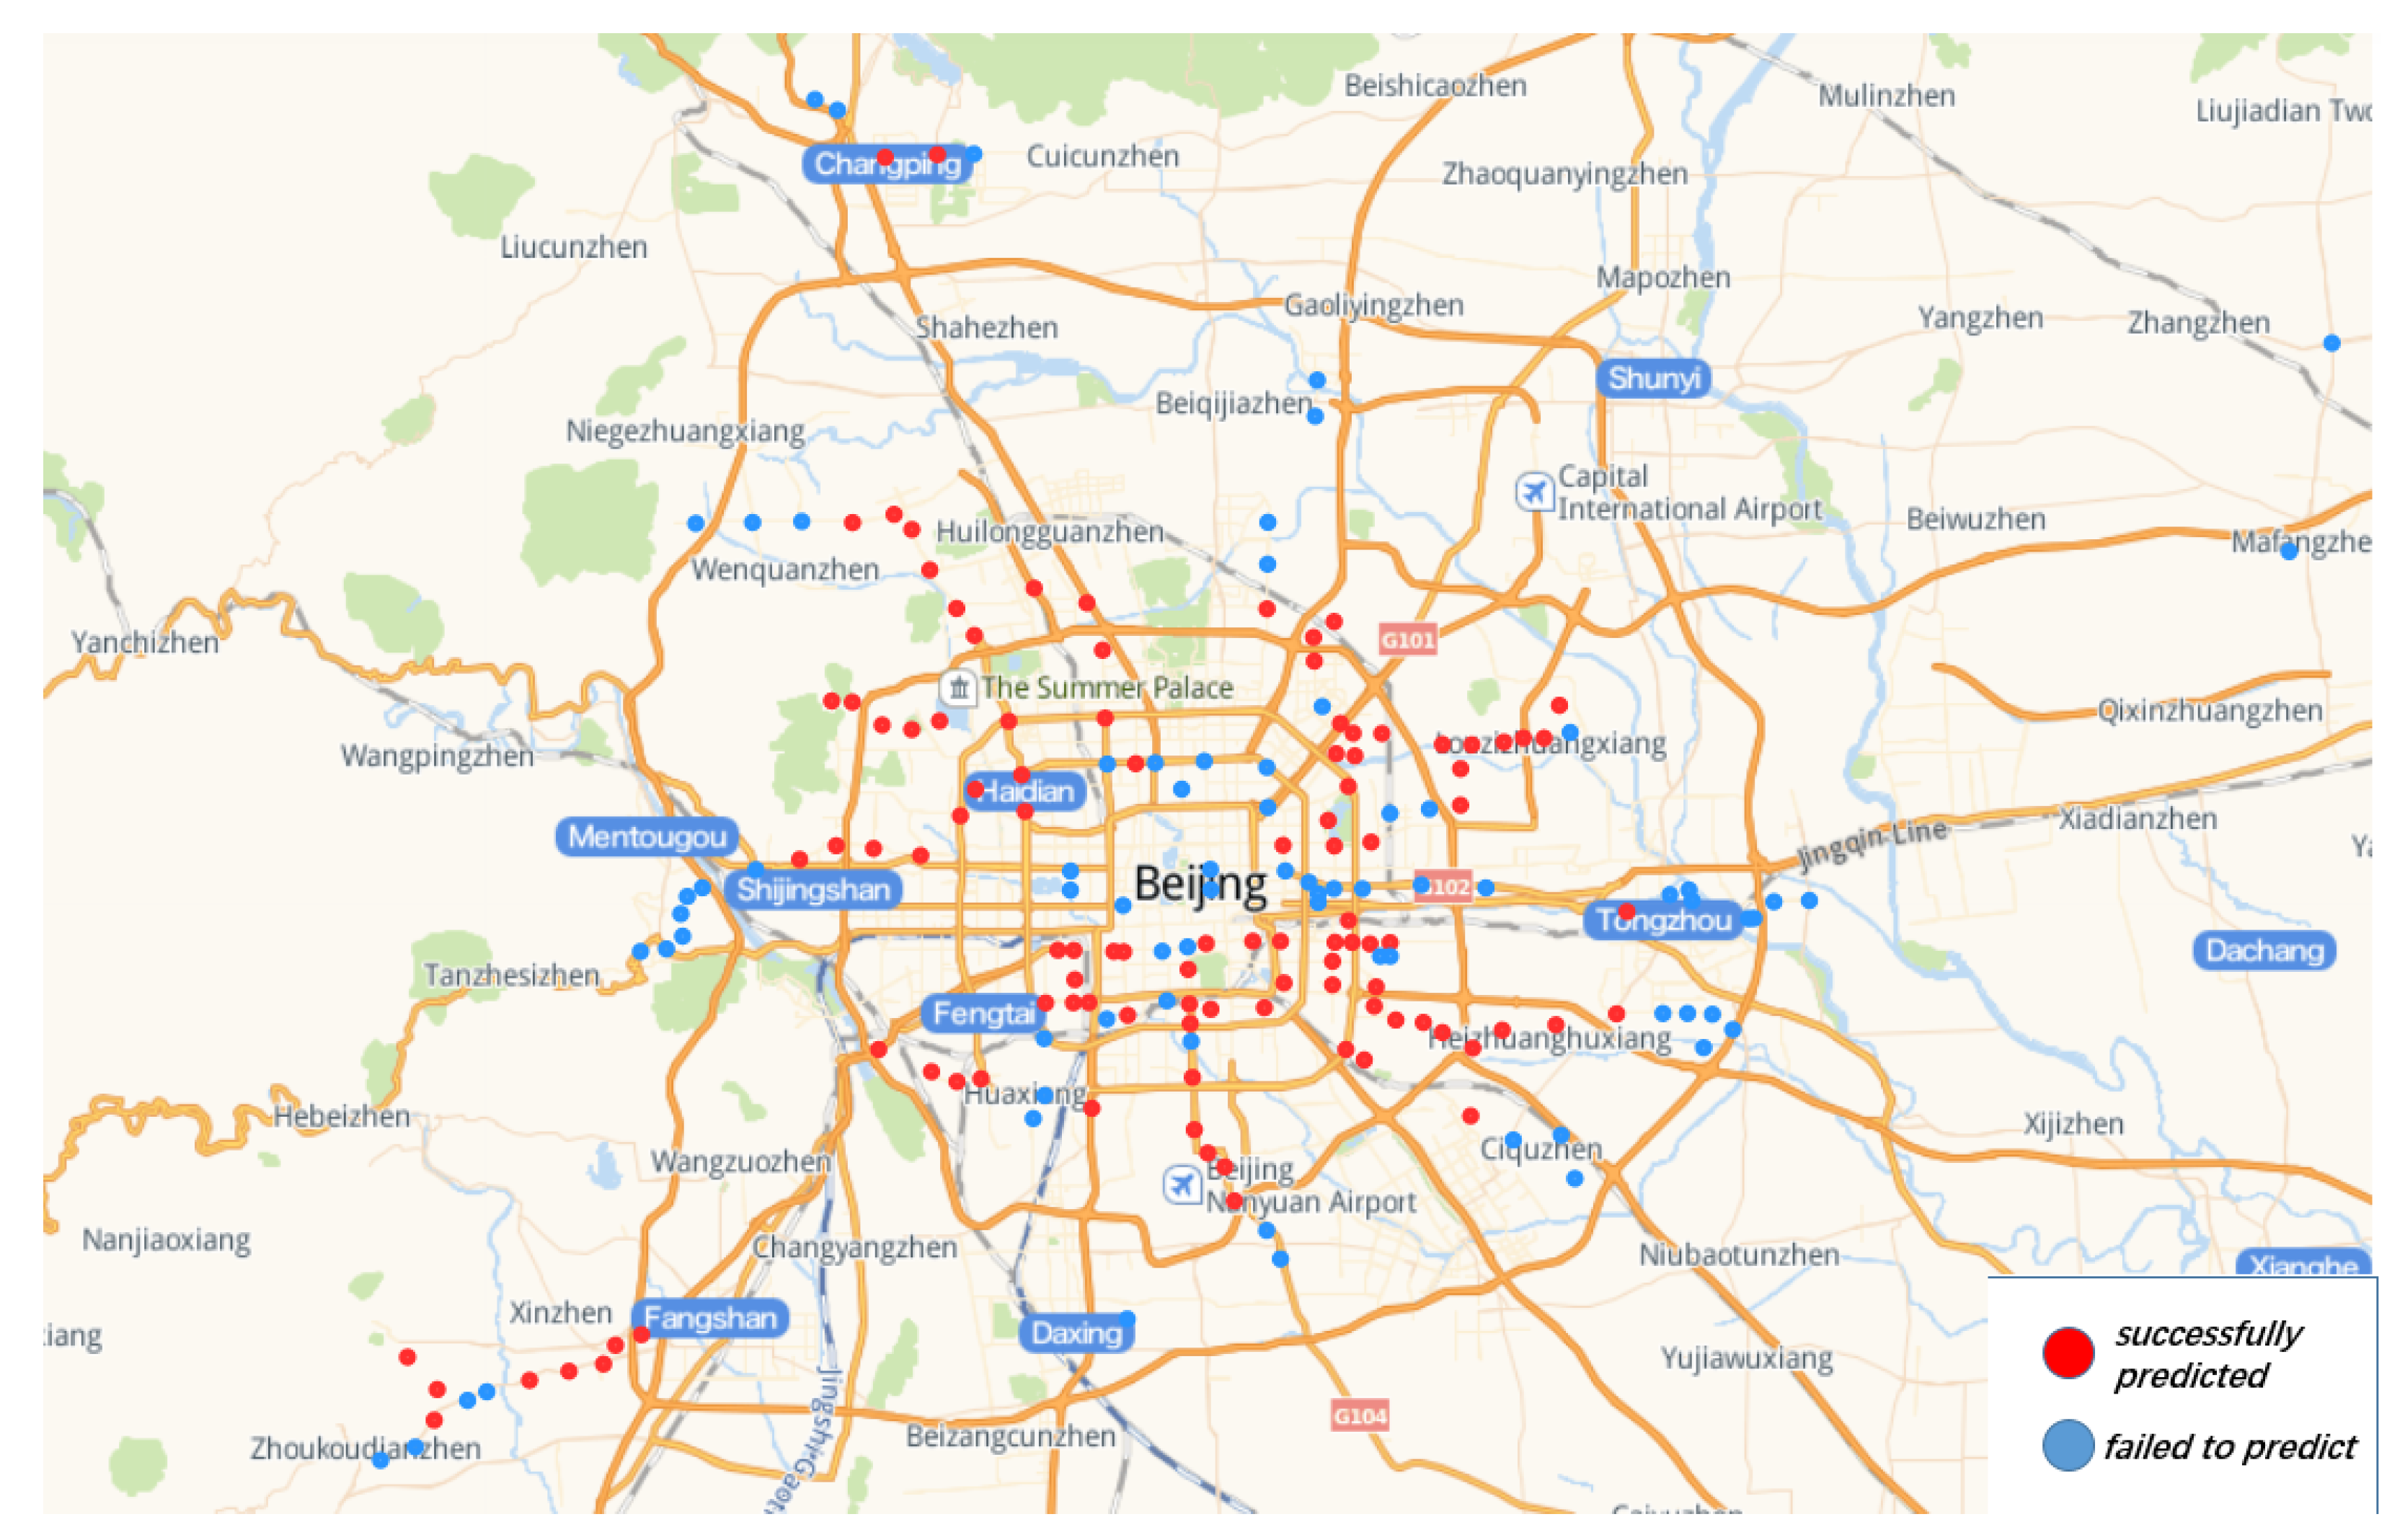
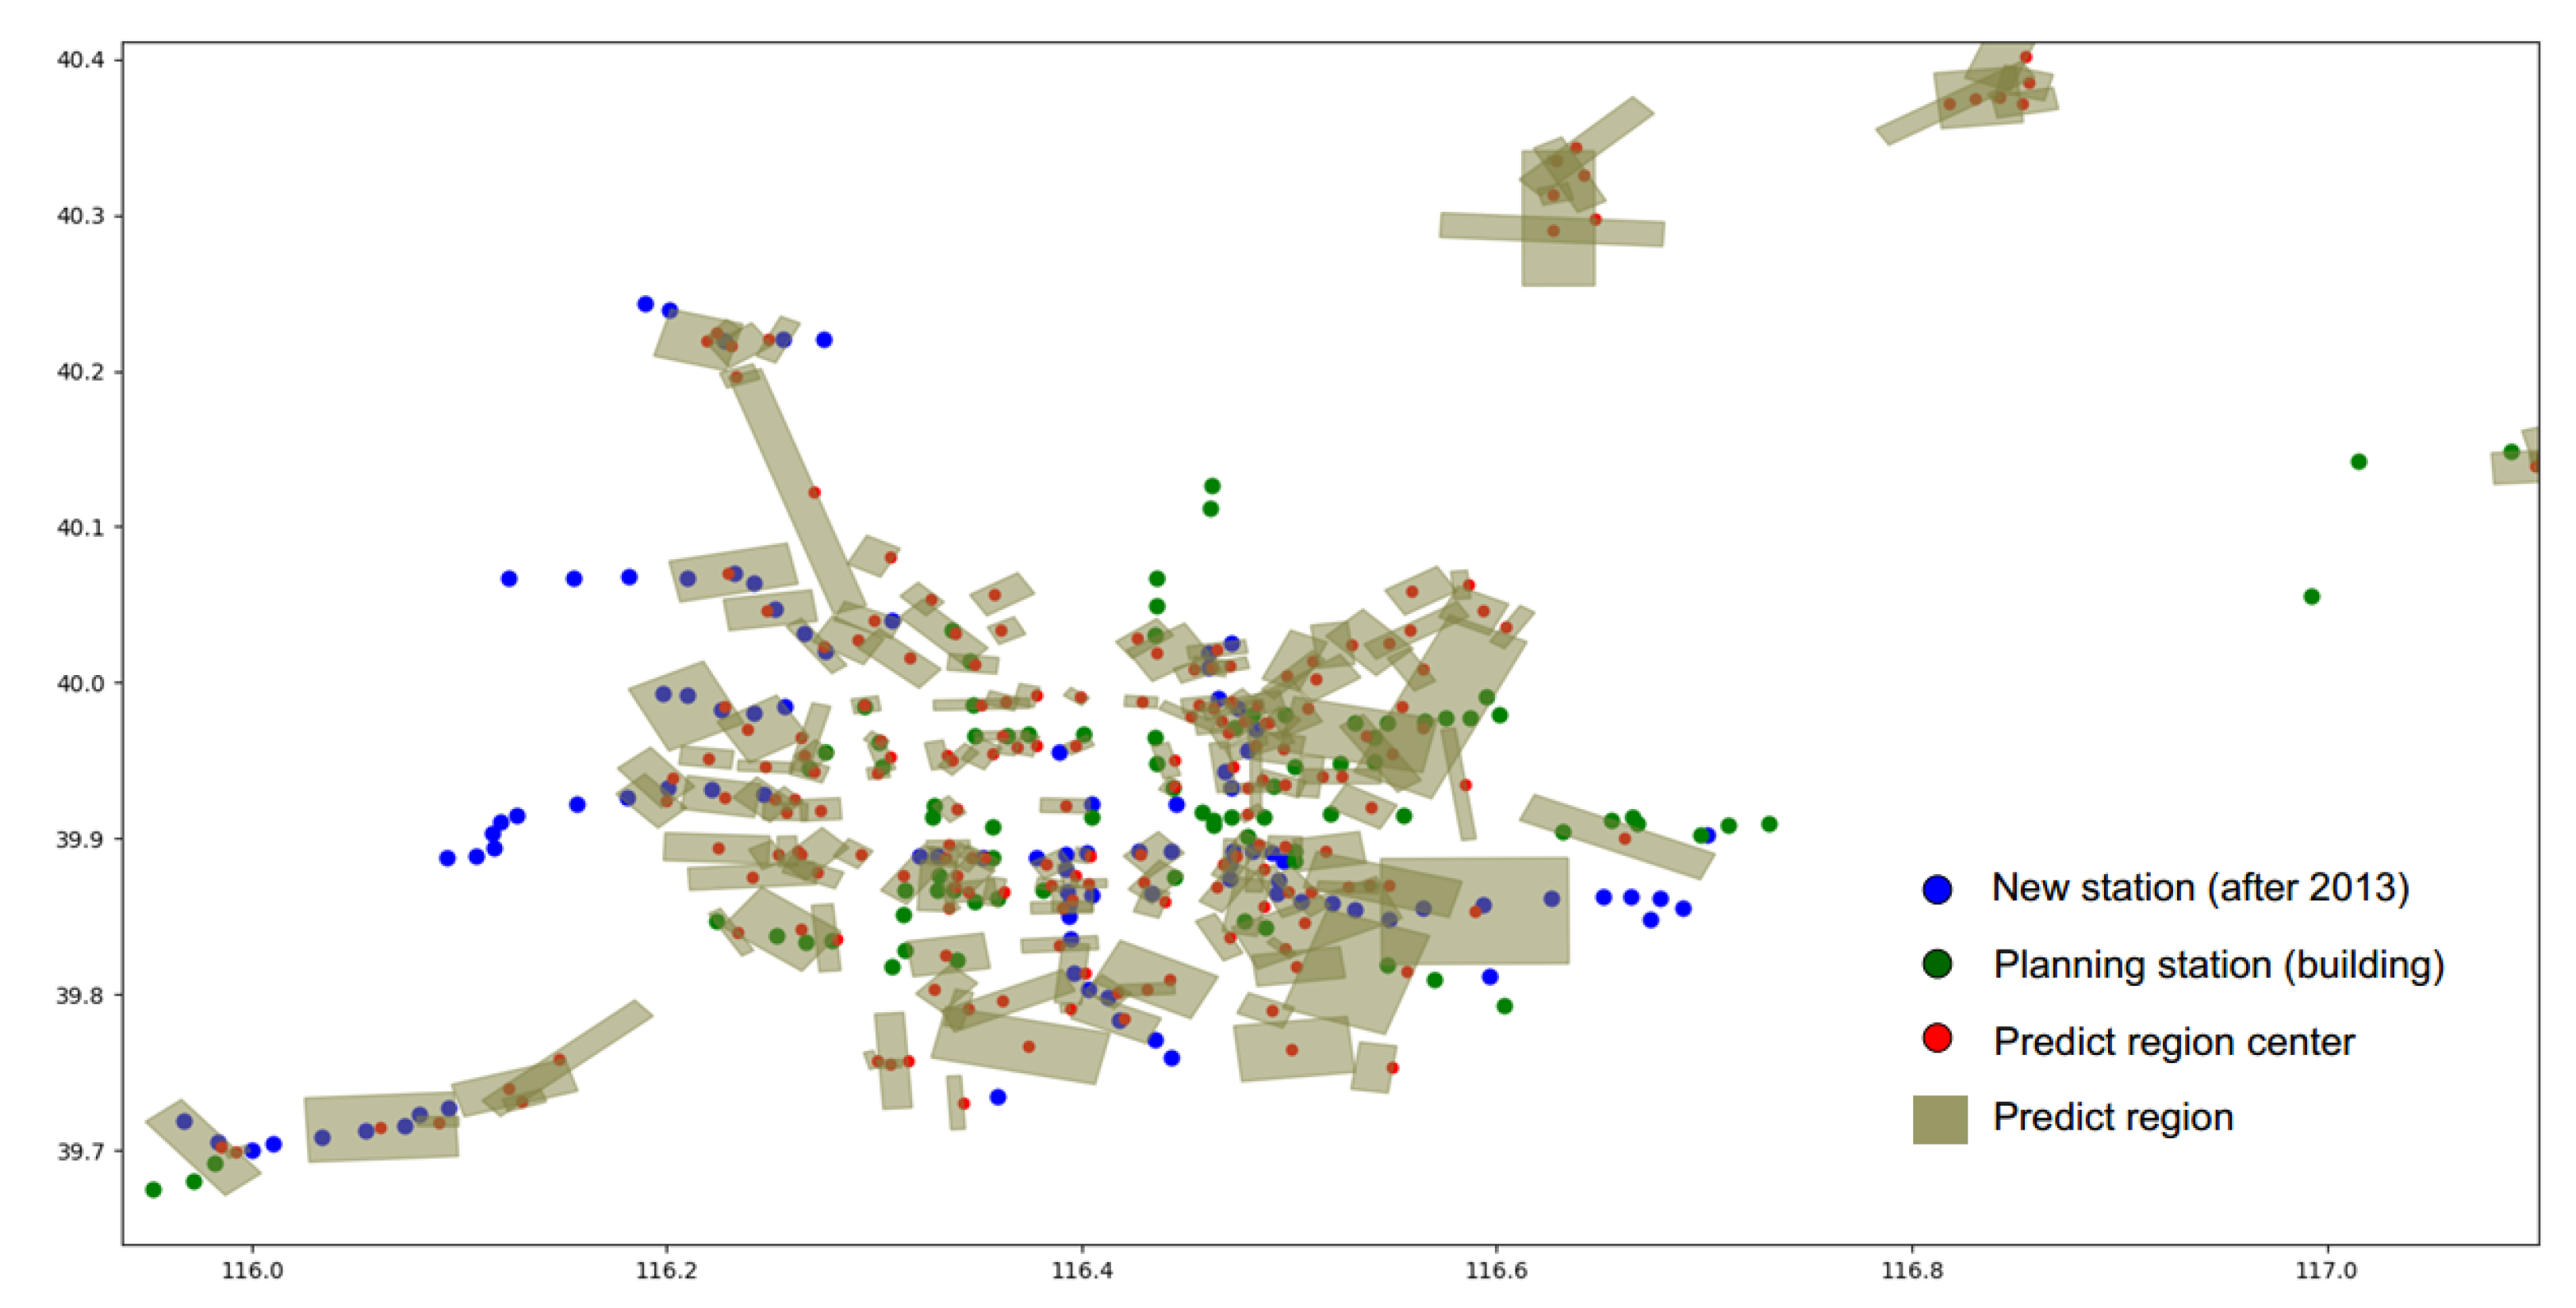
Figure 11 shows the locations of stations built after 2013 predicted by the model and locations of stations built after 2013 that the model failed to predict. This prediction result can provide reference for site selection decision of new site in the future. In addition, it can be seen clearly from
Figure 12 that the clustering distribution in some areas fits the new subway lines very well.
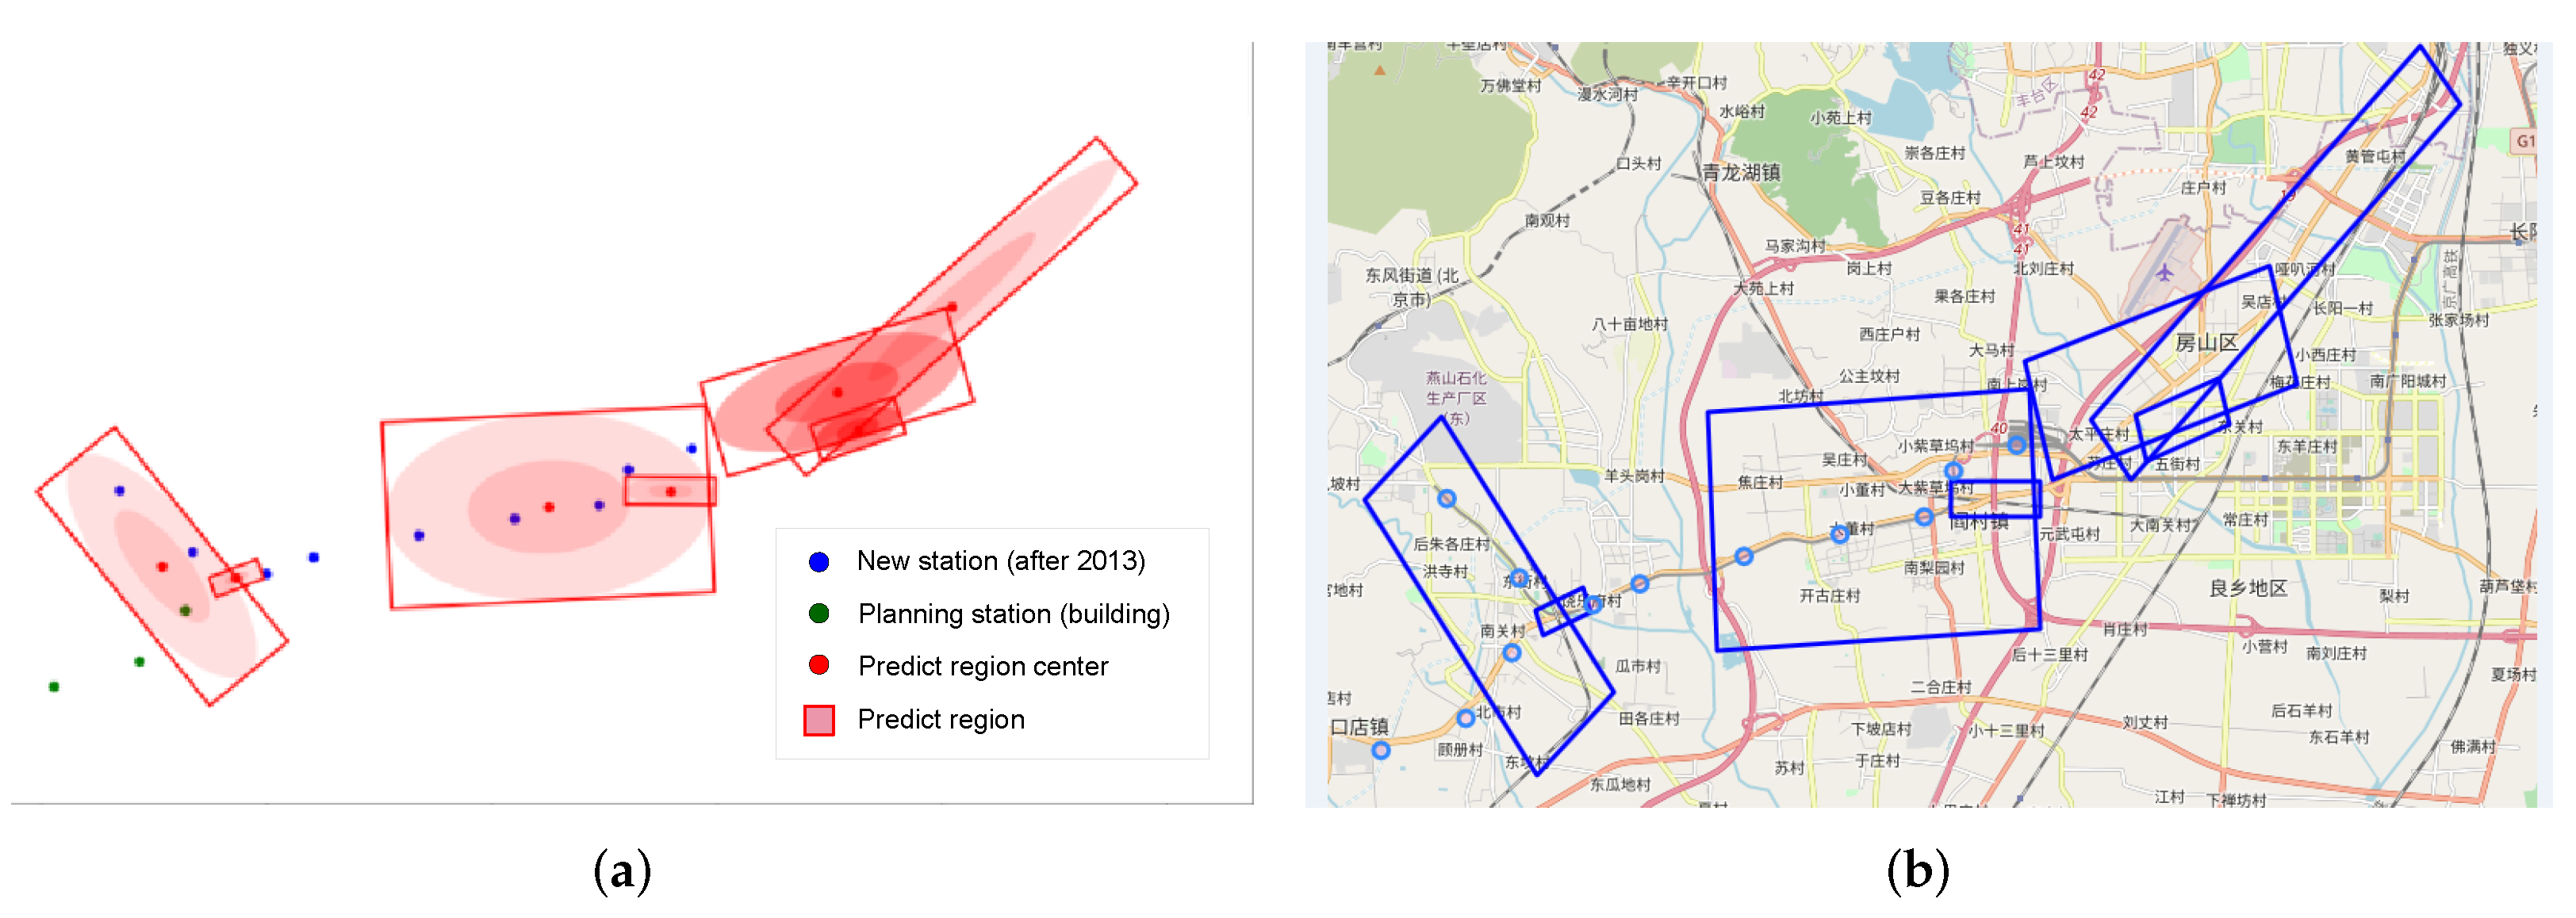
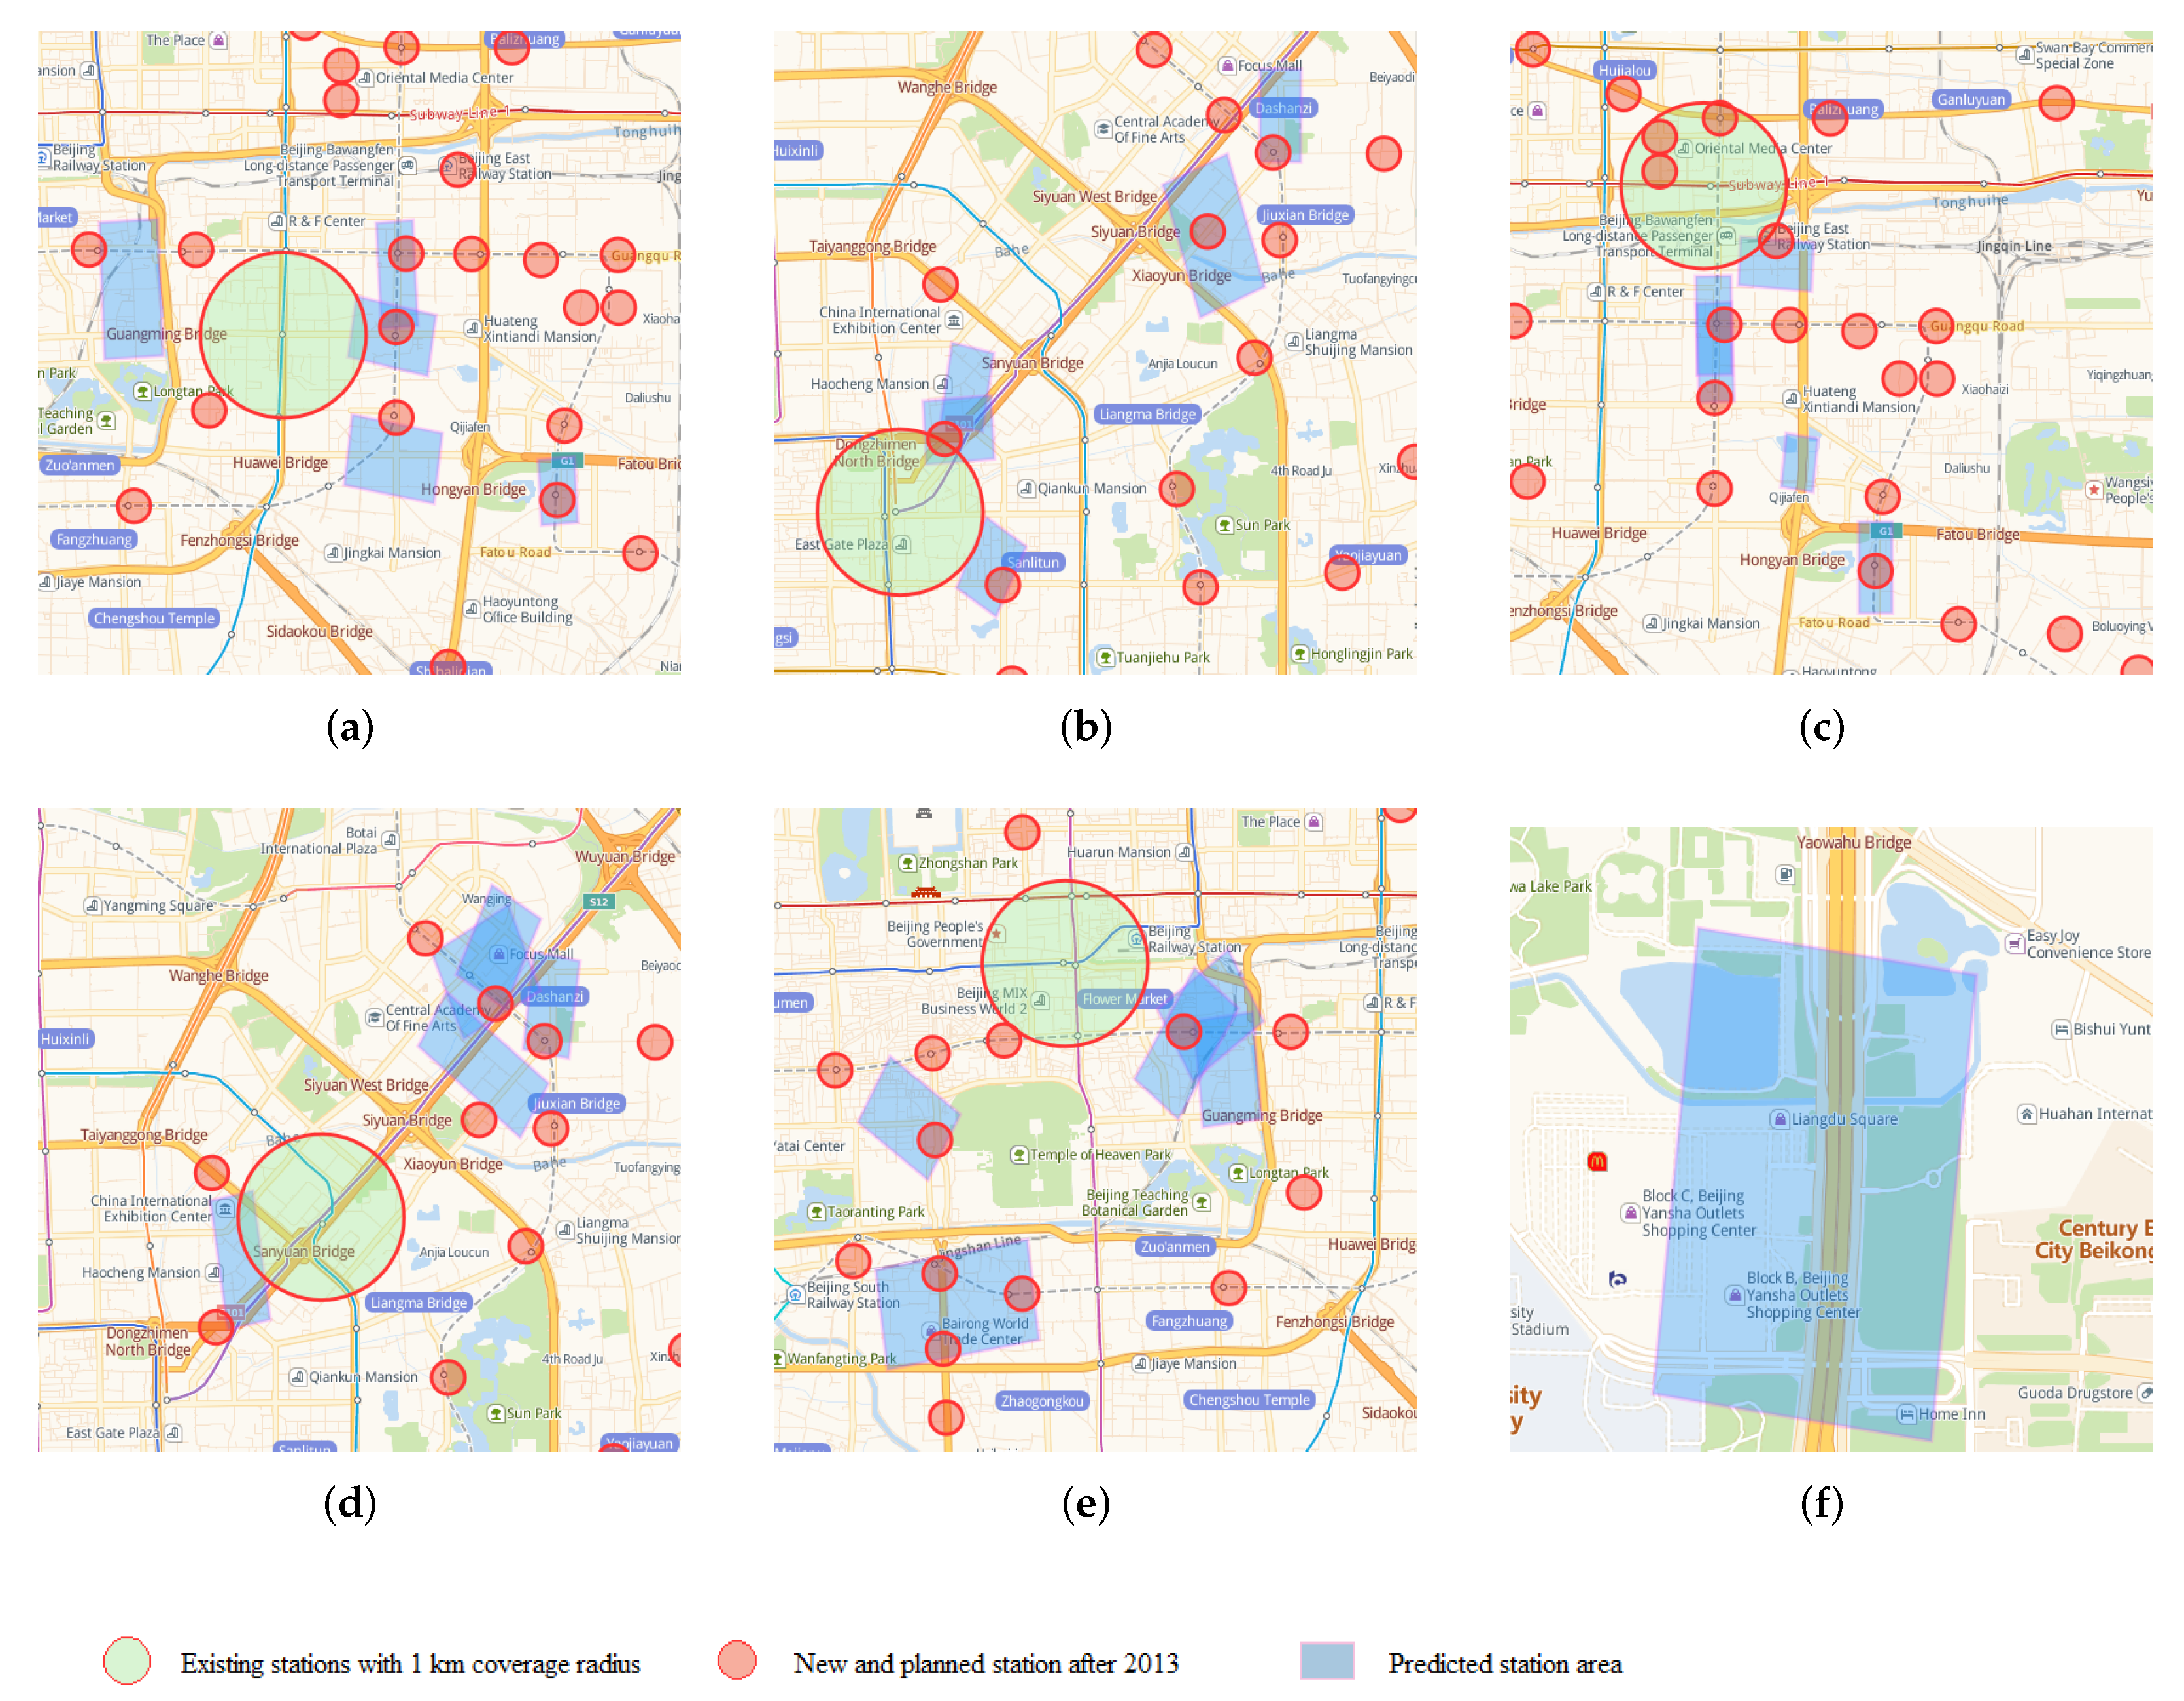
In addition, we use the Weighted LeadeRank algorithm to get the subway stations with high importance, and select some representative stations as the basis to predict the location area of the new stations in the future as shown in
Figure 13, where we choose the 1 km coverage of the built station as the experimental object, and through the model calculation, the clustering rectangular area covers some new subway stations built after 2013.
We have selected Jinsong, Dongzhimen, Dawanglu, Sanyuanqiao and Chongwenmen station as the experimental areas within one kilometer (the largest circle in
Figure 13) and obtained Top5 rectangular cluster areas through the model shows in
Figure 13a–e. The number of new sites (the smallest circle in
Figure 13) correctly covered are 4, 4, 2, 5. (The number of smallest circles that overlap the rectangle).
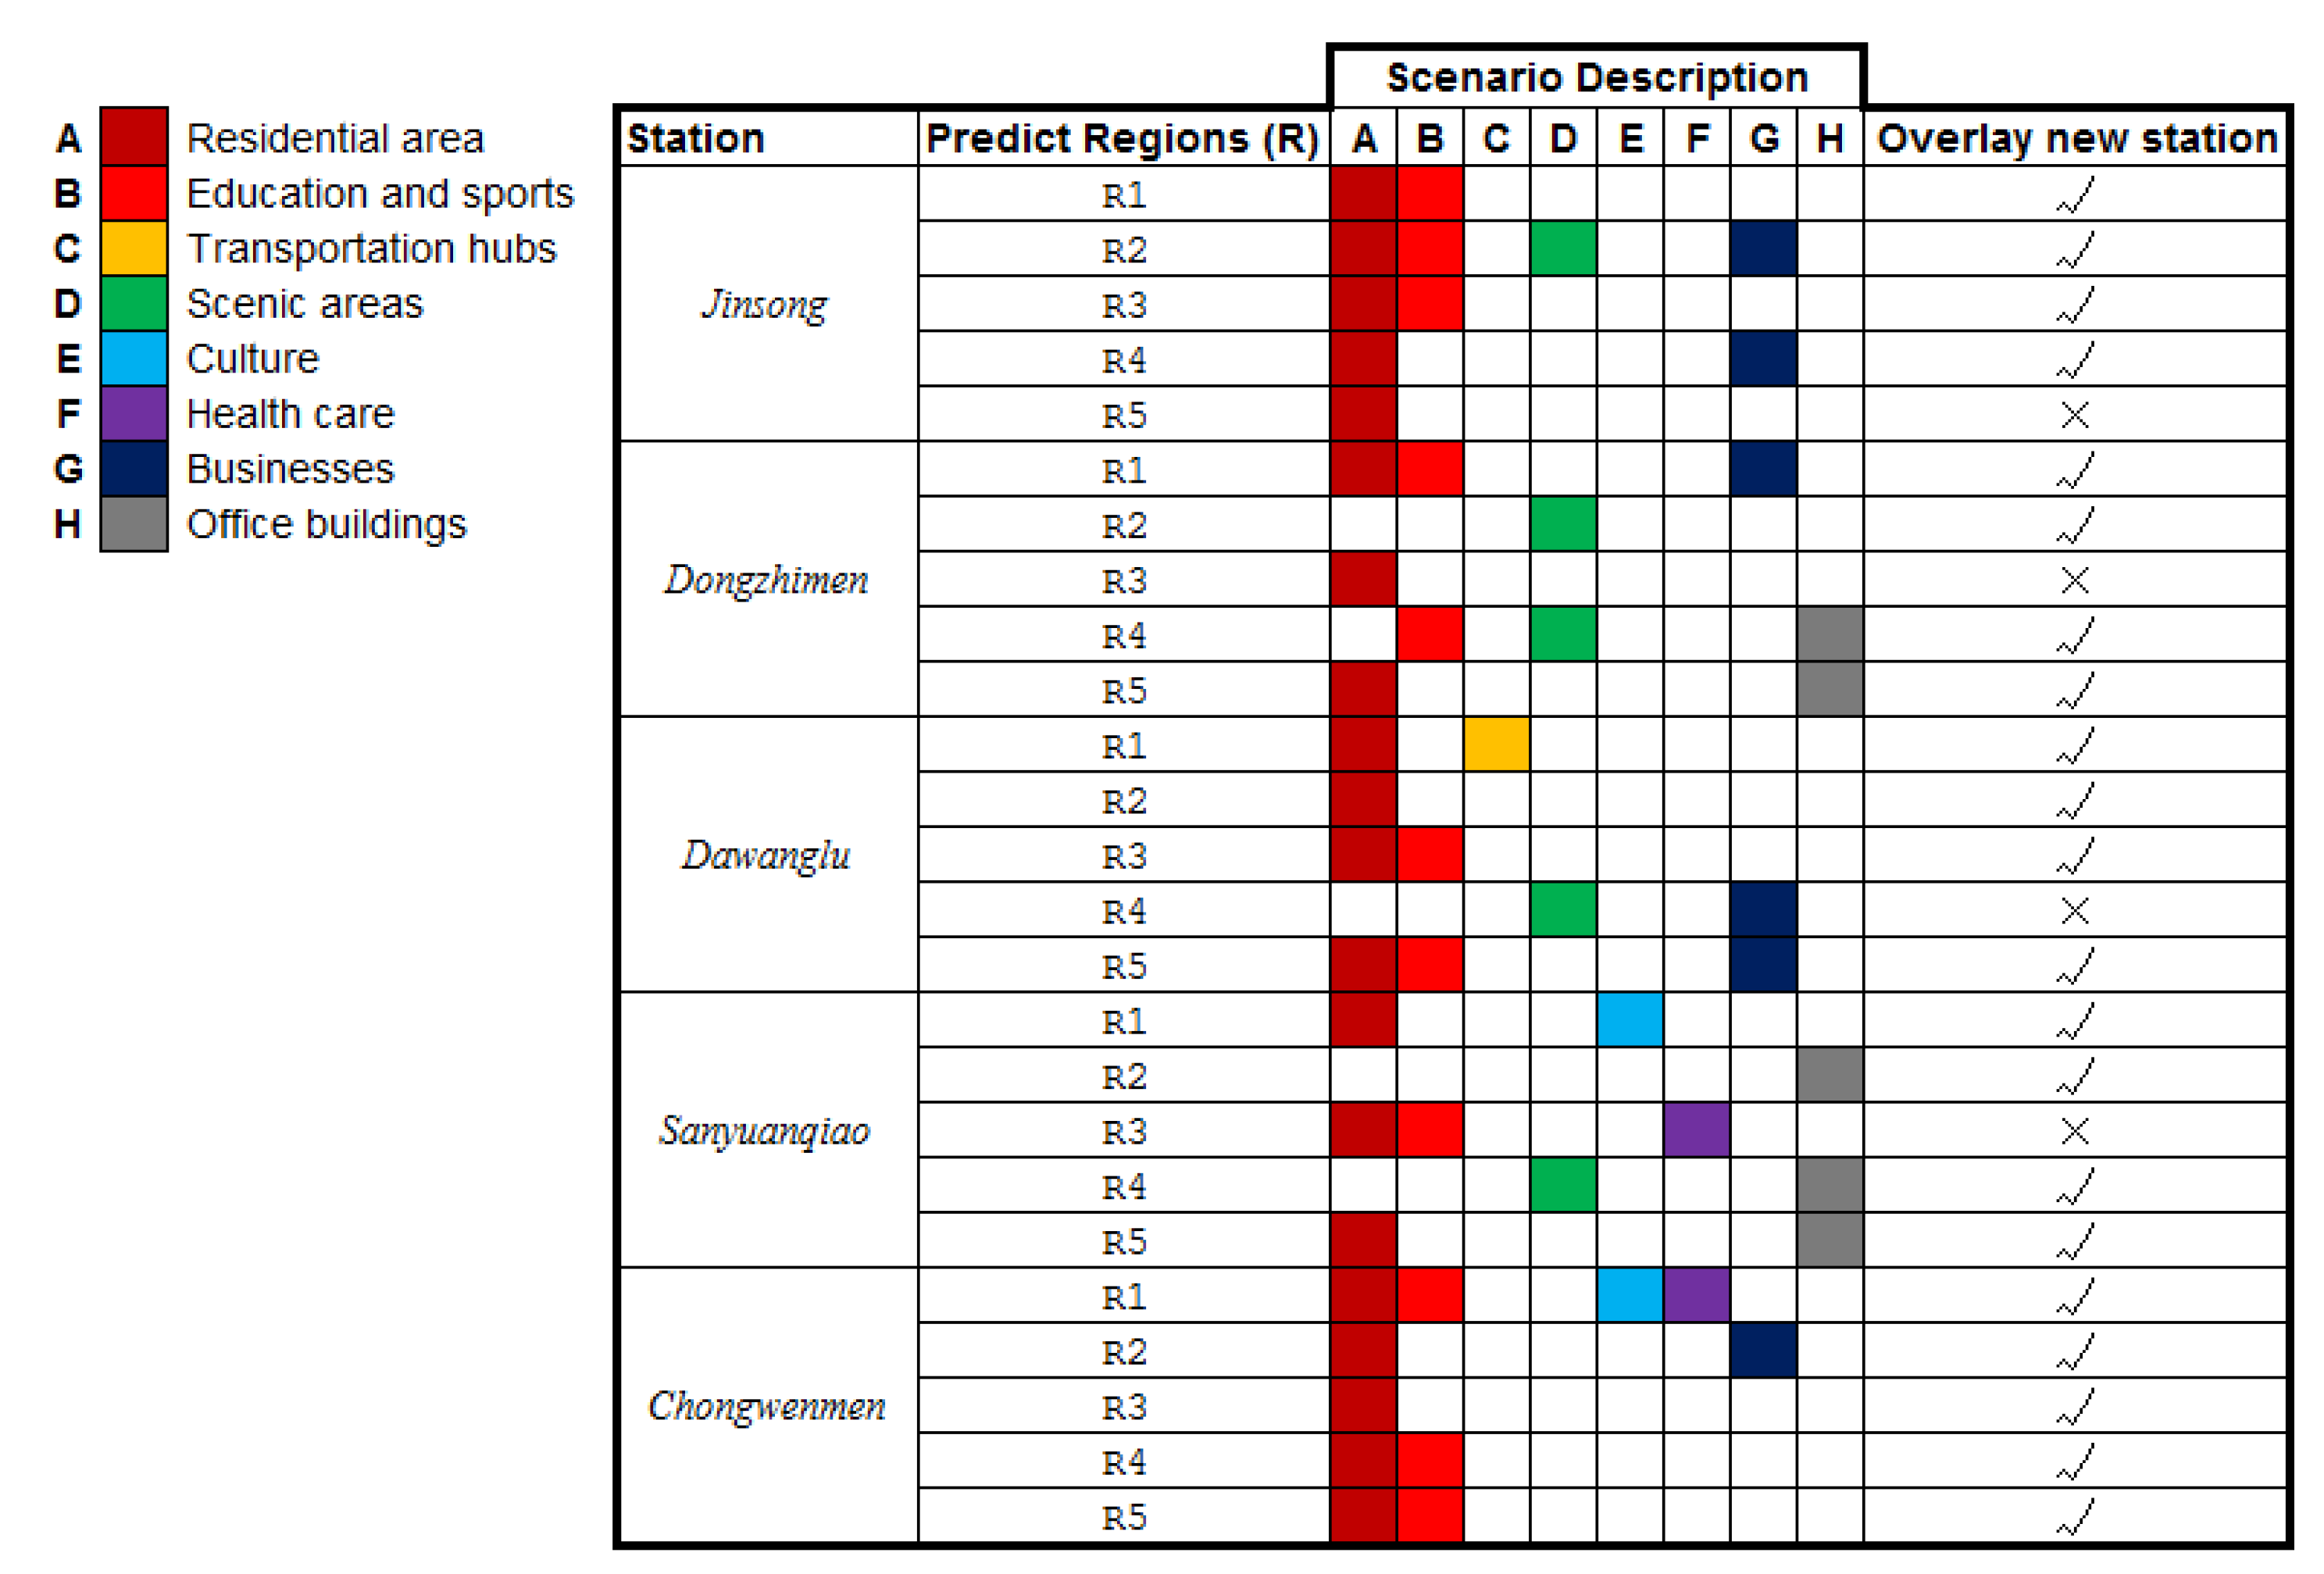
We make statistics and analysis on the land use characteristics in rectangular clustered areas, which are divided into eight categories: residential area, education and sports, transportation hubs, scenic areas, culture, health care, businesses and office buildings.
Statistical analysis of major land-use characteristics in each cluster area and correct prediction of subway stations are shown in
Figure 14.
From the distribution of land use characteristics in cluster areas in the above table, land use includes education and sports, transportation hub, businesses places and other features, which are likely to become new subway stations, while most cluster areas contain residential, it has little influence on becoming a new station. According to the above rules, we can find that the land use characteristics of new site area often include multiple land use features and not residential area as the main features. In addition, there is overlap in the prediction regions, which indicates that there is a greater traffic demand in this area, and from the prediction results compared with actual stations, there are new stations near the overlap area.
However, we found an exception in
Figure 13 Dawanglu in Region 4 (Lower right rectangular area). Although the area contains businesses places and scenic areas, it does not cover the new subway station. With further analysis, we found that the area contains urban ring lines as shown in
Figure 13f, so it is likely to be a reason for the region that can not cover new station.
6. Conclusions and Further Work
In this paper, we propose a method to find potential location areas for new subway lines and the extension of existing subway stations, so as to improve the urban public transport system and promote the overall rapid development of the region. We use the weighted leaderank algorithm and the Gaussian mixture model to extract and recommend the new rail transit area from the overall and local taxi OD. In order to verify the effectiveness of the proposed method, this paper selects the rail subway stations in Beijing after 2013, and compares the new rail transit stations predicted in this paper with the actual newly-built stations which are built after 2013. The result shows that out of our predicted 200 station areas, 115 areas have new subway stations. In addition, we selected the busier subway stations (Jinsong, Dongzhimen, Dawanglu, Sanyuanqiao and Chongwenmen station) through the LeaderRank algorithm and predicted their future adjacent five station areas through the model, the number of new sites correctly covered are 4, 4, 2, 5. Results show that our method has certain effect. It can provide useful information for decision-makers in subway infrastructure construction planning. As the subway is a very low-carbon, energy-saving and large-volume transportation tool in public transportation, how its new stations in the future can better meet people’s travel needs is worthy of further study. On the one hand, it is necessary to consider the relationship between other travel modes(buses, sharing bicycle track data, etc.) and subway stations. Besides, the land use characteristics of the predicted area are also worthy of further study.
This paper proposes a method based on a data-driven approach. In recent years, transport, Information and Communication Technologies (ICTs) and energy constitute the smart city pillars. Currently, the proposed method not focuses on user behavioural hypothesis about travel choices. In the further study, we will estimate travel demand by means Transport System Models (TSM) in order to identifies potential user that could modify its travel choices. Further developments of our research could involve the integration between data and TSM.


