

A Knowledge Graph Convolutional Networks Method for Countryside Ecological Patterns Recommendation by Mining Geographical Features


Abstract
1. Introduction
- (1)
- We establish a geographical knowledge graph of countryside ecological patterns by mining geographical features, which makes up for the sparsity of countryside ecological pattern data through the rich semantic information of the knowledge graph. The specific relationships and countryside ecological pattern embedding are weighted and calculated, so that the geographical personalized features of the countryside ecological pattern are effectively represented.
- (2)
- We design a convolutional network for sufficiently mining the geographical similarity of ecological patterns, which effectively solves the ‘cold start’ problem. The spatial features of neighborhood information are exploited through the neighborhood aggregation operation of convolutional networks.
- (3)
- We explore the geographical relationship features between the countryside and the countryside ecological pattern by considering the spatial scale of the neighborhood so that our method is more suitable for the recommended work under the countryside ecological pattern scenarios.
- (4)
- For the convenience of other researchers, we have published the code and dataset in this project on the Internet (https://github.com/973866103/KGCN4CEPR, accessed on 21 June 2022).
2. Related Work
2.1. Three Main Categories of Ecological Pattern
2.2. Recommendation Systems
2.2.1. Content-Based Recommendation
2.2.2. Collaborative Filtering Recommendation
2.2.3. Hybrid Recommendation
3. KGCN4CEPR Method
3.1. Construction of Countryside Knowledge Graph
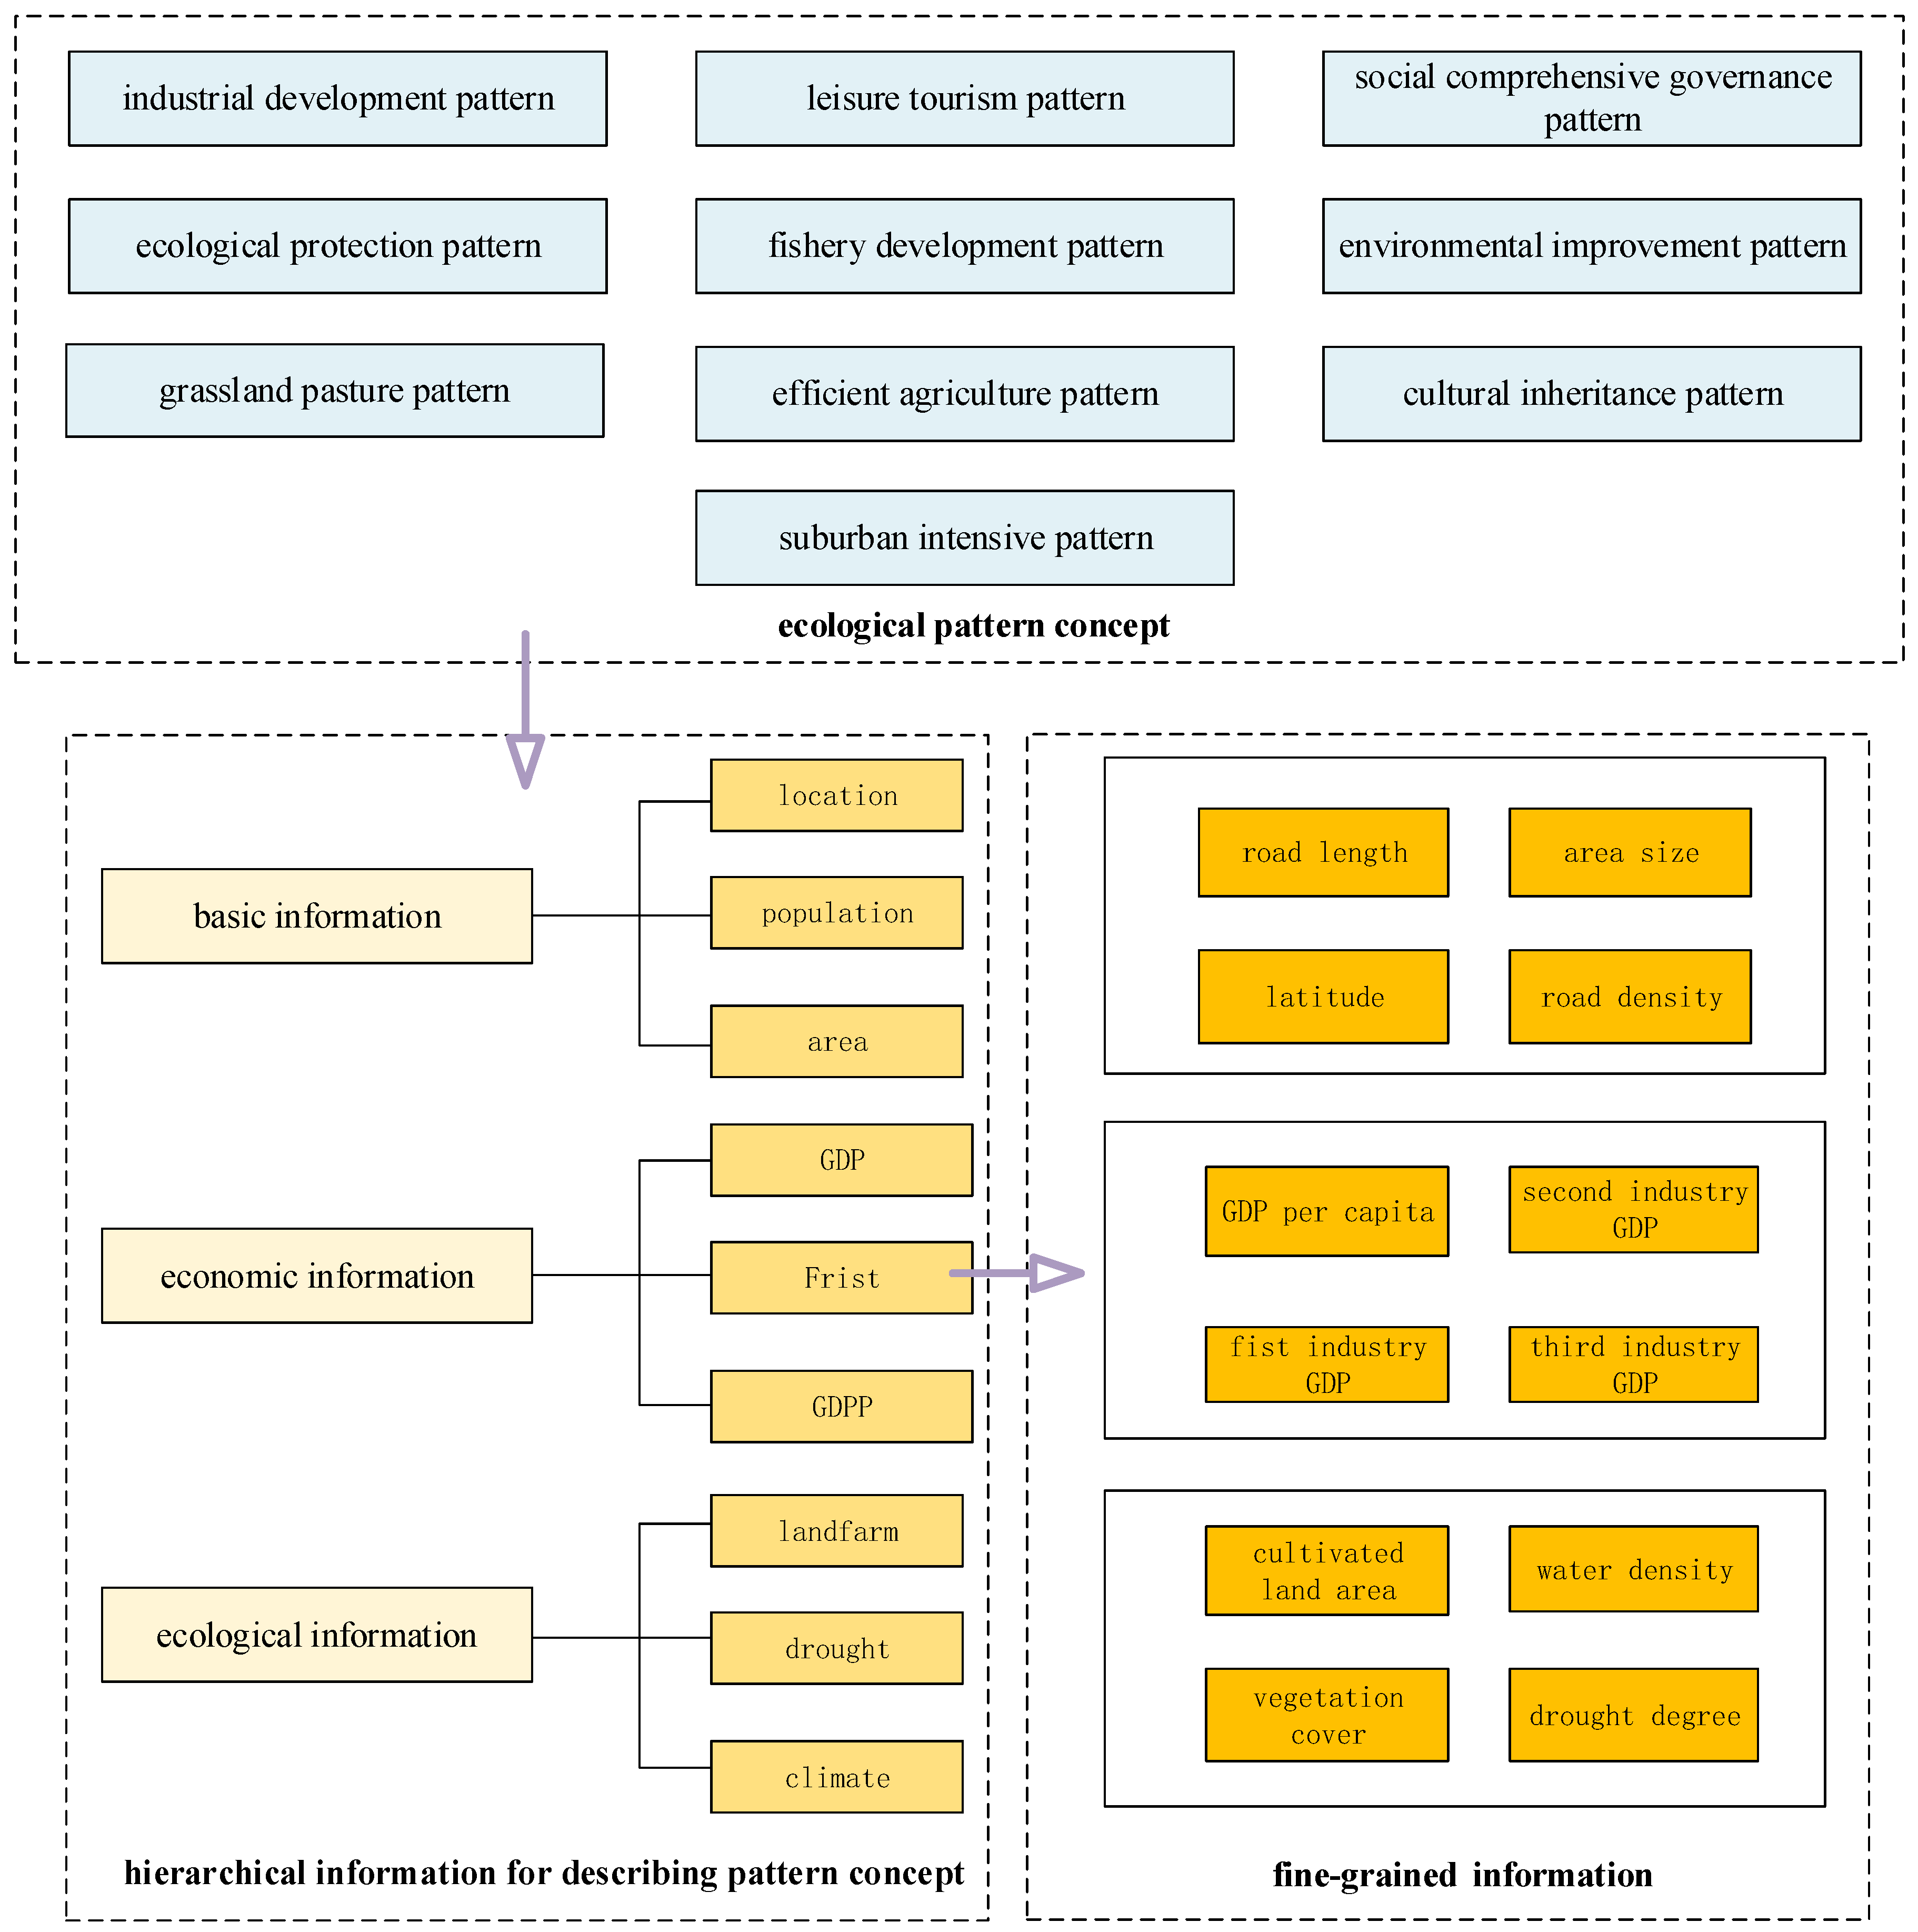
3.1.1. Ontology Construction of Countryside Knowledge Graph
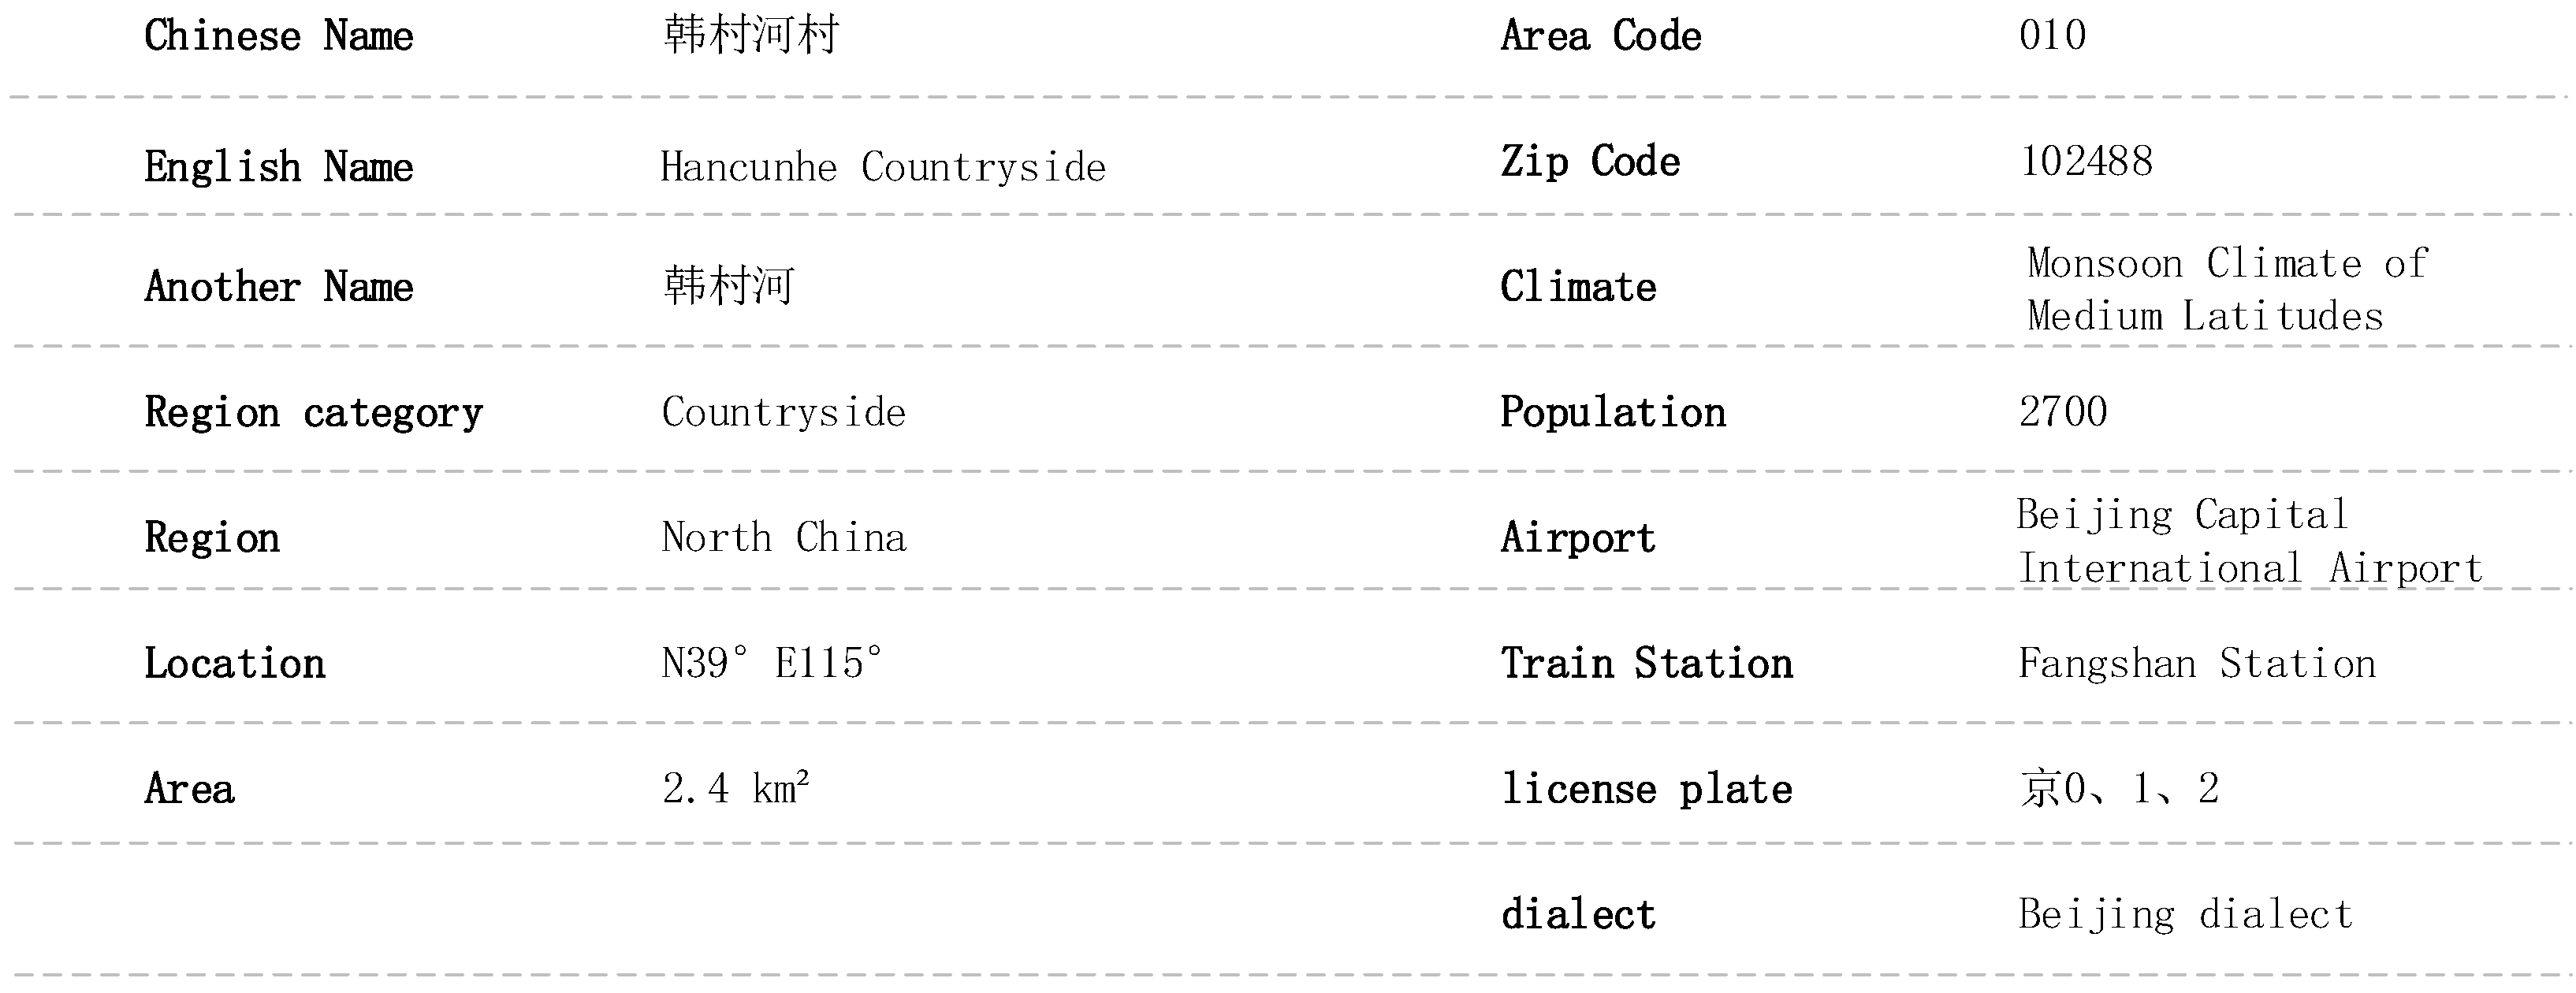
3.1.2. Entity Construction of Countryside Knowledge Graph
3.2. KGCN4CEPR Recommendation Method
3.2.1. Problem Formulation
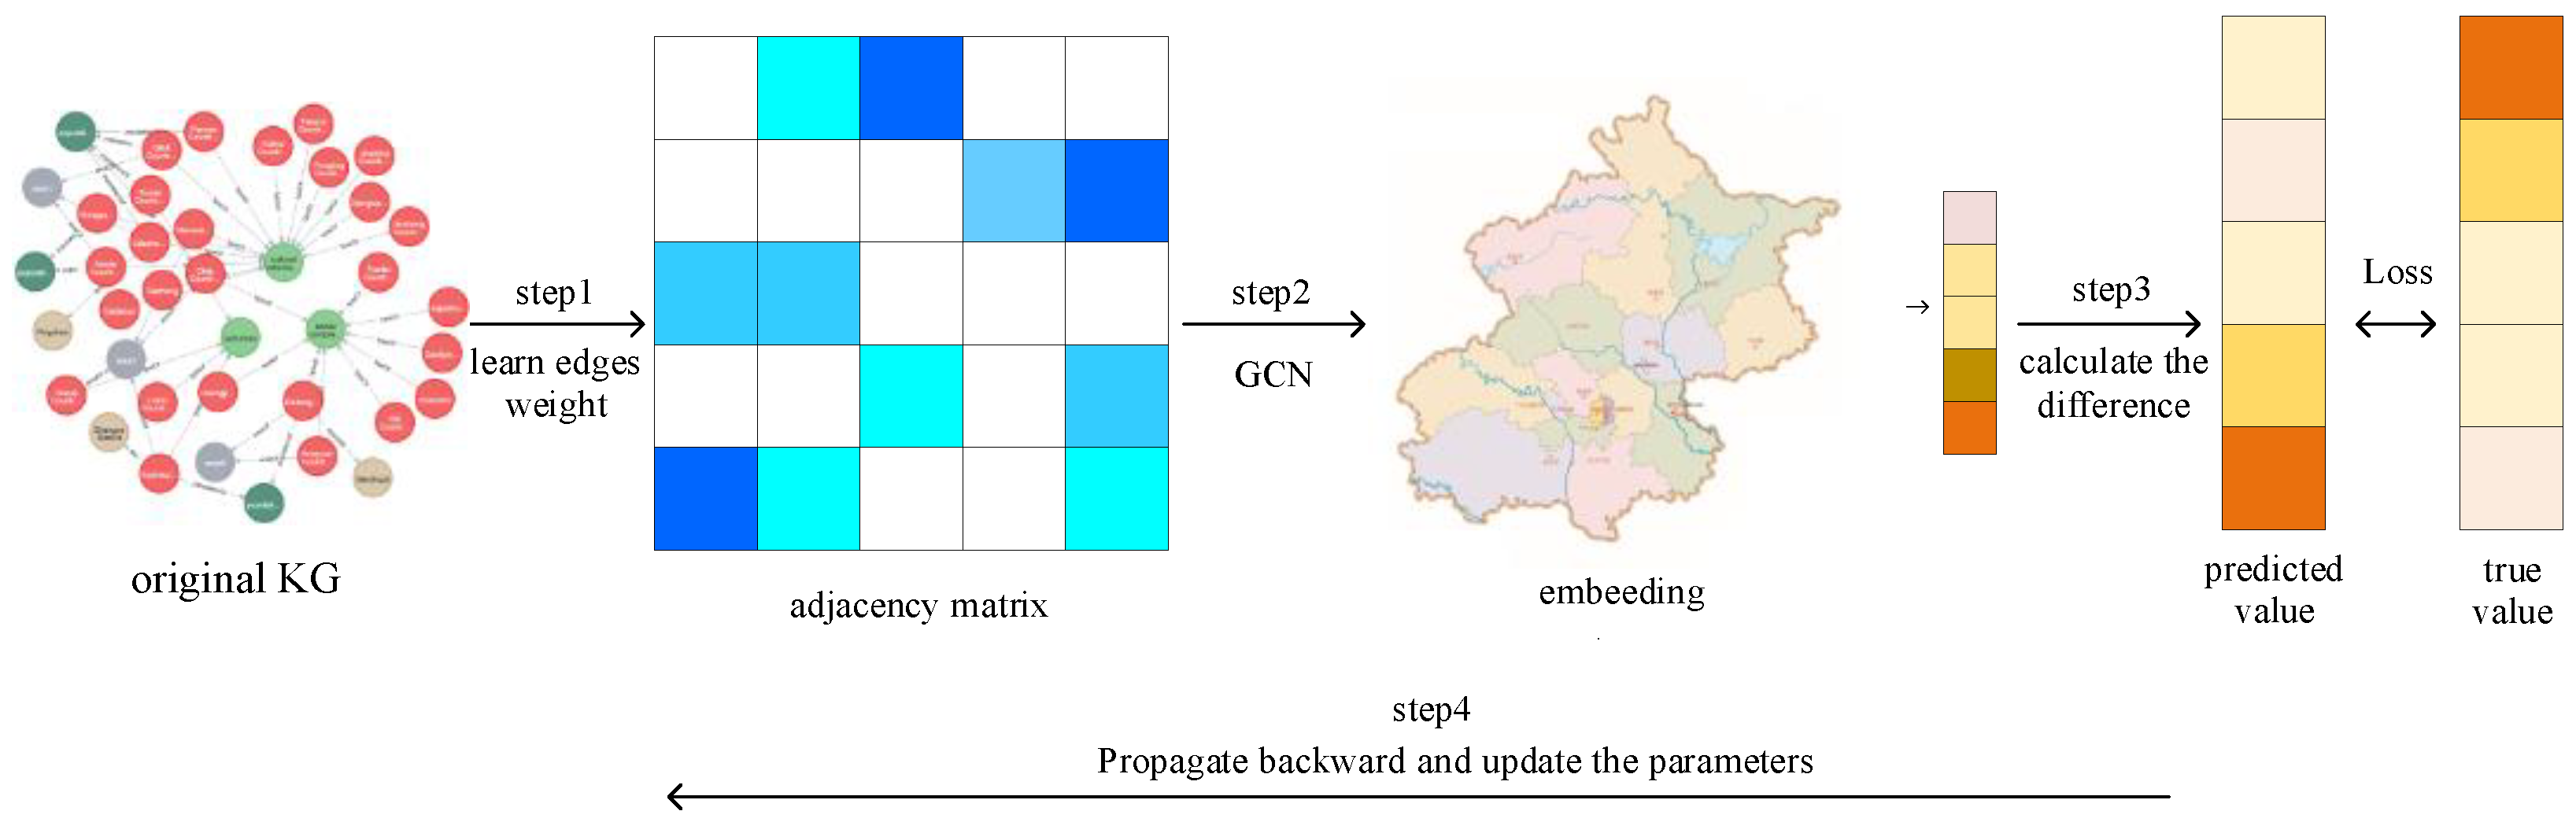
3.2.2. Implementation of KGCN4CEP Recommendation Method
4. Experimental Evaluations and Discussion
4.1. Datasets
4.2. Experiment
4.2.1. Experiment Setup and Evaluation Criterion
4.2.2. Experiment Setup and Evaluation Criterion
5. Discussion on Selecting Parameters
5.1. Discussion on Selecting Parameters
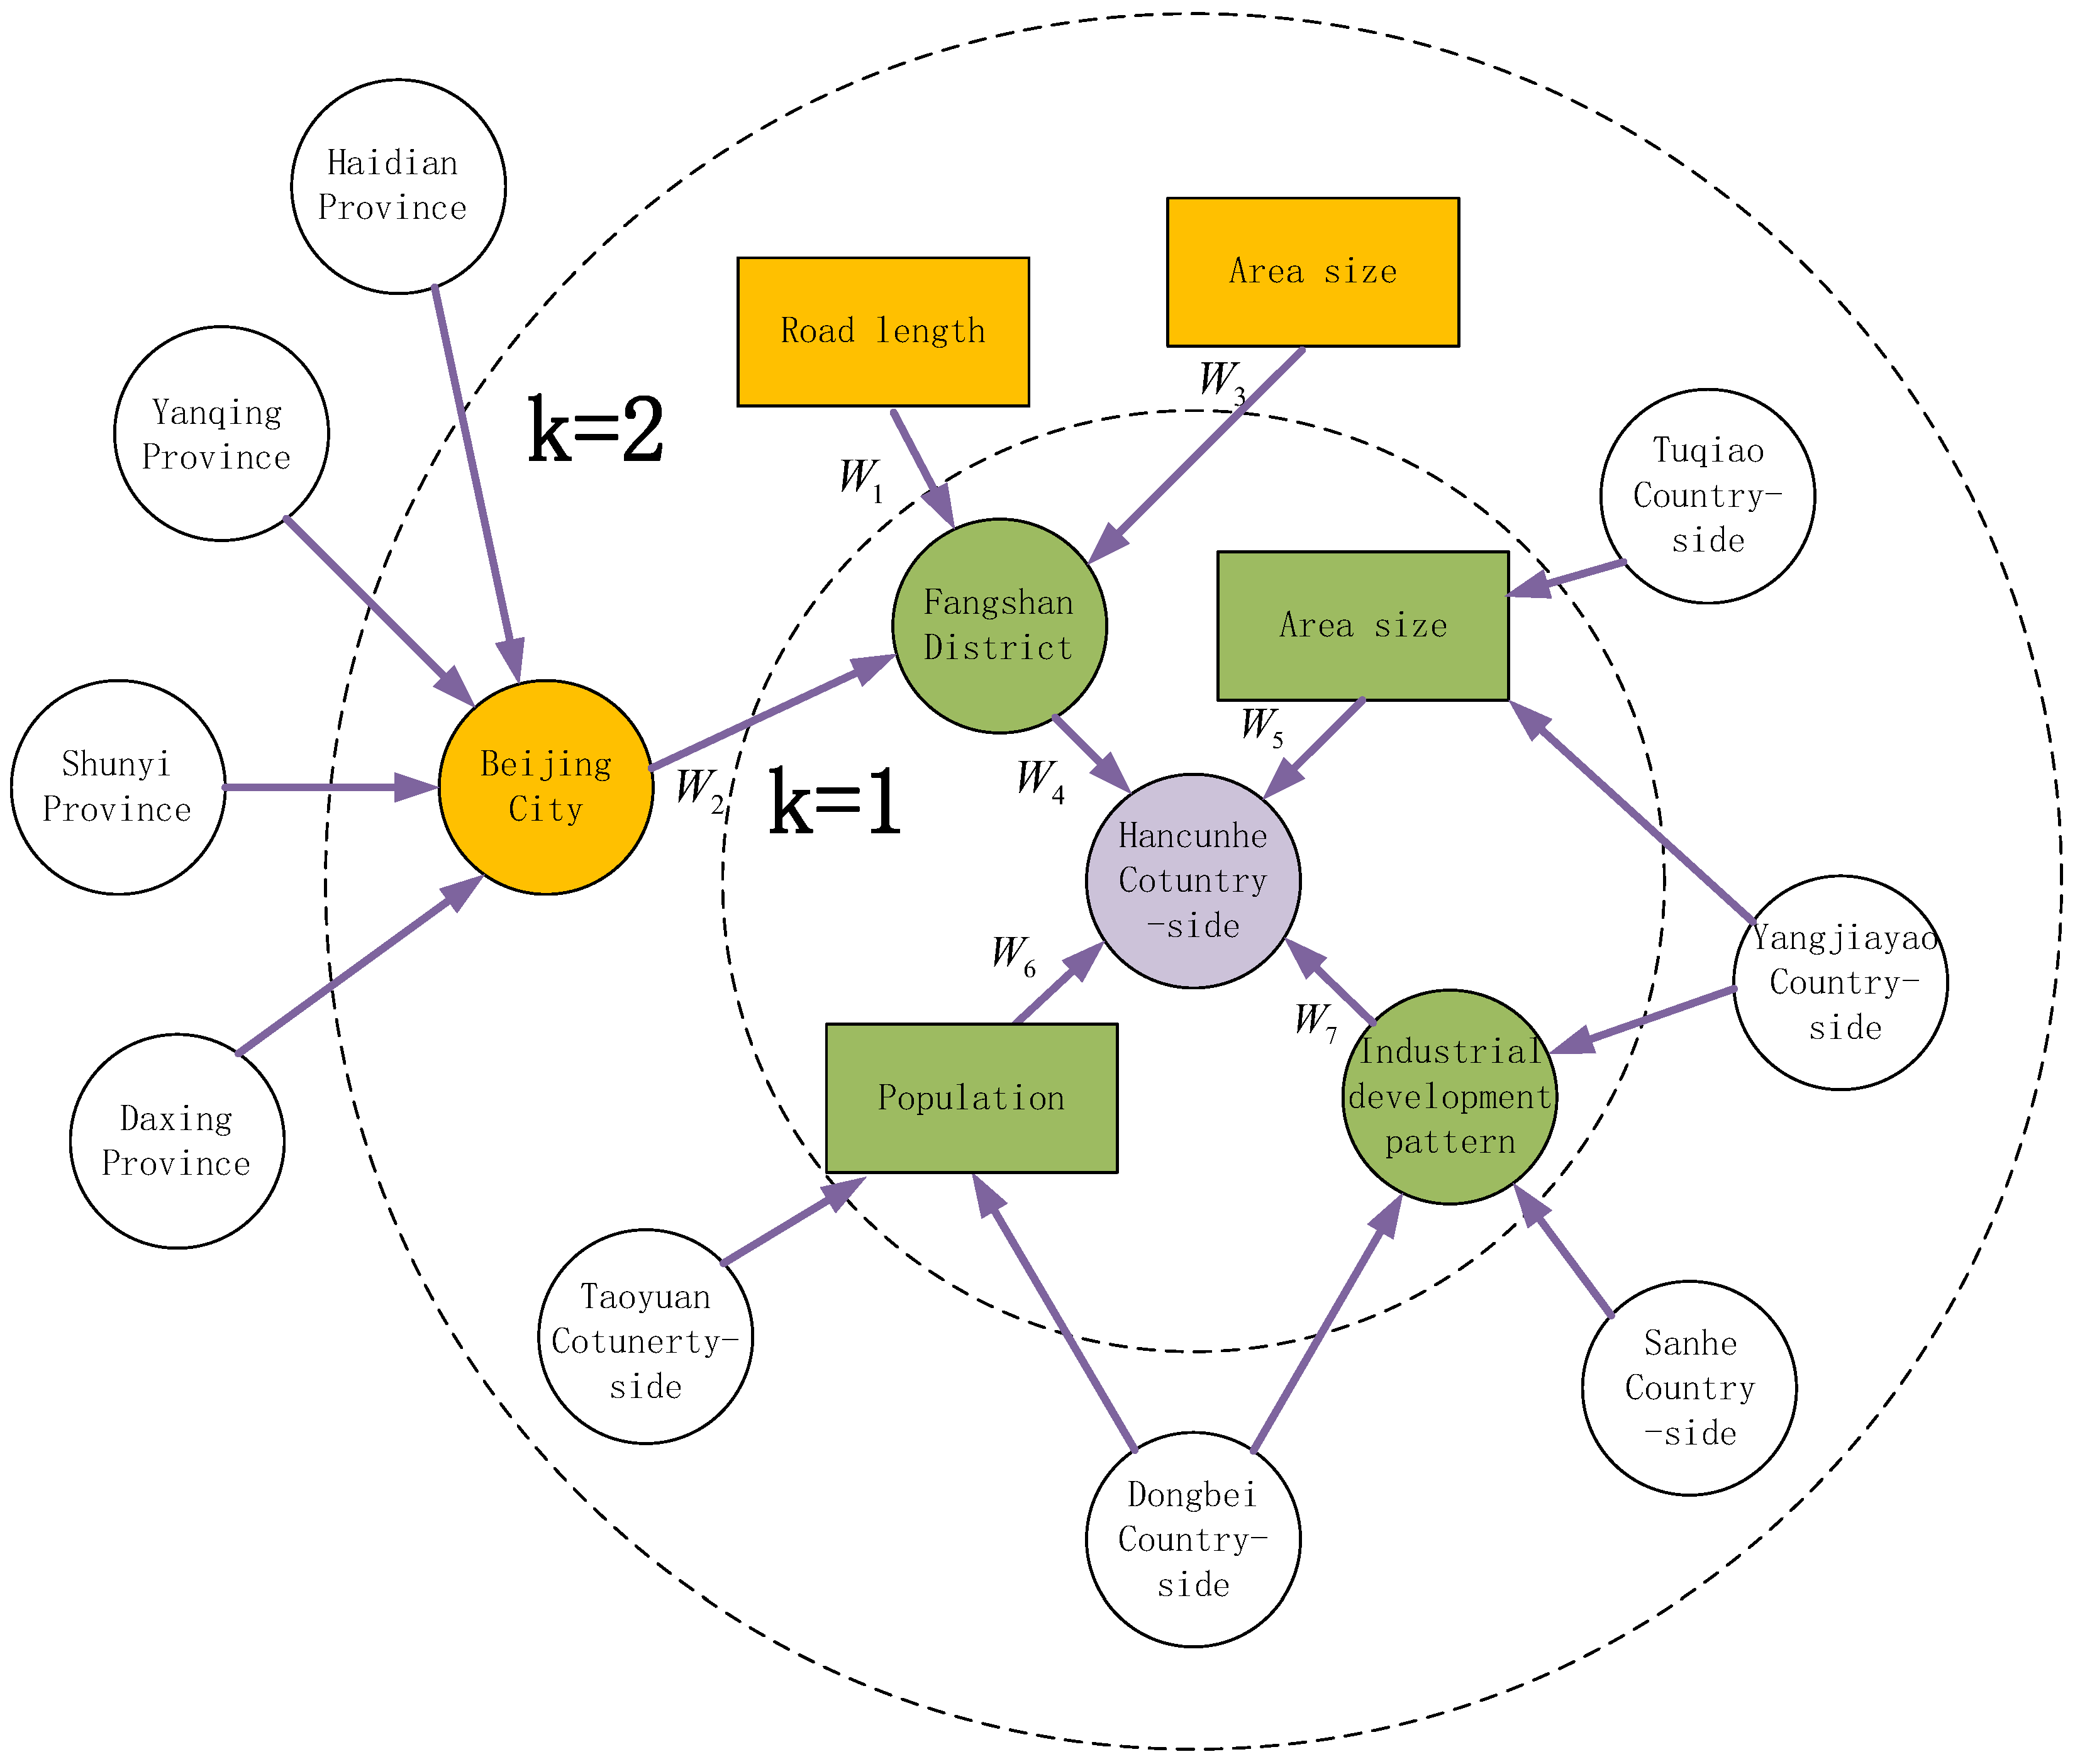
- Effect of neighbor aggregation size,: To analyze the effect of neighbor aggregation size on recommendation, we conducted several experiments with different neighbor aggregation size. The results were significant, therefore, the for the experiment was set to 2, which is based on the AUC values of the different experimental results, as shown in Table 4.
- Effect of iteration number,: As demonstrated in Table 5, the AUC first increased and then decreased with an increase in iteration number. When the iteration number is excessively small, training effect is not optimal. When the number of iteration times is 3 or 4, the AUC shows a significant decrease, because it brings much noise. Therefore, the best iteration number for the countryside ecological patterns recommendation scenario is set to 2.
- Effect of embedding dimensions,: In the experiment, we observed the effect of embedding dimensions on the utilization of the countryside knowledge graph. is set to 8 because the AUC is maximum when the number of embedding dimensions is 8, as shown in Table 6.
5.2. Discussion on KCN4CERP’s Application in Reality
6. Conclusions
Author Contributions
Funding
Data Availability Statement
Acknowledgments
Conflicts of Interest
References
- Adomavicius, G.; Tuzhilin, A. Toward the next generation of recommender systems: A survey of the state-of-the-art and possible extensions. IEEE Trans. Knowl. Data Eng. 2005, 17, 734–749. [Google Scholar] [CrossRef]
- Chicaiza, J.; Valdiviezo-Diaz, P. A comprehensive survey of knowledge graph-based recommender systems: Technologies, development, and contributions. Information 2021, 12, 232. [Google Scholar] [CrossRef]
- Wang, H.; Zhang, F.; Xie, X.; Guo, M. DKN: Deep knowledge-aware network for news recommendation. In Proceedings of the 2018 World Wide Web Conference, Lyon, France, 23–27 April 2018; pp. 1835–1844. [Google Scholar]
- Koren, Y. Factorization meets the neighborhood: A multifaceted collaborative filtering model. In Proceedings of the 14th ACM SIGKDD International Conference on Knowledge Discovery and Data Mining, Las Vegas, NV, USA, 24–27 August 2008; pp. 426–434. [Google Scholar]
- Yang, D.; Wang, Z.; Jiang, J.; Xiao, Y. Knowledge embedding towards the recommendation with sparse user-item interactions. In Proceedings of the 2019 IEEE/ACM International Conference on Advances in Social Networks Analysis and Mining, Vancouver, BC, Canada, 27–30 August 2019; pp. 325–332. [Google Scholar]
- Gu, Y.; Wu, Y.; Liu, J.; Xu, M.; Zuo, T. Ecological civilization and government administrative system reform in China. Resour. Conserv. Recycl. 2020, 155, 104654. [Google Scholar] [CrossRef]
- Jiang, B.; Bai, Y.; Wong, C.P.; Xu, X.; Alatalo, J.M. China’s ecological civilization program–Implementing ecological redline policy. Land Use Policy 2019, 81, 111–114. [Google Scholar] [CrossRef]
- Du, W.; Yan, H.; Feng, Z.; Yang, Y.; Liu, F. The supply-consumption relationship of ecological resources under ecological civilization construction in China. Resour. Conserv. Recycl. 2021, 172, 105679. [Google Scholar] [CrossRef]
- Wang, H.; Zhang, F.; Wang, J.; Zhao, M.; Li, W.; Xie, X.; Guo, M. Ripplenet: Propagating user preferences on the knowledge graph for recommender systems. In Proceedings of the 27th ACM International Conference on Information and Knowledge Management, Torino, Italy, 22–26 October 2018; pp. 417–426. [Google Scholar]
- Guo, Q.; Zhuang, F.; Qin, C.; Zhu, H.; Xie, X.; Xiong, H.; He, Q. A survey on knowledge graph-based recommender systems. IEEE Trans. Knowl. Data Eng. 2020, 34, 3549–3568. [Google Scholar] [CrossRef]
- Balabanović, M.; Shoham, Y. Fab: Content-based, collaborative recommendation. Commun. ACM 1997, 40, 66–72. [Google Scholar] [CrossRef]
- Pazzani, M.J.; Billsus, D. Content-based recommendation systems. In The Adaptive Web; Springer: Berlin/Heidelberg, Germany, 2007; pp. 325–341. [Google Scholar]
- De Campos, L.M.; Fernández-Luna, J.M.; Huete, J.F. Combining content-based and collaborative recommendations: A hybrid approach based on Bayesian networks. Int. J. Approx. Reason. 2010, 51, 785–799. [Google Scholar] [CrossRef]
- Konstas, I.; Stathopoulos, V.; Jose, J.M. On social networks and collaborative recommendation. In Proceedings of the 32nd International ACM SIGIR Conference on Research and Development in Information Retrieval, Boston MA USA, 19–23 July 2009; pp. 195–202. [Google Scholar]
- Zhou, K.; Zhao, W.X.; Bian, S.; Zhou, Y.; Wen, J.R.; Yu, J. Improving conversational recommender systems via knowledge graph based semantic fusion. In Proceedings of the 26th ACM SIGKDD International Conference on Knowledge Discovery & Data Mining, Virtual Event, CA, USA, 6–10 July 2020; pp. 1006–1014. [Google Scholar]
- Ji, S.; Pan, S.; Cambria, E.; Marttinen, P.; Philip, S.Y. A survey on knowledge graphs: Representation, acquisition, and applications. IEEE Trans. Neural Netw. Learn. Syst. 2021, 33, 494–514. [Google Scholar] [CrossRef] [PubMed]
- Xu, M.; Wang, S.; Song, C.; Zhu, A.; Zhu, Y.; Zou, Z. The Recommendation of the Rural Ecological Civilization Pattern Based on Geographic Data Argumentation. Appl. Sci. 2022, 12, 8024. [Google Scholar] [CrossRef]
- Wang, H.; Zhang, F.; Zhao, M.; Li, W.; Xie, X.; Guo, M. Multi-task feature learning for knowledge graph enhanced recommendation. In Proceedings of the World Wide Web Conference, San Francisco, CA, USA, 13–17 May 2019; pp. 2000–2010. [Google Scholar]
- Wang, H.; Zhao, M.; Xie, X.; Li, W.; Guo, M. Knowledge graph convolutional networks for recommender systems. In Proceedings of the World Wide Web Conference, San Francisco, CA, USA, 13–17 May 2019; pp. 3307–3313. [Google Scholar]
- Tobler, W.R. A computer movie simulating urban growth in the Detroit region. Econ. Geogr. 1970, 46 (Suppl. S1), 234–240. [Google Scholar] [CrossRef]
- Zhu, A.X.; Lu, G.; Liu, J.; Qin, C.Z.; Zhou, C. Spatial prediction based on Third Law of Geography. Ann. GIS 2018, 24, 225–240. [Google Scholar] [CrossRef]
- Yang, Y.J.; Xu, B.; Hu, J.W.; Tong, M.H.; Zhang, P.; Zheng, L. Accurate and efficient method for constructing domain knowledge graph. Ruan Jian Xue Bao/J. Softw. 2018, 29, 2931–2947. [Google Scholar]
- Bradley, A.P. The use of the area under the ROC curve in the evaluation of machine learning algorithms. Pattern Recognit. 1997, 30, 1145–1159. [Google Scholar] [CrossRef]
- Fawcett, T. An introduction to ROC analysis. Pattern Recognit. Lett. 2006, 27, 861–874. [Google Scholar] [CrossRef]
- Chen, X.; Liu, Y.; Li, F.; Li, X.; Jia, X. Remote sensing image recommendation based on spatial–temporal embedding topic model. Comput. Geosci. 2021, 157, 104935. [Google Scholar] [CrossRef]


| Variable | Meaning |
|---|---|
| Collections of patterns | |
| Collections of countryside | |
| An entity in | |
| An entity in | |
| The vector of countryside entity | |
| The final vector of countryside entity | |
| The set of all entities directly connecting to | |
| Countryside knowledge graph | |
| Predicted value that countryside suitable for pattern | |
| True value that countryside suitable for pattern | |
| Parameters of function | |
| The importance of relation on pattern | |
| The inner product function of relation and pattern | |
| The normalized | |
| The ith representation of neighborhood vector | |
| Neighborhood aggregation times | |
| Linear transformation matrix | |
| Bias of the stitching aggregation | |
| Loss function of and |
| Category | Name | Description of Countryside |
|---|---|---|
| Basic Information | ID | Identifier |
| QUXIAN | District | |
| SHI | City | |
| PROVINCE | Province | |
| POPULATION | Population | |
| ROAD | Road Length | |
| AREA | Area Size | |
| ROADDENSITY | Road Density | |
| Economic Information | GDP | Gross Regional Product |
| GDPP | GDP Per Capita | |
| FIRST | Primary Industry GDP | |
| SECOND | Second Industry GDP | |
| THIRD | Tertiary Industry GDP | |
| Ecological Information | FARM | Cultivated Land Area |
| GRASS | Grassland Area | |
| FROST | Woodland Area | |
| WATER | Water Area | |
| WATERDENSITY | Water Density | |
| LIVINGDENSITY | Biological Density | |
| VEGETATIONDENSITY | Vegetation Cover | |
| FROSTDENSITY | Forest Cover | |
| DROUGHT | Drought Degree |
| AUC | F1 | Recall | ACC | |
|---|---|---|---|---|
| KGCN4CEPR | 0.6237 | 0.6379 | 0.5677 | 0.6094 |
| RippleNet | 0.5933 | 0.6027 | 0.5307 | 0.5806 |
| MKR | 0.5843 | 0.5797 | 0.5012 | 0.5758 |
| SVD | 0.5015 | 0.5510 | 0.3274 | 0.4737 |
| s | 2 | 4 | 8 | 16 |
|---|---|---|---|---|
| AUC | 0.5738 | 0.5981 | 0.6237 | 0.6094 |
| H | 1 | 2 | 3 | 4 |
|---|---|---|---|---|
| AUC | 0.5847 | 0.6237 | 0.5783 | 0.5526 |
| d | 4 | 8 | 16 | 32 |
|---|---|---|---|---|
| AUC | 0.6082 | 0.6237 | 0.5918 | 0.5738 |
Publisher’s Note: MDPI stays neutral with regard to jurisdictional claims in published maps and institutional affiliations. |
© 2022 by the authors. Licensee MDPI, Basel, Switzerland. This article is an open access article distributed under the terms and conditions of the Creative Commons Attribution (CC BY) license (https://creativecommons.org/licenses/by/4.0/).
Share and Cite
Zeng, X.; Wang, S.; Zhu, Y.; Xu, M.; Zou, Z. A Knowledge Graph Convolutional Networks Method for Countryside Ecological Patterns Recommendation by Mining Geographical Features. ISPRS Int. J. Geo-Inf. 2022, 11, 625. https://doi.org/10.3390/ijgi11120625
Zeng X, Wang S, Zhu Y, Xu M, Zou Z. A Knowledge Graph Convolutional Networks Method for Countryside Ecological Patterns Recommendation by Mining Geographical Features. ISPRS International Journal of Geo-Information. 2022; 11(12):625. https://doi.org/10.3390/ijgi11120625
Chicago/Turabian StyleZeng, Xuhui, Shu Wang, Yunqiang Zhu, Mengfei Xu, and Zhiqiang Zou. 2022. "A Knowledge Graph Convolutional Networks Method for Countryside Ecological Patterns Recommendation by Mining Geographical Features" ISPRS International Journal of Geo-Information 11, no. 12: 625. https://doi.org/10.3390/ijgi11120625
APA StyleZeng, X., Wang, S., Zhu, Y., Xu, M., & Zou, Z. (2022). A Knowledge Graph Convolutional Networks Method for Countryside Ecological Patterns Recommendation by Mining Geographical Features. ISPRS International Journal of Geo-Information, 11(12), 625. https://doi.org/10.3390/ijgi11120625