Article

Landscape Visual Impact Evaluation for Onshore Wind Farm: A Case Study

School of Art Design and Media, East China University of Science and Technology, Shanghai 200237, China
ISPRS Int. J. Geo-Inf. 2022, 11(12), 594; https://doi.org/10.3390/ijgi11120594
Submission received: 29 August 2022 / Revised: 18 November 2022 / Accepted: 24 November 2022 / Published: 26 November 2022

Abstract

:
Wind energy is an effective solution for achieving the carbon-neutrality target and mitigating climate change. The expansion of onshore wind energy evokes extensive attention to environmental impact in the locality. The landscape visual impact has become the critical reason for the local protest. This paper proposed a landscape visual impact evaluation (LVIE) model that combines the theoretical framework and practical solutions and optimizes the onshore wind farm planning procedures. Based on the theoretical research on landscape connotation, the evaluation principles, criteria, and a quantitative indicator set is constructed for LVIE model with three dimensions: landscape sensitivity, the visual impact of WTs, and viewer exposure. The practicality of this evaluation model is conducted through multi-criteria GIS analysis by the case study of Friedrich-Wilhelm Raiffeisen Wind Farm in Germany. The evaluation results illustrate detailed, visualized outcomes of landscape visual impact that are deeply combined with planning procedures. The innovation of this paper is to refine the form of evaluation results, optimize the procedures of wind farm planning, and enable cooperation between different planning departments and stakeholders with definite, visible, user-friendly evaluation results. This research provides precise comparison opportunities for different projects or the same project at different periods to obtain quantitative conclusions and feedback information. This paper enhances the accurate processing of multiple information and standardization process in wind energy visual impact evaluation.

1. Introduction

Onshore wind energy is one of the effective solutions for achieving the carbon-neutrality target under global climate change issues [1]. Its clean, stable, and renewable characteristics contribute to sustainable development and carbon emissions reduction. However, the extensive installation of wind turbines (WTs) poses challenges for spatial planning and environmental protection. With the growing height of WTs, their visual impact, as well as noise, shadow flicker, impact on wild animals, and micro-climate, have received more attention during planning procedures in the locality [2,3]. The unavoidable landscape visual impact has become a critical reason for local resistance [4].
Following the rapid expansion of wind energy at the beginning of the 21st century, Germany, Denmark, Spain, and other developed countries known for renewable energy have developed various approaches to landscape visual impact evaluation in wind farm planning. These approaches can be classified into three paradigms: (1) quantitative assessment methods; (2) guidelines based on qualitative analysis; and (3) comprehensive simulation and evaluation with computer-aided tools.
The quantitative assessment methods advocate expert participation, standardized evaluation process, and quantitative analysis free from any influence from landscape viewers [5]. A decisive conclusion can be provided to demonstrate the degree of visual impact or decide how much the wind company should pay for the compensation [6,7,8,9,10,11]. The result is single-dimensional and succinct, usually used in conclusion-oriented planning implementation. However, the evaluation results are not user-friendly enough for planners and other stakeholders to obtain helpful information and participate effectively in the decision-making.
The guidelines based on qualitative analysis are widely used for the visual impact and landscape amenity during wind farm planning in the United Kingdom [12,13,14,15,16], Germany [17,18], Australia [19,20], and New Zealand [21]. Usually, the local government issues a guideline for a specific region, including integrated targets for development and protection with many qualitative descriptions. The suggestions in guidelines are more flexible and subjective than laws and regulations, available for various implementations at the regional level. However, it is difficult to make a quantitative horizontal comparison between cases. The evaluation procedures in guidelines heavily rely on evaluators with a large number of subjective descriptions. Therefore, the reliability and accuracy of the conclusion are under suspicion and received criticism.
With the upgrade of the comprehensive simulation model and multi-criteria decision frameworks, renewable energy planning targets, combined landscape visual impact evaluation, land use allocation, ecological protection, and specific human activities, can be taken into consideration to achieve multi-dimensional dynamic analysis, as well as decision-making and real-time supervision. Virtanen et al. [22] analyzed high-dimensional spatial data for wind energy planning with a spatial prioritization software Zonation. Pınarbaşı et al. [23] developed a spatial planning model based on Bayesian belief networks to identify spatially explicit site feasibility for offshore wind farms. Göke et al. [24] utilized the decision support tool Marxan to meet the offshore wind planning targets and avoid conflicts with critical ecological features. Various software and integrated methods have enriched the instruments of wind farm planning, accurately covered potential factors, and led to a more rational and accurate analysis to support the decision-making.
This paper aims to construct a theoretical framework and solutions-based landscape visual impact evaluation (LVIE) model. In line with the target of optimizing the onshore wind farm planning procedures, the LVIE model has decomposed the visual impact into three dimensions: landscape sensitivity, the visual impact of WTs, and viewer exposure. Based on the theoretical research on landscape connotation, the evaluation principles, criteria, and quantitative indicators are integrated into the LVIE model, and the evaluation is conducted in the case study of Friedrich-Wilhelm Raiffeisen Wind Farm in Germany. The innovation of this paper is to refine the form of evaluation results and integrate the results deeply with the planning implementation from the perspectives of various stakeholders and authorities. It optimizes the procedures of wind farm planning and enables cooperation between different planning departments and stakeholders with definite, visible, and user-friendly evaluation results. Additionally, this method allows horizontal comparison of visual impact in different geographical conditions. Specific solutions for visual impact mitigation can be put forward in the standardized planning framework.
This research can be divided into four parts: Section 1 and Section 2 introduce the research background and construct the theoretical model for landscape visual impact evaluation (LVIE). Section 3 explains the research methodology and detailed process in evaluation. Section 4 illustrates the evaluation results of visual impact in a visualized chart. Section 5 and Section 6 put forward recommendations to improve wind energy planning procedures under evaluation results.

2. Theoretical Model

In this section, landscape visual impact evaluation (LVIE) is firstly proposed as a theoretical framework for detecting and analyzing the landscape visual quality and the visual impact of the onshore wind farm upon the landscapes. The visual impact is directly related to the visual quality of the landscape and the characteristics of the visual perception of the proposed objects. The LVIE model is based on a comprehensive theoretical research foundation that involves the whole procedure of evaluation, such as value orientation discrimination, evaluation scope determination, evaluation indicator selection, available information collection, and the detailed grading of each indicator. The model aims to identify the potential visual impact caused by WTs in specific landscape types and to find viable measures to mitigate or reduce the impact. The evaluation method is a practical solution for balancing landscape protection and wind energy development in planning procedures, which can provide a professional judgment on the magnitude of visual impact and the significance of the impact in a logical and objective well-reasoned model. Furthermore, the evaluation conclusion provides a scientific and quantitative reference for the decision on whether the site selection of a wind farm can be approved and makes recommendations for the follow-up compensation and management measures.

2.1. Theoretical Framework

The theoretical framework of LVIE model is illustrated in Figure 1, which consists of three interacting bodies: landscape, wind turbines, and viewers. The process of LVIE can be understood as a process of judging whether the current situation meets the value standards put forward by the evaluator or not. The LVIE theoretical framework involves the connotation of the above three factors and the interdisciplinary theoretical knowledge among these factors as well. The potential factors and relevant theoretical knowledge will be discussed and integrated into the LVIE model to construct a multi-dimensional framework with mutually constrained indicators.

2.2. Landscape Sensitivity

Landscape sensitivity refers to the extent to which the character and quality of the landscape are susceptible to change as a result of wind farm installation with high visual impact. In order to research landscape quantitatively and objectively, the concept of the landscape will be further decomposed. According to Linke’s research, the whole landscape can be decomposed into elements (essentialist approach), structure (positivist approach), and function (constructivist approach) dimensions [25]. Table 1 presents the theoretical foundation of the landscape decomposition process.

2.3. Visual Impact of WTs

According to theories of visual perception [26], landscape visual impact is complicated to measure since it is related to land cover and vertical constructs on the ground and decreases with distance nonlinearly. In this section, the research on visual impact can be divided into three parts:

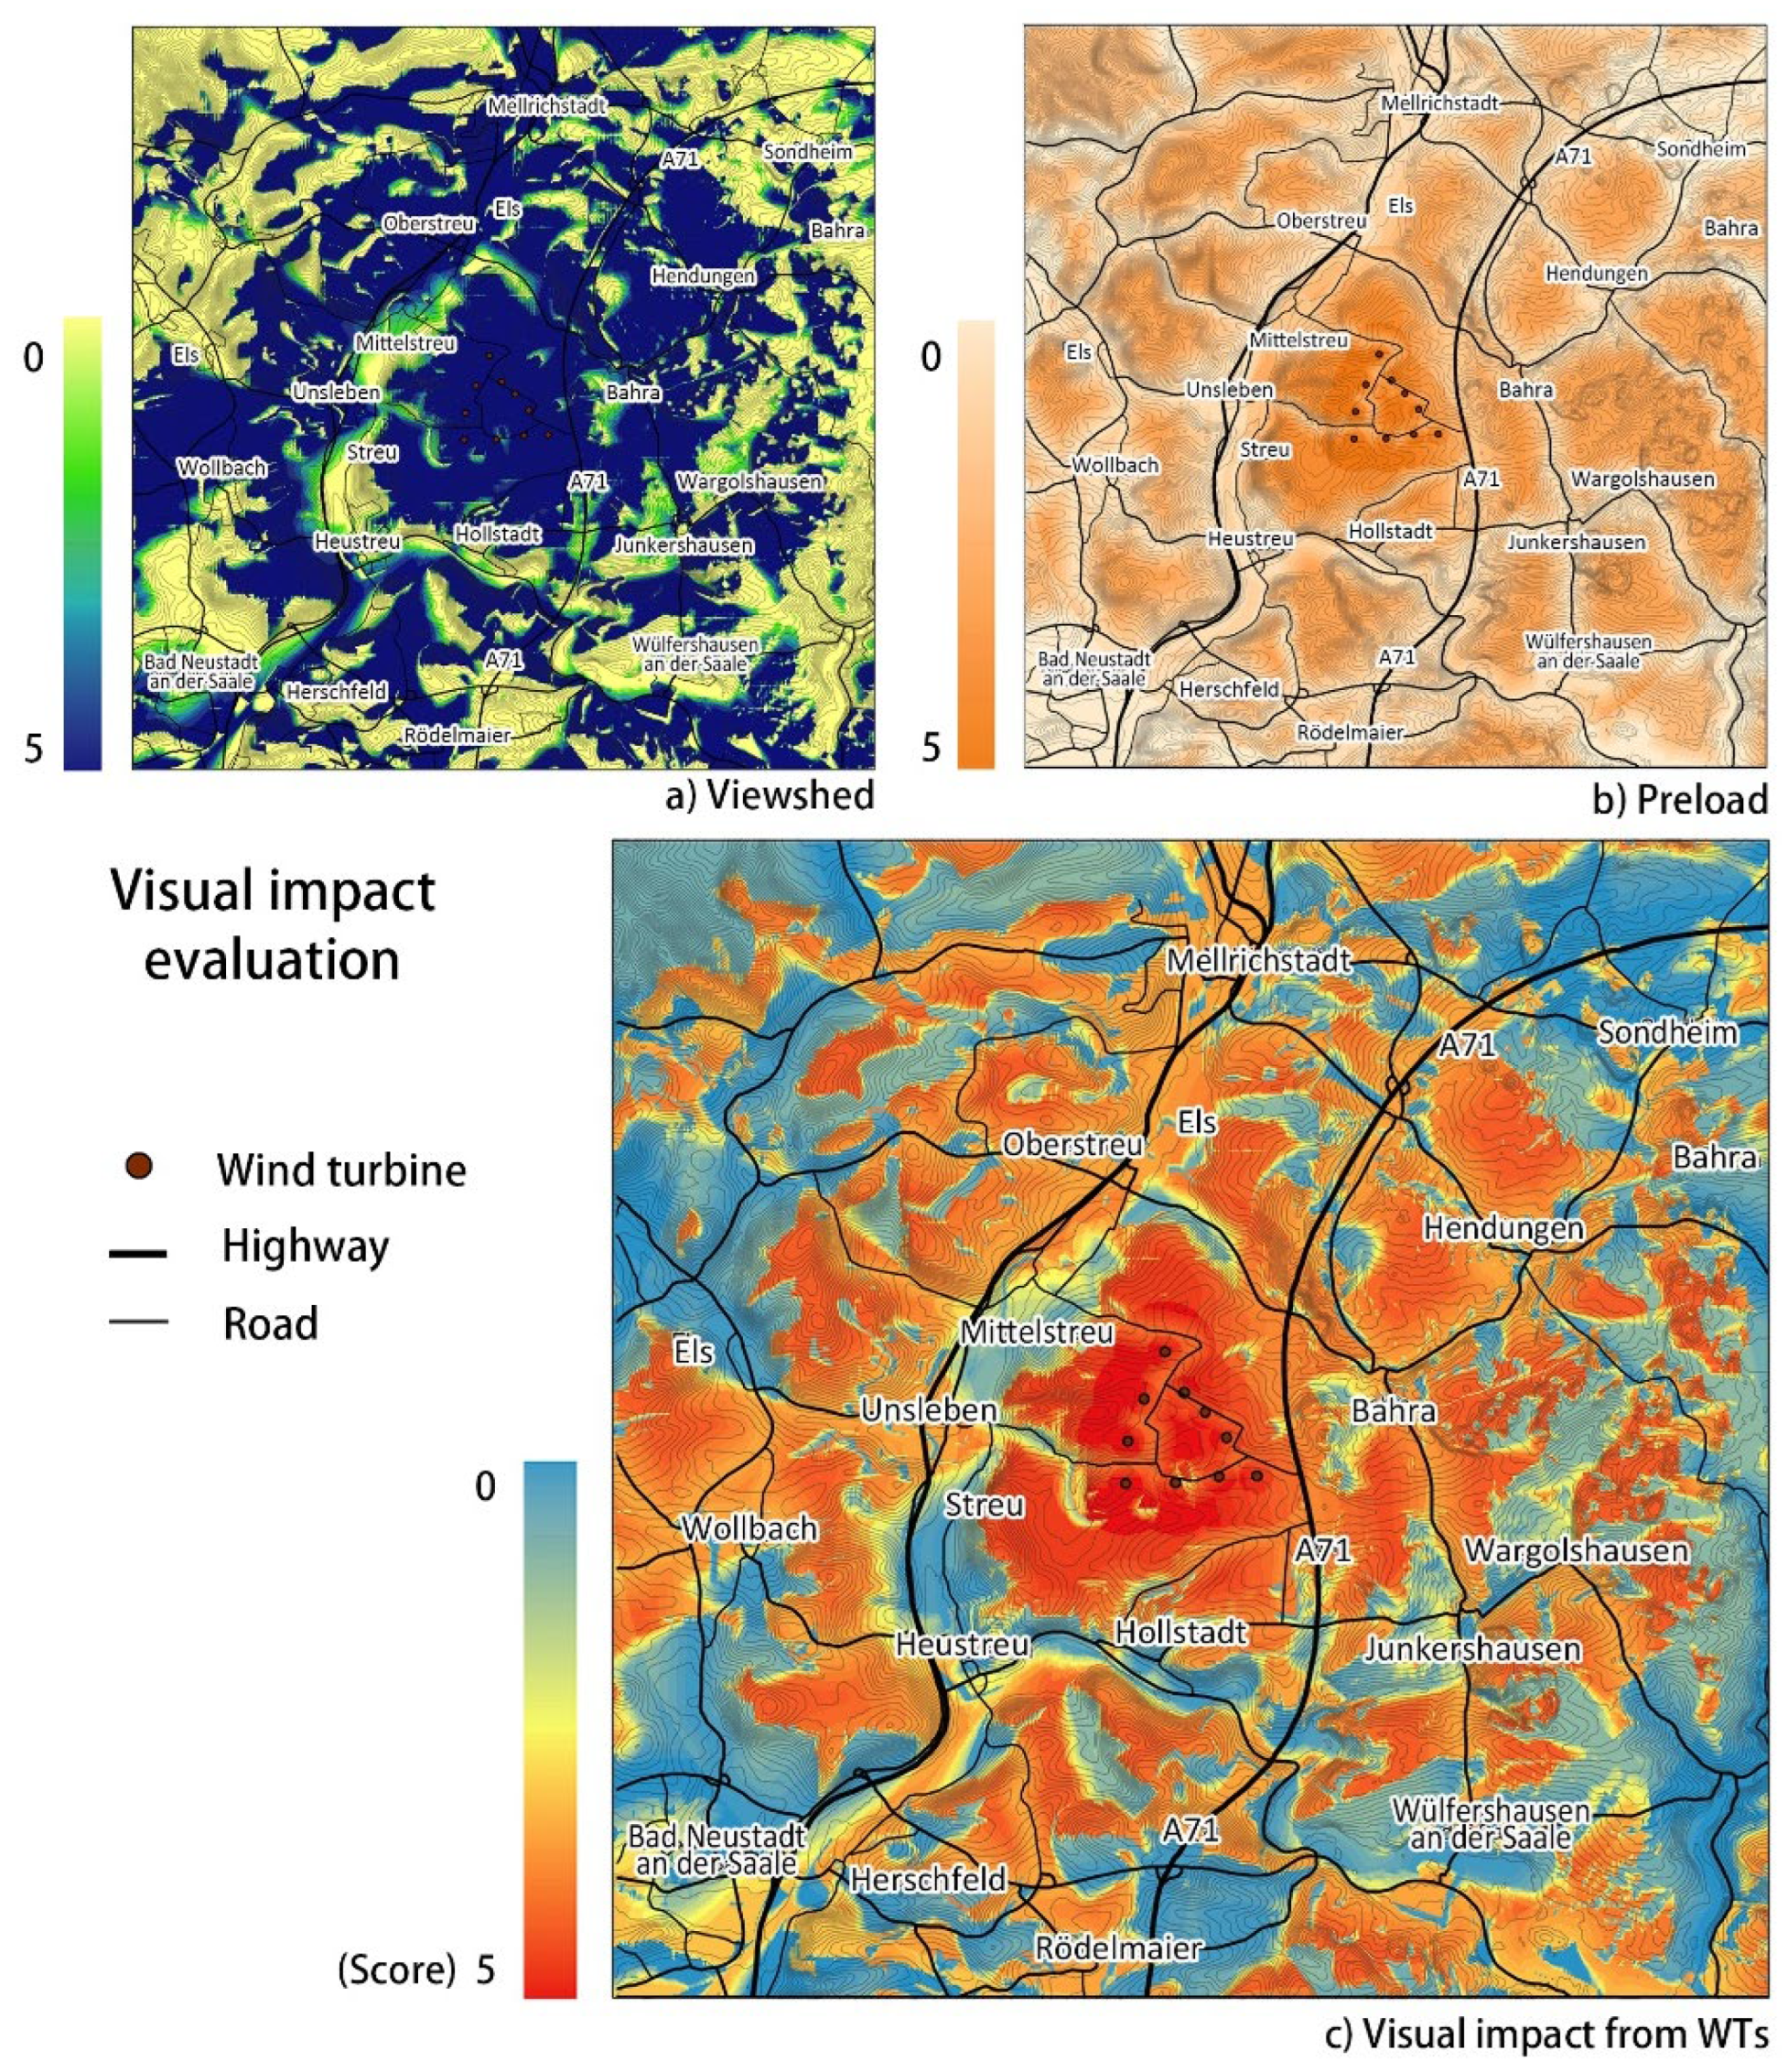
2.3.1. Theoretical Visibility Zone (TVZ) and Actual Visibility Zone (AVZ)

For the evaluation of the visual impact, an essential prerequisite is to detect the visible zone of WTs. With computer-aided tools such as GIS, the theoretical visibility zone (TVZ) is easily achieved through the analysis of the digital elevation model (DEM), the coordinates, and the height of WTs. However, the actual situation is far more complicated than the theoretical model, and more factors need to be considered in reality. For instance, the surface ground is not as flat as a digital terrain model. Any vertical structures (vegetation and artificial constructs) can be obstacles to viewing the WTs. Climate conditions and air quality also influence the actual visibility range. With more advanced technologies and the involvement of new parameters, computer simulation results are getting closer to reality.

2.3.2. Visual Impact and Distance Classification

Real visual impacts are not linearly reduced with distance [8]. The method of distance classification is a combination of human physiological vision, empirical studies, and normative prescriptions or conventions. The curve describing the relationship between visual impact and distance is also taken into consideration in this partition [27]. Usually, the visual impact areas are divided into several zones in terms of distance, such as near, medium, and far zones.
The method of fixed distance has been widely used in wind farm buffer distance assignation. However, it does not consider the growing height of WTs. The method of multiplying the turbine height has been used again, which was first mentioned by Grauthoff in 1991. Schöbel [28] analyzed the relationship between visual quality and viewing angle (or the proportional ratio between the height of objects and viewing distance), which laid the theoretical foundation for setting buffer according to the multiplication of the turbine height. In Germany, the requirements for the buffer distance of WTs are strictly listed and vary in different states: Schleswig-Holstein requires a 3H buffer distance between WTs and residential areas, while North Rhine-Westphalia 5H and Bavaria 10H [29,30]. The different attitudes toward wind energy depend on local industries, cultural identity, and the support rate for wind energy.

2.3.3. Preload

Preload refers to the fact that people have relatively high acceptance when the visual impression is already dominated by technical or industrial structures in the locality. In these areas, which are generally characterized by a relatively low regional identification, newly installed wind farms have no significantly negative effect because local people are less sensitive to installed wind farms in constructed areas than those on virgin land, which is already proved by some cases [31,32]. The concentration of WTs, which causes preload, can reduce the proportion of the influenced population and influenced areas in a macro background and protect some precious natural resources, but cause more serious visual impact to overlapping in specific concentration zones.
From the perspective of the project, preload helps the project to achieve approval quickly. With the preload, the project evokes less protest and requires less compensation than those constructed on virgin land. However, in terms of aesthetics, the visual impact on landscape has not been mitigated in regions with high acceptance. On the contrary, the visual impact is even more significant in “concentration zones” than that on virgin land, which is opposite to the German constitutional goals for spatial planning, that is, the equality of living conditions between different communities. The landscape visual quality in priority areas should be controlled and meet the statutory requirement. However, different standards should be set for suitability areas and exclusion areas.

2.4. Viewer Response

The “viewer response” refers to the subjective response from the viewer based on the perception of the visual information. It mainly depends on how the viewers perceive and judge the landscape visual impact. “Viewer”, the critical participant in the visual impact evaluation, is the most unpredictable factor. Various factors can help the researchers approach the viewer effectively, which can be categorized into subjective features (viewer sensitivity) and objective influence from the outside (viewer exposure).

2.4.1. Viewer Sensitivity

Viewer sensitivity refers to various individual subjective aspects such as identity, aesthetic preferences, disposition, personal feelings about specific sites, expectations, occupation, and personal experiences [33,34,35]. Different characters and cultural backgrounds determine various attitudes towards wind farm projects. These individual aspects constantly change with the surrounding environment [35].
However, when people experience the landscape, some impressions or emotions, such as pleasure or disturbance, are formed directly in their subconsciousness [36]. We cannot distinguish the specific reasons why we prefer or dislike certain landscape, not to mention quantify the contribution of each reason. The affective response to landscapes can be explained by “landscape preference models” based on qualitative analyses through extensive and empirical social–scientific investigations on site. Preference models can reveal a high level of commonality within cultures and regions.
In the evaluation of viewer sensitivity, personal experiences and individual characters are usually neutralized by large samples. Therefore, individual preference causes little effect on the conclusion in empirical research, even personal ties to specific sites would not be shown [37].

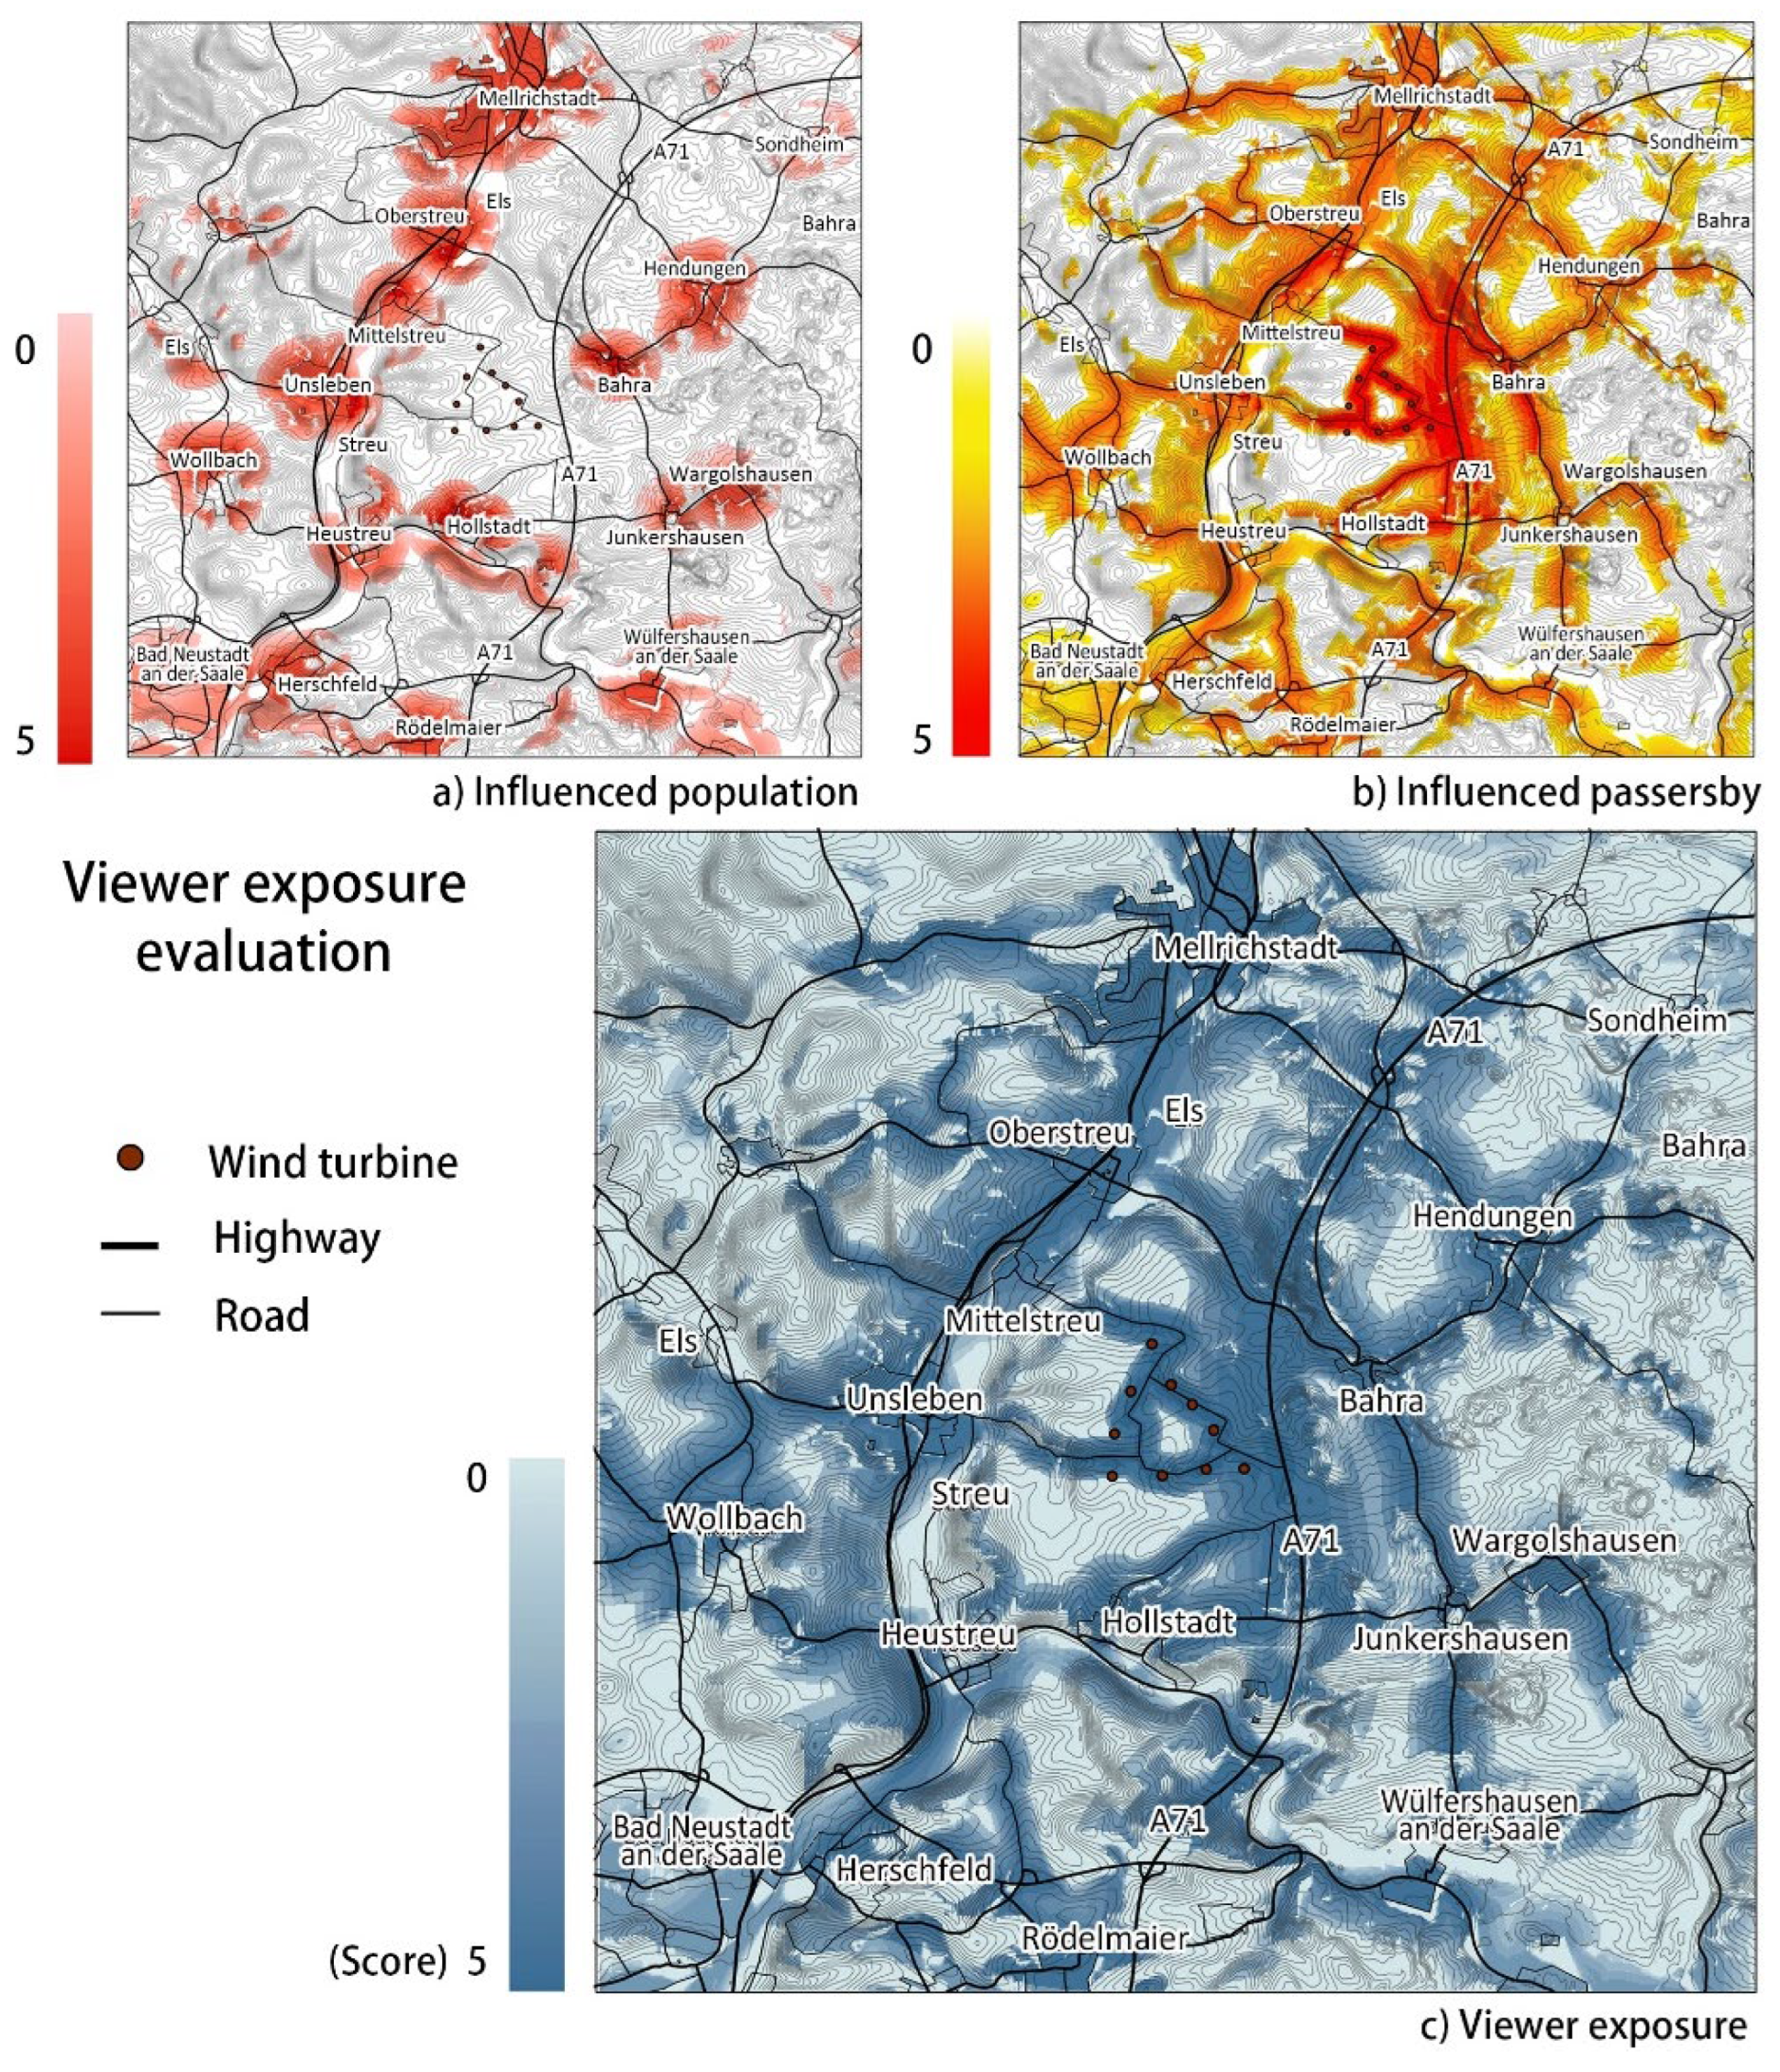
2.4.2. Viewer Exposure

Viewer exposure refers to the proportion of the population under the influence of visual impact, which is restricted by external conditions. For instance, the distance, relative position, relative movement status, the frequency of visual impacts, and weather conditions (visibility) can influence the visual perception of the viewers. To some extent, visual exposure is objective and can be quantified for providing references for planners and decision-makers.
  • Influenced population
In the research area, residents directly faced with the rotating WTs usually hold the most negative attitude supported by the theory of NIMBYism (not-in-my-back-yard) [38,39]. Molnarova et al. [40] prove that households close to wind farms are the primary victims of visual impact. Their visual experience should be protected or compensated. According to the research of Strumse [41] in Norway, when the influenced population reaches 30%, it is not suggested to construct new wind farms nearby. Hallan and González [42] introduce population data in their research on wind farm planning and draw comparative results over several years on spatial analysis. The common point is that the proportion of the affected population in the research area usually reflects the intensity of visual impacts.
  • Influenced passersby
The landscape sightline refers to the sight corridor with high aesthetic value. It contains observation points, appropriate distance, and viewing targets [43]. WTs may obscure the aesthetically pleasing sight corridor, and the original landscape structure and aesthetic value may be seriously damaged. The residents, tourists, and passersby may also suffer visual impacts during travel. In addition, roads with different traffic flows should be given different weights. Cowell et al. [44], Latinopoulos, and Kechagia [45] have considered road access and visual impact during transportation in their wind farm spatial analysis research.
In summary, the method to quantify “viewer exposure” is to combine different approaches such as topography, residential land use, surface constructs, as well as counting the exposure of roads to WTs. Rather than calculating the absolute value of exposure degree, this method provides a benchmark for comparison [46].

2.5. Evaluation Indicator Set

Table 2 lists the target, theoretical foundation, variables, factors, and parameters in a hierarchical structure, demonstrating potential indicators influencing visual impact and systematically explaining how WTs impact landscape visual quality.
In terms of content, the influence factors can be categorized into three groups: landscape sensibility, the visual impact of WTs, and viewer exposure (Figure 1). They reflect the mechanisms of how the visual impact is generated by WTs upon the landscape and perceived by the viewers. Here the viewer response is replaced by view exposure. Viewer sensitivity in the theoretical framework is removed in the evaluation indicator set because the personal experiences and individual characters are usually neutralized by large samples. The objective outcome of viewer exposure is more representative and practicable for evaluation.

3. Methodology

3.1. Research Method

The complete process of the LVIE consists of five steps.
  • Establishing the theoretical framework of evaluation: through the literature review and expert interview, potential factors causing landscape visual impact are collected and classified into three main factors (landscape, WTs, and viewers) within a theoretical framework. The theoretical framework deals with the relationships among related indicators and interdisciplinary knowledge.
  • Transforming the potential factors into indicators: the process of specification, that is, how to select indicators, needs to combine the theoretical framework with the problems and requirements of planning. The indicators should be sensitive enough to reflect the slight and subtle changes in the evaluation object.
  • Seeking available data sources: only official and updated databases and data collected from planning authorities can be used as input data in evaluation, which aim to ensure the reliability and precision of the evaluation result.
  • Conducting the evaluation: the score of each indicator would be added according to the calculation method in GIS to obtain the complete result of the evaluation.
  • Proposing mitigation and compensation solutions based on the visualized and quantitative evaluation results.

3.2. Site Selection

The project named Friedrich-Wilhelm Raiffeisen Wind Farm Streu & Saale was approved on 7 May 2012 and built-in May 2017 and officially operated in September 2017 by WT manufacturer Senvion. It is located in the Main-Rhön region, northwest of Bavaria, adjacent to two states: Hessen and Thuringia (Figure 2). Its geographical coordinates are between 10°17′11″ to 10°18′29″ Eastern longitude and 50°22′16″ to 50°23′7″ Northern latitude.
The wind farm consists of 10 WTs in the type of Senvion 3.4 M 122 NES, each with a nominal output of 3.4 MW and a total height of 200 m (hub height 137 m and rotor diameter 126 m). They are erected on the farmland with a total capacity of 34 MW.
The project is located in the natural subdivision “Grabfeld”, which is characterized by a flat but slightly undulating landscape. The north of the study area are the foothills of the Thuringian Forest. The wind farm is located on an open plateau with the altitude from 222 to 523 m, which drops relatively steeply to the scattering Saale valley, whereby a far-reaching effect of the project is generated, and the project then affects the landscape. The plateau is characterized by intensively used agricultural land, which is interrupted by small forests, fields, and hedges.
According to the master plan (Figure 3), the WTs are erected on the farmlands in the west of the A71 motorway. The nearest villages—Hollstadt (1524 inhabitants) and Unsleben (939 inhabitants)—are less than 1500 m away from the WTs. All sites are located on intensively cultivated land. An area of 380 m2 will be used per foundation. Additionally, the scrapped crane platforms for construction, maintenance, and repair work comprise approximately 1.44 Hectares. In the west of the site, there are ecological protection areas: drylands of Mittelstreu with 263.6 Hectares (4th level) and Bavarian Rhön with 7601 Hectare (5th level). Nearby the wind farm, there are some recreational sites: Wechterswinkel Abbey, Schlossmühle, Floriansbrunnen, and Kirchenburg Ostheim. There are also three cultural heritages nearby: Katholische Kirche, Hohntor, and Südwestliche Stadtmauer. The emissions impacts, such as noise, shadow flicker, optical distress, visual impact, and impact on cultural heritages, are included in the environmental impact assessment.

3.3. Data Process

The case studies are conducted on ArcGIS 10.6 from the Environmental Systems Research Institute (ESRI) with the functions of spatial analysis and three-dimensional analysis. The digital landscape model is generated through the combination of the digital elevation model (DEM), digital surface model (DSM), and the cartography of land use in GIS. The cartography of land use is the official planning data that decide the height constraint of the DSM and spatial capacity. These are open data available on the official websites of local governments. Before the data processing, the basic parameters, cartographic specifications, and data sources need to be determined and unified.
  • Determine the actual effective area of visual impacts, which is influenced by the scale and accuracy of the cartography. According to the discussion in Section 2, the fixed distances cannot accurately capture the range of influence, which should be replaced by the multiple of the height of WTs (or visual angle). In the digital landscape models, 30H is selected as the range of research area, corresponding to 6 km in the research case.
  • Collect the following data: satellite images from ArcGIS Earth 10.6; ATKIS-DLM250-DATA (The Digital Landscape Model 1:250,000 is a part of the Official Topographic-Cartographic Information System, which includes the layers of elevation, land use, natural protection areas, administrative regions, and transportation. Source: www.bkg.bund.de); fieldwork and interviews (experts, residents, and companies) for collecting first-hand information such as ecology, vegetation, social acceptance of WTs, and project implementation.
The resolution of the resulting image is assigned with a 20 m grid-resolution that can distinguish large obstacles on the ground, such as forests and building groups. The results are then displayed cartographically on a scale of 1:80,000.

4. Results

4.1. Results of Landscape Sensitivity Evaluation

Landscape sensitivity is an indicator for determining the visual capacity of WTs within a specific research space. It refers to a level above which visual impact on the landscape is no longer tolerated. In the evaluation model, landscape sensitivity consists of three indicators: landscape element, landscape structure, and landscape function. Landscape element refers to the land use that makes up the landscape. In Figure 4a, the WTs are surrounded by farmland, with villages along the rivers and forests on the periphery. The landscape structure is related to the form of spatial combination, the relationship among elements, and the scale of elements that make up the landscape. Figure 4b combines the variables of visibility, visual threshold, patch density, and diversity, showing a discrete distribution pattern of high sensitivity in the central region. Figure 4c illustrates the distribution of areas with high ecological, cultural, and recreational values, which concentrate on the west side of the Streu river, and along the banks of the Bahra and Fränkische Saale rivers.
The evaluation result (Figure 4d) represents the landscape sensitivity degree with a research scope based on the buffer distance of 30 H (30 × 200 m). Each raster is assigned a score from 0 to 5. A score of 0 means low sensitivity, and a score of 5 refers to high sensitivity. According to the geographical information statistics based on the layer of “landscape sensitivity” in GIS, the average score of landscape sensitivity in the research area is 2.61 (a scale between 0 and 5). The sensitivity degree is closely connected to the naturalness of the landscape [47]. For instance, the ecological protection areas (e.g., drylands of Mittelstreu and Bavarian Rhön) located west of Streu River, and areas near the water areas (e.g., Eis, Streu, Bahra, and Fränkische Saale) are highly sensitive. While the agricultural land near the wind farm site has a medium degree of sensitivity. Other resources, such as cultural heritage, recreational sites, and forest are also affected by WTs, as illustrated in Figure 4d.
The results of the landscape sensitivity evaluation are also related to the landscape structure. The plots with high integrity are less sensitive, such as the farmland and valley areas, while the areas that are artificially fragmented by roads and facilities are more sensitive. Moderate sensitivity was also present along several river banks.

4.2. Result of Visual Impact of Wind Turbines

The visual impact of WTs is a combination of indicators of multiple viewpoint viewshed and preload. The viewshed is the visibility of the research area that indicates whether or not the viewpoints can be seen from particular observer grids. The viewshed algorithm used in ArcGIS determines the visibility for each grid-cell center by comparing the vertical angle to the center of the cell with the vertical angle to the local horizon.
Viewshed analysis is binary in the sense that an object is either visible or invisible. However, when the viewpoints are not single (such as 10 WTs in this case), the viewsheds have to be accumulated. The result of the multiple viewpoint viewshed analysis is thus a continuous raster map with scores ranging from 0 to 5 (Table 2). Figure 5a illustrates the area statistics values for each level of visibility in GIS: 33.57% of areas have a score of 0 (i.e., invisible). The areas that suffer from the highest level of visual impact with a score of 5 (i.e., >80% are visible) account for 49.03%. Other visible proportions account for 4.23% (score 1), 4.58% (score 2), 4.59% (score 3), and 4.01% (score 4) respectively. The cluster-layout of WTs contributes to the phenomenon of polarization of the visibility ratio. Areas have either extremely high visibility or extremely low visibility depending on their relative locations to the WTs.
The preload also somewhat affects the visual impact (Figure 5b). Here, the preload refers to the phenomenon that other infrastructure facilities at a close distance can offset the environmental impact of WTs. In this case, highway A71, transportation lines, and settlements are significant preloads that can release local people’s negative attitudes toward the WTs to some extent. The perception distance is as significant as the elements mentioned above in preload that the WTs perceived by human eyes can be simulated through the distance classification until the visual threshold (30 H).
The visual impact of WTs has been processed and presented in Figure 5c, which presents the average score of 3.10 (ranging from 0 to 5) and shows the scattered characteristics of visual impact distribution. The high visual impact (red color) mainly concentrates within an extremely close distance to the WTs and reduces with the distance grows. The scattered distribution is due to the flat terrain and prominent vertical structures. Whether the WTs are visible or not in the raster unit depends on the terrain and vertical structures (e.g., forests, shrubs, houses, and farms).

4.3. Result of Viewer Exposure

The viewer exposure evaluation, based on the influenced proportion of the population (Figure 6a) and passersby (Figure 6b), helps to quantify the visual impact on viewers. Typically, viewers’ relative position and motion status affect their perception of visual impact. For instance, how often and how long people are faced with turbines, and how many proportions of the population are impacted by WTs at the locality, make quantitative visual impact evaluation extremely complicated. Though including such high subjective indicators, it is still practicable to conduct the viewer response through comparative analysis. Figure 6c illustrates the different degrees of viewer exposure in each raster unit. The average is 2.39, which represents a comparatively low exposure degree. The highly exposed areas concentrate on transportation lines across the wind farm, especially the highway A71 and railway, as well as the dwelling close to the wind farm, such as Unsleben, Mittelstreu, Oberstreu, and Bahra.

4.4. Comprehensive Results

The calculation process of the evaluation shows as follows:
Landscape visual impact degree = mean of landscape sensitivity + mean of visual impact of WTs + mean of viewer exposure
Each sub-indicator scores range from 0 to 5, and the final score is the sum of all scores. The higher the score is, the more severe the visual impact imposes upon the landscape. Through the raster calculation in GIS, the score of each grid (20 × 20 m) can be calculated and attain the final score representing the visual impact.
The complete result integrates the scores of landscape sensitivity, visual impacts of WTs, and viewer exposure. The result (Figure 7) shows a non-homogeneous pattern of visual impact. The heavily suffered areas concentrate on the western side of the railway, along highway A71, and other roads near the site. The areas with low visual impact are mainly hindered by vertical structures, such as forests, settlements, and ridges. The statistical data can be looked up in GIS, such as the affected proportion of each land use type, the specific location of visual influence, and the proportion of visible WTs (Table 3). Therefore, these impacts can be mitigated by specific measures in the planning.
The visually affected spaces increase with the growing height of turbines. However, these visual impacts are not homogeneously distributed. Although the visible area of the total 10 complete turbines is limited, most WTs are partly visible, which undoubtedly causes impairment in the landscape. The visibility is greatly dependent on the terrain and height of surface structures. Despite the height of turbines about 200 m, many localities concentrated in the valley areas are free from optical interference. Areas, such as Heustreu, Hendungen, and Bad Neustadt an der Saale with low altitude and hidden in shrubs and woods, have almost no exposure to the WTs and experience only weak or no visual impact.
Most villages and towns are partly affected, and the visual impacts are unequally distributed according to the terrain and vertical structures. The villages of Unsleben, Oberstreu, and Bahra, the north part of Mittelstreu and Wollbach, the southeast part of Heustreu, the west part of Hollstade suffer from the severe visual impact. Except for these parts, other areas can only see the blade tip of the WTs, which poses no threat to the inhabitants’ daily life. Although the WTs are surrounded by farmland (Figure 7) that accounts for two-thirds of the research area, the mean score of visual impact in farmland (2.86) is lower than that in towns (3.46), forests (2.94), industrial land, and infrastructure facilities (3.37). The cultural heritage (1.40), water (0), recreational facilities (0.77), and villages (2.78) suffer a comparatively low visual impact.

5. Discussion

5.1. Advantages of the LVIE Method

The LVIE model in this thesis is a new method that combines the theoretical framework and practical solutions. This paper’s innovation is to enrich the forms of visual impact evaluation results, precise the buffer zones for visual impact, and provide accurate, visualized, user-friendly evaluation results to support site selection decision-making. It is both scientific and feasible for cooperation between different planning departments. Moreover, the evaluation results are comparable between different cases. The method can be used to compare different regions with the independent variables of the number and height of WTs, the visibility of WTs, topography, surface smoothness, and population demographic characteristics.
For instance, the evaluation result of landscape sensitivity illustrates the sensitive areas and types of landscape resources that need extra protection. Definite protection targets and restoration measures can be implemented according to the visualized conclusion. The universal targets for landscape protection are: the restoration of the destroyed plantation, the maintenance of the ecological service of the landscape, the avoidance of soil erosion, the protection of the water sources, significant sightlines and wild animal habitats, and the strengthening of the buffer zones surrounding the ecologically sensitive areas. The natural conservation areas, national parks, biosphere reserves, landscape protection areas, and nature parks should be first excluded from wind farm site selection according to the landscape sensitivity evaluation. Other natural and cultural landscape resources should also be protected according to their values. Additionally, continuous environmental monitoring should be conducted to ensure that the long-term impact of wind turbines on landscape ecology is maintained within a controllable range.
The evaluation of the visual impact of WTs is closely related to the site selection of wind farms, the spatial layout of WTs, associated facility planning, and wind farm operation. The spatial analysis in GIS can calculate the visibility of WTs quantitatively and compare the visual impacts of WTs under different layout designs. Other parameters, such as topography, vegetation, and vertical constructions, are also taken into consideration to refine the visibility analysis. The result of the evaluation can put forward constraints for the number and height of WTs in specific regions and recommendations to improve the layout of WTs, reaching a compromise with other resource protection. This indicator evaluates the visual impact and aims to provide feedback to adjust the layout and design of WTs, compare different scenarios, and finally choose a plan with minimum impact.
The evaluation of viewer exposure illustrates certain influenced areas and influence frequency. In the process of public participation, the result of viewer exposure can be provided to the public as pre-information, which helps to improve the transparency of information, promote communication efficiency, and increase the mutual trust between wind companies and the local population. The wind operators can negotiate with the communities to mitigate the visual impact or pay for compensation according to the evaluation result. For severely influenced areas, such as dense settlements and main roads with high traffic flows, some measures are suggested to mitigate the impairment of local people. For example, installing protective walls and planting dense vegetation are practical solutions to minimize the visual impact. Besides, it is also effective to reduce the accessibility of the wind farm by discarding unnecessary trails for the mitigation of the visual impact.
In summary, the LVIE has considered the theoretical framework and planning implementations comprehensively. It is open for the participation of multi-stakeholders (e.g., communities, planning authorities, landscape protection departments, wind operators, and local governments). The planning recommendations are put forward according to different evaluation sections, which are specific for different implementation departments. Compared with existing visual impact evaluation methods, the LVIE model is planning-oriented and more targeted, which can provide visualized evaluation results for decision-making.

5.2. Recommendations for Wind Farm Planning Procedures

5.2.1. Planning Procedures

In Germany, setting the minimum buffer distance for different land use is the universal measure in wind farm planning [30]. However, these decrees reduce available areas for wind farms because the buffer zones occupy too much priority area [48]. Strict local decrees for height constraints and animal protection further reduce the available priority areas [49,50]. The one-size-fits-all method assigning a fixed buffer distance can no longer meet the needs of site selection. The LVIE model can be used to calculate how much distance should be assigned as a buffer under different scenarios. The raster cells that received scores over 10 (ranging from 0 to 15) should be identified, as protected areas requiring mitigation measures and compensations, as shown in Figure 7. Otherwise, the layout of wind farms and the number of WTs need to be modified to avoid visual impact on the surrounding sensitive areas (such as villages, towns, forest) with a score over 10. This method helps to achieve a more sustainable and compact land use plan with flexible buffer areas. The fixed buffer distance is no longer the only standard for site selection. The complete results of LVIE are highly significant in decision-making, instead of depending only on the distance. If the score of visual impact evaluation is below 10, a shorter distance is also accepted as a buffer.
In the research case, the permit of Friedrich-Wilhelm Raiffeisen Wind Farm had been approved before the promulgation of the “10 H” regulation in Bavaria in November 2014. This “10 H” regulation requires that the distance of a wind turbine to its neighboring inhabited building needs to be away multiplying with 10 of the wind turbine height [51]. However, the distance between the WTs and the village Hollstadt, as well as the village Unsleben, is less than 10 H. Through the LVIE model conducted in this site, a new buffer zone according to visual impact level instead of fixed distance is generated and effectively solved the conflicts between local communities and operation company. With continuous negotiation, the proposed project kept cutting down the number of WTs several times according to the visual impact analysis, from the original 18 WTs to 14, and finally, only 10 WTs were approved and installed. With the reduction of the installation number, the visual impact on Hendungen, Bahra, Hollstadt, and Unsleben has been mitigated to some extent. Finally, even though part of the WTs has not met the “10 H” regulation, the project has been approved by the planning authorities and reached a compromise with local communities with a reasonable layout.
WTs should not be randomly scattered on the landscape. Otherwise, the irreversible impact would be exerted on the landscape, the environment, the cultural, and the recreational value of the region. The potential conflicts between wind energy and other resources, such as landscape protection, nature reserve, and the tourism industry should be analyzed during the planning process. Before the application for permission, sufficient communication and assessment are necessary for landscape protection authorities, cultural assets, and tourism management departments at an upper level.
In this case, the Regional Planning Association of the Main-Rhön region and the authorities for the regional development plan and the landscape plan should jointly assign the priority, reserved, and exclusion areas in a spatially compatible way by continuously updating their plans. It is intended that the erection of spatially significant WTs are based on anticipatory site planning. The Friedrich-Wilhelm Raiffeisen wind farm is outside of tourist centers and has a distance of around 30 km from the Bavarian Rhön Nature Park. Therefore, it has a relatively low impact on tourism and local recreation. However, the operation of WTs still has slight impacts on the biosphere and wild animals, such as skylark, partridge, meadowsweet, quail, golden plover, black kite, and eagle owl.

5.2.2. Mitigation Measures

Besides the standard mitigation measures, such as adjusting the wind farm layout and reducing the height and number of WTs, the LVIE method puts forward specific and targeted solutions for mitigation.
According to the visibility analysis in GIS, vertical surface structures (e.g., vegetation) are competent to “hide” WTs. Vegetation with a certain height and density, preferably evergreen plants, can effectively block sight disturbance and optical disturbance. For instance, even with a close distance to WTs, the southeast of Mittelstreu and north of Heustreu is free from visual impact because the villages are partly blocked by the forests between the wind farm and settlements. Therefore, vegetation can shelter the WTs if it is located on the sightline. Based on the visualized conclusion in the LVIE model, it is easy to find out heavily influenced areas. The analysis from human perspective view can further draw definite visual impact and find out mitigation solutions.
In a site with undulating topography, the relationship between the location of WTs and micro-terrain is of great significance for reducing the visual impact. For the topography of different areas, different layout styles are recommended. On the flat plain, a cluster of WTs can effectively control the visual impact in a certain spatial scope. For instance, the proposed plan of 18 WTs on both sides of the highway A71 had been initially rejected, and the number of WTs was finally cut down to 10 with a cluster layout.

5.2.3. Compensation Measures

Due to the impairment of the landscape value, compensation and replacement measures must be considered. In the existing methods for calculating the compensation fees, the payment is averagely handed out to landowners according to the areas of influenced land [52]. However, according to the result of this thesis, the magnitude of visual impact is more important than the area. Although all of the areas are visible to WTs, the visual impact each area suffers is of a different extent. In the LVIE model, the compensation fee can be classified into several degrees according to the evaluation results of different influence degrees, which makes the distribution of compensation fees more equal and transparent.
In addition to the measures for avoidance, compensation, and replacement listed in the project documents, additional requirements put forward by the state nature conservation and cultural assets authorities should be fulfilled. For the visual impact on the landscape with specific natural and cultural value, extra compensation should be paid to recover their value and function. For instance, specific subsidies to the tourism and recreational industry, agriculture and forestry are necessary as a type of compensation for the economic loss in these industries. The Bavarian State Office for the Preservation of Historic Monuments points out that the villages surrounding the planned area almost always have high quality and a valuable historic building substance [53]. Landmarks particularly sensitive to optical impairments are, from the perspective of conservation, the church of St. Michael in Heustreu, the church of St. James in Hollstadt and Unsleben Castle. Part of the compensation is suggested to be retained for subsequent distribution when necessary.
From a perspective of sustainability, a communal fund for managing and using the compensation fee is much better than paying each individual landowner. Compensation fees can be divided into two types: short-term and long-term, and they are paid at different stages instead of one-off compensation. It can be managed and distributed as a communal fund to improve the local environment, which is an effective way to offset the environmental impact caused by wind turbines. Local objections due to unequal payment of compensation and benefit share have raised social attention, which causes a standstill in wind farm planning and the application for permission [44]. This solution can reduce the opposite voices from landowners due to uneven distribution.

5.3. Research Limitations

It should be noted that there may be other effective variables that have not been included in the LVIE model (some subjective variables such as viewers’ identity, aesthetic preference, expectation, and emotional relationship with the site). Moreover, some variables, such as air quality, atmospheric refraction, and earth curvature on visual perception, are not easily measured [54]. Consequently, the methods, data, and evaluation model in this study have inaccuracies due to the simplification of the evaluation process. Uncertainties arise due to the discrepancies between the line-of-sight model and the real-world visual process, as well as the input parameters and geographical data. A few methodological problems should be mentioned:
  • The simulation of visual perception in reality concerns multi-disciplines, such as geography, psychology, sociology, and physiology. It is impossible to establish an ideal model to cover all aspects in each subject. This research focuses on the planning procedures of wind energy planning.
  • In indicator selection, some subjective attributes, such as individual landscape preference, personal experiences with renewable energy, coordination between WT, and the background of landscape, should be approached by empirical research, which is time-consuming. These factors have been discussed but not involved in the evaluation model due to their low operability.
  • Based on the principle of efficient and precise evaluation, some indicators are processed in a simplified manner in GIS analysis. For instance, the visual impact decays with distance [55]. The distance–decay function improves the evaluation accuracy by simulating the relationship between visual perception and distance. This, however, is not possible with the viewshed analysis in GIS.
Another indicator difficult to simulate is atmospheric scattering [27]. Atmospheric haze has not been included because the viewshed should be employed for the case with the worst-case visibility. A satisfactory way has not been found to simulate the contrast between wind turbines and their background through GIS. Changes in weather conditions have been excluded from the model. Atmospheric effects such as haze and scattering of rain have not been included in the calculation of the cut-off distance.
The choice of the size of the raster is significant in the spatial analysis of GIS. It was set to 20 × 20 m. Landscape elements more minor than 20 m are excluded, such as trees, bushes, and small houses. Population data for this cell size means that the precise location of a person is not known.
The rotational speed of turbines has not been included as a model parameter, notwithstanding that smaller and faster-rotating turbines are more likely to draw attention than those larger and slower-rotating ones.

5.4. Energy Ethics

For wind energy development, an unavoidable issue is the justice of resource utilization and land designation. Since wind energy brings environmental impact, the expansion of wind energy exacerbates the spatial range of environmental impact. Especially for visual impact, the impacted area can be enlarged with the growing height of turbines, even to reach dozens of km2.
The concentration zones at specific locations are carved out by the planning authorities in Germany to reduce extra environmental impact. Therefore, as many WTs as possible should be permitted at concentration zones so that the impact on the landscape is counteracted by the largest possible amount of feed-in electricity, and other landscapes can be free from any impact. From a spatial planning perspective, on the one hand, the concentration of large-scale wind farms in a relatively small area entails a high level of pollution; on the other hand, it ensures that other sensitive landscape spaces have no problem with the impact, thus preventing the sprawl of WTs.
More emphasis has been paid on procedure justice, information balance, and trust in the government in the context of wind farm planning. Transparent planning procedures help to reduce residents’ opposition and win local support [56]. However, the concentrated impact causes inequality in the locality of wind farms. Wind farm projects are more easily approved in areas with similar artificial facilities because of preload. Excessive concentration of infrastructure such as wind farms can damage the environment in the area. The research of NABU [55] reveals that fierce protest against wind facilities mainly comes from the minority of residents who suffer from severe impacts, which cannot represent the opinions of the majority of citizens. The polarization of environmental quality between areas with and without wind farms reveals the social problem that land designation brings about.

6. Conclusions

In the context of the global energy transition, developing wind energy is a practical way to deal with climate change and reduce carbon dioxide emissions. However, the expansion of onshore wind energy encounters obstacles from spatial planning. The demand for balancing wind energy development and environmental protection can be met through the advanced planning instruments that can scientifically evaluate the visual impact caused by WTs and provide proper mitigation measures. The landscape visual impact evaluation (LVIE) model has been constructed based on theoretical research and practical planning instruments. The German wind farm case study has verified the LVIE model, and the results are illustrated cartographically to demonstrate precise locations and the degree of visual impact.
This research establishes an implementable, visualized, quantitative, and standardized GIS-based landscape visual impact evaluation (LVIE) model for optimizing planning procedures. Given the subjectivity of the perception of visual impact among individuals, quantifying the evaluation process is necessary. It helps to standardize the evaluation results by quantifying the evaluation steps, the approaches of indicator selection, and data sources. It also provides the possibility to compare the changes of landscape quality before and after the project, as well as horizontal comparisons between different projects. Establishing the evaluation model requires the consideration of the meaning and purpose of evaluation from a methodological perspective.

Funding

The research is funded by the “Chinese Fundamental Research Funds for the Central Universities”, No JKZ02222201.

Institutional Review Board Statement

Not applicable.

Informed Consent Statement

Not applicable.

Data Availability Statement

Not applicable.

Conflicts of Interest

The author declares no conflict of interest.

References

  1. Lee, J.; Zhao, F. Global Wind Report 2022. 2022. Available online: https://gwec.net/global-wind-report-2022/ (accessed on 22 July 2022).
  2. Firestone, J.; Bates, A.; Knapp, L.A. See me, Feel me, Touch me, Heal me: Wind turbines, culture, landscapes, and sound impressions. Land Use Policy 2015, 46, 241–249. [Google Scholar] [CrossRef] [Green Version]
  3. Dai, K.; Bergot, A.; Liang, C.; Xiang, W.N.; Huang, Z. Environmental issues associated with wind energy—A review. Renew. Energy 2015, 75, 911–921. [Google Scholar] [CrossRef]
  4. Eichhorn, M.; Masurowski, F.; Becker, R.; Thrän, D. Wind energy expansion scenarios—A spatial sustainability assessment. Energy 2019, 180, 367–375. [Google Scholar] [CrossRef]
  5. Sklenicka, P.; Zouhar, J. Predicting the visual impact of onshore wind farms via landscape indices: A method for objectivizing planning and decision processes. Appl. Energy 2018, 209, 445–454. [Google Scholar] [CrossRef]
  6. Nohl, W. Beeinträchtigung des Landschaftsbildes Durch Mastenartige Eingriffe: Materialien für die Naturschutzfachliche Bewertung und Kompensationsermittlung; Ministeriums für Umwelt, Raumordnung und Landwirtschaft des Landes NordrheinßWestfahlen: München, Germany, 1993; Available online: https://www.landschaftswerkstatt.de/dokumente/Masten-Gutach-1993.pdf (accessed on 22 July 2022).
  7. Nohl, W. Ist das Landschaftsbild messbar und bewertbar? In Bestandsaufnahme und Ausblick; Presentation at the University of Natural Resources and Life Sciences Vienna: Wien, Austria, 2010; pp. 1–18. Available online: http://www.skiaudit.info/media/files/landschaftsbildtagung/nohl.pdf (accessed on 20 July 2021).
  8. Paul, V.H.; Uther, D.; Neuhoff, M.; Winkler-hartenstein, K.; Schmidtkunz, H. GIS-gestütztes Verfahren zur Bewertung visueller Eingriffe durch Hochspannungs- freileitungen.Herleitung von Kompensationsmaßnahmen für das Landschaftsbild. Nat. Und Landschaftsplan. 2004, 35, 139–144. [Google Scholar]
  9. Roth, M.; Gruehn, D. Visual Landscape Assessment for Large Areas—Using GIS, Internet Surveys and Statistical Methodologies. Proc. Latv. Acad. Sci. 2012, 129–142. [Google Scholar]
  10. Roth, M.; Bruns, E. Landschaftsbildbewertung in Deutschland.Stand von Wissenschaft und Praxis.Landschaftsbildbewertung im Spannungsfeld von Wissenschaft und Praxis; Literaturdatenbank “DNL-online”: Bonn, Germany, 2016; Available online: http://www.bfn.de/fileadmin/BfN/service/Dokumente/skripten/skript_439_Labi_fin.pdf (accessed on 9 December 2021)ISBN 9783896241757.
  11. Sowińska-Świerkosz, B.N.; Chmielewski, T.J. A new approach to the identification of Landscape Quality Objectives (LQOs) as a set of indicators. J. Environ. Manag. 2016, 184, 596–608. [Google Scholar] [CrossRef]
  12. Swanwick, C. Landscape Character Assessment: Guidance for England and Scotland, UK. 2002. Available online: https://10.1016/j.jenvman.2008.11.031 (accessed on 9 January 2021).
  13. The Landscape Institute with the Institute of Environmental Management & Assessment of UK. Guidelines for Landscape and Visual Impact Assessment, 2nd ed.; Spon Press: London, UK; New York, NY, USA, 2005; ISBN 0203994655. [Google Scholar]
  14. Beauchamp, G.; Armstrong, W.; Buchan, N. Visual Representation of Windfarms Good Practice Guidance, UK. 2006. Available online: http://www.orkneywind.co.uk/advice/snhVisualrepresentation.pdf (accessed on 16 September 2021).
  15. Scottish Natural Heritage. Offshore renewables-guidance on assessing the impact on coastal landscape and seascape: Guidance for scoping an Environmental Statement. SNH Edinb. Scotl. 2012, 1–48. [Google Scholar]
  16. Cornwall Council, An Assessment of the Landscape Sensitivity to On- shore Wind Energy and Large-Scale Photovoltaic Development in Cornwall, Cornwall. 2013. Available online: https://www.cornwall.gov.uk/environment-and-planning/cornwalls-landscape/landscape-character-assessment/?page=24874&page=24874 (accessed on 22 September 2021).
  17. Oligmüller, R.; Ökol, L.; Schäfers, A.; Gers, A. Landschaftsbildbewertung.B-Plan Nr. 74n 《Fernholte》, Recklinghausen. 2017. Available online: http://www.LuSRe.de (accessed on 7 July 2022).
  18. LANUV (Landesamt für Natur Umwelt und Verbraucherschutz Nordrhein-Westfalen). Verfahren zur Landschaftsbildbewertung im Zuge der Ersatzgeld-Ermittlung für Eingriffe in das Landschaftsbild durch den Bau von Windenergieanlagen. 2016. Available online: https://www.umwelt.nrw.de/fileadmin/redaktion/PDFs/klima/Anlagen_Bewertungsverfahren_Landschaftsbild_FuerWEA.pdf (accessed on 9 January 2021).
  19. AILA (Australian Institute of Landscape Architects). Guidance Note for Landscape and Visual Assessment, Queensland State, Australia. 2018. Available online: https://www.aila.org.au/common/Uploaded%20files/_AILA/Submission%20Library/QLD/RLG_GNLVA_V3.pdf (accessed on 9 January 2021).
  20. Department of Infrastructure and Local Government Planning. Wind Farm Development Planning Guideline, State of Queensland. 2018. Available online: https://arkenergy.com.au/documents/457/wind-farm-state-code-planning-guideline.pdf (accessed on 9 January 2021).
  21. NZILA (New Zealand Institute of Landscape Architecture). Best Practice Guide: Landscape Assessment and Sustainable Management. 2010. Available online: https://nzila.co.nz/media/uploads/2017_01/nzila_ldas_v3.pdf (accessed on 9 January 2021).
  22. Virtanen, E.A.; Lappalainen, J.; Nurmi, M.; Viitasalo, M.; Tikanmäki, M.; Heinonen, J.; Atlaskin, E.; Kallasvuo, M.; Tikkanen, H.; Moilanen, A. Balancing profitability of energy production, societal impacts and biodiversity in offshore wind farm design. Renew. Sustain. Energy Rev. 2022, 158, 112087. [Google Scholar] [CrossRef]
  23. Pınarbaşı, K.; Galparsoro, I.; Depellegrin, D.; Bald, J.; Pérez-Morán, G.; Borja, Á. A modelling approach for offshore wind farm feasibility with respect to ecosystem-based marine spatial planning. Sci. Total Environ. 2019, 667, 306–317. [Google Scholar] [CrossRef]
  24. Göke, C.; Dahl, K.; Mohn, C. Maritime spatial planning supported by systematic site selection: Applying marxan for offshore wind power in the western baltic sea. PLoS ONE 2018, 13, e0194362. [Google Scholar] [CrossRef] [PubMed]
  25. Ästhetik, L.S. Werte und Landschaft. In Landschaftsästhetik und Landschaftswandel; Kühne, O., Megerle, H., Weber, F., Eds.; Springer VS: Wiesbaden, Germany, 2017; pp. 23–40. ISBN 9783658158484. [Google Scholar]
  26. Daniel, T.C. Whither scenic beauty? Visual landscape quality assessment in the 21st century. Landsc. Urban Plan. 2001, 54, 267–281. [Google Scholar] [CrossRef]
  27. Bishop, I.D. Determination of thresholds of visual impact: The case of wind turbines. Environ. Plan. B Plan. Des. 2002, 29, 707–718. [Google Scholar] [CrossRef]
  28. Schöbel, S. Windenergie und Landschaftsästhetik; Jovis: Berlin, Germany, 2012; ISBN 9783868591507. [Google Scholar]
  29. Bay, B.O. Art. 82 Windenergie und Nutzungsänderung ehemaliger landwirtschaftlicher Gebäude (1) § 35. 2007. Available online: https://www.gesetze-bayern.de/Content/Document/BayBO-82?AspxAutoDetectCookieSupport=1 (accessed on 2 September 2019).
  30. Fachagentur Windenergie an Land. Überblick zu den Abstandsempfehlungen zur Ausweisung von Windenergiegebieten in den Bundesländern. 2019. Available online: https://www.fachagentur-windenergie.de/fileadmin/files/PlanungGenehmigung/FA_Wind_Abstandsempfehlungen_Laender.pdf (accessed on 9 January 2021).
  31. Bishop, I.D. Location based information to support understanding of landscape futures. Landsc. Urban Plan. 2015, 142, 120–131. [Google Scholar] [CrossRef]
  32. Devine-Wright, P. Local Aspects of UK Renewable Energy Development:Exploring public beliefs and policy implications. Local Environ. 2005, 10, 57–69. [Google Scholar] [CrossRef] [Green Version]
  33. Gobster, P.H.; Nassauer, J.I.; Daniel, T.C.; Fry, G. The shared landscape: What does aesthetics have to do with ecology? Landsc. Ecol. 2007, 22, 959–972. [Google Scholar] [CrossRef]
  34. Sevenant, M.; Antrop, M. The use of latent classes to identify individual differences in the importance of landscape dimensions for aesthetic preference. Land Use Policy 2010, 27, 827–842. [Google Scholar] [CrossRef]
  35. Guan, J.; Zepp, H. Factors Affecting the Community Acceptance of Onshore Wind Farms: A Case Study of the Zhongying Wind Farm in Eastern China. Sustainability 2020, 12, 6894. [Google Scholar] [CrossRef]
  36. Bell, S. Landscape: Pattern, Perception and Process, 2nd ed.; Routledge Taylor & Francis Group: London UK; New York, NY, USA; Canada, 2012; ISBN 978-0-415-60836-7. [Google Scholar] [CrossRef]
  37. Wellman, J.D.; Buhyoff, G.J. Effects of regional familiarity on landscape preferences. Environ. Behav. 1980, 11, 105–110. [Google Scholar] [CrossRef]
  38. Petrova, M.A. NIMBYism revisited: Public acceptance of wind energy in the United States. Wiley Interdiscip. Rev. Clim. Chang. 2013, 4, 575–601. [Google Scholar] [CrossRef]
  39. Petrova, M.A. From NIMBY to acceptance: Towards a novel framework-VESPA-For organizing and interpreting community concerns. Renew. Energy 2016, 86, 1280–1294. [Google Scholar] [CrossRef]
  40. Molnarova, K.; Sklenicka, P.; Stiborek, J.; Svobodova, K.; Salek, M.; Brabec, E. Visual preferences for wind turbines: Location, numbers and respondent characteristics. Appl. Energy 2012, 92, 269–278. [Google Scholar] [CrossRef]
  41. Strumse, E. Demographic Differences in the visual preferences for agrarian landscapes in western norway. J. Environ. Psychol. 1996, 16, 17–31. [Google Scholar] [CrossRef]
  42. Hallan, C.; González, A. Adaptive responses to landscape changes from onshore wind energy development in the Republic of Ireland. Land Use Policy 2020, 97, 104751. [Google Scholar] [CrossRef]
  43. Tang, X. The theories, Methodology of Landscape Visual Environment Assessment and Their Application: The Case of the Three Gorges of the Yantze River (Chongqing); Fudan University: Shanghai, China, 2007. (In Chinese) [Google Scholar]
  44. Cowell, R.; Bristow, G.; Munday, M. Wind Energy and Justice for Disadvantaged Communities, 2012. Available online: https://www.hoylakevision.org.uk/wp-content/uploads/2012/11/wind-farms-communities-summary.pdf (accessed on 26 July 2022).
  45. Latinopoulos, D.; Kechagia, K. A GIS-based multi-criteria evaluation for wind farm site selection. A regional scale application in Greece. Renew. Energy 2015, 78, 550–560. [Google Scholar] [CrossRef]
  46. Möller, B. Changing wind-power landscapes: Regional assessment of visual impact on land use and population in Northern Jutland, Denmark. Appl. Energy 2006, 83, 477–494. [Google Scholar] [CrossRef]
  47. Antrop, M. Why landscapes of the past are important for the future. Landsc. Urban Plan. 2005, 70, 21–34. [Google Scholar] [CrossRef]
  48. Nkomo, F. WWEA Policy Paper Series (PP-02-18-b), Bonn, Germany. 2018. Available online: https://www.wwindea.org/wp-content/uploads/2018/06/Germany_Full.pdf (accessed on 18 November 2020).
  49. Richarz, K.; Hormann, M.; Braunberger, C.; Harbusch, C.; Süßmilch, G.; Caspari, S.; Schneider, C.; Monzel, M.; Reith, C.; Weyrath, U. Leitfaden zur Beachtung artenschutzrechtlicher Belange beim Ausbau der Windenergienutzung im Saarland betreffend die besonders relevanten Artengruppen der Vögel und Fledermäuse, Saarbrücken. 2013. Available online: https://www.saarland.de/SharedDocs/Downloads/DE/LUA_sonstige_Downloads/Wind/Leitfaden_Artenschutz.pdf?__blob=publicationFile&v=1 (accessed on 26 July 2022).
  50. Guan, J. Westerly breezes and easterly gales: A comparison of legal, policy and planning regimes governing onshore wind in Germany and China. Energy Res. Soc. Sci. 2020, 67, 101506. [Google Scholar] [CrossRef]
  51. Bayerische Staatsregierung, Bayerisches Gesetz-und Verordnungsblatt, Germany. 2014. Available online: https://www.verkuendung-bayern.de/gvbl/2014-478/ (accessed on 18 November 2021).
  52. Unland, A.; Wittmann, A. Kompensation von Eingriffen in das Landschaftsbild durch Windenergieanlagen im Genehmigungsverfahren und in der Bauleitplanung; Unland, A., Wittmann, A., Eds.; Fachagentur Windenergie an Land: Berlin, Germany, 2016; Available online: https://www.fachagentur-windenergie.de/fileadmin/files/Veroeffentlichungen/FA_Wind_Hintergrundpapier_Kompensation_Eingriffe_Landschaftsbild_durch_WEA_06-2016.pdf (accessed on 3 November 2021).
  53. Raiffeisen, F.-W.; Streu, W.; Saale, E.G. Bad Neustadt a. d. Saale Landesplanerische Beurteilung für die Errichtung und den Betrieb des Friedrich-Wilhelm Raiffeisen Windparks Streu & Saale, Würzburg. 2013. Available online: https://streusaale.raiffeisen-energie-eg.de/index.php?SiteID=1709&mode=details&ProjectID=51 (accessed on 26 July 2022).
  54. Nijhuis, S.; van Lammeren, R.; Antrop, M. Exploring the Visual World, 2nd ed.; Nijhuis, S., van Lammeren, R., van der Hoeven, F., Eds.; IOS Press: Amsterdam, The Netherlands, 2011; ISBN 9781607508328. [Google Scholar]
  55. Van Leusen, P.M. Pattern to Process: Methodological Investigations into the Formation and Interpretation of Spatial Patterns in Archaeological Landscapes; Groningen University: Groningen, The Netherlands, 2002. [Google Scholar]
  56. NABU—Naturschutzbund Deutschland. Naturverträgliche Energiewende. Akzeptanz und Erfahrungen vor Ort. 2019. Available online: https://www.nabu.de/umwelt-und-ressourcen/energie/erneuerbare-energien-energiewende/16082.html (accessed on 17 November 2021).
Figure 1. The theoretical framework of landscape visual impact evaluation.
Ijgi 11 00594 g001
Figure 2. Location of Friedrich-Wilhelm Raiffeisen Wind Farm (Source: ArcGIS Earth).
Ijgi 11 00594 g002
Figure 3. Master plan of Friedrich-Wilhelm Raiffeisen Wind Farm Streu & Saale. (Source: drawn by the author).
Ijgi 11 00594 g003
Figure 4. (ad). Results of landscape sensitivity evaluation.
Ijgi 11 00594 g004
Figure 5. (ac). Results of visual impact from wind turbine evaluation.
Ijgi 11 00594 g005
Figure 6. (ac). Results of viewer exposure evaluation.
Ijgi 11 00594 g006
Figure 7. Comprehensive results of landscape visual impact evaluation.
Ijgi 11 00594 g007
Table 1. The decomposition of landscape evaluation dimensions.
Representing Attributes of the LandscapeExpression FormalityContentsTheoretical Foundations
ElementContent and characteristics of elementsWater, soil, air, vegetation, architecture, texture, and colorIts essence and properties decide the characteristics of the landscape.
StructureCombination form, relationship between elements, and the scale of elementsBoundary, relief, shape, and densityScientific and cartographic method defines the landscape as the measurable and visible distributions of objects.
FunctionDescription of landscape identityDiversity, peculiarity, beauty, naturalness, and coherenceIt focuses on how society recognizes, describes, and evaluates the landscape.
Table 2. Indicator set of landscape visual impact evaluation.
TargetTheoretical FoundationVariablesFactorsParameters
Landscape visual impact evaluationLandscape sensitivityLandscape elementNaturalness:
Land use types
Water Area
Forest Land
Agricultural Land
Village/Town
Industrial Land
Infrastructure land
5
4
3
2
1
0
Landscape structureVisibility:
Visible proportion of WTs
>80% visible
60–80% visible
40–60% visible
22–40% visible
0–20% visible
Invisible
5
4
3
2
1
0
Visual threshold:
Multiple of WTs’ total height
<1 H
1–3 H
3–10 H
10–20 H
20–30 H
>30 H
5
4
3
2
1
0
Patch density:
Length of the patch edge in the landscape unit (ha)
≤100 m
100–200 m
200–400 m
400–600 m
600–800 m
≥800 m
0
1
2
3
4
5
Patch diversity:
Number of patch types within the landscape unit (ha)
≤1
1–2
2–3
3–5
5–10
≥10
0
1
2
3
4
5
Landscape FunctionEcological function:
Natural Protection Area Value Rating
National level nature reserve
Regional level nature reserve
Local level nature reserve
Nature area
Half-nature area
Artificial area
5
4
3
2
1
0
Cultural function:
Cultural Heritage Value Rating
National level cultural heritage
Regional level cultural heritage
Local level cultural heritage
Cultural protection area
Normal cultural area
Area without specific cultural value
5
4
3
2
1
0
Recreational function:
Recreational Sites Value Rating
National level recreational site
Regional level recreational site
Municipal level recreational site
Local level recreational site
Areas with recreational function
Areas without recreational function
5
4
3
2
1
0
Visual impact caused by WTsTotal height of WT (m)≤40
40–80
80–100
100–120
120–150
≥150
5
4
3
2
1
0
Number of WTs<5
5–10
11–20
21–30
31–50
>50
5
4
3
2
1
0
PreloadNo preload
Slight preload
Medium preload
Comparatively heavy preload
Heavy preload
Severe preload
5
4
3
2
1
0
Viewer ExposureInfluenced proportion of population≥30%
20–30%
15–20%
5–15%
0–5%
0%
5
4
3
2
1
0
Influenced proportion of the passersby≥30%
20–30%
15–20%
5–15%
0–5%
0%
5
4
3
2
1
0
Table 3. Statistical data of the visual impact in different types of land use in the German case.
Land UseArea (ha)Area ProportionMean Score (0–5)Medium Visual Impact (Score ≥ 3)Heavy Visual Impact (Score ≥ 5)
Village894.764.82%2.7855.46%44.70%
Town828.644.47%3.4670.04%54.72%
Forest4406.6823.76%2.9458.79%52.59%
Water00.00%00.00%0.00%
Industrial and infrastructure facilities93.120.50%3.3765.16%61.43%
Farmland12,325.3266.44%2.8657.13%48.26%
Cultural heritage0.200.001%1.4020.00%20.00%
Recreational facilities1.720.01%0.7716.28%13.95%
Total18,550.44100.00%2.8857.63%49.03%
Publisher’s Note: MDPI stays neutral with regard to jurisdictional claims in published maps and institutional affiliations.

