

Multi-Mode Huff-Based 2SFCA: Examining Geographical Accessibility to Food Outlets in Austin, Texas

Abstract
:1. Introduction
2. Materials and Methods
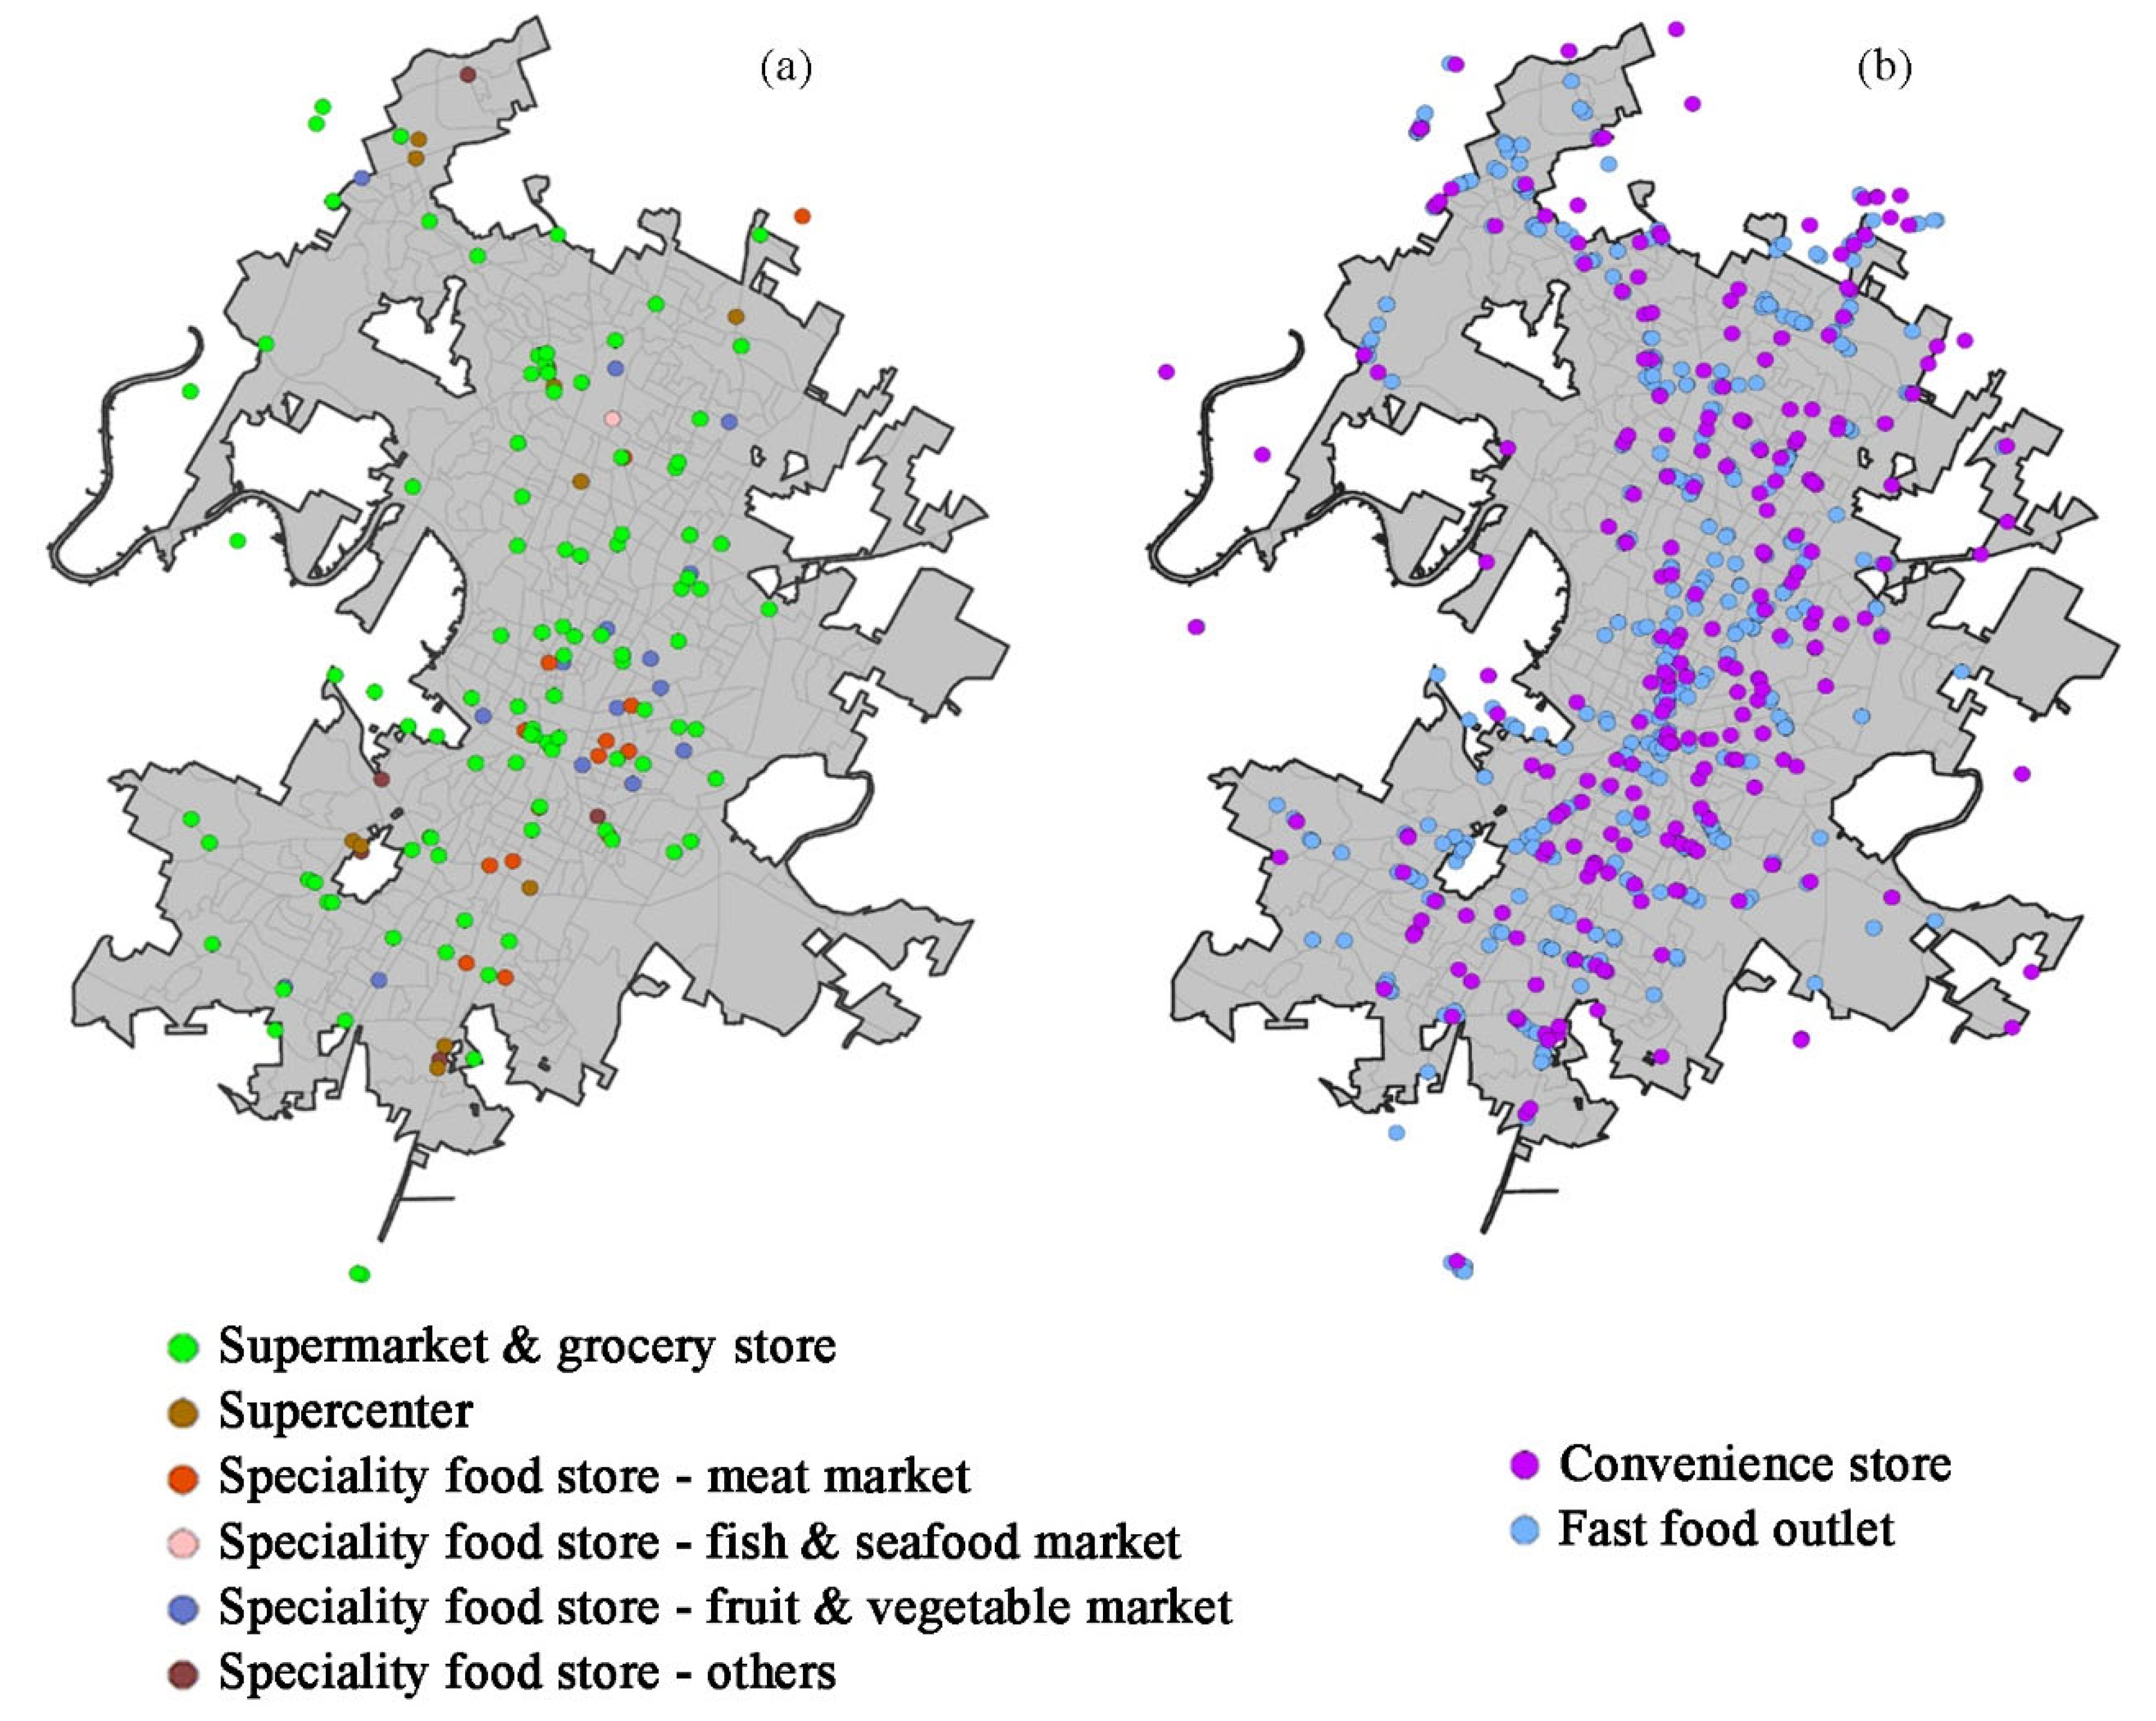
2.1. Study Area & Data Source
2.2. Method
2.2.1. Traditional 2SFCA Method
2.2.2. Multi-Mode Huff-Based 2SFCA
2.2.3. Comparison Analysis between Multi-Mode and Single-Mode Huff-Based 2SFCA
2.2.4. Implementation of Multi-Mode Huff-Based 2SFCA Method
3. Results
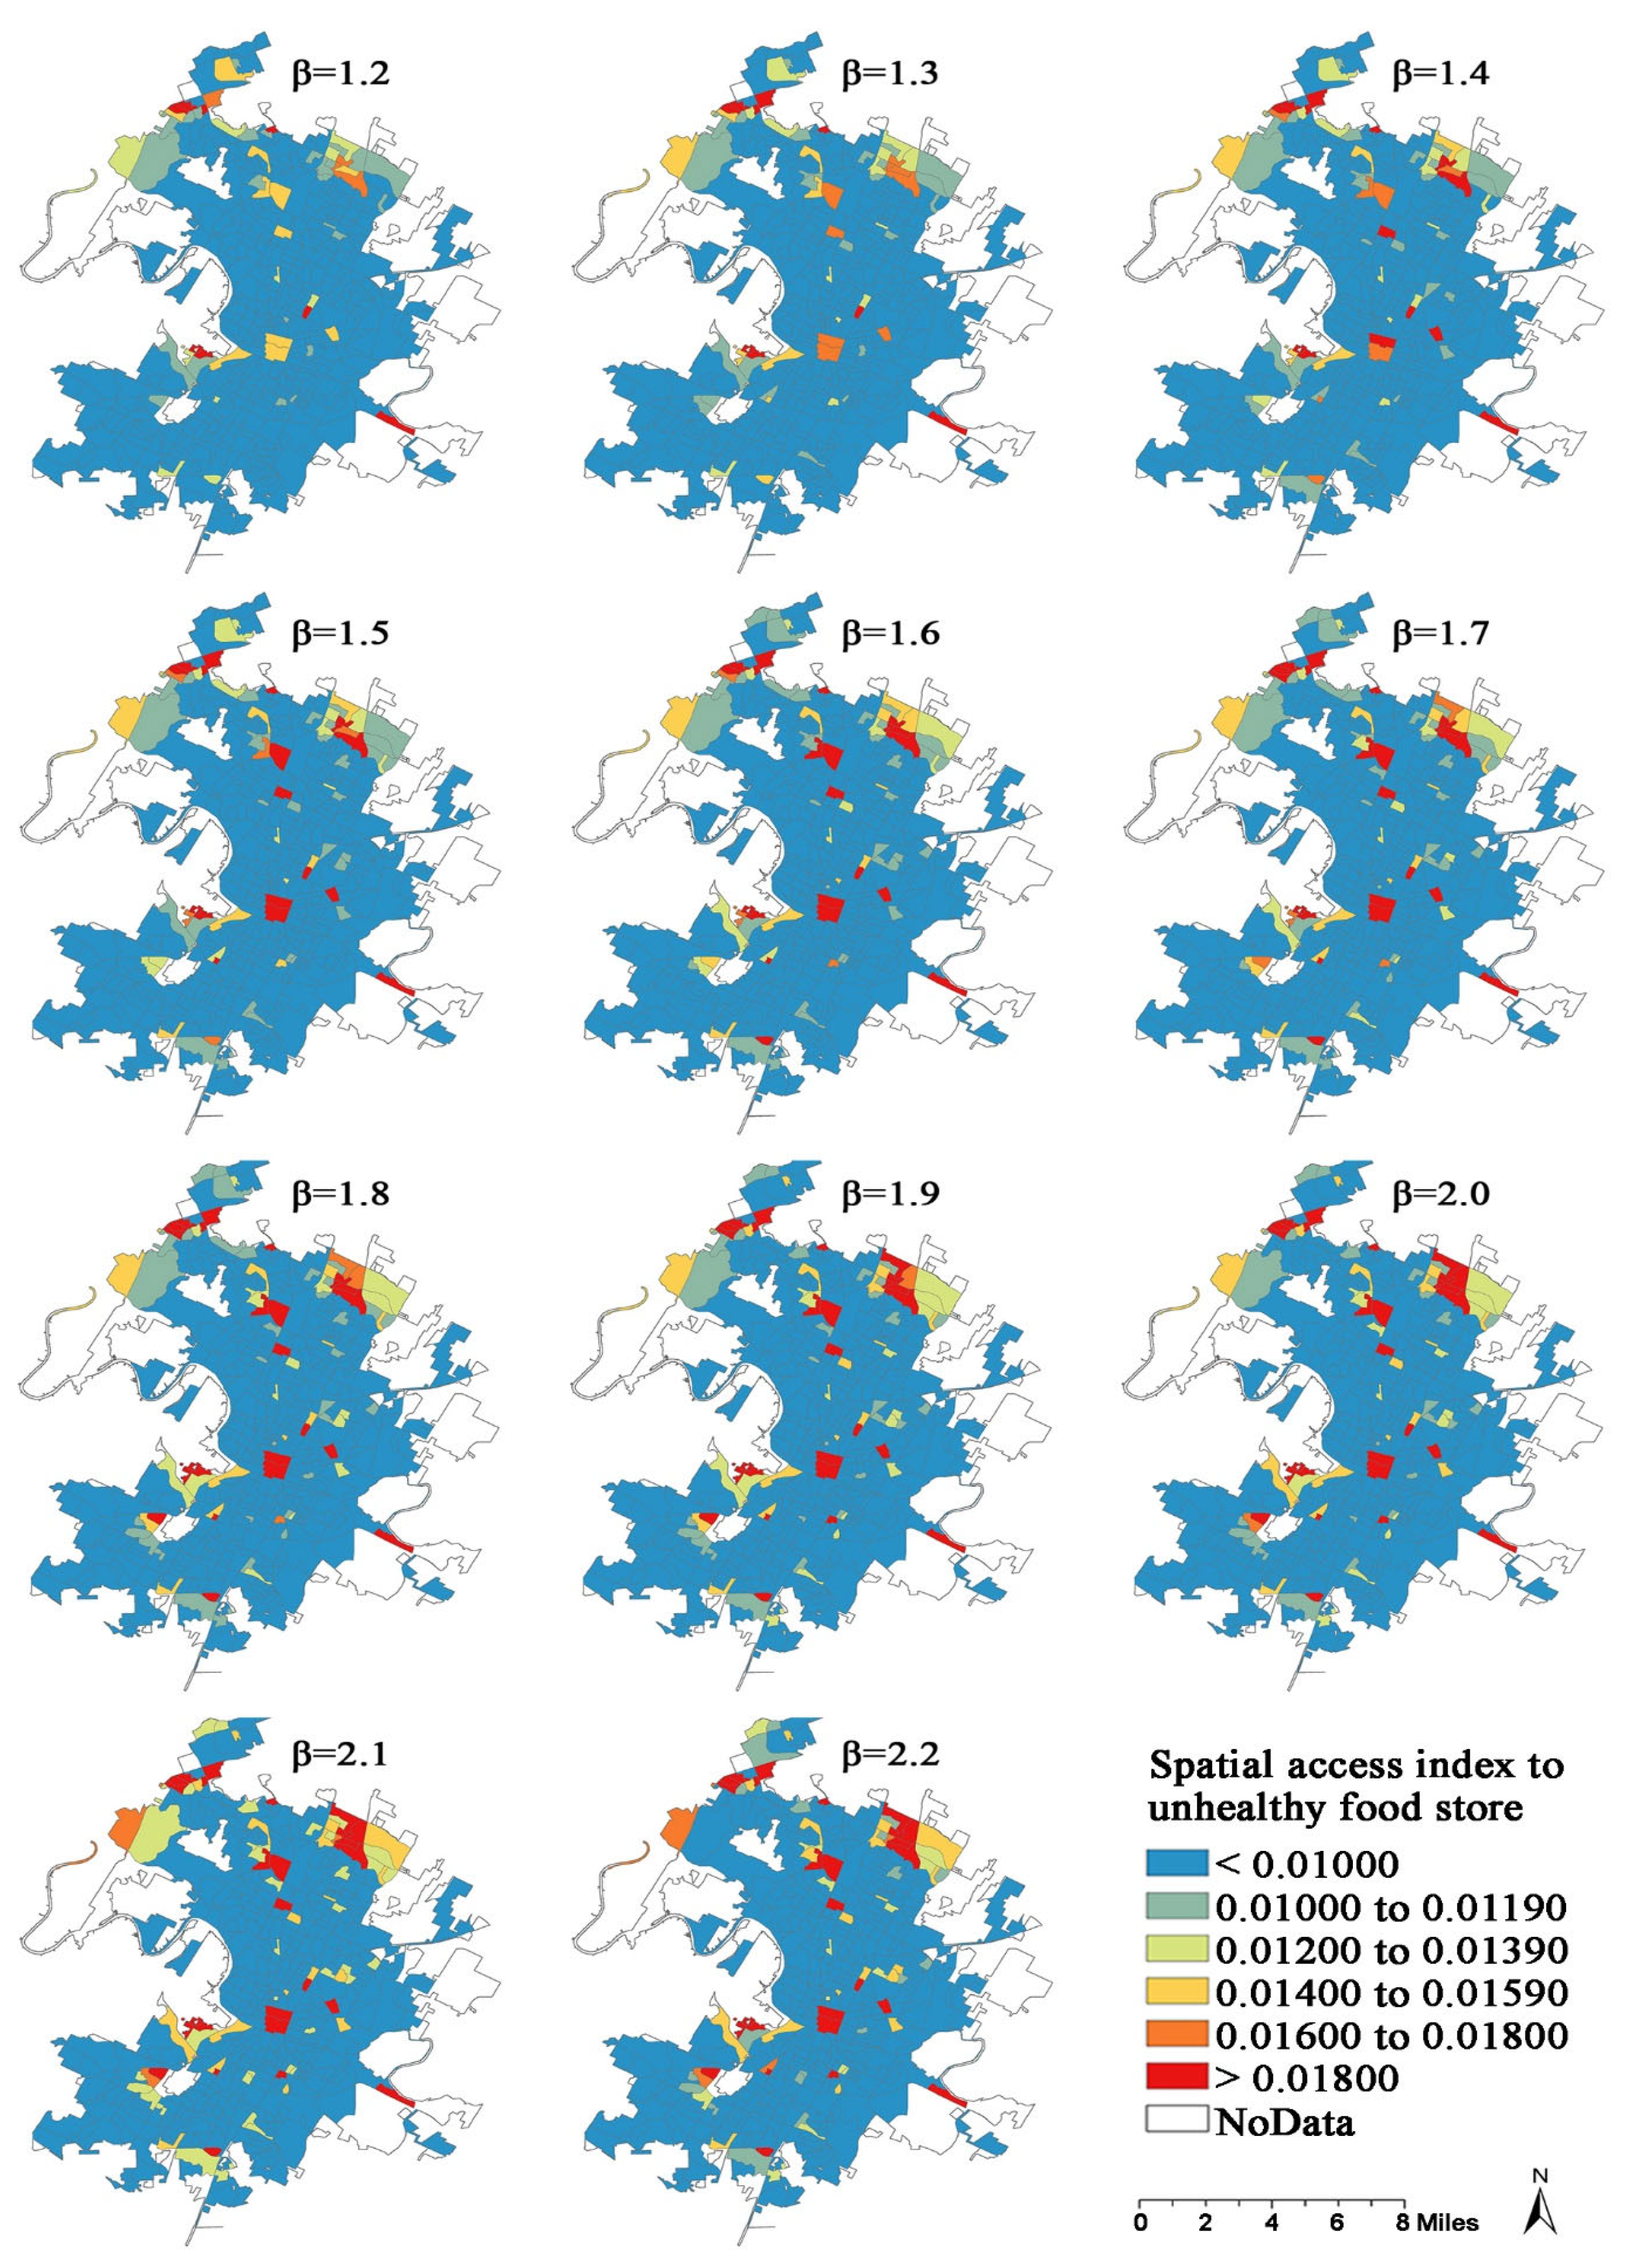
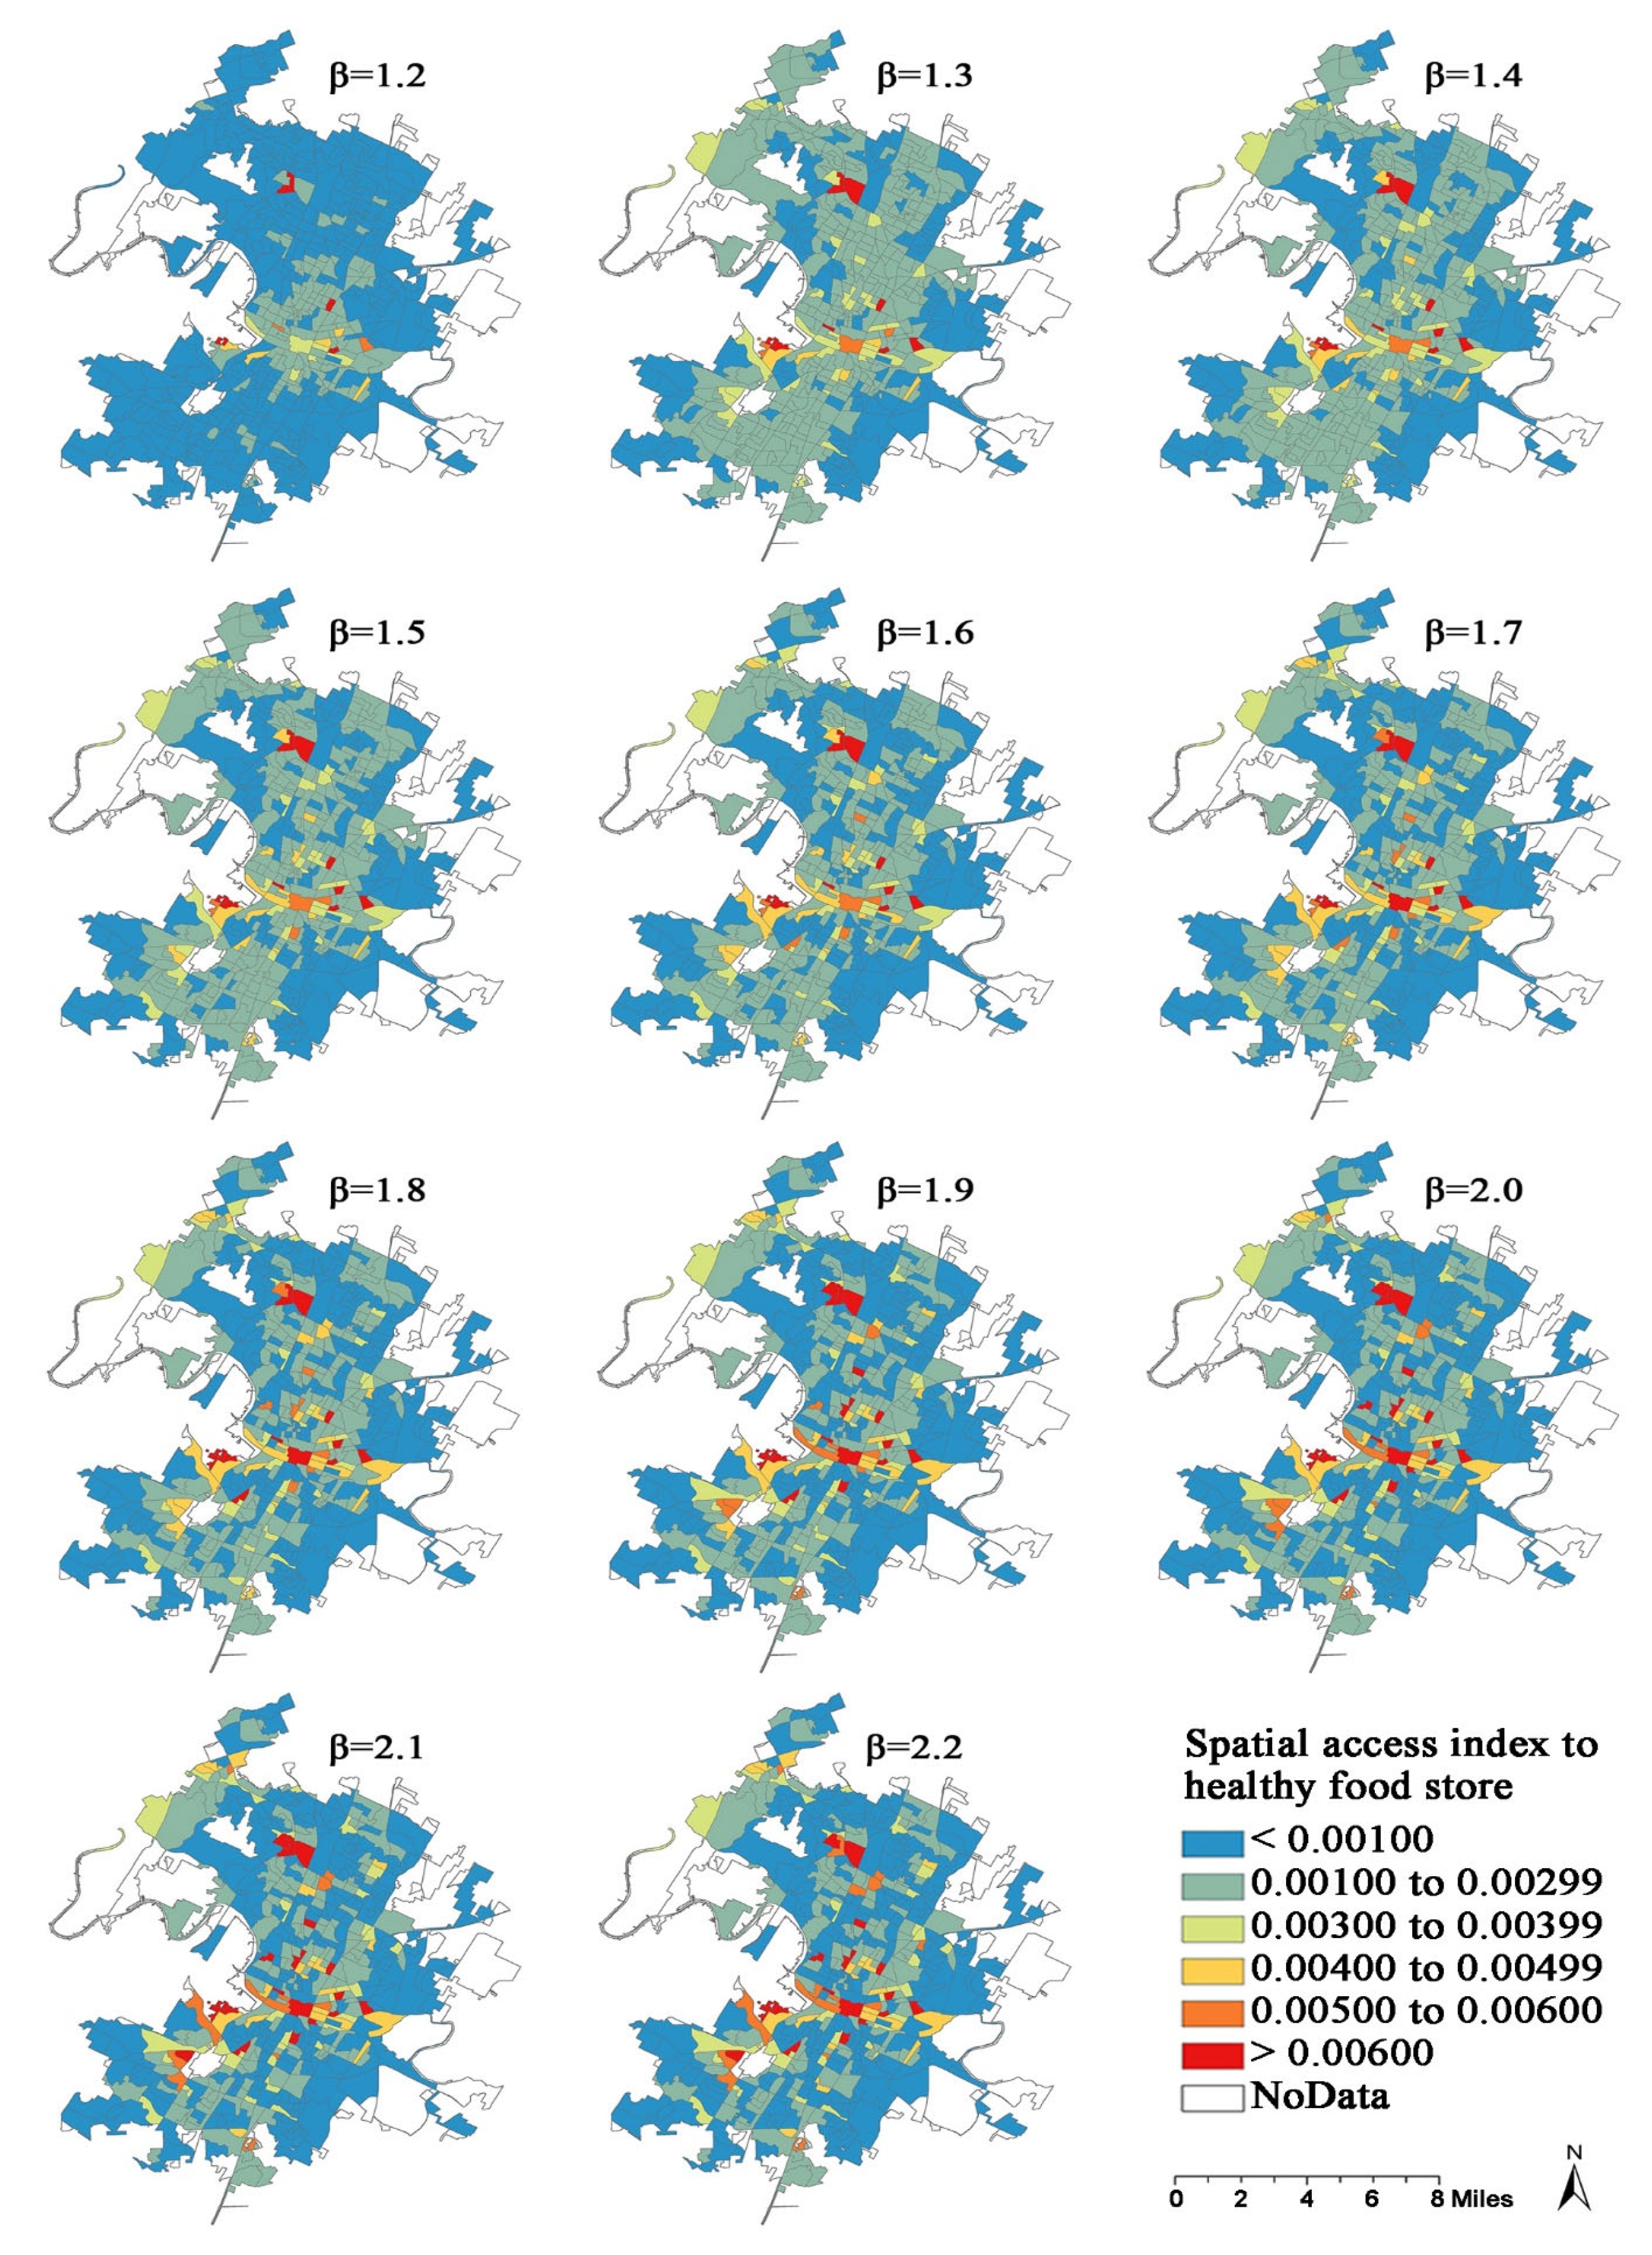
3.1. Geographic Access to Healthy and Unhealthy Food Outlets
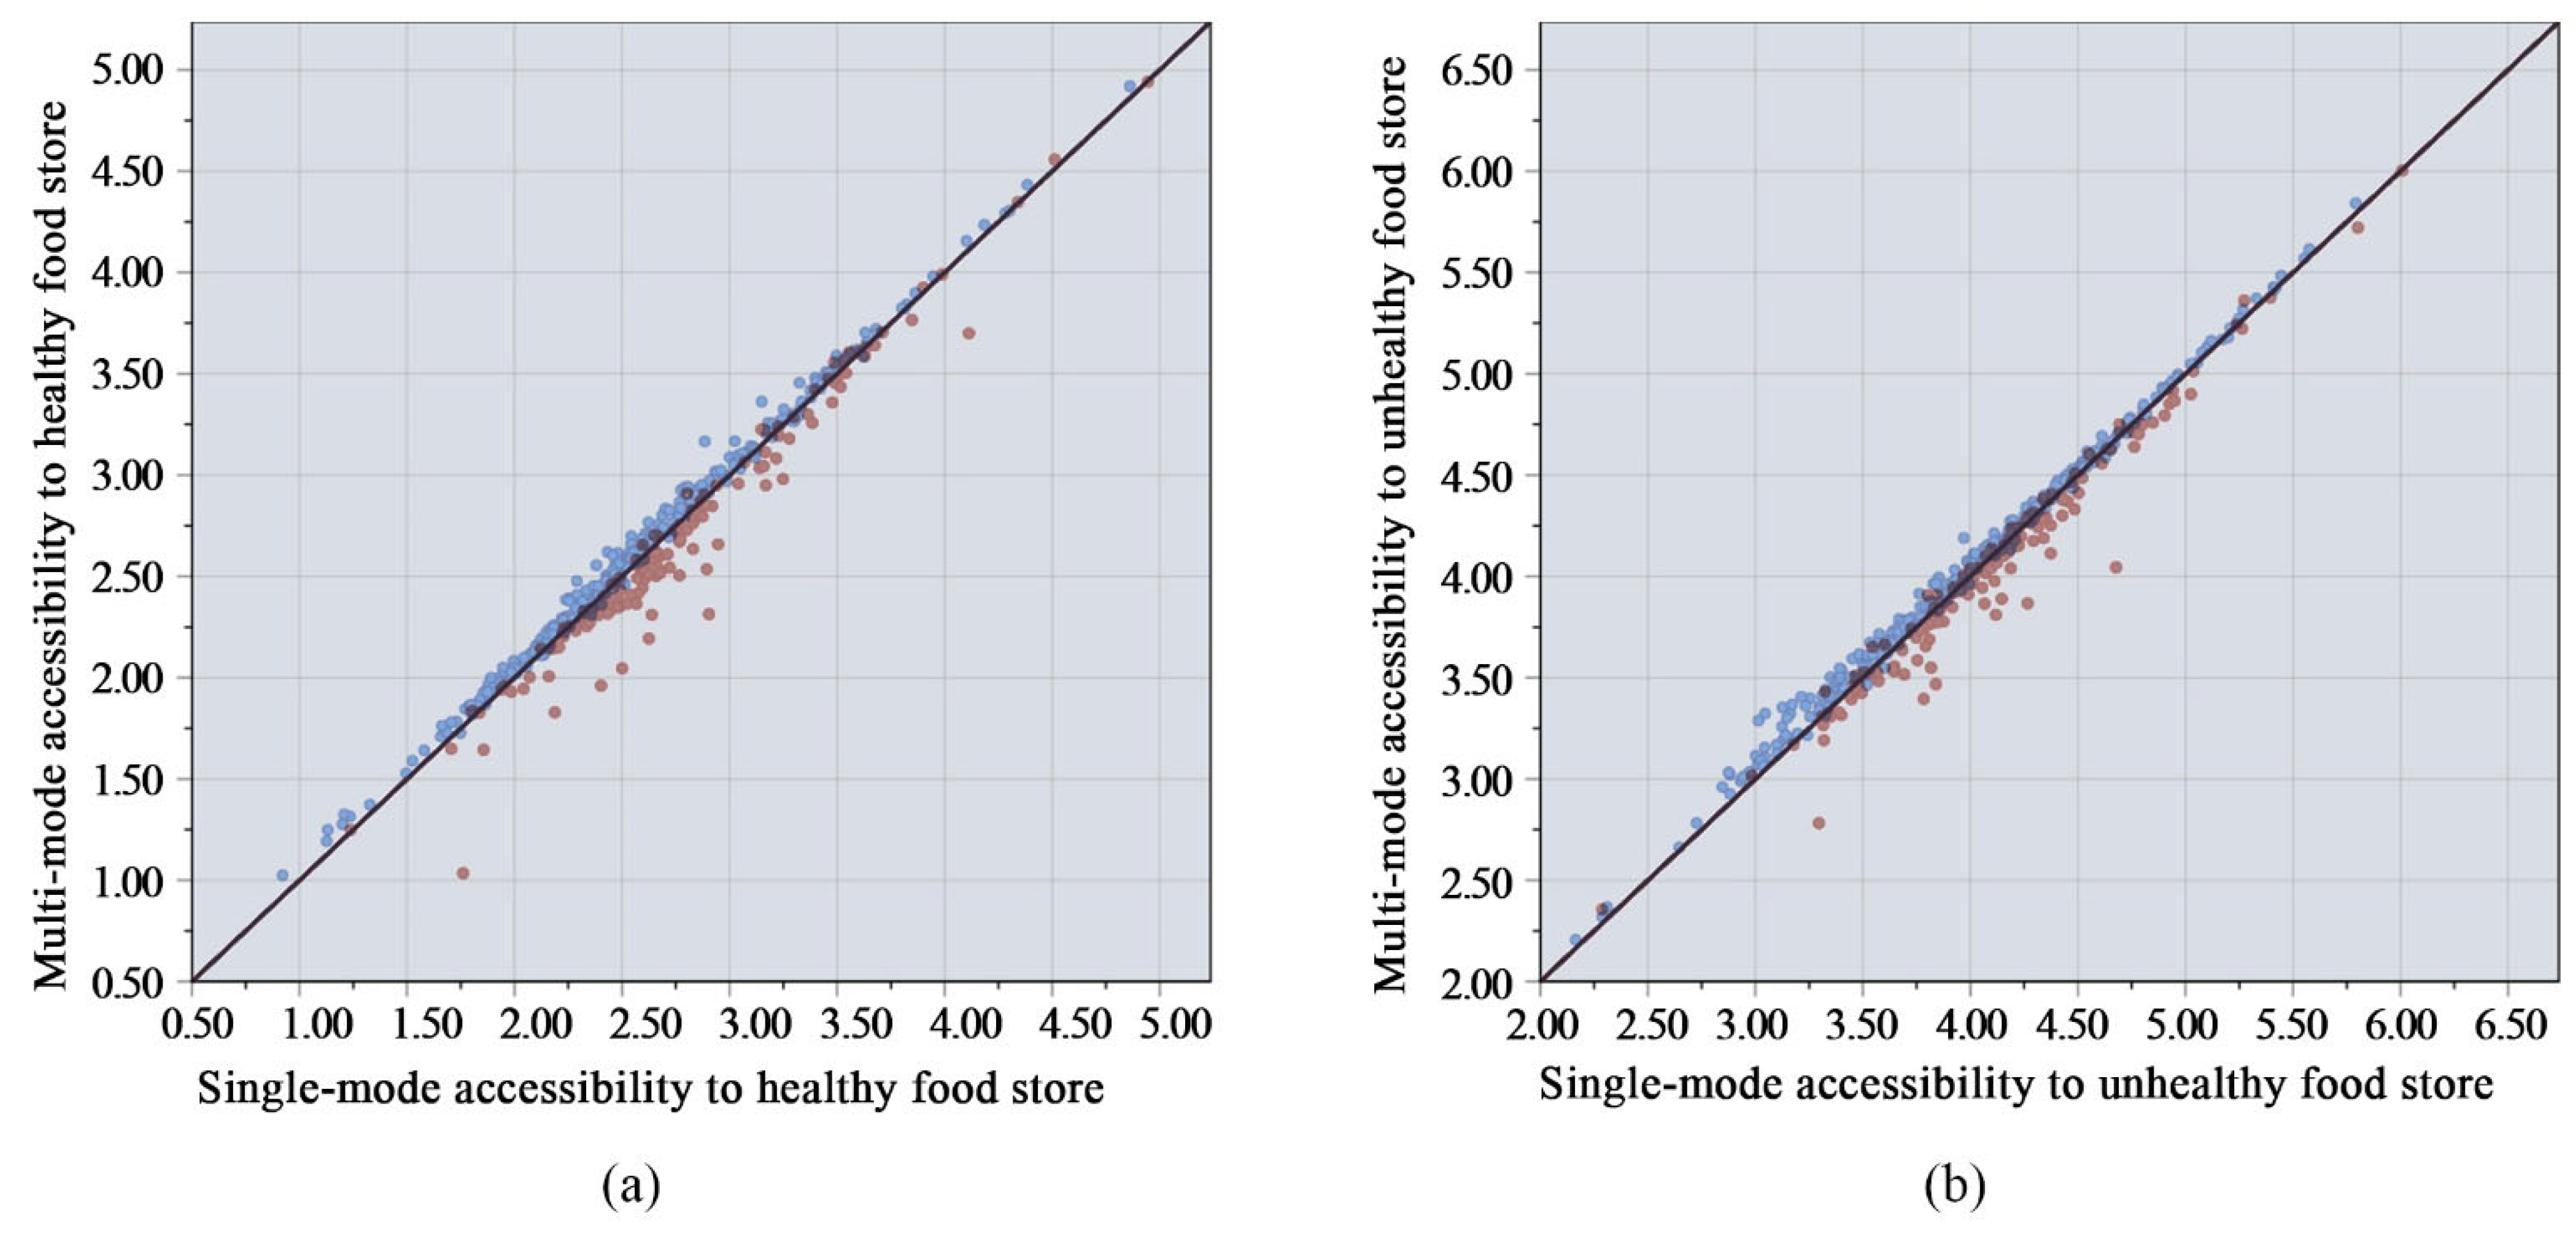
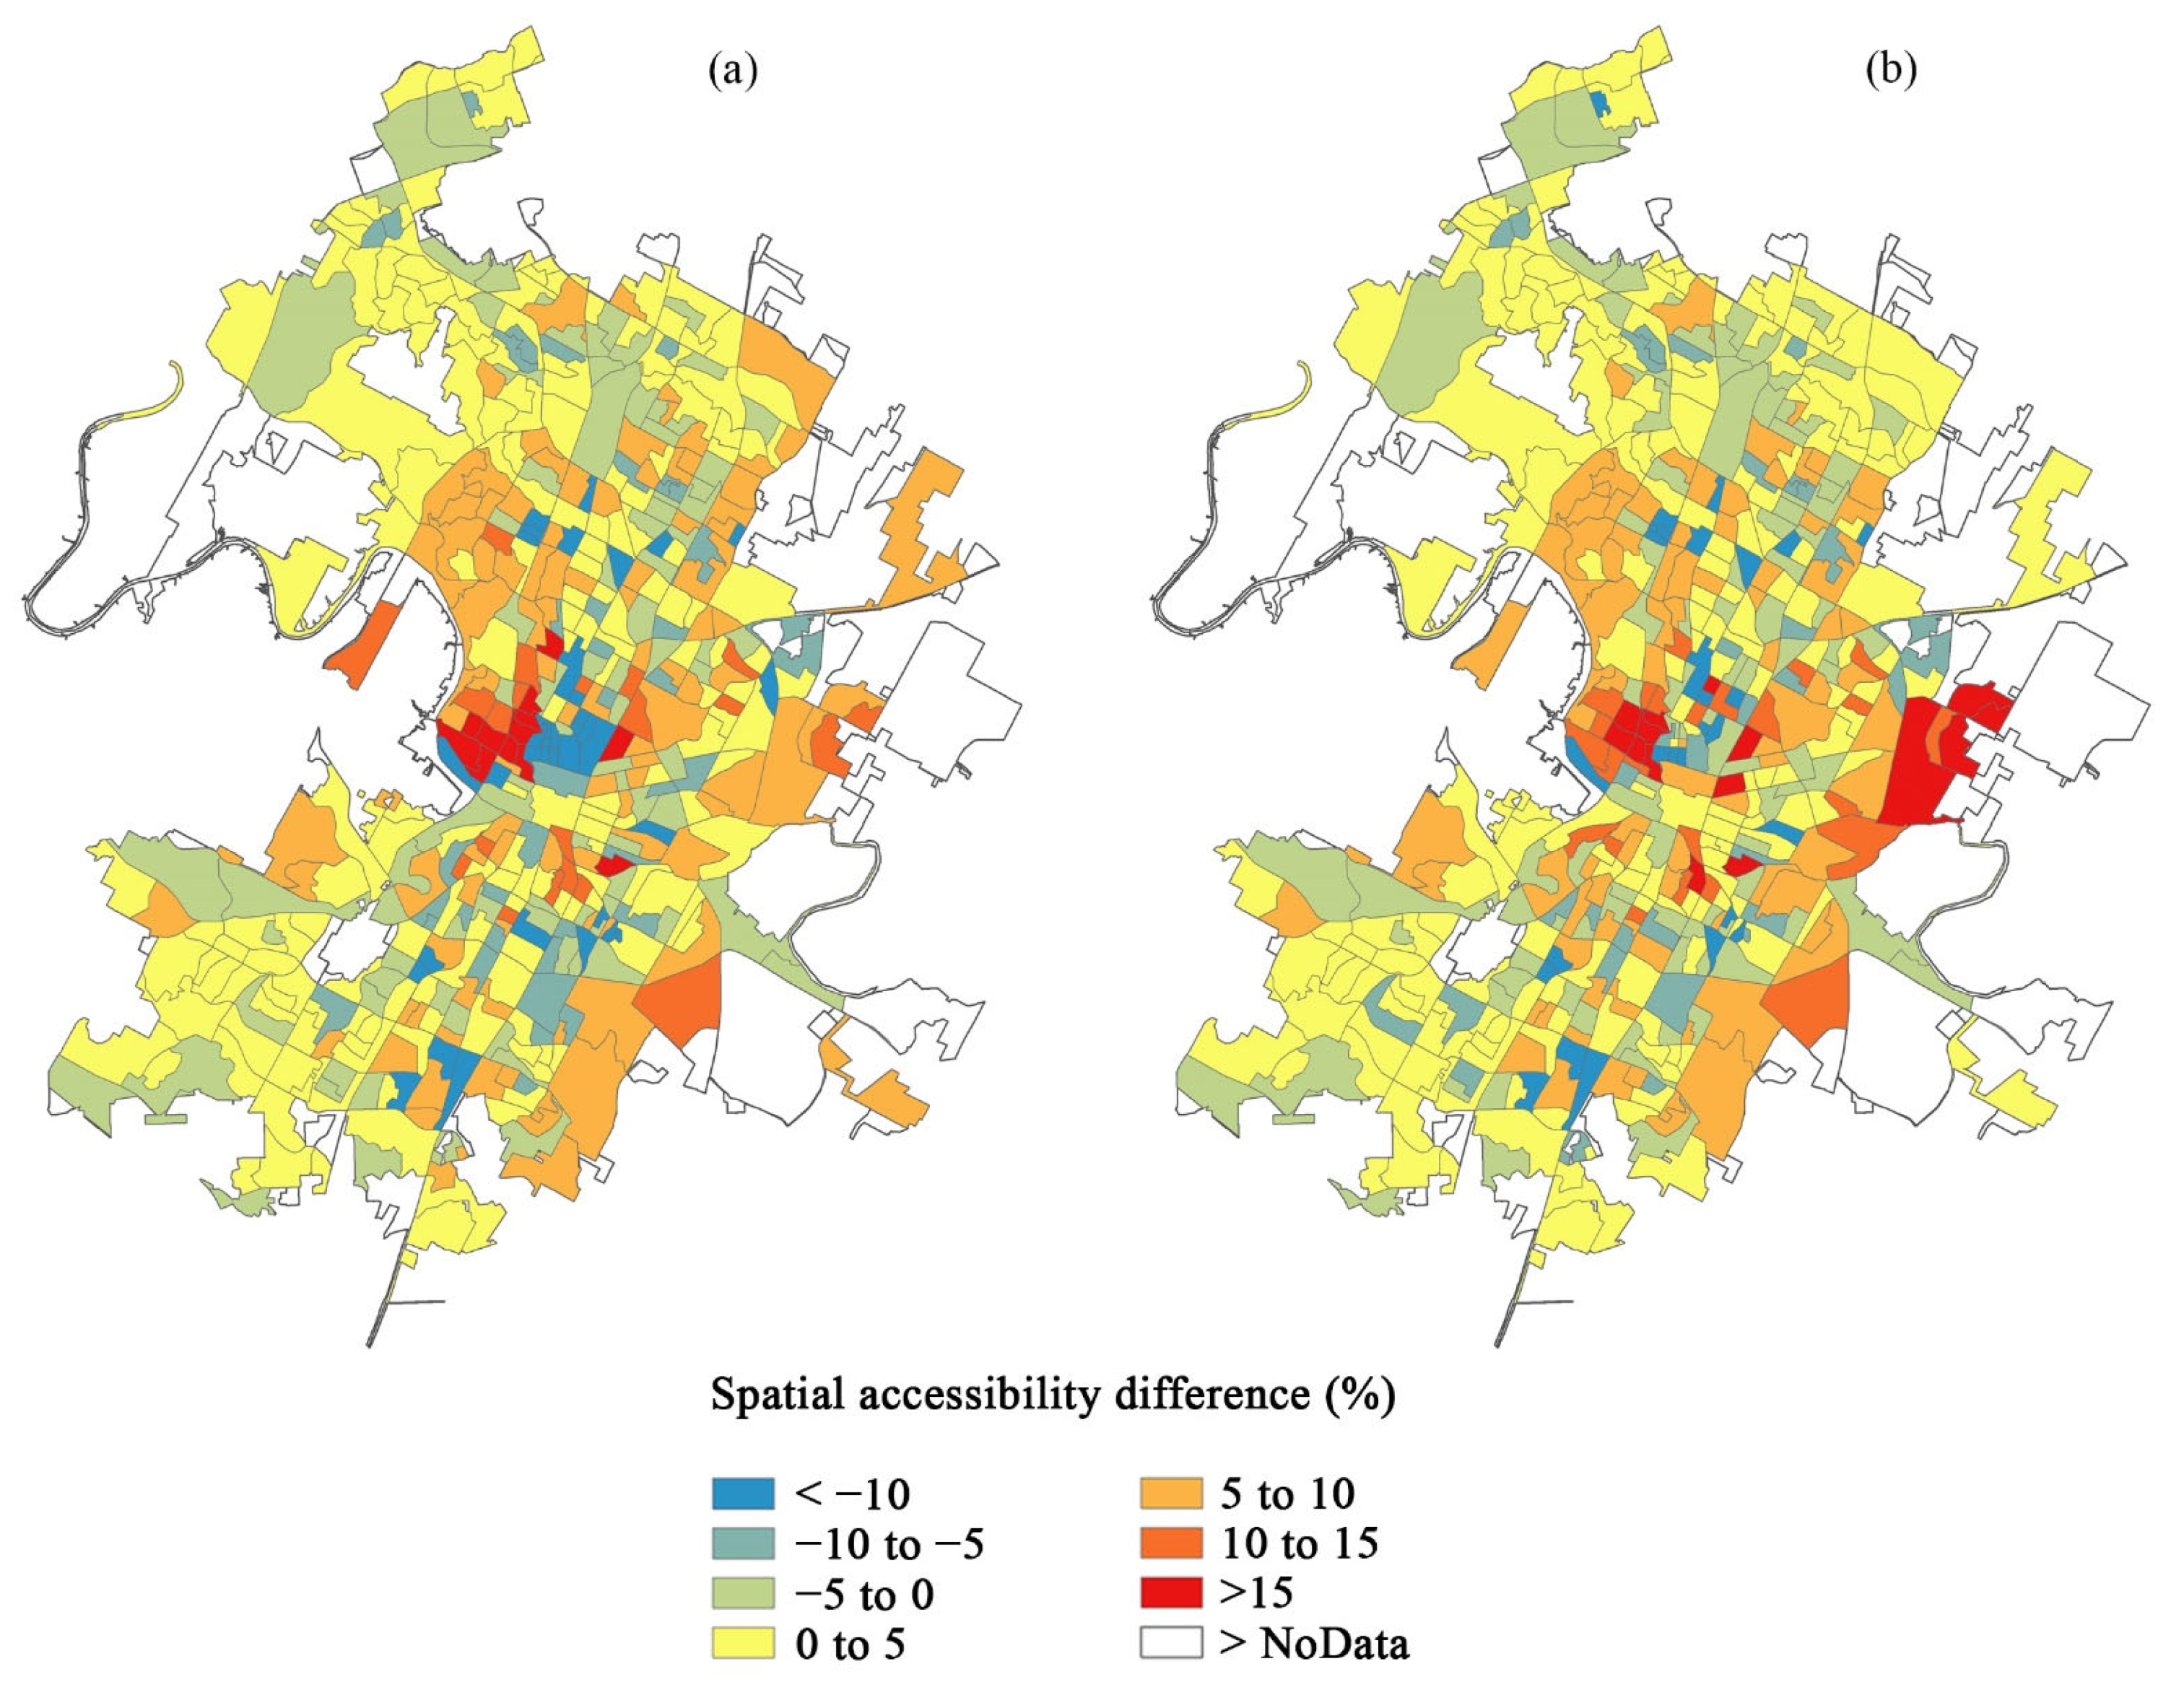
3.2. Results of the Comparison Analysis
4. Discussion and Conclusions
Author Contributions
Funding
Data Availability Statement
Conflicts of Interest
Appendix A


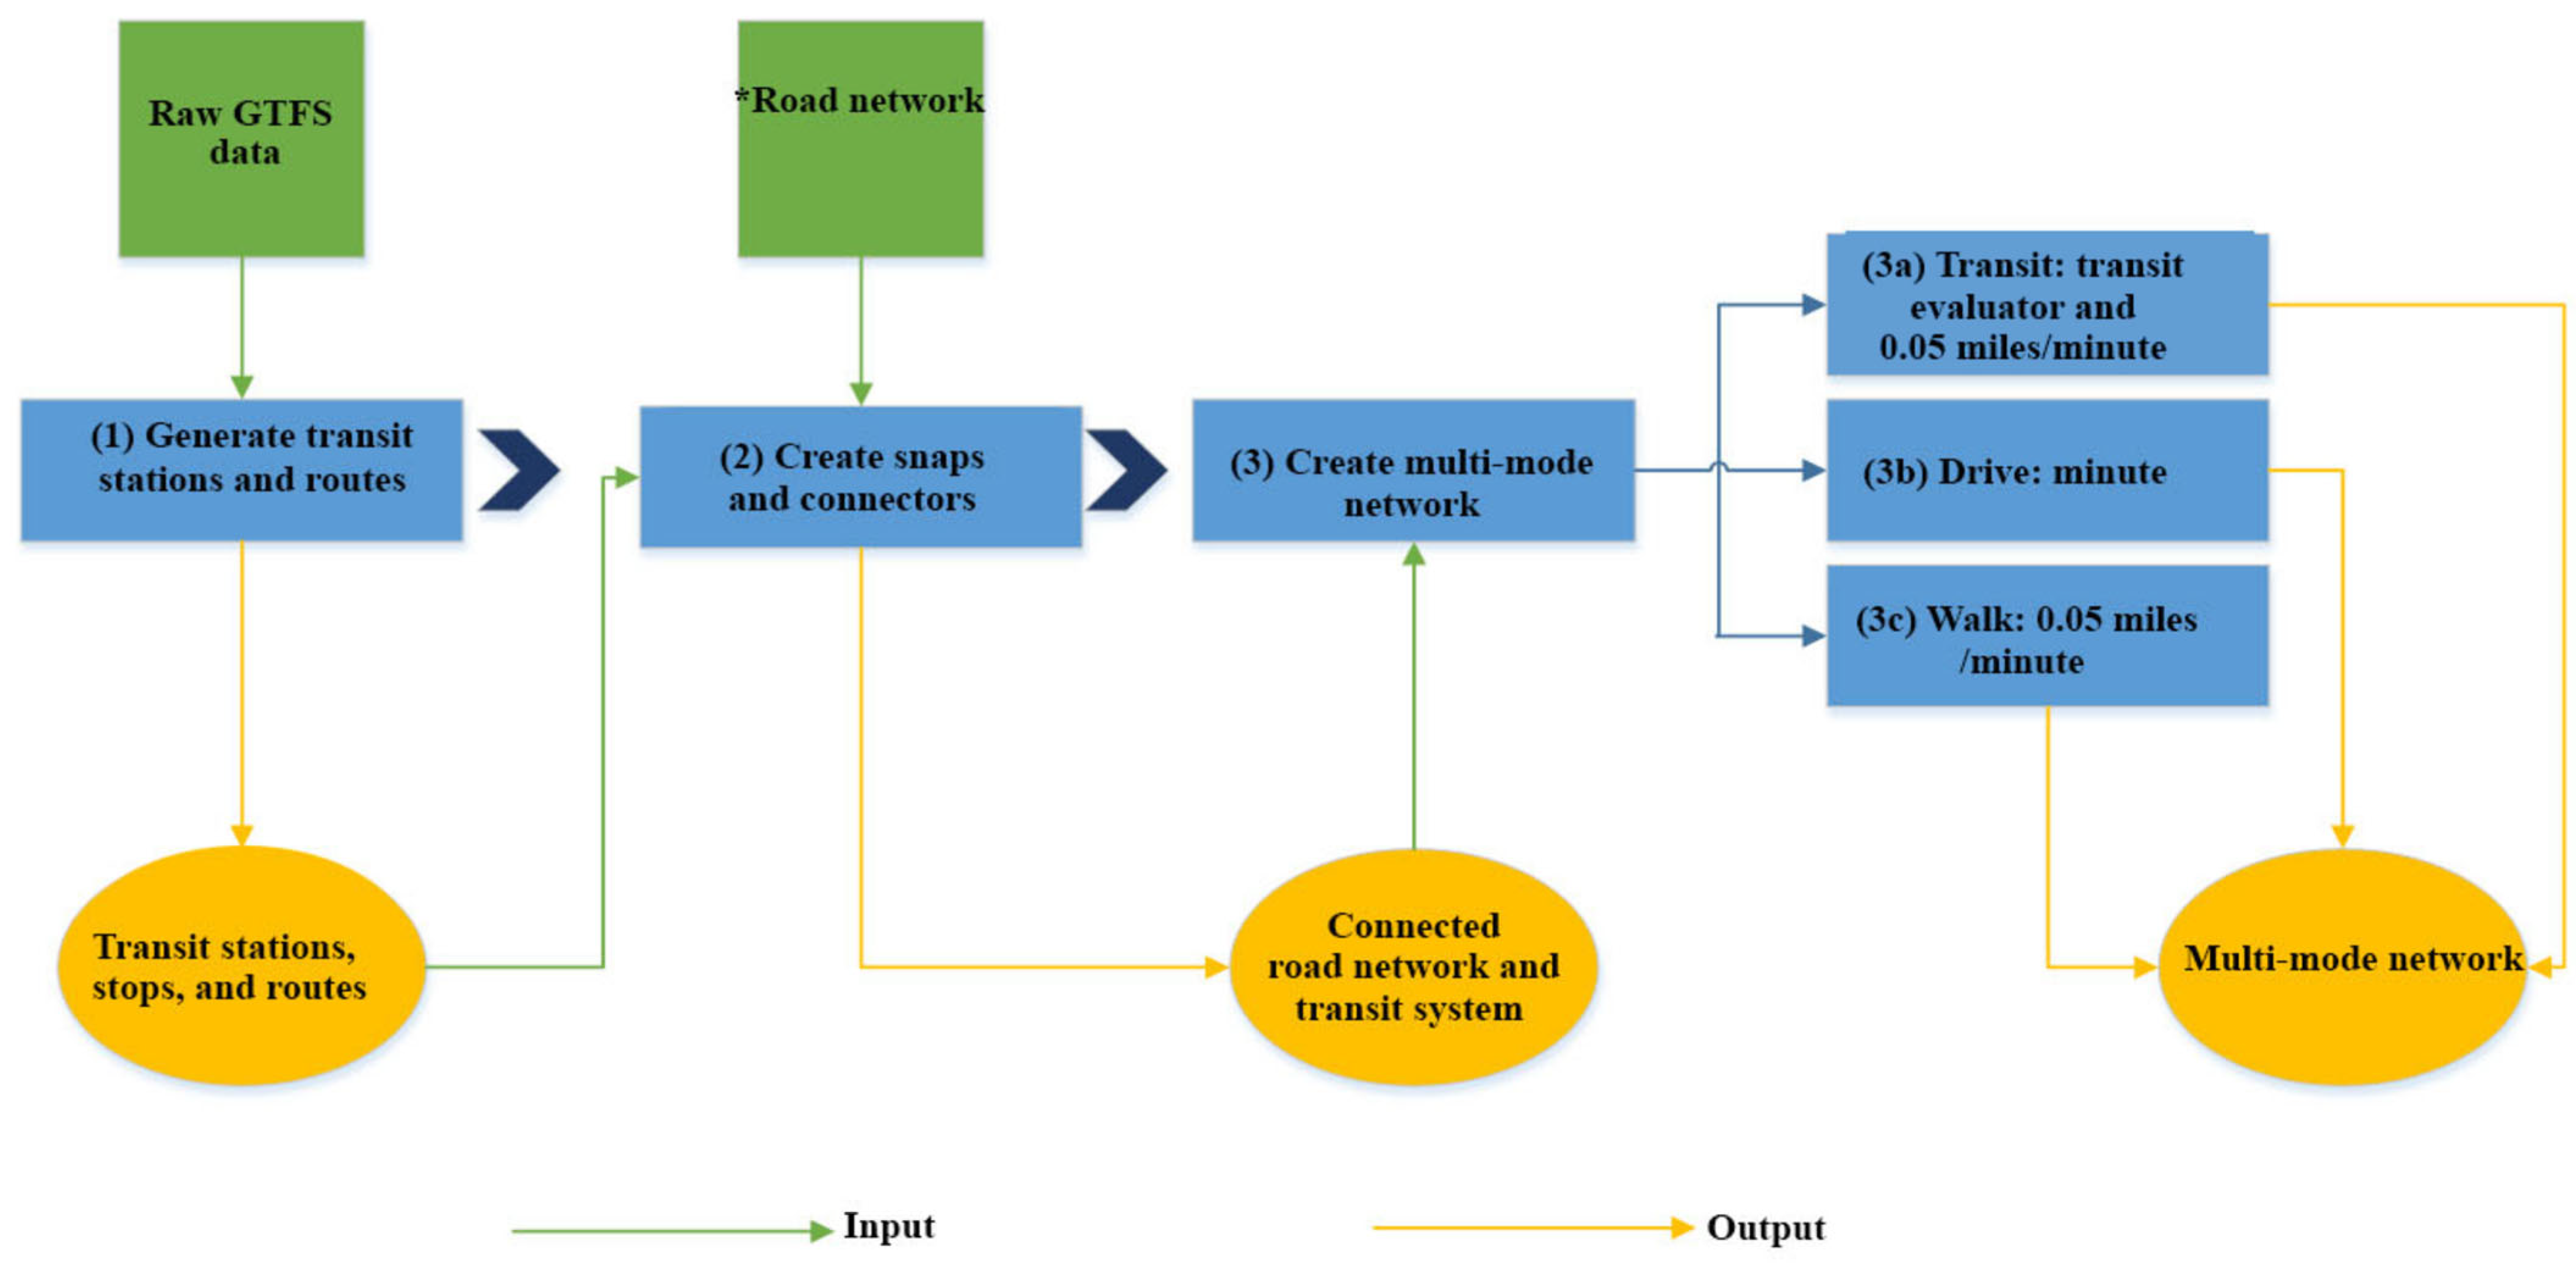
- (1)
- Generate transit routes and stations. GTFS text file contains latitude/longitude information of transit stations, and this information is read by Generate transit lines and stops tool in Add GTFS Data to a Network Dataset toolkit embedded in ArcGIS. A point shapefile that contains all transit stops in Austin is created to store spatial information. Then it generates straight lines to connect two adjacent stops; lines are converted to line shapefiles (i.e., transit routes). In total, 2684 transit stops and 3232 transit route segments were generated.
- (2)
- Create connectors between transit stops to street networks. Road networks and transit stops (or transit lines) come from different resources; there might be gaps between transit stops and road networks. People can’t cross the gaps unless there is a “bridge” connecting transit stops and streets. The Generate Stop-Street Connectors tool can create a “connector” as a “bridge” to facilitate pedestrians to walk through. The “connector” is a short straight line and is perpendicular to streets, and it connects the transit system and street network. The “connector” might not exist in the real world but is an important step. By creating connectors, transit lines and street networks only are connected at stops, which prevents pedestrians from walking on transit lines.
- (3)
- Create a multi-mode transportation network. With the creating a multi-mode network dataset toolkit provided in ArcGIS 10.8 Network Analyst Extension, a multi-mode transit network could be created. The setup of three transportation modes is shown below.
References
- Glanz, K.; Sallis, J.F.; Saelens, B.E.; Frank, L.D. Healthy nutrition environments: Concepts and measures. Am. J. Health Promot. 2005, 19, 330–333. [Google Scholar] [CrossRef]
- Luan, H. Spatial and Spatio-Temporal Analyses of Neighborhood Retail Food Environments: Evidence for Food Planning and Interventions. UWSpace. 2016. Available online: http://hdl.handle.net/10012/11079 (accessed on 21 June 2017).
- Kuai, X.; Zhao, Q. Examining healthy food accessibility and disparity in Baton Rouge, Louisiana. Ann. GIS 2017, 23, 103–116. [Google Scholar] [CrossRef]
- Wang, F.; Luo, W. Assessing spatial and nonspatial factors for healthcare access: Towards an integrated approach to defining health professional shortage areas. Health Place 2005, 11, 131–146. [Google Scholar] [CrossRef]
- Thornton, R.L.; Glover, C.M.; Cené, C.W.; Glik, D.C.; Henderson, J.A.; Williams, D.R. Evaluating strategies for reducing health disparities by addressing the social determinants of health. Health Aff. 2016, 35, 1416–1423. [Google Scholar] [CrossRef] [Green Version]
- Algert, S.J.; Agrawal, A.; Lewis, D.S. Disparities in access to fresh produce in low-income neighborhoods in Los Angeles. Am. J. Prev. Med. 2006, 30, 365–370. [Google Scholar] [CrossRef]
- Dai, D.; Wang, F. Geographic disparities in accessibility to food stores in southwest Mississippi. Environ. Plan. B Plan. Des. 2011, 38, 659–677. [Google Scholar] [CrossRef]
- O’Dwyer, L.A.; Burton, D.L. Potential meets reality: GIS and public health research in Australia. Aust. N. Z. J. Public Health 1998, 22, 819–823. [Google Scholar] [CrossRef]
- Langford, M.; Higgs, G. Measuring potential access to primary healthcare services: The influence of alternative spatial representations of population. Prof. Geogr. 2006, 58, 294–306. [Google Scholar] [CrossRef]
- Luo, J. Integrating the Huff model and floating catchment area methods to analyze spatial access to healthcare services. Trans. GIS 2014, 18, 436–448. [Google Scholar] [CrossRef]
- Charreire, H.; Casey, R.; Salze, P.; Simon, C.; Chaix, B.; Banos, A.; Badariotti, D.; Weber, C.; Oppert, J.-M. Measuring the food environment using geographical information systems: A methodological review. Public Health Nutr. 2010, 13, 1773–1785. [Google Scholar] [CrossRef]
- Forsyth, A.; Lytle, L.; Van Riper, D. Finding food: Issues and challenges in using Geographic Information Systems to measure food access. J. Transp. Land Use 2010, 3, 43. [Google Scholar] [CrossRef]
- Hilmers, A.; Hilmers, D.C.; Dave, J. Neighborhood disparities in access to healthy foods and their effects on environmental justice. Am. J. Public Health 2012, 102, 1644–1654. [Google Scholar] [CrossRef]
- Block, J.P.; Scribner, R.A.; DeSalvo, K.B. Fast food, race/ethnicity, and income. Am. J. Prev. Med. 2004, 27, 211–217. [Google Scholar] [CrossRef]
- Winkler, E.; Turrell, G.; Patterson, C. Does living in a disadvantaged area mean fewer opportunities to purchase fresh fruit and vegetables in the area? Findings from the Brisbane food study. Health Place 2006, 12, 306–319. [Google Scholar] [CrossRef]
- Apparicio, P.; Cloutier, M.-S.; Shearmur, R. The case of Montreal’s missing food deserts: Evaluation of accessibility to food supermarkets. Int. J. Health Geogr. 2007, 6, 4. [Google Scholar] [CrossRef] [Green Version]
- Austin, S.B.; Melly, S.J.; Sanchez, B.N.; Patel, A.; Buka, S.; Gortmaker, S.L. Clustering of fast-food restaurants around schools: A novel application of spatial statistics to the study of food environments. Am. J. Public Health 2005, 95, 1575–1581. [Google Scholar] [CrossRef]
- Baker, E.A.; Schootman, M.; Barnidge, E.; Kelly, C. Peer reviewed: The role of race and poverty in access to foods that enable individuals to adhere to dietary guidelines. Prev. Chronic Dis. 2006, 3, A76. [Google Scholar]
- Powell, L.M.; Chaloupka, F.J.; Bao, Y. The availability of fast-food and full-service restaurants in the United States: Associations with neighborhood characteristics. Am. J. Prev. Med. 2007, 33, S240–S245. [Google Scholar] [CrossRef]
- Moore, L.V.; Diez Roux, A.V.; Nettleton, J.A.; Jacobs, D.R., Jr. Associations of the local food environment with diet quality—A comparison of assessments based on surveys and geographic information systems: The multi-ethnic study of atherosclerosis. Am. J. Epidemiol. 2008, 167, 917–924. [Google Scholar] [CrossRef] [Green Version]
- Wang, M.C.; Kim, S.; Gonzalez, A.A.; MacLeod, K.E.; Winkleby, M.A. Socioeconomic and food-related physical characteristics of the neighbourhood environment are associated with body mass index. J. Epidemiol. Community Health 2007, 61, 491–498. [Google Scholar] [CrossRef] [Green Version]
- Zenk, S.N.; Schulz, A.J.; Israel, B.A.; James, S.A.; Bao, S.; Wilson, M.L. Neighborhood racial composition, neighborhood poverty, and the spatial accessibility of supermarkets in metropolitan Detroit. Am. J. Public Health 2005, 95, 660–667. [Google Scholar] [CrossRef]
- Wang, F. Quantitative Methods and Socio-Economic Applications in GIS; CRC Press: Boca Raton, FL, USA, 2014. [Google Scholar]
- D’Acosta, J. Finding Food Deserts: A Study of Food Access Measures in the Phoenix-Mesa Urban Area; University of Southern California: Los Angeles, CA, USA, 2015. [Google Scholar]
- Larsen, K.; Gilliland, J. Mapping the evolution of ’food deserts’ in a Canadian city: Supermarket accessibility in London, Ontario, 1961–2005. Int. J. Health Geogr. 2008, 7, 16. [Google Scholar] [CrossRef] [Green Version]
- Opfer, P.R. Using GIS Technology to Identify and Analyze ‘Food Deserts’ on the Southern Oregon Coast. 2010. Available online: https://ir.library.oregonstate.edu/concern/graduate_projects/xd07gv654 (accessed on 15 September 2018).
- Pearce, J.; Blakely, T.; Witten, K.; Bartie, P. Neighborhood deprivation and access to fast-food retailing: A national study. Am. J. Prev. Med. 2007, 32, 375–382. [Google Scholar] [CrossRef]
- Sharkey, J.R.; Horel, S.; Dean, W.R. Neighborhood deprivation, vehicle ownership, and potential spatial access to a variety of fruits and vegetables in a large rural area in Texas. Int. J. Health Geogr. 2010, 9, 26. [Google Scholar] [CrossRef] [Green Version]
- Sparks, A.L.; Bania, N.; Leete, L. Comparative approaches to measuring food access in urban areas: The case of Portland, Oregon. Urban Stud. 2011, 48, 1715–1737. [Google Scholar] [CrossRef]
- Gallagher, M.J.C. Examining the Impact of Food Deserts on Public Health in Detroit; Mari Gallagher Research and Consulting Group: Chicago, IL, USA, 2007. [Google Scholar]
- Wan, N.; Zou, B.; Sternberg, T. A three-step floating catchment area method for analyzing spatial access to health services. Int. J. Geogr. Inf. Sci. 2012, 26, 1073–1089. [Google Scholar] [CrossRef]
- Guagliardo, M.F. Spatial accessibility of primary care: Concepts, methods and challenges. Int. J. Health Geogr. 2004, 3, 3. [Google Scholar] [CrossRef] [Green Version]
- Joseph, A.E.; Bantock, P.R. Measuring potential physical accessibility to general practitioners in rural areas: A method and case study. Soc. Sci. Med. 1982, 16, 85–90. [Google Scholar] [CrossRef]
- Chen, X.; Clark, J. Measuring space–time access to food retailers: A case of temporal access disparity in Franklin County, Ohio. Prof. Geogr. 2016, 68, 175–188. [Google Scholar] [CrossRef]
- Zenk, S.N.; Schulz, A.J.; Matthews, S.A.; Odoms-Young, A.; Wilbur, J.; Wegrzyn, L.; Gibbs, K.; Braunschweig, C.; Stokes, C. Activity space environment and dietary and physical activity behaviors: A pilot study. Health Place 2011, 17, 1150–1161. [Google Scholar] [CrossRef] [Green Version]
- Shannon, J. Beyond the supermarket solution: Linking food deserts, neighborhood context, and everyday mobility. Ann. Am. Assoc. Geogr. 2016, 106, 186–202. [Google Scholar] [CrossRef]
- Balstrøm, T. On identifying the most time-saving walking route in a trackless mountainous terrain. Geogr. Tidsskr.-Dan. J. Geogr. 2002, 102, 51–58. [Google Scholar] [CrossRef]
- Sherrill, K.; Frakes, B.; Schupbach, S. Travel Time Cost Surface Model: Standard Operating Procedure; Natural Resource Report. Nps/Nrpc/Imd/Nrr–2010/238. Published Report-2164894; Natural Resources Program Center: Fort Collins, CO, USA, 2010. [Google Scholar]
- Wan, N.; Zhan, F.B.; Zou, B.; Chow, E. A relative spatial access assessment approach for analyzing potential spatial access to colorectal cancer services in Texas. Appl. Geogr. 2012, 32, 291–299. [Google Scholar] [CrossRef]
- Luo, W.; Wang, F. Measures of spatial accessibility to health care in a GIS environment: Synthesis and a case study in the Chicago region. Environ. Plan. B Plan. Des. 2003, 30, 865–884. [Google Scholar] [CrossRef] [Green Version]
- Vo, A.; Plachkinova, M.; Bhaskar, R. Assessing healthcare accessibility algorithms: A comprehensive investigation of two-step floating catchment methodologies family. In Proceedings of the 2015 Americas Conferences on Information Systems (AMCIS 2015), Fajardo, Puerto Rico, 13–15 August 2015; p. 17. [Google Scholar]
- Lin, Y.; Wan, N.; Sheets, S.; Gong, X.; Davies, A. A multi-modal relative spatial access assessment approach to measure spatial accessibility to primary care providers. Int. J. Health Geogr. 2018, 17, 33. [Google Scholar] [CrossRef] [Green Version]
- Park, J.; Goldberg, D.W. A review of recent spatial accessibility studies that benefitted from advanced geospatial information: Multimodal transportation and spatiotemporal disaggregation. ISPRS Int. J. Geo-Inf. 2021, 10, 532. [Google Scholar] [CrossRef]
- Tao, Z.; Zhou, J.; Lin, X.; Chao, H.; Li, G.J. Investigating the impacts of public transport on job accessibility in Shenzhen, China: A multi-modal approach. Land Use Policy 2020, 99, 105025. [Google Scholar] [CrossRef]
- Zhou, X.; Yu, Z.; Yuan, L.; Wang, L.; Wu, C.J. Measuring accessibility of healthcare facilities for populations with multiple transportation modes considering residential transportation mode choice. ISPRS Int. J. Geo-Inf. 2020, 9, 394. [Google Scholar] [CrossRef]
- Tao, Z.; Yao, Z.; Kong, H.; Duan, F.; Li, G.J. Spatial accessibility to healthcare services in Shenzhen, China: Improving the multi-modal two-step floating catchment area method by estimating travel time via online map APIs. BMC Health Serv. Res. 2018, 18, 345. [Google Scholar] [CrossRef] [Green Version]
- Hu, S.; Song, W.; Li, C.; Lu, J.J.C. A multi-mode Gaussian-based two-step floating catchment area method for measuring accessibility of urban parks. Cities 2020, 105, 102815. [Google Scholar] [CrossRef]
- Mao, L.; Nekorchuk, D. Measuring spatial accessibility to healthcare for populations with multiple transportation modes. Health Place 2013, 24, 115–122. [Google Scholar] [CrossRef]
- Huff, D.L.J.E. ArcUser. Parameter Estimation in the Huff Model. 2003, pp. 34–36. Available online: https://www.esri.com/news/arcuser/1003/files/huff.pdf (accessed on 23 August 2022).
- Jin, H.; Lu, Y. Evaluating consumer nutrition environment in food deserts and food swamps. Int. J. Environ. Res. Public Health 2021, 18, 2675. [Google Scholar] [CrossRef]
- Jin, H.; Lu, Y. SAR-Gi*: Taking a spatial approach to understand food deserts and food swamps. Appl. Geogr. 2021, 134, 102529. [Google Scholar] [CrossRef]
- Stein, D.O. ‘Food Deserts’ and ‘Food Swamps’ in Hillsborough County, Florida: Unequal Access to Supermarkets and Fast-Food Restaurants; University of South Florida: Tampa, FL, USA, 2011. [Google Scholar]
- Van Meter, E.M.; Lawson, A.B.; Colabianchi, N.; Nichols, M.; Hibbert, J.; Porter, D.E.; Liese, A.D. An evaluation of edge effects in nutritional accessibility and availability measures: A simulation study. Int. J. Health Geogr. 2010, 9, 40. [Google Scholar] [CrossRef] [Green Version]
- Yang, Y.; Diez-Roux, A.V. Using an agent-based model to simulate children’s active travel to school. Int. J. Behav. Nutr. Phys. Act. 2013, 10, 67. [Google Scholar] [CrossRef] [Green Version]
- Zhang, M.; Ghosh, D. Spatial Supermarket Redlining and Neighborhood Vulnerability: A Case Study of Hartford, Connecticut. Trans. GIS 2016, 20, 79–100. [Google Scholar] [CrossRef] [Green Version]
- Whelan, A.; Wrigley, N.; Warm, D.; Cannings, E.J.U.S. Life in a ‘food desert’. Urban Stud. 2002, 39, 2083–2100. [Google Scholar] [CrossRef]
- Wan, N.; Zhan, F.B.; Zou, B.; Wilson, J.G. Spatial access to health care services and disparities in colorectal cancer stage at diagnosis in Texas. Prof. Geogr. 2013, 65, 527–541. [Google Scholar] [CrossRef]


| Sales Volume Range | Sales Volume | Store Capacity | The Number of Healthy Food Stores | The Number of Unhealthy Food Stores |
|---|---|---|---|---|
| <0.5 million | 500,000 | 5.69 | 15 | 128 |
| 0.5~1.0 million | 1,000,000 | 6.00 | 9 | 234 |
| 1.0~2.5 million | 2,500,000 | 6.39 | 36 | 385 |
| 2.5~5 million | 5,000,000 | 6.69 | 13 | 61 |
| 5~10 million | 10,000,000 | 7.00 | 11 | 1 |
| 10~20 million | 20,000,000 | 7.30 | 8 | 2 |
| 20~50 million | 50,000,000 | 7.69 | 35 | NA |
| 50~100 million | 100,000,000 | 8.00 | 24 | NA |
| 100~500 million | 500,000,000 | 8.69 | 5 | NA |
| β | Min | 1st Quartile | Median | 3rd Quartile | Max | Mean | SD | CV | Moran’s I |
|---|---|---|---|---|---|---|---|---|---|
| 1.2 | 0.00023 | 0.00111 | 0.00139 | 0.00188 | 0.01047 | 0.00168 | 0.00110 | 0.65451 | 0.09493 |
| 1.3 | 0.00019 | 0.00104 | 0.00134 | 0.00189 | 0.01213 | 0.00170 | 0.00126 | 0.74160 | 0.07861 |
| 1.4 | 0.00015 | 0.00096 | 0.00129 | 0.00191 | 0.01400 | 0.00171 | 0.00143 | 0.83982 | 0.07153 |
| 1.5 | 0.00012 | 0.00089 | 0.00124 | 0.00195 | 0.01506 | 0.00171 | 0.00153 | 0.89320 | 0.06990 |
| 1.6 | 0.00010 | 0.00083 | 0.00121 | 0.00198 | 0.01622 | 0.00172 | 0.00165 | 0.95570 | 0.06644 |
| 1.7 | 0.00008 | 0.00077 | 0.00116 | 0.00198 | 0.01718 | 0.00173 | 0.00175 | 1.01175 | 0.06312 |
| 1.8 | 0.00006 | 0.00071 | 0.00111 | 0.00200 | 0.01796 | 0.00174 | 0.00184 | 1.06173 | 0.06005 |
| 1.9 | 0.00005 | 0.00066 | 0.00106 | 0.00204 | 0.01859 | 0.00174 | 0.00192 | 1.10559 | 0.05734 |
| 2.0 | 0.00004 | 0.00061 | 0.00103 | 0.00207 | 0.01910 | 0.00175 | 0.00200 | 1.14446 | 0.05492 |
| 2.1 | 0.00003 | 0.00057 | 0.00099 | 0.00212 | 0.01952 | 0.00175 | 0.00206 | 1.17961 | 0.05268 |
| 2.2 | 0.00002 | 0.00053 | 0.00096 | 0.00216 | 0.01989 | 0.00175 | 0.00212 | 1.21151 | 0.05061 |
| Paired Difference a | ||||||
|---|---|---|---|---|---|---|
| β | Mean | Stand Deviation | Standard Error | 95% Confidence Interval of the Difference | t-Value | p-Value |
| 1.2 | 0.000013 | 0.000189 | 0.000009 | (−0.000004, 0.000030) | 1.526 | 0.128 |
| 1.3 | 0.000012 | 0.000186 | 0.000009 | (−0.000004, 0.000029) | 1.452 | 0.147 |
| 1.4 | 0.000013 | 0.000125 | 0.000006 | (0.000002, 0.000024) | 1.981 | 0.048 * |
| 1.5 | 0.000009 | 0.000175 | 0.000008 | (−0.000007, 0.000025) | 1.151 | 0.25 |
| 1.6 | 0.000010 | 0.000166 | 0.000008 | (−0.000005, 0.000025) | 1.303 | 0.193 |
| 1.7 | 0.000009 | 0.000159 | 0.000007 | (−0.000005, 0.000023) | 1.260 | 0.208 |
| 1.8 | 0.000008 | 0.000152 | 0.000007 | (−0.000006, 0.000022) | 1.124 | 0.262 |
| 1.9 | 0.000007 | 0.000146 | 0.000007 | (−0.000006, 0.000021) | 1.111 | 0.267 |
| 2.0 | 0.000007 | 0.00014 | 0.000006 | (−0.000005, 0.000020) | 1.155 | 0.249 |
| 2.1 | 0.000007 | 0.000136 | 0.000006 | (−0.000005, 0.000019) | 1.132 | 0.258 |
| 2.2 | 0.000007 | 0.000131 | 0.000006 | (−0.000005, 0.000018) | 1.081 | 0.280 |
| Vehicle Ownership | Method | Under-Served Area for Healthy Food (km2) a | Under-Served Population for Healthy Food a | Over-Served Area for Unhealthy Food (km2) b | Over-Served Population for Unhealthy Food b |
|---|---|---|---|---|---|
| Block groups with high vehicle ownership | Single-mode | 221.44 | 185,606 | 80.30 | 79,778 |
| Multi-mode | 213.51 | 175,399 | 83.25 | 83,168 | |
| Block groups with low vehicle ownership | Single-mode | 20.53 | 38,205 | 15.62 | 32,053 |
| Multi-mode | 24.19 | 47,263 | 14.89 | 28,007 |
Publisher’s Note: MDPI stays neutral with regard to jurisdictional claims in published maps and institutional affiliations. |
© 2022 by the authors. Licensee MDPI, Basel, Switzerland. This article is an open access article distributed under the terms and conditions of the Creative Commons Attribution (CC BY) license (https://creativecommons.org/licenses/by/4.0/).
Share and Cite
Jin, H.; Lu, Y. Multi-Mode Huff-Based 2SFCA: Examining Geographical Accessibility to Food Outlets in Austin, Texas. ISPRS Int. J. Geo-Inf. 2022, 11, 579. https://doi.org/10.3390/ijgi11110579
Jin H, Lu Y. Multi-Mode Huff-Based 2SFCA: Examining Geographical Accessibility to Food Outlets in Austin, Texas. ISPRS International Journal of Geo-Information. 2022; 11(11):579. https://doi.org/10.3390/ijgi11110579
Chicago/Turabian StyleJin, He, and Yongmei Lu. 2022. "Multi-Mode Huff-Based 2SFCA: Examining Geographical Accessibility to Food Outlets in Austin, Texas" ISPRS International Journal of Geo-Information 11, no. 11: 579. https://doi.org/10.3390/ijgi11110579
APA StyleJin, H., & Lu, Y. (2022). Multi-Mode Huff-Based 2SFCA: Examining Geographical Accessibility to Food Outlets in Austin, Texas. ISPRS International Journal of Geo-Information, 11(11), 579. https://doi.org/10.3390/ijgi11110579