Article

Does Culture Shape Our Spatial Ability? An Investigation Based on Eye Tracking

State Key Laboratory of Remote Sensing Science, Beijing Key Laboratory for Remote Sensing of Environment and Digital Cities, Research Center of Geospatial Cognition and Visual Analytics and Faculty of Geographical Science, Beijing Normal University, Beijing 100875, China
*
Author to whom correspondence should be addressed.
ISPRS Int. J. Geo-Inf. 2022, 11(11), 578; https://doi.org/10.3390/ijgi11110578
Submission received: 30 September 2022 / Revised: 9 November 2022 / Accepted: 19 November 2022 / Published: 21 November 2022
(This article belongs to the Special Issue Eye-Tracking in Cartography)

Abstract

:
Culture affects people’s spatial memory, mental representations, and spatial reference frameworks. People with different cultural backgrounds show different degrees of spatial ability. However, the current research does not reveal the shaping of spatial ability by culture from the perspective of visual cognition. In this study, we used eye tracking and designed mental rotation, spatial visualization, spatial orientation, and spatial correlation tasks to compare the spatial ability of Chinese and Malaysian Chinese people. The results showed that there were some minimal differences between them. Chinese participants had higher accuracy in the mental rotation task, showed more fixation to landmarks in spatial orientation, showed more fixation to the main map, and switched more frequently between the two thematic maps when judging spatial relationships. As “cultural citizens” of China, Malaysian Chinese people’s spatial ability is not only shaped by their own ethnic culture in terms of language but also influenced by foreign races in terms of education, wayfinding tendency, and cognitive style. This study can contribute to the understanding of the influence of culture on spatial ability and its possible causes.

1. Introduction

Spatial ability plays an important role in our daily wayfinding [1], STEM course performance [2], and long-term career achievement [3]. Understanding the effect factors of spatial ability could provide insights into spatial cognition and develop our spatial ability, reducing differences related to sex and race in a targeted manner. Prior studies have reported the influence of sex, age, and expert knowledge on spatial ability. However, few studies have revealed how culture shape spatial ability. As a concept including identity, language, education, life habits, etc. [4,5,6], culture affects people’s spatial working memory [7], mental representations [8], and spatial cognitive strategy [9]. In terms of behavior, people with different cultural backgrounds show differences in navigation [10] and map reading [11]. Specifically, people living in regular urban structures have better memory and expression of the knowledge of the surrounding geographical environment [12]. People’s navigation ability is stronger in areas with higher economic wealth [10]. Chinese speakers show advantages in the basic processing mechanisms, memory strategies, and reasoning processes of space [13]. The influence of culture on spatial ability is well-established, but we do not know the exact process of it.
In this study, we chose Chinese and Malaysian Chinese as research groups. We aim to compare the spatial ability of Chinese and Malaysian Chinese students from the same university using an eye-tracking approach. Malaysian Chinese and Chinese people are culturally homogenous, but because of the gap in space, the difference in geographical environment characteristics, and the influence of other ethnic cultures, Malaysian Chinese also have some different cultural characteristics from Chinese people [14]. Based on this, we hypothesized that Chinese and Malaysian Chinese would have a similar level of spatial ability, but there may be some differences caused by other environmental factors. We designed four tasks related to spatial ability to evaluate and compare the spatial ability of participants from different countries. In the experiment, we recorded the behavioral data and eye movement data of the participants to characterize their spatial cognitive processes (Section 3). We conducted statistical analysis of the experimental data, obtained the comparison results of the spatial ability of participants from different countries (Section 4), and discussed the possible cultural factors and environmental factors (Section 5). Finally, we present the conclusions of this study and suggestions for future work (Section 6).

2. Related Work

2.1. Spatial Ability and the Effect of Culture

Spatial ability is described as the ability to mentally generate, manipulate, and retain abstract information and/or images [15]. Based on the spatial cognitive process, Linn and Petersen [16] divided spatial ability into mental rotation, spatial visualization, and spatial perception. Many studies advocated for the use of modern factor analytic methods and a hierarchical factor model to find spatial factors. McGee [17] reviewed a number of factor analytic studies of spatial factors and proposed that spatial visualization and orientation are two defining factors of spatial ability. Lohman et al. [18] indicated that spatial ability should involve visualization, speeded rotation, closure speed, closure flexibility, and perceptual speed. Buckley et al. [19] provided a framework of spatial factors, pointing out that spatial visualization, mental rotation, spatial correlation, and spatial orientation are important factors in spatial skills; these four factors are also now widely accepted.
For these categories, researchers have developed a variety of tests to accurately measure spatial ability. Currently, widely used tests include the paper folding test of Guilford and Lacey [20], the Purdue Spatial Visualization Test (PSVT) developed by Guay [21], and the Vandenberg Mental Rotations Test [22]. However, these tests reflect people’s spatial ability on a small scale. To address the need to evaluate large-scale spatial ability, Bednarz and Lee [23] developed a set of spatial thinking ability tests (STATs). It includes seven types of questions, such as questions regarding topographic map reading, optimal site selection, and the identification of spatial associations, and it is acknowledged that STATs can measure spatial ability such as spatial visualization, spatial orientation, and spatial correlation.
The influence of culture is an important issue of individual differences in spatial ability. Many studies have shown that cross-cultural differences in spatial ability exist globally. Chang and Antes’s [11] study confirmed that Chinese participants outperformed North Dakota participants in topographic map reading, while reading the map required the visualization of objects in spatial distributions. Farrell et al. [24] conducted a study using the mental cutting test and the PSVT with STEM freshmen from different countries and reported that the spatial ability of Gulf students was significantly lower than that of Irish students; both Gulf and Irish students showed lower spatial ability than students from the US, Germany, and Poland. Coutrot et al. [10] developed a mobile-app-based cognitive task, conducting a worldwide test of spatial navigation ability, and found that there are global differences in spatial cognition. The differences begin to show up in childhood. Chinese children aged 8–12 years performed better on water-level tasks that reflected spatial perception ability than Malay children of the same age [25]. In the same task of constructing a map of the area around the school, Indian children drew more features than American children, while American children were able to draw features that were farther from the school. However, the difference was only found in the group of 12-year-olds, not in the group of 6-year-olds [26].
Studies on the sources of cultural differences focus on empirical and environmental factors. For example, STEM freshmen from different countries with different high school education backgrounds show different degrees of spatial ability [24]. Through their frequent hunting trips, Baffin Island Eskimo develop greater spatial abilities than the Temne of Sierra Leone, who settled in the village [27]. Due to the spatial information processing experience accumulated in the process of learning Chinese, Chinese children outperformed Greek children in visual/spatial processing tasks [13]. In addition, there are quantitative studies of determinants using statistical methods, which found that global differences in spatial cognition are clustered according to economic wealth and sex inequalities globally [10].
Malaysian Chinese people are mostly descendants of immigrants who arrived in Malaysia in the last century. They are also considered “cultural citizens” of China [28] since their language, life habits, and customs are still similar to those of Chinese people. However, they are also influenced by other ethnic cultures through education or lifestyle factors. Overall, it needs to be verified whether there is a difference in spatial ability between Chinese and Malaysian Chinese people.

2.2. Eye Tracking to Evaluate Spatial Ability

Eye-tracking technology has been used as an alternative to traditional paper-and-pencil tests to evaluate spatial ability since it helps researchers quantify cognitive processes in spatial tasks in addition to task performance [29,30]. By combining visual features recorded by eye movements with the AOI (area of interest), multiple eye movement metrics can be generated to describe the visual processes of users completing spatial tasks.
Fixation and saccade are two basic components of eye movements [31]. Fixation is defined as positions that the eyes stay in for an extended time and reflect the user’s visual processing; saccade is defined as rapid movements between fixations and reflects the user’s visual searching [32]. Cazzato et al. [33] used fixation metrics (fixation number and fixation ratio) to measure the cognitive load of participants of different sexes while they completed a visuospatial task and verified that males had stronger ability than females in spatial orientation and optimization strategies. Andersen et al. [34] also analyzed the participants’ fixation indicators of landmarks and indicated that a sustained landmark-oriented gaze in navigation was found in women but not in men. Toth and Campell [35] compared the fixation duration, fixation count and pupil dilation of males and females in a mental rotation task and found that sex differences in mental rotation disappeared when there was no time pressure. Sun et al. [36] established a spatial ability evaluation model based on fixations (especially first fixation) and saccades and found that people with higher spatial ability pay more attention to the acquisition of spatial structure information. In addition, the switching between different AOIs could reflect a user’s spatial memory and information-processing efficiency. Dong et al. [37] selected indicators related to fixation and switching to verify the effectiveness of a geography course to improve spatial ability and found that after the geography course, the participants’ efficiency for processing and matching spatial information were both improved. Dong et al. [38] also revealed the spatial orientation patterns of males and females by analyzing their fixation indicators and switching of indicators between AOIs.
In these studies, eye movements revealed participants’ spatial information processing and searching and measured their spatial ability effectively. For our research, we attempted to reveal the influence of culture on spatial ability from the perspective of visual cognitive processes. We designed four tasks, mental rotation, spatial visualization, spatial orientation, and spatial correlation tasks, and chose eye movement indicators related to fixations, saccades, and switching for analysis. Combined with their general performance on the tasks, we could understand how culture affects people’s acquisition, memory, and processing of spatial information.

3. Methods

3.1. Participants

Forty-eight university students (all nongeography majors, 9 males, mean age = 19.4 years, Min = 18, Max = 23, SD = 1.5) participated in this experiment. Thirty-four participants were from China, and 14 participants were from Malaysia. In particular, through the background check after the experiment, we found that all participants were Malaysian Chinese. All participants’ vision was normal or corrected-to-normal. All participants signed up for the experiment voluntarily and stated that they were aware of the study.
During the experiment, the test data with a sampling rate lower than 70% were eliminated. Therefore, the number of samples for each task was slightly different.

3.2. Apparatus

The experiment was conducted in a well-lit and free-from-interference laboratory. The Tobii T120 eye tracker (Tobii AB, Sweden; www.tobii.com, accessed on 10 May 2022) with a 22-inch monitor (1280 × 1024) was used in the experiment, and the recording accuracy of the eye tracker was 0.5° with a spatial resolution of 0.2°. The distance between the participants and the monitor was approximately 60 cm. The raw eye movement data was recorded by Tobii Studio.

3.3. Materials and Procedure

According to the composition of spatial ability and referring to the STAT, we designed four tasks: mental rotation, spatial visualization, spatial orientation, and spatial correlation.
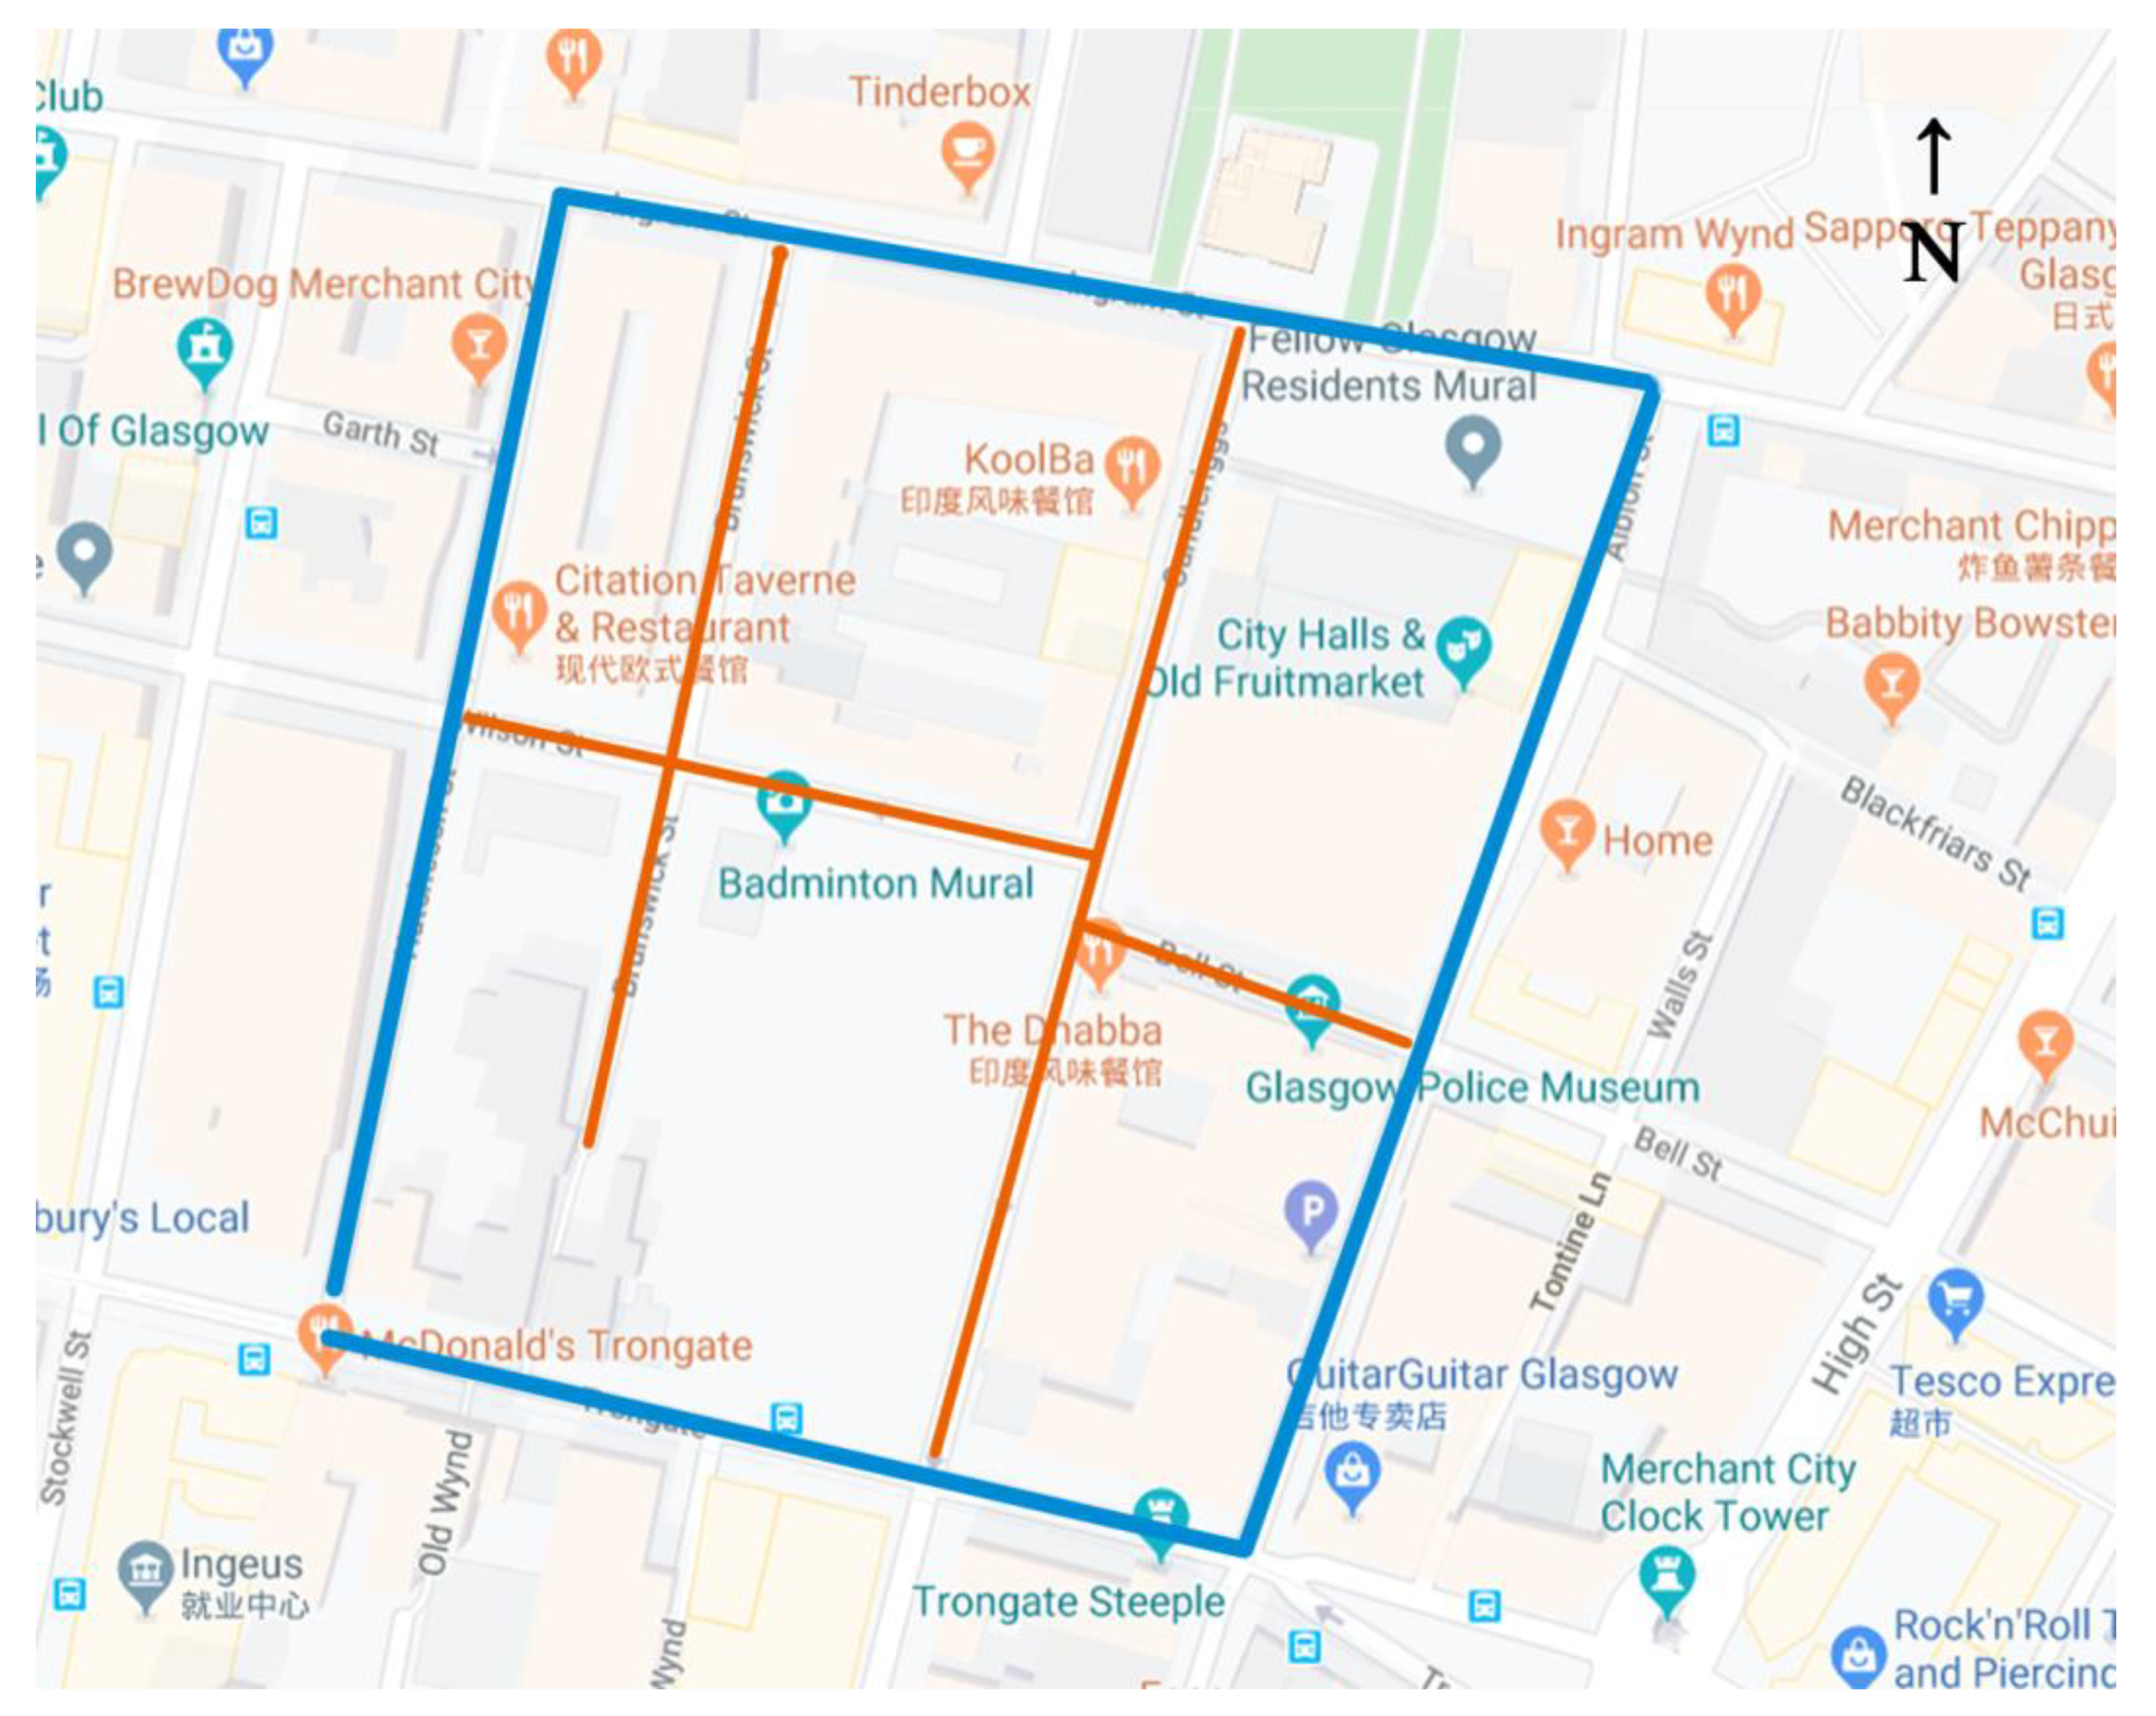
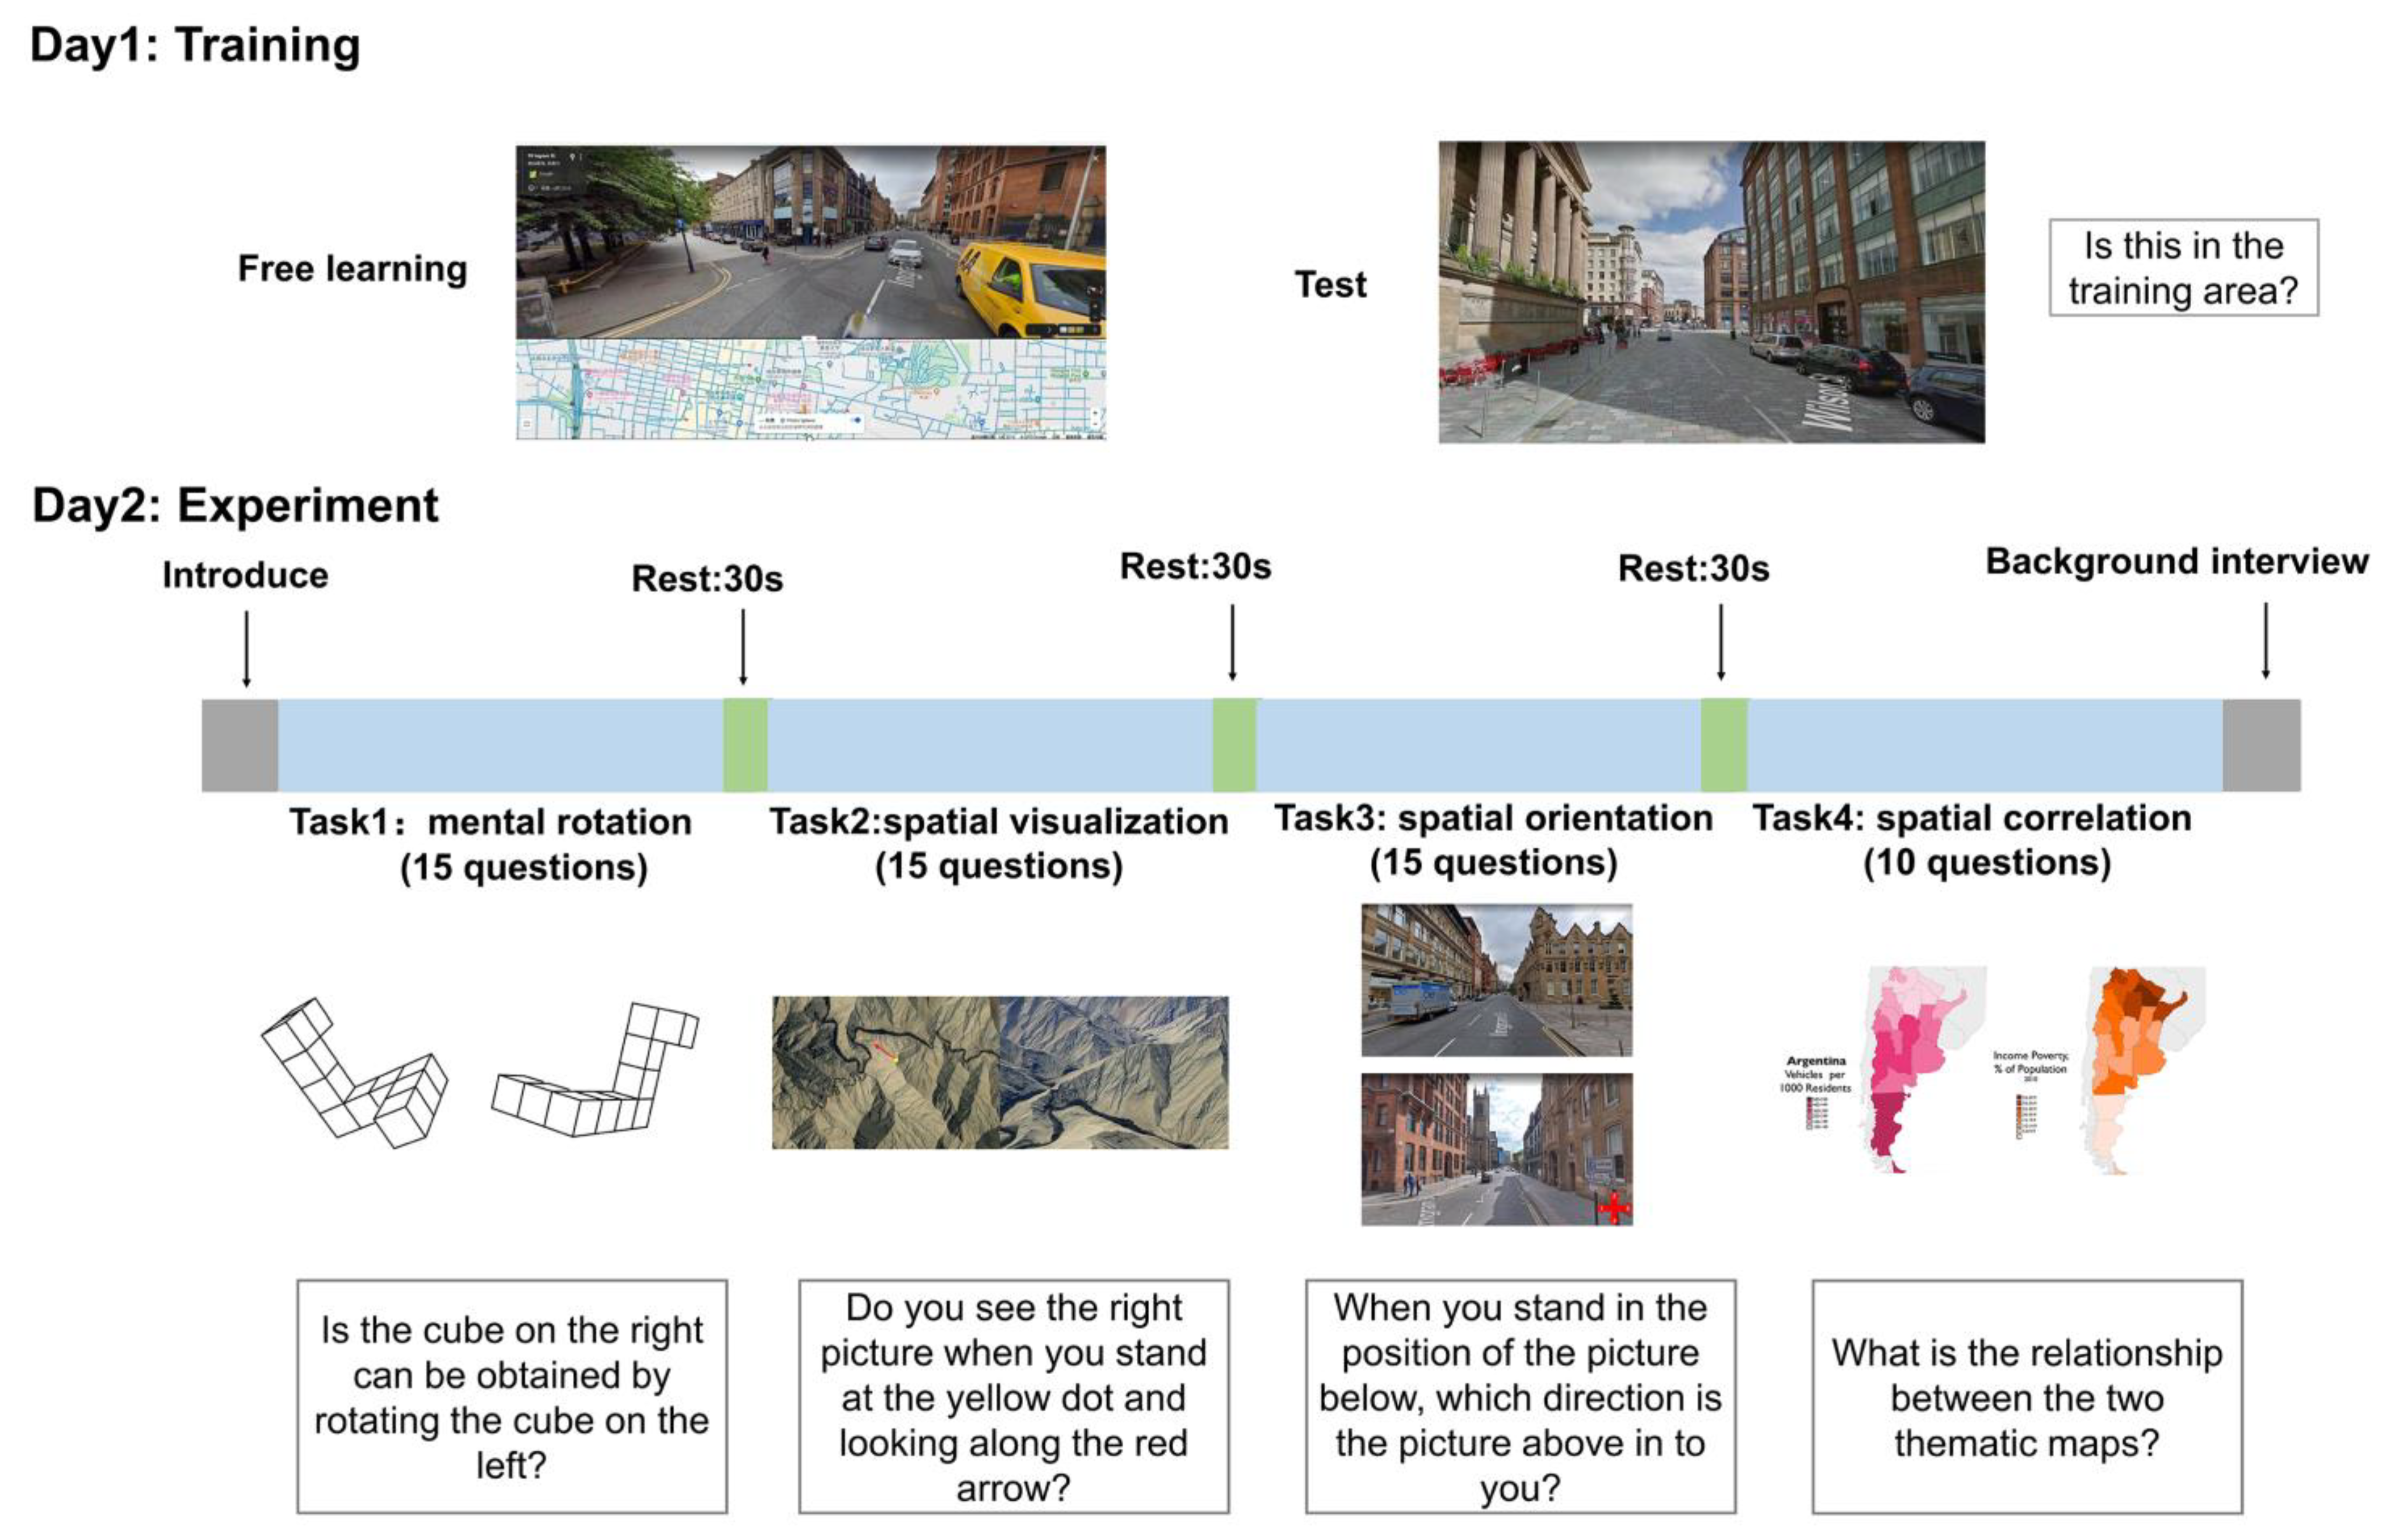
In the spatial orientation task, we used street views from Google Maps as the experimental material, and the specific area was a section of Glasgow, UK (Figure 1). We chose the study area to ensure that all participants were not previously familiar with the area. Since the participants were completely ignorant of the study area and they had no reference (like a map) in the formal experiment, they had to be familiar with the study area in advance. Thus, we divided the experiment into two days (Figure 2).
Day 1: The participants used Google Maps to train independently to become familiar with the study area according to the training instructions. After the training, the participants needed to take the training effect test, which consisted of 20 questions. The participants needed to judge whether the subject scene was in the study area and the absolute position of the scene in the study area. Only after passing the test (accuracy ≥ 90%) could the participants participate in the formal experiment.
Day 2: Before the experiment, the researchers verbally explained the contents of the four tasks to the participants, provided the participants with example questions on paper, and confirmed that the participants fully understood all the tasks through their answers to the example questions. After that, the researchers informed the participants about the experimental operation and precautions and started the formal experiment. During the experiment, the researchers only gave a simple reminder when switching tasks and no longer explained the contents in detail.
The participants completed four successive tasks: mental rotation, spatial visualization, spatial orientation, and spatial correlation. There was no time pressure during the experiment, and the participants could rest for 30 s after completing a task to prevent fatigue from affecting the experiment. After the experiment, the researchers conducted background information investigations on the participants, including their age, major, and living environment, through interviews.

3.4. Data Analysis

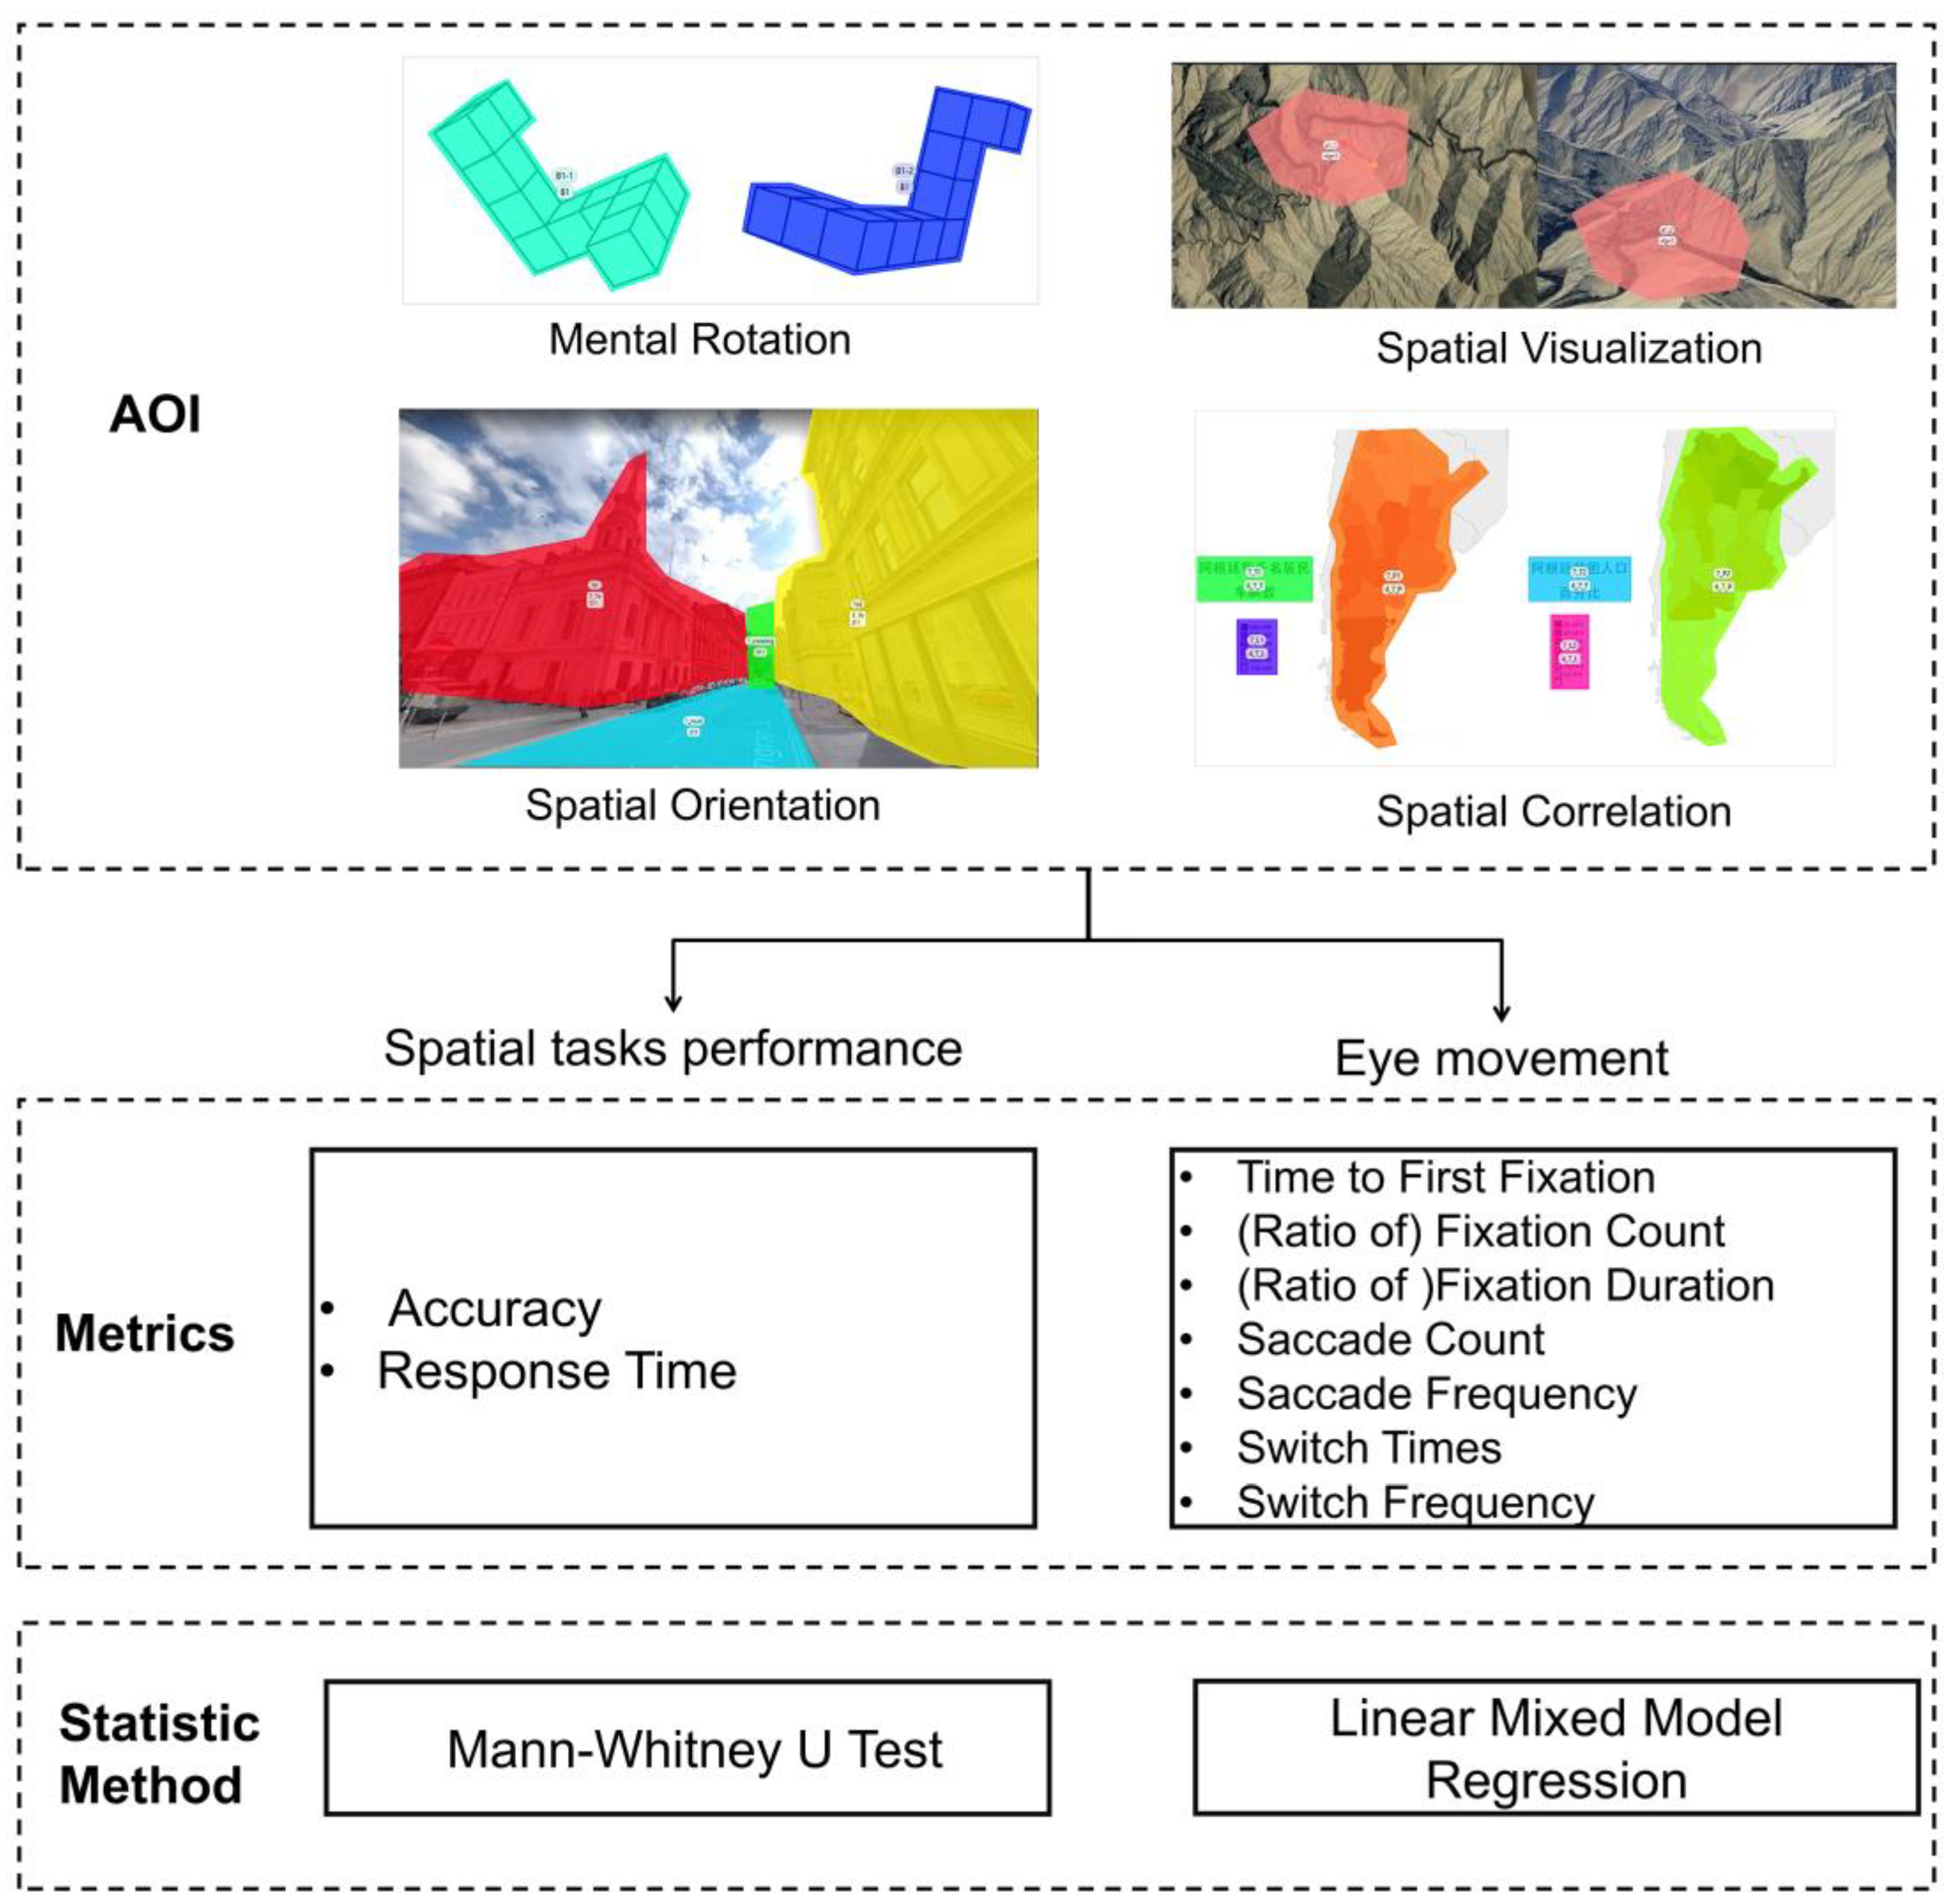
We divided the area of interest (AOI) to further analyze the eye movement data of the participants (Figure 3). For mental rotation, the AOIs were two cubes; for spatial visualization, we choose key cues [37] (such as rivers, valleys, and ridges that could be used to determine location and direction) as the AOIs; for spatial orientation, the AOIs were buildings, roads, intersections, and landmarks that were meaningful for navigation. For spatial correlation, the title, main map, and legend were the AOIs [39].
The participants’ overall performance was represented by accuracy and response time [40]. We chose five eye movement metrics (Table 1) that could represent the information processing and search efficiency of the participants [41,42]. In particular, there were only two AOIs in the mental rotation task, and the AOIs involved all the information of the stimulus material. Therefore, fixation count and fixation duration were selected as the information processing indices for this task, and time to first fixation was excluded.
The statistical analysis was conducted in statistical product and service solutions (SPSS). We first standardized all the data and removed outliers (z score >3 or z score < −3). The accuracy and response time data did not follow a normal distribution, so we used nonparametric tests, specifically the Mann–Whitney U test, to verify whether there were significant differences between the two groups (p = 0.05).
We used linear mixed model regression for statistical tests on the eye movement data, since the data were obtained from repeated experiments within participants and were not independent [43]. Cultural background was used as a fixed effect, and participants were used as a random effect to predict the eye movement results (p = 0.05).

4. Results

4.1. Mental Rotation

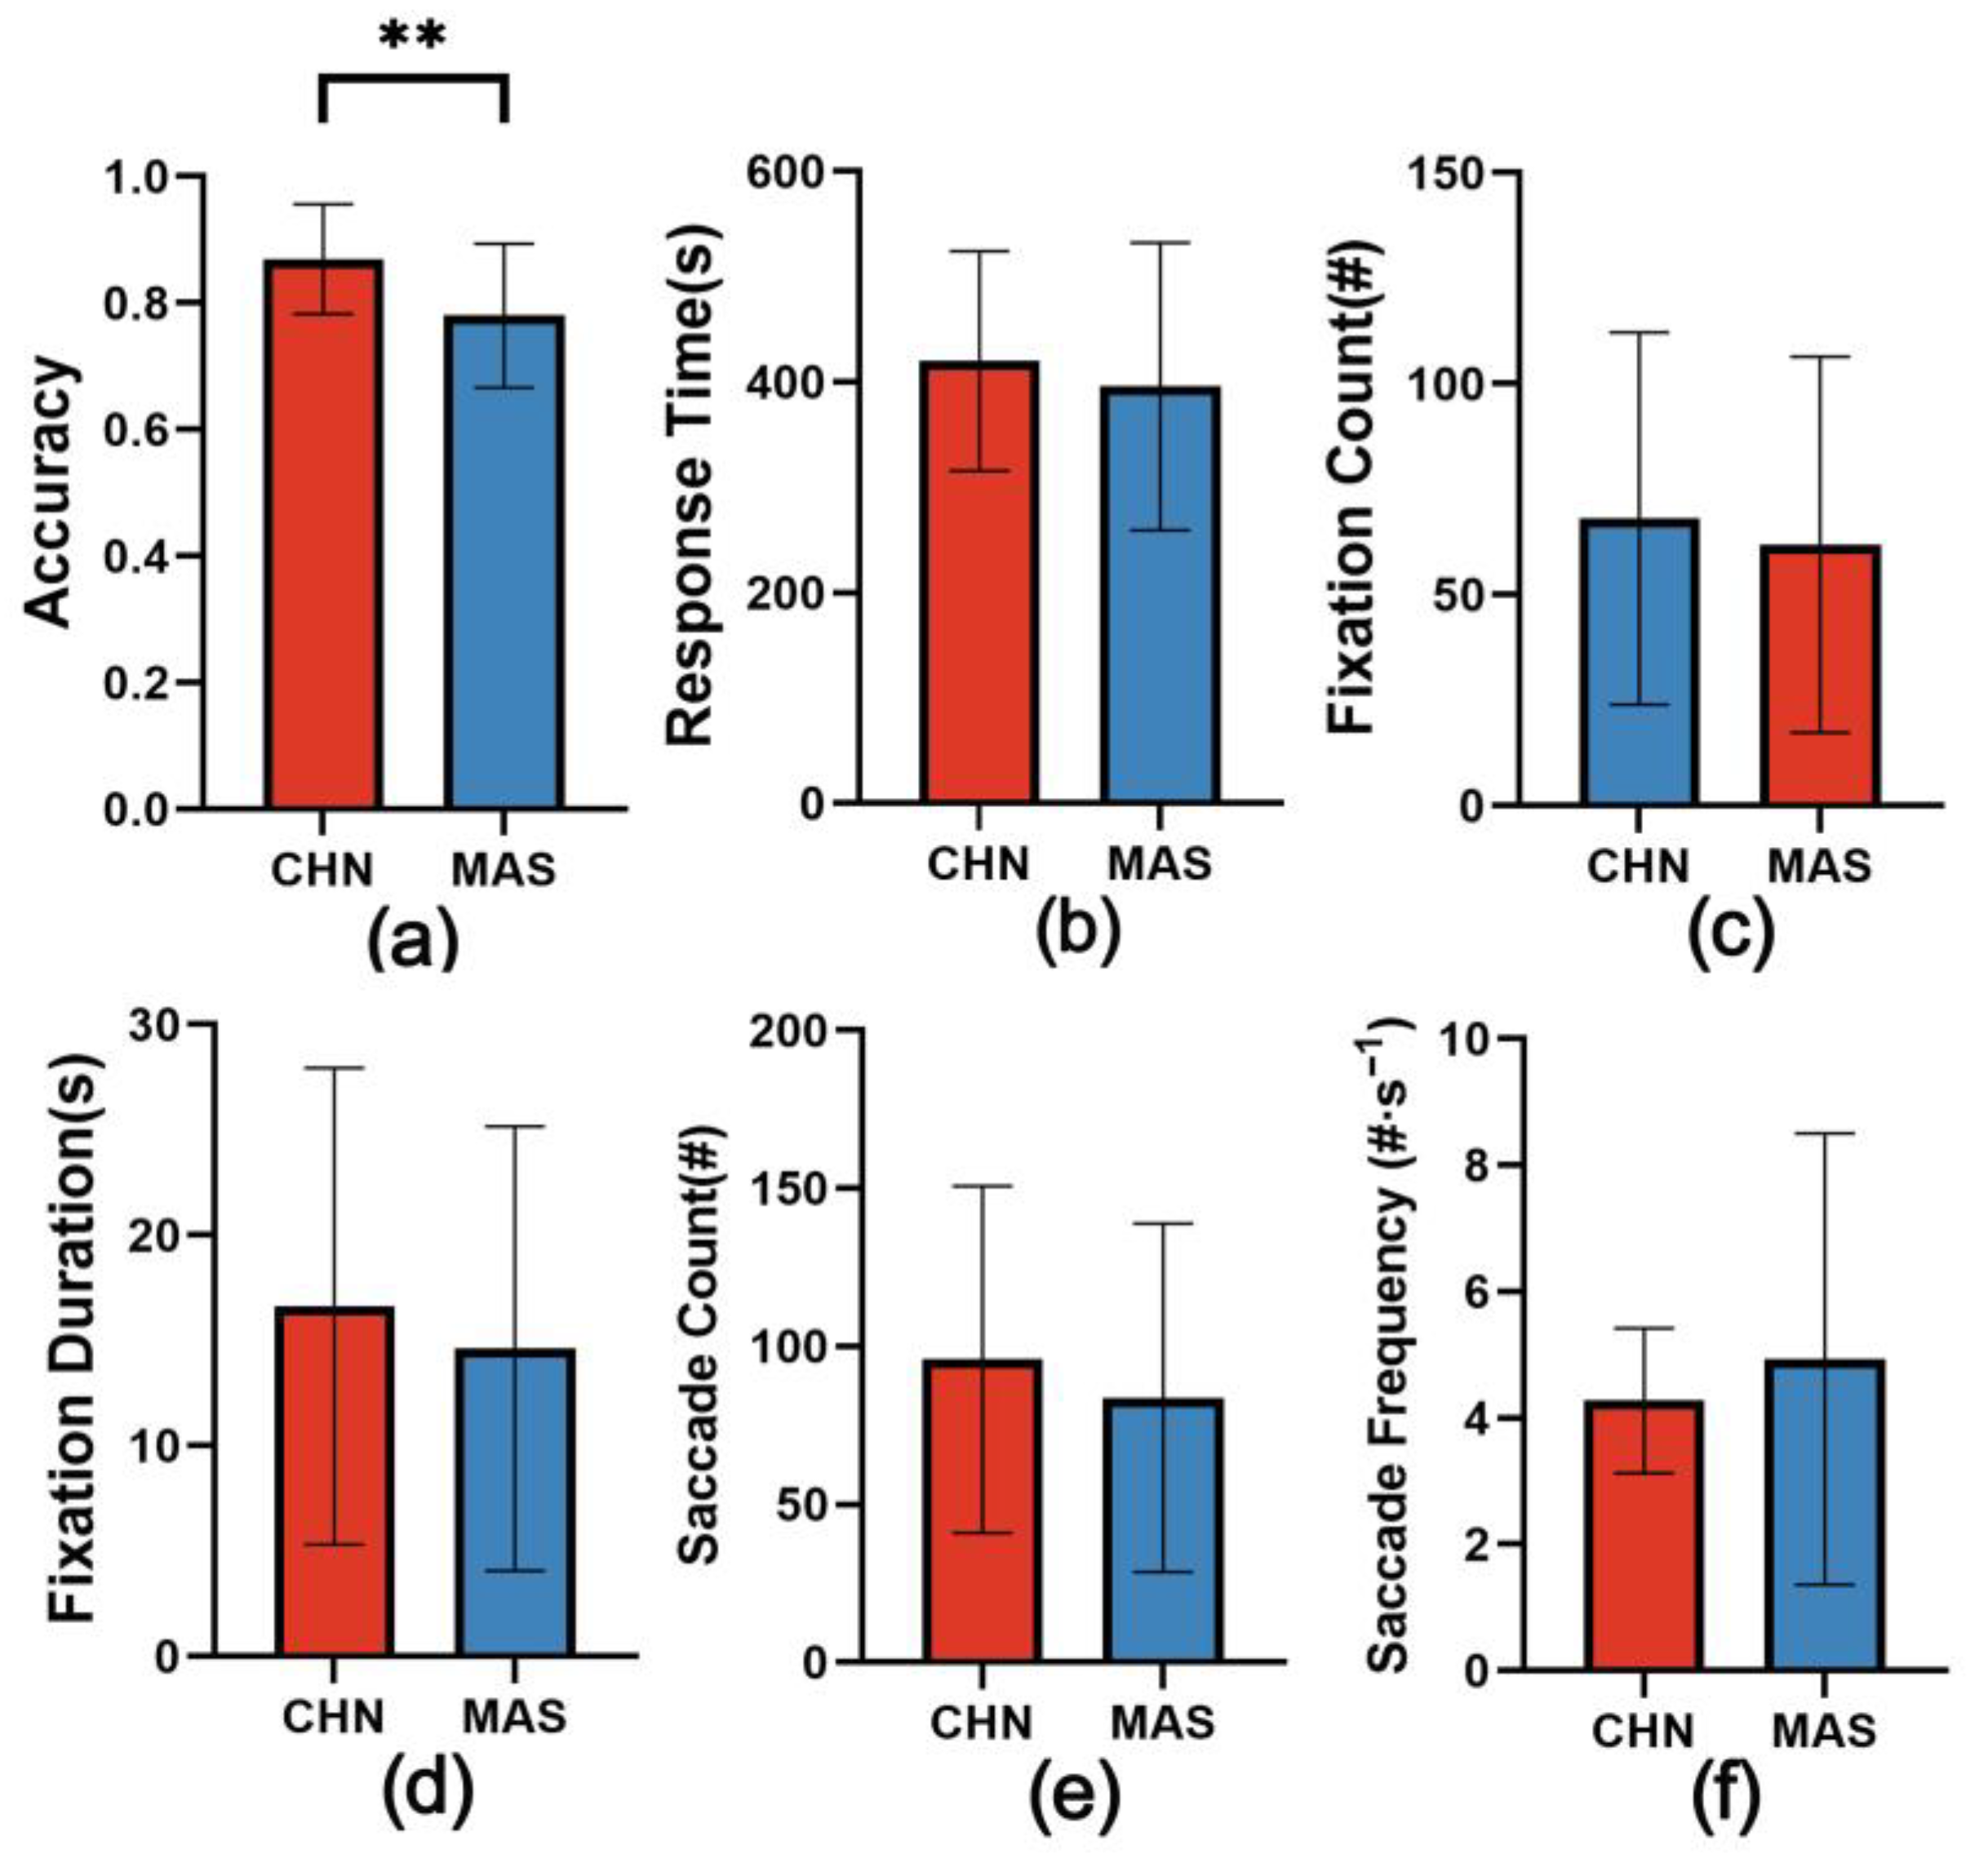
The results of the behavioral data in the mental rotation task are shown in Figure 4. The Mann–Whitney U test indicated that Chinese participants (MCHN = 0.87) had significantly higher accuracy than Malaysian participants (MMAS = 0.78, p = 0.007, Figure 4a). Moreover, Malaysian participants (MMAS = 395.8) finished the task faster than Chinese participants (MCHN = 420.1), but the difference was not significant (p = 0.366, Figure 4b). Therefore, there were significant differences in performance on the mental rotation task between the Chinese participants and the Malaysian participants, and the Chinese participants had higher accuracy.
The linear mixed model regression results (Appendix A, Table A1) show that although the descriptive statistical results of the other eye movement indices in the two groups were different, there was no significant difference in the overall distribution.
Chinese participants had longer fixation counts (p = 0.437, Figure 4c) and fixation duration (p = 0.314, Figure 4d) for the AOIs; Malaysian participants had fewer saccades (p = 0.350, Figure 4e), but their frequency of saccades was higher than that of Chinese participants (p = 0.250, Figure 4f). The results of all the tests were not significant. It can be considered that there is no significant difference in the information processing and information searching of the Chinese participants and the Malaysian participants in the mental rotation task.

4.2. Spatial Visualization

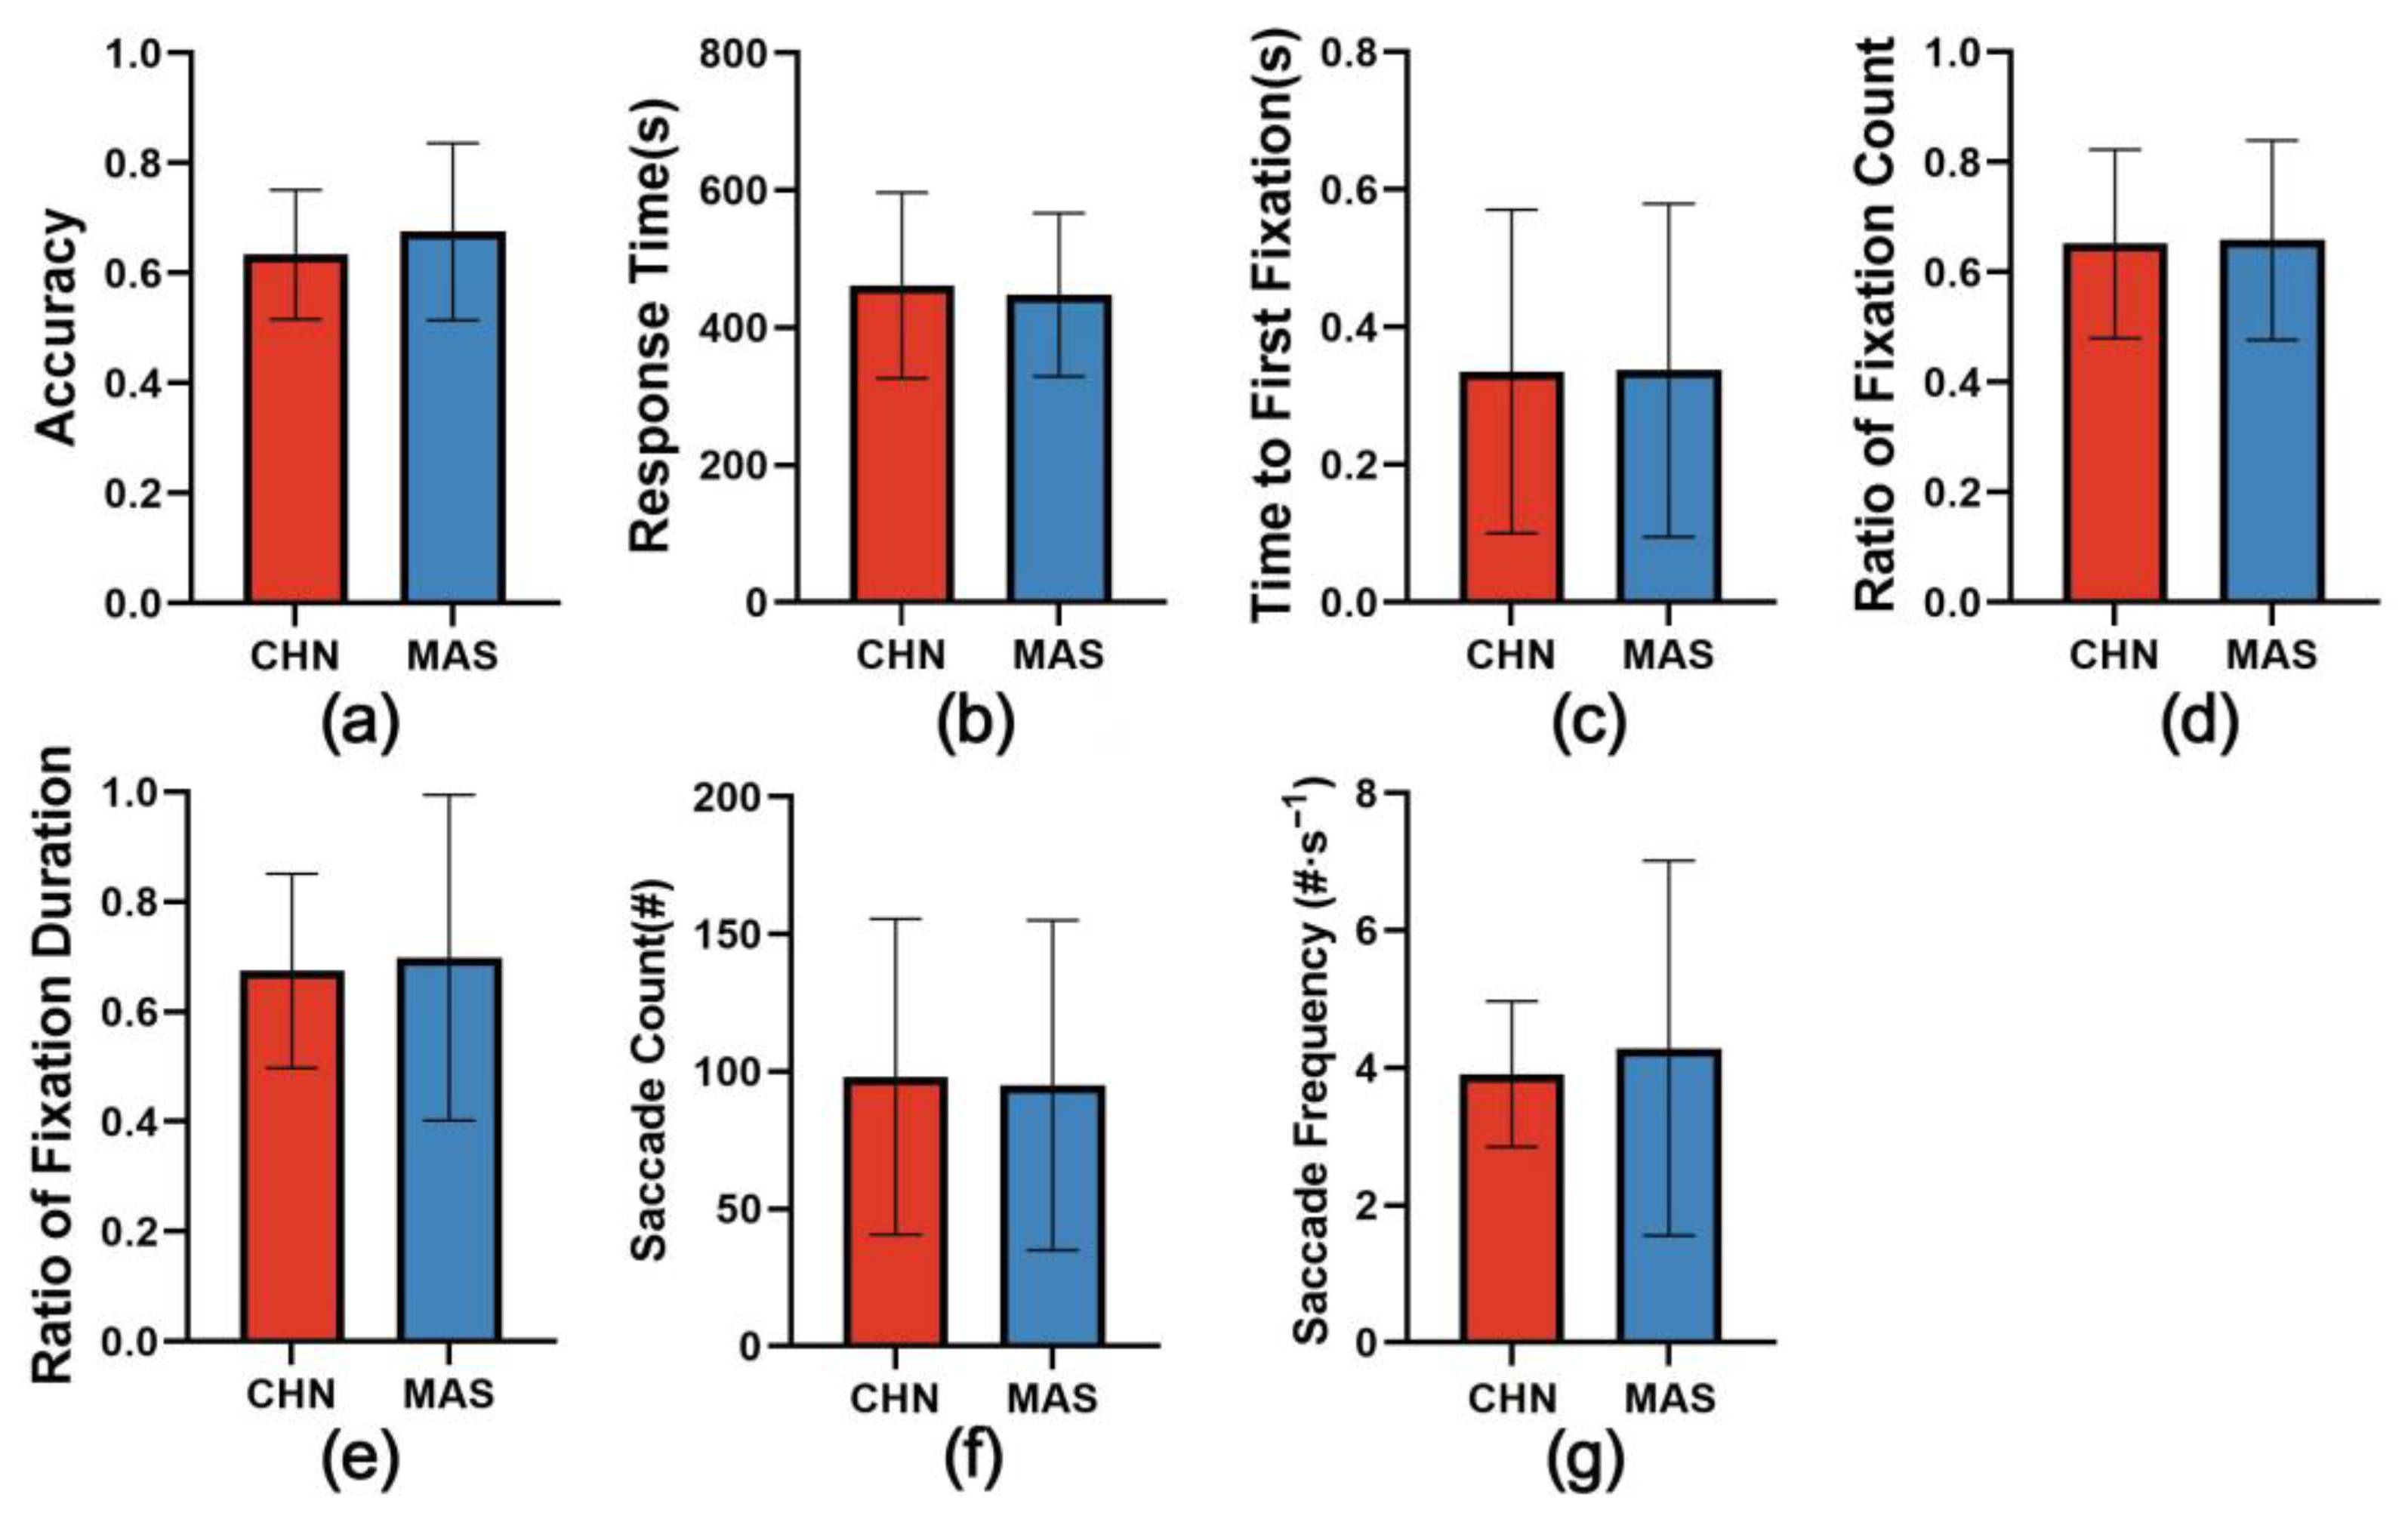
The statistical results of the spatial visualization task (Figure 5) showed that the Malaysian participants completed the task in a shorter time (MCHN = 461.79; MMAS = 447.80, p = 0.484, Figure 5b), and their accuracy was higher than that of the Chinese participants (MCHN = 0.63; MMAS = 0.68, p = 0.854, Figure 5a). However, the test results showed that the difference between the two groups was not significant.
The linear mixed model regression results (Appendix A, Table A2) showed that there was no significant difference in the eye movement indices of the participants from different cultural backgrounds. Chinese participants and Malaysian participants may perform very similarly on the spatial visualization task.
Chinese participants and Malaysian participants fixed on the AOIs at almost the same time (p = 0.663, Figure 5c); there was almost no difference in the ratio of fixation count (p = 0.562, Figure 5d) and fixation duration (p = 0.433, Figure 5e) between the two groups. The saccade count of Malaysian participants was lower than that of Chinese participants (p = 0.841, Figure 5f), and their saccade frequency was higher (p = 0.281, Figure 5g), indicating that Malaysian participants may be more efficient in searching for information in spatial visualization tasks, but the results are not statistically significant.

4.3. Spatial Orientation

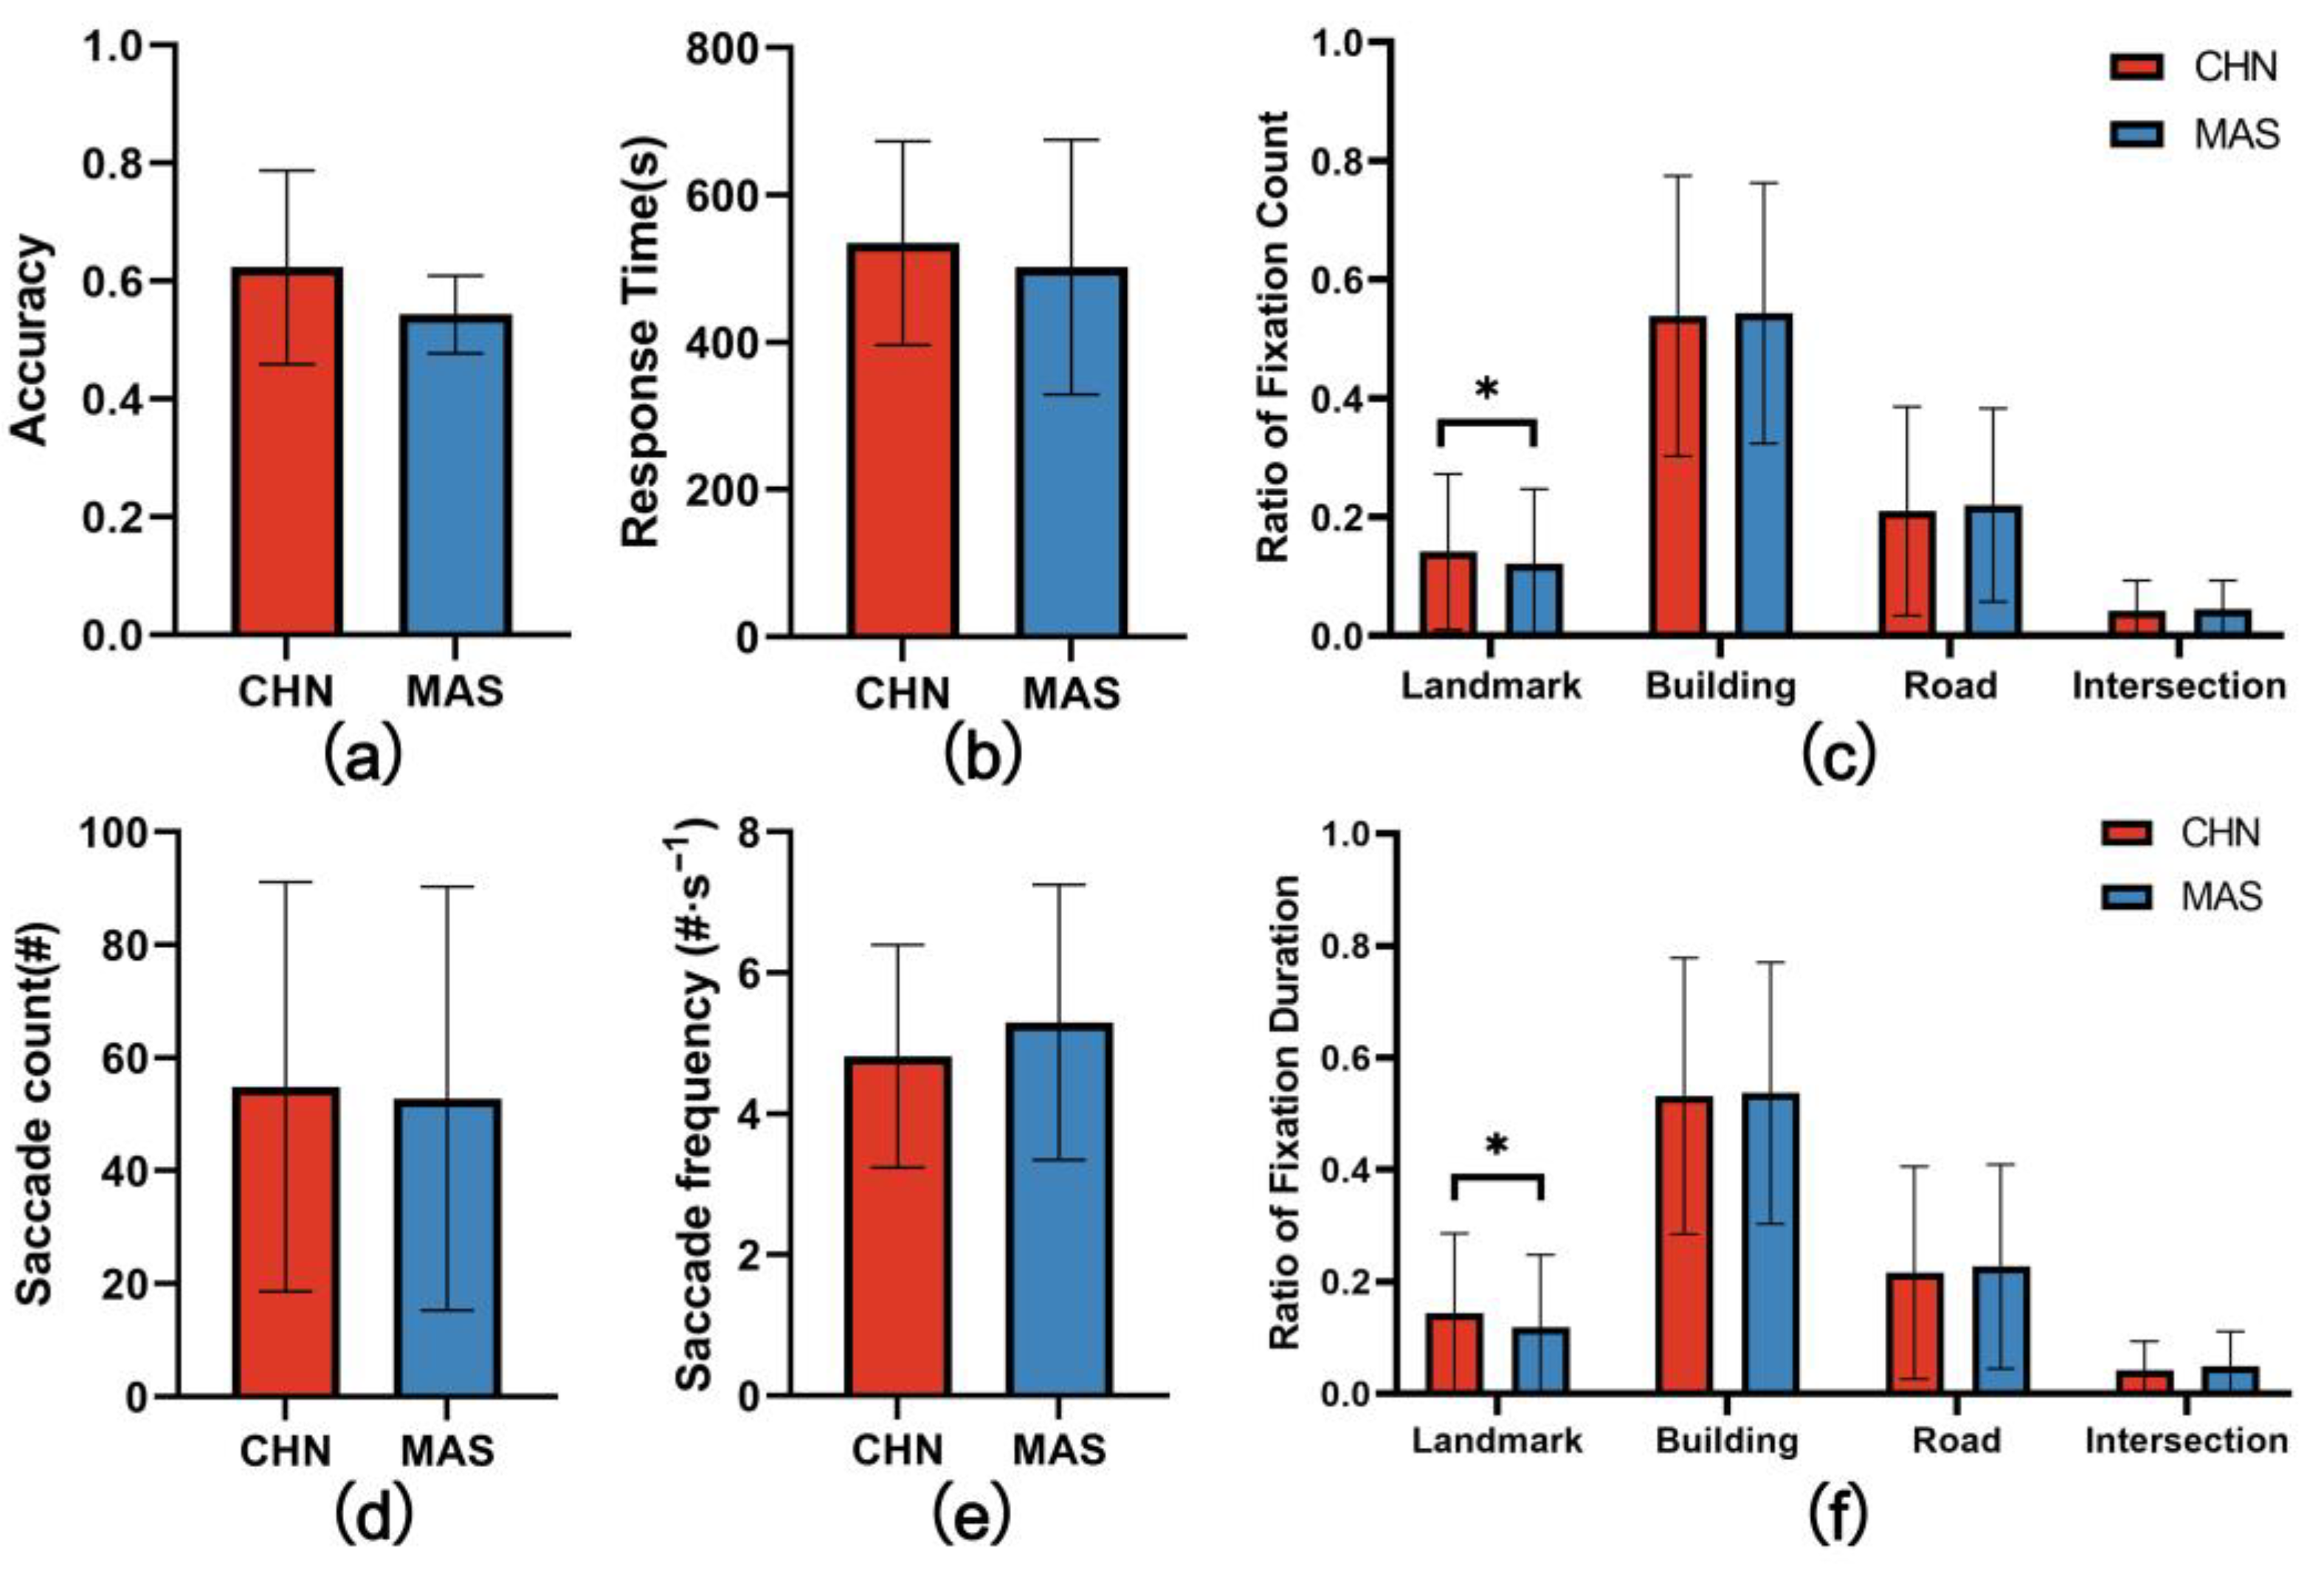
Figure 6 shows statistics of the general performance indicators and eye movement indicators in the spatial orientation task. Chinese participants completed the task with higher accuracy (MCHN = 0.62, MMAS = 0.55, p = 0.128, Figure 6a), but took longer (MCHN = 534.70, MMAS = 502.14, p = 0.634, Figure 6b). However, these differences were not significant.
The two groups of participants had significant differences in fixation for the landmark AOI. We did not detect significant differences in other eye movement indicators (Appendix A, Table A3). The participants gazed at the building AOI most frequently and for the longest time, followed by the road AOI and the landmark AOI, and they gazed at the intersection AOI least. The two groups of participants may have very similar ratios of fixation counts (Figure 6c) and fixation duration (Figure 6f) for the building AOI (pcount = 0.846, pduration = 0.849), road AOI (pcount = 0.674, pduration = 0.674), and intersection AOI (pcount = 0.702, pduration = 0.625). However, for the landmark AOI, Chinese participants’ ratio of fixation count/duration was higher than that of Malaysian Chinese participants (pcount = 0.019; pduration = 0.034). Chinese participants performed more saccades during the task (p = 0.608, Figure 6d), while Malaysian Chinese participants had a higher saccade frequency (p = 0.233, Figure 6e).

4.4. Spatial Correlation

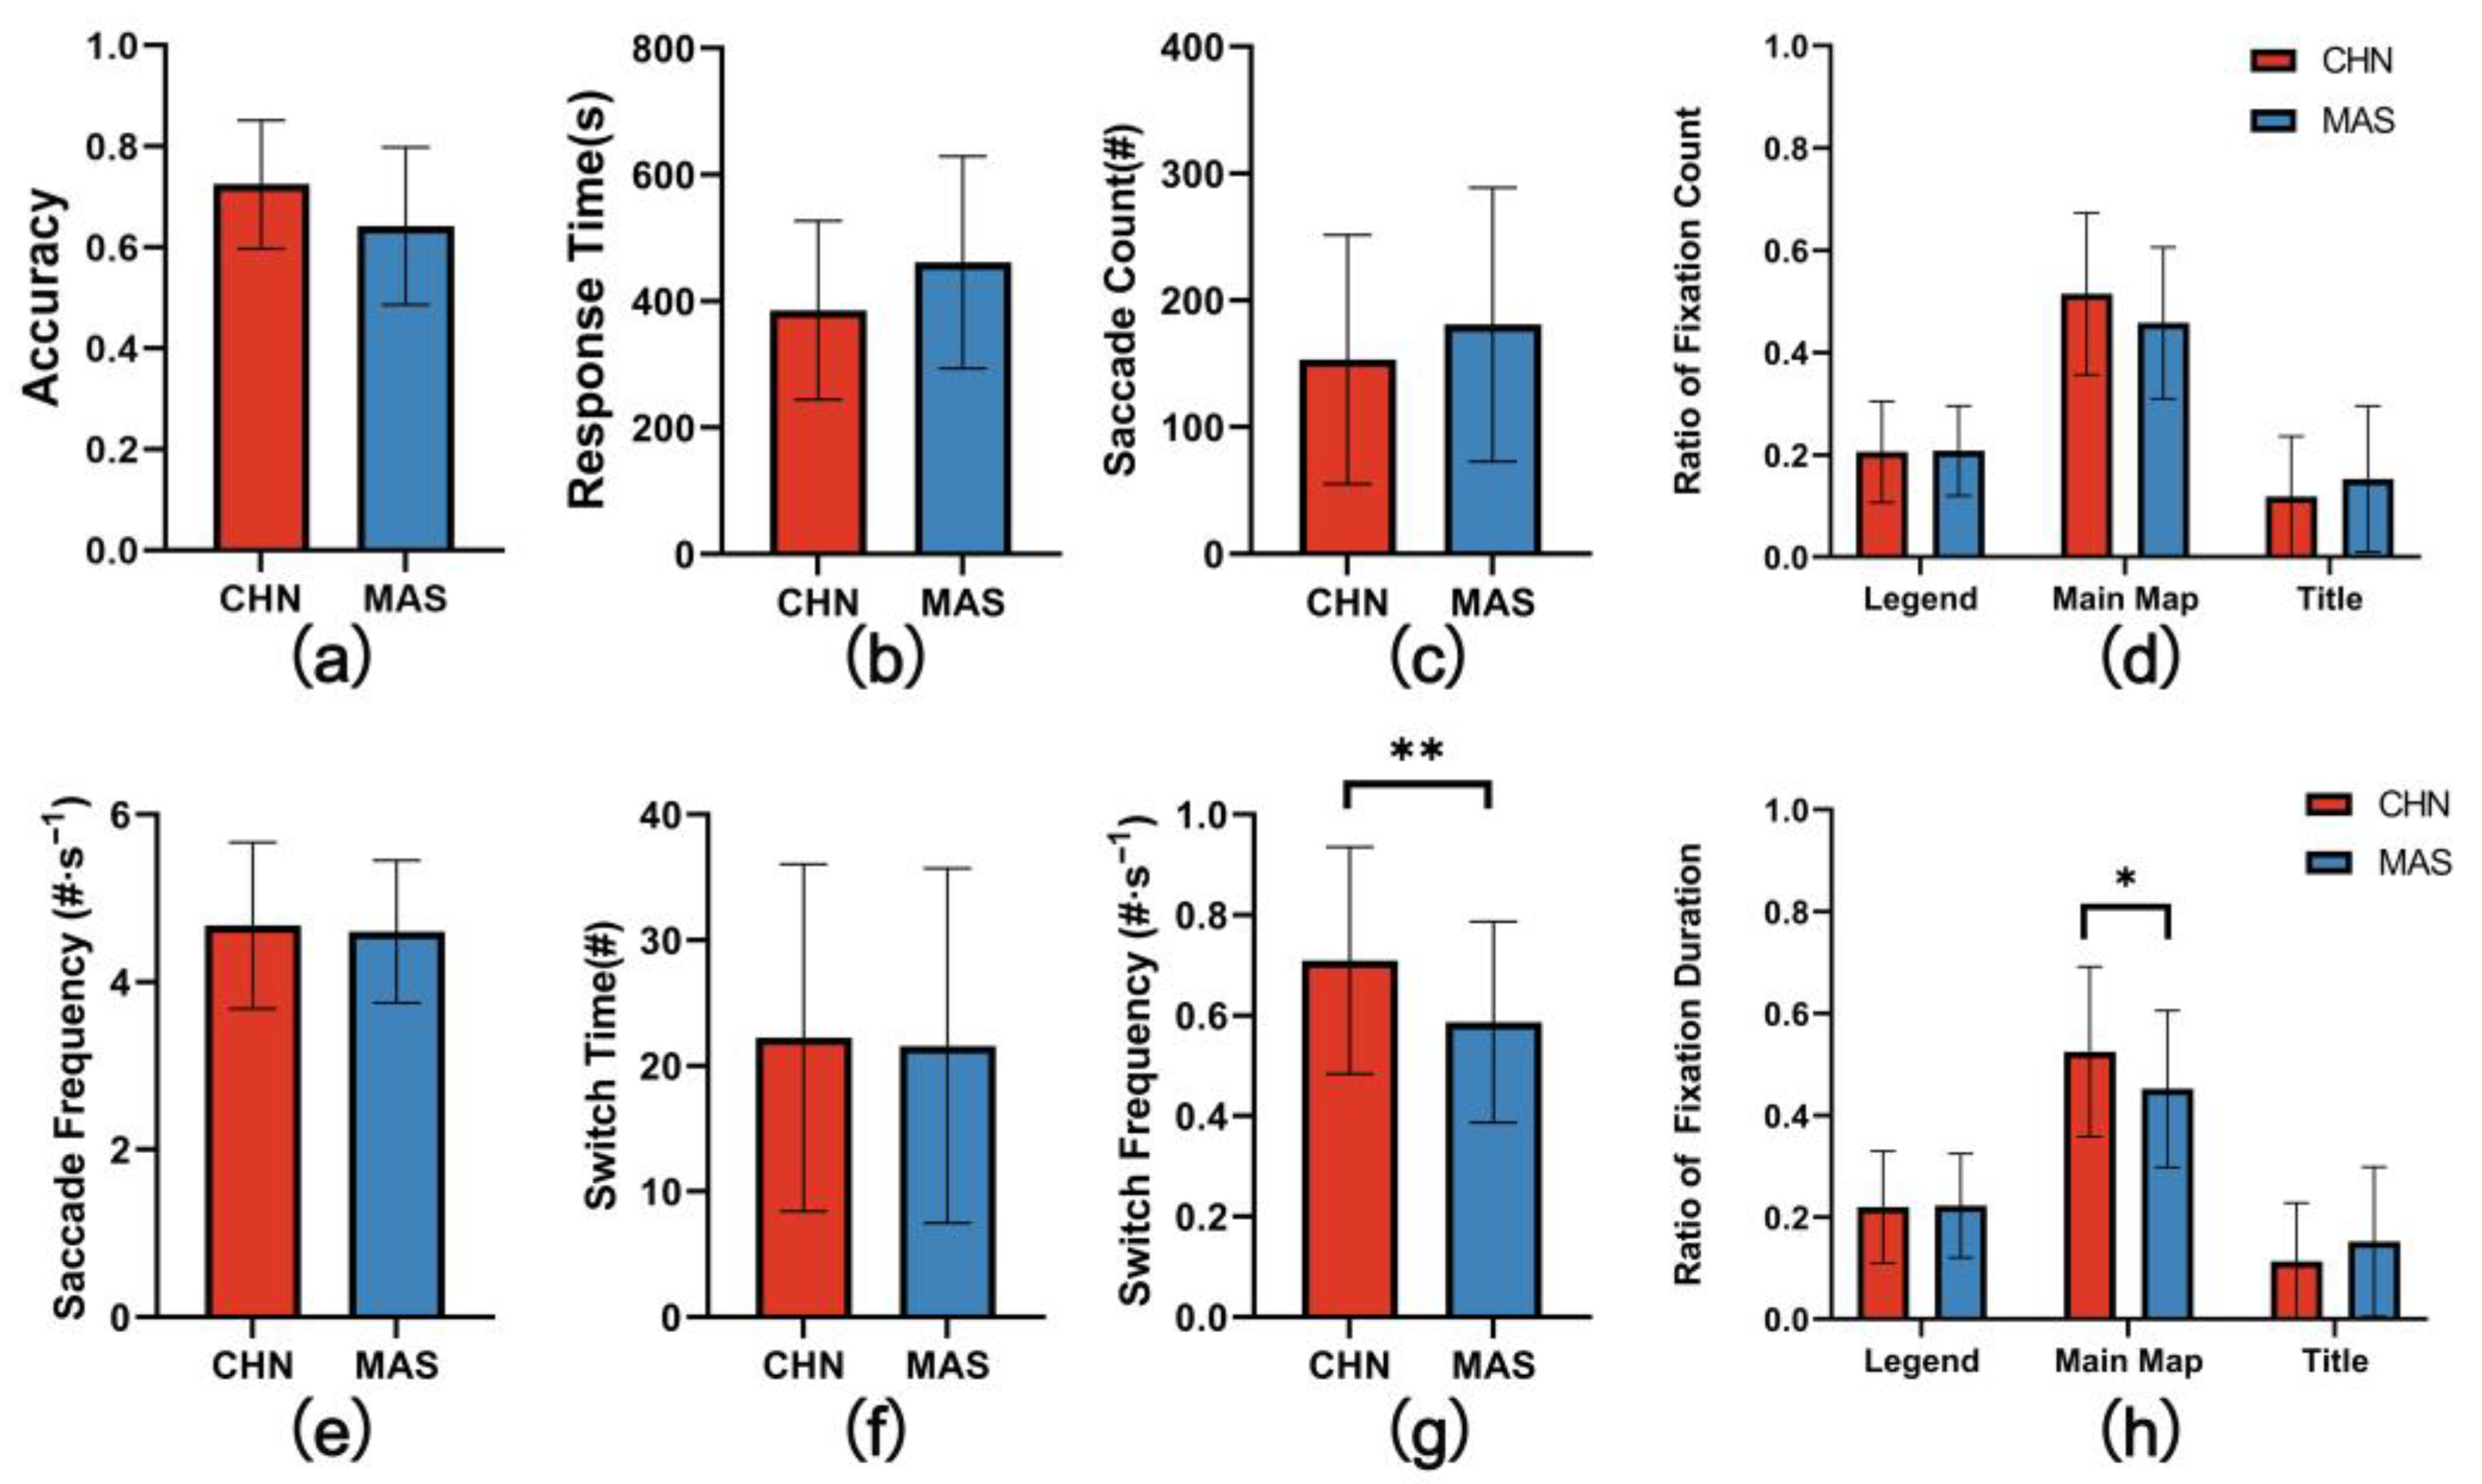
As shown in Figure 7, Chinese participants showed higher accuracy in the spatial correlation task (MCHN = 0.73, MMAS = 0.64, p = 0.145, Figure 7a). Malaysian Chinese participants (MMAS = 461.43) took more time to complete the task than Chinese participants (MCHN = 385.61, p = 0.091, Figure 7b), but the difference was not significant.
Both groups paid the most attention to the main map, followed by the legend, and paid less attention to the title. According to the linear mixed model regression results (Appendix A, Table A4), the ratio of fixation duration of Chinese participants for the main map was significantly higher than that of Malaysian Chinese participants (p = 0.031, Figure 7h), and when judging the spatial relationship, there was a significant difference in the switching frequency between the two thematic maps (p = 0.110, Figure 7g).
Their gazes toward other types of AOIs and saccades were not found to be significantly different. According to the descriptive statistics, the ratios of fixation counts (p = 0.062, Figure 7d) of the Chinese participants for the main map AOI was higher than that of the Malaysian Chinese participants, while the Malaysian Chinese participants had more fixation counts (p = 0.085, Figure 7d) and spent more time processing (p = 0.172, Figure 7h) the title information. In terms of information searching, Malaysian Chinese participants had more saccades (p = 0.129, Figure 7c), but their saccade frequency was almost at the same level as that of Chinese participants (p = 0.815, Figure 7e). The number of switches between the two thematic maps were higher for the Chinese participants than the Malaysian Chinese participants (p = 0.745, Figure 7f).

5. Discussion

5.1. Similarities in Two Cultural Groups: Overall Performance and Visual Information Processing

This study shows that the performance of Chinese and Malaysian Chinese people in spatial ability tasks may be similar, whether in behavioral performance or visual cognitive processes. Their fixations and saccades during the tasks were not significantly different. They also had the same levels of accuracy and efficiency in the large-scale spatial ability tasks. According to the research of Seng [25], Chinese children perform significantly better in spatial ability tasks than Malay children. However, this difference disappears between Chinese and Malaysian Chinese, which may be because of their cultural homology. The nonsignificant difference between the two groups in the eye movement indicators in the four categories of spatial tasks may indicate that Chinese and Malaysian Chinese people show similar visual information searching and processing during spatial tasks. In more detail, the fixation metrics may reflect that the two groups of participants showed similar task-driven visual perception [44], and we also inferred that they may have similar spatial memory and spatial learning abilities, and use the same spatial referencing strategy and visual representation of space. Cultural factors such as language [45], cultural activities [46], and living experience [47] can shape these spatial cognition processes.
Chinese and Malaysian Chinese speak Chinese constantly; Chinese is more complicated than most of the alphabetical systems used in the West [13], and it has a unique spatial structure that can provide semantic information and pronunciation [48]. The process of mastering Chinese may affect both of the two groups’ visual/spatial strategies and abilities, including perception, memory, and reasoning [13]. Tang et al. [49] also demonstrated a differential cortical representation between native Chinese and English speakers during spatial orientation, proving that the Chinese “possess a high, nonlinear visual complexity”, which trained both of the two groups’ participants’ significant spatial awareness, and provided a reasonable speculation for their similarity of spatial ability. Due to the cognitive and linguistic concepts of spatial relations developing simultaneously during childhood, people’s relational thought is closely related to relational language [50]. Haun et al. [51] also verified that participants using languages with different reference frames showed different spatial cognitive strategies in spatial tasks. According to statistics, Xiao et al. [52] found that, in contrast to other languages, Chinese tends to use absolute frames of reference, such as north, south, east, and west, while Terrill et al. [53] and Palmer et al. [54] found that relative reference frames are used in the Austronesian Malay language.
Coutrot et al. [10] used a clustering approach to verify that spatial ability is influenced by common wealth. In the last 20 years, the gap in GDP per capita between China and Malaysia has decreased rapidly, and it has basically disappeared in the last five years. We inferred this also keeps the spatial ability of Malaysian Chinese people at a similar level to that of Chinese people, although they change their living areas. There are more direct cultural reasons that are highly correlated with GDP, such as travel experience. During travel, people can acquire much spatial knowledge, form cognitive maps, and improve their spatial ability [55], and the development of the economy can increase people’s willingness to travel [56]. Another reason is that, compared to using public transportation, driving is more beneficial to people’s spatial learning [57], while economic growth has spurred the development of more cars, pushing more people to drive [58].

5.2. Differences in Two Cultural Groups: Accuracy of Small-Scale and Visual Attention Allocation of Large-Scale

In the mental rotation task, the accuracy of Malaysian Chinese participants was significantly lower than that of Chinese participants. This finding indicates that Chinese participants process geometric features, perspective relationships, directional visual variables, and other spatial information more accurately. During the orientation task, Malaysian Chinese participants had more fixation counts and longer fixation duration on the landmark AOIs than Chinese participants did. When reading two thematic maps to determine spatial correlation, the two groups of participants showed significant differences in the assignment of visual attention to the main map, and the frequency of switching between the two maps was significantly higher in Chinese participants than in Malaysian Chinese participants.
The difference between the spatial visualization task and the mental rotation task is only the difference in the scale of the stimulus material [59]. However, the two groups showed differences in the mental rotation task but showed similar performance in the spatial visualization task. This indicates that there are also differences in the same spatial ability of people at different scales, such as the “paper-pencil test” and a large-scale task in geographical environments [60,61]. Small-scale spatial visualization skill is closely related to education, especially science education [62]. Abd Wahab et al. [63] also reported the undesirable performance of excellent Malaysian students on small-scale visual spatial tasks, pointing out that their visual spatial ability was at the lowest level. Although space geometry is taught from preschool to middle school in Malaysia [63], it is not effective, since they use the traditional teaching methods, which tend to force students to memorize knowledge and ignore application. Teachers depend highly on textbooks and do not use practical activities in the teaching process, leading to students’ visual spatial abilities not being developed [64,65]. The Malaysian Chinese participants in this study were all educated in Malaysia before attending university, which may be the reason for their suboptimal performance on the small-scale spatial visualization task.
In contrast to German and British people, Chinese and Malaysian people tend to rely on landmarks rather than memory routes during navigation [66]. People living in cities with different types of road network structures have different wayfinding tendencies [67]. Since the prevailing urban structure in Malaysia is an irregular grid pattern, it is difficult to remember routes. We inferred that Malaysian Chinese people pay more attention to landmarks than Chinese people [68,69]. However, in the spatial orientation task, Chinese Malaysian participants took less time to process the landmarks than Chinese participants, and their accuracy was lower, although the difference was not significant. This may be related to the typical urban environments of their living environments. We chose a regular grid pattern area as the experimental area, which is common in Chinese cities; however, in Malaysia, such layouts are rare. According to Davies et al. [12], compared with participants who were familiar with the road pattern, participants who were unfamiliar with the road pattern showed worse performance of cognition and expression of the surrounding environment. Coutrot [70] also pointed out that people who grew up in a city with grid-pattern streets, such as Chicago, were able to navigate in an environment that was similar to their hometown but performed poorly in an environment with irregular road patterns. Similarly, in the unfamiliar regular road pattern task, Chinese Malaysian participants’ attention to landmarks and the process of orientation may have been affected negatively. Future work may require spatial orientation experiments with irregular road patterns.
The eye movement results reflected the less desirable spatial memory and lower spatial information processing efficiency of Malaysian Chinese participants. In addition, according to the interviews after the experiment, we found that Malaysian Chinese participants tended to judge the spatial relationship through the title of the thematic map, in combination with their prior knowledge, rather than relying on the main map, while Chinese participants said that they mainly used the main map to make judgments. If there was a conflict between the information they received from the main map and the title, they still trusted the main map. Since Malaysian Chinese participants also gazed at the main map frequently, we believed that they had difficulty in obtaining relationship information from the map. This may be due to the cognitive style differences between the two groups. The analytic style is typical for Westerners, while that for Easterners is holistic [71]. Existing studies have proven that cognitive style is influenced by culture [72,73]. In particular, multicultural people’s cognitive styles can be dynamic, depending on their self-identity cognition and cultural cues [74]. As a former British colony [75], the cultures of Malaysia and the UK have a great deal in common. We inferred that the cognitive style of the Malaysian Chinese participants was also influenced by culture and tended to be analytic. The research of Gentner [76] pointed out that there is competition between analytic perceptions and holistic perception. In this research, Malaysian Chinese participants showed analytic perception, and Chinese participants showed holistic perception, which has an advantage when analyzing spatial correlation [77]. In summary, the difference in spatial ability between Chinese and Malaysian Chinese is not as significant as we expected, and the differences we have found might be explained by education, life habits, and cultural influence by other ethnicities.

6. Conclusions and Future Work

In this study, we combined behavioral measurements and eye tracking and designed a battery of spatial tasks to explore whether there were differences in the degree of spatial ability of Chinese and Malaysian Chinese people. We found that most of the spatial abilities of the two groups were not significantly different, and their visual behaviors such as gaze and saccade may also reflect their similar spatially related visual information searching and processing cognitive characteristics. However, Chinese participants showed higher accuracy in the mental rotation task than Malaysian participants; Malaysian Chinese participants assigned less visual attention to the landmarks during orientation, assigned less visual attention to the main map, and had lower visual information processing efficiency while reading the map to find the spatial correlation. This result can be explained by the two groups’ cultural homology, and the fact that Malaysian Chinese immigrants have been influenced by cultures of other races. The results contribute to the understanding of the influence of culture on spatial ability and its possible causes.
There are also some limitations in the study. Due to the COVID-19 pandemic, we had difficulty recruiting international students as participants, so we could not recruit more participants with different cultural backgrounds for this study. Besides, to ensure data quality, we excluded participants with a low sampling rate or obvious abnormal data. Thus, the number of participants in the sample is small. Since our participants did not differ enough in their cultural backgrounds, most of the results of the experiment were not statistically significant, and we could only make inferences about the nonsignificant results carefully, instead of drawing a definite conclusion. Future work needs to choose participant groups with clearer cultural differences to examine how culture shapes spatial ability. Besides, we obtained a limited number of suitable thematic maps, resulting in fewer questions for Task 4 than for the rest of the tasks. In addition, our study inferred that natural factors and economic factors influence the culture of an ethnic group and that culture shapes people’s spatial ability. However, is it possible that natural and economic factors directly affect people’s spatial ability? Future studies should link these factors with spatial ability with a larger sample.

Author Contributions

Conceptualization, Yuyang Tian and Weihua Dong; data curation, Yuyang Tian; formal analysis, Yuyang Tian; funding acquisition, Weihua Dong; methodology, Yuyang Tian and Tianyu Yang; project administration, Weihua Dong; supervision, Weihua Dong; writing—original draft, Yuyang Tian; writing—review and editing, Yuyang Tian, Tianyu Yang and Weihua Dong. All authors have read and agreed to the published version of the manuscript.

Funding

This research was funded by the Second Tibetan Plateau Scientific Expedition and Research Program (Grant No. 2019QZKK0608) and the National Natural Science Foundation of China (NSFC, Grant No. 41871366).

Institutional Review Board Statement

The study was conducted in accordance with the Declaration of Helsinki, and approved by the Institutional Review Board of Beijing Normal University.

Informed Consent Statement

Informed consent was obtained from all subjects involved in the study.

Data Availability Statement

Considering the privacy of the research participants, the original behavioral data and eye-tracking data are not publicly shared, but they are available from the corresponding authors upon reasonable request.

Acknowledgments

The authors would like to thank the editor and reviewers for their efforts for this paper. We also thank Lin Zhu (Beijing Normal University, China) for the help in the experiment design.

Conflicts of Interest

The authors declare no conflict of interest.

Appendix A

Table A1. Linear mixed model regression results of eye movement data in the mental rotation task (CB, cultural background; SE, standard error; EST, estimate).
Eye Movement IndexEffect95% Confidence Interval
ESTSEFp Value
Fixation count/#CB−5.6217.1630.6160.437
Intercept62.8143.869
Fixation duration/sCB−1.7661.7331.0390.314
Intercept15.1420.936
Saccade count/#CB−9.2809.8280.8920.350
Intercept93.5315.429
Saccade frequency/#·s−1CB0.5910.5071.3600.250
Intercept4.2750.280
Table A2. Linear mixed model regression results of eye movement data in the spatial visualization task (CB, cultural background; SE, standard error).
Eye Movement IndexEffect95% Confidence Interval
CoefficientSEFp Value
Time to first fixation/sCB−0.0100.0220.1940.663
Intercept0.3200.014
Ratio of fixation count/#CB0.0110.0180.3430.562
Intercept0.7010.011
Ratio of fixation duration/sCB0.0160.0200.6280.433
Intercept0.7340.012
Saccade count/#CB−2.25211.1680.0410.841
Intercept97.5036.888
Saccade frequency/#·s−1CB0.4820.4401.2000.281
Intercept3.8950.272
Table A3. Linear mixed model regression results of eye movement data in the spatial orientation task (CB, cultural background; SE, standard error; EST, estimate; * p < 0.05, ** p < 0.01).
Eye Movement IndexEffect95% Confidence Interval
ESTSEFp Value
Ratio of fixation count RoadCB0.0210.0490.1800.674
Intercept0.2140.169
BuildingCB−0.0090.0460.0380.846
Intercept0.5830.027
LandmarkCB−0.0230.0096.1230.019 *
Intercept0.0910.006
IntersectionCB0.0030.0060.1480.702
Intercept0.0420.004
Ratio of fixation durationRoadCB0.0220.0530.1790.674
Intercept0.2220.031
BuildingCB−0.0100.0500.0370.849
Intercept0.5700.029
LandmarkCB−0.0200.0094.9080.034 *
Intercept0.0800.005
IntersectionCB0.0040.0080.2430.625
Intercept0.0460.005
Saccade count/#CB−2.6655.1550.2670.608
Intercept52.3353.010
Saccade frequency/#·s−1CB0.5250.4331.4710.233
Intercept4.7450.309
Table A4. Linear mixed model regression results in the spatial correlation task (CB, cultural background; SE, standard error; EST, estimate; * p < 0.05, ** p < 0.01).
Eye Movement IndexEffect95% Confidence Interval
ESTSEFp Value
Ratio of fixation count TitleCB0.0350.1993.0960.085
Intercept0.1180.011
LegendCB0.0020.0180.0110.919
Intercept0.2050.009
Main mapCB−0.0540.0283.6550.062
Intercept0.5200.017
Ratio of fixation durationTitleCB0.0250.0181.9230.172
Intercept0.0700.010
LegendCB0.0000.0200.0000.996
Intercept0.2170.011
Main mapCB−0.0700.0314.9510.031 *
Intercept0.5240.017
Saccade count/#CB30.78219.8392.4080.129
Intercept148.82210.502
Saccade frequency/#·s-CB−0.0710.3010.0550.815
Intercept4.7340.159
Switch time/#CB−0.7842.3920.1070.745
Intercept22.4851.300
Switch frequency/#·s−1CB−0.1160.0437.1990.010 **
Intercept0.7030.025

References

  1. Golledge, R.G.; Jacobson, R.D.; Kitchin, R.; Blades, M. Cognitive Maps, Spatial Abilities, and Human Wayfinding. Geogr. Rev. Jpn. Ser. B 2000, 73, 93–104. [Google Scholar] [CrossRef] [Green Version]
  2. Stieff, M.; Uttal, D. How Much Can Spatial Training Improve STEM Achievement? Educ. Psychol. Rev. 2015, 27, 607–615. [Google Scholar] [CrossRef]
  3. Bolen, J.A. Spatial Ability, Motivation, and Attitude of Students as Related to Science Achievement. Ph.D. Thesis, University of north Texas, Denton, TX, USA, 2011. [Google Scholar]
  4. Jiang, W. The Relationship between Culture and Language. ELT J. 2000, 54, 328–334. [Google Scholar] [CrossRef]
  5. Peng, K.; Knowles, E.D. Culture, Education, and the Attribution of Physical Causality. Personal. Soc. Psychol. Bull. 2003, 29, 1272–1284. [Google Scholar] [CrossRef] [PubMed]
  6. Edensor, T. National Identity, Popular Culture and Everyday Life; Routledge: New York, NY, USA; London, UK, 2020. [Google Scholar]
  7. Kerrigan, L.; Thomas, M.S.C.; Bright, P.; Filippi, R. Evidence of an Advantage in Visuo-Spatial Memory for Bilingual Compared to Monolingual Speakers. Biling. Lang. Cogn. 2016, 20, 602–612. [Google Scholar] [CrossRef] [Green Version]
  8. Fuhrman, O.; Boroditsky, L. Cross-Cultural Differences in Mental Representations of Time: Evidence From an Implicit Nonlinguistic Task. Cogn. Sci. 2010, 34, 1430–1451. [Google Scholar] [CrossRef]
  9. Goeke, C.; Kornpetpanee, S.; Köster, M.; Fernández-Revelles, A.B.; Gramann, K.; König, P. Cultural Background Shapes Spatial Reference Frame Proclivity. Sci. Rep. 2015, 5, 11426. [Google Scholar] [CrossRef] [Green Version]
  10. Coutrot, A.; Silva, R.; Manley, E.; de Cothi, W.; Sami, S.; Bohbot, V.D.; Wiener, J.M.; Hölscher, C.; Dalton, R.C.; Hornberger, M.; et al. Global Determinants of Navigation Ability. Curr. Biol. 2018, 28, 2861–2866.e4. [Google Scholar] [CrossRef] [Green Version]
  11. Chang, K.; Antes, J.R. Sex and Cultural Differences in Map Reading. Am. Cartogr. 1987, 14, 29–42. [Google Scholar] [CrossRef]
  12. Davies, C.; Pederson, E. Grid Patterns and Cultural Expectations in Urban Wayfinding. In Spatial Information Theory; Lecture Notes in Computer Science; Springer: Berlin, Heidelberg, 2001; pp. 400–414. [Google Scholar]
  13. Demetriou, A.; Kui, Z.X.; Spanoudis, G.; Christou, C.; Kyriakides, L.; Platsidou, M. The Architecture, Dynamics, and Development of Mental Processing: Greek, Chinese, or Universal? Intelligence 2005, 33, 109–141. [Google Scholar] [CrossRef]
  14. Tan, C.B.Y.; Stephen, I.D.; Whitehead, R.; Sheppard, E. You Look Familiar: How Malaysian Chinese Recognize Faces. PLoS ONE 2012, 7, e29714. [Google Scholar] [CrossRef] [PubMed]
  15. Lohman, D.F. Spatial Ability: A Review and Reanalysis of the Correlational Literature; School of Education, Stanford University: Stanford, CA, USA, 1979. [Google Scholar]
  16. Linn, M.C.; Petersen, A.C. Emergence and Characterization of Sex Differences in Spatial Ability: A Meta-Analysis. Child Dev. 1985, 56, 1479–1498. [Google Scholar] [CrossRef] [PubMed]
  17. McGee, M.G. Human Spatial Abilities: Psychometric Studies and Environmental, Genetic, Hormonal, and Neurological Influences. Psychol. Bull. 1979, 86, 889–918. [Google Scholar] [CrossRef]
  18. Lohman, D. Spatial Ability and G. Hum. Abil. Nat. Meas. 1996, 97, 1. [Google Scholar]
  19. Buckley, J.; Seery, N.; Canty, D. A Heuristic Framework of Spatial Ability: A Review and Synthesis of Spatial Factor Literature to Support Its Translation into STEM Education. Educ. Psychol. Rev. 2018, 30, 947–972. [Google Scholar] [CrossRef] [Green Version]
  20. Guilford, J.P.; Lacey, J.I. Printed Classification Tests; US Government Printing Office: Washington, DC, USA, 1947.
  21. Guay, R.B. Purdue Spatial Visualization Test; Purdue Research Foundation: West Lafayette, IN, USA, 1976. [Google Scholar]
  22. Vandenberg, S.G.; Kuse, A.R. Mental Rotations, a Group Test of Three-Dimensional Spatial Visualization. Percept. Mot. Ski. 1978, 47, 599–604. [Google Scholar] [CrossRef] [PubMed]
  23. Bednarz, R.; Lee, J. What Improves Spatial Thinking? Evidence from the Spatial Thinking Abilities Test. Int. Res. Geogr. Environ. Educ. 2019, 28, 262–280. [Google Scholar] [CrossRef]
  24. Farrell, S.; Duffy, G.; Bowe, B. A Cross-Cultural Exploration of Spatial Visualisation Abilities of First Year STEM Students: Students from Gulf States and Ireland. In Proceedings of the 2015 International Conference on Interactive Collaborative Learning (ICL), Firenze, Italy, 20–24 September 2015; pp. 922–926. [Google Scholar]
  25. Seng, A.S.H.; Tan, L.C. Cultural and Gender Differences in Spatial Ability of Young Children. In Proceedings of the ACEI 2002 Annual Conference, Paris, France, 1 July 2002. [Google Scholar]
  26. Parameswaran, G. Experimenter Instructions as a Mediator in the Effects of Culture on Mapping One’s Neighborhood. J. Environ. Psychol. 2003, 23, 409–417. [Google Scholar] [CrossRef]
  27. Berry, J.W. Temne and Eskimo Perceptual Skills. Int. J. Psychol. 1966, 1, 207–229. [Google Scholar] [CrossRef]
  28. Gabriel, S.P. ‘After the Break’: Re-Conceptualizing Ethnicity, National Identity and ‘Malaysian-Chinese’ Identities. Ethn. Racial Stud. 2013, 37, 1211–1224. [Google Scholar] [CrossRef]
  29. Kiefer, P.; Giannopoulos, I.; Raubal, M. Where Am I? Investigating Map Matching During Self-Localization with Mobile Eye Tracking in an Urban Environment. Trans. GIS 2014, 18, 660–686. [Google Scholar] [CrossRef]
  30. Davis, R. The Feasibility of Using Virtual Reality and Eye Tracking in Research with Older Adults with and Without Alzheimer’s Disease. Front. Aging Neurosci. 2021, 13, 607219. [Google Scholar] [CrossRef] [PubMed]
  31. Dong, W.; Liao, H.; Zhan, Z.; Liu, B.; Wang, S.; Yang, T. New Research Progress of Eye Tracking-Based Map Cognition in Cartography since 2008. Acta Geogr. Sin. 2019, 74, 599–614. [Google Scholar]
  32. Liao, H.; Dong, W.; Peng, C.; Liu, H. Exploring Differences of Visual Attention in Pedestrian Navigation When Using 2D Maps and 3D Geo-Browsers. Cartogr. Geogr. Inf. Sci. 2017, 44, 474–490. [Google Scholar] [CrossRef]
  33. Cazzato, V.; Basso, D.; Cutini, S.; Bisiacchi, P. Gender Differences in Visuospatial Planning: An Eye Movements Study. Behav. Brain Res. 2010, 206, 177–183. [Google Scholar] [CrossRef] [Green Version]
  34. Andersen, N.E.; Dahmani, L.; Konishi, K.; Bohbot, V.D. Eye Tracking, Strategies, and Sex Differences in Virtual Navigation. Neurobiol. Learn. Mem. 2012, 97, 81–89. [Google Scholar] [CrossRef]
  35. Toth, A.J.; Campbell, M.J. Investigating Sex Differences, Cognitive Effort, Strategy, and Performance on a Computerised Version of the Mental Rotations Test via Eye Tracking. Sci. Rep. 2019, 9, 19430. [Google Scholar] [CrossRef] [Green Version]
  36. Sun, Y.; Lu, X.; Wang, Y. Using Eye Tracking to Explore Differences between High and Low Map-Based Spatial Ability. J. Geogr. 2020, 119, 215–225. [Google Scholar] [CrossRef]
  37. Dong, W.; Ying, Q.; Yang, Y.; Tang, S.; Zhan, Z.; Liu, B.; Meng, L. Using Eye Tracking to Explore the Impacts of Geography Courses on Map-Based Spatial Ability. Sustainability 2018, 11, 76. [Google Scholar] [CrossRef] [Green Version]
  38. Dong, W.; Zhan, Z.; Liao, H.; Meng, L.; Liu, J. Assessing Similarities and Differences between Males and Females in Visual Behaviors in Spatial Orientation Tasks. ISPRS Int. J. Geo-Inf. 2020, 9, 115. [Google Scholar] [CrossRef] [Green Version]
  39. Šašinka, Č.; Stachoň, Z.; Čeněk, J.; Šašinková, A.; Popelka, S.; Ugwitz, P.; Lacko, D. A Comparison of the Performance on Extrinsic and Intrinsic Cartographic Visualizations through Correctness, Response Time and Cognitive Processing. PLoS ONE 2021, 16, e0250164. [Google Scholar] [CrossRef] [PubMed]
  40. Liao, H.; Dong, W. An Exploratory Study Investigating Gender Effects on Using 3D Maps for Spatial Orientation in Wayfinding. ISPRS Int. J. Geo-Inf. 2017, 6, 60. [Google Scholar] [CrossRef]
  41. Popelka, S. Eye-Tracking Evaluation of 3D Thematic Maps. In Proceedings of the 3rd Workshop on Eye Tracking and Visualization, Warsaw, Poland, 15 June 2018; pp. 1–5. [Google Scholar]
  42. Çöltekin, A.; Brychtová, A.; Griffin, A.L.; Robinson, A.C.; Imhof, M.; Pettit, C. Perceptual Complexity of Soil-Landscape Maps: A User Evaluation of Color Organization in Legend Designs Using Eye Tracking. Int. J. Digit. Earth 2017, 10, 560–581. [Google Scholar] [CrossRef]
  43. Hesselmann, G. Applying Linear Mixed Effects Models (LMMs) in Within-Participant Designs With Subjective Trial-Based Assessments of Awareness—A Caveat. Front. Psychol. 2018, 9, 788. [Google Scholar] [CrossRef] [PubMed] [Green Version]
  44. Guo, F.; Ding, Y.; Liu, W.; Liu, C.; Zhang, X. Can Eye-Tracking Data Be Measured to Assess Product Design?: Visual Attention Mechanism Should Be Considered. Int. J. Ind. Ergon. 2016, 53, 229–235. [Google Scholar] [CrossRef]
  45. Majid, A.; Bowerman, M.; Kita, S.; Haun, D.B.M.; Levinson, S.C. Can Language Restructure Cognition? The Case for Space. Trends Cogn. Sci. 2004, 8, 108–114. [Google Scholar] [CrossRef]
  46. Annerstedt, C. Physical Education in Scandinavia with a Focus on Sweden: A Comparative Perspective. Phys. Educ. Sport Pedagog. 2008, 13, 303–318. [Google Scholar] [CrossRef]
  47. Maguire, E.A.; Woollett, K.; Spiers, H.J. London Taxi Drivers and Bus Drivers: A Structural MRI and Neuropsychological Analysis. Hippocampus 2006, 16, 1091–1101. [Google Scholar] [CrossRef] [Green Version]
  48. Bai, X.; Yan, G.; Liversedge, S.P.; Zang, C.; Rayner, K. Reading Spaced and Unspaced Chinese Text: Evidence from Eye Movements. J. Exp. Psychol. Hum. Percept. Perform. 2008, 34, 1277–1287. [Google Scholar] [CrossRef] [Green Version]
  49. Tang, Y.; Zhang, W.; Chen, K.; Feng, S.; Ji, Y.; Shen, J.; Reiman, E.M.; Liu, Y. Arithmetic Processing in the Brain Shaped by Cultures. Proc. Natl. Acad. Sci. USA 2006, 103, 10775–10780. [Google Scholar] [CrossRef] [Green Version]
  50. Gentner, D.; Goldin-Meadow, S. Language in Mind: Advances in the Study of Language and Thought; MIT Press: Cambridge, MA, USA, 2003; pp. 3–14. [Google Scholar]
  51. Haun, D.B.M.; Rapold, C.J.; Call, J.; Janzen, G.; Levinson, S.C. Cognitive Cladistics and Cultural Override in Hominid Spatial Cognition. Proc. Natl. Acad. Sci. USA 2006, 103, 17568–17573. [Google Scholar] [CrossRef] [PubMed] [Green Version]
  52. Xiao, D. Cognitive Geography: Human-Centered Geographic Information Science; Science Press: Beijing, China, 2013. [Google Scholar]
  53. Terrill, A.; Burenhult, N. Orientation as a Strategy of Spatial Reference. Stud. Language. Int. J. Spons. Found. Found. Lang. 2008, 32, 93–136. [Google Scholar] [CrossRef]
  54. Palmer, B.; Lum, J.; Schlossberg, J.; Gaby, A. How Does the Environment Shape Spatial Language? Evidence for Sociotopography. Linguist. Typol. 2017, 21, 457–491. [Google Scholar] [CrossRef]
  55. Mondschein, A.; Blumenberg, E.; Taylor, B.D. Cognitive Mapping, Travel Behavior, and Access to Opportunity. Transp. Res. Rec. 2006, 1985, 266–272. [Google Scholar] [CrossRef]
  56. Poumanyvong, P.; Kaneko, S.; Dhakal, S. Impacts of Urbanization on National Transport and Road Energy Use: Evidence from Low, Middle and High Income Countries. Energy Policy 2012, 46, 268–277. [Google Scholar] [CrossRef]
  57. Sandamas, G.; Foreman, N. Active versus Passive Acquisition of Spatial Knowledge While Controlling a Vehicle in a Virtual Urban Space in Drivers and Non-Drivers. Sage Open 2015, 5, 2158244015595443. [Google Scholar] [CrossRef]
  58. Hook, W.; Replogle, M. Motorization and Non-Motorized Transport in Asia: Transport System Evolution in China, Japan and Indonesia. Land Use Policy 1996, 13, 69–84. [Google Scholar] [CrossRef]
  59. Hegarty, M.; Waller, D. A Dissociation between Mental Rotation and Perspective-Taking Spatial Abilities. Intelligence 2004, 32, 175–191. [Google Scholar] [CrossRef]
  60. Hegarty, M.; Richardson, A.E.; Montello, D.R.; Lovelace, K.; Subbiah, I. Development of a Self-Report Measure of Environmental Spatial Ability. Intelligence 2002, 30, 425–447. [Google Scholar] [CrossRef]
  61. Allen, G.L.; Kirasic, K.C.; Dobson, S.H.; Long, R.G.; Beck, S. Predicting Environmental Learning from Spatial Abilities: An Indirect Route. Intelligence 1996, 22, 327–355. [Google Scholar] [CrossRef]
  62. Uttal, D.H.; Meadow, N.G.; Tipton, E.; Hand, L.L.; Alden, A.R.; Warren, C.; Newcombe, N.S. The Malleability of Spatial Skills: A Meta-Analysis of Training Studies. Psychol. Bull. 2013, 139, 352. [Google Scholar] [CrossRef] [PubMed] [Green Version]
  63. Abd Wahab, R.; Abdullah, A.H.; Abu, M.S.; Mokhtar, M.; Atan, N.A. A Case Study on Visual Spatial Skills and Level of Geometric Thinking in Learning 3D Geometry among High Achievers. Man India 2016, 96, 489–499. [Google Scholar]
  64. Abu, M.S.; Ali, M.B.; Hock, T.T. Assisting Primary School Children to Progress through Their van Hiele’s Levels of Geometry Thinking Using Google SketchUp. Procedia-Soc. Behav. Sci. 2012, 64, 75–84. [Google Scholar] [CrossRef]
  65. Abdullah, A.H.; Zakaria, E. The Effects of Van Hiele’s Phases of Learning Geometry on Students’ Degree of Acquisition of Van Hiele Levels. Procedia-Soc. Behav. Sci. 2013, 102, 251–266. [Google Scholar] [CrossRef] [Green Version]
  66. Large, D.R.; Burnett, G.; Mohd-Hasni, Y. Capturing Cultural Differences between UK and Malaysian Drivers to Inform the Design of In-Vehicle Navigation Systems. Int. J. Automot. Eng. 2017, 8, 112–119. [Google Scholar] [CrossRef] [Green Version]
  67. Iftikhar, H.; Shah, P.; Luximon, Y. Human Wayfinding Behaviour and Metrics in Complex Environments: A Systematic Literature Review. Archit. Sci. Rev. 2021, 64, 452–463. [Google Scholar] [CrossRef]
  68. Liu, B.; Dong, W.; Zhan, Z.; Wang, S.; Meng, L. Differences in the Gaze Behaviours of Pedestrians Navigating between Regular and Irregular Road Patterns. ISPRS Int. J. Geo-Inf. 2020, 9, 45. [Google Scholar] [CrossRef] [Green Version]
  69. Rapoport, A. Human Aspects of Urban Form: Towards a Man—Environment Approach to Urban Form and Design; Elsevier: Amsterdam, The Netherlands, 2016. [Google Scholar]
  70. Coutrot, A.; Manley, E.; Goodroe, S.; Gahnstrom, C.; Filomena, G.; Yesiltepe, D.; Dalton, R.C.; Wiener, J.M.; Hölscher, C.; Hornberger, M.; et al. Entropy of City Street Networks Linked to Future Spatial Navigation Ability. Nature 2022, 604, 104–110. [Google Scholar] [CrossRef]
  71. Stachoň, Z.; Šašinka, Č.; Čeněk, J.; Štěrba, Z.; Angsuesser, S.; Fabrikant, S.I.; Štampach, R.; Morong, K. Cross-Cultural Differences in Figure–Ground Perception of Cartographic Stimuli. Cartogr. Geogr. Inf. Sci. 2018, 46, 82–94. [Google Scholar] [CrossRef]
  72. Nisbett, R.E.; Masuda, T. Culture and Point of View. Proc. Natl. Acad. Sci. USA 2003, 100, 11163–11170. [Google Scholar] [CrossRef] [Green Version]
  73. Kelly, D.J.; Miellet, S.; Caldara, R. Culture Shapes Eye Movements for Visually Homogeneous Objects. Front. Psychol. 2010, 1, 6. [Google Scholar] [CrossRef] [PubMed] [Green Version]
  74. Nisbett, R.E.; Miyamoto, Y. The Influence of Culture: Holistic versus Analytic Perception. Trends Cogn. Sci. 2005, 9, 467–473. [Google Scholar] [CrossRef] [PubMed]
  75. Sumintono, B. Science Education in Malaysia: Challenges in the 21st Century. J. Cakrawala Pendidik. 2017, 36, 1–10. [Google Scholar]
  76. Gentner, D.; Rattermann, M.J. Language and the Career of Similarity. Perspectives on Language & Thought Interrelations in Development; Cambridge University Press: Cambridge, UK, 1991. [Google Scholar] [CrossRef]
  77. Kuwabara, M.; Smith, L.B. Cross-Cultural Differences in Cognitive Development: Attention to Relations and Objects. J. Exp. Child Psychol. 2012, 113, 20–35. [Google Scholar] [CrossRef]
Figure 1. Experimental area: the blue box represents the experimental area; the orange lines represent roads. Since the participants’ native language is Chinese, the map used in the experiment had some Chinese annotations.
Ijgi 11 00578 g001
Figure 2. Procedure.
Ijgi 11 00578 g002
Figure 3. Analysis framework.
Ijgi 11 00578 g003
Figure 4. Statistics in the mental rotation task: (a) accuracy; (b) response time; (c) fixation count; (d) fixation duration; (e) saccade count; (f) saccade frequency (* p < 0.05, ** p < 0.01).
Ijgi 11 00578 g004
Figure 5. Statistics in the spatial visualization task: (a) accuracy; (b) response time; (c) time to first fixation; (d) ratio of fixation count; (e) ratio of fixation duration; (f) saccade count; (g) saccade frequency (* p < 0.05, ** p < 0.01).
Ijgi 11 00578 g005
Figure 6. Statistics in the spatial orientation task: (a) accuracy; (b) response time; (c) ratio of fixation count; (d) saccade count; (e) saccade frequency; (f) ratio of fixation duration (* p < 0.05, ** p < 0.01).
Ijgi 11 00578 g006
Figure 7. Statistics in the spatial correlation task: (a) accuracy; (b) response time; (c) saccade count; (d) ratio of fixation count; (e) saccade frequency; (f) switch time; (g) switch frequency; (h) ratio of fixation duration (* p < 0.05, ** p < 0.01).
Ijgi 11 00578 g007
Table 1. Definitions and Meaning of the Metrics.
Evaluation IndexDefinitionMeaning
AccuracyThe ratio of correct answers in the taskThe accuracy and efficiency
Response TimeThe time the participants take to complete a task
Time to First
Fixation
The time spent before the AOI was first fixated onTime required to notice key information areas
(Ratio of)
Fixation Count
Number of fixations within the AOI (divided by the total fixation count)Information processing load
(Ratio of)
Fixation Duration
All durations of fixation on one AOI (divided by the total fixation duration)Time required to process information
Saccade CountTotal saccade count within the AOIInformation searching load
Saccade FrequencySaccade counts divided by visit durationInformation search efficiency
Switch TimeNumber of switches between different mapsNumber of information matches
Switch FrequencySwitching time divided by visit durationInformation matching efficiency
Publisher’s Note: MDPI stays neutral with regard to jurisdictional claims in published maps and institutional affiliations.