Article

Agglomeration Externalities, Network Externalities and Urban High-Quality Development: A Case Study of Urban Agglomeration in the Middle Reaches of the Yangtze River

1
Geographical Sciences School, Liaoning Normal University, Dalian 116029, China
2
Teachers College, Shenyang University, Shenyang 110044, China
3
Art and Design School, Dalian Polytechnic University, Dalian 116034, China
4
School of Resource and Environmental Sciences, Quanzhou Normal University, Quanzhou 362000, China
5
National Marine Environmental Monitoring Center, Dalian 116023, China
*
Author to whom correspondence should be addressed.
ISPRS Int. J. Geo-Inf. 2022, 11(11), 555; https://doi.org/10.3390/ijgi11110555
Submission received: 11 July 2022 / Revised: 25 September 2022 / Accepted: 5 November 2022 / Published: 8 November 2022

Abstract

:
The rapid development of the urban network has led to the fact that cities are no longer single individuals, and the network has changed the urban development environment. The interaction between cities has gradually become an important factor for the high-quality development (HQD) of cities. From the perspective of externalities, it is of great significance to explore the impact of agglomeration externalities and network externalities on the HQD of cities to promote the high-quality and sustainable development of the region. Taking the urban agglomeration in the middle reaches of the Yangtze River as an example, this study constructs a theoretical framework to empirically study the influence of agglomeration externalities and network externalities on the HQD of the city. The results show that the integrated network of the urban agglomeration from 2011 to 2020 had a high clustering coefficient and a small average path length with the characteristics of a “small world”. The centrality of urban nodes was hierarchical and had a “pyramid” structure. From 2011 to 2020, the high-quality development level (HQDL) of the urban agglomeration steadily improved and the regional “development gap” gradually narrowed. Wuhan, Changsha, and Nanchang were in a relatively advantageous position in the urban agglomeration. Furthermore, there was a spatial agglomeration effect and a spatial spillover effect in the HQD of urban agglomeration. Network externalities presented difference in different cities, and the influence of agglomeration externalities on HQD presented a u-shaped nonlinear relationship. Network externalities could significantly promote HQD, and the indirect effect of HQD was greater than its direct effect. In addition, factors such as government capacity and level of opening to the outside world also had a significant impact on the HQD of the region.

1. Introduction

With the development of industrial division and trade globalization, industry has gradually gathered on the geographical space and it has become a common economic geographical phenomenon [1,2] in developing countries and developed countries. As a form of spatial organization, industrial agglomeration can also produce external economy, which will affect the urban development [3], and this effect is considered to agglomerate externalities. In addition, under the background of informatization, globalization, and regional integration trends, the relationship between cities has become increasingly close. “Place space” has been replaced with “flow space”, the network trend of regional spatial relations has grown significantly, the effect of geospatial proximity has been reduced, and the urban network and its spatial spillover effect have significantly influenced the development of cities [4]. As a node in the network space, the development of a city depends more on the interaction and spillover effect between cities than on its own functions and characteristics [5]. Relevant studies have provided that the production efficiency of a city is closely related to its connectivity in the network [6]. By participating in the urban network and co-operating with other cities in the network, cities make use of economies of scale to promote their own development through a “complementary relationship” and “synergistic effect” [7,8,9,10]. As cities become more connected, the importance of “externalities” is gradually highlighted [11,12]. Therefore, it is of great theoretical and practical significance to analyze the impact of agglomeration externalities and network externalities on the high-quality development (HQD) of cities from the perspective of externalities under increasingly close urban connections.

1.1. Urban High-Quality Development

China first proposed HQD at the 19th National Congress of the Communist Party of China in October 2017, calling for more efficient, equitable, open, and sustainable development [13]. Scholars have carried out several exploratory studies on HQD, including its connotation, motivation, and index systems [14,15,16]. It is widely believed that HQD includes five dimensions: innovation, co-ordination, green, opening, and sharing. Among them, the influencing mechanism of HQD is an important research field in urban geography [17]. By analyzing the factors affecting the HQD of cities, it has gradually become a key topic of research to provide scientific reference for the scientific and effective formulation of relevant policies. At present, most of the relevant studies on the influence of HQD focus on the “endogenous power” of cities, ignoring the influence of “external” factors on regional HQD. Currently, with the development of urban integration, there is a relatively obvious external effect of urban spatial connection, and the influence of external factors on urban development must be considered when exploring the driving force of HQD. In addition, urban agglomeration is an important place to promote regional sustainable development [18], so the study of the HQD of urban agglomeration has certain guiding value for urban development [19].

1.2. Agglomeration Externalities and Network Externalities

As a product of the agglomeration of economic entities and their economic activities within a certain geographical space [20], the spatial agglomeration of urban elements generates agglomeration externalities [21], which has obvious spatial spillover effects, and thus has an impact on urban development [22,23]. With the improvement of transportation and technology, cities are becoming more connected, and the agglomeration economy is no longer limited to a specific physical space. Urban networks can cross the geographical space boundary to some extent and expand the spatial flow range of urban elements. Cities in the network can benefit from the interaction with other cities, and the benefit degree is even greater than the size of the city itself [6]. Capello put forward the concept of “network externalities” and believed that externality, as an essential attribute of an urban network, is of great significance for the development of cities and regions [8]. In the urban network, the city realizes sharing, matching, and learning through participating in the urban network and develops its own economy through co-operative activities [9,10]. The borrowing scale effect produced by the co-operation of cities in the network can effectively improve the urban production efficiency [24,25,26]. It was found that the externalities of urban networks can influence urban development [27,28,29], including a positive borrowing scale effect and a negative gathering shadow effect [21,30]. Discussing the relationship between externalities and HQD has become a hot topic in urban geography [31]. Some scholars believed that agglomeration externalities had a more important effect on urban development than network externalities [32,33,34], whereas other scholars thought that network externalities could partly replace agglomeration externalities [4,6,35]. In fact, there is a complementary relationship between agglomeration externalities and network externalities, and they can work together for urban development [28].
To sum up, existing studies have laid a good foundation for analyzing the relationship among agglomeration externalities, network externalities, and HQD. However, most studies on urban network externalities were theoretical, lacking empirical studies. In an urban system, how do agglomeration externalities and network externalities jointly affect HQD, and what is their relative importance? In addition, there have been few empirical studies on the impact of externalities on HQD based on an urban agglomeration scale, and its internal formation mechanism still needs to be further explored. From the perspective of agglomeration externalities and network externalities, it is of great significance to discuss the transmission mechanism of agglomeration externalities affecting HQD. In fact, it is necessary to discuss the influence of agglomeration externalities and network externalities on HQD. Empirical research is more conducive to promoting HQD under the background of regional integration and networks. On this basis, 28 cities at the prefectural level in urban agglomeration of the middle reaches of the Yangtze River from 2011 to 2020 were taken as the research units. On the basis of multisource data, social network analysis and a spatial econometric model were used to examine and explain the relationship among agglomeration externalities, network externalities, and HQD in order to deepen the understanding of the mechanism of HQD and provide a theoretical understanding for HQD.
The research objectives of this paper are as follows: (1) to clarify the influence mechanism of agglomeration externalities and network externalities on HQD; (2) using a spatial econometric model to empirically study how agglomeration externalities and network externalities affect HQD; and (3) to put forward suggestions on promoting the HQD of urban agglomerations, so as to provide reference for regional development plans.
The marginal contributions of this study are mainly reflected in the following points: (1) by constructing a theoretical framework, the theoretical mechanism between agglomeration externalities, network externalities, and HQD is clarified. (2) Using multisource data, an urban integrated network is constructed, which can more accurately reflect the element connections between cities and better measure the externalities of urban networks. (3) On the basis of existing research, the spatial econometric model is used to explore the influence mechanism of agglomeration externalities and network externalities on HQD, as well as to enrich and expand the empirical research on agglomeration externalities, network externalities, and HQD.
The remainder of the article is organized as follows: Section 2 introduces the theoretical framework and research hypothesis. Section 3 describes the study area, data sources, and research methods. Section 4 analyzes the empirical results, including an analysis of the spatiotemporal evolution characteristics of urban networks and HQD and an analysis of the impacts of agglomeration externalities and network externalities on HQD by constructing spatial econometric models. Section 5 discusses the research results, policy recommendations, and future research directions. Section 6 summarizes the content of this article.

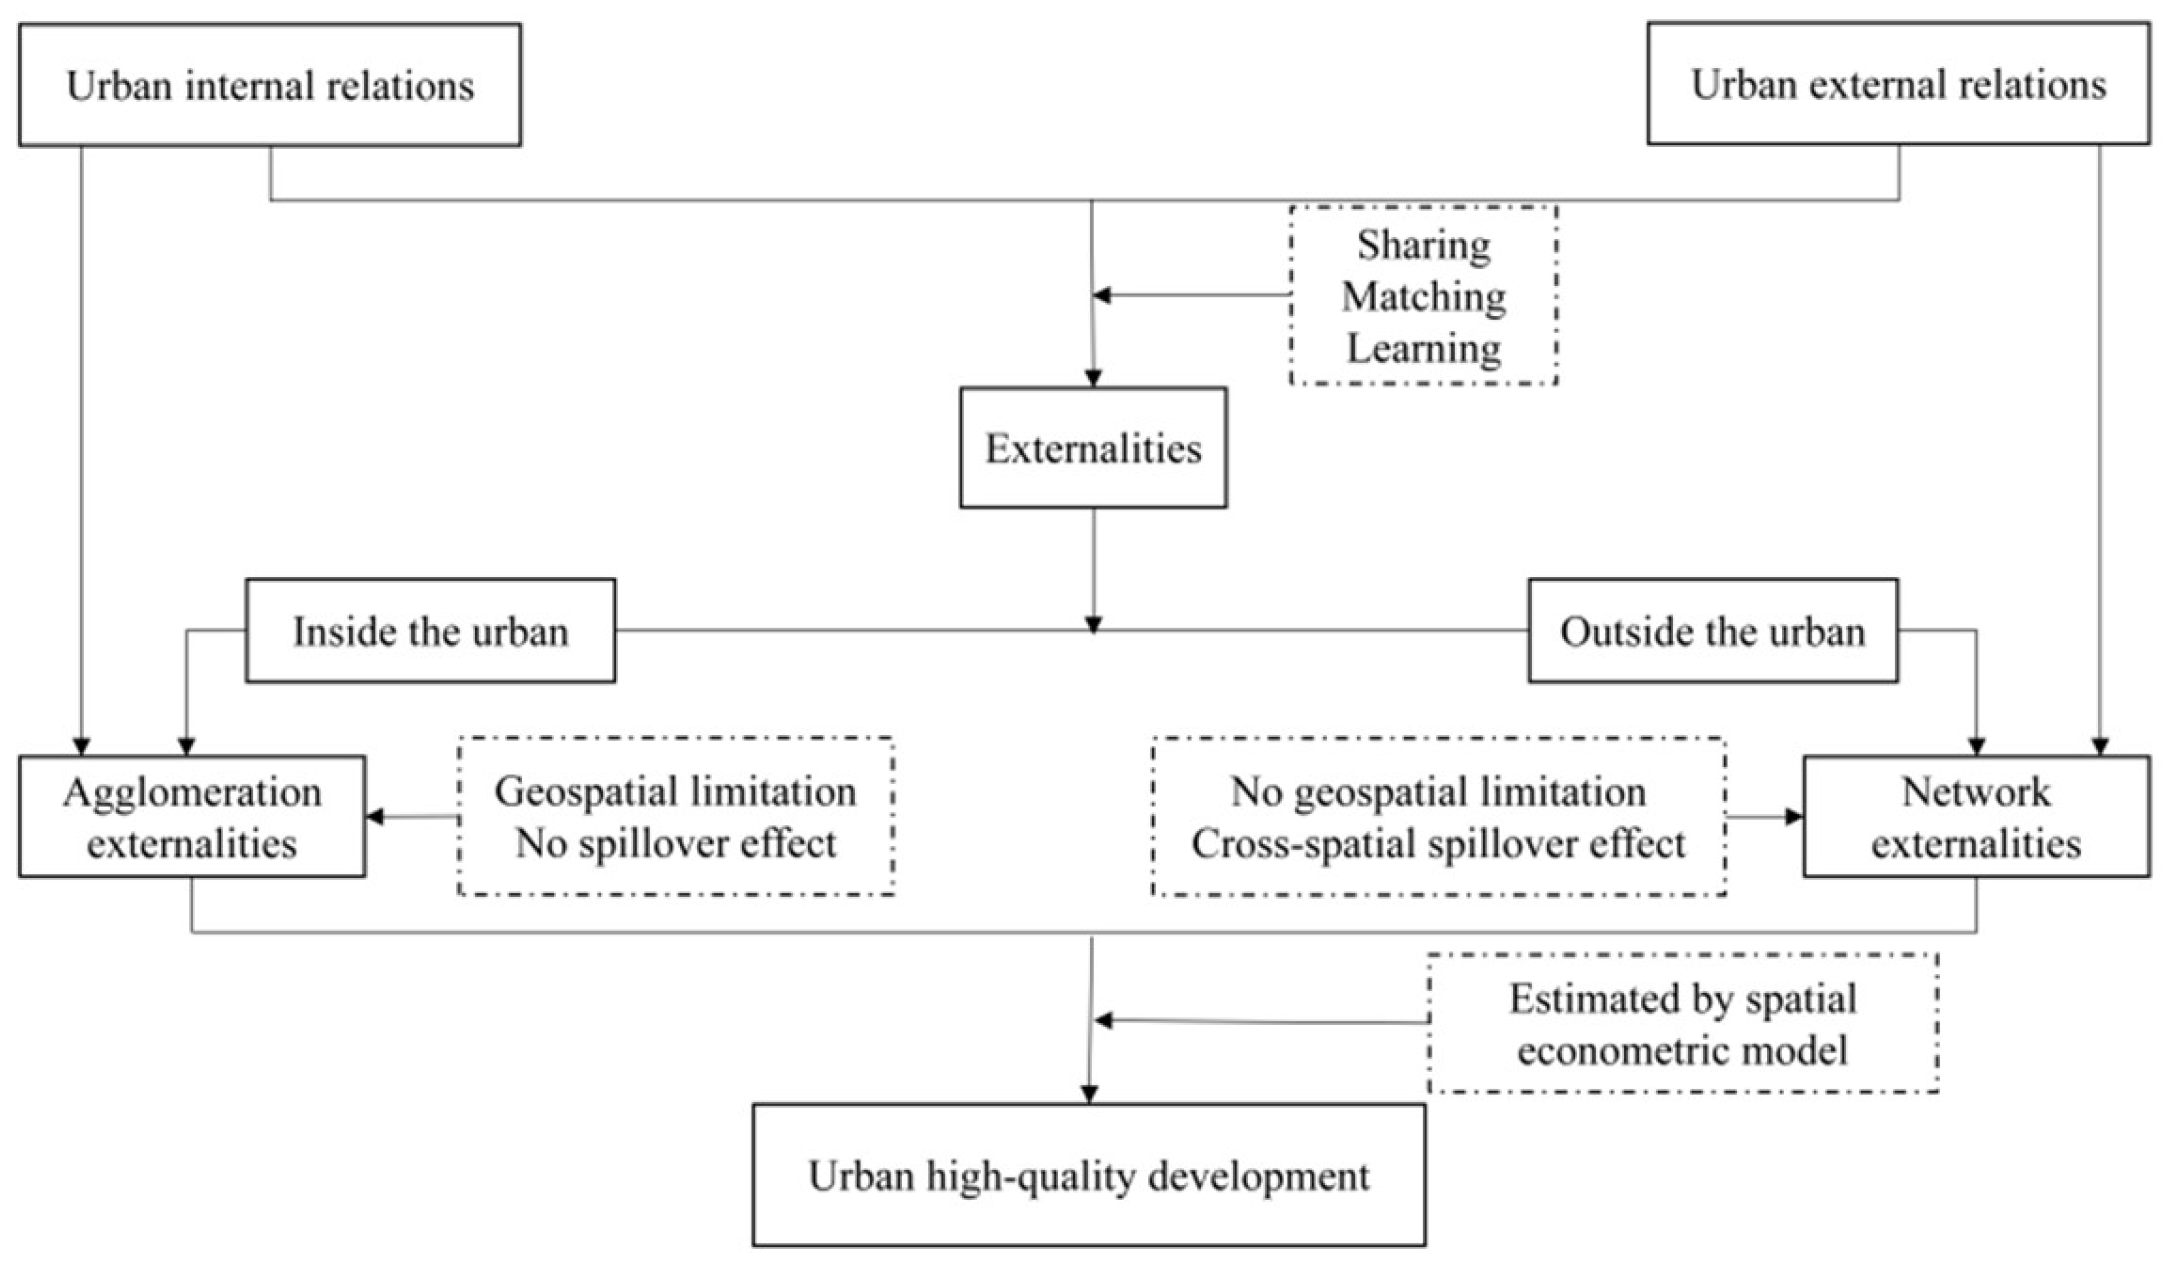
2. Theoretical Framework and Research Hypothesis

2.1. Agglomeration Externalities and the Impact of HQD

Agglomeration, as an economic phenomenon, produces environmental effects because of the existence of externalities. Studies have provided that agglomeration externalities play a role in urban development through three mechanisms: resource sharing, element matching, and mutual learning [26]. Many scholars have found that industrial agglomeration has positive environmental externalities [36], the agglomeration of population, enterprises, and other factors in urban space can reduce the cost of inter-regional exchange and provide a powerful driving force for urban development, which has a significantly positive impact on the overall development of the city [37]. However, the influence of agglomeration externalities on urban development is limited by geographical space, and its influence degree decreases with the increase in distance [4]. In addition, some studies believe that, when cities are in different development processes, agglomeration externalities will have different degrees of impact on cities [38]. When a city is in the initial stage of development, agglomeration externalities can have a positive impact. However, the gradual agglomeration of elements in space leads to the increase in agglomeration cost, accompanied by the increase in transportation costs, the increase in rent, and the aggravation of air pollution. This effect is called agglomeration diseconomy. When a city develops to a certain extent, agglomeration diseconomy may exceed agglomeration economy, and agglomeration externalities may inhibit urban development [38]. Therefore, the relationship between agglomeration externalities and HQD may be nonlinear.
On the basis of the above analysis, this study proposes the following hypothesis:
H1: 
The impact of agglomeration externalities on HQD is heterogeneous and likely to be nonlinear.

2.2. Network Externalities and the Impact of HQD

As nodes in the network, cities interact with each other to produce externalities [39]. Empirical studies show that the spatial spillover effects of urban network externalities include “borrowed size” and “agglomeration shadow” [11], and the existing research on network externalities also focus on these two aspects [40]. Borrowed size indicates a small city benefitting from the development of big cities through the network with the aid of the radiation effect, thus promoting its development. Specifically, the urban network enables elements to have larger geographical spatial range flows, resulting in a spillover effect that can promote the development of the city itself and its surrounding cities. Agglomeration shadow indicates that a small city is affected by the siphoning effect of neighboring big cities, which limits their own development. Thanks to network externalities, cities can co-operate with other cities and borrow the services or functions of other cities to promote their own development [29]. Of course, cities cannot always benefit from network externalities, which also include negative externalities. Small and medium-sized cities may suffer from competition effects due to their proximity to big cities, leading to worse development [11,41]. Therefore, the externalities of urban networks can have a positive impact on HQD through the “borrowed size” effect or a negative impact on HQD through the “agglomeration shadow” effect.
On the basis of the above analysis, this study proposes the following hypotheses:
H2: 
When the “borrowing size” effect is stronger than the “agglomeration shadow” effect, urban network externalities can promote HQD to a certain extent.
H3: 
When the “agglomeration shadow” effect is stronger than the “borrowing size” effect, urban network externalities can inhibit HQD to a certain extent.
In summary, the theoretical framework constructed in this study is shown in Figure 1. Cities are interconnected and interact with each other to generate externalities. Among them, agglomeration externalities generated by urban internal connections are limited by geographical space, whereas network externalities generated by urban external connections are not. Among them, agglomeration externalities are mainly measured by the density of urban economic activity, while network externalities are determined by complex networks. In addition, the entropy method is adopted to measure the high-quality development level (HQDL) of the cities. On this basis, the spatial econometric model is used to explore the impact of externalities on HQD, which requires empirical research at the scale of urban agglomeration. Therefore, this study takes the urban agglomeration in the middle reaches of the Yangtze River as the case area for empirical analysis.

3. Research Area and Methods
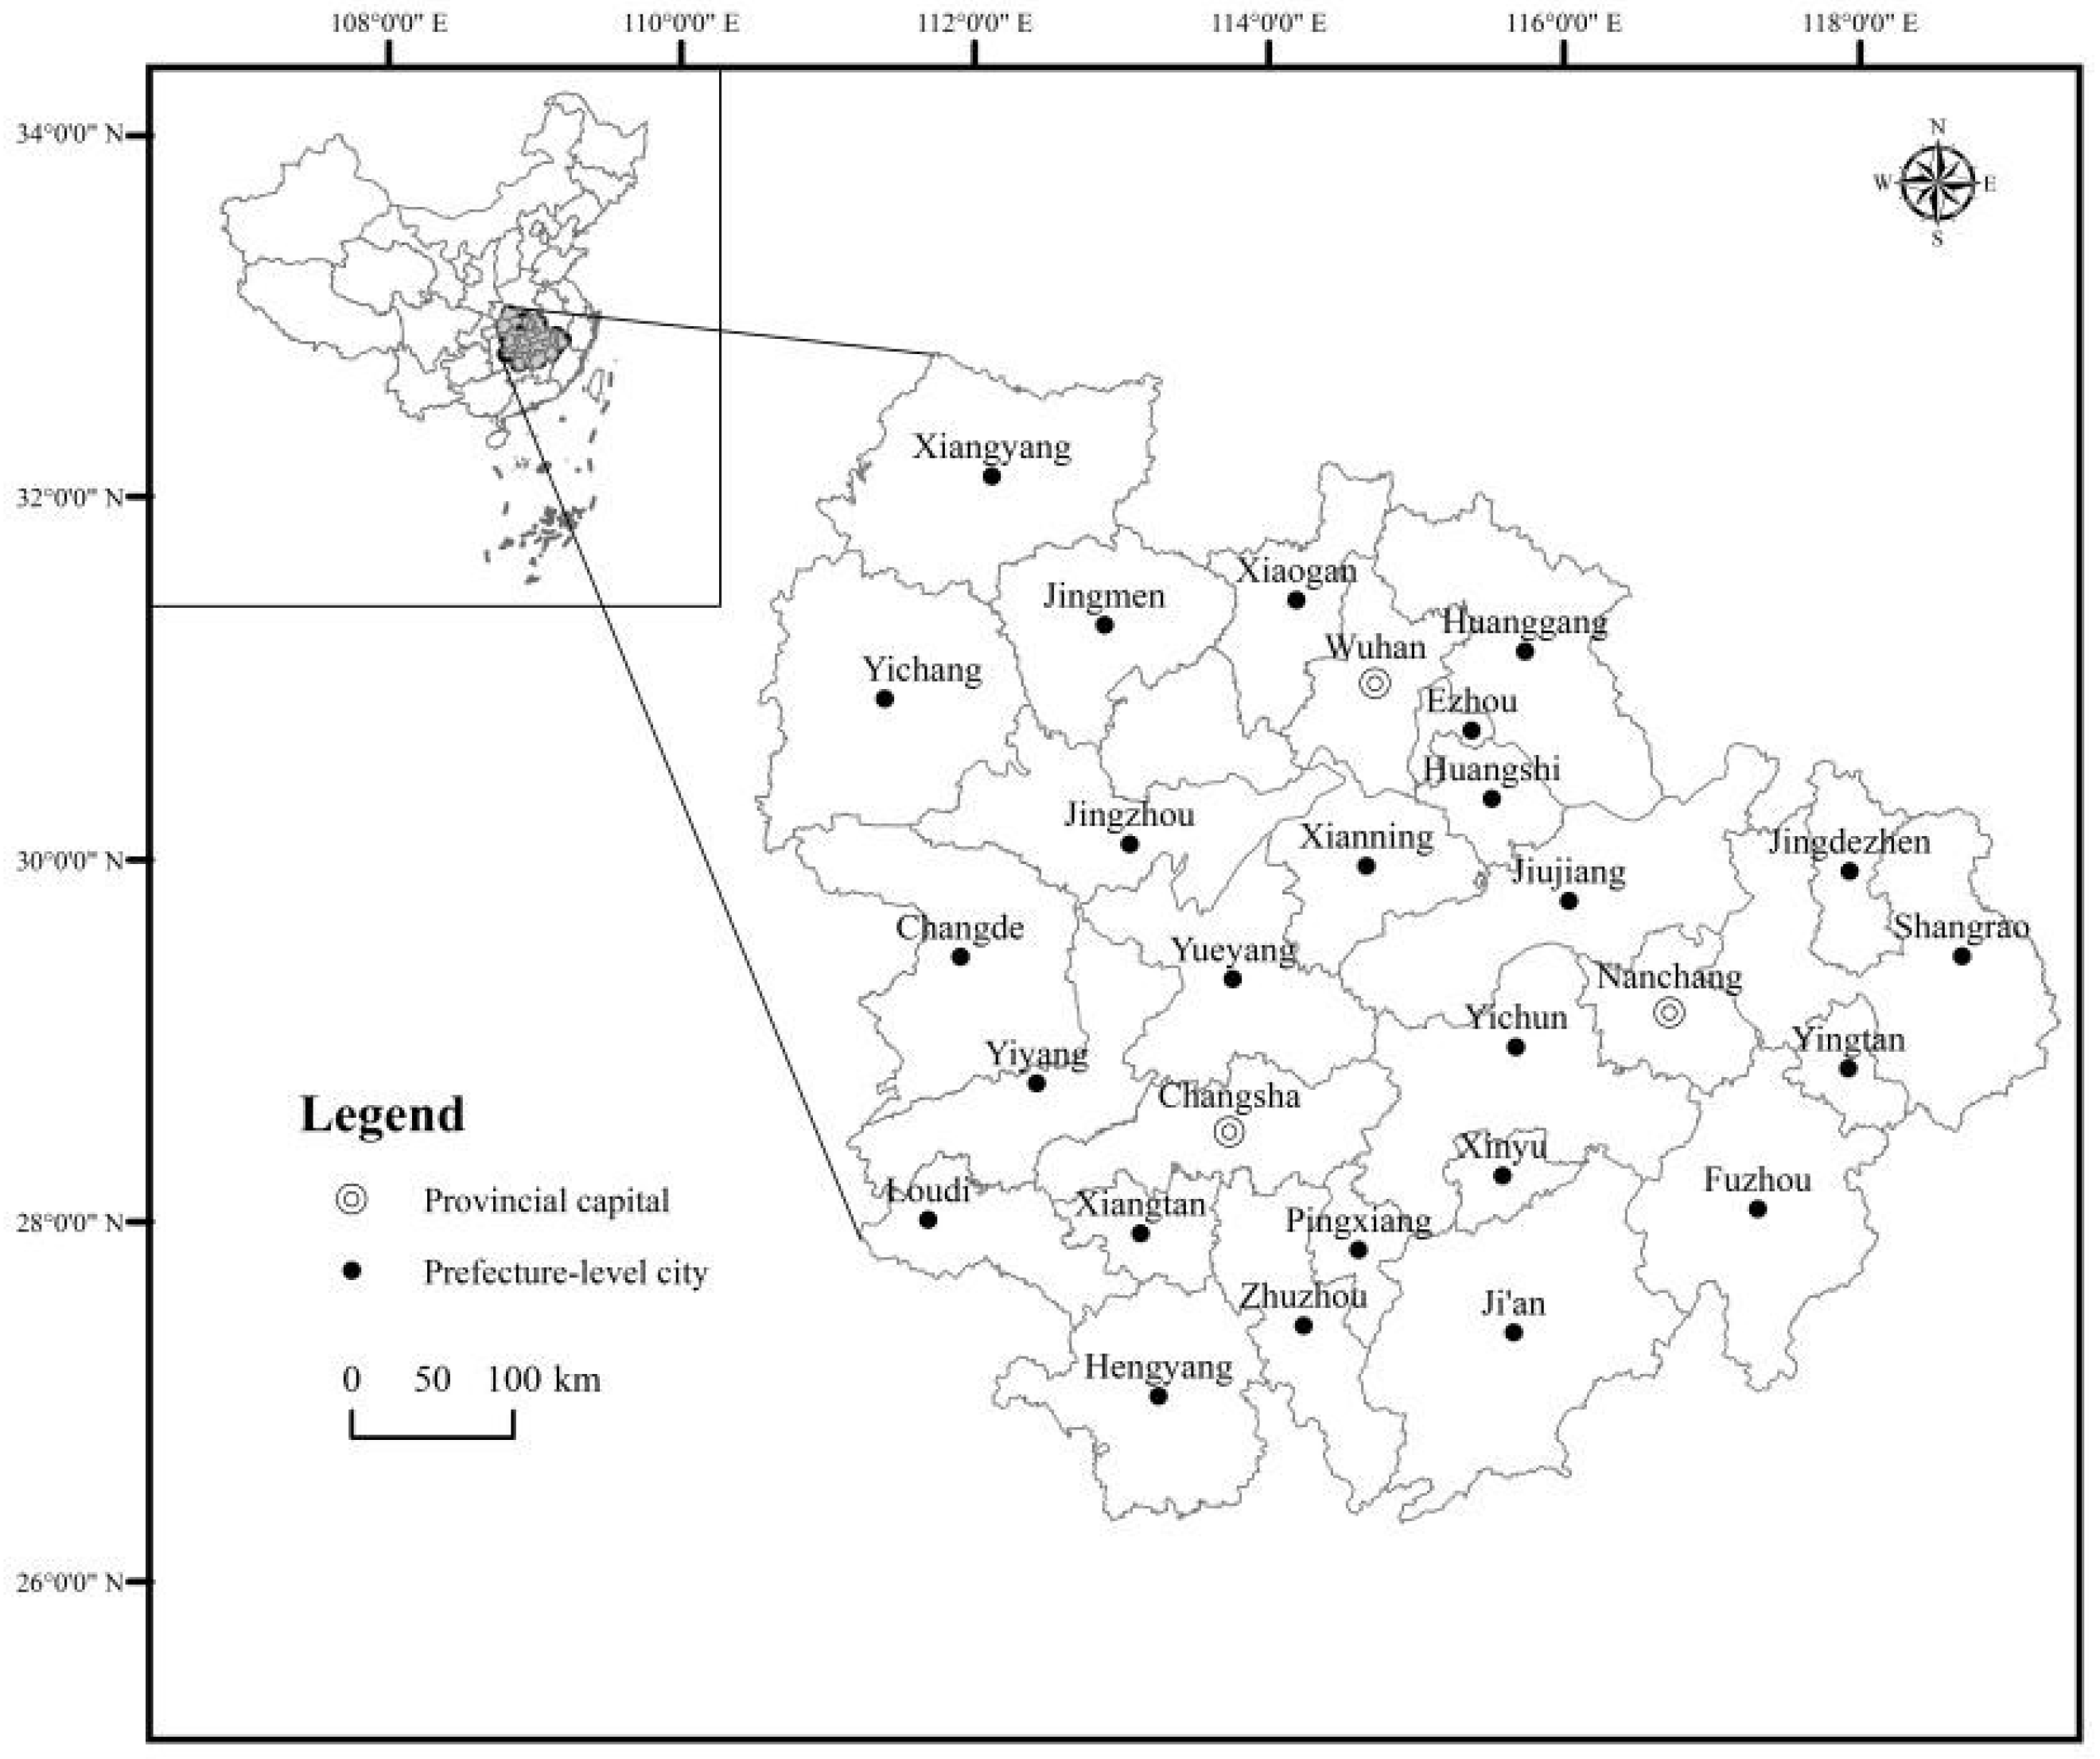
3.1. Study Area

The urban agglomeration in the middle reaches of the Yangtze River is in the central region of China, with the role of bearing the east, enlightening the west, and connecting the north and the south. It is an important area for the rising strategy of central China and the industrial transfer of the east [42]. With the Wuhan Metropolitan circle, the Changzhou–Zhuzhou–Xiangtan urban agglomeration, and the Poyang Lake urban agglomeration as the main body, it comprises 31 cities in three provinces. Among them, Xiantao, Qianjiang, and Tianmen are county-level cities under direct jurisdiction, where some data are difficult to obtain. In order to ensure the consistency and scientific nature of the research, we eliminated these cities. Therefore, the basic regional unit of the study involved 28 prefecture-level cities (Figure 2). In 2020, the total population of these cities in the urban agglomeration in the middle reaches of the Yangtze River reached 123 million, the GDP of the region exceeded CNY 9 trillion, and the per capita GDP reached CNY 69,800. This is a huge region with a dense population, extensive transportation, and substantial economic activities [43].

3.2. Variable Measures and Descriptions

3.2.1. Explained Variables

The explanatory variable was the level of HQD. At present, there are abundant studies on the connotations and measurements of HQD, and it is believed that HQD includes five dimensions: innovation, co-ordination, green, opening, and sharing [44,45,46]. These five dimensions form the outline of HQD, which meets the self-needs of the people for comprehensive development in the new era and the requirements for comprehensive and sustainable social development [47]. Therefore, following the scientific research principle, as well as China’s “13th Five-Year Plan for National Economic and Social Development Compendium” (http://www.xinhuanet.com//politics/2016lh/2016-03/17/c_1118366322.htm, accessed on 30 April 2022), and starting from the five development concepts, the evaluation index system of HQD was constructed (Table 1). The innovation is the primary driving force for HQD [48], including innovation environment and innovation output. Co-ordination is an inherent requirement for sound regional development [49]. Co-ordinated development between cities and integrated development between urban and rural areas are essential for HQD and include urban–rural co-ordination, industrial structure co-ordination, economic stability, and inflation degree. The green is an inevitable condition for maintaining HQD [50] and includes resource consumption and green environmental protection. The opening is the only way for a country to prosper and develop [51] and includes foreign investment, foreign trade, transportation, and communication. The sharing is the fundamental purpose of HQD [52] and the essential requirement of socialism with Chinese characteristics. It emphasizes “putting people first” and includes seven aspects: people’s livelihood, cultural welfare, medical welfare, educational welfare, transportation facilities, infrastructure, and living conditions. The index of advanced industrial structure is measured by the ratio between the secondary industry and the tertiary industry, while the Theil index is used to measure the rationalization level of industrial structure [53].

3.2.2. Explanatory Variables

The explanatory variables were agglomeration externalities and network externalities.
(1) Agglomeration Externalities
In this study, economic activity density was used to measure the economic level of urban agglomeration [54], and the total urban passenger transport density (annual total bus passenger transport/built-up area/annual number of days) was used to represent the density of economic activities (Density). In addition, the square term of density of economic activities (Density2) was introduced to explore whether agglomeration externalities had nonlinear effects on HQD.
(2) Network Externalities
Because an urban network is a complex system, it is difficult to fully reflect the relationship between cities using a single element. Therefore, urban information, innovation, and economic ties mediating the construction of the information network, innovation network, and economic network were considered [55]. As the main transportation modes within an urban agglomeration are highways and railways, the sum of the road distance and railway distance was used to replace the straight-line distance. On this basis, the entropy method was used to determine the weight of each network to construct an undirected weighted integrated network. The weighted degree centrality (Degree) was selected to represent network externalities; the calculation formula is shown in Table 2.

3.2.3. Control Variables

(1) Government capacity (Gov). This variable encompasses fiscal expenditure to provide financial support for regional development, promote the improvement of infrastructure, and siphon multiple factors to promote HQD [56]. The ratio of fiscal expenditure to GDP (%) was selected as a proxy variable.
(2) Innovation efficiency (Innovation). Scientific and technological innovation helps optimize resource allocation, improve resource utilization efficiency, and promote industrial optimization and upgrading, thus promoting HQD of the region [56]. The ratio of the number of patent grants to the number of patent applications (%) was selected as a proxy variable.
(3) Level of digital economy development (Digital). The digital economy has gradually become a new driving force of social and economic development. The digital economy is conducive to improving factor productivity, as well as the quality of regional development [17]. The per capita telecom traffic (CNY) was selected as a proxy variable.
(4) Level of opening to the outside world (Opening). The introduction of science and technology and foreign investment has changed the conditions of capital formation, promoted a change in regional technology and trade structure, and promoted the HQD of cities. In addition, introducing technology and trade has provided good opportunities for China’s development and more job opportunities for its residents [57,58]. The proportion of actual utilized foreign investment in GDP (%) was selected as a proxy variable.
In order to reduce the impact of heteroscedasticity on the regression results, the control variables were processed logarithmically on the basis of determining variables. The statistical characteristics of the variables are shown in Table 3.

3.3. Data Sources

The data in this paper mainly came from four sources. Firstly, Baidu index data were obtained from the official website of the Baidu index (http://index.baidu.com; collected on 10–15 January 2022), using 28 prefecture-level cities in the urban agglomeration in the middle reaches of the Yangtze River as search keywords. The average daily attention data of two cities in the middle reaches of Yangtze River urban agglomeration from 1 January 2011 to 31 December 2020 were retrieved, and the urban information network was constructed. Secondly, mileage data constituted expressway mileage and railway mileage data. The expressway mileage data between the 28 cities in the middle reaches of the Yangtze River urban agglomeration were mainly obtained through the Baidu map official website (https://map.baidu.com; collected on 13 January 2022). The railway mileage data between two cities were obtained from the train network (http://www.huochepiao.com/licheng/; collected on 19 January 2022). Thirdly, coauthored papers were retrieved from the Web of Science database (http://webofscience.com; collected on 11–13 February 2022). The number of coauthored papers involving the two cities from 2011 to 2020 was retrieved to characterize the urban innovation network. Lastly, socioeconomic statistical data were mainly sourced from the Statistical Yearbook of Jiangxi Province, the Statistical Yearbook of Hubei Province, the Statistical Yearbook of Hunan Province from 2012 to 2021, the Statistical Yearbook of China’s Urban Construction from 2011 to 2020, and the Statistical Bulletin of the 28 prefecture-level cities in the middle reaches of the Yangtze River urban agglomeration.

3.4. Research Methods

3.4.1. Social Network Analysis

Social network analysis can be used to effectively explore the structural characteristics of urban networks, and it has been widely used in urban network research in recent years. This study mainly selected statistical indices such as network density, clustering coefficient, average path length, and degree centrality to explore the complexity of the integrated network of the urban agglomeration in the middle reaches of the Yangtze River [59] (Table 2).

3.4.2. Entropy Method

The entropy method can calculate the objective weight of each index and avoid the deviation caused by subjective weight assignment to a certain extent [60]. It is widely used in scientific research [61,62]. In this study, the entropy method was used to calculate the weight of each indicator of urban high-quality development and the weight of each subnetwork of the urban integrated network. The HQDL and the integrated network of the urban agglomeration in the middle reaches of the Yangtze River were obtained according to the weight and standardized value. Please refer to the relevant literature for calculation steps [63].

3.4.3. Spatial Econometric Model

Spatial econometric models can fully consider the spatial correlation of variables, and common spatial econometric models include the spatial lag model (SLM), spatial error model (SEM), and spatial Durbin model (SDM) [56]. SDM can consider the spatial correlation of explanatory variables and the spatial correlation of explained variables. It can be considered that SDM is an improvement of the SLM and the SEM [64].
First, the benchmark regression model was constructed as follows:
H Q D i t = β 0 + β 1 × D e n s i t y i t + β 2 × D e n s i t y 2 i t + β 3 × D e g r e e i t + β 4 × ln   G o v i t + β 5 × ln   I n n o v a t i o n i t + β 6 × ln   D i g i t a l i t + β 7 × ln   O p e n i n g i t + ε .
With the development of regional integration, The HQD has a certain degree of spatial correlation; that is, HQD can be affected by the development status of surrounding cities. Therefore, the spatial spillover effect of HQD should be considered when considering the impact of agglomeration externalities and network externalities on HQD. To summarize, the SLM, SEM, and SDM were constructed in order to select the best regression model.
Spatial lag model (SLM):
H Q D i t = ρ W H Q D i t + β 0 + β 1 × D e n s i t y i t + β 2 × D e n s i t y 2 i t + β 3 × D e g r e e i t + β 4 × ln   G o v i t + β 5 × ln   I n n o v a t i o n i t + β 6 × ln   D i g i t a l i t + β 7 × ln   O p e n i n g i t + ε .
Spatial error model (SEM):
H Q D i t = β 0 + β 1 × D e n s i t y i t + β 2 × D e n s i t y 2 i t + β 3 × D e g r e e i t + β 4 × ln   G o v i t + β 5 × ln   I n n o v a t i o n i t + β 6 × ln   D i g i t a l i t + β 7 × ln   O p e n i n g i t + μ                     μ = λ W × μ + ε .
Spatial Durbin model (SDM):
H Q D i t = ρ W H Q D i t + β 0 + β 1 × D e n s i t y i t + β 2 × D e n s i t y 2 i t + β 3 × D e g r e e i t + β 4 × ln   G o v i t + β 5 × ln   I n n o v a t i o n i t + β 6 × ln   D i g i t a l i t + β 7 × ln   O p e n i n g i t + ρ 1 × W D e n s i t y i t + ρ 2 × W D e n s i t y 2 i t + ρ 3 × W D e g r e e i t + ρ 4 × W ln   G o v i t + ρ 5 × W ln   I n n o v a t i o n i t + ρ 6 × W ln   D i g i t a l i t + ρ 7 × W ln   O p e n i n g i t + ε i t .
Above, β0 is the constant term, β1–β7 are the parameters to be estimated, ρ and ρ1–ρ7 are the spatial lag coefficients, λ is the spatial error term coefficient, μ and ε are disturbance terms, i is the city, t is the time, and W is the spatial weight matrix. The commonly used spatial weight matrices include the adjacency matrix (W1), economic geographic matrix (W2), and population geographic matrix (W3). The calculation formula is as follows:
Adjacency matrix (W1):
W 1 = { 1 c i t y   i   i s   a d j a c e n t   t o   c i t y   j 0 c i t y   i   i s   n o t   a d j a c e n t   t o   c i t y   j ,
Economic geographical distance matrix (W2):
W 2 = { ( P i × P j ) / d i j 2 i j 0 i = j ,
Population geographical distance matrix (W3):
W 3 = { ( Q i × Q j ) / d i j 2 i j 0 i = j ,
Here, Pi and Pj, respectively, represent the average per capita GDP of city i and city j after the GDP deflator was subtracted from 2011 to 2020; Qi and Qj, respectively, represent the average population of city i and city j at the end of 2011–2020. Dij is the sum of the road distance and railway distance between city i and city j. In the empirical analysis, considering that the adjacency matrix is the most concise and widely used compared with other matrices, it was selected as the reference matrix for relevant tests and introduced into the spatial econometric model. The economic geographic matrix and population geographic matrix were used in the robustness test of the model.

3.4.4. Spatial Effect Decomposition

Since the point estimation method has some defects in explaining the spatial effects, this study used a partial differential method [65] to decompose the total effects of agglomeration externalities and network externalities on HQD [66]. The above spatial econometric model can be rewritten as:
Y = ( I k W ) 1 ( X β + W X θ ) + R ,
Here, R is the remaining term, including the intercept and error term. For the explanatory variable and the control variable X, the partial derivative matrix of the expected value of the corresponding explained variable Y can be written as:
[ E ( Y ) x 1 k ( Y ) x N k ] = [ E ( y 1 ) x 1 k E ( y 1 ) x N k E ( y N ) x i k E ( y N ) x N k ] = ( I k W ) 1 [ β k w 12 θ k w 1 N θ k w 21 θ k β k w 2 N θ k w N 1 θ k w N 2 θ 2 β k ] ,
Here, the elements on the diagonal of the matrix at the right end represent the average influence of the explanatory variable and the control variable X on explained variable Y in this region, i.e., the direct effect; the elements on the nondiagonal line represent the average influence of the explanatory variable and the control variable X on the explanatory variable and control variable X in the neighboring region, i.e., the indirect effect.

4. Results

4.1. Spatial and Temporal Pattern of Urban Network and HQD

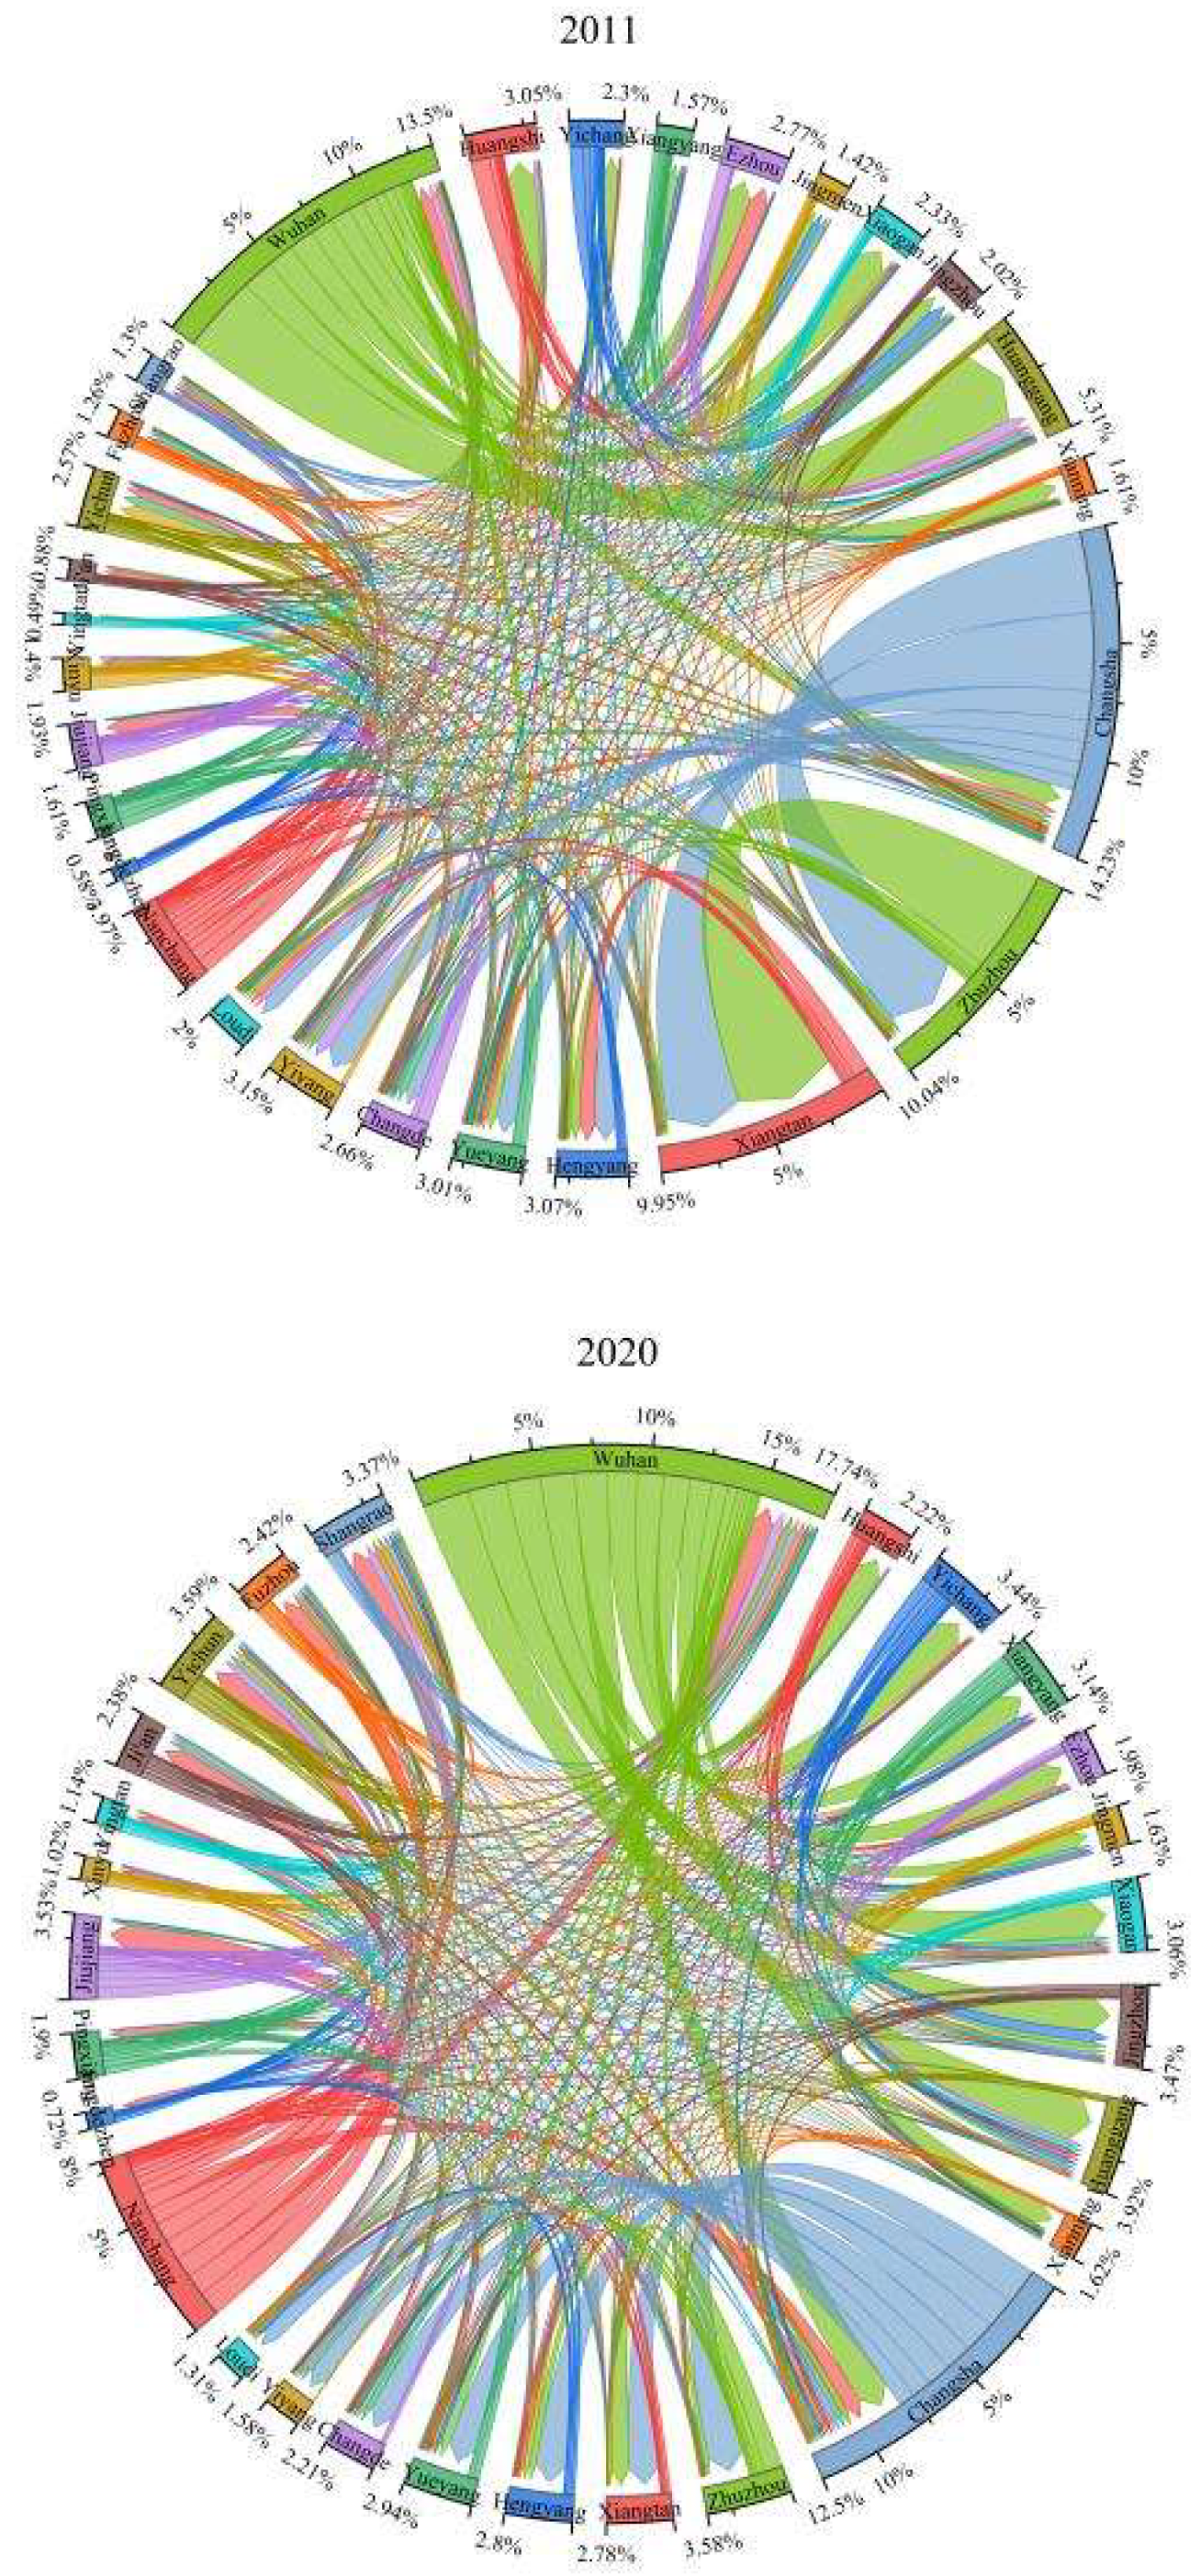
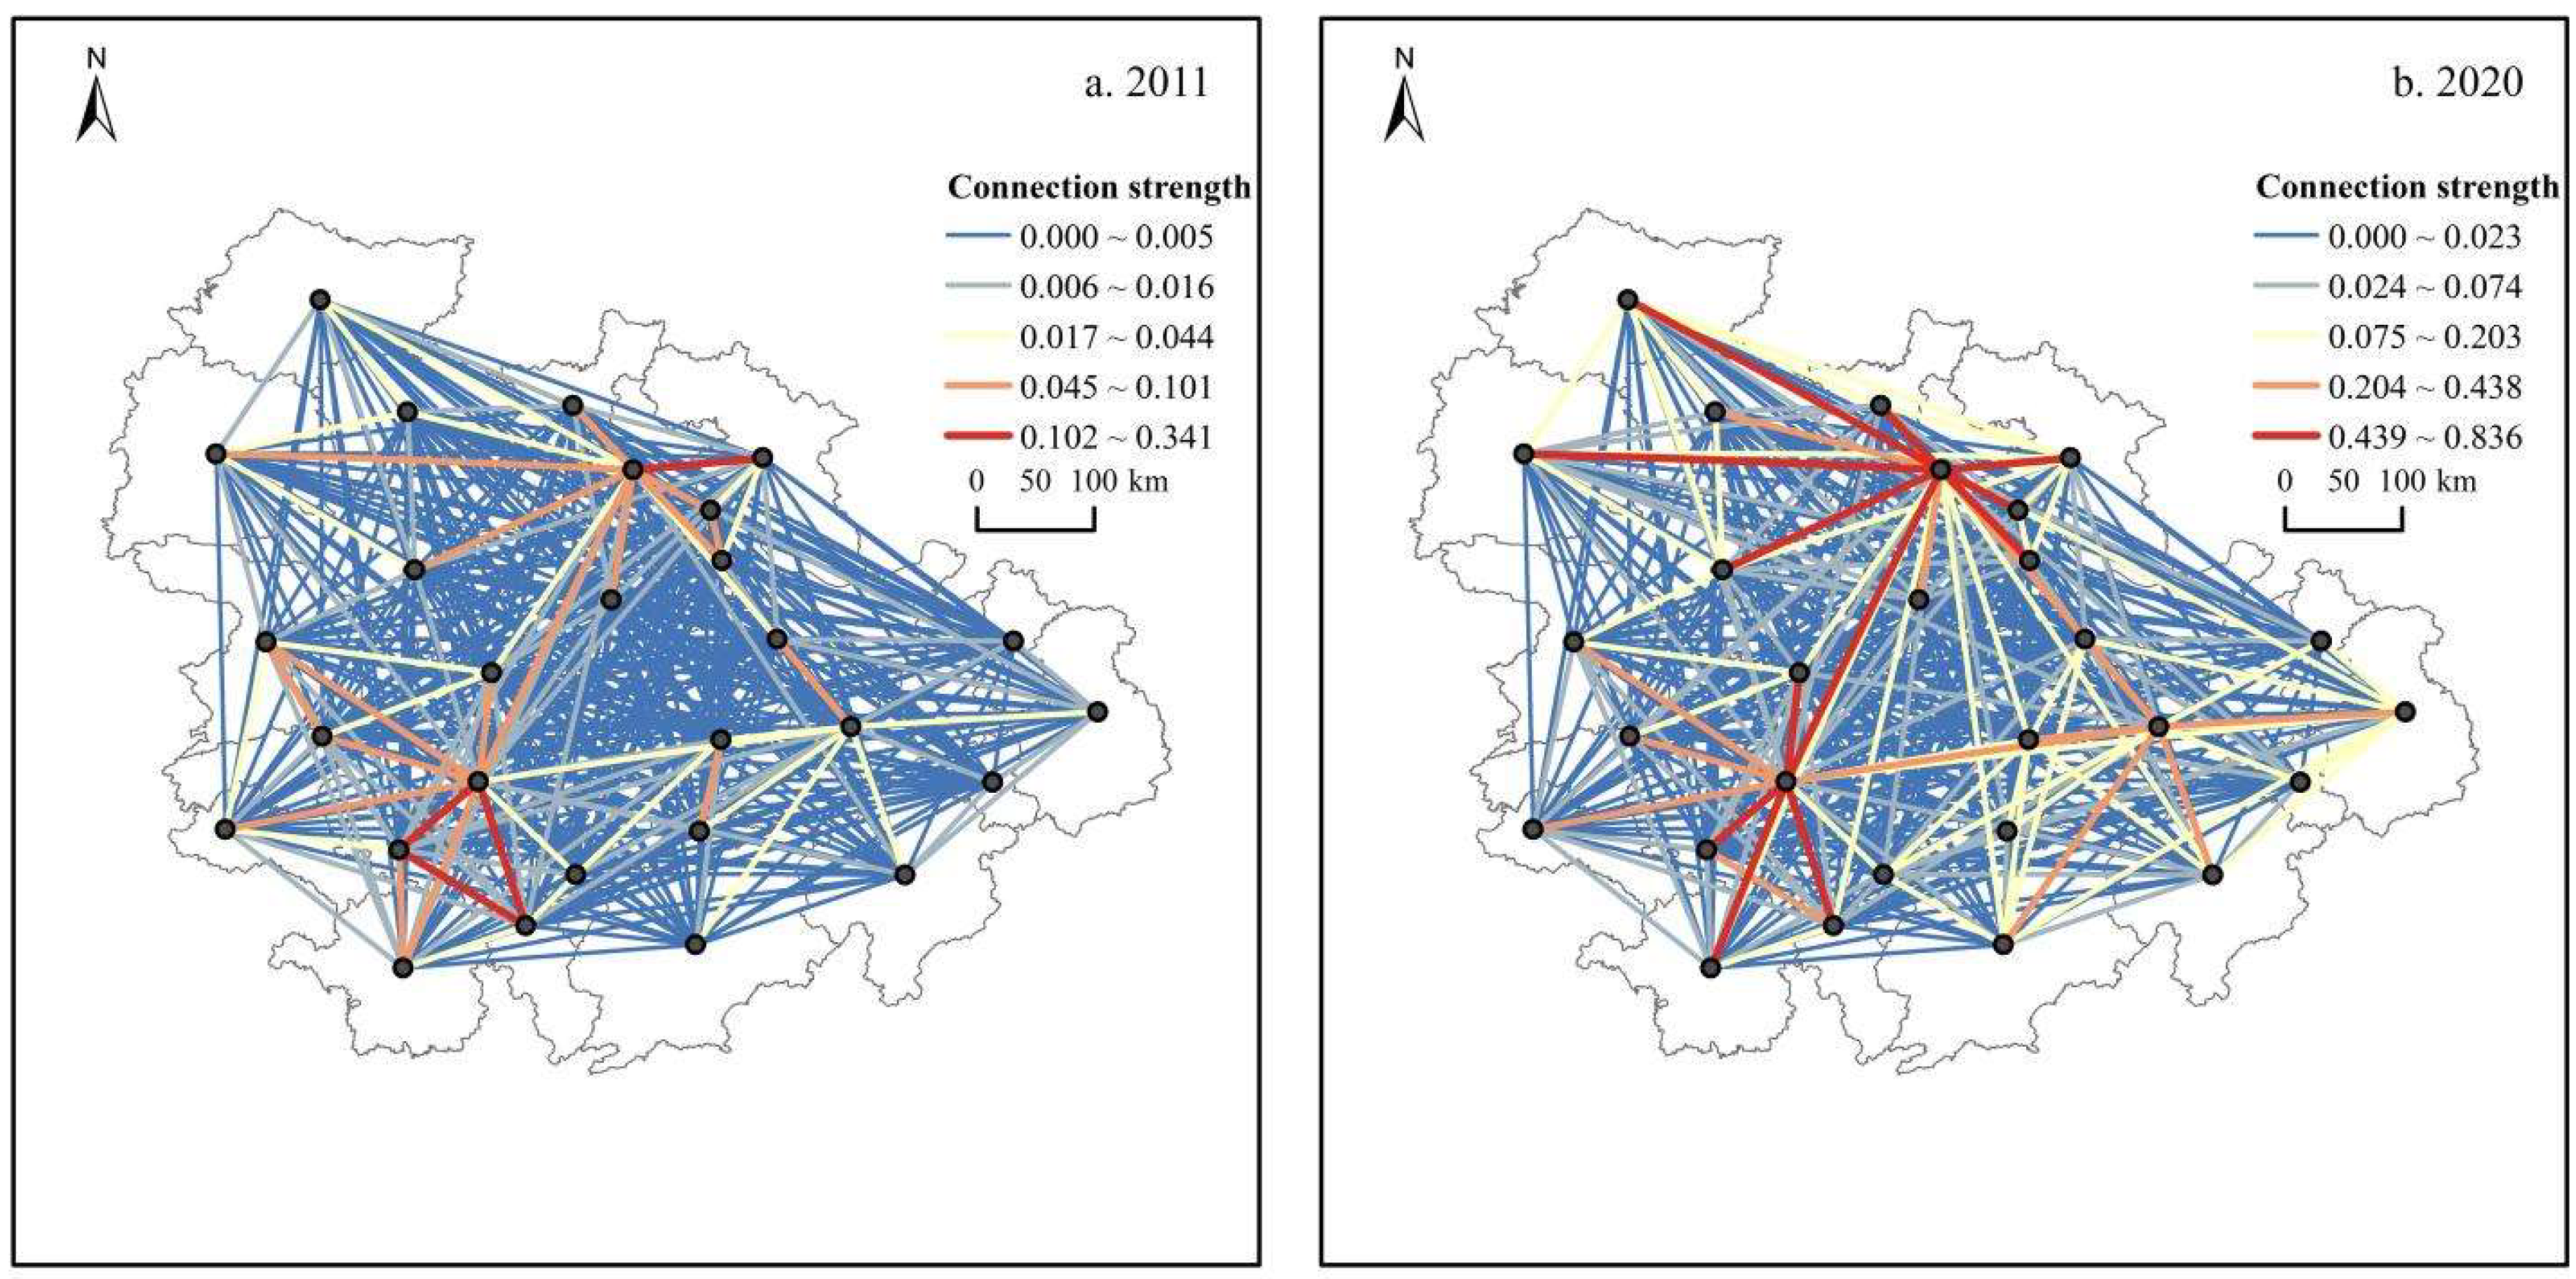
4.1.1. Spatial and Temporal Patterns of Urban Network

(1) Overall Characteristics of Urban Network
According to Gephi software, the average path length of the integrated network in urban agglomeration decreased from 2.331 in 2011 to 1.950 in 2020, and the connectivity of the urban integrated network improved, along with the spatial organization performance and efficiency of the network. The clustering coefficient increased from 0.699 in 2011 to 0.804 in 2020, the connection between cities was gradually tightened, and the degree of agglomeration increased to some extent. Compared with the China and Japan airline port shipping network in 2015 (with average path length of 2.769, clustering coefficient of 0.330) [67] and the innovation network in China’s coastal areas in 2017 (with average path length of 4.733, clustering coefficient of 0.233) [68], the average path length was smaller and the clustering coefficient was larger. This shows that the small-world characteristics of the urban agglomeration integrated network were more significant and had better agglomeration and connectivity performance.
(2) Temporal Evolution of Urban Network
In order to better analyze the change in association between cities, the Origin software was used to draw the loop diagram of the integrated network of urban agglomeration in the middle reaches of the Yangtze River according to the flow direction and flow relationship of the elements among urban nodes (Figure 3). Among them, the radian proportion represents the importance of the degree of urban nodes, and the connection direction and width represent the connection intensity between urban nodes. In terms of radians, from 2011 to 2020, the radians of Wuhan and Changsha were both greater than 10%, occupying the top two positions across the time period. This indicated that Wuhan and Changsha occupied the absolute core position in the urban agglomeration, with Wuhan and Changsha as the core radiating outward. In addition, Nanchang’s radian proportion gradually increased to third place in 2020. In terms of connection flow, the flow of urban elements from 2011 to 2020 mainly flowed out from Wuhan, Changsha, and Nanchang, while the number of inflow cities increased, indicating that the integrated urban network was developed in a balanced way. In addition, the geographical relationship was biased significantly, and the connection between cities in the province was closer. In terms of the connection width, the connections between Wuhan and Huanggang and between Changsha and Zhuzhou were relatively close in 2011 and 2020, once again proving that Wuhan and Changsha were important connection hubs of the urban agglomeration.
(3) Urban Network Spatial Distribution Pattern
The integrated network of the urban agglomeration from 2011 to 2020 gradually highlighted a multicore spatial distribution structure with hierarchical nesting characteristics (Figure 4). The network density of the urban integrated network increased from 0.161 in 2011 to 0.233 in 2020, indicating that 23.3% of cities had realized direct connection without transit by 2020, and the connection between urban nodes became gradually closer. However, on the whole, the network density was low, the connection between cities was not close enough, and the connection was relatively weak. In order to better analyze the spatial structure characteristics of the integrated network of the urban agglomeration, the natural breakpoint method was used to divide it into five levels and ArcGIS was used to visually display the integrated network, as shown in Figure 4. From 2011 to 2020, the core framework of the integrated network was gradually formed, presenting a triangular spatial structure with Wuhan, Changsha, and Nanchang as the core, while the connection among the peripheral cities of the urban agglomeration was weak. In addition, the western region of the urban agglomeration was more densely connected, while the eastern region was sparsely connected.
(4) Centrality Characteristics of Urban Nodes
The node centrality in the integrated network of the urban agglomeration from 2011 to 2020 has a hierarchical structure. The weighted degree centrality of each city node was calculated using Matlab software, and the natural breakpoint method was used to classify the weighted degree centrality of urban nodes into four levels. It was found that the city level changed from “4 + 6 + 8 + 10” to “1 + 2 + 13 + 12”, presenting a “pyramid” structure (Figure 5). Specifically, the urban hub of the urban agglomeration changed from Changsha, Wuhan, Zhuzhou, and Xiangtan in 2011 to Wuhan in 2020. Wuhan remained at the top of the pyramid structure throughout the time period, holding a relatively advantageous position in the urban agglomeration.

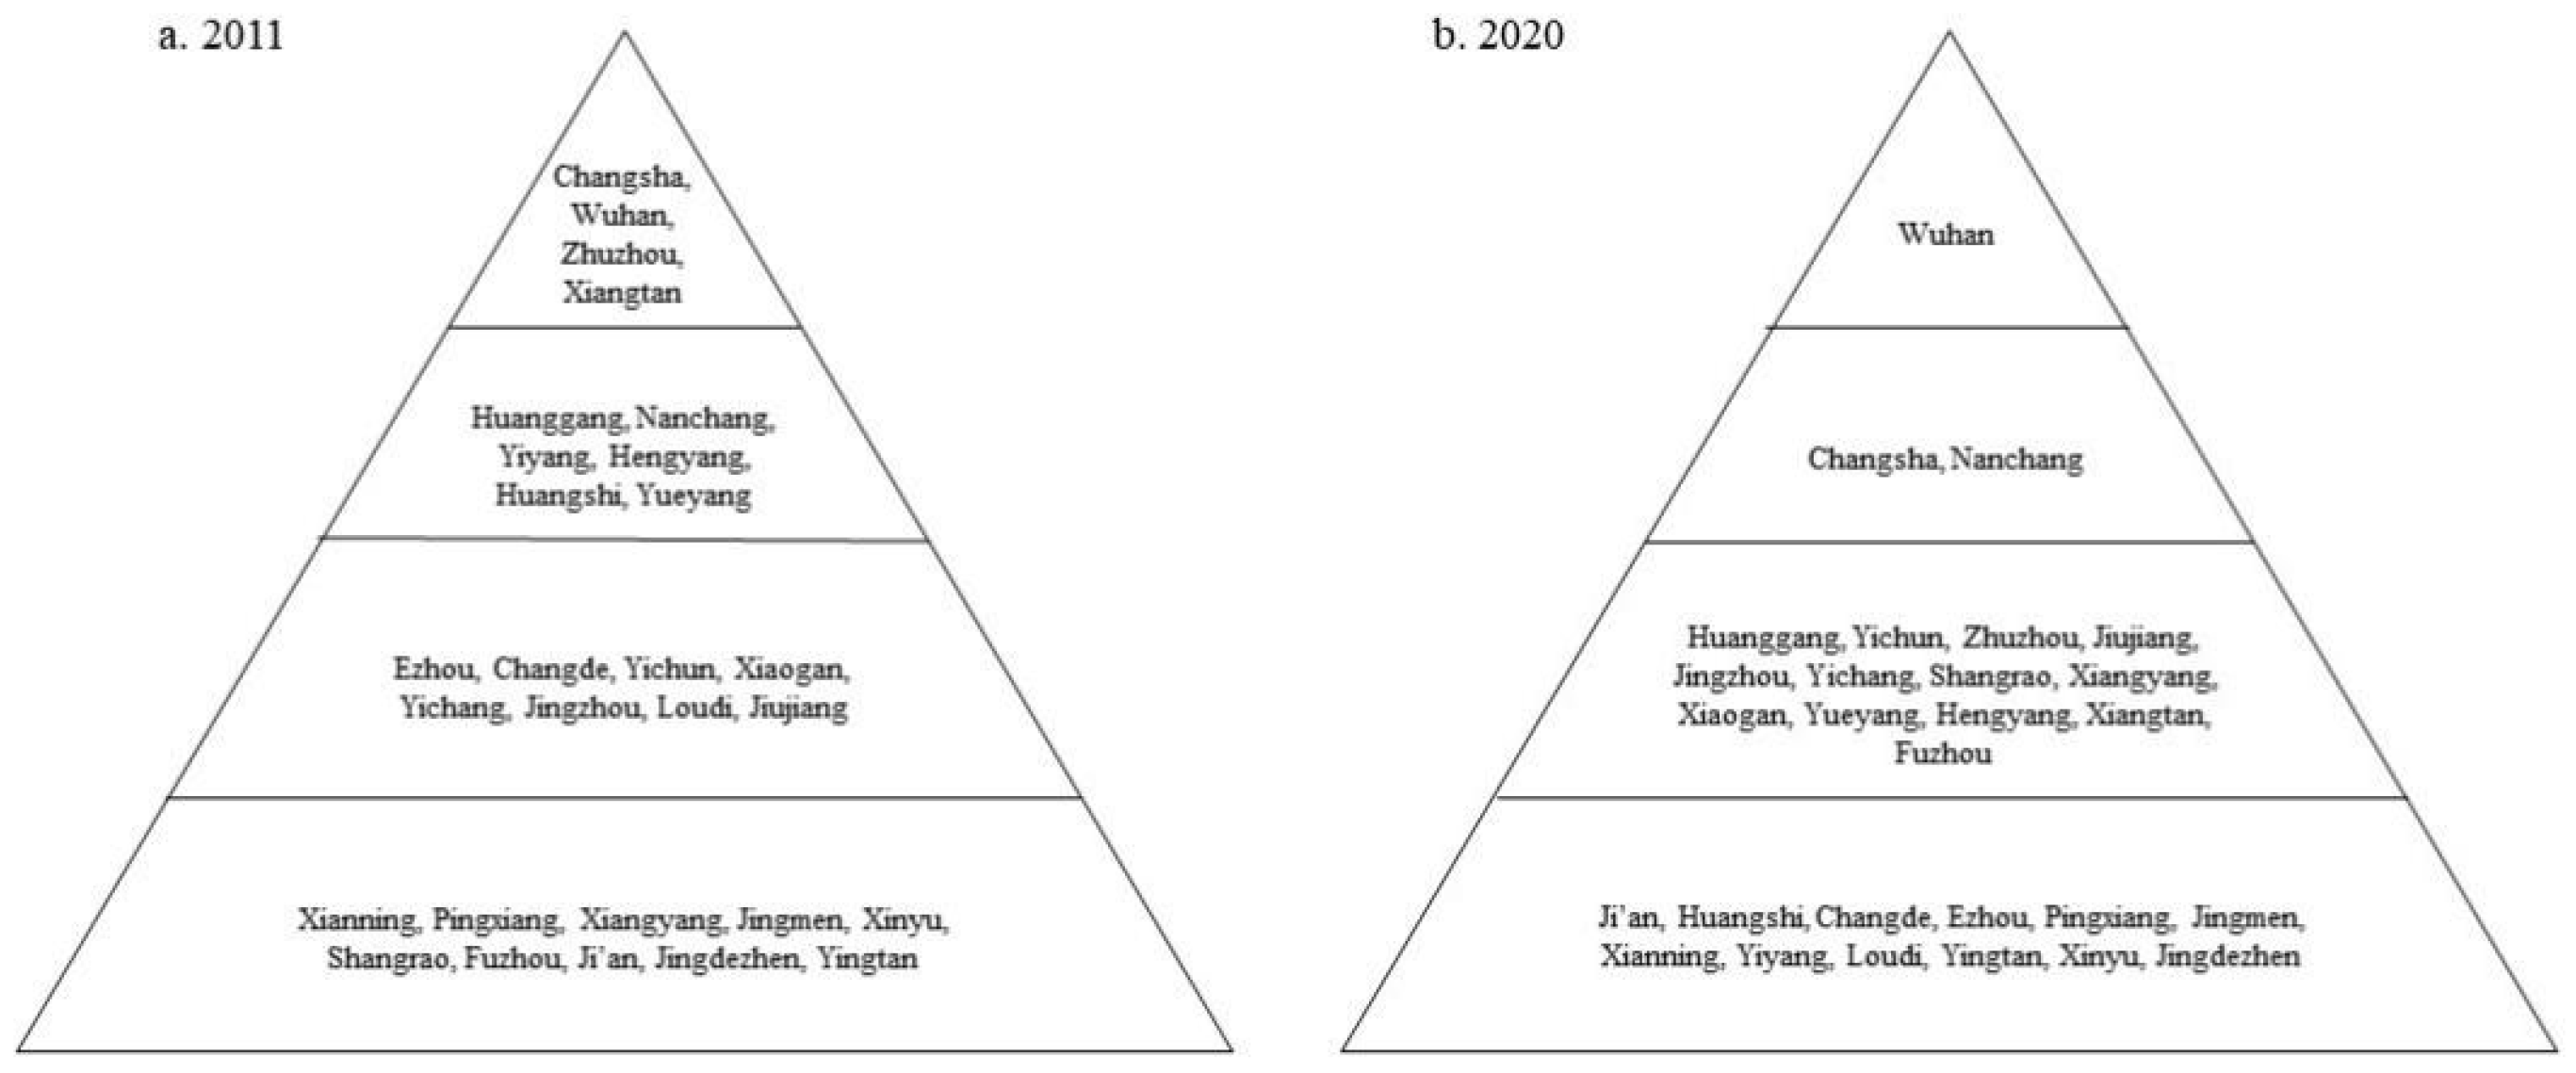
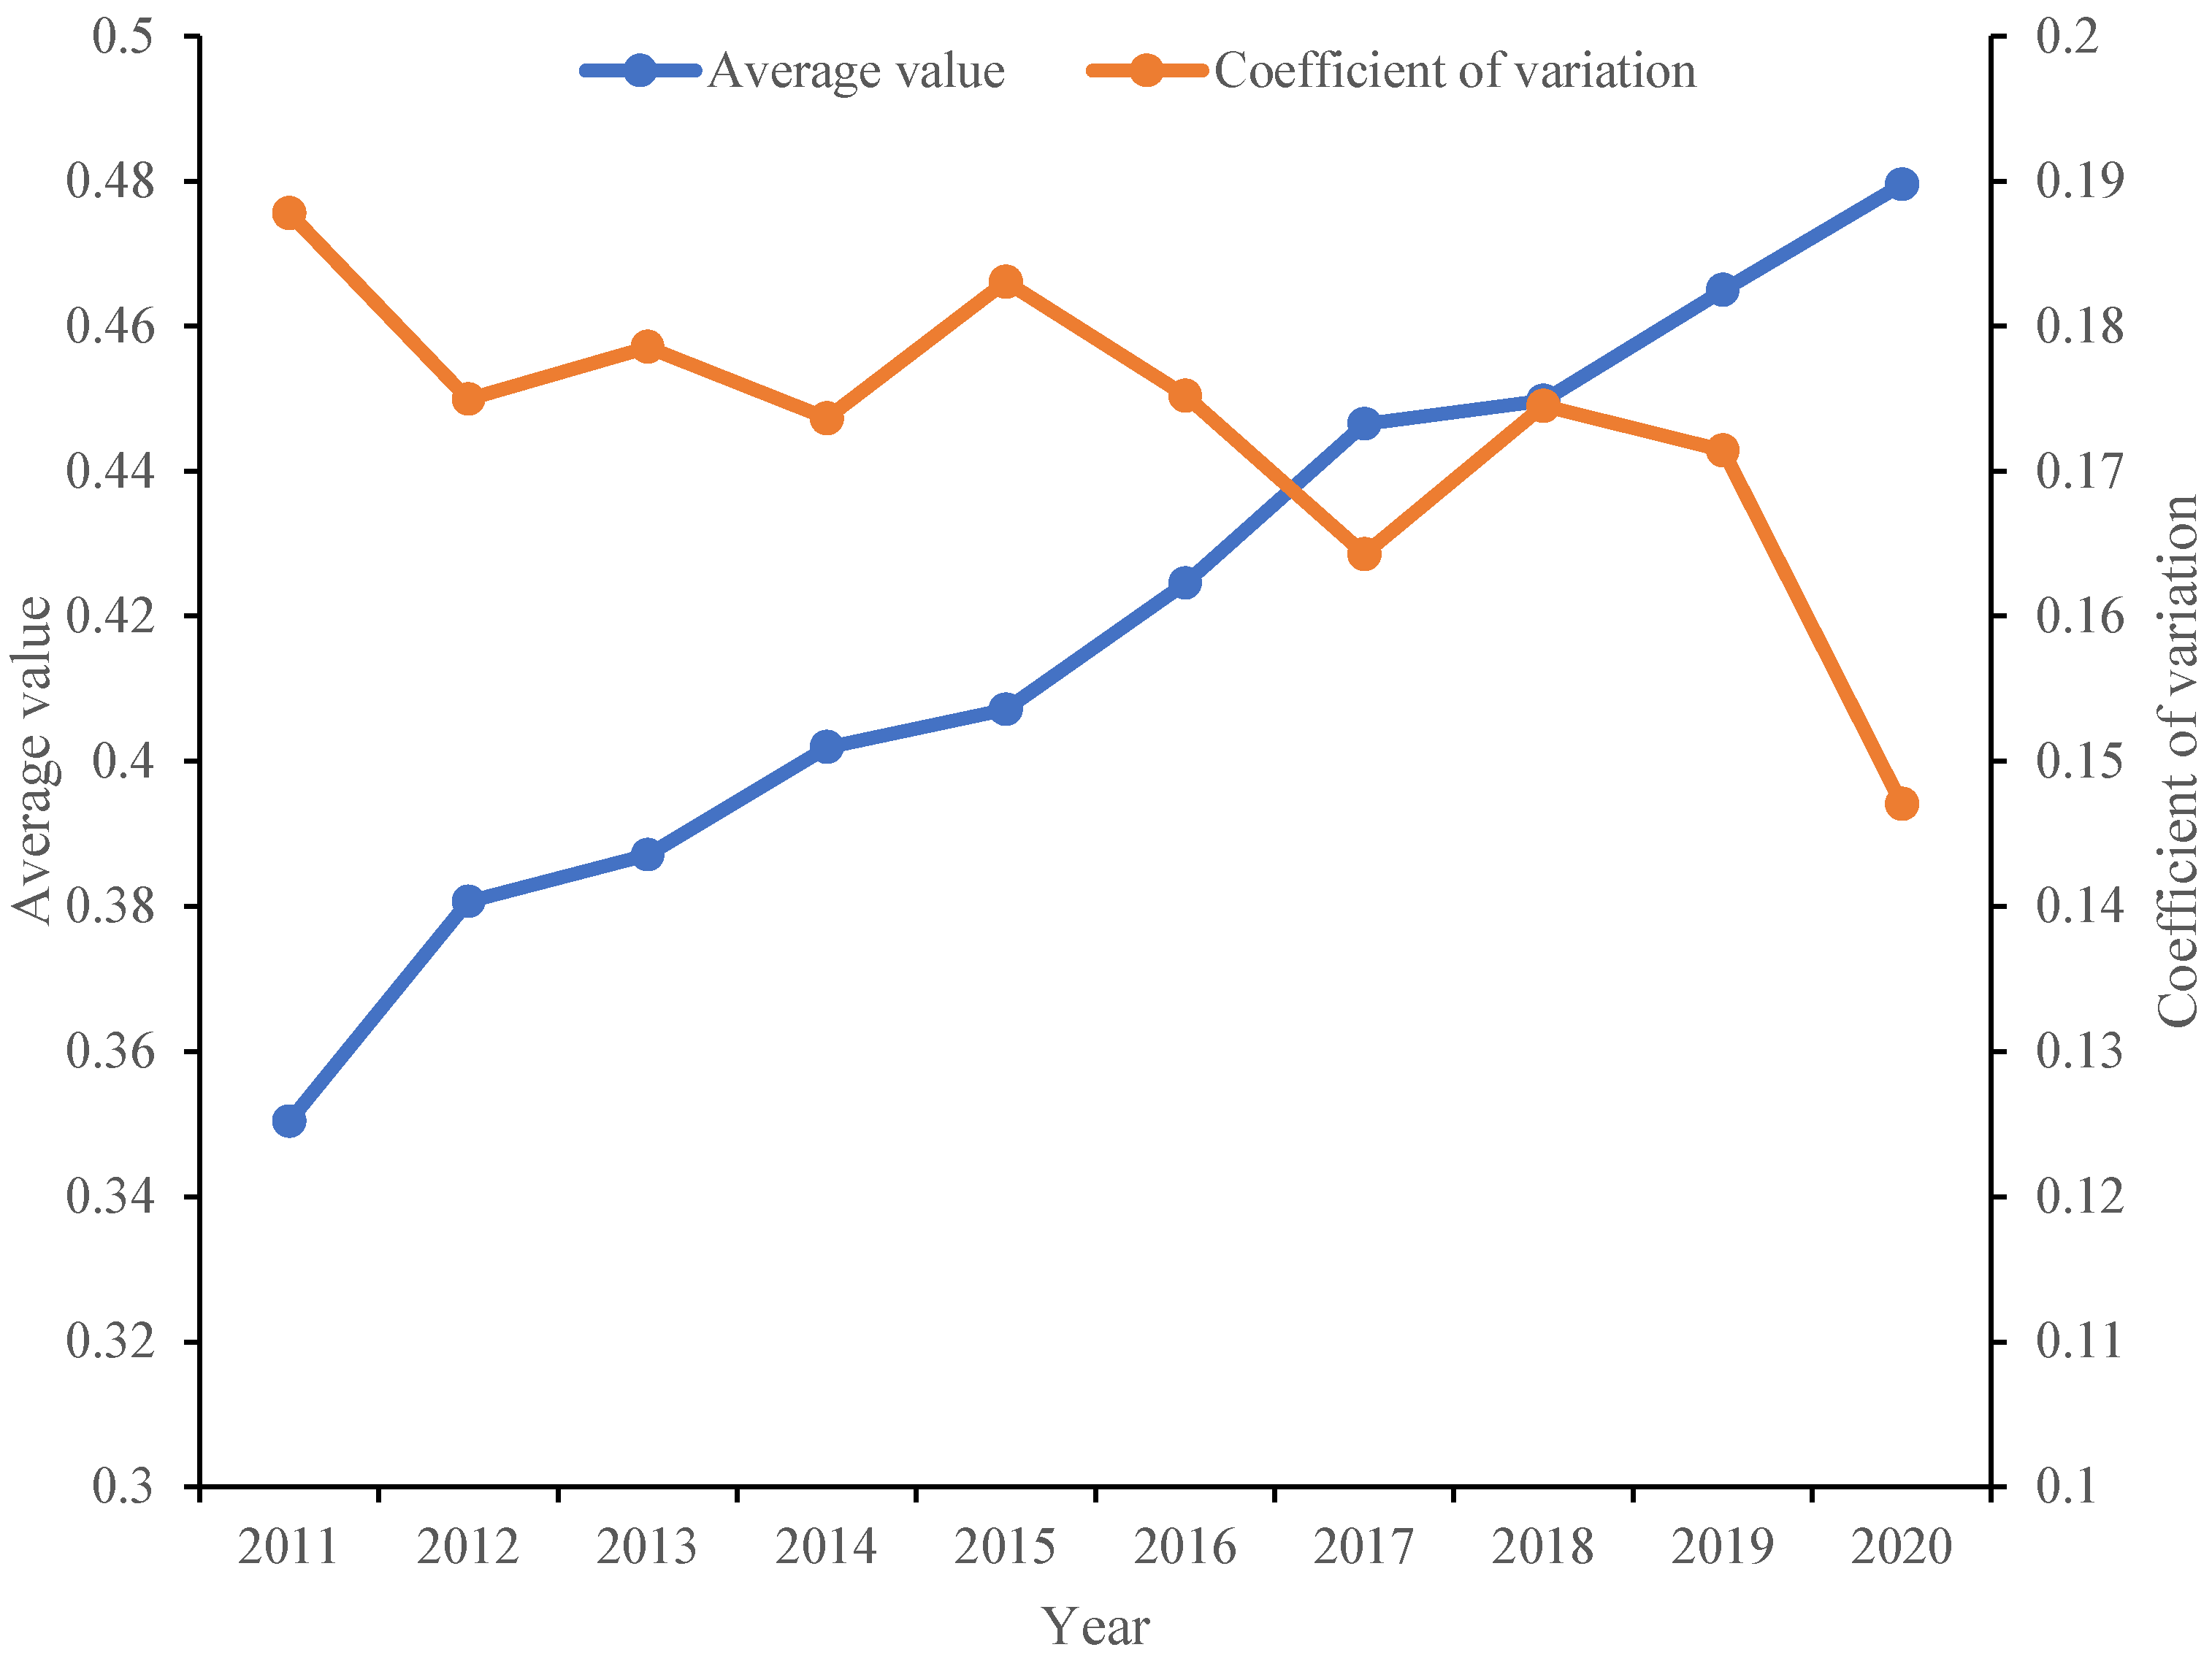
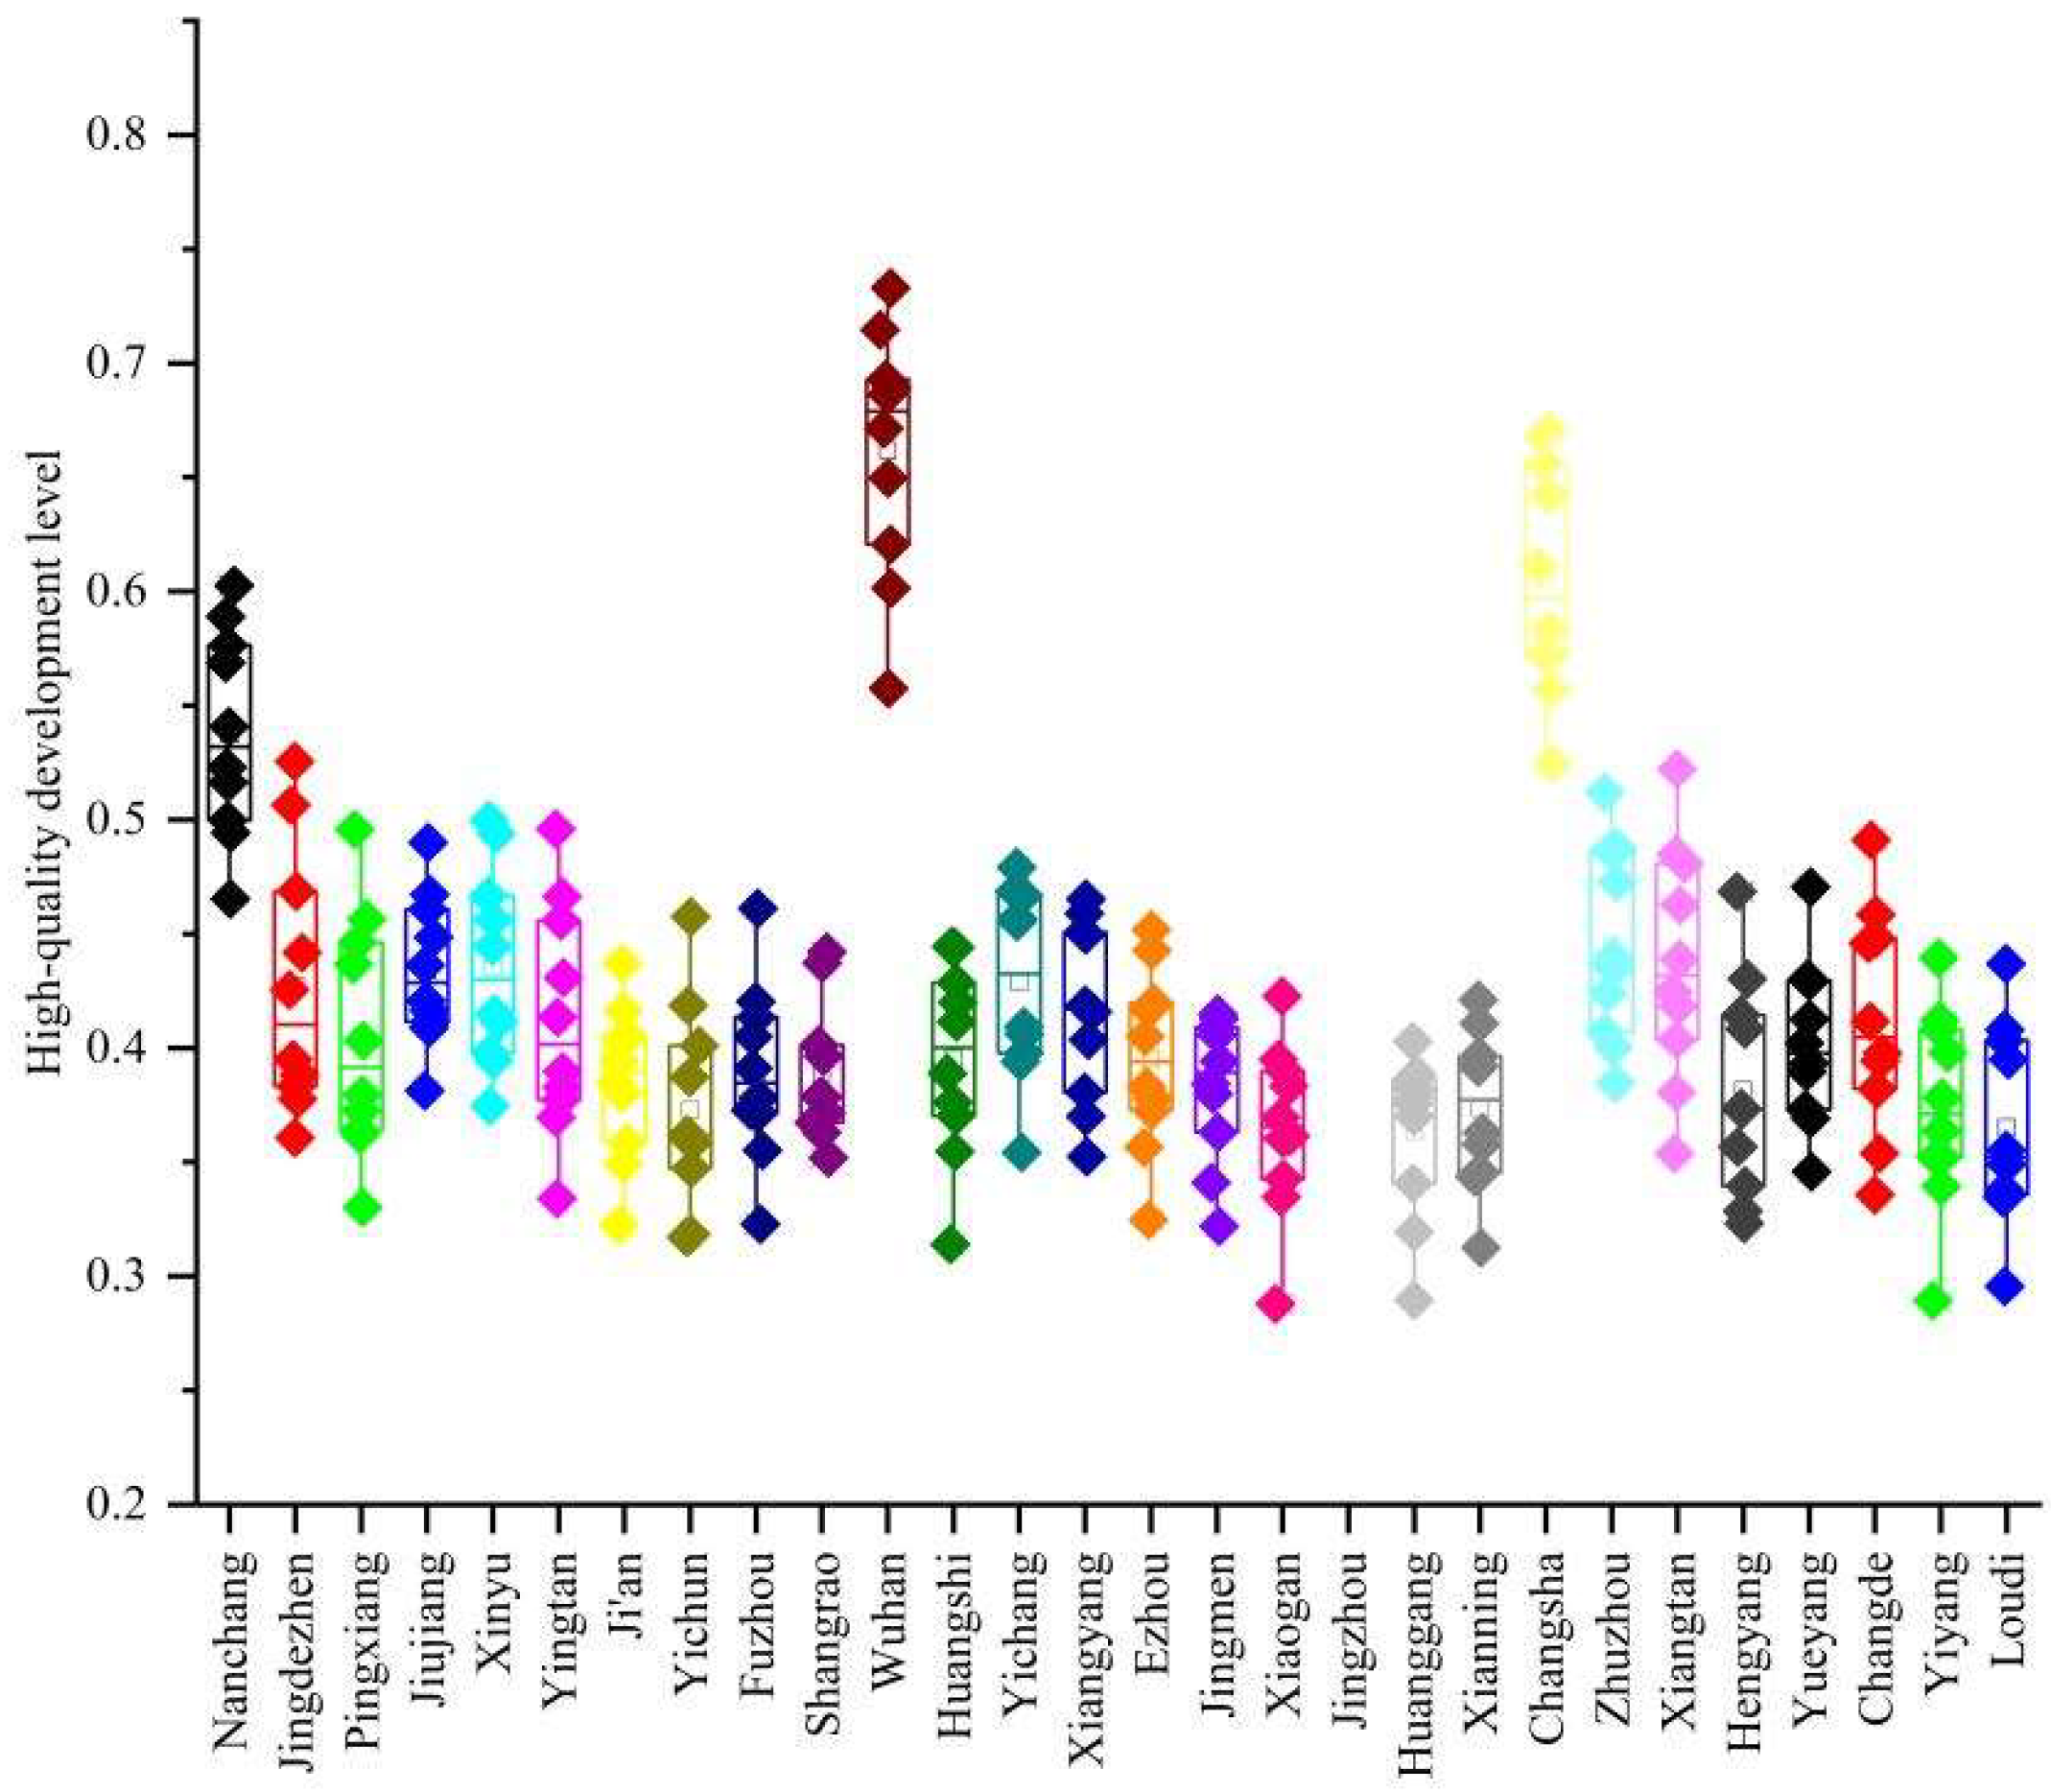
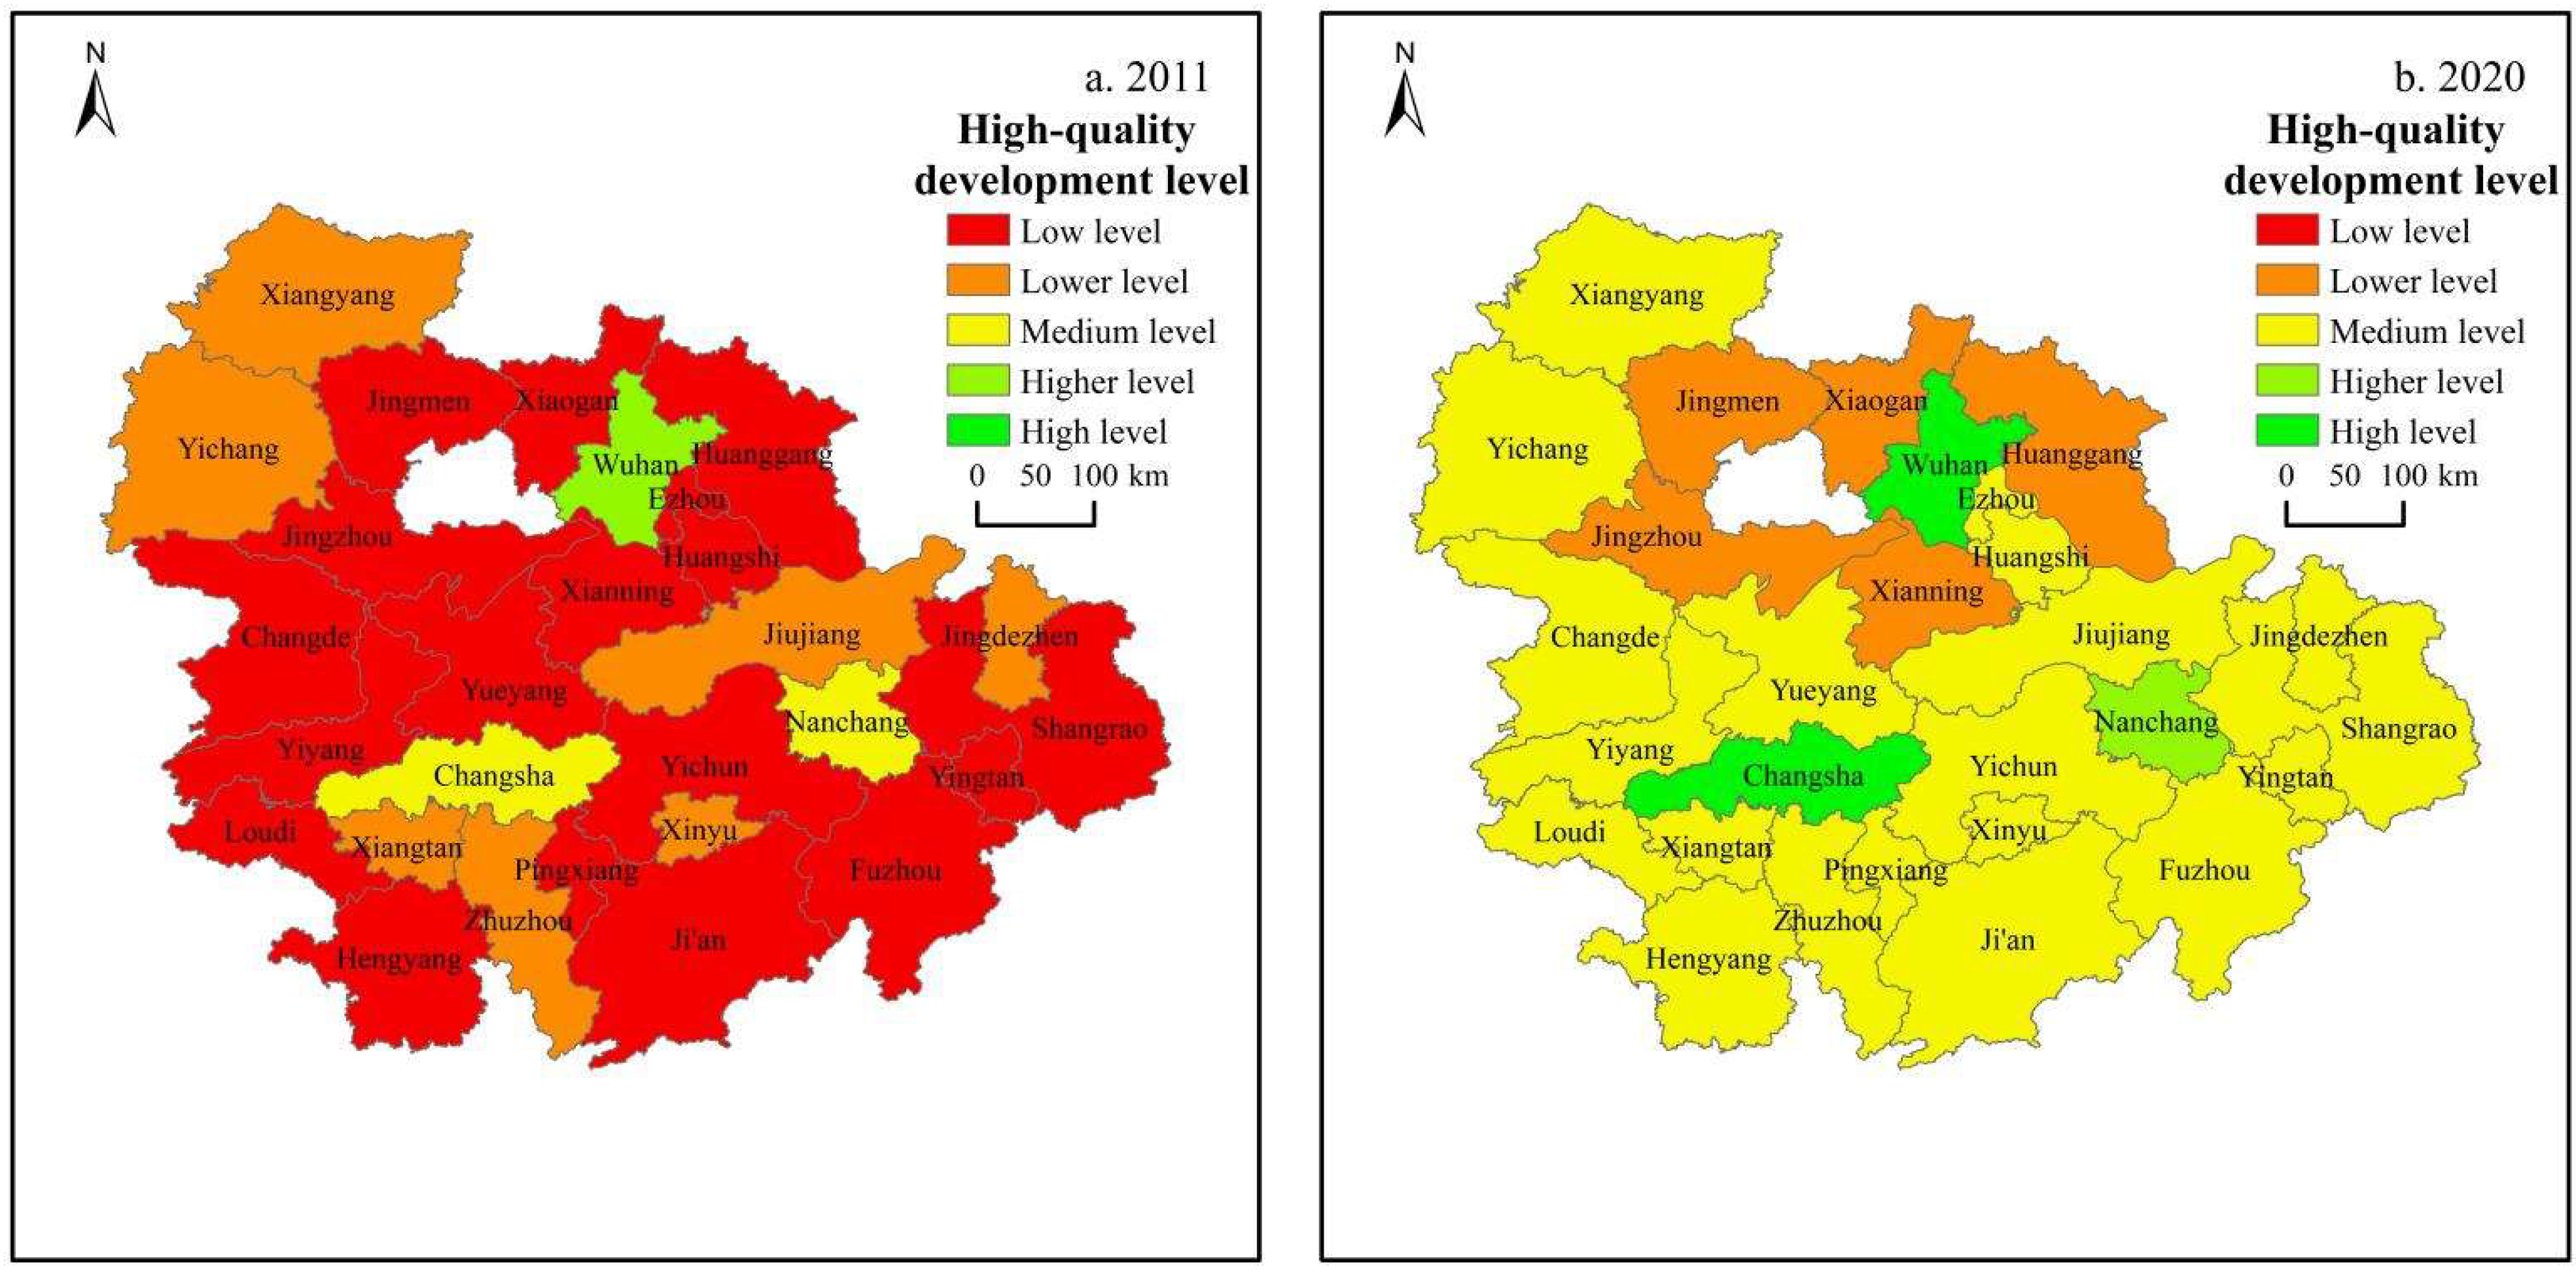
4.1.2. Spatial and Temporal Pattern of HQD

The HQDL of cities in the urban agglomeration from 2011 to 2020 was calculated using the entropy method (Table 4) and divided into five categories by SPSS cluster analysis: very low (0.281–0.352), low (0.353–0.429), medium (0.430–0.536), high (0.527–0.621), and very high (0.622–0.734).
(1) Time-Series Change of HQDL
The HQDL in the urban agglomeration steadily improved, while the “development gap” between the regions gradually narrowed (Figure 6). From 2011 to 2020, the HQDL of urban agglomerations showed a gradual upward trend, rising from 0.350 in 2011 to 0.480 in 2020, with an average annual growth of 3.57%. The gap between cities in the HQDL gradually narrowed and the coefficient of variation decreased from 0.188 in 2011 to 0.147 in 2020. Yiyang’s HQDL increased the most from 2011 to 2020, increasing by 52.82% in 10 years.
In order to further analyze the variation characteristics of the HQDL of each city from 2011 to 2020, the Origin software was used to draw a high-quality development boxplot of urban agglomeration. Longer boxes and line segments indicated a higher level of HQD and greater growth. As shown in Figure 7, there was a large gap in the HQDL among cities. Wuhan, Changsha, and Nanchang were in an advantageous position in terms of the HQD of the urban agglomeration, while Jingzhou, Huanggang, and Xiaogan were in an inferior position. Among them, Wuhan showed a significant advantage with respect to the score of HQD, showing the clustering characteristics of a “high-value cluster”. Changsha showed a comparative advantage with respect to the score of HQD, and its median was close to the lower quartile, indicating that Changsha’s HQDL was unbalanced, with the characteristics of a “low-value cluster”. The median of Nanchang’s HQDL was close to the upper and lower quartiles, indicating that the HQDL of Nanchang presented relatively balanced distribution characteristics.
(2) Spatial Variation of HQD
From 2011 to 2020, the HQDL of the urban agglomeration presented a patchy spatial distribution pattern, and a three-pillar rivalry trend was obvious. According to the classification results of cluster analysis, the spatial distribution pattern of the HQDL of the urban agglomeration was drawn using the data from 2011 and 2020. As can be seen from Figure 8, the HQDL of the urban agglomeration formed a spatial distribution pattern with provincial capital cities at the center, spreading to surrounding areas, whereas cities with low levels of HQD in 2020 disappeared. Cities with HQD were gradually concentrated in the areas around Poyang Lake and along the Beijing–Guangzhou line. These cities typically had a high level of social and economic development, carried out urban construction earlier, and had relatively perfect basic public service facilities.
(3) Spatial Agglomeration Characteristics
The Moran’s I values of the HQD of the urban agglomeration from 2011 to 2020 were all below −0.1, less than the expected value (−0.037). Most of them passed the 5% significance level test (Table 5), indicating that the urban agglomeration level was not completely independent of high quality. Negative correlation existed in the global space, perhaps due to the Wuhan, Changsha–Zhuzhou–Xiangtan, and Poyang Lake urban agglomeration, which was relatively competitive. This resulted in unbalanced regional development, leading to obvious spatial negative correlation characteristics. Therefore, a spatial econometric model was selected to explore the impact of agglomeration externalities and network externalities on the level of HQD. However, it should be noted that the Moran’s I value of the HQDL of the middle reaches of Yangtze River urban agglomeration in 2020 did not pass the significance test; however, significant correlation characteristics may still exist locally or positive and negative correlations may have canceled each other out.

4.2. Impact of Agglomeration Externalities and Network Externalities on HQD

4.2.1. Baseline Regression Result

The OLS regression results are shown in Table 6. The influence of agglomeration externalities and network externalities on HQD both passed the 1% significance level test, which preliminarily verified the research hypothesis of this paper. For every 1 unit increase in agglomeration externalities, the HQDL decreased by 0.206 units. When the square term of agglomeration externalities increased by 1 unit, the level of HQD increased by 0.306 units, indicating that there may be a u-shaped nonlinear relationship between agglomeration externalities and HQD. Thus, hypothesis H1 was verified. For every increase in network externality by one unit, the city’s HQDL increased by 0.052 units, indicating that the “borrowing size” effect of the city’s HQDL within the region was obvious, thus verifying hypothesis H2. In addition, the development level of the digital economy and the level of opening to the outside world also had a significantly positive impact on the HQD of cities.
However, according to the analysis of spatial agglomeration, there were spatial spillover effects; therefore, simple OLS regression could not be used to determine the agglomeration externalities and their influence on HQD. Accordingly, a spatial econometric model was needed for further regression analysis.

4.2.2. Check before Model Estimation

(1) Multicollinearity Test and Stationary Test
A multicollinearity test and stationarity test were conducted for each variable before regression analysis of the spatial econometric model, and the test results are shown in Table 7. Firstly, in the multicollinearity test, the highest variance inflation factor (VIF) was recorded for variable ln Gov, whose value was 1.349 (<5), indicating no multicollinearity between variables; thus, a spatial econometric model could be constructed. Secondly, in the stationarity test, the LLC test of all variables rejected the null hypothesis at the 1% level, indicating that all variables were stable and there was no false regression; thus, parameter estimation could be conducted.
(2) Selection of Spatial Econometric Model
This study established the best spatial econometric model to explore the impact of agglomeration externalities and network externalities on HQD. The results (Table 8) show that the LM statistics of the spatial error model did not pass the significance test, while the LM and robust LM of the spatial lag model both passed the significance test, indicating a form of spatial lag in the influence model of agglomeration externalities and network externalities on HQD. The Wald and LR statistics also indicated that the spatial Durbin model could not degenerate into a spatial lag model or spatial error model. In addition, the Hausman test was significantly negative at the 1% level, indicating that the spatial random effects model was more efficient than the spatial fixed effects model. Therefore, the random effects model was selected for regression analysis.

4.2.3. Regression Analysis

In summary, a random effects model was selected to analyze the impact of agglomeration externalities and network externalities on HQD. In order to be able to choose the right model, the SLM, SEM, and SDM were applied to the regression results (Table 9).
It can be seen from Table 9 that the spatial lag coefficient of SDM ρ was 0.646, significant at the 1% level, showing that the HQD of urban agglomerations had the spatial spillover effect. The HQDL of each city was affected not only by factors within the region, but also by factors in adjacent cities. This spatial spillover effect could shorten the gap of HQDL between cities to a certain extent and further promote the HQD of the urban agglomeration. At the same time, the SLM (ρ = 0.762) and SEM (λ= 0.870) also provide evidence for spatial dependence on HQD.
Among agglomeration externalities, the density of economic activity coefficient was significantly negative at the 5% level, while the squared coefficient was significantly positive at the 10% level, indicating that a low density of economic activity hinders HQD to some extent. The gradual concentration of economic activity density can promote HQD to a certain extent, indicating that agglomeration externalities have heterogeneous nonlinear effects on regional HQD.
In terms of network externalities, it can be seen from Table 9 that the urban agglomeration has network externalities, which can promote HQD. The impact of centrality on HQD was significant at the 1% level. The regression results of variables were similar to the spatial lag model, indicating that network externalities can promote HQD. In addition, the spatial regression coefficient of network externalities was significantly positive at the 1% level (0.019), indicating that network externalities have a certain spatial spillover effect and can promote the HQDL of surrounding areas to a certain extent.
In terms of control variables, government capacity and level of opening to the outside world had positive effects on HQD at the 10% and 5% levels, respectively. Therefore, the HQD of urban agglomerations is not only affected by external factors, but also by the internal government capacity and the level of opening to the outside world.

4.2.4. Spatial Effect Decomposition

The estimated coefficients of the SDM could not directly reflect the influence of independent variables on dependent variables; thus, the spatial effects generated by each variable were further decomposed into direct effects, indirect effects, and total effects with the partial differential method [65]. Furthermore, the marginal effects of explanatory variables and control variables on HQD were analyzed, in addition to the impact of each variable on the HQD of the region and neighboring regions (Table 10).
As can be seen from Table 10, the regression coefficients of all effects of economic activity density were negative, indicating that agglomeration externalities have an inhibitory effect on HQD. The regression coefficients of the effects of the square term of economic activity density and the weighted degree centrality were significantly positive, indicating that the excessive concentration of economic activity density and network externalities can promote the regional HQDL as well as the corresponding spatial spillover effect. Both government capacity and level of opening to the outside world had a positive impact on regional HQD, but the spatial spillover effect was not obvious. Lastly, the impact of innovation efficiency and digital economy level on regional HQD did not pass the significance test.

4.2.5. Robustness Test

In this paper, the two most prominent urban attributes, population attribute and economic attribute, were combined with geographical distance to construct the urban economic geographic matrix and urban population geographic matrix, respectively. Meanwhile, the spatial econometric test was conducted again to test whether the results were stable. The results show (Table 11) that the values of R2 and ρ were larger using the newly constructed matrices, indicating that the fitting effect of the geographical distance matrix was better. Both the density of economic activity and its square term had an effect on the quality of urban development, maintaining a nonlinear relationship. The regression coefficients and spatial lag terms of weighted degree centrality were significantly positive, consistent with the estimated results. The regression results of the control variables were slightly different but there was no obvious overall change, verifying the robustness and reliability of the research results to a certain extent.

5. Discussion

5.1. Findings and Contributions

With the transition from geographical space to network space, urban development and construction are no longer limited to a specific physical space but more influenced by other cities in the regional network. However, from the perspective of externalities, there have been few studies on the impact of agglomeration externalities and network externalities on HQD. Multivariate data were used to construct an integrated network. Social network analysis was used to evaluate the complexity of the urban agglomeration in the middle reach of Yangtze River through integrated network characteristics. The entropy value method and GIS spatial analysis were applied to explore the spatial and temporal differentiation of the HQD of the urban agglomeration. The application of a spatial econometric model to explore the influence of agglomeration externalities and network externalities on HQD provides a new theoretical basis and policy perspective for local urban construction and development. The main conclusions are as follows:
(1) From 2011 to 2020, the integrated network of urban agglomerations has the characteristics of “small world”, showing a balanced development trend, and the connection within the province was closer. In space, Wuhan, Changsha, and Nanchang are in a leading position and presented a multicore spatial distribution structure [69]. The centrality of urban nodes is a “pyramid” structure. Therefore, in order to promote regional integration, trans-regional co-operation should be realized with provincial capital cities as the core to drive the development of surrounding regions.
(2) From 2011 to 2020, the HQDL of urban agglomerations steadily improved and the regional “development gap” gradually narrowed. Wuhan took a dominant position in the urban agglomeration, while Changsha and Nanchang were in a relatively dominant position, which indicates that there is a positive correlation between the degree of factor agglomeration and the status of cities in the urban agglomeration [70]. The HQDL of cities showed a clustered spatial distribution pattern with a negative correlation in space [71]. Therefore, it is necessary to give full play to the leading role of core cities and accelerate the HQD of marginal cities.
(3) The HQD had a spatial agglomeration effect and positive spillover effect, with network externalities presenting differences in different cities. Both the agglomeration externalities and the network externalities can affect the HQD [72]. Agglomeration externalities influenced HQD through a u-shaped nonlinear relationship, whereas network externalities significantly promoted HQD, indicating that other urban elements’ agglomeration-influenced urban high-quality development “borrowed size” effect is stronger than the “agglomeration shadow” effect. The indirect effect of these externalities was greater than their direct effect. In addition, the regional government capacity and level of opening to the outside world also promoted the HQD of the region. According to the research results of the influence mechanism, the corresponding improvement is proposed, trying to provide a targeted reference for improving the HQDL of the research area.

5.2. Optimization Measures

This research provides evidence that agglomeration externalities and network externalities could significantly affect the HQD of cities, indicating that, in the network era, urban development no longer depends on its own construction but depends more on that of the region. Therefore, in the formulation of an HQD strategy of urban agglomeration in the middle reaches of the Yangtze River, the influence of externalities and network elements on HQD should be fully considered, and the positive role of agglomeration externalities and network externalities in promoting HQD of regional should be fully brought into play.
(1) The connection between cities in the urban agglomeration should be strengthened. To promote the HQD of cities, we should pay attention to the connection intensity between cities, enhance the circulation of elements between cities, and expand the space of urban connection, especially in the middle part of the urban agglomeration. Furthermore, we should strengthen the connection between the central region and provincial capital cities, promoting the realization of a cross-regional connection. In addition, for cities with low centrality, it is possible to strengthen policy support, improve infrastructure construction, enhance the agglomeration and radiation capacity, and enhance the communication and interaction of internal elements.
(2) The siphon effect between city clusters should be reasonably avoided. Due to the siphon effect of provincial capitals, economic activity density has a negative effect on the HQD of cities, which is not conducive to the HQD of surrounding cities. Therefore, cities with low centrality can make use of the positive spillover effect brought by surrounding cities. Meanwhile, they can continuously improve their own level of agglomeration economy and centrality, increasing the density of regional economic activities, and shorten the gap between regions.

5.3. Limitations

This study used the density of economic activity in the characterization of agglomeration externalities according to the information, innovation, and economic relationships between city construction of urban integrated network. Furthermore, the weighted degree centrality was used to characterize network externalities and the spatial Dubin model was used to explore the influence of agglomeration externalities and network externalities on the HQD of urban agglomerations. Although this study deepened and expanded the existing research to some extent, there were still some limitations, which need to be addressed in the future. Firstly, the heterogeneous results generated by elements in different periods may be different [72], which can be extended in time and scale in the future to enrich the spatiotemporal scale of the research. Secondly, the influence path of agglomeration externalities and network externalities on HQD were not investigated in detail in the empirical study. In the future, the influence path of agglomeration externalities and network externalities in local space can be subdivided to obtain more detailed research conclusions. Lastly, the study mainly analyzed the one-way influence of agglomeration externalities and network externalities on HQD. The reverse interaction, i.e., whether HQD can promote agglomeration externalities and network externalities, needs to be further discussed by building relevant models in the future.

6. Conclusions

With the development of regional integration, urban networks have gradually become a new form of urban spatial structure, and strengthening the connection between cities has gradually become an important issue for optimizing regional spatial structure. Urban networks and their externalities play an important role in promoting regional HQD [4,73]. The current urban network theory considers the formation of an urban network and its economic effects [7], but the environmental effects are less considered. Based on the new development concept, this paper constructs an HQD evaluation index system and empirically analyzes the effects of agglomeration externalities and network externalities on HQD by using a spatial econometric model. It was found that agglomeration externalities, network externalities, population size, government capacity, innovation efficiency, digital economy development level, and openness level had different direct or indirect effects on HQD in different directions and via different paths. This study is helpful to understand the impact of externalities on HQD. The HQD is not only influenced by the endogenous dynamics of a city itself, but also by external factors. Therefore, it is necessary to attach importance to regional co-operative governance and realize cross-regional co-ordinated management. Although the empirical study takes the urban agglomeration in the middle reaches of the Yangtze River as the case area, the theoretical framework constructed by the study and the conclusions drawn are universal and applicable to the research in other regions. At present, networking and integration have become the inevitable trend of urban development, and other regions are also facing similar development opportunities and challenges with the urban agglomeration in the middle reaches of the Yangtze River. Therefore, the study has reference significance for the development of other regions.

Author Contributions

Conceptualization, Xueming Li; Data curation, He Liu; Formal analysis, He Liu; Funding acquisition, Xueming Li; Investigation, Shenzhen Tian and He Sun; Methodology, He Liu; Resources, He Liu; Software, He Liu; Supervision, Xueming Li; Validation, He Liu, Yilu Gong and Yingying Guan; Visualization, He Liu; Writing—original draft, He Liu and Songbo Li; Writing—review and editing, Xueming Li and Songbo Li. All authors have read and agreed to the published version of the manuscript.

Funding

This research was funded by the National Natural Science Foundation of China (grant number 41671158).

Data Availability Statement

The data presented in this study are available on request from the corresponding author.

Conflicts of Interest

The authors declare no conflict of interest.

References

  1. Zhu, X.; Qian, T.; Wei, Y. Do high-speed railways accelerate urban land expansion in China? A study based on the multi-stage difference-in-differences model. Socio-Econ. Plan. Sci. 2020, 71, 100846. [Google Scholar] [CrossRef]
  2. Lu, X.; Chen, D.; Kuang, B.; Zhang, C.; Cheng, C. Is high-tech zone a policy trap or a growth drive? Insights from the perspective of urban land use efficiency. Land Use Policy 2020, 95, 104583. [Google Scholar] [CrossRef]
  3. Hu, H.; Pan, L.; Jing, X.; Li, G.; Zhuo, Y.; Xu, Z.; Chen, Y.; Wang, X. The Spatiotemporal Non-Stationary Effect of Industrial Agglomeration on Urban Land Use Efficiency: A Case Study of Yangtze River Delta, China. Land 2022, 11, 755. [Google Scholar] [CrossRef]
  4. Ma, T.; Yin, H.; Hong, T. Urban network externalities, agglomeration economies and urban economic growth. Cities 2020, 107, 102882. [Google Scholar] [CrossRef]
  5. Long, Y. Measuring the spillover effects: Some Chinese evidence. Pap. Reg. Sci. 2000, 79, 75–89. [Google Scholar] [CrossRef]
  6. Mccann, P.; Acs, Z.J. Globalization: Countries, Cities and Multinationals. Reg. Stud. 2010, 45, 17–32. [Google Scholar] [CrossRef] [Green Version]
  7. Lu, J.; Mao, W. The Rise of Urban Network Externalities: A New Mechanism for the High-quality Integrated Development of Regional Economy. Economist 2020, 12, 62–70. (In Chinese) [Google Scholar] [CrossRef]
  8. Capello, R. The City Network Paradigm: Measuring Urban Network Externalities. Urban Stud. 2000, 37, 1925–1945. [Google Scholar] [CrossRef]
  9. Van, O.F.; Martijn, B.; Raspe, O. On the Economic Foundation of the Urban Network Paradigm: Spatial Integration, Functional Integration and Economic Complementarities within the Dutch Randstad. ERIM Rep. Ser. Res. Manag. 2009, 47, 725–748. [Google Scholar] [CrossRef] [Green Version]
  10. Camagni, R.; Capello, R. Caragliu, A, One or infinite optimal city sizes? In search of an equilibrium size for cities. Ann. Reg. Sci. 2013, 51, 309–341. [Google Scholar] [CrossRef]
  11. Meijers, E.J.; Burger, M.J.; Hoogerbrugge, M.M. Borrowing size in networks of cities: City size, network connectivity and metropolitan functions in Europe. Pap. Reg. Sci. 2016, 95, 181–198. [Google Scholar] [CrossRef] [Green Version]
  12. Meijers, E.; Burger, M.; Camagni, R.; Capello, R.; Caragliu, A. Static vs. dynamic agglomeration economies. Spatial context and structural evolution behind urban growth. Pap. Reg. Sci. 2016, 95, 133–158. [Google Scholar] [CrossRef]
  13. Li, Y.; Pan, W.; Wang, J.; Liu, Y. Spatial pattern and influencing factors of high-quality development of China at the prefecture level. Acta Ecol. Sin. 2020, 42, 2306–2320. (In Chinese) [Google Scholar] [CrossRef]
  14. Li, C.; Wan, J.; Xu, Z.; Liu, T. Impacts of Green Innovation, Institutional Constraints and Their Interactions on High-Quality Economic Development across China. Sustainability 2021, 13, 5277. [Google Scholar] [CrossRef]
  15. Zhou, T.; Ding, R.; Du, Y.; Zhang, Y.; Cheng, S.; Zhang, T.; Li, M. Study on the Coupling Coordination and Spatial Correlation Effect of Green Finance and High-Quality Economic Development—Evidence from China. Sustainability 2022, 14, 3137. [Google Scholar] [CrossRef]
  16. Song, R.; Hu, Y.; Li, M. Chinese Pattern of Urban Development Quality Assessment: A Perspective Based on National Territory Spatial Planning Initiatives. Land 2021, 10, 773. [Google Scholar] [CrossRef]
  17. Cui, D.; Bu, X.; Xu, Z.; Li, G.; Wu, D. Comprehensive evaluation and impact mechanism of high-quality development of China’s resource-based cities. Acta Geogr. Sin. 2021, 76, 2489–2503. (In Chinese) [Google Scholar] [CrossRef]
  18. Chen, Q.; Bi, Y.; Li, J. Spatial Disparity and Influencing Factors of Coupling Coordination Development of Economy–Environment–Tourism–Traffic: A Case Study in the Middle Reaches of Yangtze River Urban Agglomerations. Int. J. Environ. Res. Public Health 2021, 18, 7947. [Google Scholar] [CrossRef]
  19. Dong, H.; Han, Y. Spatiotemporal evolution and driving factors of ueban quality development in a complex ecosystem: Taking the seven major urban agglomerations along the Yellow River Basin as examples. Hum. Geogr. 2021, 36, 96–107. (In Chinese) [Google Scholar] [CrossRef]
  20. Li, P.; Zhang, X. Agglomeration Externalities of City Cluster: Analysis from Labor Wage Premium. Manag. World 2021, 37, 121–136. (In Chinese) [Google Scholar] [CrossRef]
  21. Yang, W.; Fan, F.; Wang, X.; Yu, H. Knowledge innovation network externalities in the Guangdong-Hong Kong-Macao Greater Bay Area: Borrowing size or agglomeration shadow? Technol. Anal. Strateg. Manag. 2021, 34, 1020–1037. [Google Scholar] [CrossRef]
  22. Edward, L.; Glaeser, H.D.; Kallal, J.A.; Andrei, S. Growth in Cities. J. Political Econ. 1992, 100, 1126–1152. [Google Scholar] [CrossRef]
  23. Jofre-Monseny, J.; Marin-Lopez, R.; Viladecans-Marsal, E. The determinants of localization and urbanization economies: Evidence from the location of new firms in Spain. J. Reg. Sci. 2014, 54, 313–337. [Google Scholar] [CrossRef]
  24. Camagni, R.; Capello, R.; Caragliu, A. The Rise of Second-Rank Cities: What Role for Agglomeration Economies? Eur. Plan. Stud. 2015, 23, 1069–1089. [Google Scholar] [CrossRef]
  25. Burger, M.J.; Meijers, E.J. Stretching the concept of “borrowed size”. Urban Stud. 2017, 54, 269–291. [Google Scholar] [CrossRef]
  26. Duranton, G.; Puga, D. Chapter 48 Micro-foundations of urban agglomeration economies. Handb. Reg. Urban Econ. 2004, 4, 2063–2117. [Google Scholar] [CrossRef]
  27. Glaeser, E.L.; Ponzetto, G.; Zou, Y. Urban Networks: Connecting Markets, People, and Ideas. Pap. Reg. Sci. 2016, 95, 17–59. [Google Scholar] [CrossRef] [Green Version]
  28. Johansson, B.; Quigley, J.M. Agglomeration and networks in spatial economies. Pap. Reg. Sci. 2004, 83, 165–176. [Google Scholar] [CrossRef] [Green Version]
  29. Meijers, E. Polycentric Urban Regions and the Quest for Synergy: Is a Network of Cities More than the Sum of the Parts? Urban Stud. 2005, 42, 765–781. [Google Scholar] [CrossRef]
  30. Burger, M.J.; Meijers, E.J. Agglomerations and the rise of urban network externalities. Pap. Reg. Sci. 2016, 95, 5–16. [Google Scholar] [CrossRef]
  31. Huggins, R.; Thompson, P. Networks and regional economic growth: A spatial analysis of knowledge ties. Environ. Plan. A 2017, 49, 1247–1265. [Google Scholar] [CrossRef] [Green Version]
  32. Boix, R. Networks of cities and growth: Theory, network identification and measurement of the network externality. CiteSeerX 2003, 2003, 13–14. [Google Scholar]
  33. Boix, R.; Trullén, J. Knowledge, networks of cities and growth in regional urban systems. Pap. Reg. Sci. 2007, 86, 551–574. [Google Scholar] [CrossRef] [Green Version]
  34. Wetwitoo, J.; Kato, H. High-speed rail and regional economic productivity through agglomeration and network externality: A case study of inter-regional transportation in Japan. Case Stud. Transp. Policy 2017, 5, 549–559. [Google Scholar] [CrossRef]
  35. Tang, C.; Guan, M.; Dou, J. Understanding the impact of High Speed Railway on urban innovation performance from the perspective of agglomeration externalities and network externalities. Technol. Soc. 2021, 67, 101760. [Google Scholar] [CrossRef]
  36. Yuan, H.; Xin, L.; Yu, C.; Wei, L. Industrial agglomeration externalities, local governments’ competition and environmental pollution: Evidence from Chinese prefecture-level cities. J. Clean. Prod. 2020, 277, 123455. [Google Scholar] [CrossRef]
  37. Dupont, V. Do geographical agglomeration, growth and equity conflict? Pap. Reg. Sci. 2007, 86, 193–213. [Google Scholar] [CrossRef]
  38. Williamson, J.G. Regional inequality and the process of national development: A descripition of the patterns. Econ. Dev. Cult. Chang. 1965, 13, 3–45. [Google Scholar] [CrossRef]
  39. Camagni, R.; Salone, C. Network Urban Structures in Northern Italy: Elements for a Theoretical Framework. Urban Stud. 1993, 30, 1053–1064. [Google Scholar] [CrossRef]
  40. Volgmann, K.; Rusche, K.; Weesep, J.V. The Geography of Borrowing Size: Exploring Spatial Distributions for German Urban Regions. Tijdschr. Voor Econ. En Soc. Geogr. 2020, 111, 60–79. [Google Scholar] [CrossRef] [Green Version]
  41. Chen, Y.; Sun, B. Does “agglomeration shadow” exist in Beijing-Tianjin-Hebei region? Large cities’ impact on regional economic growth. Geogr. Res. 2017, 36, 1936–1946. (In Chinese) [Google Scholar] [CrossRef]
  42. Gao, P.; Ning, Y.; He, D. Evolution of Spatial Correlation Network of City Clusters in Middle Reaches of the Yangtze River Based on Producer Services. Areal Res. Dev. 2021, 40, 61–66. (In Chinese) [Google Scholar] [CrossRef]
  43. Zheng, W.; Du, N.; Yang, Y.; Wang, X.; Xiong, Z. Multi-fractal characteristics of spatial structure of urban agglomeration in the middle reaches of the Yangtze River. Acta Geogr. Sin. 2022, 77, 947–959. (In Chinese) [Google Scholar] [CrossRef]
  44. Chen, Y.; Miao, Q.; Zhou, Q. Spatiotemporal Differentiation and Driving Force Analysis of the High-Quality Development of Urban Agglomerations along the Yellow River Basin. Int. J. Environ. Res. Public Health 2022, 19, 2484. [Google Scholar] [CrossRef] [PubMed]
  45. Liu, J.; Zhang, L.; Zhang, N. Analyzing the South-North Gap in the High-Quality Development of China’s Urbanization. Sustainability 2022, 14, 2178. [Google Scholar] [CrossRef]
  46. Wang, F.; Wang, R.; He, Z. Exploring the Impact of “Double Cycle” and Industrial Upgrading on Sustainable High-Quality Economic Development: Application of Spatial and Mediation Models. Sustainability 2022, 14, 2432. [Google Scholar] [CrossRef]
  47. Ma, H.; Xu, X. High-quality development assessment and spatial heterogeneity of urban agglomeration in the Yellow River Basin. Econ. Geogr. 2020, 40, 11–18. (In Chinese) [Google Scholar] [CrossRef]
  48. Hu, H.; Ma, Y.; Wu, S. Fuzzy comprehensive evaluation on high-quality development of China’s rural economy based on entropy weight. J. Intell. Fuzzy Syst. 2020, 38, 7531–7539. [Google Scholar] [CrossRef]
  49. Fan, Y.; Fang, C.; Zhang, Q. Coupling coordinated development between social economy and ecological environment in Chinese provincial capital cities-assessment and policy implications. J. Clean. Prod. 2019, 229, 289–298. [Google Scholar] [CrossRef]
  50. Chen, J.; Zhou, Q. City size and urban labor productivity in China: New evidence from spatial city-level panel data analysis. Econ. Syst. 2017, 41, 165–178. [Google Scholar] [CrossRef]
  51. He, Y.; Choi, B.R. China’s outward foreign direct investment patterns: Evidence from asian financial markets. J. Asian Financ. Econ. Bus. 2020, 7, 157–168. [Google Scholar] [CrossRef]
  52. Jiang, J.; Luo, L.; Xu, P.; Wang, P. How does social development influence life expectancy? A geographically weighted regression analysis in China. Public Health 2018, 163, 95–104. [Google Scholar] [CrossRef]
  53. Li, B.; Qin, H.; Sun, W. Interaction mechanism between industrial transformation and upgrading and green total factor productivity improvement: An empirical study based on 116 China’s prefecture-level resource-based cities. J. Nat. Resour. 2022, 37, 186–199. [Google Scholar] [CrossRef]
  54. Yao, C.; Song, D. Borrowed scale, network externalities and the economy of urban agglomeration. Ind. Econ. Res. 2019, 2, 76–87. (In Chinese) [Google Scholar] [CrossRef]
  55. Wei, S.; Pan, J. Resilience of Urban Network Structure in China: The Perspective of Disruption. ISPRS Int. J. Geo-Inf. 2021, 10, 796. [Google Scholar] [CrossRef]
  56. Liu, L.; Luo, Y.; Peo, J.; Wang, H.; Li, J.; Li, Y. Temporal and Spatial Differentiation in Urban Resilience and Its Influencing Factors in Henan Province. Sustainability 2021, 13, 12460. [Google Scholar] [CrossRef]
  57. Hi, Y.; Zhu, Q.; Xu, L.; Li, Z.; Wu, Y.; Wang, X.; Fei, Y.; Deng, J. Independent or Influential? Spatial-Temporal Features of Coordination Level between Urbanization Quality and Urbanization Scale in China and Its Driving Mechanism. Int. J. Environ. Res. Public Health 2020, 17, 15872. [Google Scholar] [CrossRef] [Green Version]
  58. Xu, L.; Wang, D.; Du, J. Spatial-Temporal Evolution and Influencing Factors of Urban Green and Smart Development Level in China: Evidence from 232 Prefecture-Level Cities. Int. J. Environ. Res. Public Health 2022, 19, 3939. [Google Scholar] [CrossRef]
  59. He, S.; Mei, L.; Wang, L. The Dynamic Influence of High-Speed Rail on the Spatial Structure of Economic Networks and the Underlying Mechanisms in Northeastern China. ISPRS Int. J. Geo-Inf. 2021, 10, 776. [Google Scholar] [CrossRef]
  60. Li, X.; Liu, H. The Influence of Subjective and Objective Characteristics of Urban Human Settlements on Residents’s Life Satisfaction in China. Land 2021, 10, 1400. [Google Scholar] [CrossRef]
  61. Chen, K.; Tian, G.; Tian, Z.; Ren, Y.; Liang, W. Evaluation of the Coupled and Coordinated Relationship between Agricultural Modernization and Regional Economic Development under the Rural Revitalization Strategy. Agronomy 2022, 12, 990. [Google Scholar] [CrossRef]
  62. Shen, W.; Huang, Z.; Yin, S.; Hsu, W. Temporal and Spatial Coupling Characteristics of Tourism and Urbanization with Mechanism of High-Quality Development in the Yangtze River Delta Urban Agglomeration, China. Appl. Sci. 2022, 12, 3403. [Google Scholar] [CrossRef]
  63. Huang, C.; Liu, F.; Chu, D.; Wang, L.; Liao, J.; Wu, J. Spatiotemporal Evolution and Trend Prediction of Tourism Economic Vulnerability in China’s Major Tourist Cities. ISPRS Int. J. Geo-Inf. 2021, 10, 644. [Google Scholar] [CrossRef]
  64. Elhorst Paul, J. Matlab Software for Spatial Panels. Int. Reg. Sci. Rev. 2014, 37, 389–405. [Google Scholar] [CrossRef] [Green Version]
  65. Lesage, J.P.; Pace, R.K. Introduction to Spatial Econometrics; CRC Press: London, UK, 2009; pp. 70–72. [Google Scholar]
  66. Li, T.; Xue, L.; Li, G. The evolution of spatial pattern of industrial agglomeration and its impact on the high-quality economic development: Empirical analysis based on the data of 278 cities in China. Geogr. Res. 2022, 41, 1092–1106. (In Chinese) [Google Scholar] [CrossRef]
  67. Guo, J.; Wang, S.; Wang, D.; Liu, T. Spatial Structural Pattern and Vulnerability of China-Japan-Korea Shipping Network. Chin. Geogr. Sci. 2017, 27, 697–708. [Google Scholar] [CrossRef]
  68. Li, Y.; Ma, S.; Fu, N.; Yi, K.; Peng, F. The Characteristics and Proximity of Cooperative Innovation Network of Marine Industry in China’s Coastal Areas. Econ. Geogr. 2021, 41, 129–138. (In Chinese) [Google Scholar] [CrossRef]
  69. Liu, L.; Luo, J.; Xiao, X.; Hu, B.; Qi, S.; Lin, H.; Zu, X. Spatio-Temporal Evolution of Urban Innovation Networks: A Case Study of the Urban Agglomeration in the Middle Reaches of the Yangtze River, China. Land 2022, 11, 597. [Google Scholar] [CrossRef]
  70. Fan, F.; Dai, S.; Zhang, K.; Ke, H. Innovation agglomeration and urban hierarchy: Evidence from Chinese cities. Appl. Econ. 2021, 53, 6300–6318. [Google Scholar] [CrossRef]
  71. Wang, T.; Liu, C.; Duan, D.; Liu, J.; Zeng, J. The spatial evolution of urban agglomeration competitiveness in the middle reaches of the Yangtze river. World Reg. Stud. 2014, 23, 92–101. (In Chinese) [Google Scholar] [CrossRef]
  72. Jiang, J.; Xu, Z.; Lu, J.; Sun, D. Does Network Externality of Urban Agglomeration Benefit Urban Economic Growth—A Case Study of the Yangtze River Delta. Land 2022, 11, 586. [Google Scholar] [CrossRef]
  73. Zhou, H.; Gu, G. The evolution of China’s city network and its environmental effects from the perspective of externalities. Geogr. Res. 2022, 41, 268–285. (In Chinese) [Google Scholar] [CrossRef]
Figure 1. Analysis framework of agglomeration externalities, network externalities, and HQD.
Ijgi 11 00555 g001
Figure 2. Study area.
Ijgi 11 00555 g002
Figure 3. Ring diagram of integrated network of the urban agglomeration in the middle reaches of Yangtze River in 2011 and 2020.
Ijgi 11 00555 g003
Figure 4. Integrated network distribution of the urban agglomeration in the middle reaches of the Yangtze River: (a) 2011; (b) 2020.
Ijgi 11 00555 g004
Figure 5. Urban node hierarchy distribution of the urban agglomeration in the middle reaches of Yangtze River: (a) 2011; (b) 2020.
Ijgi 11 00555 g005
Figure 6. Average quality development level and variation coefficient of the urban agglomeration in the middle reaches of the Yangtze River from 2011 to 2020.
Ijgi 11 00555 g006
Figure 7. Box chart of HQD in the middle reaches of the Yangtze River from 2011 to 2020.
Ijgi 11 00555 g007
Figure 8. Spatial and temporal distribution of HQDL of the urban agglomeration in the middle reaches of the Yangtze River: (a) 2011; (b) 2020.
Ijgi 11 00555 g008
Table 1. The index system of HQD.
Target LayerCriterion LayerIndex Layer
Innovative developmentInnovation environmentShare of expenditure on science and technology; share of expenditure on education; number of colleges per 10,000 people; number of college teachers per 10,000 people
Innovation outputNumber of patent applications per 10,000 people; number of college students per 10,000 people; percentage of tertiary industry employees; percentage of science and technology employees
Co-ordinated developmentUrban–rural co-ordinationIndex of disposable income difference between urban and rural residents; the proportion of primary industry in GDP
Industrial structure co-ordinationShare of tertiary industry in GDP; index of rationalization of industrial structure; index of advanced industrial structure
Economic stabilityUrban registered unemployment rate; economic growth rate; GDP per capita
Inflation levelConsumer price index
Green developmentResource consumptionElectricity consumption per unit of GDP; water consumption per unit of GDP
Greening and environmental protectionGreen area per capita; green coverage rate of built-up areas; harmless treatment rate of domestic garbage; treatment rate of domestic sewage; comprehensive utilization rate of industrial solid waste; industrial wastewater emissions per 10,000 people; sulfur dioxide emissions per 10,000 people; industrial smoke and dust emissions per 10,000 people
Opening developmentForeign tradeImport and export trade per capita; the number of foreign invested enterprises as a percentage; the actual amount of foreign capital utilized per capita
ShippingRoad passenger volume; road cargo volume
Communication situationNumber of cell phone subscribers per 10,000 people; number of postal and telecommunications services per 10,000 people; number of Internet users per 10,000 people
Sharing developmentPeople’s livelihoodDisposable income per capita; average wage of employees on the job; total social consumer goods per capita
Cultural benefitsNumber of books in libraries per 100 people; number of museums per 10,000 people
Medical benefitsNumber of physicians per 100 people; number of medical beds per 100 people
Education benefitsElementary school teacher–student ratio; secondary school teacher–student ratio
Transportation facilitiesRoad area per capita; number of public vehicles per 10,000 people
InfrastructureGas penetration rate; water penetration rate
Living situationLiving space per capita; real estate development investment per capita; residential development investment per capita
Table 2. Indicators and meanings of undirected weighted symmetric networks.
IndicatorsCalculation FormulaVariable ExplanationPractical Significance
Network density D = i = 1 N j = 1 n d ( n i , n j ) N ( N 1 ) D is the information network density, N is the number of city nodes in the integrated network, and d(ni, nj) is the number of links between city node i and city node jThe closeness of the city network as a whole and its individual connections
Clustering coefficient C = 2 e i k i ( k i 1 ) C is the information network clustering coefficient, ei is the number of neighboring edges of city node i, and ki is the number of edges connected to city node iClustering of urban nodes in urban networks
Average path length L = 1 1 / 2 N ( N 1 ) i j d i j L is the average path length, and dij is the shortest path between city node i and city node jOverall transmission performance of urban networks
Weighted degree centrality W D C i = k i α ( S i k i ) ( 1 α ) WDCi is the weighted degree centrality, Si is the weighted degree, and α is the assignment parameter with a value of 0.5Weighting the importance of city nodes in the network
Table 3. Descriptive statistical results.
Variable TypeVariableObsMeanStd. Dev.MinMax
Explained variablesHQD2800.4190.0810.2810.733
Explanatory variablesDensity2800.3360.1770.0050.882
Density22800.1440.1450.0000.777
Degree2800.7650.9590.0367.295
Control variablesln Gov2802.8350.2931.9014.200
ln Innovation2803.9550.3251.5904.780
ln Digital2806.6700.9085.32510.085
ln Opening280−1.3600.901−5.301−0.118
Table 4. The HQD of the urban agglomeration in the middle reaches of the Yangtze River from 2011 to 2020.
2011201220132014201520162017201820192020
Nanchang0.465 0.494 0.500 0.516 0.523 0.541 0.569 0.577 0.589 0.603
Jingdezhen0.361 0.378 0.383 0.388 0.395 0.426 0.442 0.469 0.506 0.526
Pingxiang0.330 0.362 0.364 0.373 0.380 0.403 0.437 0.446 0.456 0.496
Jiujiang0.381 0.409 0.411 0.416 0.421 0.436 0.461 0.449 0.467 0.490
Xinyu0.375 0.398 0.395 0.412 0.415 0.445 0.456 0.467 0.494 0.500
Yingtan0.334 0.377 0.370 0.383 0.390 0.413 0.456 0.431 0.466 0.496
Ji’an0.323 0.349 0.358 0.380 0.385 0.394 0.406 0.403 0.416 0.437
Yichun0.317 0.318 0.347 0.362 0.359 0.362 0.387 0.401 0.419 0.458
Fuzhou0.323 0.355 0.373 0.371 0.378 0.391 0.405 0.413 0.420 0.461
Shangrao0.352 0.363 0.367 0.379 0.372 0.379 0.401 0.396 0.437 0.442
Wuhan0.558 0.601 0.621 0.650 0.686 0.689 0.693 0.715 0.733 0.671
Huangshi0.314 0.355 0.376 0.370 0.389 0.412 0.429 0.420 0.444 0.444
Yichang0.354 0.398 0.394 0.406 0.409 0.457 0.455 0.469 0.479 0.467
Xiangyang0.352 0.370 0.381 0.404 0.416 0.419 0.451 0.450 0.465 0.459
Ezhou0.325 0.357 0.373 0.383 0.378 0.405 0.417 0.420 0.443 0.452
Jingmen0.322 0.341 0.363 0.380 0.384 0.394 0.413 0.406 0.409 0.415
Xiaogan0.288 0.360 0.335 0.343 0.361 0.370 0.390 0.383 0.395 0.423
Jingzhou0.281 0.309 0.298 0.329 0.342 0.370 0.385 0.386 0.399 0.394
Huanggang0.290 0.319 0.341 0.389 0.370 0.381 0.403 0.383 0.386 0.376
Xianning0.313 0.346 0.344 0.363 0.358 0.392 0.392 0.397 0.421 0.411
Changsha0.524 0.557 0.571 0.573 0.583 0.611 0.642 0.656 0.671 0.668
Zhuzhou0.385 0.407 0.400 0.435 0.424 0.440 0.473 0.487 0.488 0.512
Xiangtan0.354 0.381 0.404 0.418 0.425 0.439 0.463 0.481 0.485 0.522
Hengyang0.323 0.329 0.340 0.357 0.373 0.374 0.408 0.414 0.430 0.469
Yueyang0.346 0.369 0.373 0.390 0.393 0.402 0.430 0.413 0.429 0.471
Changde0.336 0.354 0.382 0.398 0.394 0.412 0.448 0.446 0.458 0.491
Yiyang0.289 0.352 0.339 0.352 0.364 0.378 0.398 0.412 0.408 0.439
Loudi0.296 0.349 0.336 0.338 0.335 0.355 0.395 0.408 0.403 0.437
Table 5. Moran’s I index of HQDL of the urban agglomeration in the middle reaches of the Yangtze River.
YearMoran’s IZ-Valuep-ValueYearMoran’s IZ-Valuep-Value
2011−0.196 *−1.3750.0842016−0.215 *−1.6190.053
2012−0.194 *−1.3940.0822017−0.224 **−1.6650.048
2013−0.202 *−1.4730.0702018−0.197 *−1.4210.078
2014−0.198 *−1.4630.0722019−0.208 *−1.5090.066
2015−0.209 *−1.6080.0542020−0.143−0.8860.188
Note: the expected value of Moran’s I is −0.037; * and ** mean passing the significance level test of 10% and 5%.
Table 6. OLS regression results.
VariablesCoefficientStd. Dev.
Density−0.206 ***0.050
Density20.306 ***0.060
Degree0.052 ***0.003
ln Gov−0.0140.009
ln Innovation−0.0060.007
ln Digital0.020 ***0.003
ln Opening0.019 ***0.003
R20.773
Note: *** mean passing the significance level test of 1%.
Table 7. Multivariate collinearity test and stationarity test.
VariablesMulticollinearity TestStationarity Test
VIF1/VIFStatisticProbStationarity
Density1.3460.742942−3.3260.000Stability
Density21.3490.741290−3.2360.000Stability
Degree1.1960.836120−16.8250.000Stability
ln Gov1.2560.796178−2.85880.002Stability
ln Innovation1.0390.962464−7.69850.000Stability
ln Digital1.3260.754148−5.64710.000Stability
ln Opening1.0610.942507−8.53960.000Stability
Mean1.225
Table 8. Test of spatial econometric model.
Test ItemsCoefficientp-ValueTest ItemsCoefficientp-Value
LM_lag16.2480.000Wald_spatial_lag24.0000.001
Robust LM_lag19.6480.000LR_spatial_Lag23.2000.002
LM_error1.0410.307Wald_spatial_error24.940<0.001
Robust LM_error4.4410.035LR_spatial_error24.2900.001
Hausman−7.770<0.001
Table 9. Regression results of spatial econometric model.
VariablesSLMSEMSDM
CoefficientStd. Dev.CoefficientStd. Dev.CoefficientStd. Dev.
Constant0.070 **0.0280.362 ***0.0360.129 ***0.050
Density−0.080 ***0.028−0.060 **0.028−0.057 **0.029
Density20.084 **0.0330.0520.0320.062 *0.034
Degree0.010 ***0.0020.0030.0020.009 ***0.002
ln Gov0.015 ***0.0050.012 **0.0050.010 *0.006
ln Innovation−0.006 *0.003−0.006 *0.003−0.0050.003
ln Digital0.003 **0.0010.009 **0.0040.0050.004
ln Opening0.0020.0020.0030.0020.005 **0.003
W × Density −0.0740.066
W × Density2 0.1050.073
W × Degree 0.019 ***0.004
W × ln Gov 0.0060.009
W × ln Innovation 0.0000.006
W × ln Digital −0.0060.004
W × ln Opening 0.0010.004
Ρ/λ0.762 ***0.0300.870 ***0.0250.646 ***0.045
R20.7470.4930.817
Log likelihood679.017669.387692.253
Note: *, **, and *** mean passing the significance level test of 10%, 5%, and 1%, respectively.
Table 10. Spatial effect decomposition.
Direct EffectIndirect EffectTotal Effect
CoefficientStd. Dev.CoefficientStd. Dev.CoefficientStd. Dev.
Density−0.085 **0.037−0.2810.180−0.366 *0.207
Density20.099 **0.0430.371 *0.2070.470 **0.239
Degree0.015 ***0.0030.063 ***0.0080.078 ***0.010
ln Gov0.013 **0.0060.0340.0250.047 *0.029
ln Innovation−0.0060.004−0.0090.015−0.0150.017
ln Digital0.0050.003−0.0050.007−0.0000.006
ln Opening0.006 **0.0030.0110.0110.0170.013
Note: *, **, and *** mean passing the significance level test of 10%, 5%, and 1%, respectively.
Table 11. Robustness test.
Economic Geographic MatrixPopulation Geographic Matrix
CoefficientStd. Dev.CoefficientStd. Dev.
Constant0.285 ***0.0550.272 ***0.068
Density−0.046 *0.026−0.048 *0.027
Density20.055 *0.0300.059 *0.032
Degree0.014 ***0.0020.010 ***0.002
ln Gov0.009 *0.0050.0080.005
ln Innovation−0.005 *0.003−0.005 *0.003
ln Digital0.005 *0.0030.0050.004
ln Opening0.007 ***0.0020.007 ***0.002
W × Density−0.121 **0.063−0.193 ***0.074
W × Density20.0620.0700.151 *0.080
W × Degree0.008 **0.0040.011 **0.005
W × ln Gov−0.031 ***0.010−0.0080.014
W × ln Innovation−0.0000.007−0.0050.009
W × ln Digital−0.008 **0.004−0.010 **0.004
W × ln Opening0.020 ***0.0060.022 ***0.008
ρ0.661 ***0.0480.668 ***0.053
R20.8600.846
Log likelihood725.972710.703
Note: *, **, and *** mean passing the significance level test of 10%, 5%, and 1%, respectively.
Publisher’s Note: MDPI stays neutral with regard to jurisdictional claims in published maps and institutional affiliations.

