Article

Thematic Content and Visualization Strategy for Map Design of City-Specific Culture Based on Local Chronicles: A Case Study of Dengfeng City, China

School of Geoscience and Technology, Zhengzhou University, Zhengzhou 450001, China
*
Author to whom correspondence should be addressed.
ISPRS Int. J. Geo-Inf. 2022, 11(11), 542; https://doi.org/10.3390/ijgi11110542
Submission received: 20 August 2022 / Revised: 20 October 2022 / Accepted: 25 October 2022 / Published: 30 October 2022
(This article belongs to the Special Issue Cartography and Geomedia)

Abstract

:
Local chronicles are a kind of historical record in China that are written in detail and play an important role in the transmission of local history and culture. Due to the single-text-carrier form of local chronicles, people have limited access to information on urban characteristics and culture; therefore, based on the cultural gene theory and Hofstede model, also known as the cultural onion model, this paper develops a “Spirit–Sign” content framework with the themes of urban characteristics and culture. Based on this framework, we map the urban characteristics and culture (visualization strategy and map design) of local chronicles. Taking the historic city of Dengfeng in the Central Plains as an example, the spatial information of the four historical city characteristics of Dengfeng was mined for the map design using the content framework of the city characteristics proposed in this study. The results of the study found that (1) there is a certain overlap in the spatial distribution of the four characteristic cultures of Dengfeng, indicating that the spiritual (traditional customs and famous people and events) and material (famous buildings and products) are complementary and mutually reinforcing to a certain extent; and (2) with the iterative development of Chinese dynasties, the material characteristic cultures of Dengfeng show strong temporal and spatial differences, which laterally reflect the changes in human activities and urban changes of each dynasty and also reflect the very important historical position occupied by Dengfeng in China. Compared with the traditional text-carrier form of local chronicles, the content construction and map visualization of the city’s historical and cultural information proposed in this study can effectively explore more potential cultural characteristics, as well as spatial and temporal connections of Dengfeng and thus help people better understand the historical characteristics of the city.

1. Introduction

Local chronicles are a kind of historical record of local details, and they are a product of the city’s historical and cultural heritage. Local chronicles record events from ancient times to the present day. They contain a large number of city-specific historical and cultural resources, including cultural relics and monuments, culture, customs and dialects, celebrities, art, and literature. As a kind of public cultural product, local chronicles assume the functions of storing history and educating people. They are also closely related to the historical continuity, cultural inheritance, current construction, and future development of the city; however, due to the vast amount of local chronicles resources and the single form of text carrier, it is difficult for people to process and understand them, and they have not fully entered the public’s view.
Since the 1990s, when information technology first entered the field of local chronicles, local chronicle informatization has made great progress in the establishment of local chronicle full-text databases [1], the construction of local chronicle historical geographic information systems [2], and the automatic identification and mining of local chronicle texts [3,4]. Among them, in the area of automatic recognition and mining of local chronicle texts, Bai et al. [5] constructed a mining recognition system for local- chronicle-citation books based on the pattern of the citation books of the local chronicle material, combined with functional algorithms such as N-gram word separation recognition. Xu et al. [6] performed automatic recognition of four types of entities, including property aliases, characters, origins, and citation books in ancient chronicle material. This system has also been used for the construction of the knowledge base of the material. In addition, previous research on local chronicle informatization has mainly used national historical documents combined with a geographic information system (GIS). The study of the boundaries and population of a country was conducted by establishing a historical GIS, such as the Great Britain Historical GIS [7], the United States National Historical GIS [8], and the Canadian Century Research Infrastructure (CCRI) [9], which is based on a historical database of census data. The above research has solved the problem of the huge amount of local chronicle data, but there are still challenges in little-access and low-utilization. Also, the research remains at the level of textual informatization. The large amount of city-specific historical and cultural resources recorded in local chronicles lack a richer carrier to display it; therefore, there is a need to improve the single-text-carrier form of local chronicles. By doing so, local chronicles can be made available to society as a whole so that people can read them easily and quickly.
Information visualization, as an important form of presentation of information today, can present the core content of complex data [10,11,12]. Mapping, as the most basic tool for humans to understand the world, is the best language for geographic information expression in information visualization [13,14]. With the development of society and technology, the content and form of maps are constantly evolving. As a constant topic in map research, the current way forward for map design is to break through in terms of functions and modes [15], the need for both artistic and scientific map design [16,17], the comprehensiveness of map design themes, and the richness of information. Among them, the representative and excellent atlas products published worldwide in the past ten years, such as the Arctic Nautical Atlas [18], Atlas of Chinese Natural Disaster System [19], Atlas of Switzerland [20], and Coral Triangle Atlas [21], have explored the richness of information, the comprehensiveness of topics, and the diversity of forms in their atlases and have created valuable examples for map design. Based on these excellent atlases, Weng et al. [22] selected the city of Xi’an, China, as a research case to design tourism maps through spatial narratives to reflect its artistic characteristics and put forward some operational suggestions for improving the functionality and artistry of tourism maps. Xu et al. [23] took a series of maps of innovation development in the new Shenzhen as an example to establish a content structure and visual representation by sorting out the innovation characteristics of Shenzhen. In addition, many papers in academic journals on urban maps have also focused on the themes of natural resources [24] and economic development [25] and proposed the corresponding content framework, map design, and production based on comprehensive data such as those from web searches and fieldwork; however, the current discussion on the production of maps of urban characteristics and culture based on local chronicles is rarely mentioned. In addition, the use of thematic maps to display information, as a common visualization method, helps to mine information in spatial analysis with more emphasis on spatial distribution compared to tables and charts [26,27]. Therefore, it is necessary to convert data on natural sciences [28] or social sciences [29] from local chronicles into thematic maps and use the maps for analysis.
In response to the local and informational characteristics of local chronicles, complex, hidden, and difficult-to-express information needs to be represented in visual form, for which this study started from two aspects: content framework construction and map design. In terms of content framework construction, previous authors have adopted content framework methods based on cultural gene theory [30] and the Hofstede model, also known as the cultural onion model [31]. For example, Weng et al. [32] subdivided cultural genes into ecological-cultural genes, historical-cultural genes, and folklore-cultural genes according to cultural gene theory and excavated urban cultural resources based on these three types of cultural genes. Su et al. [33] used the Hofstede model as a theoretical basis to dissect the hierarchical structure of campus-culture systems and established the thematic content system of campus-culture atlases based on it. The above research shows that both cultural gene theory and the Hofstede model can achieve the collation and construction of the corresponding content system; however, in practice, the cultural gene theory or the Hofstede model alone is relatively imperfect in the collation of urban cultural resources, while the combination of them is more effective in the collation of urban cultural resources of local chronicles. Therefore, based on cultural gene theory and the Hofstede model, this paper developed a “Spirit–Sign” content-framework model with the theme of urban characteristic culture. Based on this model, we extracted and sorted the urban cultural resources of local chronicles, which mainly focused on the textual information elements in the chronicles and how to extract and express them according to different thematic categories of textual information. For the map design, we proposed grasping the cultural characteristics of the city as a whole from the triple perspective of “time, space and people”. Then, we followed the basic map design strategy for optimizing the visual expression by figurativeness and symbolism [34,35] and explored the spatial information of the cultural characteristics of the city in terms of layout design, color emotion, and symbol creativity. Among them, expression methods such as geometric-pattern composition and artistic processing based on real objects are adopted in terms of symbol creativity. These methods enable symbols to have pictographic patterns, which are then used to indicate the real objects they represent [32,36].
In summary, this paper developed a “Spirit–Sign” content-framework model with the city’s characteristic culture as the main information source and illustrated the main theories, steps, and methods of the content framework and visualization strategies with the example of the thematic map group of Dengfeng’s characteristic culture. Finally, the pattern of cultural activities in the human society of Dengfeng city was analyzed and the map results were evaluated. We expect to improve the single-text-carrier form of local chronicles and to explore and display more potential spatial information and laws of urban characteristic culture to further develop the function of local chronicles in promoting urban construction, cultural industry, and tourism development and to provide a reference for similar map designs.

2. Materials and Methods

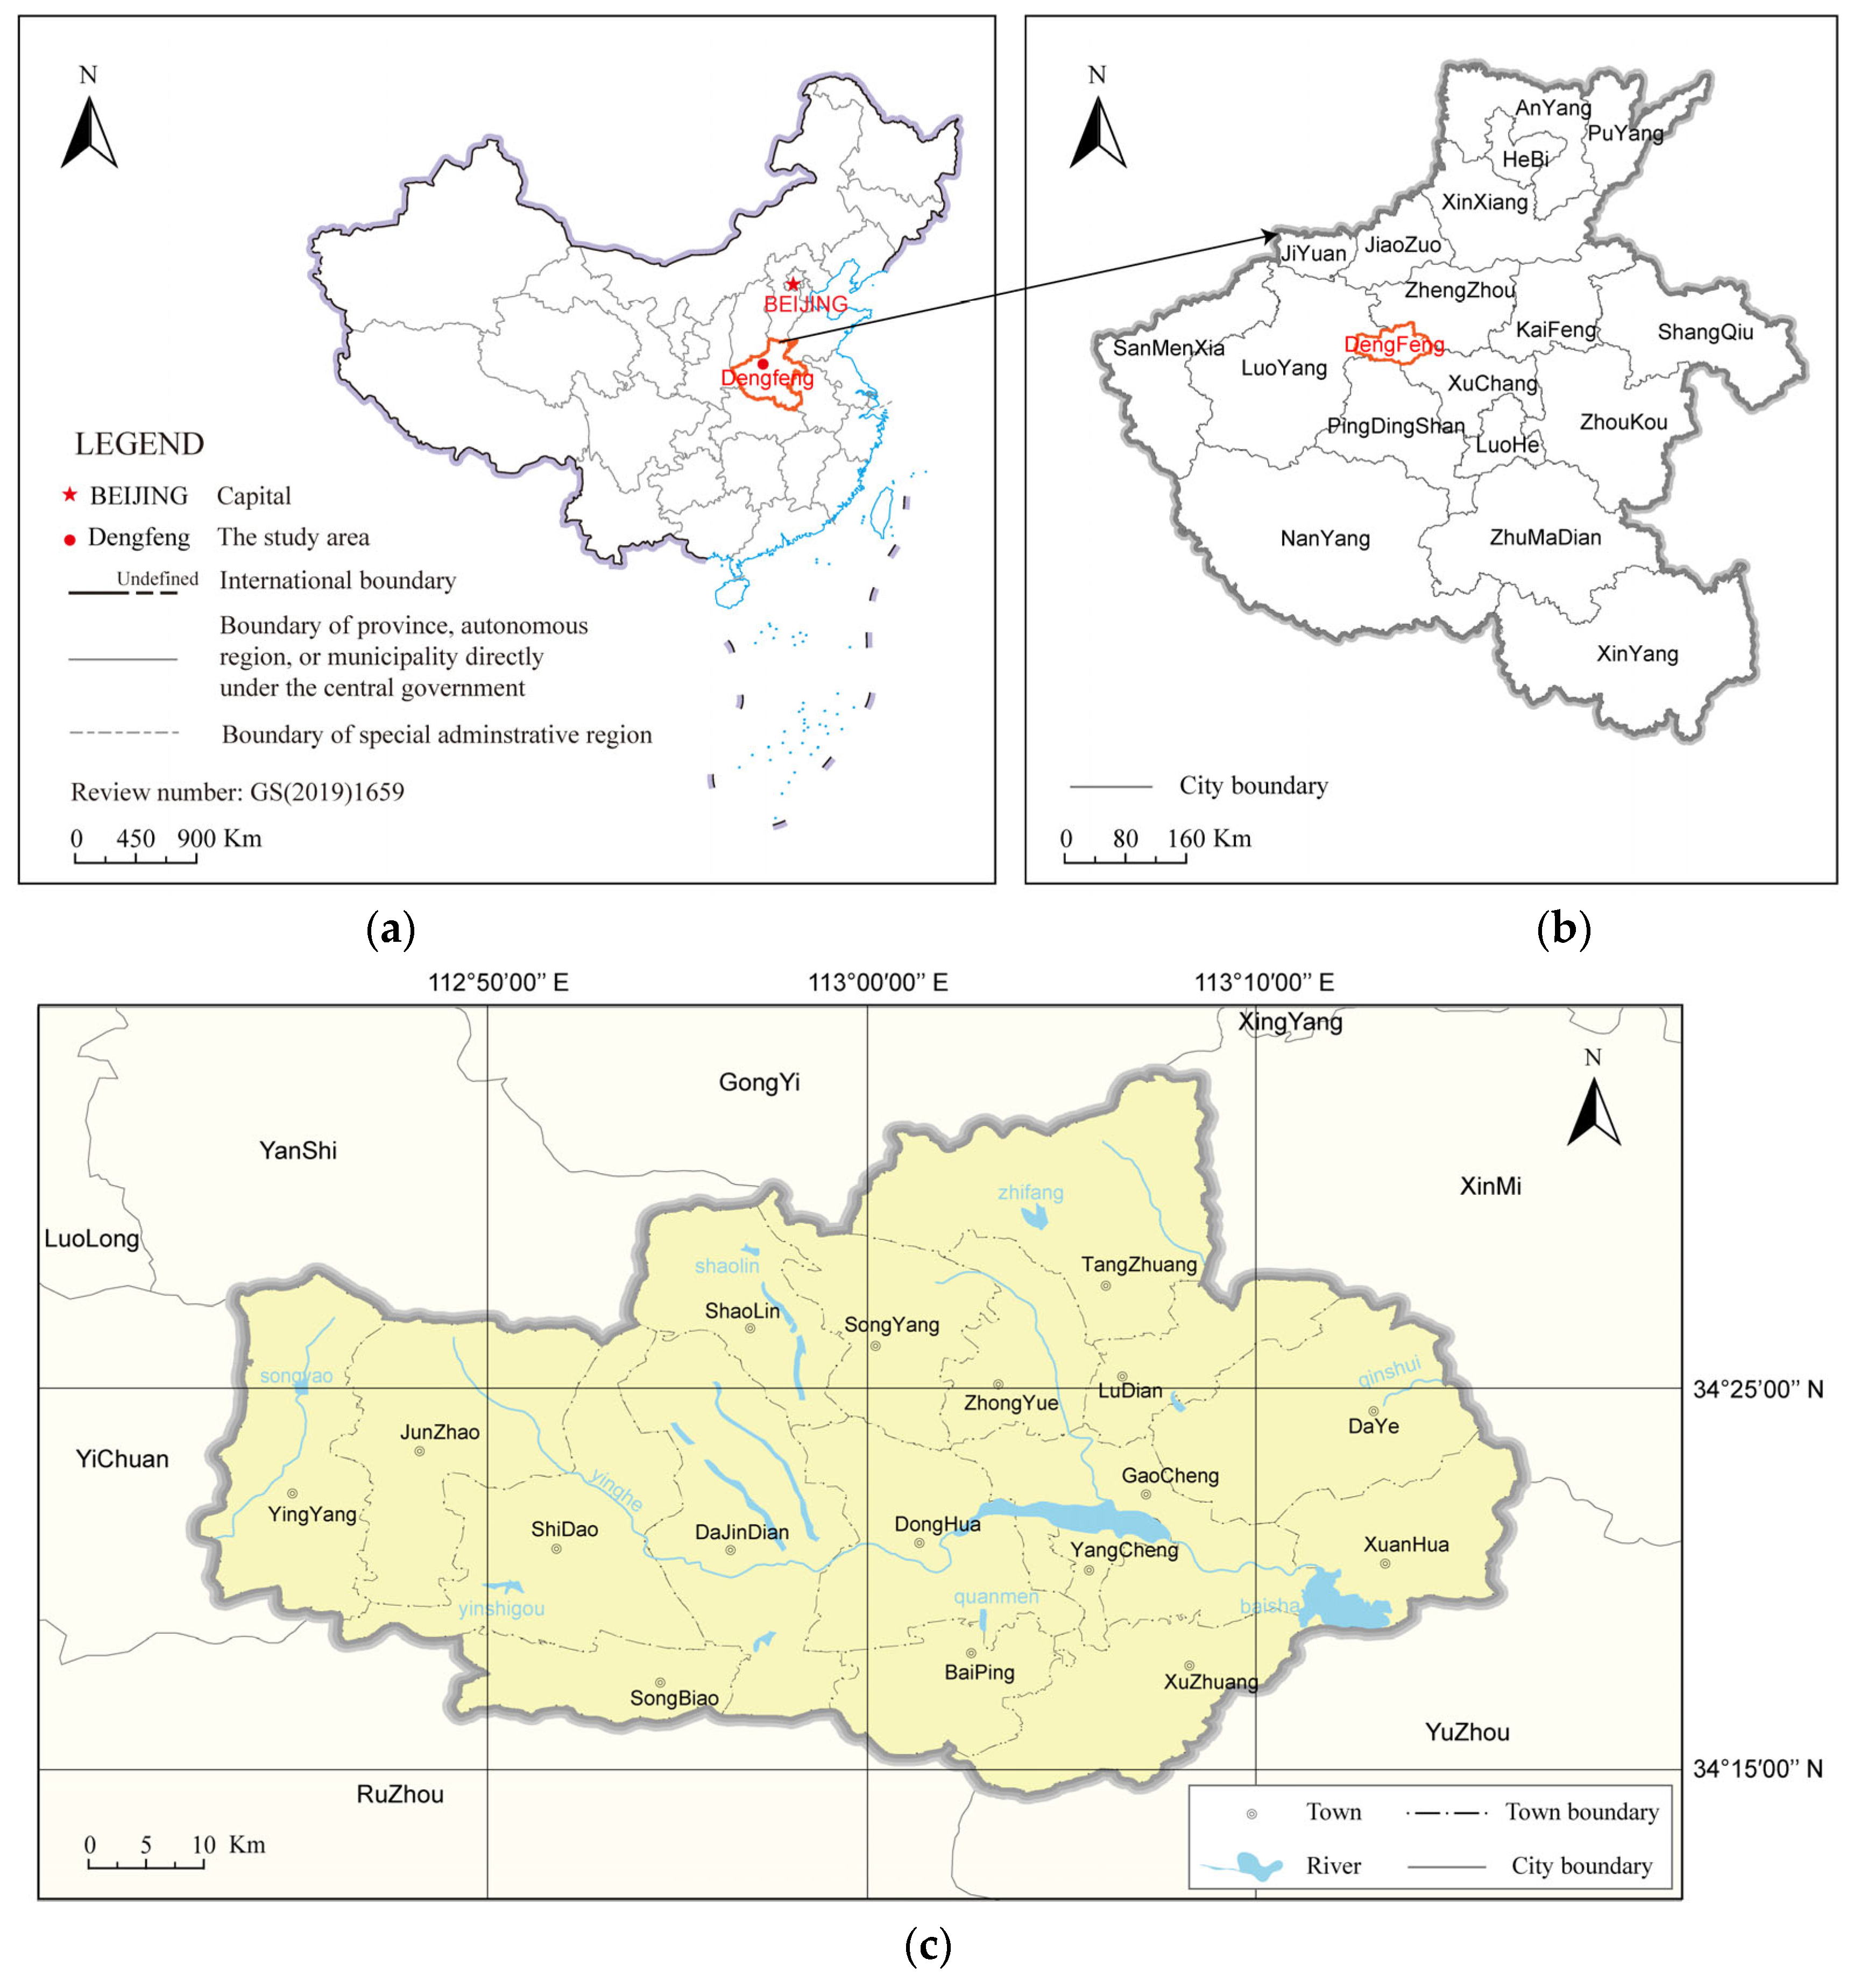
2.1. Study Area and Dataset

Dengfeng (34°35′–34°15′ N, 112°49′–113°19′ E), a historical city in central China, is part of China’s Henan Province (Figure 1). It is located in the core of the Yellow River Basin, the birthplace of Chinese civilization. With a long history of more than 8000 years, Dengfeng also has a rich cultural heritage. For example, the city has 11 World Heritage Sites, among which the Shaolin Temple in Songshan is the birthplace of Shaolin Kung Fu in China.
Urban local chronicles are a series of books that comprehensively describe the natural, geographical, political, economic, social, and cultural history and current situation of cities, with their local, contemporary, extensive, informative, scientific, and authoritative characteristics [37].
The data source of this study comes from the series of the Dengfeng City Chronicle, which is updated and revised every 15 years. The latest edition of the series, which was written in 2008, is used as the data source. The Dengfeng City Chronicle exists mainly in paper form, which one can find and buy in libraries or online stores. It is also available in electronic form, which one can find and read on online databases. Similar to the local chronicles of other cities, Dengfeng City Chronicle provides a comprehensive account of all aspects of the city’s history and current situation; however, because of its unique Shaolin martial arts culture, the excavation of many historical products, and the many famous historical events, Dengfeng City Chronicle covers unique and richer content. Also, due to its professional editorial board, this series of books covers a long period, and it records events from ancient times to the present day. In addition, it is systematic and comprehensive; therefore, we chose this area as the study area and wanted to preserve and inherit the cultural treasure of the Dengfeng City Chronicle, which will have profound significance for the development of the city’s unique culture.

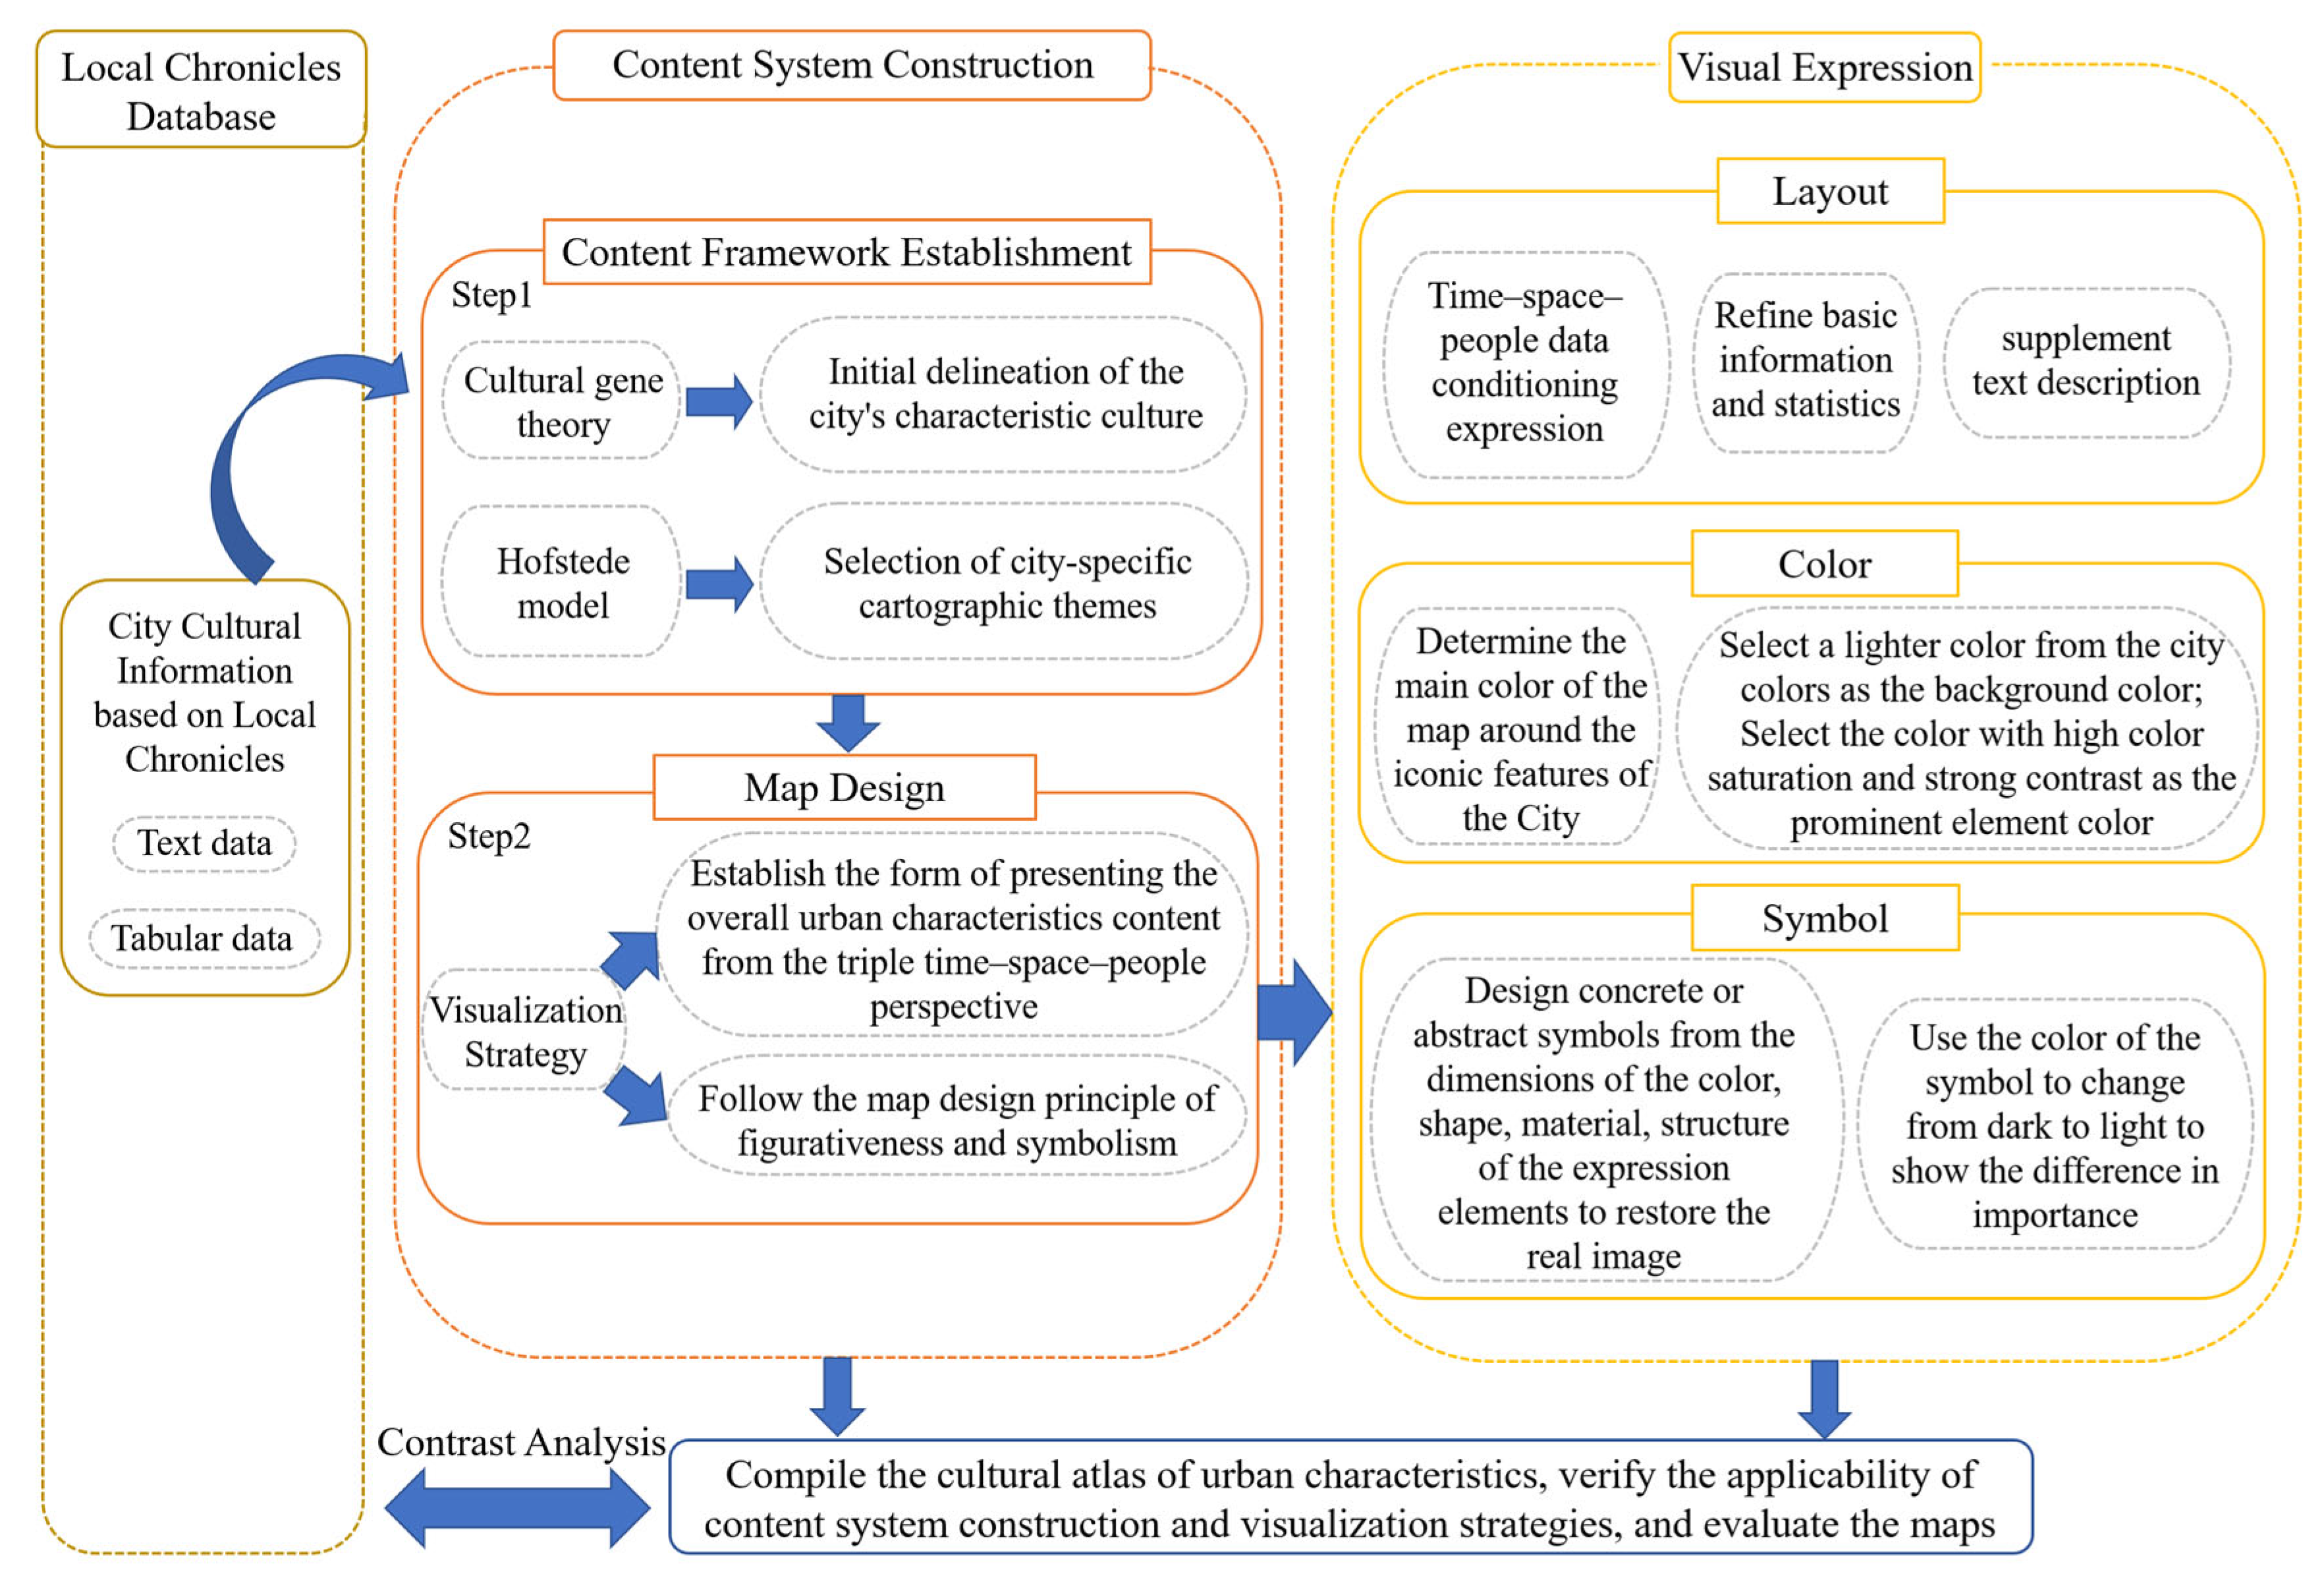
2.2. Main Steps and Methods

This study started from two aspects: content-framework construction and map design. Content-framework construction mainly refers to how to build a thematic content framework of urban characteristics and culture based on local chronicles and the selection of contents; the map design studied how to establish visualization strategies to convey local chronicle information scientifically and accurately. The flow chart of the method is shown in Figure 2 below.

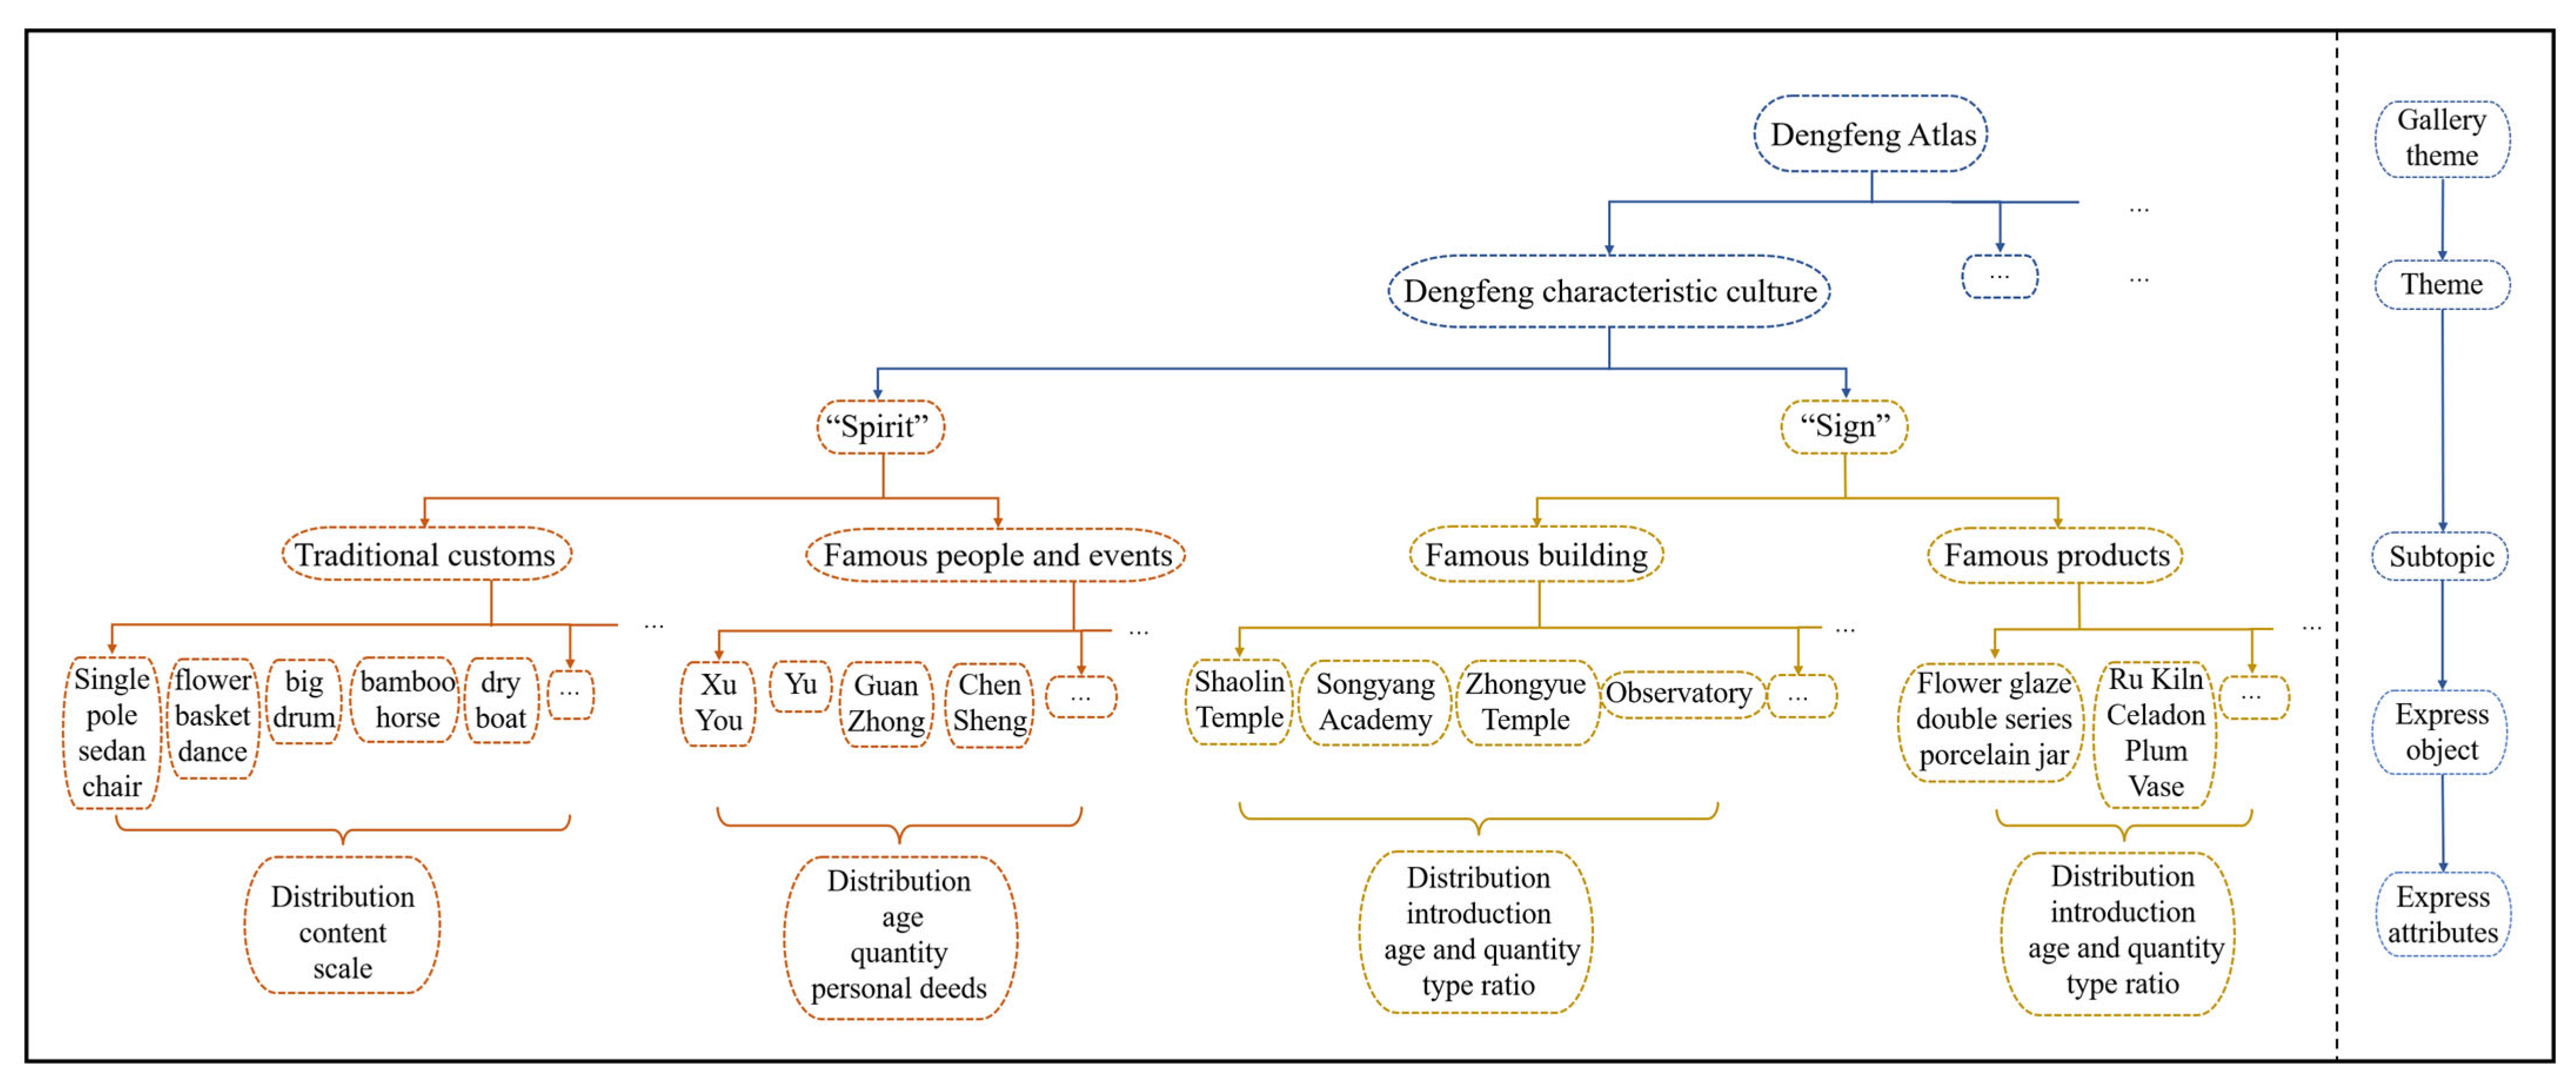
2.2.1. Step 1: Establishment of the Urban Cultural Content Framework of Local Chronicles Based on Cultural Gene Theory and the Hofstede Model

The city has many rich and diverse representative cultures, including its unique Shaolin martial arts culture, famous individuals, local cultural and artistic works, and excavated cultural relics. To clarify the connotation of each characteristic culture in the local chronicles, we carried out the following steps: first, we used cultural gene theory to initially classify the city’s distinctive cultures, and then we used the Hofstede model to select the city’s distinctive mapping themes. The specific steps are as follows.
(1)
Initial delineation of the city’s characteristic culture by cultural gene theory
The term “cultural genes” was created by analogy with biological genes, which initiated the exploration and study of the laws of cultural evolution and transmission. The resulting cultural gene theory divides cultural genes into material and immaterial cultural genes according to the mode of transmission, in which material cultural genes are mostly presented and transmitted materially, while immaterial cultural genes exist in the form of “mental states” and are transmitted through oral narratives and behavioral expressions [38]. Based on this theory, this study classified urban characteristics into material cultural characteristics and immaterial cultural characteristics by the different ways of urban cultural transmission, then classified the characteristic cultural information in local chronicles and named them figuratively “Spirit” and “Sign” to produce the initial framework, and further excavated and sorted urban characteristic resources on this initial framework.
(2)
Selection of city-specific cartographic themes based on the Hofstede model
The Hofstede model was proposed by Geert Hofstede, who argued that culture can be likened to an onion composed of different layers that interact with each other [31,39,40]: the top layer of the onion is the material “symbols”, including language, artworks, architecture, and clothing; the second layer is the character of the heroic figure; the third layer is the customs and rituals; the core layer is the values. In the general local chronicles, for the material cultural characteristics of cities (Sign), information on famous buildings and famous products is recorded; for the immaterial cultural characteristics of cities (Spirit), information on traditional customs and famous individuals and events is recorded. The different layers of the Hofstede model are compared as follows. Sign: “famous buildings” and “famous products” correspond to the material symbols on the surface of the onion. Spirit: “famous people” corresponds to the heroic character in the second layer of the onion, and “traditional customs” corresponds to the customs and rituals in the third layer of the onion model. Therefore, this study used these four types of characteristics as the map theme to establish the cultural content framework of local chronicles, and because the innermost layer of the Hofstede model, “values”, is more abstract, this study did not perform visual mapping of this layer.
The content framework of the city’s characteristic culture based on local chronicles is shown in Figure 3.

2.2.2. Step 2: Propose Visualization Strategies for the Content Framework of the City’s Characteristic Culture

After establishing the framework of urban characteristic cultural content based on local chronicles, it is necessary to establish the principles of a visualization strategy to fully realize the portrayal of multiple characteristics, such as regional uniqueness, recognizability, systematization, and temporality of urban local chronicle characteristic cultural information. This part consists of two main aspects: (1) establishing the form of presenting the overall urban characteristics content from the triple time–space–people perspective, and (2) following the map design principles of figurativeness and symbolism.
(1)
Establish the form of presenting the overall urban characteristics content from the triple time–space–people perspective
The urban environment should be seen as the result of multiple roles in space and time, the core of which is the role of human socialization [41]; therefore, to perceive and feel the characteristics of the city as a whole from the triple time–space–people perspective, we focused on the expression of the “time, space, and people” dimensions of the city’s distinctive culture in the visualization of local chronicles to help readers effectively immerse themselves in the city’s distinctive culture in all aspects.
(2)
Follow the map design principle of figurativeness and symbolism
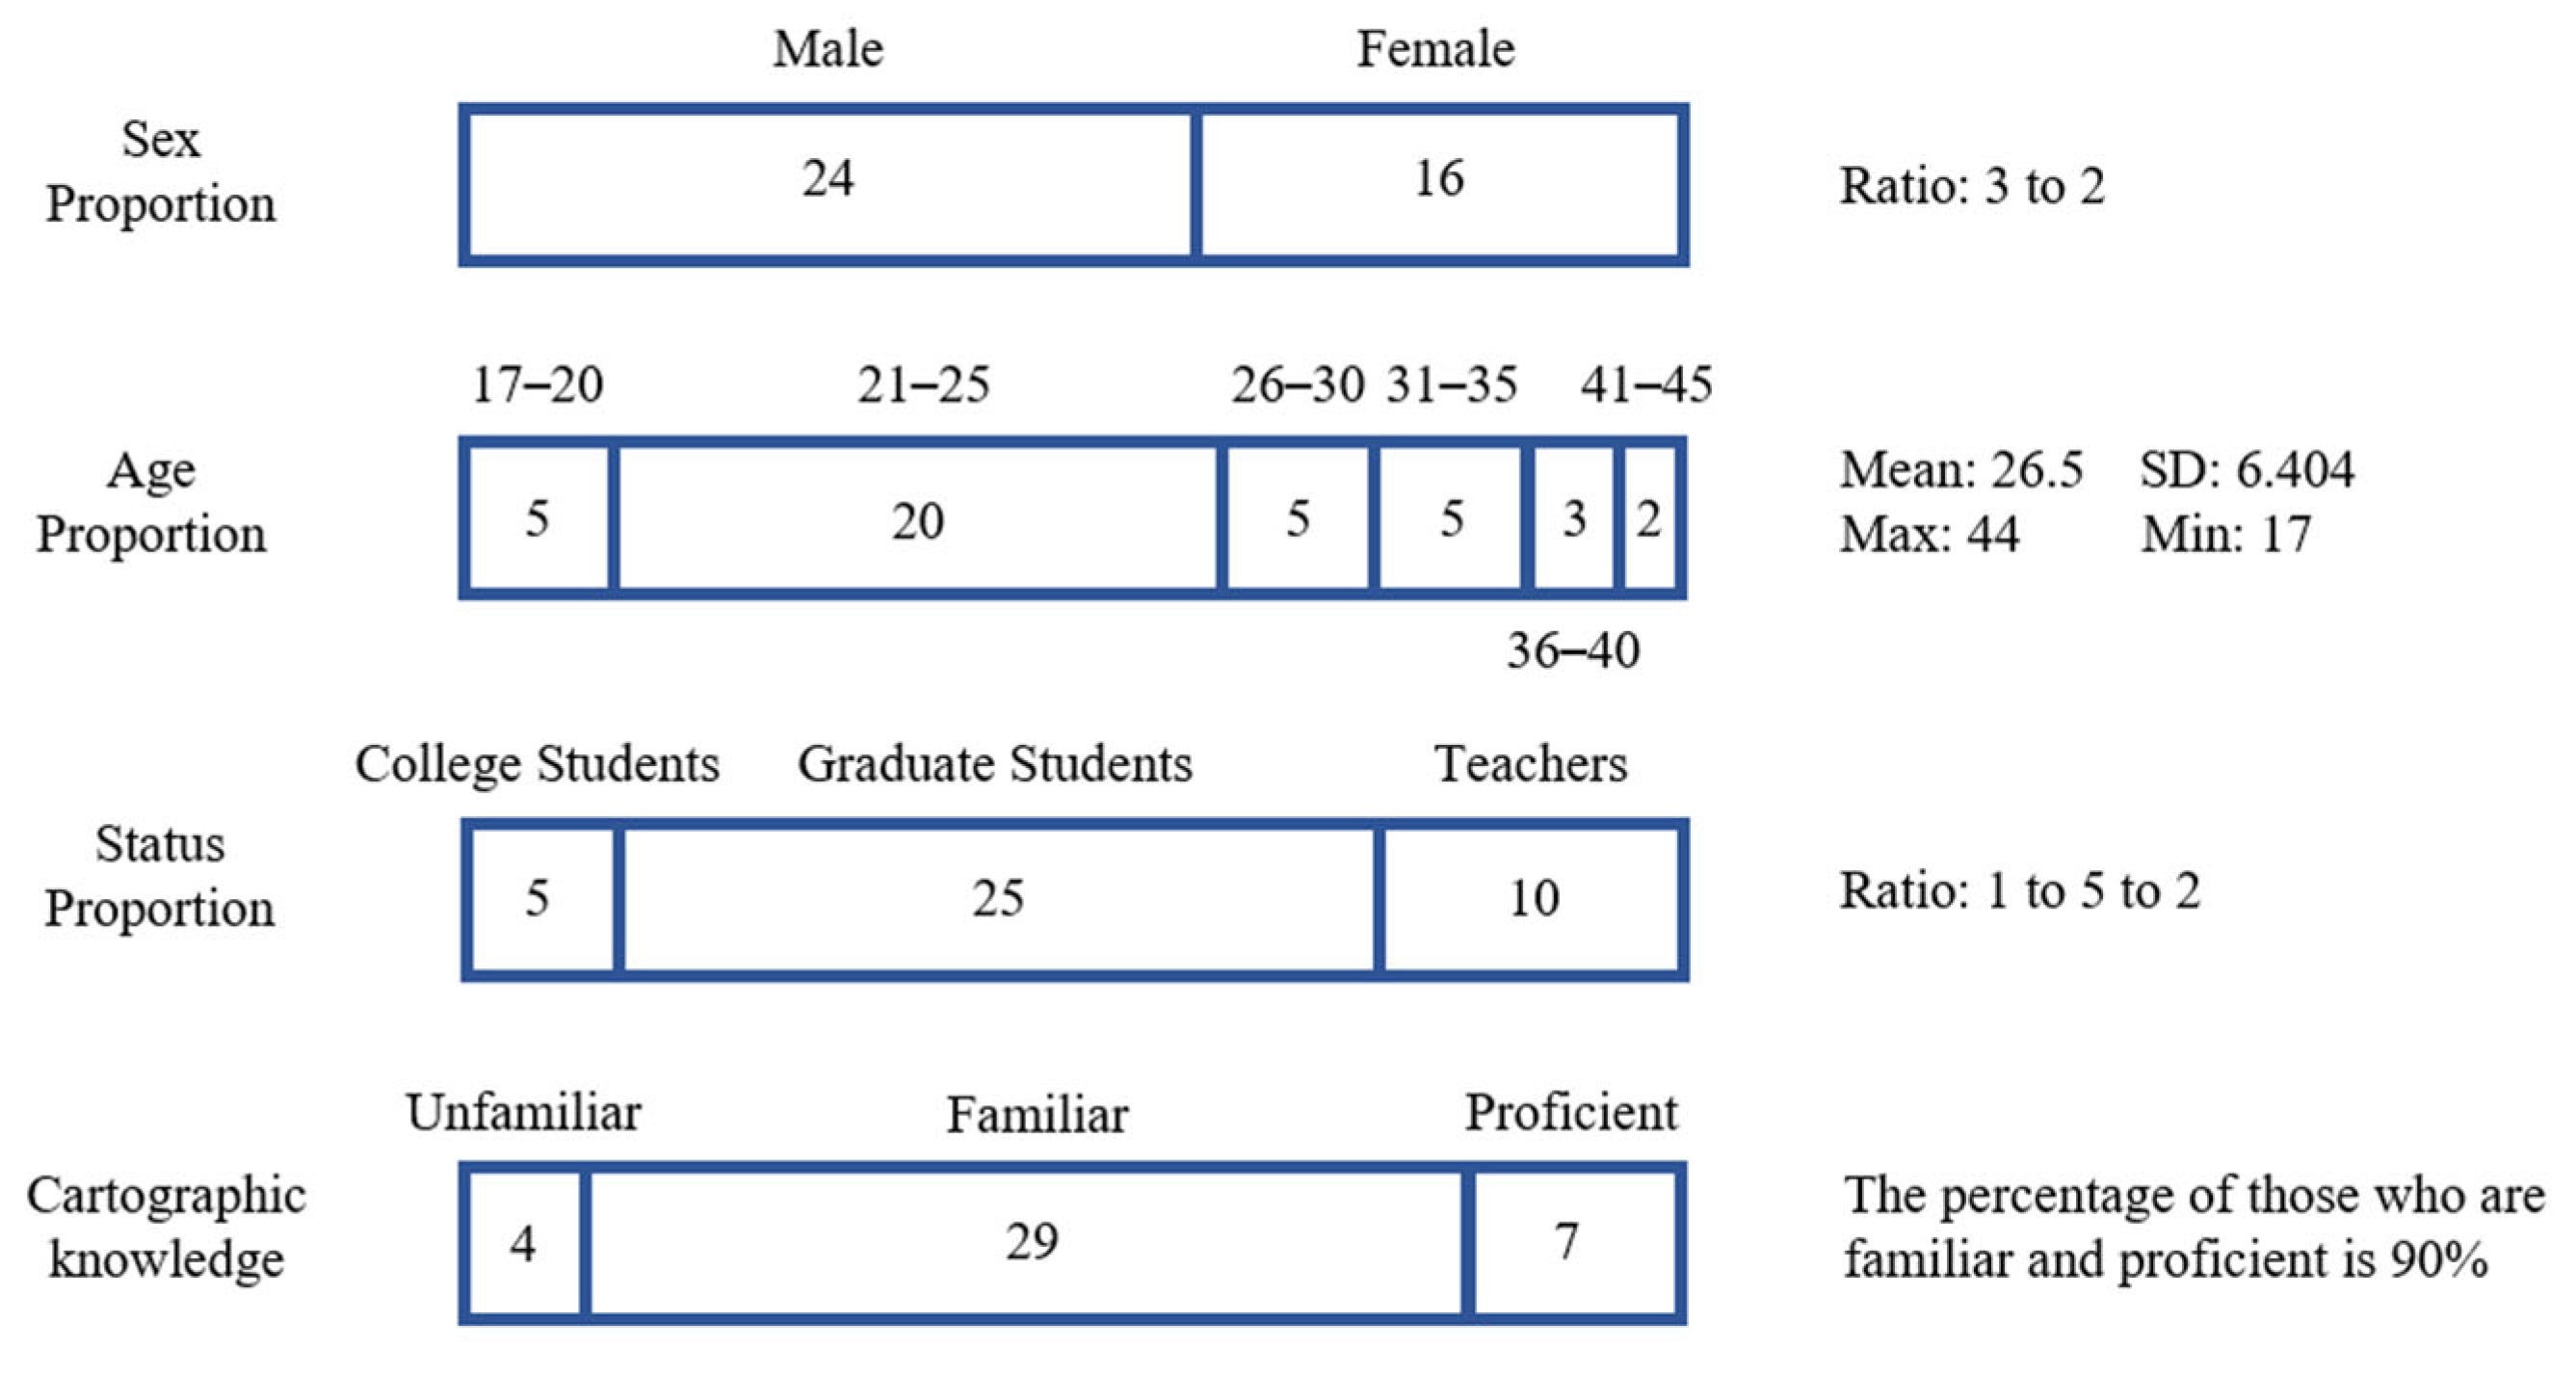
Figuration is the expression of what people see and hear in a specific context according to their cognition, while symbolization means the generalization and summary of experience through a symbolic medium [42]. When designing maps (such as color and symbol design), it should closely focus on the style of the city’s characteristics and capture its features to symbolize the city culture, promote the formation of “imagery” through figurativeness, and then elicit emotional resonance through symbolism to achieve a better visualization effect.

2.3. Map Evaluation

Cartography itself shares some common goals, i.e., whether the results of map design are effective in providing information to readers; however, the evaluation of map design is subjective and different people have different opinions; therefore, we evaluated the effectiveness of the map products of this study using a questionnaire [43]. We selected 40 respondents, who were chosen mainly because some of them were teachers engaged in map research, some were graduate students majoring in maps, and some were college students who claimed to have a strong interest in maps. The details of the respondents are shown in Figure 4. There were 24 men and 16 women who completed the survey, and the ratio of male to female respondents was 3 to 2. The age of respondents was mainly between 20 and 25 years old, and the mean age of all respondents was 26.5 years (SD: 6.404). In terms of professional status, 10 teachers, 25 graduate students, and 5 university students participated in this survey, and the proportion of respondents who were familiar with and proficient in cartography was 90%. At their own will, we invited them to participate in this questionnaire. We chose the Likert scale format, which means that the respondents responded with their level of agreement with different statements [44]. In this study, the following statements and options were set to achieve the evaluation of map products.
Statements:
  • The three-dimensional layout of these map products in terms of time, space, and people is a way to understand the city in all aspects;
  • The symbolic design and color design of these map products can convey the characteristic style of the city;
  • The pictorial point symbols are a very expressive representation in these visualizations;
  • Text descriptions in rectangular frames are a good complement to cartographic visualization;
  • These map products help access local-chronicle information, and they provide a richer carrier.
Options:
A. I strongly agree; B. I agree; C. neutral; D. I disagree; E. I strongly disagree.

3. Results

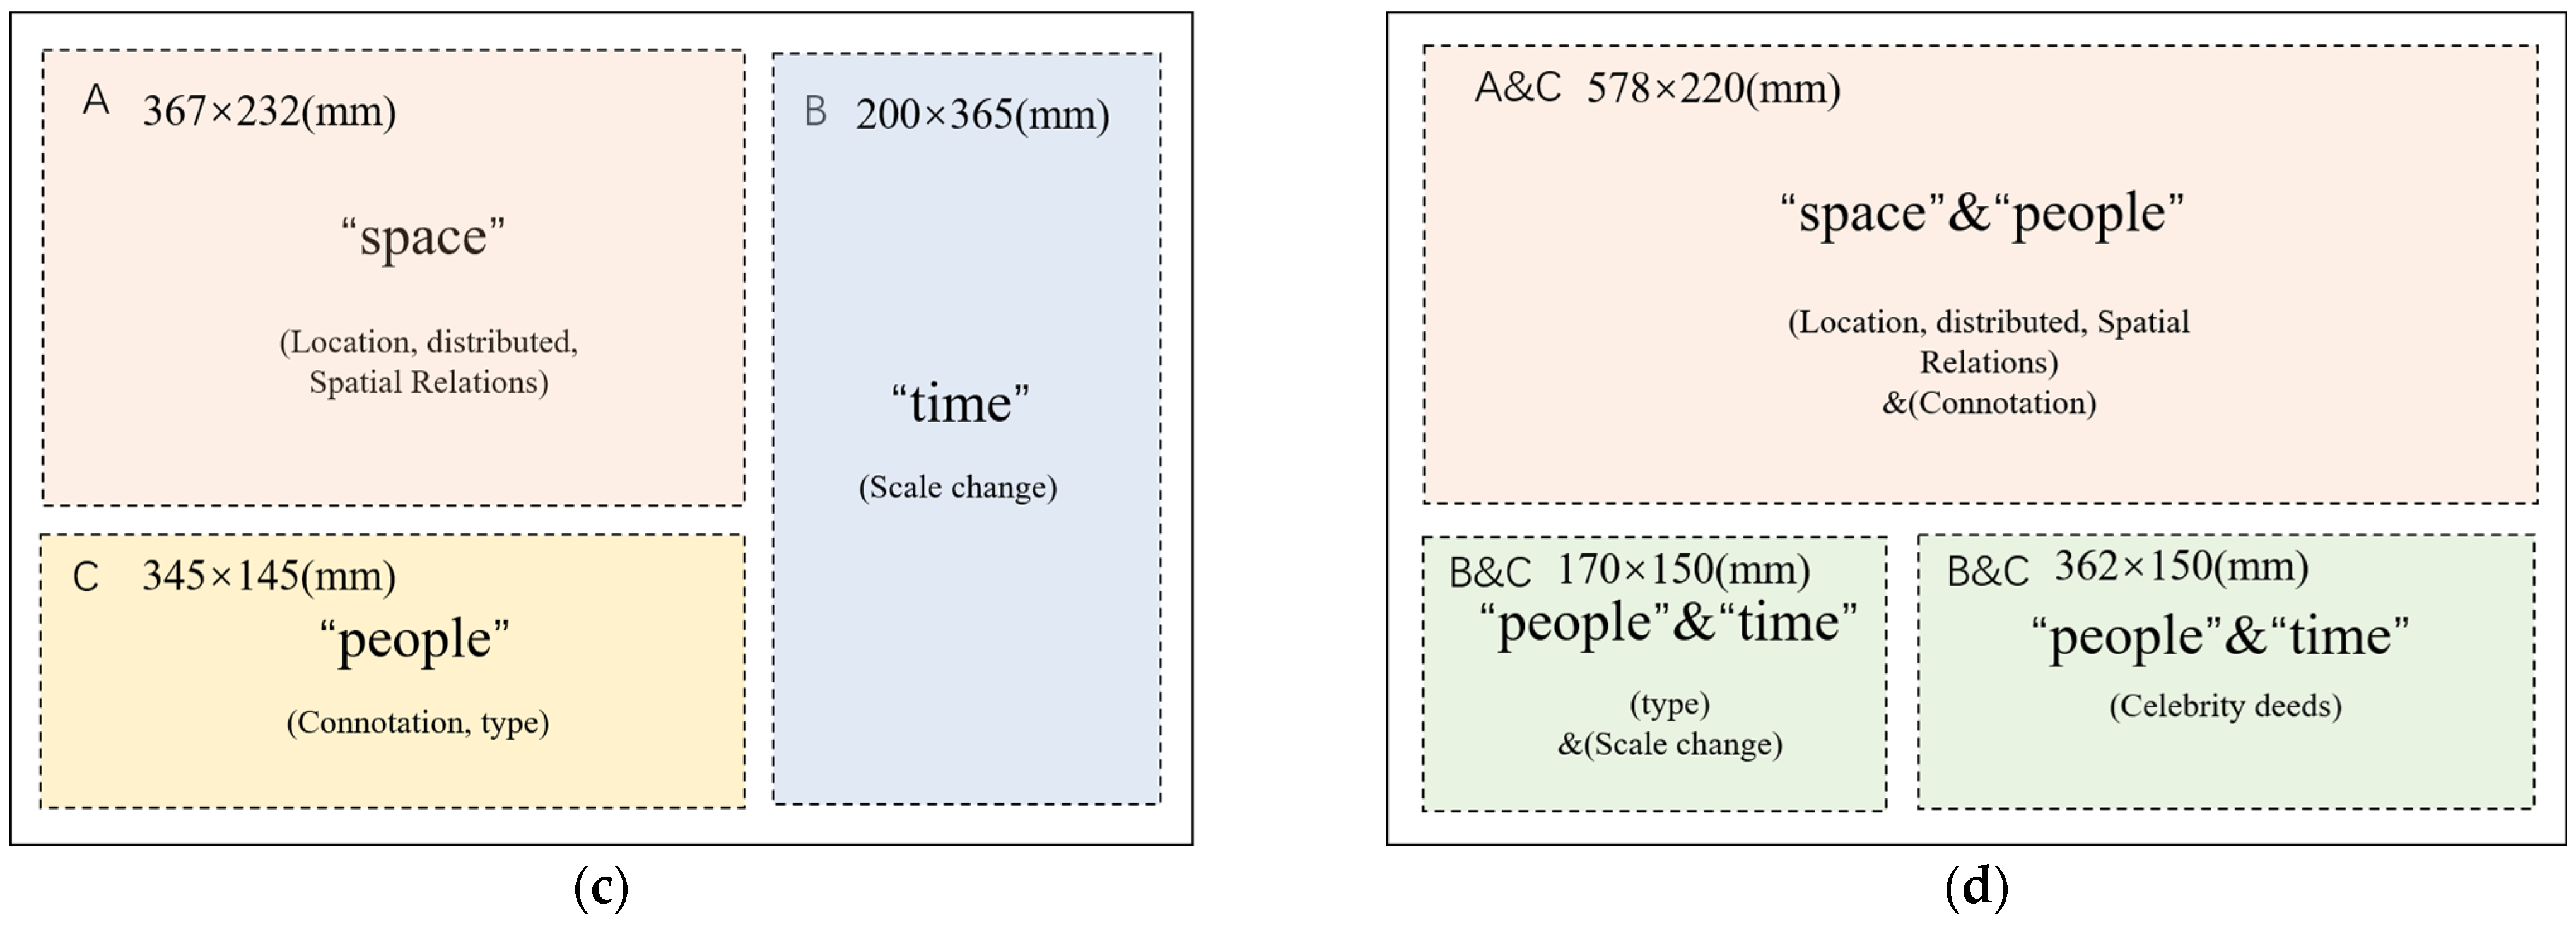
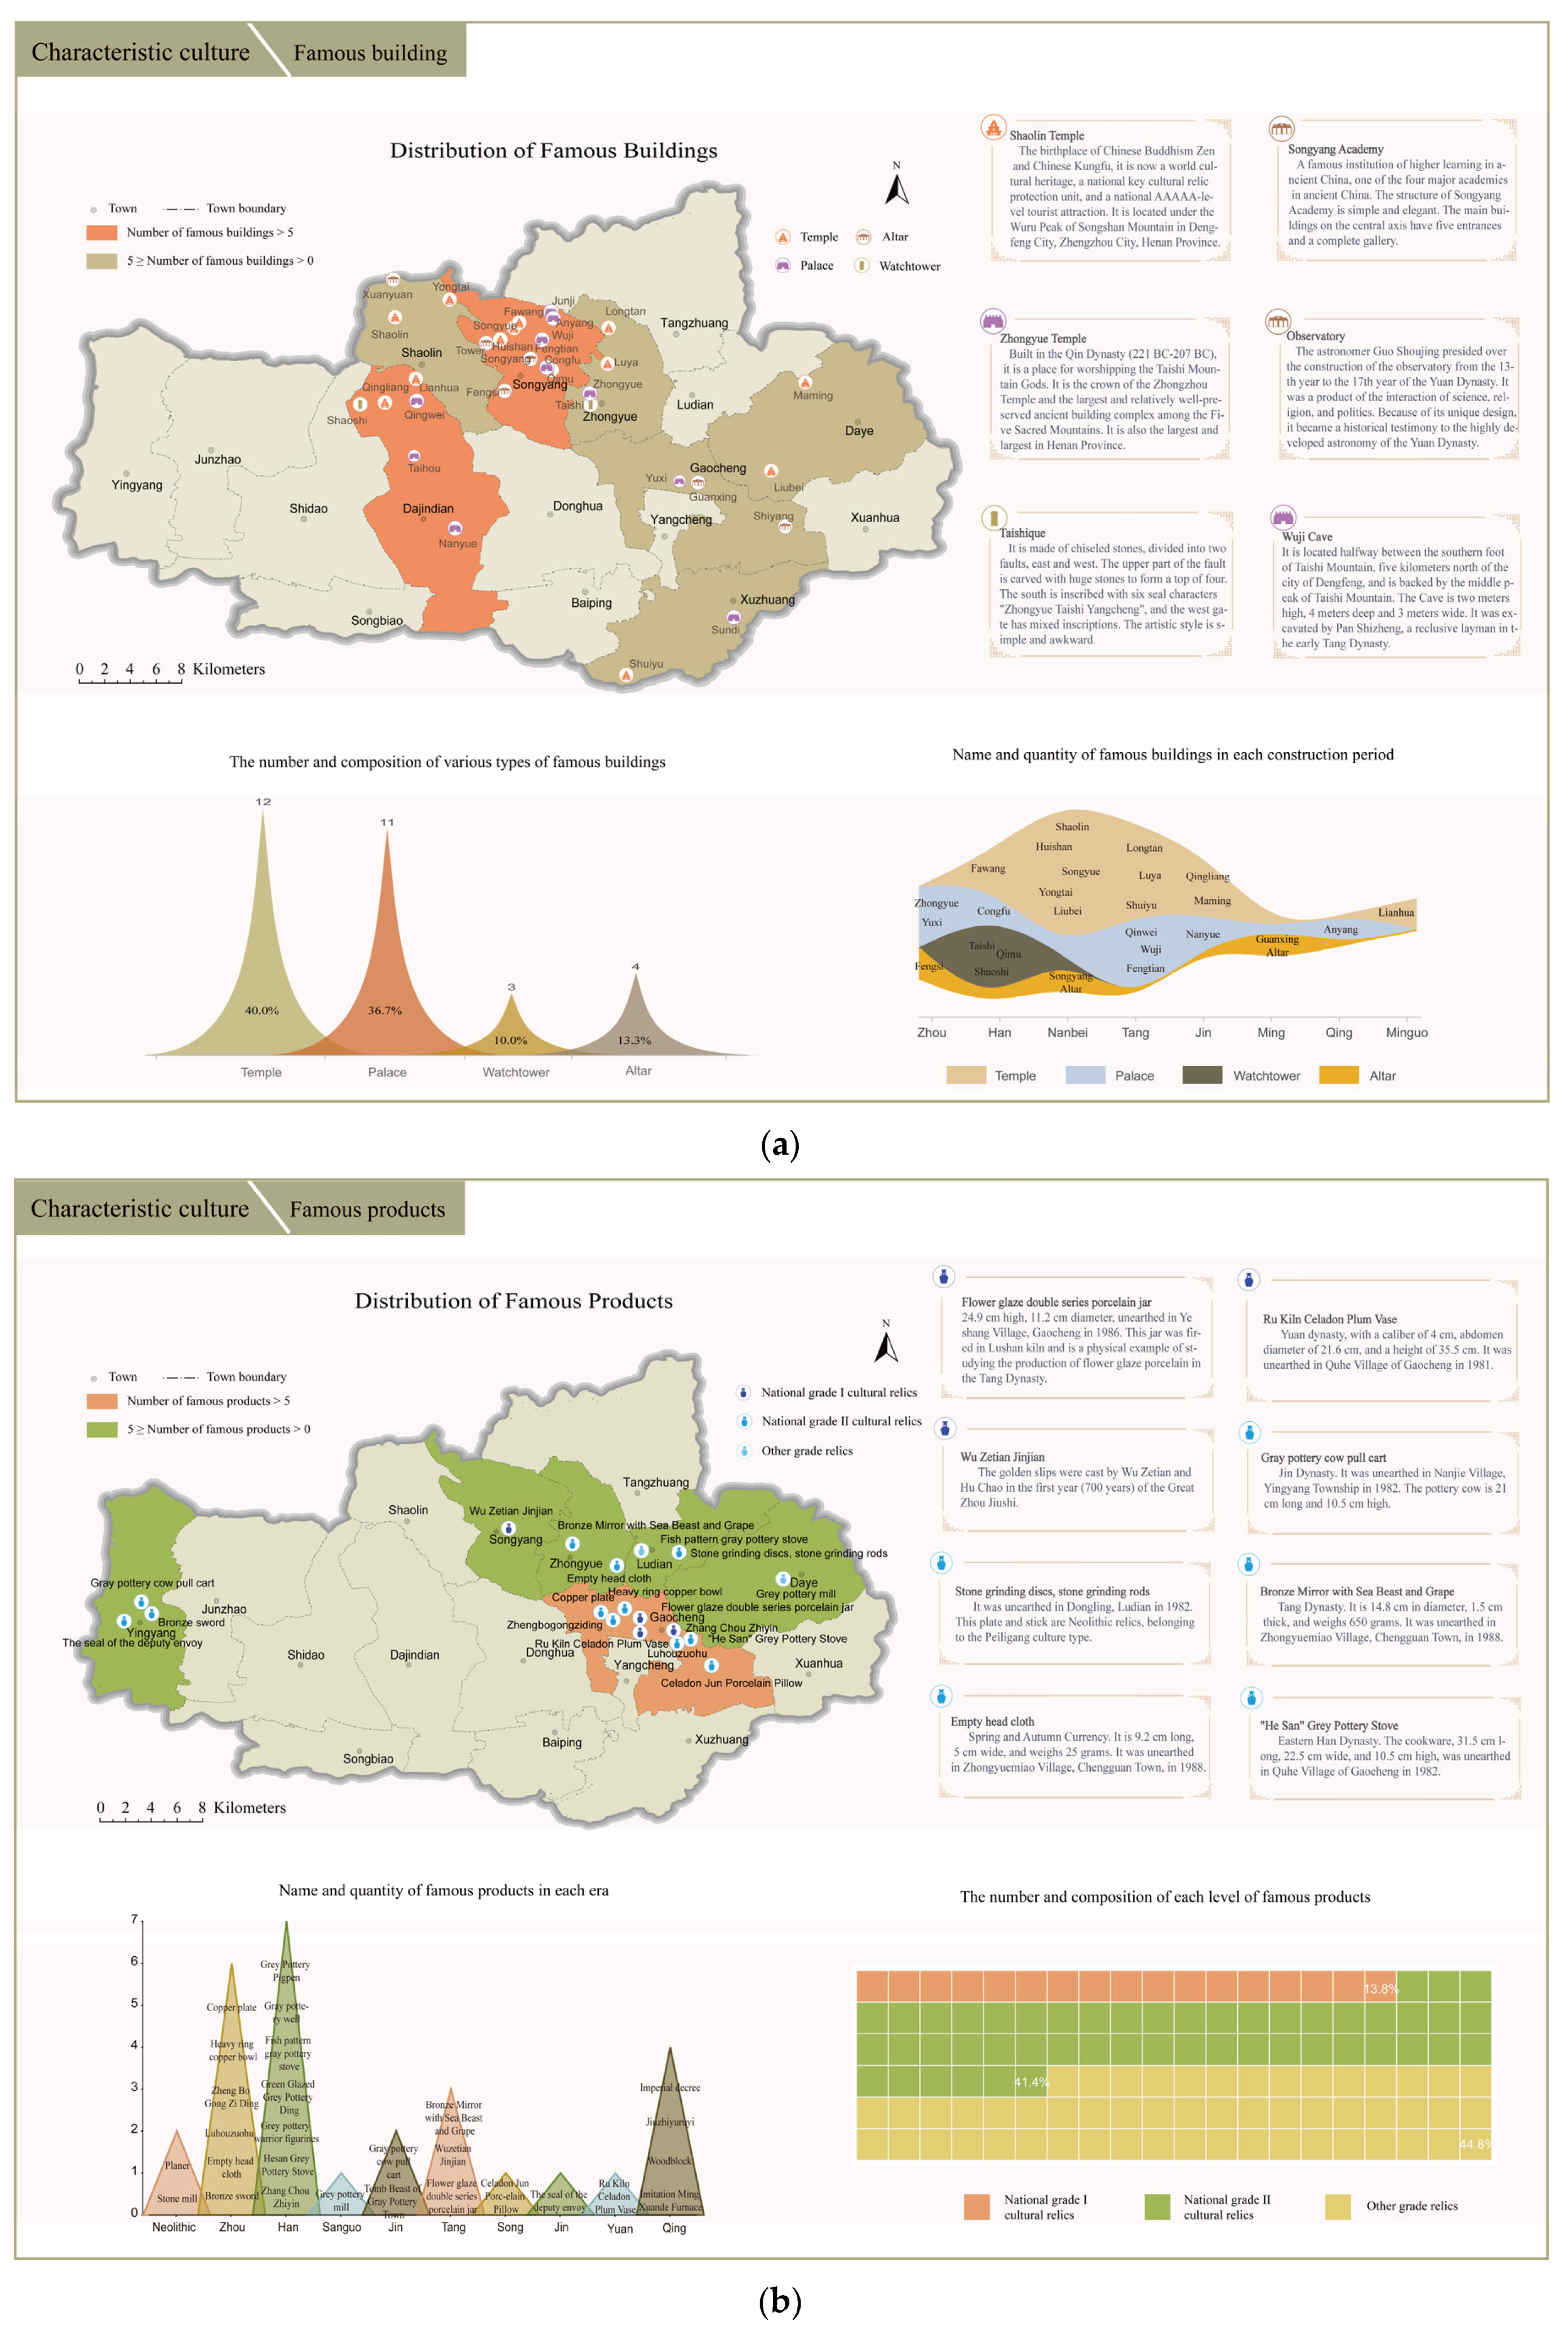
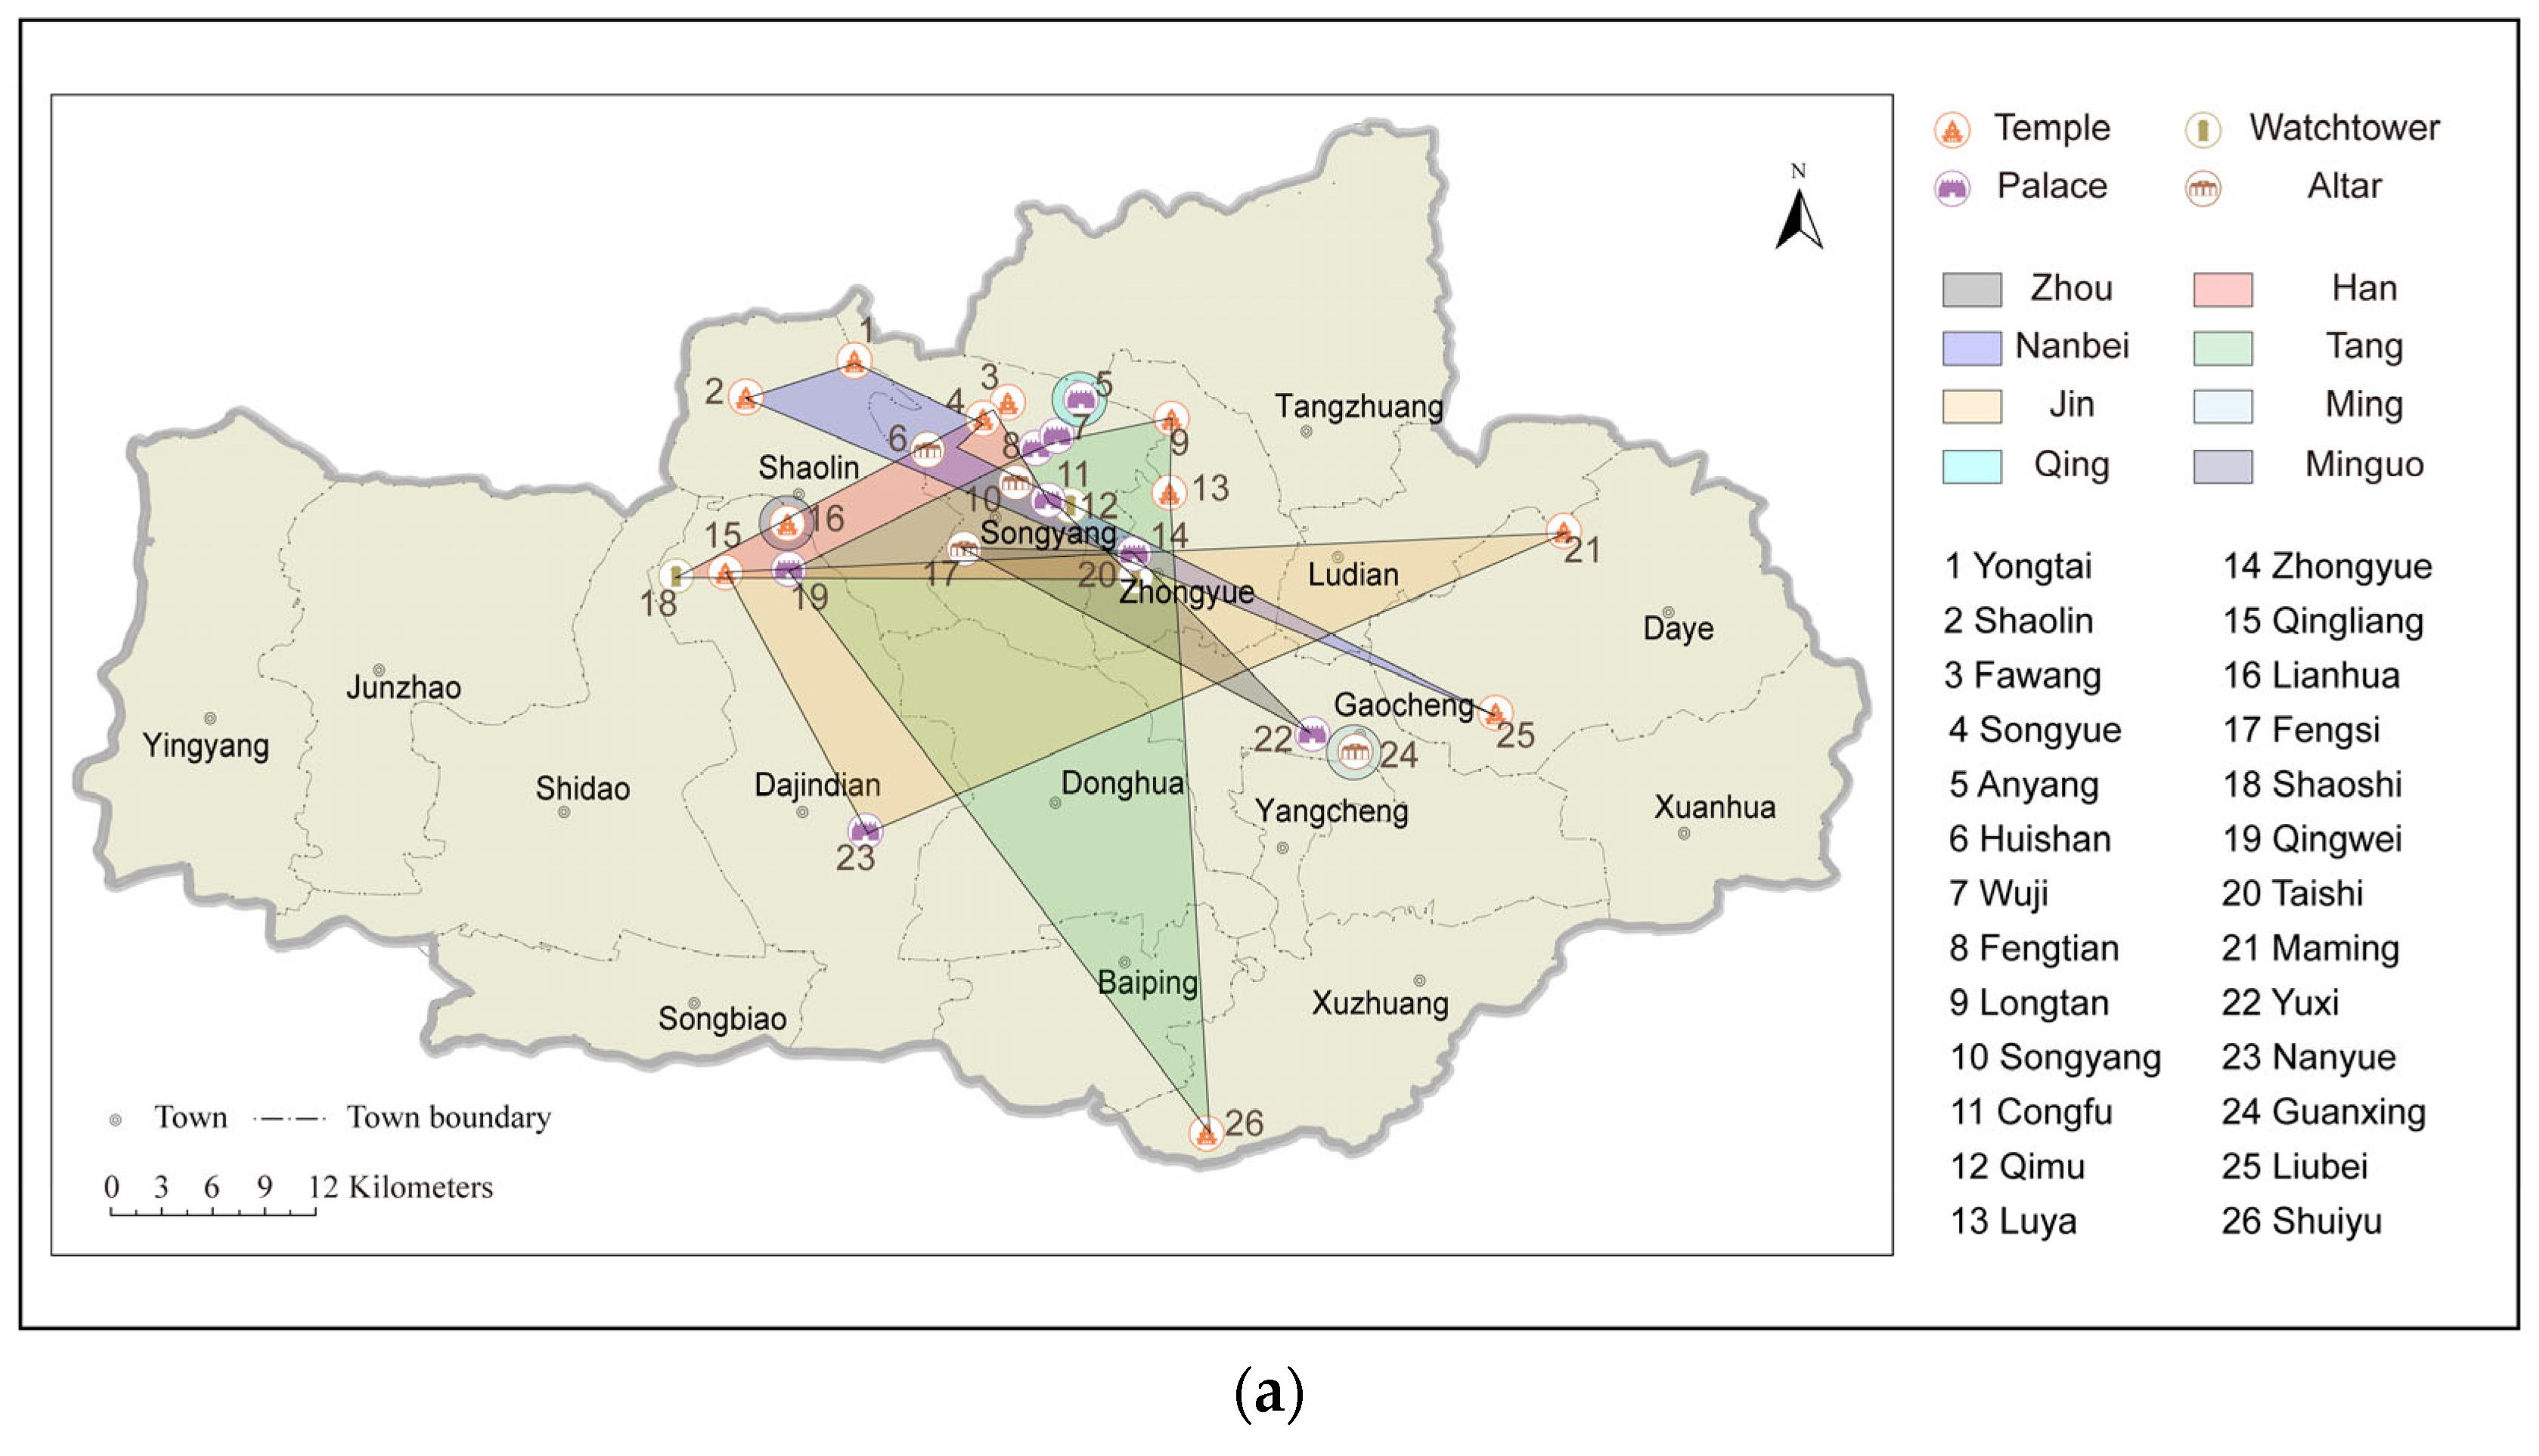
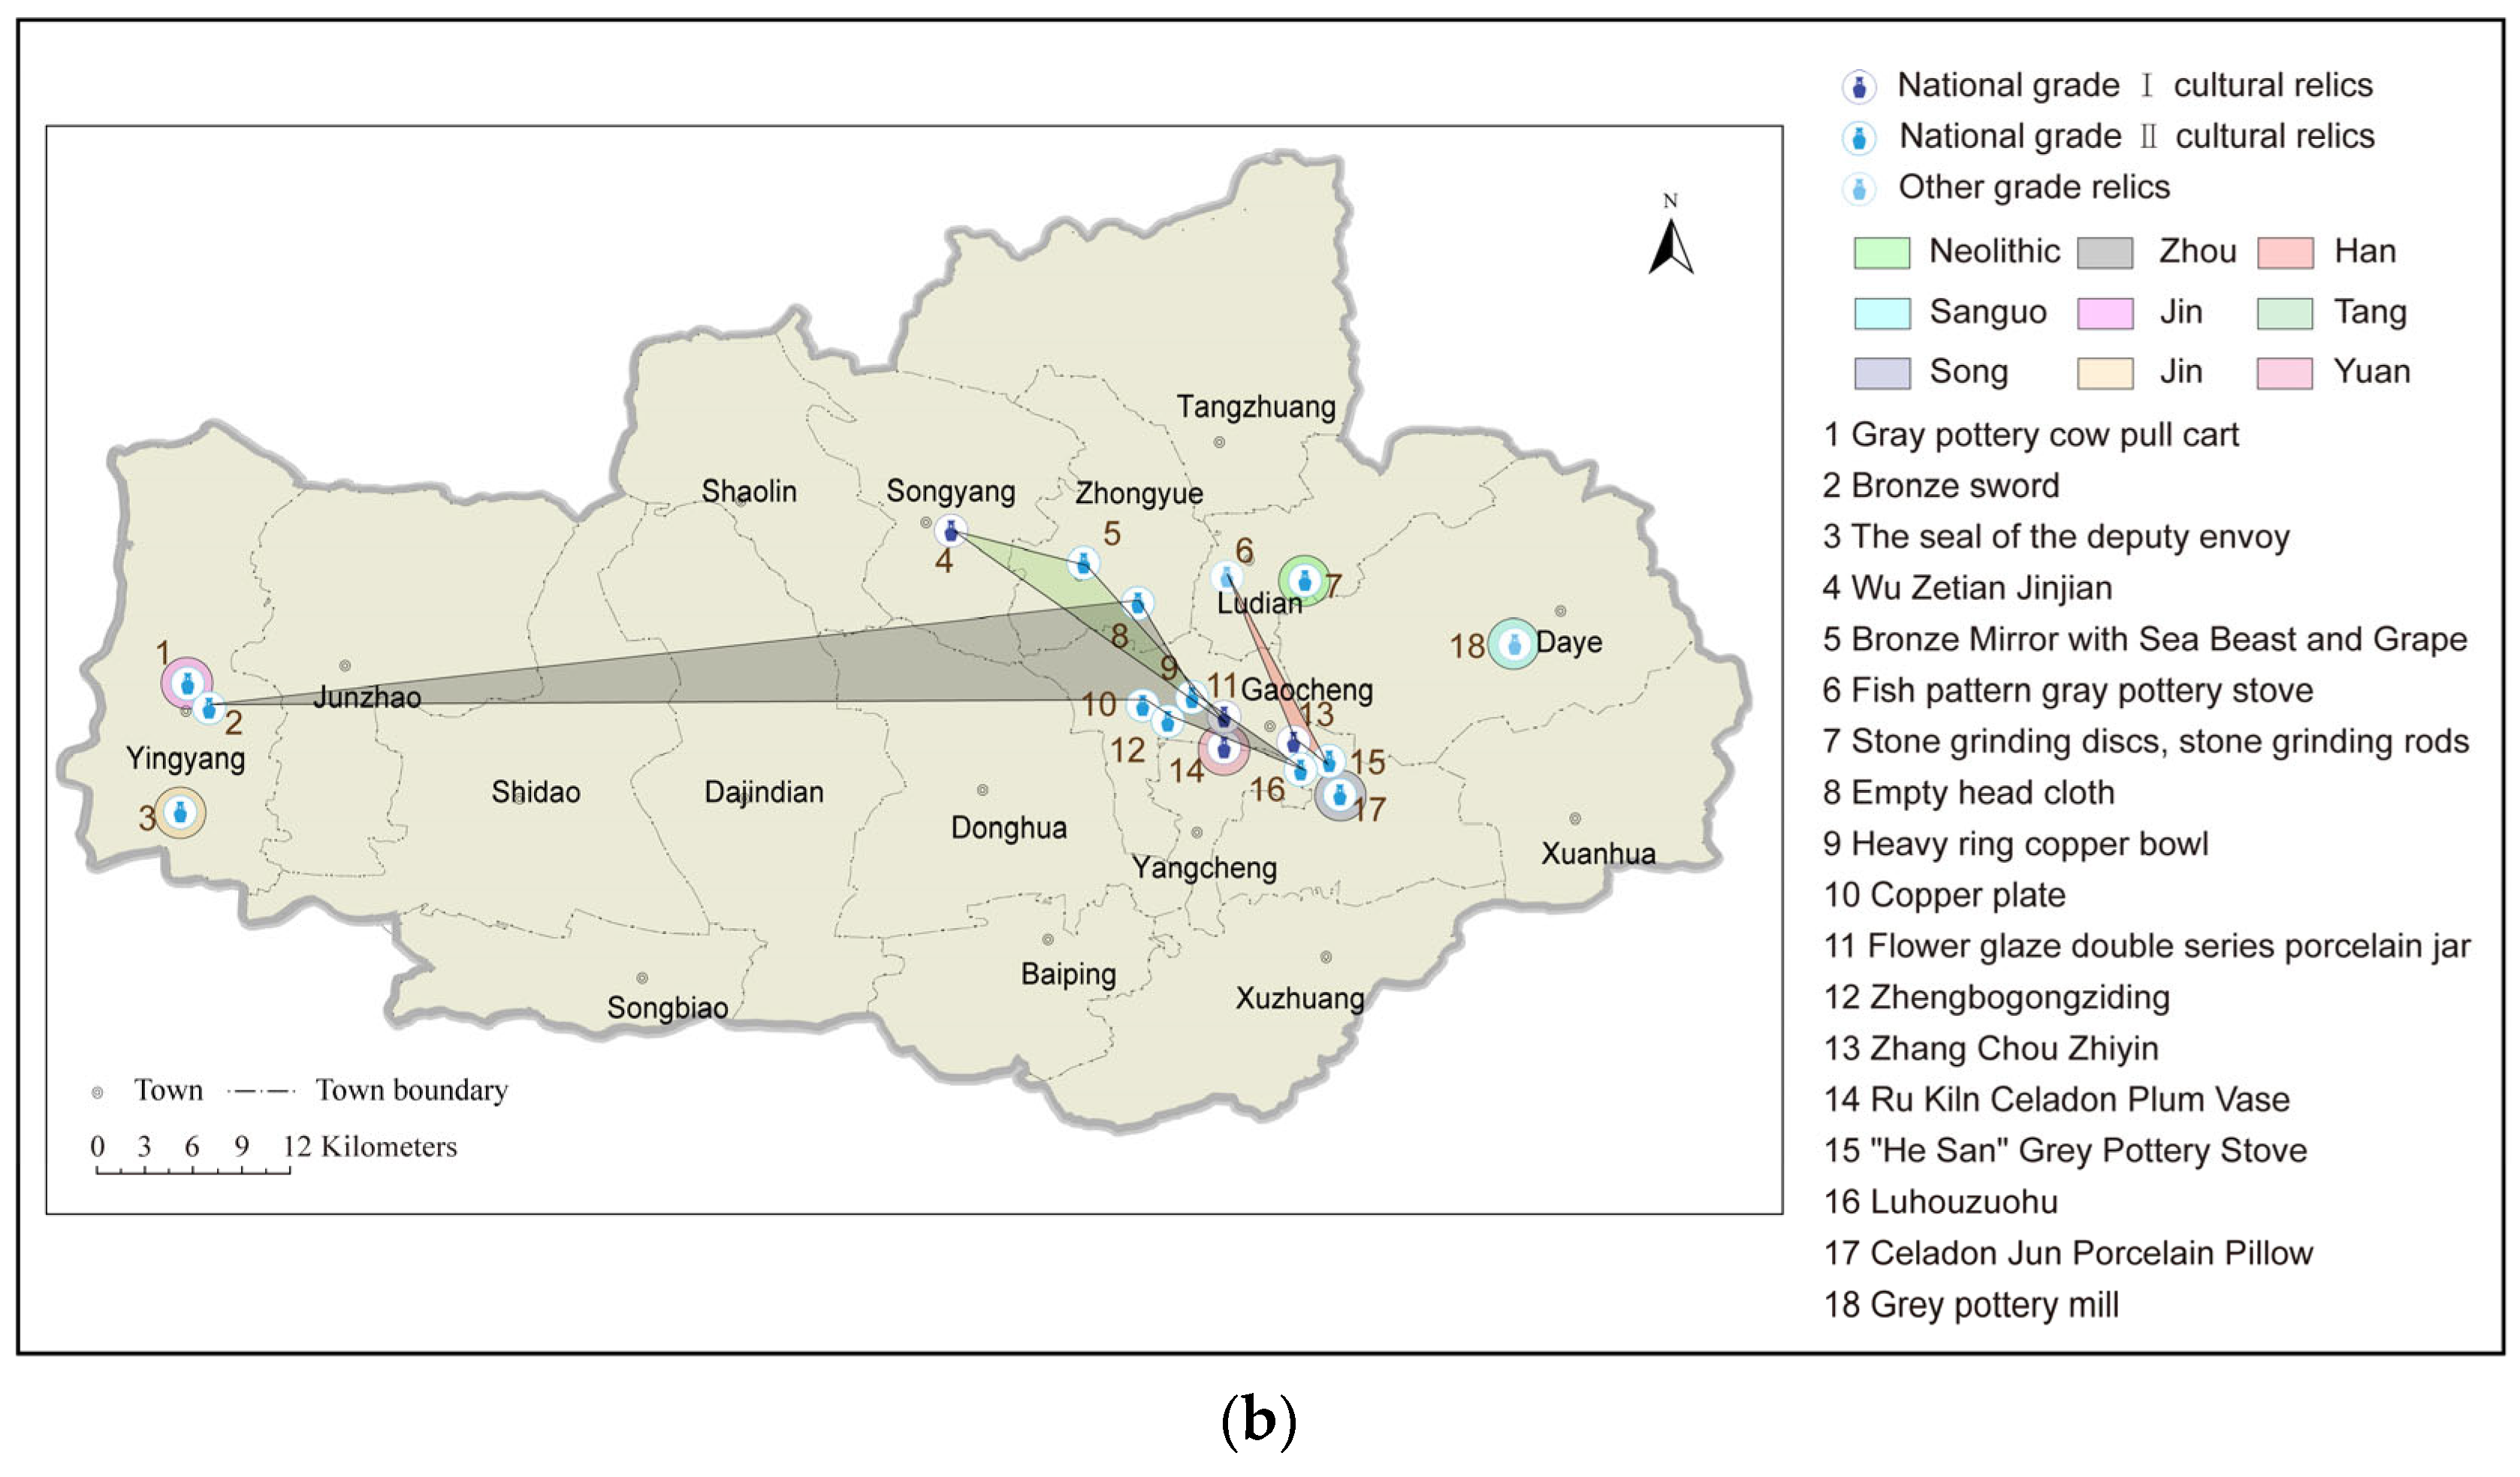
3.1. The Cultural Content Framework of Dengfeng City’s Chronicles

Taking the 2008 edition of the Dengfeng City Chronicle as the data source, based on cultural gene theory and the Hofstede model, we established a framework of the city’s characteristic cultural contents under the four themes of “traditional customs”, “famous people and events”, “famous buildings”, and “famous products” in Dengfeng city, as shown in Figure 5. Among them, the expression of “traditional customs” mainly includes folk-culture resources such as the Dengfeng opera and folk activities; the expression of “famous people and events” includes important people and related events from ancient times to the present; the expression of “famous buildings” mainly includes temples, watchtowers, palaces, and altars in Dengfeng; and the expression of “famous products” mainly includes national grade I cultural relics, national grade II cultural relics, and other grade relics excavated in Dengfeng. These three classes of relics are classified according to their preciousness, rarity, and archaeological value. National grade I cultural relics are the most valuable, rare, and archaeologically valuable; national grade II cultural relics are second in value, rarity, and archaeological value to national grade I cultural relics; while other grade relics are the least valuable, rare, and archaeological value of the three.

3.2. Visual Expression

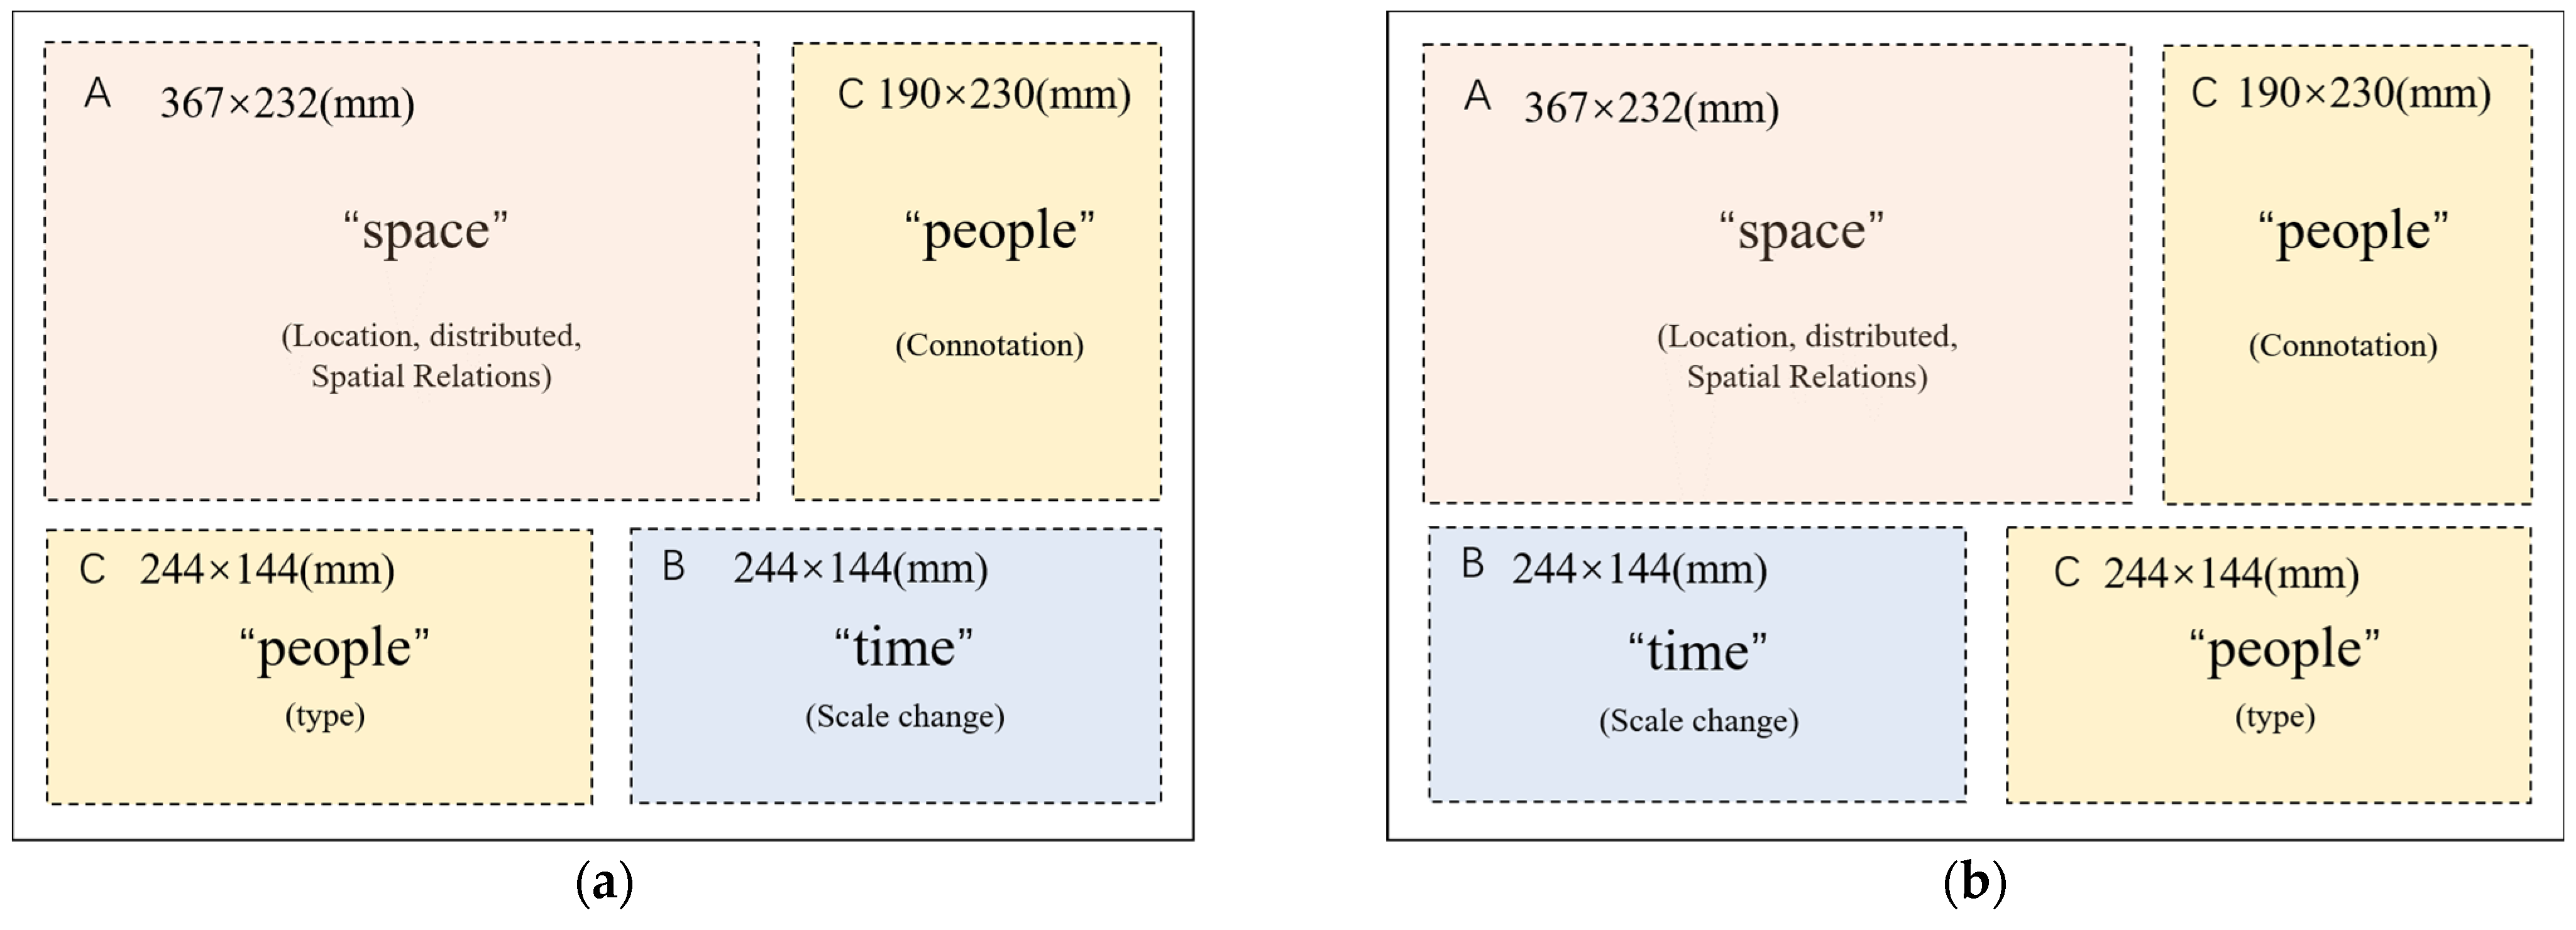
3.2.1. Construction of Presentation Form of Overall Urban Characteristic Content from the Triple Time–Space–People Perspective

The four thematic maps in this study are of size A2 (420 × 594 mm), with famous buildings and products on the front and back of the first “Sign” map, and traditional customs and famous people and events on the front and back of the “Spirit” map. The layout of the maps is divided into three subspaces based on the principle of grasping the overall city characteristics from the triple time–space–people perspective. Among them, the spatial scale (Panel A) shows the relationships among various features of Dengfeng (traditional customs, famous people and events, famous buildings, and products) and their surroundings; the temporal scale (Panel B) shows the historical axis of cultural changes in various features of Dengfeng, and the human scale (Panel C) emphasizes the spatial and temporal scale of human awareness of the city’s distinctive contents. In addition, the primary function of the map is to show spatial location relationships. Therefore, the spatial scale display occupies the main position in the layout. Figure 6 shows the layout diagram.

3.2.2. Follow the Map Design Principle of Figurativeness and Symbolism

(1)
Color System
Visualization-narrative research considers color to have the same narrative function as language and text [10]. The establishment of the color system of map design in this study was based on the principle of figurativeness and symbolism, and the main colors used in the map were determined around the iconic features of Dengfeng [45,46]. Among them, the buildings and landscapes (e.g., Shaolin Temple, Stargazer Terrace, etc.), which are symbols of the city, have strong local characteristics, and adopting their main colors, such as red and brown, can better reflect the culture and temperament of the city [22]. At the same time, following the principle that color intensity presents different visual levels to the expression elements [47,48], lighter and more contrasting colors from the city colors were selected as the background colors; the colors with high color saturation and strong contrast were selected as the prominent element colors, which in turn formed the whole color system. According to the principle of wholeness, all four thematic maps used a uniformly established color system, as shown in Table 1 below.
(2)
Symbol System
The core themes of the four thematic maps are the customs, people, buildings, and products of Dengfeng. Based on the principles of figurativeness and symbolism [34], this study designed concrete or abstract symbols to restore the real imagery from the dimensions of color, shape, material, and structure of the expression elements and used expression methods such as geometric pattern composition and physical objects for artistic processing. These methods enable symbols to have pictographic patterns, which are then used to indicate the real objects they represent [32,49,50,51,52]. Among them, the famous products were represented by abstract symbols, but according to their different degrees of importance, the color of the symbols was changed from dark to light to represent national grade I cultural relics, national grade II cultural relics, and other grade relics, respectively. The specific illustration of the symbol design is shown in Table 2.

3.2.3. Full Map

In this study, after taking the Dengfeng City Chronicle as the information source and establishing the content framework of the city’s characteristic culture based on cultural gene theory and the Hofstede model, we followed the visualization strategy to generate maps using the software of ArcGIS 10.6 and Adobe Illustrator 2020.
ArcGIS, as a GIS platform software, facilitated the processing of the administrative division map of Dengfeng. In addition, Adobe Illustrator, as a vector drawing software, was convenient for the design and creation of the maps. ArcGIS was used to realize the import and presentation of the administrative division map data of Dengfeng city, the addition of scale and compass, cartographic synthesis, and the export of the administrative division map. Adobe Illustrator was used to lay out the map content, and this layout considered that the map must show the information of the time–space–people scale. Moreover, the design of the color and symbols of the map was achieved using Adobe Illustrator software. Specifically, we added the spatial locations of four special cultures to the administrative map and used symbols to represent them. Creative diagrams were designed for related thematic information, and necessary text annotations were added to the map to make it easier to fully understand the information presented on the map. The final map results are shown in Figure 7 and Figure 8 below.

3.3. Evaluation Results

During the survey, we showed the map results of this study to 40 respondents and then invited them to fill out the questionnaire. At the end of the survey, we collected all respondents’ answers to the questionnaire, tabulated them (Table 3), and created a statistical chart (Figure 9). The statistical chart clearly shows the percentage of respondents’ choices for each question, with blue indicating positive options (I strongly agree, or I agree) and red indicating negative options (I disagree, or I strongly disagree). The chart shows that the percentage of positive options exceeds 85% for all questions, with the maximum percentage being 97.5%, the minimum percentage being 85%, and the median being 95%. Ultimately, we believe that a median percentage of positive options greater than 90% confirms that the map products in this study present local chronicle information well and that the typography, colors, symbols, and supplemental text of these maps are reasonable and well-liked by users.

4. Discussion

Based on cultural gene theory and the Hofstede model, this paper developed a “Spirit–Sign” content-framework model with the theme of urban characteristic culture. Based on this model, the urban cultural resources of local chronicles were excavated and sorted out. In addition, this study proposed a series of visualization strategies for the information of urban culture characteristics in local chronicles, i.e., grasping urban culture characteristics from the triple time–space–people perspective and following the map design principle of figurativeness and symbolism to optimize the visual expression. Finally, the feasibility and effectiveness of the above content-framework model and visualization strategies were verified by Dengfeng’s distinctive cultural group.
The designed maps were compiled as a special-cultural-thematic map group together with the rest of the thematic maps in a paper atlas. The whole atlas will be published as a map visualization result of the Dengfeng City Chronicle and in the form of electronic maps for people to browse on the internet. The readers of this atlas will range from politicians to ordinary citizens. Perhaps through it, politicians will have easier access to information on various aspects of the city for planning and decision making. Ordinary citizens can learn more about the city through it and increase their love for the city.
The results of cartographic design are potentially important for understanding and effectively providing information to decision makers. Our specific goal in this section is to demonstrate the necessity and value of cartography for local chronicles. The case analysis shows that the rapidity and effectiveness of this study in comparing the original books of local chronicles to obtain the characteristic cultural information of the city can be reflected in the following aspects. First, this paper combined the cultural gene theory with the Hofstede model, which can effectively meet the demand for map visualization of historical and cultural data of local chronicles, help to fully complete the sorting and structure of relevant thematic information, and help local chronicles to change a single-text carrier and visualize maps. Second, the proposed visualization strategies can effectively separate the urban cultural information of the Dengfeng City Chronicle from the textual method, facilitate the use of a map to show the distribution and spatial relationships of the elements, help us to design visual elements such as symbols and colors and fully adopt the novel graphical form to intuitively express the thematic information, facilitate access to the overall distribution of urban characteristic culture, and effectively explore more potential Dengfeng characteristic cultural features, as well as spatial and temporal connections. In addition, we analyzed the information of each panel of “Sign” and “Spirit” from the perspectives of “space” and “time, space, and humanity” and drew the following conclusions so that we can better understand and grasp the historical characteristics of Dengfeng.

4.1. Spatial Scales

The spatial scales of “Sign” and “Spirit” (Panel A) both show the distribution of various features of Dengfeng (traditional customs, famous people and events, and famous buildings and products) and their relationships with their surroundings and as the spatial scale panel occupies the main position of the layout, we can obtain much information and rules from it through analysis. Taking the “Sign” panel as an example, the main distribution of famous buildings and products on its front and back is located in Gaocheng town, Songyang Street, Zhongyue Street, Daye town, etc. Combined with the distribution of traditional customs and famous people’s addresses in the “Spirit” panel, it can be seen that there is an overlap among the four main areas of Dengfeng’s characteristic culture; for example, there are four characteristic cultural sites in Songyang Street, Gao Cheng, and Daye. This result can be explained by the fact that Songshan is located on Songyang Street, which has been an important place to visit and worship at since ancient times; it has been visited by kings, generals, scholars, and monks, leaving more temples, palaces, and other buildings. The result further implies that the activity areas of celebrities in Dengfeng in the past and present have brought activity to the corresponding areas, thus promoting the completion of ancient buildings and the output of famous products and eventually forming a unique traditional culture that has been inherited to this day.

4.2. Time, Space, and Humanities Scales

The temporal scales of “Sign” and “Spirit” (Panel B) show the historical axis of the cultural changes in each characteristic of Dengfeng, while the human scale (Panel C) emphasizes the spatial and temporal scales of human awareness of the city’s distinctive contents. Combining the spatial scale (Panel A) with the temporal scale (Panel B) and referring to the human scale (Panel C) helps us better grasp the patterns of cultural change in the relevant urban characteristics. To this end, we took the front and back panels of famous buildings and products of “Sign” as an example, and we further analyzed them in the A, B, and C (space and time and humanities) panels, as follows.
Figure 10 shows the time scale (Panel B) chart of the famous buildings and famous products. Based on this chart, it can be observed that the different dynasties to which the famous buildings and famous products belong paint the famous buildings and famous products of the same dynasty with the same color. Then, the spatial information of Panel A was used to spatially connect the famous buildings and products of the same dynasty. If there is only one famous building or product in the same dynasty, we will cover it with an independent circle. The result is several colorful polygons with different dynasties, and then we can obtain the analysis chart shown in Figure 11. Based on this chart, the spatial range of famous buildings and excavated products with different dynasties was visualized and analyzed.
For example, the Zhou Dynasty began to build famous buildings that were mainly located on Songyang Street and Zhongyue Street in a few places, and the Han Dynasty began to build famous buildings in Dajindian, Songyang Street, and Gaocheng town in a few places. Also, the Zhou Dynasty, Han Dynasty, and Tang Dynasty excavated famous products that were mainly located in Songyang and Gaocheng town, showing a relatively concentrated situation. Combining the graph with the above analysis, we can conclude that as the dynasties proceeded, the spatial scope of the construction of the famous buildings expanded, which implies that the changes in human activities were also expanding and the different directions of urban changes in each dynasty, and the more concentrated scope of the excavation of the famous products, may be related to archaeological human factors.

5. Conclusions

In the context of urban history and culture gradually attracting public attention, this study used maps to visualize the information of local chronicles given the limitations of accessing the information on urban characteristics and culture caused by the single-text carrier form of local chronicles. This study took content-framework construction and map design as breakthrough points and provided new ideas and successful practical cases on how to effectively dig out and sort local chronicle information and how to optimize the visual-expression effect from layout design, color emotion, symbol creativity, and other elements; then, after analyzing the four completed maps of this study in combination with the advantage of being able to express geographical relationships that the maps themselves have, the following conclusions were found. On the one hand, there is an overlap among the four main concentrated areas of Dengfeng’s distinctive culture, which indicates that spirit and matter exist in a complementary and mutually reinforcing relationship; however, there are also certain differences in their spatial distribution, which indicates that there is also a contingency between material and immaterial culture, not absolute interdependence. On the other hand, as the dynasties proceeded, the spatial scope of the famous buildings built in different dynasties expanded, which implies that the changes in human activities were also expanding and that there were different directions of urban changes in each dynasty, reflecting that Dengfeng had a certain historical status in each historical dynasty due to its splendid culture and rich resources. The concentration of the excavated range of famous products may be related to archaeological anthropogenic factors, etc. Finally, the feasibility and validity of the above content-framework model and visualization strategies for map design were verified by evaluating the map results of this study with a questionnaire.
The local-chronicles-content framework and visualization strategies for urban cultural characteristics proposed in this study are operable and universal and can be used in other cities to carry out the work related to local-chronicle-information visualization and urban-cultural-map design; however, the local chronicles cover a wide range of contents, and the excavation and collation of urban characteristics in this study are biased toward historical and cultural elements, while the collation of natural ecological and industrial economic elements of urban characteristics needs further research. Given the above limitations, we will carry out follow-up studies and make more efforts to better integrate local chronicles with maps.

Author Contributions

Conceptualization, Xiaohui He; methodology, Yongji Wang and Lili Wu; validation, Chuan Liu; formal analysis, Chuan Liu and Yongji Wang; investigation, Chuan Liu; data curation, Chuan Liu; writing—original draft preparation, Chuan Liu, Xiaohui He, and Lili Wu; writing—review and editing, Chuan Liu, Xiaohui He, and Yongji Wang; visualization, Chuan Liu; supervision, Xiaohui He; project administration, Zhihui Tian; funding acquisition, Zhihui Tian and Xiaohui He. All authors have read and agreed to the published version of the manuscript.

Funding

This work was supported by the Science and Technology Major Project of Henan Province under Grant 201400210900.

Data Availability Statement

The data presented in this study are available from the author upon reasonable request.

Acknowledgments

The authors would like to acknowledge all the reviewers and editors.

Conflicts of Interest

The authors declare no conflict of interest.

References

  1. Wang, F.; Zhu, H.; Zhang, L.; Long, M.; Liao, X. The Full-Text Search on Local Chronicles’ Database. Available online: http://en.cnki.com.cn/Article_en/CJFDTOTAL-CHTB200802020.htm (accessed on 1 August 2022).
  2. Zhu, S.L.; Bao, P. The use of Geographic Information Systems in the development and utilization of ancient local chronicles. Libr. Hi Tech. 2015, 33, 356–368. [Google Scholar] [CrossRef]
  3. Li, N. Automatic Extraction of Alias in Ancient Local Chronicles Based on Conditional Random Fields. J. Chin. Inf. Process. 2018, 32, 41. [Google Scholar]
  4. Aguilar, J.; Vizcarrondo, J. Distributed chronicle for the fault diagnosis in distributed systems. Int. J. Commun. Netw. Distrib. Syst. 2020, 24, 284–315. [Google Scholar] [CrossRef]
  5. Bai, Z.; Hou, H. Design and implementation of a text categorization system based on word-extracting dictionary and multi-categorizing algorithms. J. China Soc. Sci. Tech. Inf. 2008, 27, 337–343. [Google Scholar]
  6. Xu, C.; Ye, H.; Bao, P. Automatic Recognition of Produce Entities from Local Chronicles with Deep Learning. Data Anal. Knowl. Discov. 2020, 4, 86–97. [Google Scholar]
  7. Southall, H. Rebuilding the Great Britain Historical GIS, Part 3. Hist. Methods 2014, 47, 31–44. [Google Scholar] [CrossRef]
  8. Fitch, C.A.; Ruggles, S. Building the National Historical Geographic Information System. Hist. Methods 2003, 36, 41–51. [Google Scholar] [CrossRef]
  9. Gaffield, C. Conceptualizing and constructing the Canadian Century Research Infrastructure. Hist. Methods 2007, 40, 54–64. [Google Scholar] [CrossRef]
  10. McKenna, S.; Riche, N.H.; Lee, B.; Boy, J.; Meyer, M. Visual Narrative Flow: Exploring Factors Shaping Data Visualization Story Reading Experiences. Comput. Graph. Forum 2017, 36, 377–387. [Google Scholar] [CrossRef]
  11. Tang, J.; Liu, Z.; Sun, M. A Survey of Text Visualization. J. Comput. Aided Des. Comput. Graph. 2013, 25, 273–285. [Google Scholar]
  12. Oliveira, E.C.; Oliveira, L.C.; Cardoso, A.; Mattioli, L.; Lamounier, E.A. Meta-model of information visualization based on Treemap. Univers. Access Inf. Soc. 2017, 16, 903–912. [Google Scholar] [CrossRef]
  13. Pang, P.C.I.; Biuk-Aghai, R.P.; Yang, M.Y.; Pang, B. Creating realistic map-like visualizations: Results from user studies. J. Vis. Lang. Comput. 2017, 43, 60–70. [Google Scholar] [CrossRef]
  14. Biuk-Aghai, R.P.; Yang, M.Y.; Pang, P.C.I.; Ao, W.H.; Fong, S.; Si, Y.W. A map-like visualization method based on liquid modeling. J. Vis. Lang. Comput. 2015, 31, 87–103. [Google Scholar] [CrossRef]
  15. Bartling, M.; Havas, C.R.; Wegenkittl, S.; Reichenbacher, T.; Resch, B. Modeling Patterns in Map Use Contexts and Mobile Map Design Usability. Isprs Int. J. Geo-Inf. 2021, 10, 527. [Google Scholar] [CrossRef]
  16. Qin, Y.; Pang, X.; Zhao, X.; Ren, F. Design Process of Map Cognitive Function of Atlas: A Case Study of Atlas of Pesticide Residue Levels in Fruits and Vegetables in China. J. Geomat. 2021, 46, 110–113. [Google Scholar]
  17. Liu, Y.; Ma, C.; Su, Z. Visual Art Design of Atlas of Shenzhen Based on Users’ Cognition. J. Geomat. 2021, 46, 143–147. [Google Scholar]
  18. Wu, L.; Liu, Z. Design and Compilation of Atlas of Arctic Navigation. Hydrogr. Surv. Charting 2016, 36, 63–66. [Google Scholar]
  19. Qi, C. Design and Compilation of Atlas of Major Natural Disasters in China. 2010. Available online: http://en.cnki.com.cn/CJFD_en/Detail.ashx?t=e&url=/Article_en/CJFDTOTAL-CHTB201301031.htm (accessed on 1 August 2022).
  20. Schulz, T. Graphical-statistical Atlas of Switzerland, 1914. Int. J. Cartogr. 2021, 7, 226–232. [Google Scholar] [CrossRef]
  21. Shi, P.J.; Yang, X.; Xu, W.; Wang, J.A. Mapping Global Mortality and Affected Population Risks for Multiple Natural Hazards. Int. J. Disaster Risk Sci. 2016, 7, 54–62. [Google Scholar] [CrossRef] [Green Version]
  22. Weng, M.; Song, X.Y.; Wang, L.Q.; Xie, H.; Zhang, P.; Su, S.L.; Kang, M.J. A tourist map of Xi’an: Combining historical city characteristics with art. J. Maps 2020, 16, 195–202. [Google Scholar] [CrossRef]
  23. Xu, Y.; Ma, C.; Zhang, D.; Du, Q. Content Construction and Cartographic Expression of Urban Innovation: A Case Study of Atlas of Shenzhen. J. Geomat. 2021, 46, 96–99. [Google Scholar]
  24. Jia, M.C.; Huang, Q.H.; Li, M.C.; Hu, W. Illegal land use risk assessment of Shenzhen City, China. J. Maps 2015, 11, 798–805. [Google Scholar] [CrossRef] [Green Version]
  25. Romanillos, G. Collaborative mapping of emerging cities in developing countries: The Leon Emergente project. J. Maps 2016, 12, 584–590. [Google Scholar] [CrossRef] [Green Version]
  26. Guo, R.; Chen, Y.; Ying, S.; Lu, G.; Li, Z. Geographic visualization of pan-map with the context of ternary spaces. Geomat. Inf. Sci. Wuhan Univ. 2018, 43, 1603–1610. [Google Scholar] [CrossRef]
  27. Qin, Y.; Pang, X.P.; Zhao, X.; Liu, H.Y.; Ren, F.; Bi, C.; Zhang, D.J.; Wu, J. Visualization of pesticide residue data. J. Maps 2017, 13, 892–899. [Google Scholar] [CrossRef] [Green Version]
  28. Cevasco, A.; Brandolini, P.; Scopes, C.; Rellini, I. Relationships between geo-hydrological processes induced by heavy rainfall and land-use: The case of 25 October 2011 in the Vernazza catchment (Cinque Terre, NW Italy). J. Maps 2013, 9, 289–298. [Google Scholar] [CrossRef]
  29. Beconyte, G.; Alekna, V.; Rociute, I. A Map of 21st Century Conflicts in Europe. J. Maps 2011, 7, 1–8. [Google Scholar] [CrossRef]
  30. Aoki, K. A stochastic model of gene-culture coevolution suggested by the culture-historical hypothesis for the evolution of adult lactose absorption in humans. Proc. Natl. Acad. Sci. USA 1986, 83, 2929–2933. [Google Scholar] [CrossRef]
  31. Hofstede, G.J.; Jonker, C.M.; Verwaart, T. Cultural Differentiation of Negotiating Agents. Group Decis. Negot. 2012, 21, 79–98. [Google Scholar] [CrossRef] [Green Version]
  32. Weng, M.; Song, X.; Du, Q.; Kang, M.; Su, S. Tourism map design for historical and cultural cities: Thematic content and visualization strategy. Sci. Surv. Mapp. 2021, 46, 178–185. [Google Scholar]
  33. Su, S.; Wang, L.; Du, Q.; Li, L.; Kang, M.; Weng, M. The design of campus cultural atlas—A case of Luojia Walking Atlas. Sci. Surv. Mapp. 2020, 45, 153–160. [Google Scholar]
  34. Su, S.; Wu, L.; Du, Q.; Kang, M.; Weng, M. Theoretical framework and case study of urban cultural atlas design. Sci. Surv. Mapp. 2021, 46, 145–152. [Google Scholar]
  35. Wang, J.; Jiang, N.; Zhang, W.; Zhang, X.N. Study and Practice of Mobile Map Symbols Design for Urban Traffic Map Users. In Proceedings of the International Conference on Information Electronic and Computer Science, Zibo, China, 26–28 November 2010; pp. 180–183. [Google Scholar]
  36. Li, J.X.; Cao, Y.N.; Li, A.G. Design of Emergency Map Symbol. In Proceedings of the 18th International Conference on Geoinformatics, Beijing, China, 18–20 June 2010. [Google Scholar]
  37. Christian-smith, L. Chinese Local History; Taylor and Francis: Abingdon, UK, 2019. [Google Scholar]
  38. Huo, Y. Theory Analysis of the Culture Gene Extraction and Transmission Path of Beijing-Hangzhou Grand Canal. Archit. Cult. 2017, 59–62. [Google Scholar]
  39. Degens, N.; Hofstede, G.J.; McBreen, J.; Beulens, A.; Mascarenhas, S.; Ferreira, N.; Paiva, A.; Dignum, F. Creating a World for Socio-Cultural Agents; Springer International Publishing: Cham, Switzerland, 2014; pp. 27–43. [Google Scholar]
  40. De Mooij, M.; Hofstede, G. The Hofstede model Applications to global branding and advertising strategy and research. Int. J. Advert. 2010, 29, 85–110. [Google Scholar] [CrossRef] [Green Version]
  41. Smith, D.M. Human-geography-a welfare approach-response. Prog. Hum. Geogr. 1995, 19, 393–394. [Google Scholar]
  42. Taverne, E.R.M. Genius-loci-towards a phenomenology of architecture-Norberg Schulz, c. J. Gard. Hist. 1981, 1, 414–416. [Google Scholar]
  43. Zagata, K.; Gulij, J.; Halik, L.; Medynska-Gulij, B. Mini-Map for Gamers Who Walk and Teleport in a Virtual Stronghold. Isprs Int. J. Geo-Inf. 2021, 10, 96. [Google Scholar] [CrossRef]
  44. Medynska-Gulij, B.; Zagata, K. Experts and Gamers on Immersion into Reconstructed Strongholds. ISPRS Int. J. Geo-Inf. 2020, 9, 655. [Google Scholar] [CrossRef]
  45. Skopeliti, A.; Stamou, L. Online Map Services: Contemporary Cartography or a New Cartographic Culture? ISPRS Int. J. Geo-Inf. 2019, 8, 215. [Google Scholar] [CrossRef] [Green Version]
  46. Guo, L.; Li, L.; Zhang, Y. Color Design of the Hillshading Map Based on the Visual Image. Geomat. Inf. Sci. Wuhan Univ. 2004, 29, 492–495. [Google Scholar]
  47. Niu, Y.; Ma, G.; Xue, W.; Xue, C.; Zhou, T.; Gao, Y.; Zuo, H.; Jin, T. Research on the Colors of Military Symbols in Digital Situation Maps Based on Event-Related Potential Technology. Isprs Int. J. Geo-Inf. 2020, 9, 420. [Google Scholar] [CrossRef]
  48. Cui, H.; Jiang, N.; Bai, X.; Hu, Y. The color design scheme of a map for the color vision impaired. In Proceedings of the 2008 International Conference on Computer Science and Software Engineering (CSSE 2008), Wuhan, China, 12–14 December 2008; pp. 272–274. [Google Scholar] [CrossRef]
  49. Horbinski, T.; Zagata, K. Interpretation of Map Symbols in the Context of Gamers’ Age and Experience. ISPRS Int. J. Geo-Inf. 2022, 11, 150. [Google Scholar] [CrossRef]
  50. Bartoněk, D.; Andělová, P. Method for Cartographic Symbols Creation in Connection with Map Series Digitization. ISPRS Int. J. Geo-Inf. 2022, 11, 105. [Google Scholar] [CrossRef]
  51. Gong, X.Y.; Li, Z.L.; Liu, X.T. Structures of Compound Map Symbols Represented with Chinese Characters. J. Geovis. Spat. Anal. 2022, 6, 14. [Google Scholar] [CrossRef]
  52. Wielebski, Ł.; Medyńska-Gulij, B. Graphically supported evaluation of mapping techniques used in presenting spatial accessibility. Cartogr. Geo-Inf. Sci. 2019, 4, 311–333. [Google Scholar] [CrossRef]
Figure 1. Location and administrative division of Dengfeng: (a) the location of Dengfeng in China, this map of China is mainly provided by the Ministry of Natural Resources of China; (b) the location of Dengfeng in Henan Province; (c) the administrative division map of Dengfeng city.
Ijgi 11 00542 g001
Figure 2. Flow chart.
Ijgi 11 00542 g002
Figure 3. The content framework of city characteristic culture. (1) Initial delineation of the city’s characteristic culture by cultural gene theory; (2) Selection of city-specific cartographic themes based on the Hofstede model.
Ijgi 11 00542 g003
Figure 4. Details of the respondents.
Ijgi 11 00542 g004
Figure 5. “Spirit–Sign” content framework of the Dengfeng City Chronicle.
Ijgi 11 00542 g005
Figure 6. Layout settings for the layout system: (a) famous buildings layout; (b) famous products layout; (c) traditional customs layout; (d) famous people and events layout.
Ijgi 11 00542 g006aIjgi 11 00542 g006b
Figure 7. The front and back of the “Sign” map: (a) front side: map of famous buildings; (b) backside: map of famous products.
Ijgi 11 00542 g007
Figure 8. The front and back of the “Spirit” map: (a) front side: map of traditional customs; (b) backside: map of famous people and events.
Ijgi 11 00542 g008
Figure 9. The statistical chart of questionnaire results for map evaluation.
Ijgi 11 00542 g009
Figure 10. Time scale (Panel B) results: (a) changes in famous buildings over time; (b) changes in famous products over time.
Ijgi 11 00542 g010
Figure 11. Graphs of the results of the spatial and temporal analysis: (a) spatial share of famous buildings over time; (b) spatial share of famous products over time.
Ijgi 11 00542 g011aIjgi 11 00542 g011b
Table 1. The color system of the thematic map.
Map ElementsColorRGBMap ElementsColorRGB
BackgroundIjgi 11 00542 i001254244244WordIjgi 11 00542 i002204210188
Ijgi 11 00542 i003206206155Ijgi 11 00542 i004201188156
Outstanding elementsIjgi 11 00542 i00516018384ChartIjgi 11 00542 i006116156169
Ijgi 11 00542 i00723913078Ijgi 11 00542 i00819215637
Table 2. The symbol design of the thematic map.
Express ContentSymbol TypeExpression MethodSymbol Example
Traditional customsConcrete symbolBased on the physical art processing methodIjgi 11 00542 i009Ijgi 11 00542 i010Ijgi 11 00542 i011Ijgi 11 00542 i012
Famous people and eventsConcrete symbolBased on the physical art processing methodIjgi 11 00542 i013Ijgi 11 00542 i014
Famous buildingsAbstract symbolGeometric pattern compositionIjgi 11 00542 i015Ijgi 11 00542 i016Ijgi 11 00542 i017Ijgi 11 00542 i018
Famous productsAbstract symbolGeometric pattern compositionIjgi 11 00542 i019Ijgi 11 00542 i020Ijgi 11 00542 i021
Table 3. Questionnaire answers from all respondents.
IdQ1Q2Q3Q4Q5IdQ1Q2Q3Q4Q5IdQ1Q2Q3Q4Q5IdQ1Q2Q3Q4Q5
1AABAB2ABBAA3BBCAA4ABAAA
5AAAAA6ACCBA7BBCBB8BBACA
9AAABC10ABBAB11AAAAA12AAAAA
13AAAAB14AAAAB15AABAB16ABAAB
17BCCCA18ACBAB19BACAB20AAAAA
21AAABA22BBAAA23BBABA24AAAAA
25AABAA26AAAAA27AAABA28BBAAA
29BBABA30AAAAA31AABAA32AAAAA
33ABBBA34CDBAB35BBDBB36BABAB
37ABAAA38ABBAA39BBBAA40BBBAA
Publisher’s Note: MDPI stays neutral with regard to jurisdictional claims in published maps and institutional affiliations.

