Article

Network Patterns of Zhongyuan Urban Agglomeration in China Based on Baidu Migration Data

Institute of Geographic Space Information, Information Engineering University, Zhengzhou 450052, China
*
Author to whom correspondence should be addressed.
ISPRS Int. J. Geo-Inf. 2022, 11(1), 62; https://doi.org/10.3390/ijgi11010062
Submission received: 2 December 2021 / Revised: 4 January 2022 / Accepted: 12 January 2022 / Published: 14 January 2022

Abstract

:
As a new product of the Internet and big data era, migration data are of great significance for the revealing of the complex dynamic network patterns of urban agglomerations and for studying the relations between cities by using the “space of flows” model. Based on Baidu migration data of one week in 2021, this paper constructs a 30 × 30 rational data matrix for cities in Zhongyuan Urban Agglomeration and depicts the network pattern from static and dynamic perspectives by using social network analysis and dynamic network visualization. The results show that the network of Zhongyuan Urban Agglomeration is characterized by a circular structure with Zhengzhou as the center, a city belt around Zhengzhou as the connection, subcentral cities as the support and peripheral cities as the extension. Zhengzhou is the core city of the entire network, related to which the central and backbone networks divided in this paper account for nearly 40% of the total migration. Shangqiu, Luoyang, Zhoukou and Handan also play an important role in the structure of the migration network as subcentral cities. For a single city, the migration scale generally peaks on weekends and reaches its minimum during Tuesday to Thursday. Regarding the relations between cities, the migration variation can be divided into four types: peaking on Monday, peaking on weekends, bimodal and stable, and there are obvious phenomena of weekly commuting. In general, the links between cities outside Henan Province and other cities in the urban agglomeration are relatively weak, and the constraints of administrative regionalization on intercity migration are presumed to still exist. According to the results, the location advantage for multi-layer development and construction of Zhongyuan Urban Agglomeration should be made use of. In addition, the status as the core city and the radiation range should be strengthened, and the connections between the peripheral cities and the other cities should be improved, so as to promote the integrated and efficient development of the whole urban agglomeration.

1. Introduction

A city is not an isolated entity in space. Its development cannot be separated from the interaction between cities in the region. The concept “urban agglomeration” was put forward by Gottmann in 1961, and he used “Megalopolis” at first [1]. In another research, he listed 6 existing megalopolitan systems in the world: the American North-eastern Megalopolis [2], the Great Lakes Megalopolis [3], the Tokaido Megalopolis in Japan [4], the Megalopolis in England [5], the Megalopolis in northwestern Europe [6] and the Megalopolis in China centered on Shanghai. In the 1980s, the concept and theory of urban agglomeration were introduced into China, and the term “urban agglomeration“ was adopted in some research. After that, the “Chinese standard” of urban agglomerations has been put forward, and the development of urban agglomerations was counseled and included in the national development strategy system for the first time in 2005. Compared with urban agglomerations in western countries, the development of urban agglomerations in China started about a third of a century later, and their construction and development are affected more by administrative factors [7].
With the rapid advancement of globalization and informatization and the development of regional integration, the functions of different cities are gradually differentiated. The communication and exchanges between cities are becoming increasingly close, and the fluidity and interdependence of elements promote the continuous evolution of urban space from “place space” to “flow space” [8,9,10]. With the rapid development of urban networking and the conception of relevant major national strategies, urban agglomeration as an important form of regional development and the corresponding network patterns have become a popular research topic [11]. Urban agglomeration represents a network organization of cities in the mature stage of urban development in a certain region and is generally composed of core cities and a number of affiliated cities. The study of the network patterns has important theoretical and practical value for the internal collaborative development, integration of the industrial space, and organization and optimization of the resources of urban agglomerations [12,13].
The gravity model and urban flow model are the two most commonly used models for measuring intercity connections in urban agglomeration network patterns [14,15]. The Gravity model generally considers the comprehensive strength of two cities (GDP, population and other indicators [16]) and the distance to construct the evaluation index, but usually does not consider directionality, and adopts a large time span of data. Based on the idea of space of flow, scholars at home and abroad mainly study urban agglomeration networks through infrastructure, enterprise organization and social culture or corresponding composite methods [17,18,19]. In the context of informatization, network big data has become an important carrier representing residents’ social activities, and the geographic behavior data represented by social communication data with location, POI (point of interest) data, heat search index data and migration data have also become important data sources reflecting urban relations [20,21,22]. As an important carrier of material flow, information flow, capital flow and technology flow between cities, population flow is the most active and dynamic element in a socioeconomic system and plays a fundamental and key role in reshaping an urban network. Therefore, some scholars compare the relationship between population and cities to that between flows and nodes in a network [23]. Some research has been done on network patterns at different geographical area levels (national [24], regional [25,26], etc.) and of different urban agglomerations (Beijing-Tianjin-Hebei, Chengdu-Chongqing [12], the middle reaches of the Yangtze River [27]) over specific periods (a whole year [9], the Spring Festival transportation period [23], holidays [28], etc.) based on the migration data of different companies (Tencent, Baidu, etc.).
From the above research, it can be found that it is still lacking in the following aspects. In terms of research content, compared with those based on traffic flow (traffic mileage, frequency) and information flow (concern index), there are relatively few studies on the network patterns of Zhongyuan Urban Agglomeration based on population migration activities. Han [14] and An [17] analyzed the network pattern of urban agglomeration in Zhongyuan Urban Agglomeration based on the frequency of buses, trains and Baidu index, respectively, but these indicators are not precise enough for the study of urban connection and its change. Specifically, the frequency of the trains between two cities remains unchanged in most of the time, and the frequency is also determined by the importance of the entire line. Migration is a more direct and accurate element that reflects the connection between two cities, and research on migration has more practical significance for Zhongyuan Urban Agglomeration, one of the most populous areas in China. For the research method, priority is given to the static analysis of network patterns, and there is a lack of dynamic characteristic mining, especially in terms of the analysis of small-scale time ranges. For example, the above study mainly analyzed the network patterns from the average level at a certain time or stage, and failed to effectively display the variation characteristics of urban connection intensity in a certain period of time in the region. We believe that the analysis of periodic connection intensity variation within the urban agglomerations plays a very important role in urban development planning.
Therefore, this paper combines the methods of social network analysis, dynamic network mining and visualization to conduct a detailed analysis on network patterns of Zhongyuan Urban Agglomeration using Baidu migration data from one week in 2021. The interactions and connections between cities are expounded from the perspectives of static overall characteristics as well as dynamic changes, based on which more decisions can be made that support balanced urban development and rational resource allocation of Zhongyuan Urban Agglomeration.

2. Materials and Methods
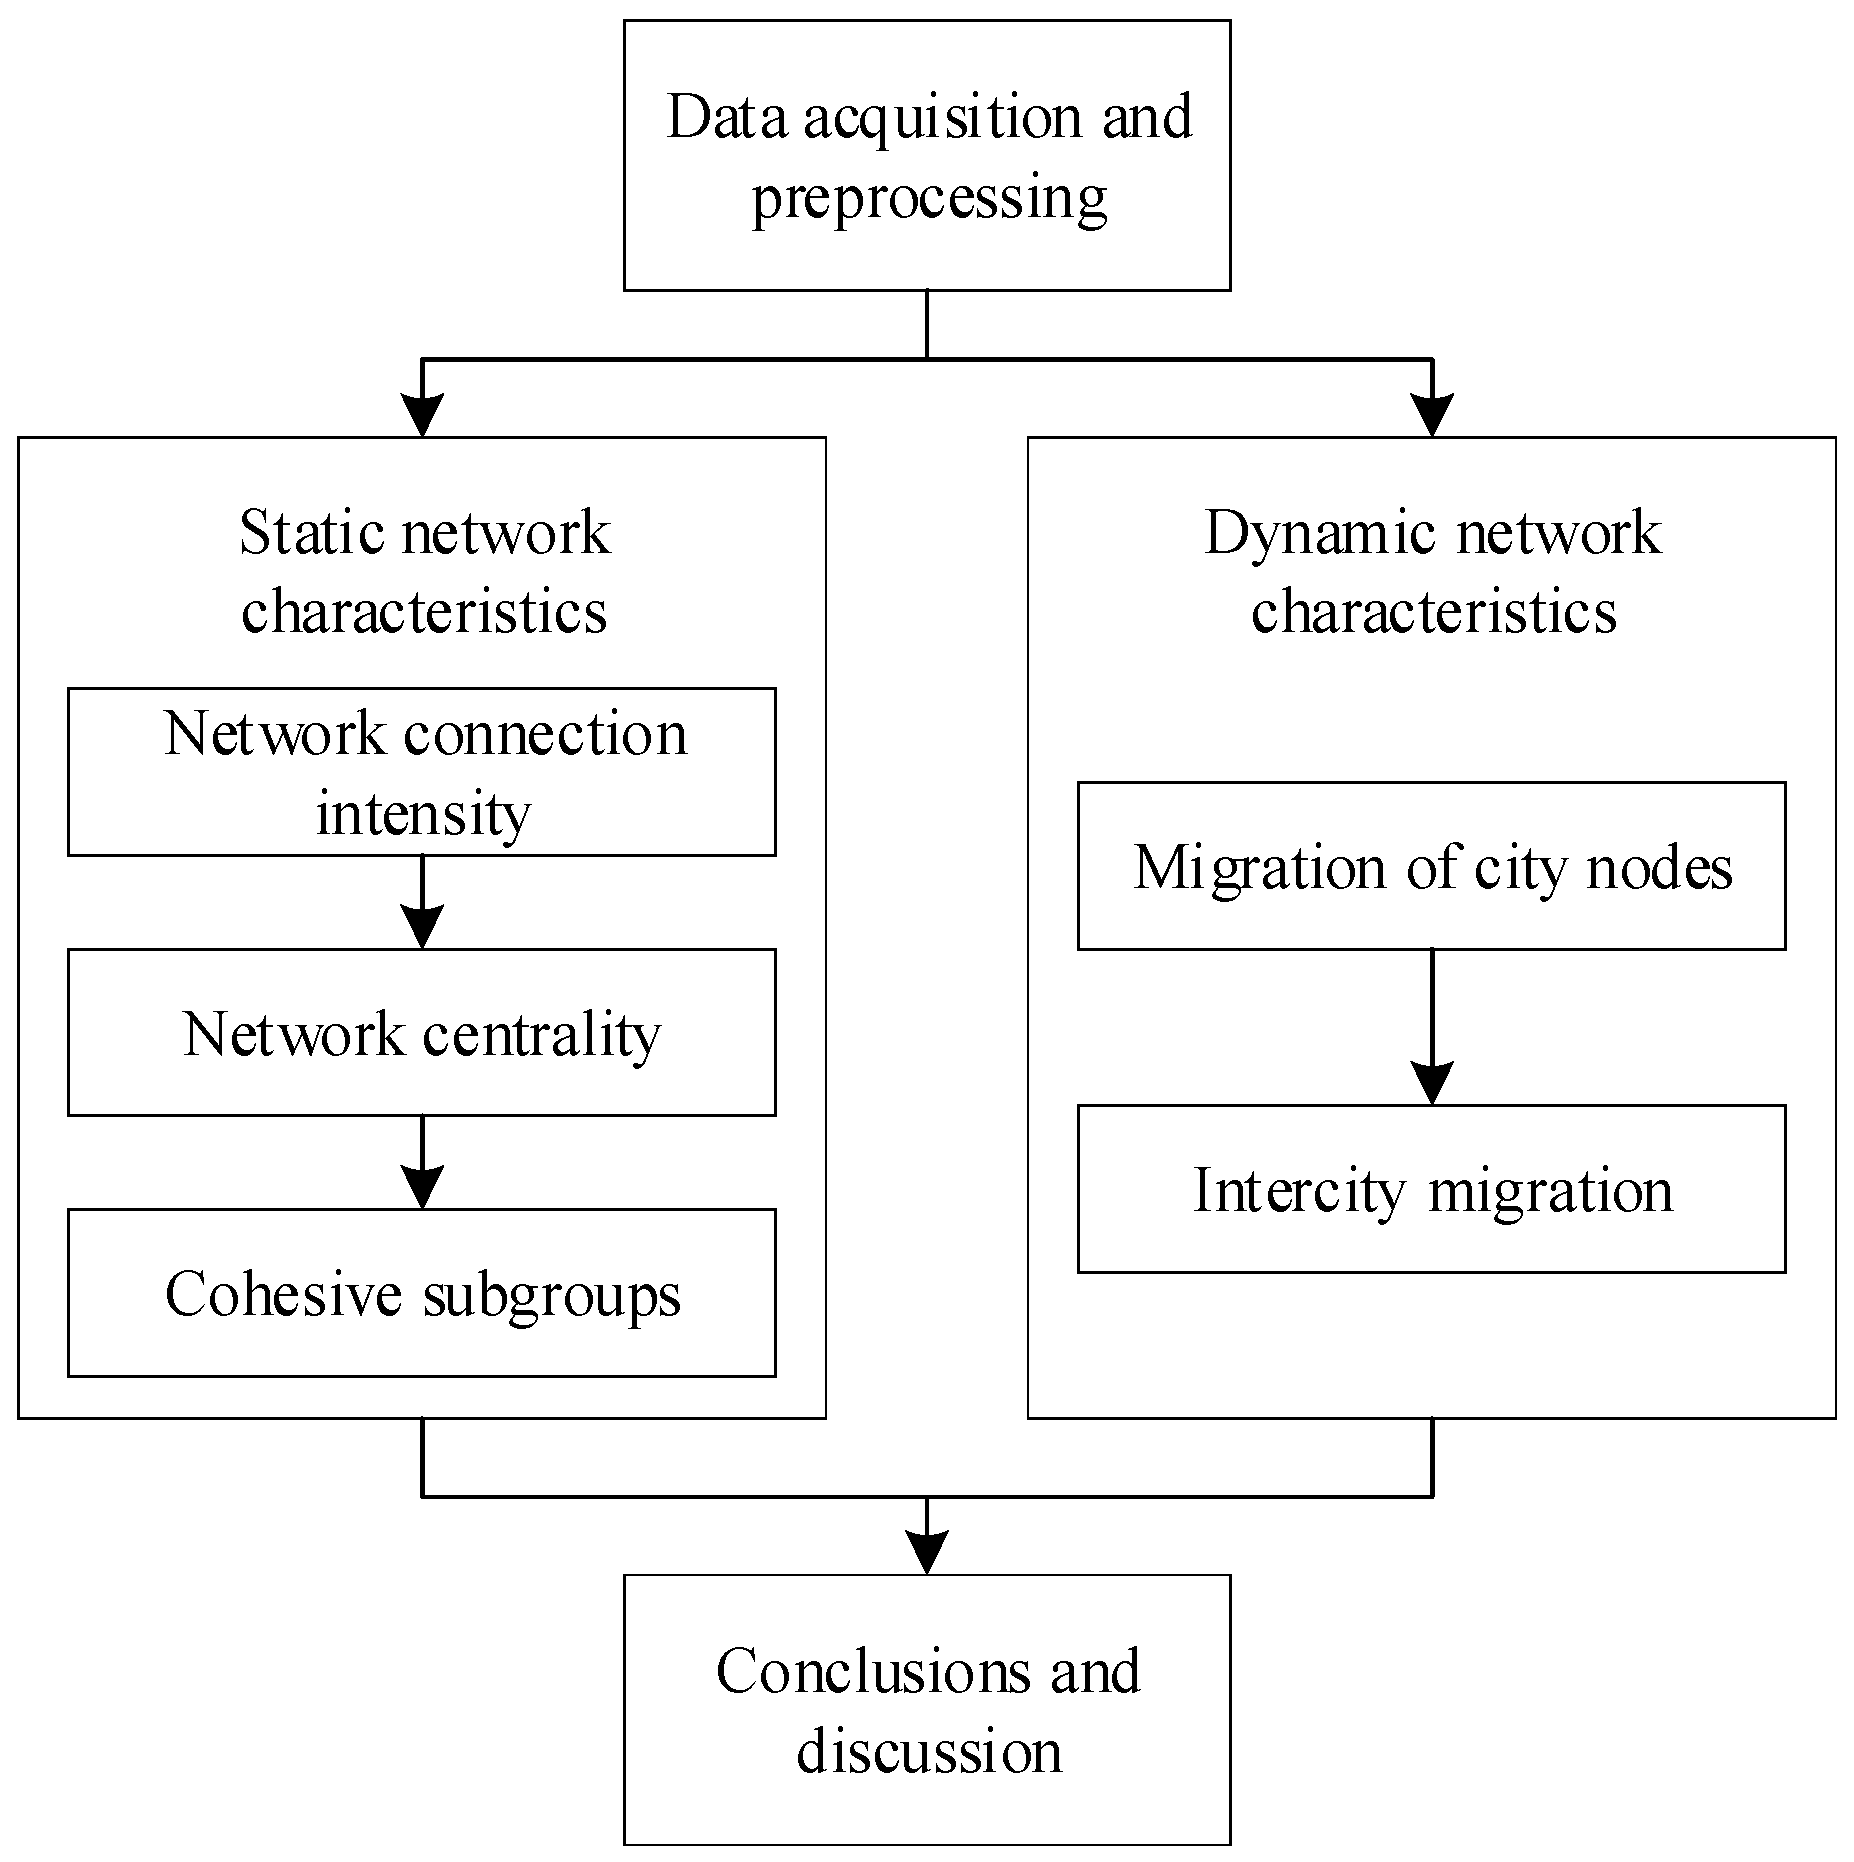
2.1. Work Flow

The work flow in this paper is shown in Figure 1. Firstly, the migration data are acquired and preprocessed by calling the network service with a Python program. Then the static and dynamic characteristics of the network are analyzed based on social network analysis, dynamic network mining and visualization, respectively. Finally, the results are summarized and discussed. Among them, social network analysis mainly includes point weight, centrality and cohesive subgroup analysis, while dynamic network mining includes time series clustering of city nodes and dynamic visualization of migration relations.

2.2. Data and Preprocessing

Zhongyuan Urban Agglomeration is located in the intersection area of the land bridge channel and Beijing-Guangzhou channel in the national urbanization strategy of “two horizontal and three vertical” corridors, which represents the middle zone intended to promote China’s economic development from east to west. As one of the seven major urban agglomerations in China, Zhongyuan Urban Agglomeration is dominated by 18 provincial cities in Henan Province and includes 30 provincial cities in Henan, Anhui, Shandong, Hebei and Shanxi Provinces [29]. By 2019, the region covered an area of 287,000 km2, with a total gross domestic product (GDP) of 7965.14 billion yuan and a total population of more than 160 million. As a new urban agglomeration, there are still some problems in the region, such as the large gaps in the development levels of the cities, the uneven integration and distribution of resource elements and the need to strengthen regional connections. Therefore, mining and understanding the comprehensive network pattern of Zhongyuan Urban Agglomeration is of strategic significance for promoting the development of cities in Central China, accelerating the rise of the central region, promoting the construction of new urbanization and expanding new space for economic development in China [30,31]. Figure 2 shows the location of Zhongyuan Urban Agglomeration in China.
Baidu migration data are derived from Baidu Map and third-party user location statistics, which accurately record the migration trajectory of hundreds of millions of people. We obtained the urban migration data of 6 weeks from 9 March to 19 April in 2021 through the Baidu migration platform interface (http://qianxi.baidu.com/ accessed on 21 May 2021). A Python program is used to call the Baidu migration service and acquire migration data for each city, which are saved locally in Excel format. The data attributes include the daily immigration and emigration scale index of each city in Zhongyuan Urban Agglomeration, and the corresponding proportion data of the immigration source and emigration destination. Through data comparison (taking Zhengzhou as an example), it can be found that, except for the Qingming Festival, the migration in the rest periods varies as a weekly cycle, as shown in Figure 3. Therefore, we chose migration data for one week (22 March to 28 March), which can reflect the general migration patterns between cities in non-holiday periods. Although the migration scale index does not refer to the number of migrants, it can be compared horizontally (between cities) and vertically (over time) [32]. To facilitate the accurate expression of this variable, it is uniformly enlarged 100-fold and called the migration scale in this paper.
To analyze the intensity of the connections, the migration scale between cities is calculated based on the original data, and a migration scale matrix of 30 × 30 is obtained. Taking the immigration matrix I as an example, the values of matrix element aij can be calculated as follows:
a ij = S i × r ij
where aij indicates the scale of the emigration of city j to city i. Si represents the total emigration scale of city i and rij is the proportion occupied by city j. Similarly, the emigration matrix O and its element bij can be calculated. The immigration and emigration relationship between cities i and j means that aij in I and bji in O have the same meaning and equal values in theory. Therefore, we construct the average matrix M by using the average value of aij and bji, and take M as the relational matrix for the study of urban agglomeration network patterns. Since M is not a symmetric matrix, the symmetric matrix M′ is generally constructed only in the calculation of the overall migration scale between two cities. The average migration matrix M′ is defined as follows:
M = 1 2 ( M + M T )

2.3. Methods

2.3.1. Social Network Analysis

In the method of social network analysis, society is considered to be a very large network composed of various relations, and each actor is a node in the network. Through the study of network relations, the relationship between individuals can be determined to reveal the integration and hierarchy of the network [33]. We used a social network analysis method to quantitatively analyze the network pattern characteristics of Zhongyuan Urban Agglomeration from the perspectives of point weight, centrality and cohesive subgroups.

Point Weight

The directed weighted graph is used to show the network structure of Zhongyuan Urban Agglomeration, in which 30 cities are regarded as node vi, and the edge eij formed by node vi and the immigration source city vj has the weight wij. The sum of the weights of all edges connected to a node is the point weight Pi of this node, and is calculated as follows:
P i = w ij
In directed weighted networks, point weight can be subdivided into point entry weight and point exit weight due to the direction of edges. In the absence of direction, however, the average of the sum of the two is generally taken as the point weight. The larger the point weight is, the more active the node is in the network. The point weights of different city nodes are different, and the multiple edge weights (connection intensity) corresponding to the same node are also different. Therefore, the overall development and local differentiation of the network can be analyzed based on the point weight and edge weight.

Centrality

Centrality is an important research issue of social network analysis that is used to analyze what kind of power individuals or organizations have in social networks. Centrality is mainly manifested in three forms: point centrality, betweenness centrality and closeness centrality [34].
Point centrality refers to the number of nodes directly connected to a node and reflects the ability of the node to communicate with others. If a node has the highest centrality, this node is considered to be in the center of the network and to have the most power. In the directed graph, the centrality of nodes can be divided into in-degree and out-degree centrality, which represent the number of connected edges entering and leaving, respectively.
Closeness centrality is a measure of freedom from control by others. If the distance between a node and other nodes in the network is very short, this node is considered to have a high closeness centrality. It is described as follows:
C AP i 1 = j = 1 n d ij
where dij is the shortcut distance between nodes i and j.
Betweenness centrality measures, the degree to which a node acts as an “intermediary” and the extent to which a node lies between other node pairs. If a node is on a shortcut of many other node pairs, the node is believed to have a high betweenness centrality. It is defined as follows:
C AB i = j n k n g jk ( i ) g jk , j k i
where gjk is the number of shortcuts between node j and node k, and gjk(i) is the number of shortcuts between node j and node k that pass through a third node i.

Cohesive Subgroups

Cohesive subgroups are used to quantitatively analyze the interrelation intensity between nodes, the study of which is helpful for understanding important theoretical issues such as the status and role of cities in the network, the way in which the urban network is organized, which cities closely interact with each other, and the hierarchical differentiation of the urban link strength [35]. The methods commonly used include analysis based on mutual dyads (cliques), reachability (n-cliques, n-clan), degree (k-plex, k-core), internal and external relations (LS set, Lambda set), and so on. Compared with other methods, the k-plex method reflects the idea of cohesion better than cliques, in which the situation of direct connection is mainly considered. Therefore, the k-plex method is chosen as the cohesive subgroup analysis method in this paper.
In a subgroup generated by k-plex, every node is directly connected to all but at most k nodes. That is, a subgroup of size n can be called a k-plex subgroup when the degree of any node in the subgroup is not less than n-k. After the k-plex subgroups in the network are searched, the times of each city pairs appearing in the k-plex subgroups are calculated and the overlap matrix is obtained. The element of the overlap matrix represents the frequency at which city i and city j appear together in all subgroups, where the higher the value is, the more similar the two cities are in migration activities. On this basis, a single-link hierarchical clustering algorithm is used to analyze the migration similarity of cities at different levels.

2.3.2. Dynamic Network Mining and Visualization

For networks with temporal information, dynamic network mining and visualization methods are used to explore and display dynamic characteristics through data mining and visualization techniques. “Dynamics” mainly refers to the increases and decreases in nodes and edges, and the weight changes of nodes and edges [36]. Since there are no increases or decreases in the nodes and edges in the network of Zhongyuan Urban Agglomeration, this paper focuses on the changes in weight.

Time Series Clustering of the Point Weight Based on K-Means

K-means clustering is the most commonly used clustering algorithm in data mining, in which a given sample set is divided into K clusters according to the distance between sample points, so that the points in the same cluster are aggregated as closely as possible and the distance between different clusters is as large as possible to ensure the minimum SSE (sum of squared error). The SSE is defined as follows:
SSE = i = 1 K x C i x x 2 2
where x = {x1, x2, …xn} is the weight time series of city nodes and x′ represents the average value of clusters.
In this paper, the Euclidean distance based on the original time series [37] is used as the distance measurement of two city nodes to analyze the similarity between cities from the perspective of the trend of the migration scale. The standardized time series element is defined as follows:
x l = ( P l P ) P × 100
where P′ is the average value of the point weight in a time period and xl represents the change in weight on a certain day relative to the average value P′.
To optimize the initial value of clustering centers and K, the idea of the “K-means++” algorithm is used to iteratively pick the sample point farthest from the selected center points to select the initial cluster centers, and the elbow method is used to determine a relatively reasonable cluster number.

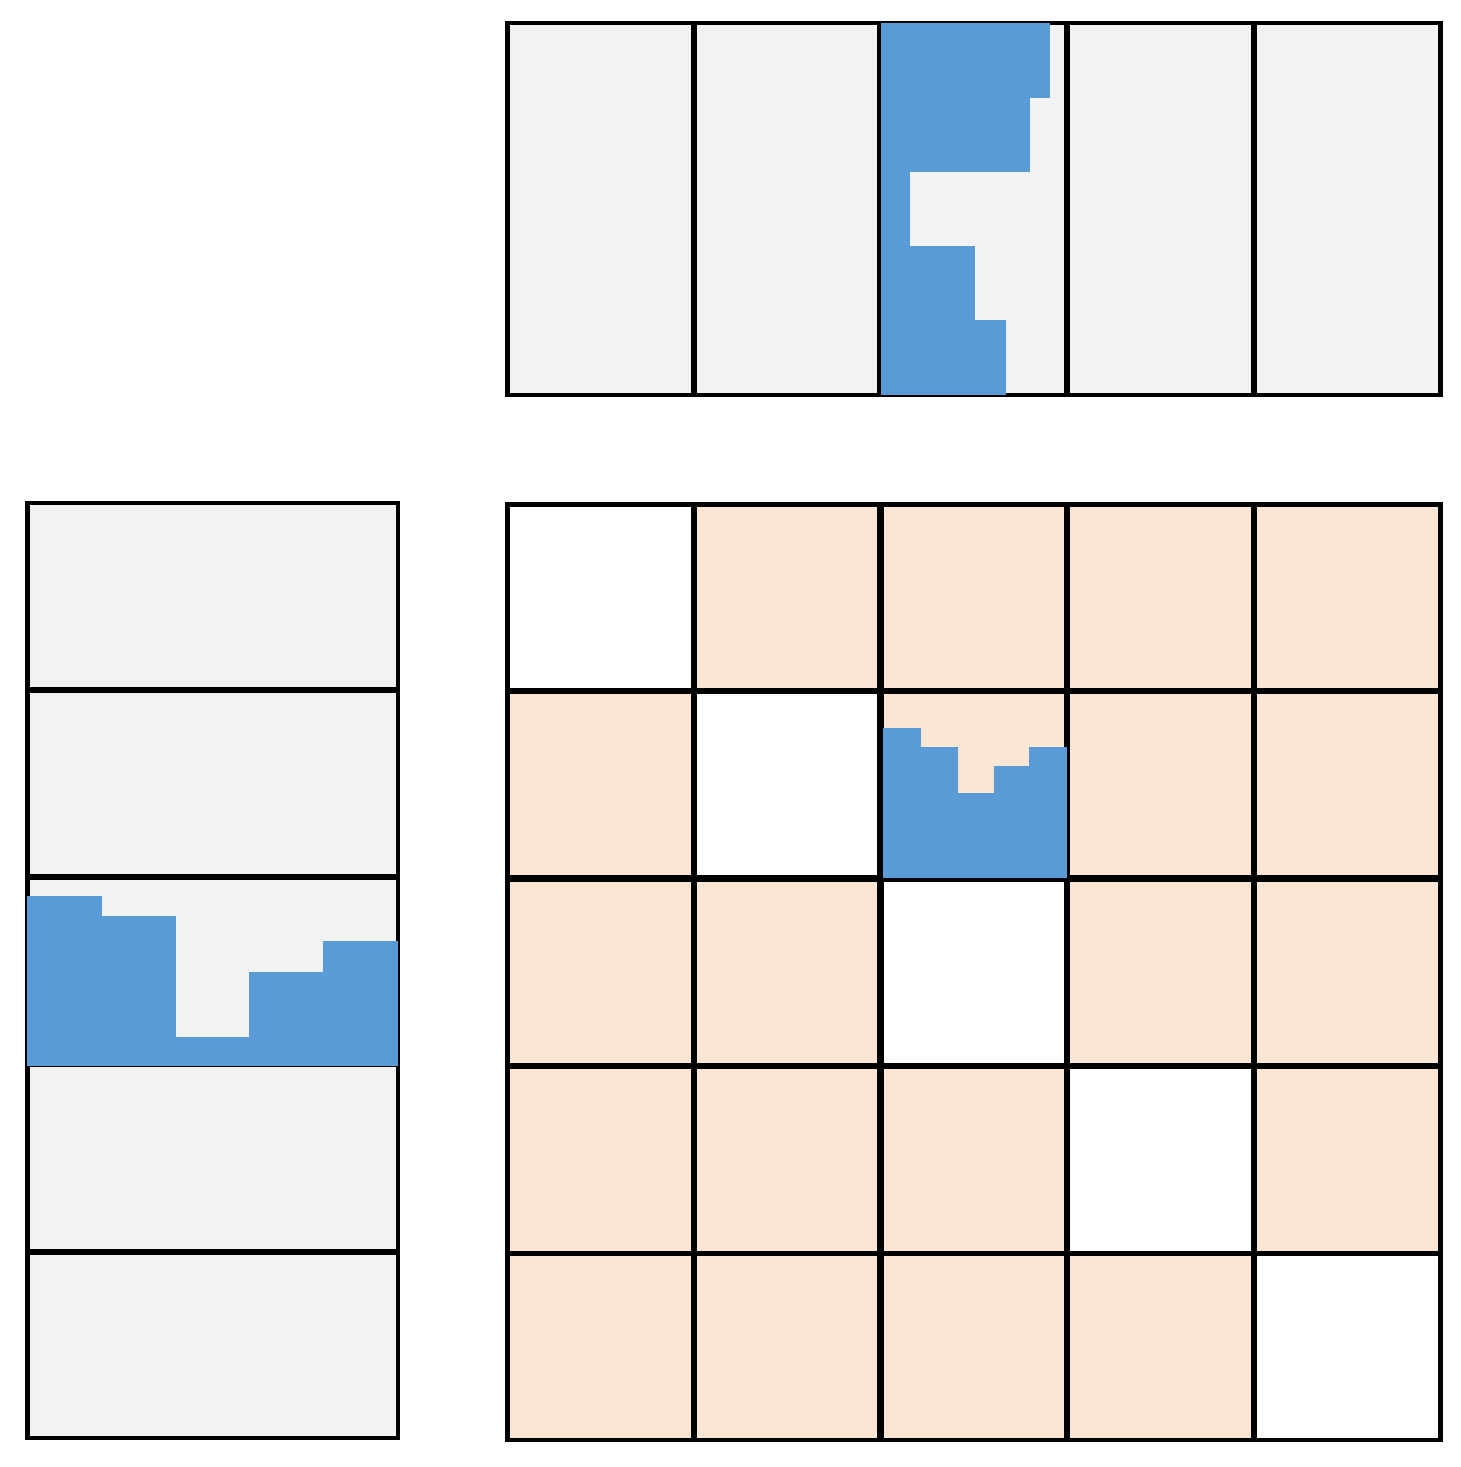
Dynamic Visualization of the Edges Is Based on TimeCell

As one of the timeline techniques based on matrix representation, TimeCell is an aggregation visualization method that expresses the time information of nodes and edges in dynamic networks by combining graphs [38,39]. Compared with other methods, TimeCell is mainly used to display the numerical changes in a network during the whole time period, which can be effective in a comprehensive analysis of the migration scale between two cities.
In TimeCell, the size of each cell of the matrix is generally small, and only a few simple stacking graphs or statistical symbols can be used. In Figure 4, the attributes of nodes and edges are represented by bar charts in positions such as row and column titles and matrix elements, with the X-axis expressing the time dimension and the Y-axis expressing the node or edge attribute dimension.
To display the migration scale in a more intuitive way, the natural breakpoint method is first used to classify the values and thus, graphs of different levels can be differentiated with color grading. On this basis, a bar graph containing a time axis is embedded in each cell of the matrix to give consideration to the expression of both the order of magnitude and amplitude of variation.

3. Results

3.1. Static Network Characteristics of Zhongyuan Urban Agglomeration Based on Social Network Analysis

3.1.1. Network Connection Intensity

Levels of the Whole Network
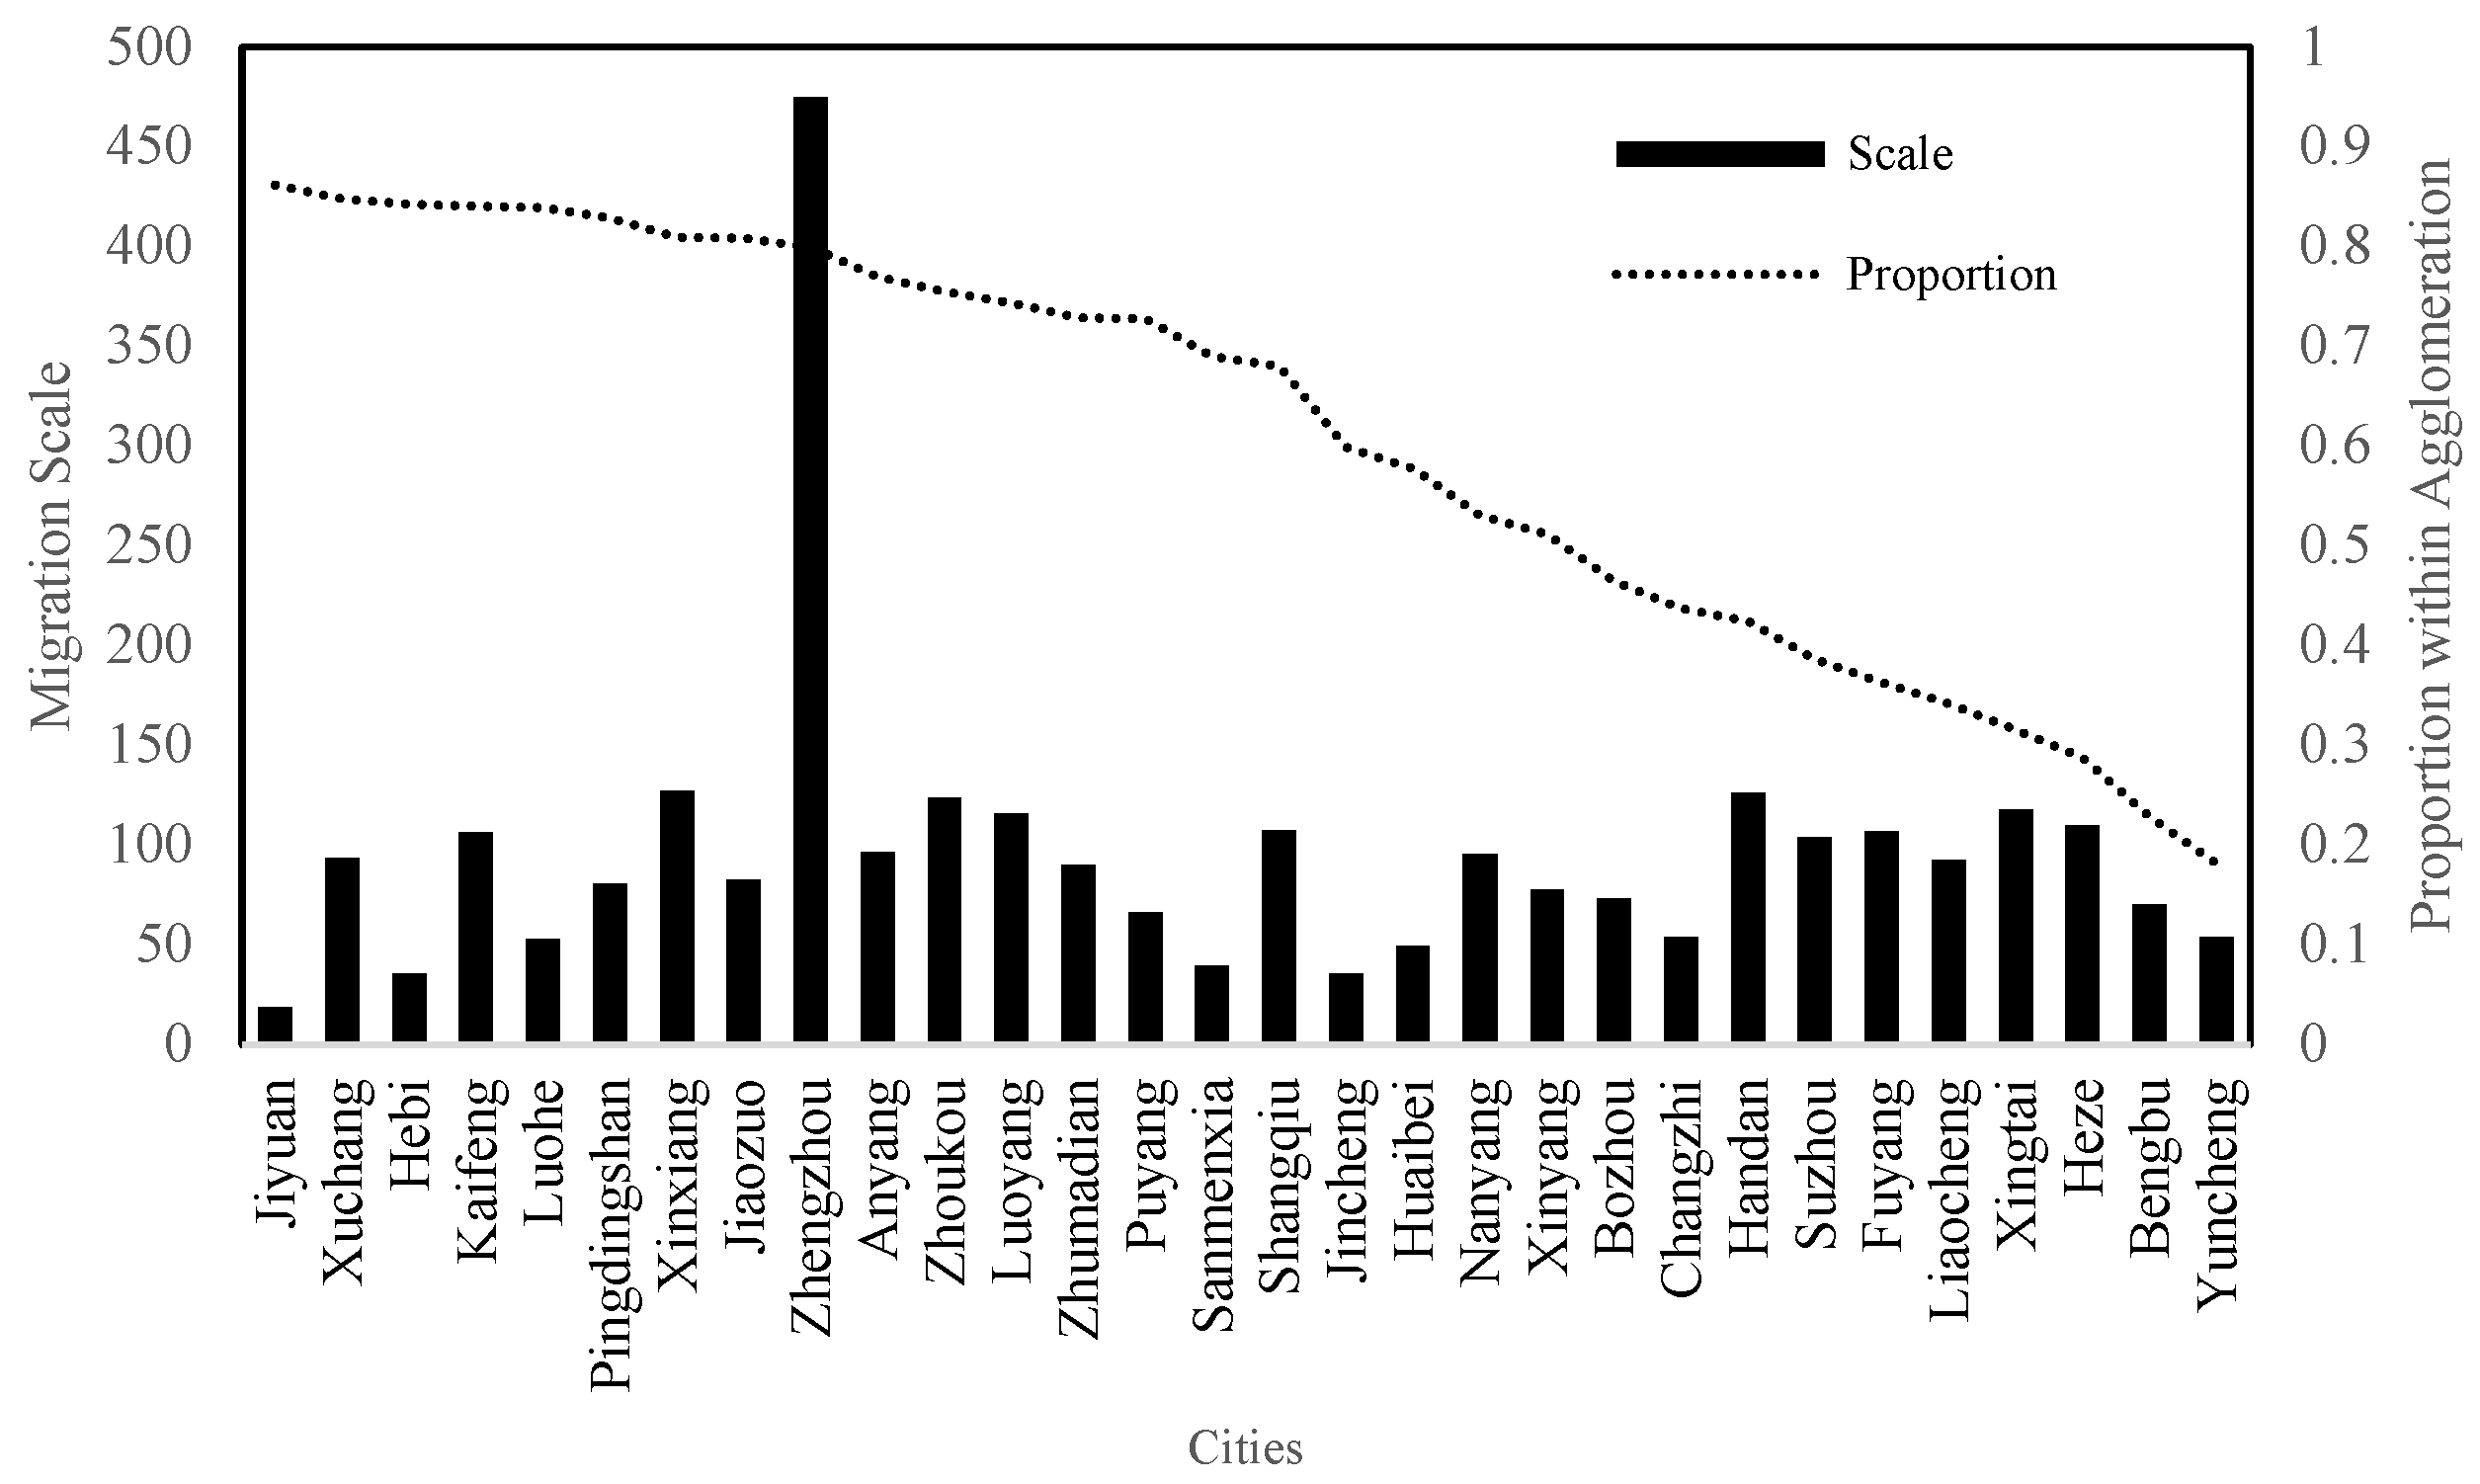
By using the natural breakpoint method in ArcGIS for the average migration matrix M′, the migration network connections of Zhongyuan Urban Agglomerations are divided into five levels: the central level, backbone level, skeleton level, regional level and marginal level, and each level of connections forms a small network, as shown in Figure 5.
As described in the figure, there are 5 city pairs (Zhengzhou-Kaifeng, Zhengzhou-Xinxiang, Zhengzhou-Luoyang, Zhengzhou-Xuchang and Zhengzhou-Zhoukou) in the central-level network, with Zhengzhou as the center radiating to the other cities. The city pairs in the central-level network account for only 1.15% of the total number, but the migration scale accounts for 21.59% of the total amount, making it the core urban migration network in the Zhongyuan Urban Agglomerations. The backbone-level network, including 7 city pairs, accounts for 1.61% of the total number and 16.62% of the migration amount. It is composed of a small network formed by Zhengzhou and several surrounding cities, as well as 2 city pairs: Huaibei-Suzhou and Xingtai-Handan, which shows that there have been massive migration activities in the northern and southeastern areas of the Zhongyuan Urban Agglomeration. The skeleton-level network, including 15 city pairs, is centered on Zhengzhou as above and extends mainly in the northeastern, western and southern directions. In addition, there are two pairs in the northwest and southeast: Changzhi-Jincheng and Shangqiu-Zhoukou-Fuyang-Bozhou, indicating that the skeleton-level network basically covers the whole scope of Zhongyuan Urban Agglomeration. The regional-level network, consisting of 43 city pairs, covers almost all cities within the urban agglomeration, and regional center cities of migration clearly emerge, which include not only Zhengzhou, Xinxiang and Kaifeng in the middle but also Handan in the north, Luoyang in the west, Nanyang, Zhoukou and Zhumadian in the south and Heze and Shangqiu in the east. In addition, there are 344 city pairs in the marginal network, 79.08% of the total but accounting for only 16.76% of the migration amount, which mainly reflects the relatively small-scale but wide-range urban migration activities.

City Point Weight

In this paper, point weight refers to the sum of the connection intensity between a certain city node and the other city nodes in the network. That is, the point weight is used to analyze the migration scale of a single city and its immigration and emigration relationship with other cities. The average daily migration scale of all cities and the proportion within the urban agglomeration are shown in Figure 6.
From the aspect of migration scale, the migration amount of Zhengzhou is much higher than that of other cities in the urban agglomeration, and it is the only city that exceeds 450 (474.45), while others do not reach 150. The cities in the second tier include Kaifeng, Xinxiang, Zhoukou, Luoyang, Shangqiu, Handan, Suzhou, Fuyang, Xingtai and Heze, whose migration scale exceeds 100, indicating that migration activities in the urban agglomeration are relatively active. From the perspective of internal migration proportion, several cities located close to the center of urban agglomeration generally have higher values. Among them, the proportion of 18 cities in Henan Province is greater than 0.5, which shows that migration within Zhongyuan Urban Agglomeration dominates in these cities. The migration scale of Suzhou, Fuyang, Xingtai and Heze is relatively large, but the proportion within the urban agglomeration is relatively low, indicating that these cities have weaker connections with other cities in Zhongyuan Urban Agglomeration.
To probe the migration relationship in the network, the immigration source and emigration destination city of the largest scale of each city in Zhongyuan Urban Agglomeration are calculated. The results show that the immigration source and emigration destination are the same for all 30 cities, with the intensity in both directions being approximately equal.
Figure 7 shows the maximum immigration scale of the 30 cities in a hierarchical way by taking immigration connections as an example. As seen from the figure, Zhengzhou is the largest immigration source for Kaifeng, Xinxiang, Jiaozuo, Luoyang and so on, showing an obvious “1-n” relationship with a high intensity. Among them, Zhengzhou and Kaifeng are each other’s largest immigration city and also form the city pair with the largest mutual migration scale in Zhongyuan Urban Agglomeration. In the periphery of the urban agglomeration, there are mainly “1-1” and “1-0” connection patterns, such as those of Xingtai-Handan, Changzhi-Jincheng and Huaibei-Suzhou. Most of these cities are not located in Henan Province in terms of administrative regionalization, and the migration activities are relatively independent.

3.1.2. Network Centrality

Based on point centrality, betweenness centrality and closeness centrality, the analysis of network centrality is used to reveal the influence and power of different cities in Zhongyuan Urban Agglomeration. First, the binarized matrix B is obtained through binarization of M based on the average migration scale (2.063). Then, 3 kinds of network centrality of Zhongyuan Urban Agglomeration are calculated with UCINET, as shown in Table 1.
In terms of point centrality, Zhengzhou, Luoyang and Zhoukou rank as the top three, which have the most active direct migration activities with other cities in the urban agglomeration. In addition, the out-degree centrality of Zhengzhou, Luoyang, Xinxiang and Suzhou is greater than the in-degree centrality, indicating that these cities mainly radiate resources outward. However, the opposite is the case in Zhoukou, Shangqiu, Handan and Bozhou, which means that these cities receive more resources from other cities than they provide to.
According to the calculation results, Zhengzhou, Shangqiu, Zhoukou, Sanmenxia and Handan are the top five cities in terms of betweenness centrality, indicating that these cities are important bridge nodes in the urban agglomeration and play an “intermediary” role in migration activities. Note that compared with other cities, Sanmenxia, which is geographically not close to the center of the urban agglomeration, also has a high value, which may be due to its high centrality as the “only intermediary” connecting Yuncheng with other cities. On the other hand, the values of Xingtai, Jiyuan, Yuncheng and Hebi city are 0, indicating that the connections between these cities and the whole urban agglomeration needs to be strengthened.
The closeness centrality calculation shows that the in-closeness and out-closeness centrality of the other cities except Zhengzhou are similar. As the regional center city, Zhengzhou has significantly higher closeness centrality than the other cities, and its out-closeness centrality is significantly greater than its in-closeness centrality, indicating that the migration activities of Zhengzhou within the urban agglomeration are the least constrained by other cities, and that the short-cut distance of emigration is shorter than that of immigration.

3.1.3. Cohesive Subgroups

City Subgroup Division

In social network analysis, cohesive subgroups are used to search for relatively stable and connected subgroups in the network and to analyze their hierarchical characteristics based on their similarity. On the basis of binarization matrix B, the minimum symmetrization method is used to generate a symmetric matrix Bs as the input parameter, and the k-plex method in UCINET is used to analyze the subgroups of Zhongyuan Urban Agglomeration.
There are two input parameters in the k-plex method: n represents the size of a subgroup, and k reflects the number of disconnected nodes in a subgroup. For urban agglomeration network analysis, the value n ranges from 3 to 5. Considering that the number of cities in Zhongyuan Urban Agglomeration is relatively large, n = 5 is taken as the number of cities in a subgroup in this paper. k is set to an appropriate value based on the value of n and the network density, and generally meets the empirical requirements of n ≥ 2k − 1, thus ranging from 1 to 3. In this paper, the intermediate value 2 is taken as the constraint of the subgroup connections; that is, in a subgroup of size 5, there are at least 3 other nodes directly connected to each node. The results of the cohesive subgroups calculated are shown in Table 2.
The results show that a total of 17 subgroups are generated by k-plex analysis. The following conclusions can be drawn from the frequency of each city: Zhengzhou appears in all subgroups, reflecting its core position in Zhongyuan Urban Agglomeration. Xuchang, Pingdingshan and Zhoukou appear more frequently and are all located in the southern area of the urban agglomeration. In addition, 11 cities, such as Xingtai, do not appear in any subgroup. These cities are mainly distributed on the eastern, western and northern edges of the urban agglomeration, and are not located in Henan Province with the exception of Sanmenxia, which shows that migration inside Henan Province is much greater than that outside and across the province, and indicates that administrative regions have an evident influence on migration activities in Zhongyuan Urban Agglomeration.

Hierarchical Clustering Based on Subgroups

Based on the results of cohesive subgroups, the single-link hierarchical clustering method in UCINET is used to calculate the clustering results of Zhongyuan Urban Agglomeration at different levels, as shown in Figure 8.
From the overall hierarchy, 19 cities are divided into two clusters (called primary clusters in this paper). The distribution of cities in different clusters is clearly different in terms of location, and cities in the same cluster are adjacent to each other in space. The first cluster, which includes Kaifeng, Pingdingshan, Zhengzhou, Xuchang, Zhoukou, Nanyang, Zhumadian, Luohe, Xinyang and Fuyang is located in the southern area, while the second cluster, including Jiaozuo, Jiyuan, Anyang, Hebi, Luoyang, Xinxiang, Puyang, Shangqiu and Heze, is located in the north-central region. These results indicate that the spatial neighbor relationship has a decisive influence on migration activities in Zhongyuan Urban Agglomeration, and that cities adjacent to each other in the administrative boundary have a higher probability of forming a cluster. On the other hand, although Zhengzhou is located in the core position of the urban agglomeration, clusters appear distributed along a certain orientation rather than in center-ring orientations, indicating that the southern cities in Zhongyuan Urban Agglomeration have higher migration similarity and are more closely connected.
From the local hierarchy, there are obvious secondary clusters inside the two primary clusters. In the first primary cluster, Xinyang and Fuyang are grouped into one secondary cluster and are the last to be joined into the primary cluster, which shows that the other cities in the primary cluster are more similar in migration than these two cities. In the other primary cluster, there are four secondary clusters: Jiaozuo-Jiyuan, Anyang-Hebi, Luoyang-Xinxiang-Puyang and Shangqiu-Heze, and most of them are adjacent cities, which also validates the apparent influence of spatial neighbors on urban migration similarity. Note that Luoyang and Xinxiang are not adjacent but are also clustered together, indicating that there might be a special migration connection between these two cities.

3.2. Dynamic Network Characteristics of Zhongyuan Urban Agglomeration in View of Periodicity

3.2.1. Dynamic Changes in the Migration Scale of City Nodes

In non-holiday periods, the migration scale of Zhongyuan Urban Agglomeration cities shows a “weekly” cycle, reflecting the weekly commuting between cities, namely, the “weekend pendulum phenomenon” [40]. To explore the change characteristics of immigration and emigration in specific cities, we construct standardized time series of immigration and emigration for one week, and use the K-means clustering algorithm to mine city clusters with similar migration change amplitudes.

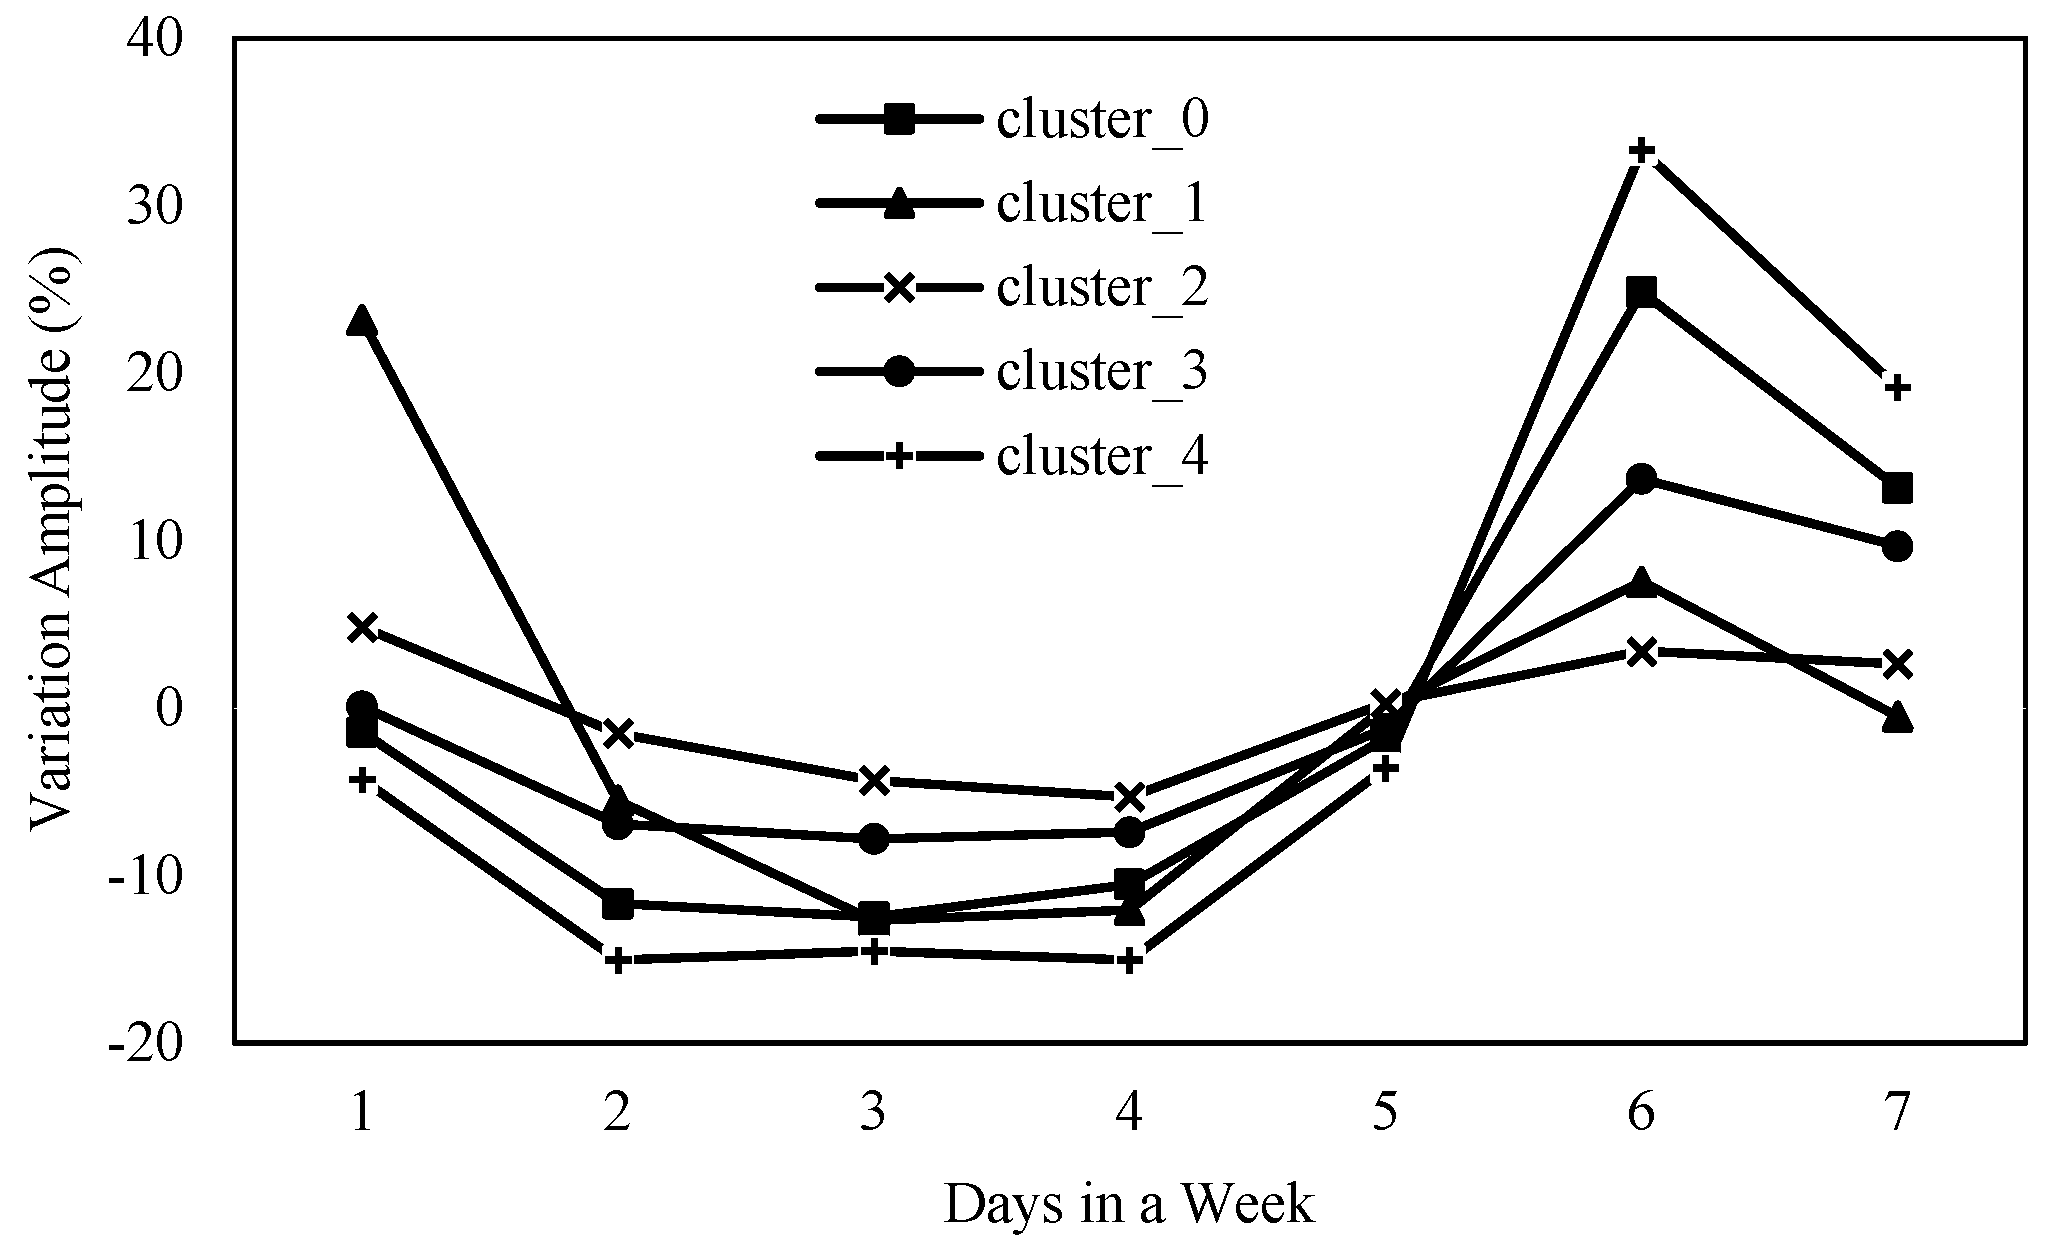
Clustering Based on Immigration

The calculation is based on the elbow method, and K = 5 is determined as the cluster number for calculating cluster centers. The variation in the immigration amplitude of cluster centers over time and the corresponding cities of each cluster are shown in Figure 9 and Table 3, respectively.
Cluster_0, which has a considerable overall variation amplitude of 37%, includes 10 cities, such as Bozhou, with the largest amount of immigration on Saturday, and the lowest intensity on Tuesday, Wednesday and Thursday. Cluster_1, containing only one city, Zhengzhou, has an overall variation amplitude of 36%. The immigration intensity is the highest on Monday, and the lowest on Wednesday and Thursday. Cluster_2 includes 5 cities, such as Sanmenxia, which has the minimum overall variation amplitude of 10%. The amount of immigration on Monday, Saturday and Sunday is large, and that on Thursday is small, showing that the migration intensity is relatively stable. Cluster_3 includes 10 cities, such as Nanyang, with an overall variation amplitude of 21%, a moderate variation range. The immigration intensity is the highest on Saturday, and the lowest from Tuesday to Thursday. Cluster_4, including Suzhou and the other 3 cities, has the largest overall variation amplitude of 48%, with the maximum amount of immigration on Saturday, and the lowest intensity from Tuesday to Thursday.
In general, the number of immigrants peaks on the weekend and falls from Tuesday to Thursday. The immigration curves of Cluster_0, Cluster_3 and Cluster_4 are similar, with that of Cluster_4 being the most significant, which indicates that Suzhou, Kaifeng, Jiaozuo and Bengbu are the destinations of intercity commuting on weekends.

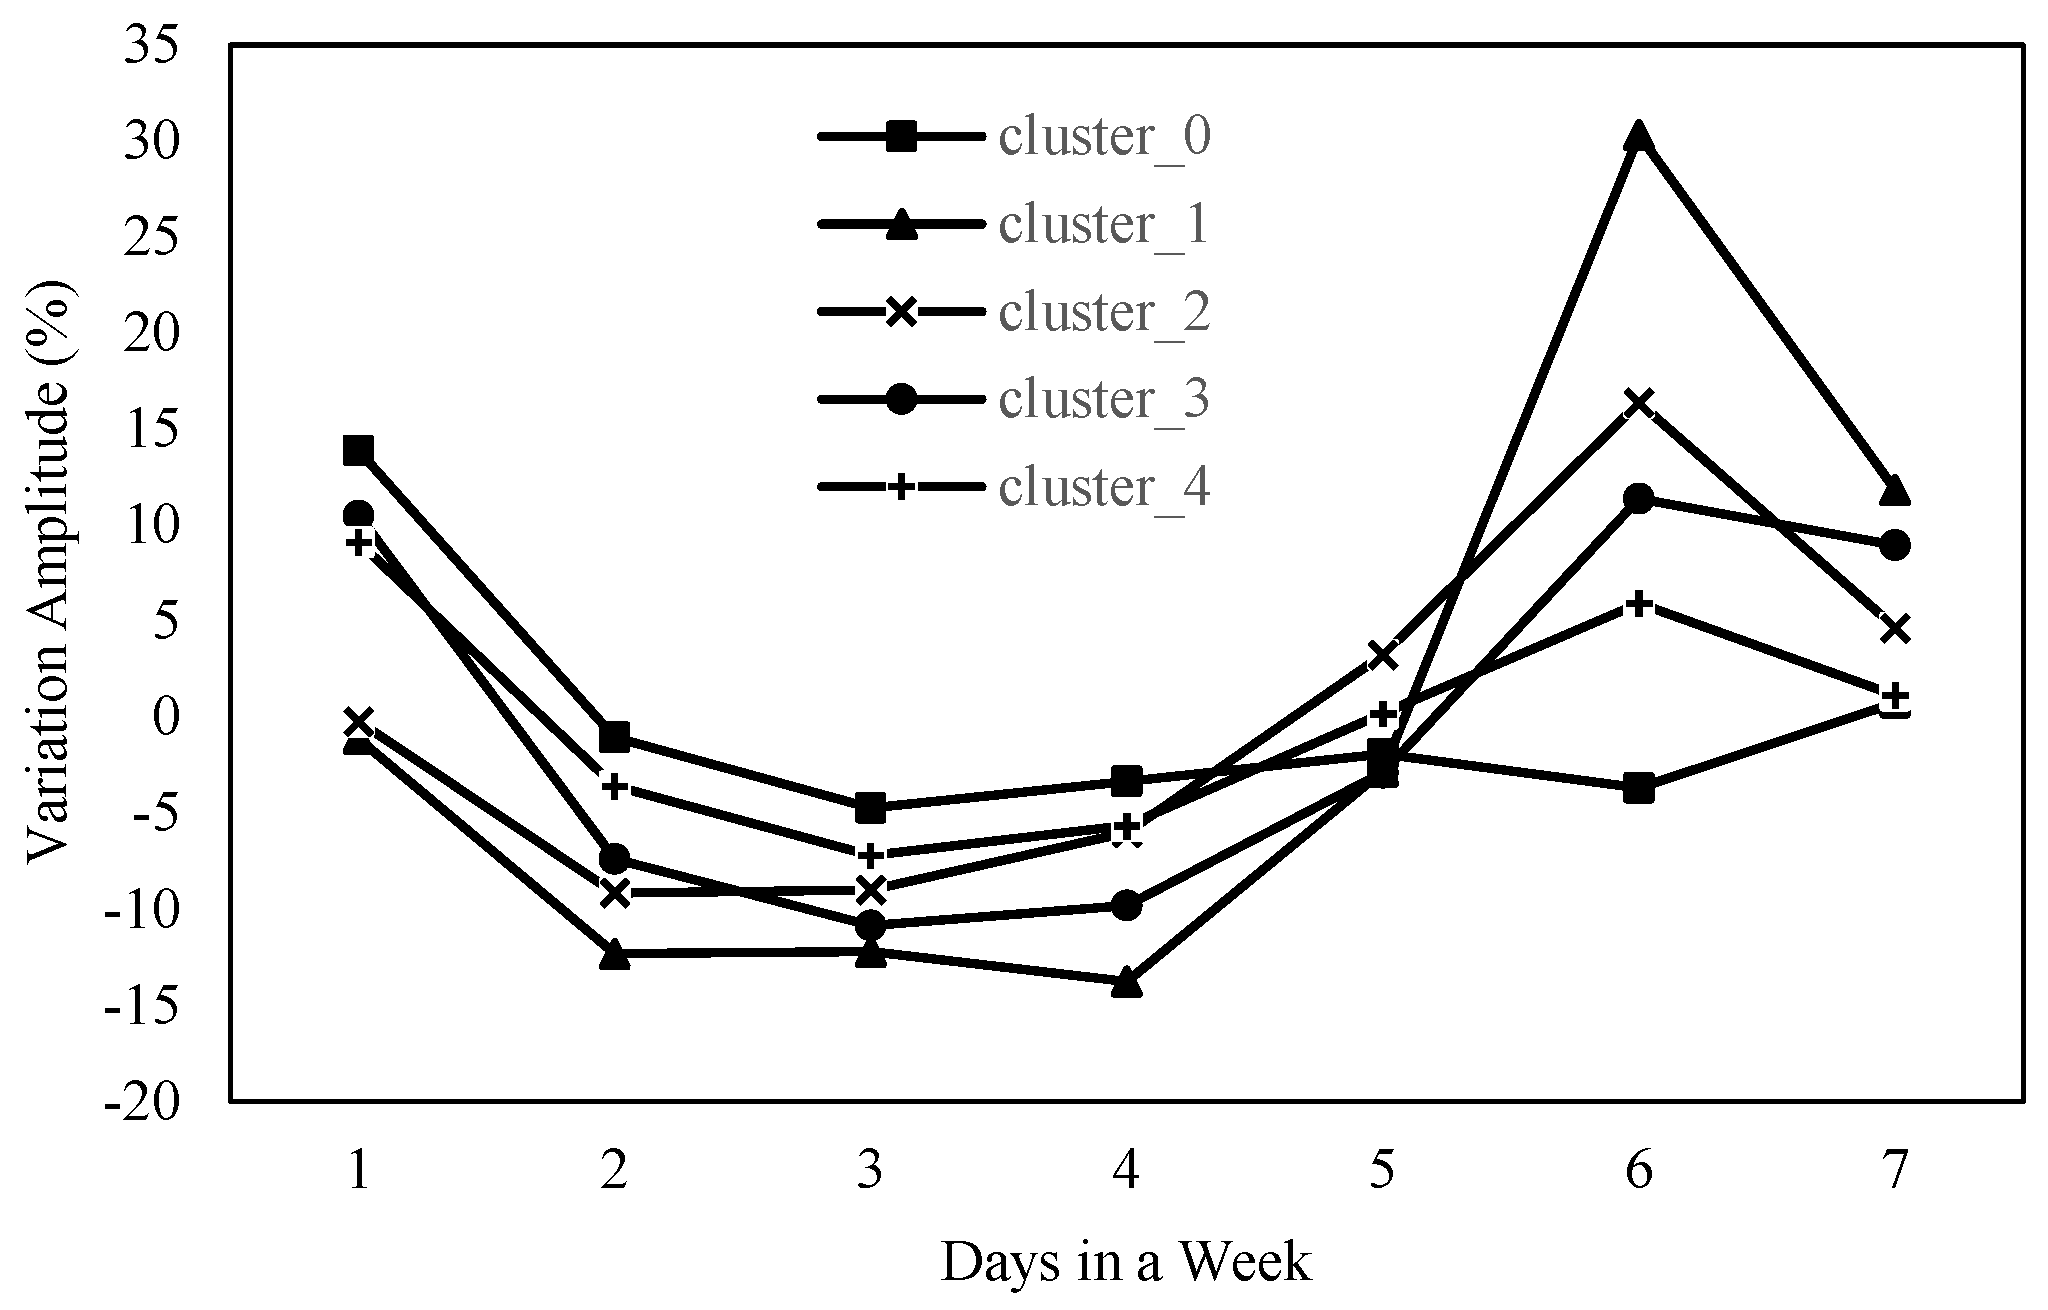
Clustering Based on Emigration

In the analysis of emigration, K = 5 is again selected as the cluster number. The variation in the emigration amplitude of the cluster center over time and the corresponding cities of each cluster are shown in Figure 10 and Table 4, respectively.
Cluster_0 includes Zhoukou and Handan, with a small overall variation amplitude of 18%, where the amount of emigrants is the largest on Monday, and that at other times of the week is small. Cluster_1 contains only one city, Zhengzhou, with the largest overall variation amplitude of 44%. The emigration intensity is the highest on Saturday, and the amount of emigrants is relatively small from Tuesday to Thursday. Cluster_2, with an overall variation amplitude of 25%, includes 5 cities, such as Sanmenxia, where the maximum amount of emigration occurs on Saturday and the minimum amount occurs on Tuesday. Cluster_3, including Suzhou and 11 other cities, has a moderate overall variation amplitude of 22%. The emigration intensity on Monday, Saturday and Sunday is high, and there is a decrease in the amount of emigration on Wednesday and Thursday. Cluster_4 includes 10 cities, such as Xinyang, and has the minimum overall variation amplitude of 16%. Among the cities in this cluster, the emigration amount is the largest on Monday and the smallest on Wednesday, with a significant increase on Saturday.
On the whole, the emigration intensity remains at a high level from Saturday to Monday, and becomes low from Tuesday to Thursday. In addition, the migration curves of Cluster_1 and Cluster_2 are more similar, indicating that Zhengzhou, Sanmenxia, Bozhou, Yuncheng, Changzhi and Fuyang are the starting points of commuting between cities on weekends, while some cities such as Zhoukou and Handan are the starting points of weekly commuting.

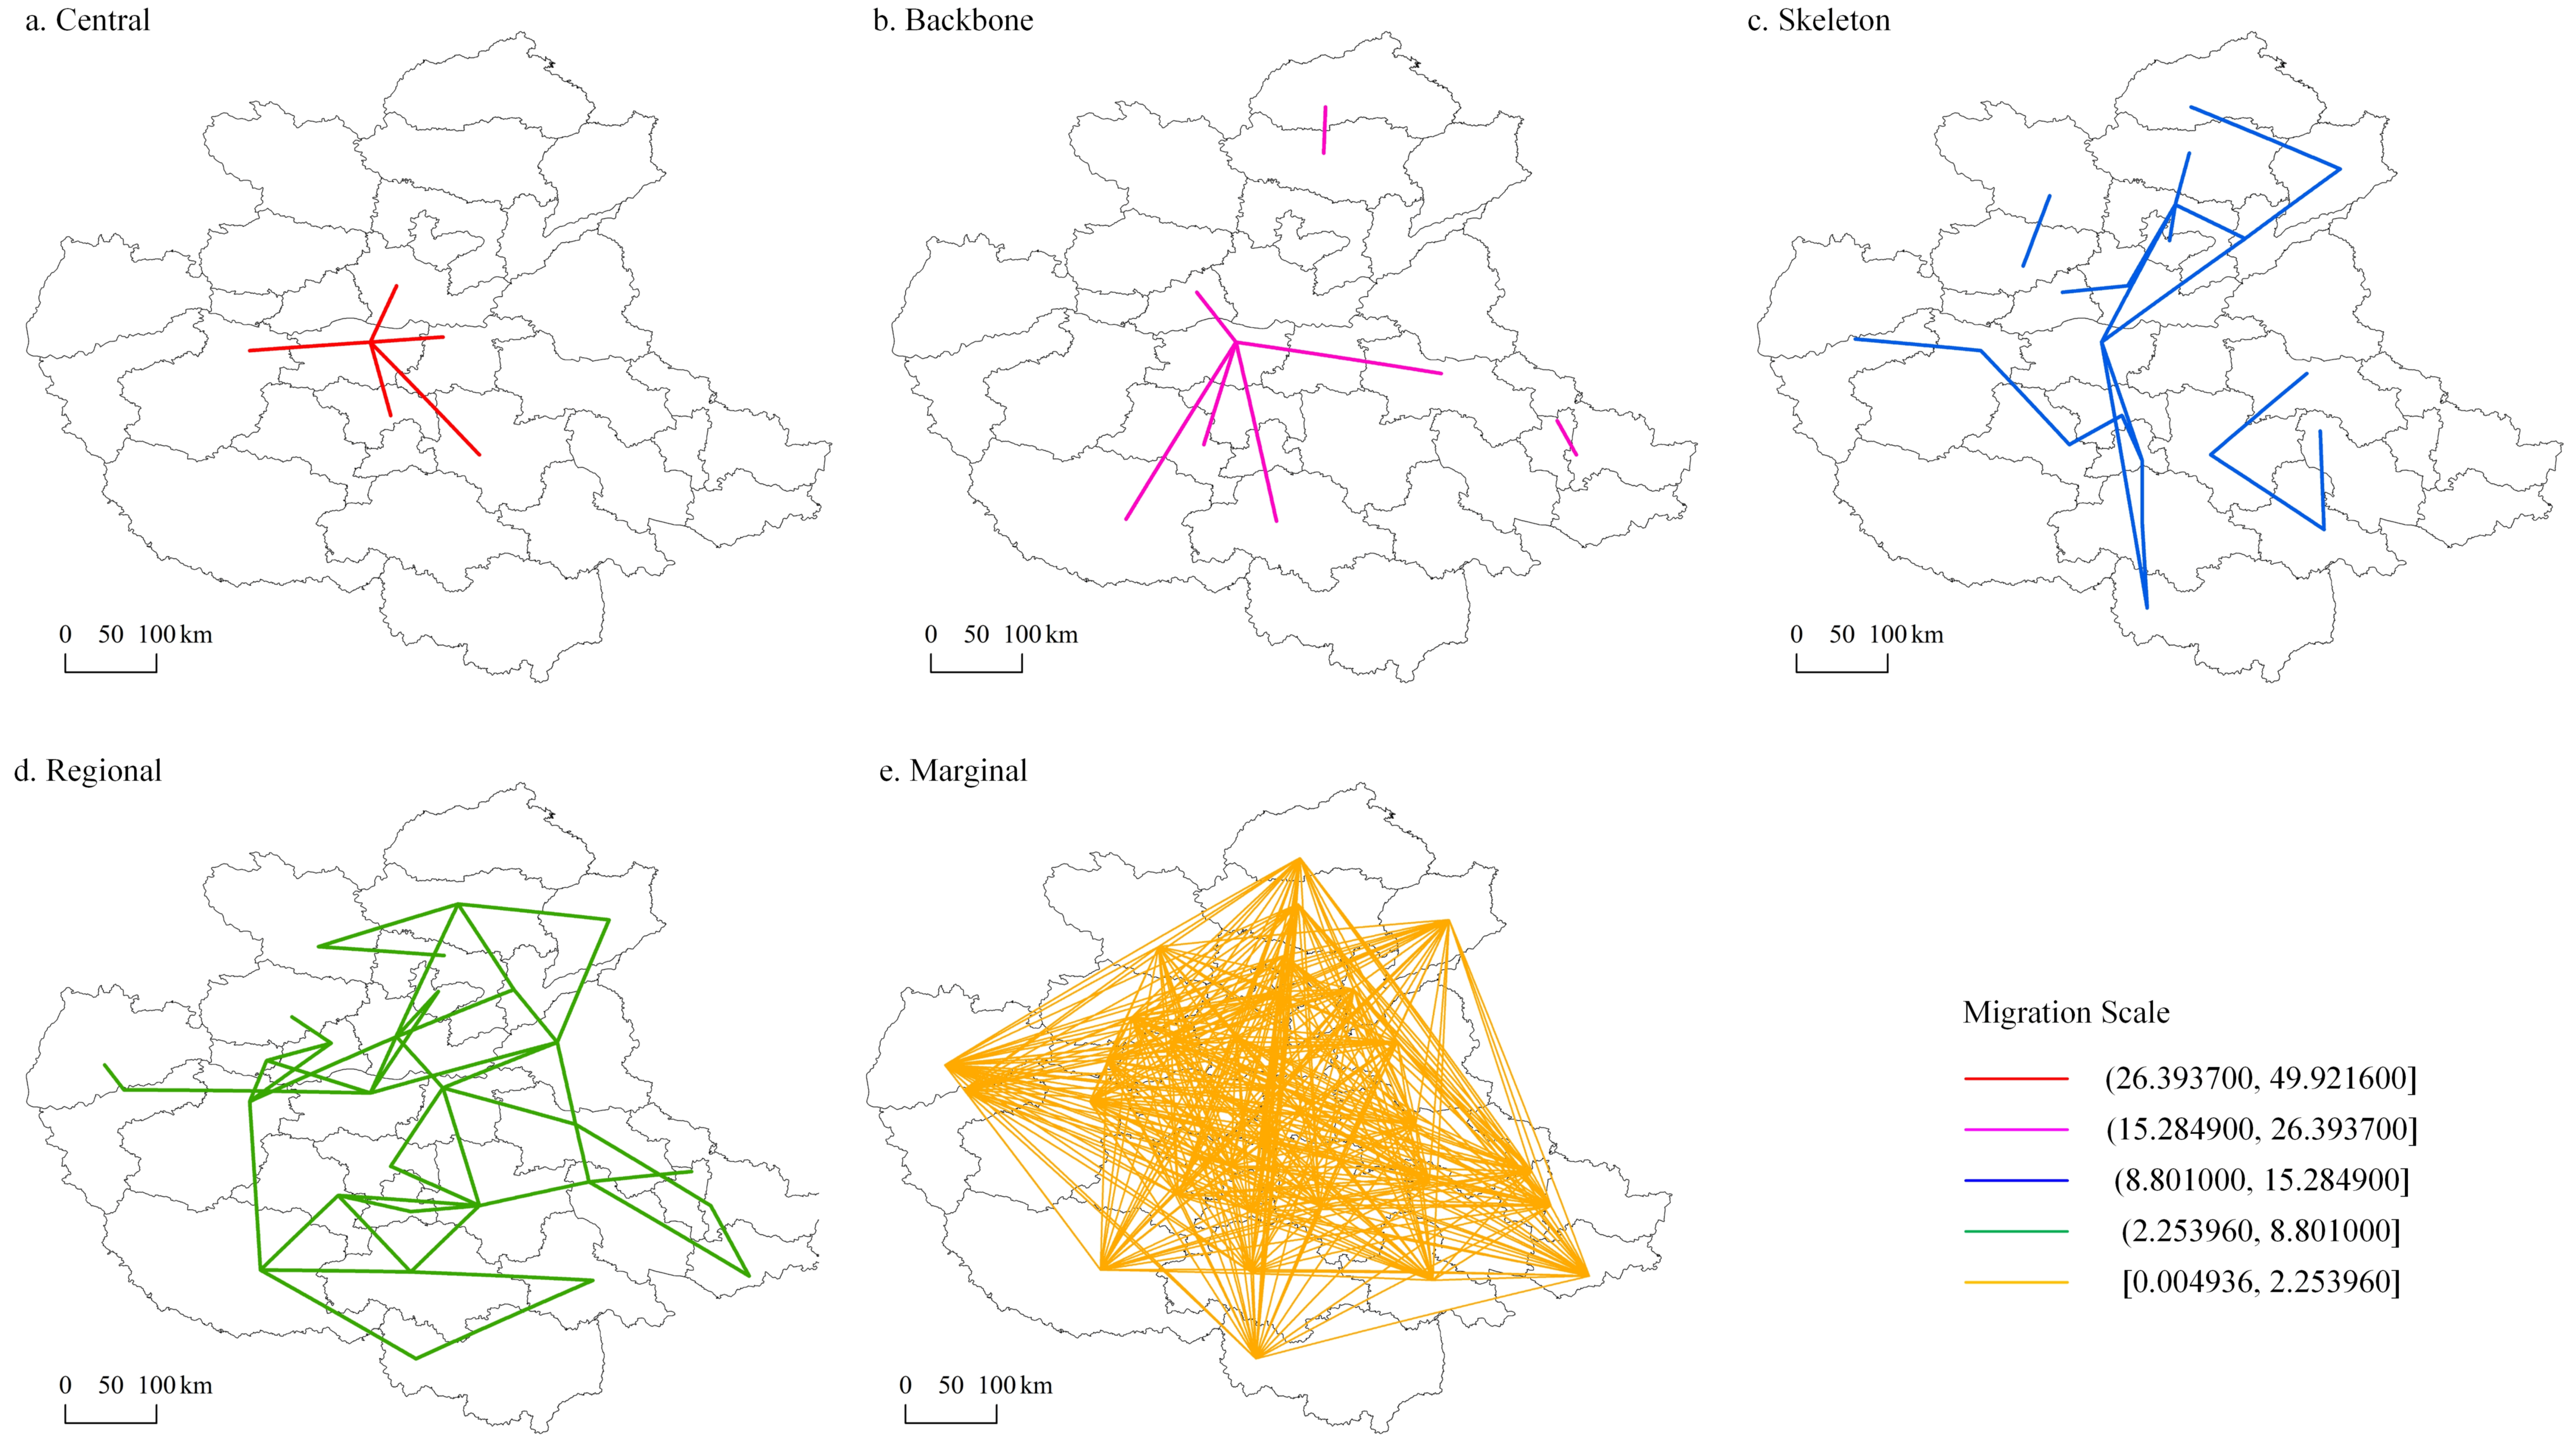
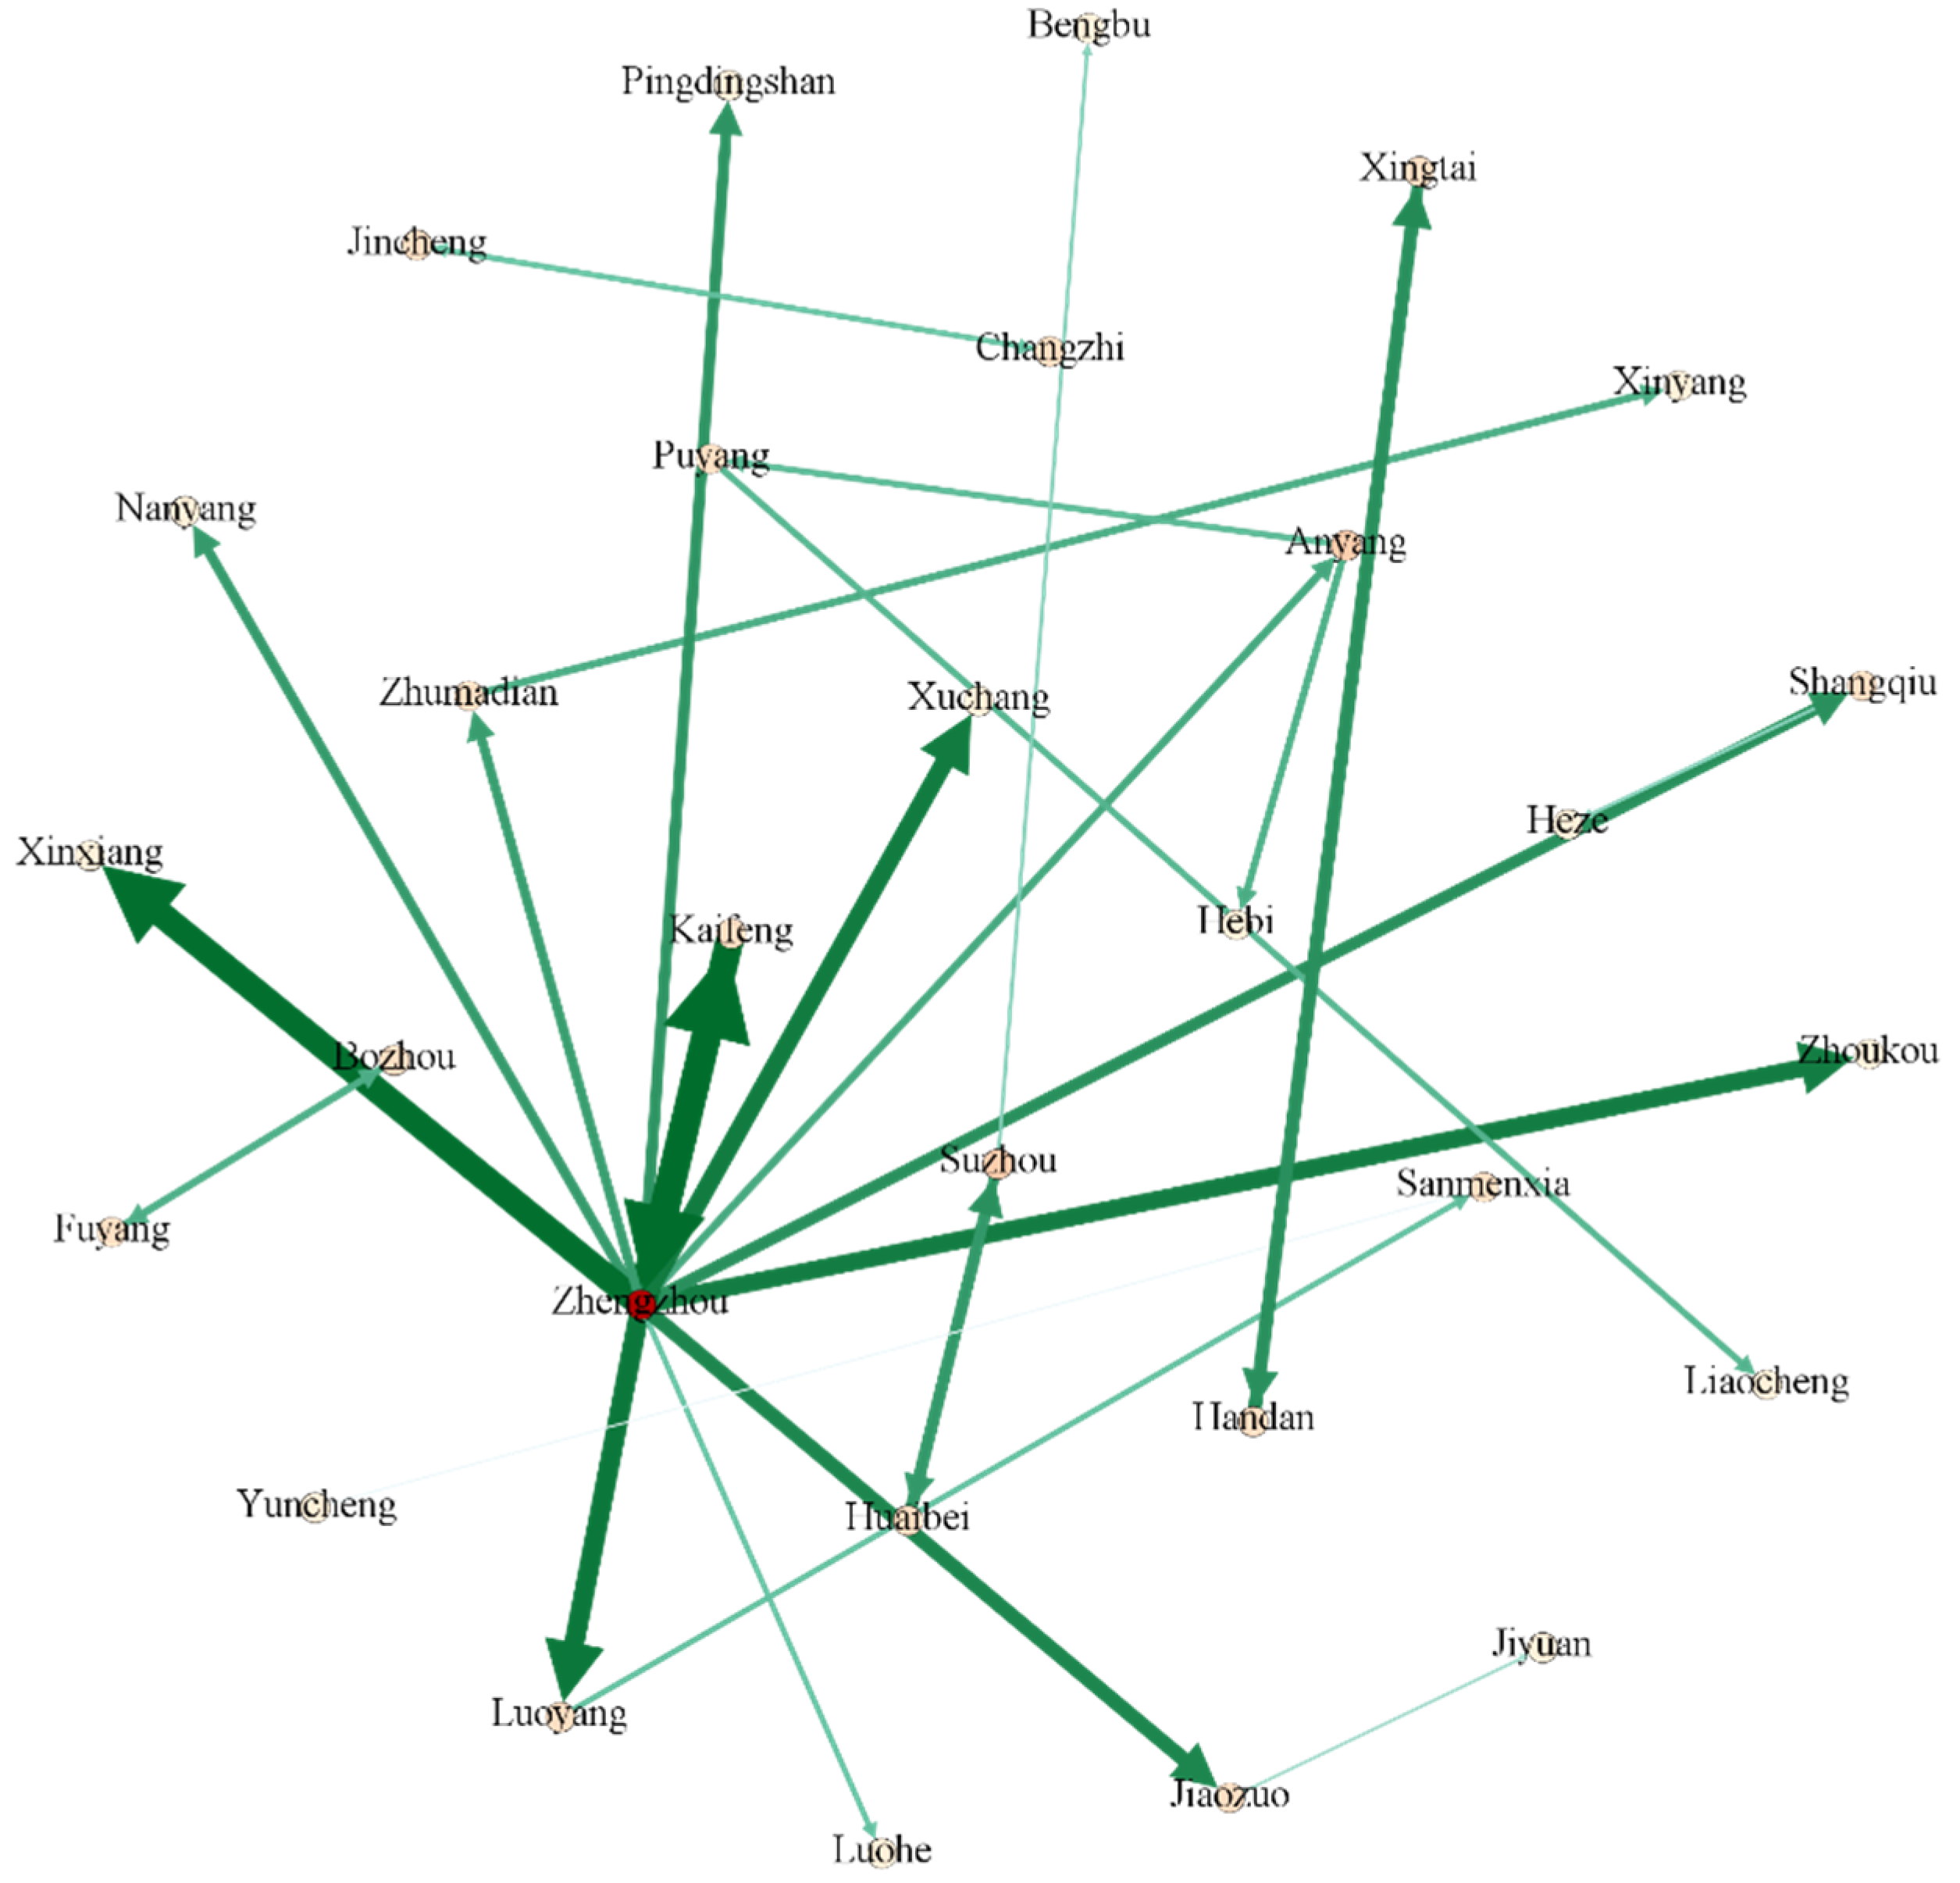
3.2.2. Dynamic Changes in the Intercity Migration Scale

To probe the dynamic change characteristics of the migration scale and the relation between two cities in Zhongyuan Urban Agglomeration, a hierarchical TimeCell method is proposed and adopted to visualize the migration scale based on the matrix M for 7 days, as shown in Figure 11.
On the whole, the change in the migration scale between two cities in Zhongyuan Urban Agglomeration is generally consistent with that of city nodes. Specifically, dynamic changes in the intercity migration scale can be classified into the following four types. ① Peaking on Monday, that is, the migration between two cities reaches its peak on Monday. This type appears mainly in the immigration to Zhengzhou from some cities in Henan Province, such as Kaifeng, Luoyang, Xinxiang, Xuchang and Jiaozuo. ② Peaking on weekends, that is, the migration reaches its peak on weekends (especially on Saturday). This characteristic can be found in the emigration from Zhengzhou to cities including Kaifeng, Luoyang, and so on, and is opposite the direction of that type ①. In addition, this type of migration exists between some other cities, such as Sanmenxia-Luoyang, Anyang-Jiaozuo, Shangqiu-Zhoukou and Fuyang-Zhoukou. Notably, the migration scales of ① and ② are generally larger, which is consistent with the judgment of weekly intercity commuting in Section 3.2.1. ③ Bimodal, that is, there are two migration peaks on Monday and the weekend, and the migration scale is nearly the same, such as Luoyang-Kaifeng, Anyang-Xinxiang, Jiaozuo-Xinxiang, Xuchang-Pingdingshan, Luohe-Xuchang, Jiaozuo-Jiyuan and Fuyang-Bozhou. ④ Stable, that is, the migration scale changes little without obvious peaks during a week, such as Shangqiu-Kaifeng, Heze-Shangqiu and Handan-Xingtai.
The change types of the migration scale in the urban agglomeration reflect the level of urban integration development and urban functions of the two cities. The urban integration development policy has led to the expansion of the “pendulum clan” from commuting within a single city to the intercity range, and has enabled an increasing number of people to live a “5 + 2” dual-city lifestyle. Cities with peak inflows on Sundays and Mondays tend to be core cities with better working conditions, while those with higher inflows on Fridays and Saturdays tend to be surrounding cities. It can be concluded that the larger the migration scale and the greater the variation amplitude (such as type ① and type ②) between two cities, the higher the level of urban integration development is.

4. Discussion

This paper innovatively puts forward the methodology of dynamic network characteristic analysis in view of periodicity, which has not been used in the previous study of urban agglomeration. Therefore, we compare our method with the existing research based on the results of static network characteristic analysis. (1) Both network intensity results from our method and the method based on comprehensive connection network analysis [17] can reflect the multi-level network pattern centered on Zhengzhou. The difference is that the high-level network connections distribute along the train lines (Beijing-Guangzhou Line, Longhai Line, Beijing-Kowloon Line, etc.) according to An’s research, while the networks based on population migration do not show such characteristics. This suggests that the frequency of trains does not necessarily reflect the connection intensity between the two cities, as it might be a proof of the importance of the entire line. By contrast, the migration scale is a more direct reflection and indicator. In addition, our study not only demonstrates the overall network level, but also conducts point weight analysis for cities, so as to reveal the migration between two cities in a comprehensive perspective. (2) Both cohesive subgroup results from our method and Han’s study [14] show that cities in Henan province participate in clustering first, indicating that these cities have higher migration similarity and are more closely related. The difference is that Han’s result shows that all cities participate in hierarchical clustering, while from our research, we find that the relationship between certain cities such as Bozhou and the others is relatively weak and does not appear in any cohesive subgroups and hierarchical clustering. Due to China’s provincial administrative regionalization, the migration scale between the peripheral cities and cities in the same provinces may be larger than that between them and cities in Zhongyuan Urban Agglomerations, and the connections within the urban agglomerations is relatively weak. These results are consistent with Figure 6.
The pattern of migration networks is one of the external manifestations of the interrelation between cities. Population migration is influenced by many factors, including administrative regionalization, traffic, resident population and economy, and it also promotes traffic construction and economic development to a certain extent. From the above results, it can be seen that the impact of administrative regionalization on the urban migration network is obvious. The influence of administrative regionalization factors is reflected not only in geographical location but also in the promulgation and implementation of relevant policies. Henan Province as a whole is located in the central part of Zhongyuan Urban Agglomeration, and Zhengzhou is also located in the geographic center, which helps to consolidate its influence. Zhengzhou is an important hub city of railways (the double cross center of ordinary and high-speed railways, and the center of meter-shaped high-speed railway network), aviation (the national airport economic comprehensive experimental area), expressways, electric power, postal and telecommunication services in China. Its GDP is at the trillion level and far ahead of those of other cities, and the permanent population in the seventh census exceeded 12.6 million. These are all objective conditions for its very large migration scale. Benefiting from the urban integration development policy with Zhengzhou as the core, Kaifeng, Xinxiang, Luoyang and other cities adjacent to Zhengzhou have a large scale of migration, among which migration with Zhengzhou accounts for a large proportion. For example, the migration scale of Zhengzhou and Kaifeng reflects the positive impact of the Zheng-Kai integration construction on the migration activities of the two cities. Zheng-Luo-Xin National Independent Innovation Demonstration Zone, which is built on the basis of high-tech industrial development zones in Zhengzhou, Luoyang and Xinxiang, plays a significant role in promoting population migration, city integration and the development of innovative industries. It may be an important policy factor that causes Xinxiang and Luoyang, which are not adjacent, to still exhibit a certain scale of migration. In addition, Shangqiu, Luoyang, Zhoukou and Handan are at the forefront in terms of migration scale and centrality, and occupy an important position in the structure of the migration network. They are the subcentral node cities in the eastern, western, southern and northern areas of Zhongyuan Urban Agglomeration. In summary, the current migration network of Zhongyuan Urban Agglomeration is characterized by a circular structure with Zhengzhou as the center, a city belt around Zhengzhou as the connection, and subcentral cities as the support and peripheral cities as the extension. To some extent, the conclusion of migration network research in this paper is consistent with the planning of Zhongyuan Urban Agglomeration intended to build a modern comprehensive transportation hub system with a “reasonable layout and clear hierarchy” [29].

5. Conclusions

Based on Baidu migration data, this paper analyzes the network patterns of Zhongyuan Urban Agglomeration from both static and dynamic aspects. The conclusions are as follows.
(1) Research on static migration networks based on social network analysis shows that: a. All network connections can be divided into 5 levels according to the average migration scale between the city nodes, that is, connections of the central level, backbone level, skeleton level, regional level and marginal level. The networks consisting of connections at the central and backbone levels occupy more than 38% of the total amount of migration, taking on a radial shape with Zhengzhou as the center and the rest as the surroundings. b. In terms of point weight, Zhengzhou takes an absolute lead over other cities in Zhongyuan Urban Agglomeration by virtue of its status as a national transportation hub, and keeps the largest migration connection with most surrounding cities. Furthermore, the internal migration proportion of each city in Henan Province accounts for more than 50%. c. Network centrality analysis shows that Zhengzhou, Luoyang and Zhoukou have the highest migration intensity with other cities in the urban agglomeration. Zhengzhou, Shangqiu, Zhoukou, Sanmenxia and Handan are important intermediate nodes in the urban agglomerations, while the migration activities of Zhengzhou, Shangqiu and Zhoukou are the least restricted by other cities. d. The analysis of cohesive subgroups shows that 11 cities represented by Xingtai fail to form a subgroup connection, and the other 19 cities are grouped into two clusters in the south and north-central parts of the urban agglomeration according to the similarity of subgroups. The southern cluster includes 10 cities, such as Zhengzhou, and the north-central cluster includes 9 cities, such as Luoyang.
(2) Research on the dynamic characteristics of migration networks within one week in view of periodicity shows that: a. The migration scale in and out of a single city peaks on the weekend and falls from Tuesday to Thursday, and there is an obvious weekly commuting phenomenon. In terms of immigration, Suzhou, Kaifeng, Jiaozuo and Bengbu are the destinations of weekly commuting on weekends, and Zhengzhou is the destination of weekly commuting at the beginning of the week. For emigration, Zhengzhou, Sanmenxia and Bozhou are the starting points of weekly commuting on weekends, while Zhoukou and Handan are the starting points at the beginning of the week. b. Migration variation between two cities can be divided into four types: peaking on Monday (represented by Kaifeng-Zhengzhou), peaking on weekends (represented by Zhengzhou-Kaifeng), bimodal (represented by Xuchang-Pingdingshan) and stable (represented by Heze-Shangqiu). These types of migration scale variation can also reflect the level of urban integration development and urban functions of the two cities.
According to the above analysis and discussion, compared with the most developed urban agglomerations in the world (the urban agglomerations centered on New York, Tokyo), Zhongyuan Urban Agglomeration also has the location advantage for multi-layer development and construction. However, due to the influence of factors such as administrative regionalization and spatial distance, cities in Henan province have relatively high internal connections, while the connections with cities in other provinces need to be strengthened. In order to promote the coordinated development of Zhongyuan Urban Agglomeration, it is recommended to continue to strengthen Zhengzhou’s core status and radiation range, and speed up the construction of intercity railways, rail transit and expressways around Zhengzhou, so as to form a more convenient metropolitan transportation network within the city belt around Zhengzhou. In addition, it is of great significance to support the construction of Luoyang as a national hub, and Fuyang and other regional transportation hubs to relieve the migration pressure of subcentral cities, and the construction of regional hubs will help improve the migration connection between peripheral cities and others to promote the integrated and efficient development of the whole urban agglomeration.
As a result, our research makes some contributions to the pattern discovery of network features, but is relatively inadequate for the study of causality. Although the network patterns from both static and dynamic aspects are revealed in detail in this paper, it should be noted that these are conclusions drawn from just migration data and little consideration is given to other factors. For example, Baidu migration data contain the information about scale and direction of inter-city migration, without any information about the ”push and pull” factors that affect migration, which is not conducive to our in-depth study of the formation of networks. Therefore, future studies could be conducted on the correlation and causal relationships between migration flow and traffic, permanent population, economy and other factors to further analyze the relations between cities and urban agglomeration network patterns at multiple levels.

Author Contributions

Conceptualization, Zhenkai Yang and Yixin Hua; methodology, Zhenkai Yang; software, Yibing Cao; validation, Zhenkai Yang, Xinke Zhao and Minjie Chen; formal analysis, Yixin Hua; investigation, Yibing Cao; resources, Zhenkai Yang; data curation, Zhenkai Yang; writing—original draft preparation, Zhenkai Yang; writing—review and editing, Xinke Zhao; visualization, Minjie Chen; supervision, Yixin Hua; project administration, Yibing Cao; funding acquisition, Yixin Hua. All authors have read and agreed to the published version of the manuscript.

Funding

This research was funded by National Key R&D Program of China, grant number 2016YFB0502300.

Institutional Review Board Statement

Not applicable.

Informed Consent Statement

Not applicable.

Data Availability Statement

The data presented in this study are available on request from the authors.

Conflicts of Interest

The authors declare no conflict of interest.

References

  1. Gottmann, J. Megalopolis: The Urbanized Northeastern Seaboard of the United States; The MIT Press: Cambridge, UK, 1964. [Google Scholar]
  2. Gottmann, J. Megalopolitan systems around the world. Hrvat. Geogr. Glas. 1976, 38, 103–111. [Google Scholar]
  3. Gao, X.; Li, C. Geographical discrimination for the urbanization response to upgrade of industry structure in Great Lakes industrial district. World Reg. Stud. 2006, 15, 71–77. (In Chinese) [Google Scholar]
  4. Liu, K.; Murayama, Y.; Ichinose, T. Exploring the relationship between functional urban polycentricity and the regional characteristics of human mobility: A multi-view analysis in the Tokyo metropolitan area. Cities 2021, 111, 103109. [Google Scholar] [CrossRef]
  5. Zhang, Y.; Marshall, S.; Manley, E. Understanding the roles of rail stations: Insights from network approaches in the London metropolitan area. J. Transp. Geogr. 2021, 94, 103110. [Google Scholar] [CrossRef]
  6. Heitz, A. The logistics dualization in question: Evidence from the Paris metropolitan area. Cities 2021, 119, 103407. [Google Scholar] [CrossRef]
  7. Liu, S. Mega–regions across the world and its experiences in China. Academics 2012, 6, 19–28, 269–273. (In Chinese) [Google Scholar]
  8. Castells, M. Local and global: Cities in the network society. Tijdschr. Voor Econ. En Soc. Geogr. 2002, 93, 548–558. [Google Scholar] [CrossRef]
  9. Wang, L.; Liu, H.; Liu, Q. China’s city network based on Tencent’s migration big data. Acta Geogr. Sin. 2021, 76, 853–869. (In Chinese) [Google Scholar]
  10. Wang, C.; Wang, M. Evolution of associated network characteristics between cities in Shandong province: Comparing central place and flow space theories. Geogr. Res. 2017, 36, 2197–2212. (In Chinese) [Google Scholar]
  11. Zheng, B.; Zhong, Y. Study on spatial structure of population migration network of urban agglomeration in the middle Yangtze River based on complex network. Econ. Geogr. 2020, 40, 118–128. (In Chinese) [Google Scholar]
  12. Sun, J.; Hou, L. Research on characteristics of network structure of Chengdu-Chongqing urban agglomeration based on Tencent population migration data. Mod. Urban Res. 2020, 9, 78–85. (In Chinese) [Google Scholar]
  13. Sun, Q.; Wang, S.; Zhang, K.; Ma, F.; Guo, X.; Li, T. Spatial pattern of urban system based on gravity model and whole network analysis in eight urban agglomerations of China. Math. Probl. Eng. 2019, 9, 6509726. [Google Scholar] [CrossRef]
  14. Han, T.; Huo, J.; Xue, J.; Cui, J.; Ma, B.; Liu, J. Comparative research of urban network structure of Zhongyuan Urban Agglomeration based on multivariate data. J. Henan Univ. (Nat. Sci.) 2020, 50, 379–390. (In Chinese) [Google Scholar]
  15. Liu, Z.; Ding, Z.; Bu, S.; Wang, F. The network structure analysis of Zhongyuan Urban Agglomeration based on interactive and traffic flow relationship. Hum. Geogr. 2015, 30, 79–86. (In Chinese) [Google Scholar]
  16. Zhu, X.; Wang, Q.; Zhang, P.; Yu, Y.; Xie, L. Optimizing the spatial structure of urban agglomeration: Based on social network analysis. Qual. Quant. 2021, 55, 683–705. [Google Scholar] [CrossRef]
  17. An, Y.; Liu, J.; Qiao, D. Urban spatial connection and network structure in Zhongyuan Urban Agglomeration: A study based on integrated traffic and information flow. Sci. Geogr. Sin. 2019, 39, 1929–1937. (In Chinese) [Google Scholar]
  18. Mahutga, M.C.; Ma, X.; Smith, D.A.; Timberlake, M. Economic globalization and the structure of the world city system: The case of airline passenger data. Urban Stud. 2010, 47, 1925–1947. [Google Scholar] [CrossRef]
  19. Taylor, P.J. The new geography of global civil society: NGOs in the world city network. Globalizations 2004, 1, 265–277. [Google Scholar] [CrossRef] [Green Version]
  20. Liu, W.; Shi, E. Spatial pattern of population daily flow among cities based on ICT: A case study of “Baidu Migration”. Acta Geogr. Sin. 2016, 71, 1667–1679. (In Chinese) [Google Scholar]
  21. Zhao, Y.; Li, J.; Guo, J. Study on the urban network connection of Chengdu-Chongqing Agglomeration based on Baidu Index. Areal Res. Dev. 2017, 36, 55–59, 129. (In Chinese) [Google Scholar]
  22. Krings, G.; Carabrese, F.; Ratti, C.; Blondel, V.D. Urban gravity: A model for inter-city telecommunication flows. J. Stat. Mech. Theory Exp. 2009, 7, L07003. [Google Scholar] [CrossRef] [Green Version]
  23. Jiang, X.; Wang, S. Research on China’s urban population mobility network: Based on Baidu migration big data. Chin. J. Popul. Sci. 2017, 2, 35–46, 127. (In Chinese) [Google Scholar]
  24. Zhang, X.; Han, H.; Tang, Y.; Luo, G. Research on the characteristics of urban network structure in China based on Baidu migration data. J. Geo-Inf. Sci. 2021, 23, 1798–1808. (In Chinese) [Google Scholar]
  25. Liu, H.; Wang, L.; Li, Q.; Yan, C. Spatial and temporal patterns of city connection networks in the Yellow River Basin based on Tencent’s big data of population migration. Econ. Geogr. 2020, 40, 28–37. (In Chinese) [Google Scholar]
  26. Wang, X.; Ding, S.; Cao, W.; Fan, D.; Tang, B. Research on network patterns and influencing factors of population flow and migration in the Yangtze River Delta urban agglomeration, China. Sustainability 2020, 12, 6803. [Google Scholar] [CrossRef]
  27. Ye, Q.; Zhang, L.; Peng, P.; Huang, J. The network characteristics of urban agglomerations in the middle reaches of the Yangtze River based on Baidu migration data. Econ. Geogr. 2017, 37, 53–59. (In Chinese) [Google Scholar]
  28. Pan, J.; Lai, J. Research on spatial pattern of population mobility among cities: A case study of “Tencent Migration” big data in “National Day–Mid-Autumn Festival” vacation. Geogr. Res. 2019, 38, 1678–1693. (In Chinese) [Google Scholar]
  29. Notice of the National Development and Reform Commission on the Issuance of the Development Plan for Zhongyuan Urban Agglomeration. Available online: https://www.ndrc.gov.cn/xxgk/zcfb/ghwb/201701/t20170105_962218_ext.html (accessed on 1 June 2021). (In Chinese)
  30. Liu, M.; Wang, W.; Liu, J.; Liang, L.; Qiao, D.; An, Y. The delimitation and evolution pattern of cities space attractive scopes in the Zhongyuan Urban Agglomeration. Areal Res. Dev. 2017, 36, 49–54. (In Chinese) [Google Scholar]
  31. Zheng, H. Study on the Pattern and Optimization of Urban Network in Zhengzhou Urban Agglomeration from Space of Flows Viewpoint. Master’s Thesis, Northeast Normal University, Changchun, China, 2020. (In Chinese). [Google Scholar]
  32. Wang, C.; Yan, J. An inversion of the constitution of the Baidu migration scale index. J. Univ. Electron. Sci. Technol. China 2021, 50, 616–626. (In Chinese) [Google Scholar]
  33. Scott, J. Social Network Analysis; Sage Publications Ltd.: London, UK, 2000. [Google Scholar]
  34. Liu, J. Whole Network Approach, 3rd ed.; Truth & Wisdom Press: Shanghai, China, 2019. (In Chinese) [Google Scholar]
  35. Sheng, K.; Yang, Y.; Zhang, H. Cohesive subgroups and underlying factors in the urban network in China. Geogr. Res. 2019, 38, 2639–2652. (In Chinese) [Google Scholar]
  36. Zhou, C.; Qv, P.; Wang, X. DSNE: A new dynamic social network analysis algorithm. J. Jilin Univ. (Eng. Technol. Ed.) 2008, 38, 408–413. (In Chinese) [Google Scholar]
  37. Song, C.; Pei, T. Research progress in time series clustering methods based on characteristics. Prog. GeoGraphy 2012, 31, 1307–1317. (In Chinese) [Google Scholar]
  38. Chen, W.; Shen, Z.; Tao, Y. Data Visualization, 2nd ed.; Publishing House of Electronics Industry: Beijing, China, 2019. (In Chinese) [Google Scholar]
  39. Yi, J.S.; Elmqvist, N.; Lee, S. TimeMatrix: Analyzing temporal social networks using interactive matrix-based visualizations. Int. J. Hum.-Comput. Interact. 2010, 26, 1031–1051. [Google Scholar] [CrossRef]
  40. Chen, S.; Shen, L. Study on spatial-temporal characteristics of population mobility in the urban integration areas of three cities based on Tencent location big data. Mod. Urban Res. 2019, 11, 2–12. (In Chinese) [Google Scholar]
Figure 1. Work flow.
Ijgi 11 00062 g001
Figure 2. Location of Zhongyuan Urban Agglomeration in China.
Ijgi 11 00062 g002
Figure 3. Line chart of migration scale index (taking Zhengzhou as an example).
Ijgi 11 00062 g003
Figure 4. Representation of nodes and edges based on TimeCell.
Ijgi 11 00062 g004
Figure 5. Migration network levels of Zhongyuan Urban Agglomeration.
Ijgi 11 00062 g005
Figure 6. City point weight.
Ijgi 11 00062 g006
Figure 7. Cities of the largest scale of immigration to 30 cities.
Ijgi 11 00062 g007
Figure 8. Single-link clustering based on cohesive subgroups.
Ijgi 11 00062 g008
Figure 9. Variation in cluster centers based on immigration.
Ijgi 11 00062 g009
Figure 10. Variation in cluster centers based on emigration.
Ijgi 11 00062 g010
Figure 11. Migration variation visualization based on graded TimeCell.
Ijgi 11 00062 g011
Table 1. Network centrality of Zhongyuan Urban Agglomeration.
Point CentralityCloseness CentralityBetween Centrality
CitiesOut DegreeIn DegreeCitiesIn ClosenessOut ClosenessCitiesValue
Zhengzhou20.00018.000Zhengzhou69.04874.359Zhengzhou423.522
Luoyang9.0008.000Shangqiu52.72753.704Shangqiu127.813
Zhoukou9.00010.000Zhoukou52.72754.717Zhoukou74.349
Xinxiang8.0007.000Kaifeng50.00051.786Sanmenxia56.000
Xuchang7.0007.000Heze50.00050.877Handan52.013
Pingdingshan7.0007.000Anyang49.15349.153Anyang49.244
Shangqiu7.0008.000Xinxiang49.15353.704Heze43.435
Zhumadian7.0007.000Handan49.15336.709Puyang37.738
Anyang6.0006.000Puyang48.33349.153Luoyang30.951
Kaifeng6.0006.000Zhumadian48.33350.877Xinxiang30.820
Nanyang6.0006.000Xuchang47.54150.000Fuyang30.559
Puyang6.0006.000Luoyang47.54152.727Bozhou30.278
Jiaozuo5.0005.000Pingdingshan47.54150.000Jiaozuo25.617
Fuyang5.0005.000Nanyang46.03248.333Zhumadian21.807
Heze5.0005.000Luohe46.03248.333Liaocheng21.479
Luohe5.0005.000Xinyang46.03248.333Xinyang14.720
Handan5.0006.000Jincheng45.31334.524Suzhou10.235
Bozhou5.0006.000Jiaozuo45.31346.774Kaifeng10.204
Liaocheng4.0004.000Hebi44.61545.313Jincheng9.808
Xinyang4.0004.000Jiyuan43.28444.615Changzhi7.992
Suzhou4.0003.000Sanmenxia43.28445.313Xuchang5.580
Changzhi3.0003.000Bozhou41.42940.845Nanyang4.054
Hebi3.0003.000Fuyang39.18940.278Pingdingshan3.849
Bengbu3.0003.000Liaocheng38.15838.158Bengbu3.200
Jiyuan3.0003.000Huaibei36.70937.179Luohe0.400
Huaibei3.0003.000Suzhou36.70937.662Huaibei0.333
Sanmenxia3.0003.000Changzhi35.80235.802Xingtai0.000
Xingtai2.0002.000Xingtai34.11829.293Jiyuan0.000
Jincheng2.0003.000Bengbu31.18331.183Yuncheng0.000
Yuncheng1.0001.000Yuncheng30.52631.522Hebi0.000
Table 2. Cohesive subgroups of Zhongyuan Urban Agglomeration.
Subgroup NumberCities
1Zhengzhou, Kaifeng, Luoyang, Xinxiang, Xuchang
2Zhengzhou, Kaifeng, Shangqiu, Xuchang, Zhoukou
3Zhengzhou, Kaifeng, Shangqiu, Zhoukou, Heze
4Zhengzhou, Kaifeng, Xinxiang, Puyang, Heze
5Zhengzhou, Kaifeng, Pingdingshan, Xuchang, Zhoukou
6Zhengzhou, Kaifeng, Xuchang, Zhoukou, Luohe
7Zhengzhou, Luoyang, Nanyang, Pingdingshan, Xuchang
8Zhengzhou, Luoyang, Nanyang, Pingdingshan, Zhumadian
9Zhengzhou, Luoyang, Xinxiang, Jiaozuo, Jiyuan
10Zhengzhou, Luoyang, Pingdingshan, Xuchang, Zhoukou
11Zhengzhou, Luoyang, Pingdingshan, Xuchang, Luohe
12Zhengzhou, Nanyang, Pingdingshan, Xuchang, Zhoukou, Zhumadian
13Zhengzhou, Nanyang, Pingdingshan, Xuchang, Zhumadian, Luohe
14Zhengzhou, Nanyang, Pingdingshan, Xinyang, Zhumadian
15Zhengzhou, Anyang, Xinxiang, Hebi, Puyang
16Zhengzhou, Pingdingshan, Xuchang, Zhoukou, Zhumadian, Luohe
17Zhengzhou, Zhoukou, Xinyang, Zhumadian, Fuyang
Table 3. Clustering results based on immigration.
Cluster NumberMaxMinCities
Cluster_024.86172–12.472807Bozhou, Xinyang, Zhoukou, Xinxiang, Luoyang, Jiyuan, Huaibei, Xuchang, Fuyang, Hebi
Cluster_123.1806–12.6821Zhengzhou
Cluster_24.8515374–5.296148Sanmenxia, Heze, Yuncheng, Handan, Changzhi
Cluster_313.671321–7.819742Nanyang, Shangqiu, Anyang, Pingdingshan, Jincheng, Luohe, Puyang, Liaocheng, Xingtai, Zhumadian
Cluster_433.3409–15.052Suzhou, Kaifeng, Jiaozuo, Bengbu
Table 4. Clustering results based on emigration.
Cluster NumberMaxMinCities
Cluster_013.89395–4.70248Zhoukou, Handan
Cluster_130.3182–13.7351Zhengzhou
Cluster_216.38534–9.140346Sanmenxia, Bozhou, Yuncheng, Changzhi, Fuyang
Cluster_311.39154–10.82296833Suzhou, Pingdingshan, Kaifeng, Xinxiang, Luoyang, Jiyuan, Huaibei, Luohe, Jiaozuo, Bengbu, Xuchang, Hebi
Cluster_49.109639–7.181792Xinyang, Nanyang, Shangqiu, Anyang, Jincheng, Puyang, Liaocheng, Heze, Xingtai, Zhumadian
Publisher’s Note: MDPI stays neutral with regard to jurisdictional claims in published maps and institutional affiliations.

