
Spatial Evolution of Coastal Tourist City Using the Dyna-CLUE Model in Koh Chang of Thailand during 1990–2050


Abstract
1. Introduction
2. Materials and Methods
2.1. Study Area
2.2. Data Collection and Analysis
2.2.1. Data Collection
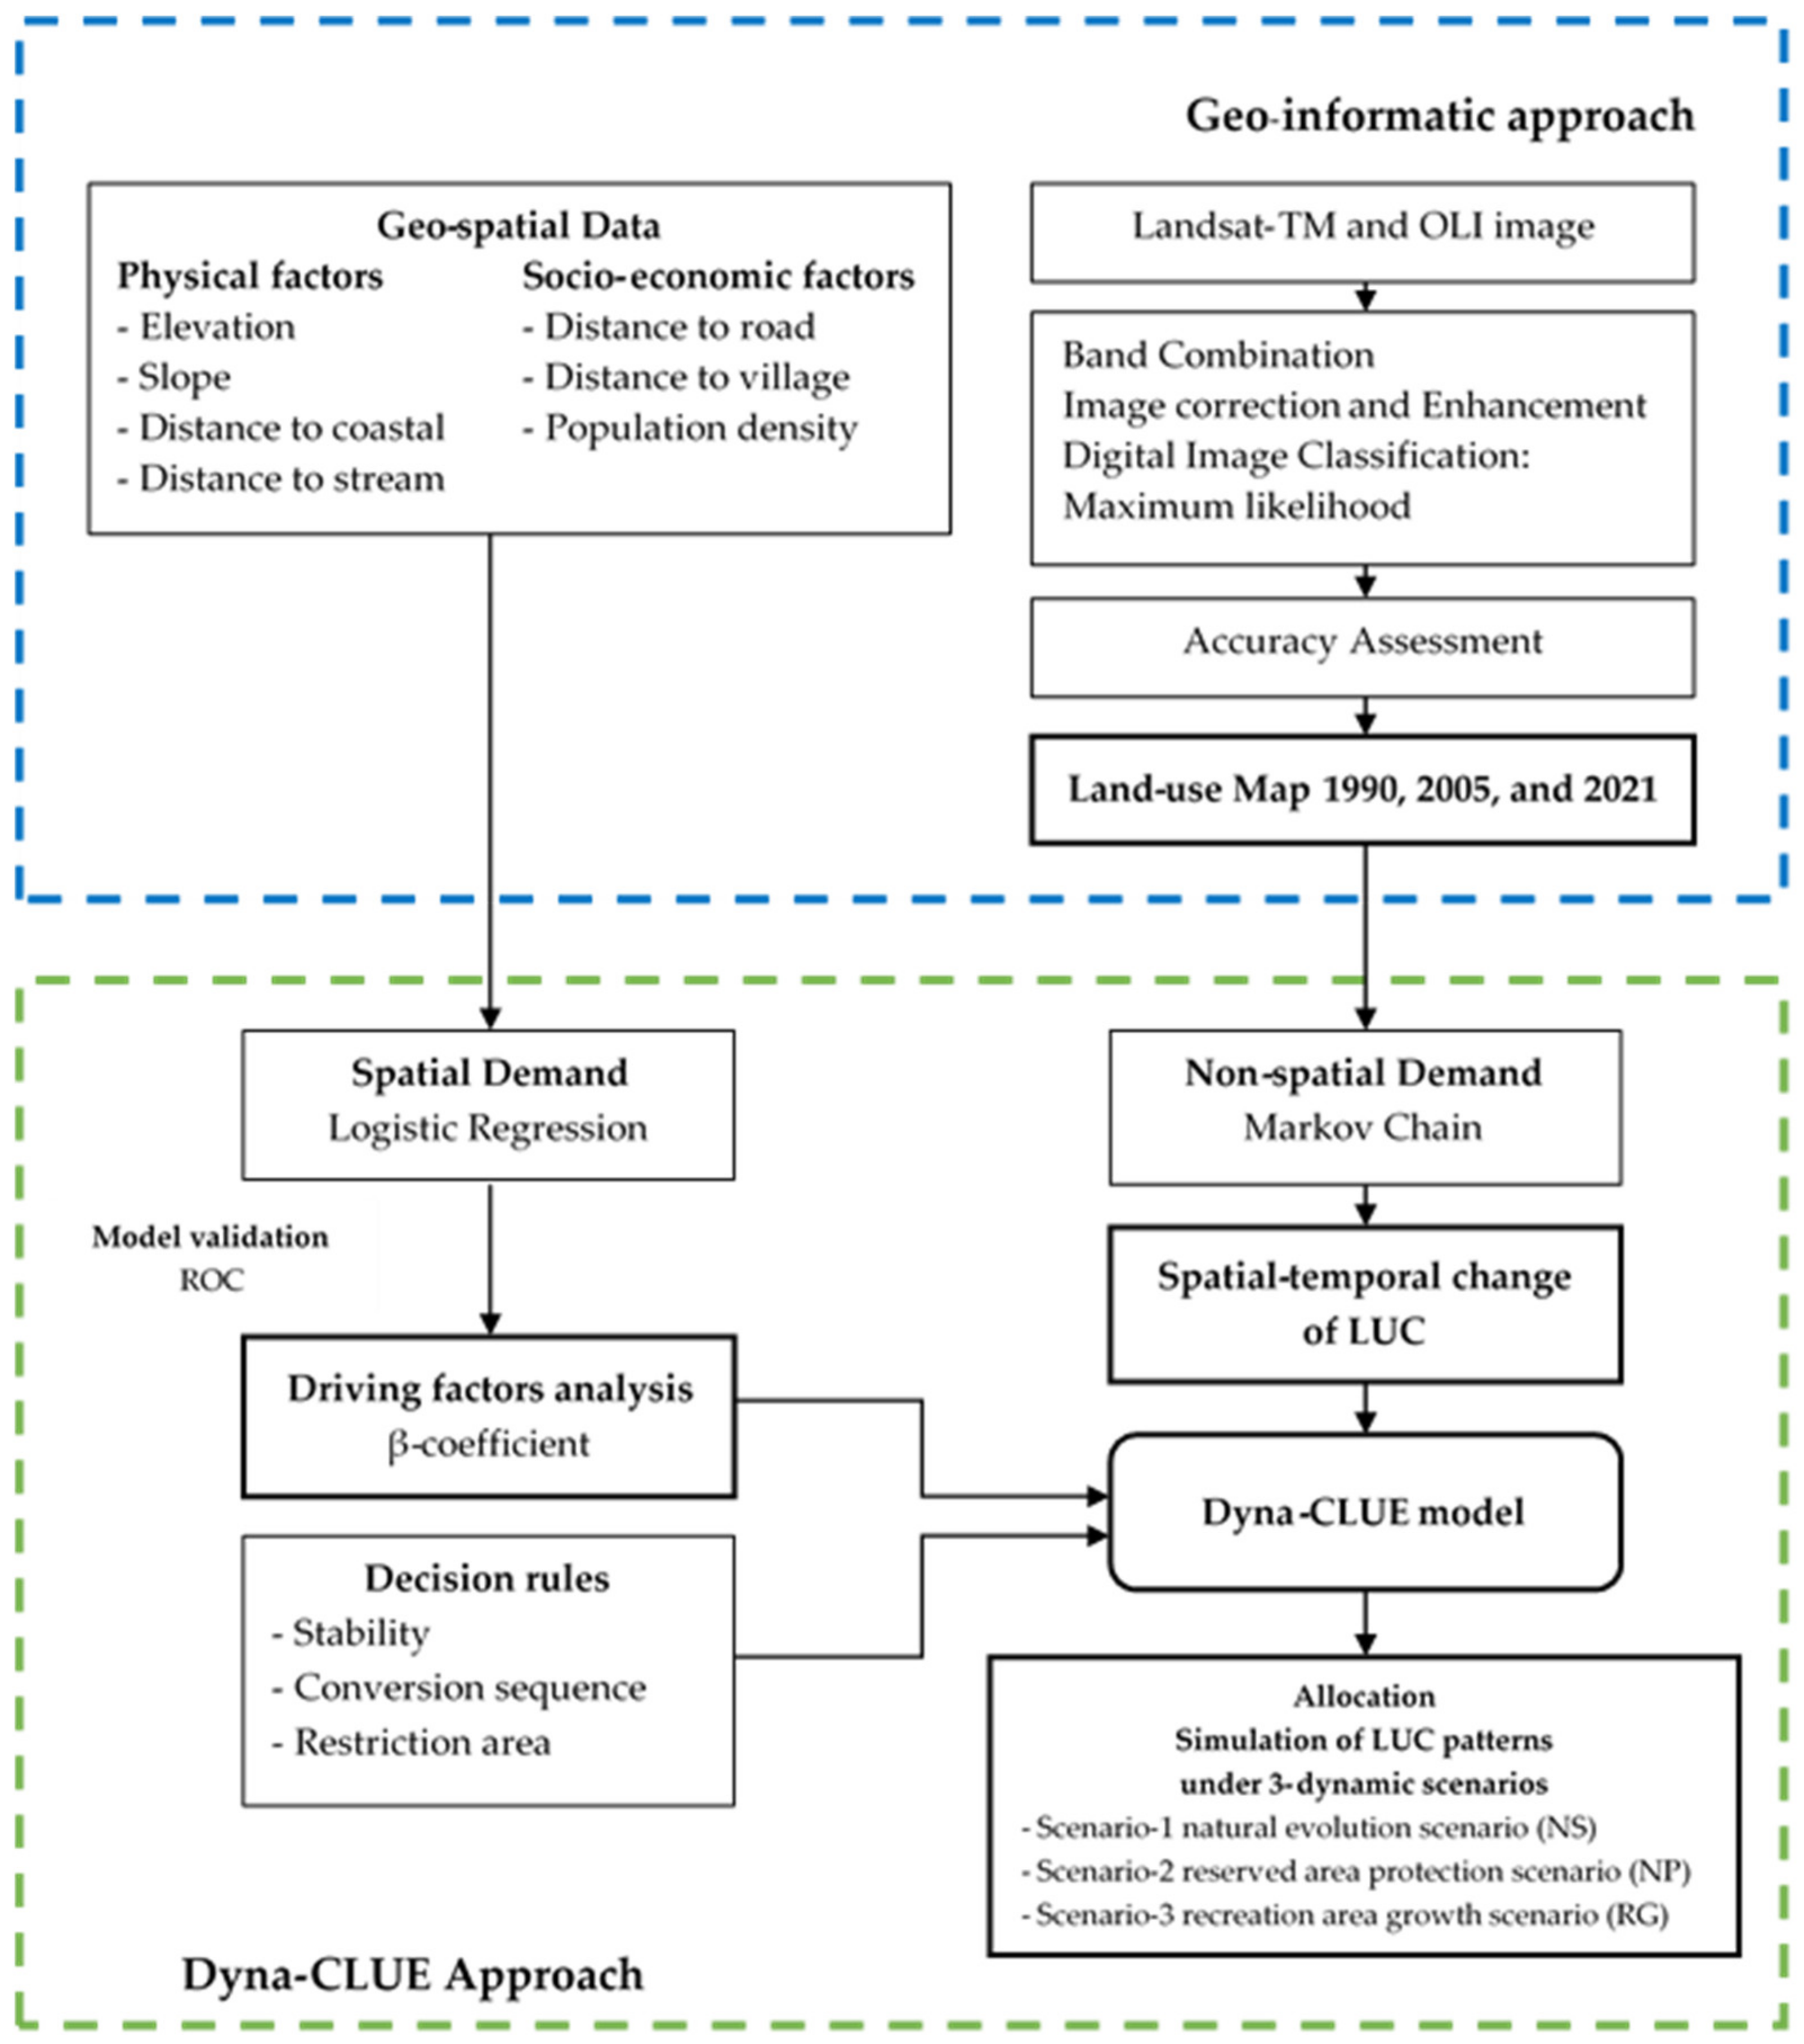
2.2.2. Method
- <0 means unacceptable classification data.
- 0.01–0.40 means fair classification data.
- 0.41–0.60 means moderate classification data.
- 0.61–0.80 means good classification data.
- 0.81–1.00 means very good classification data.
- × is the proportion of land-use in the second year
- is the land-use activity (f) derived from the transition probability matrix (TPM)
- is the proportion of land-use in the first year
- j is the type of land-use in first year and
- k is the type of land-use in the second year.
3. Results
3.1. Spatio–Temporal LUCs in Koh Chang
3.1.1. Land-Use Pattern Analysis
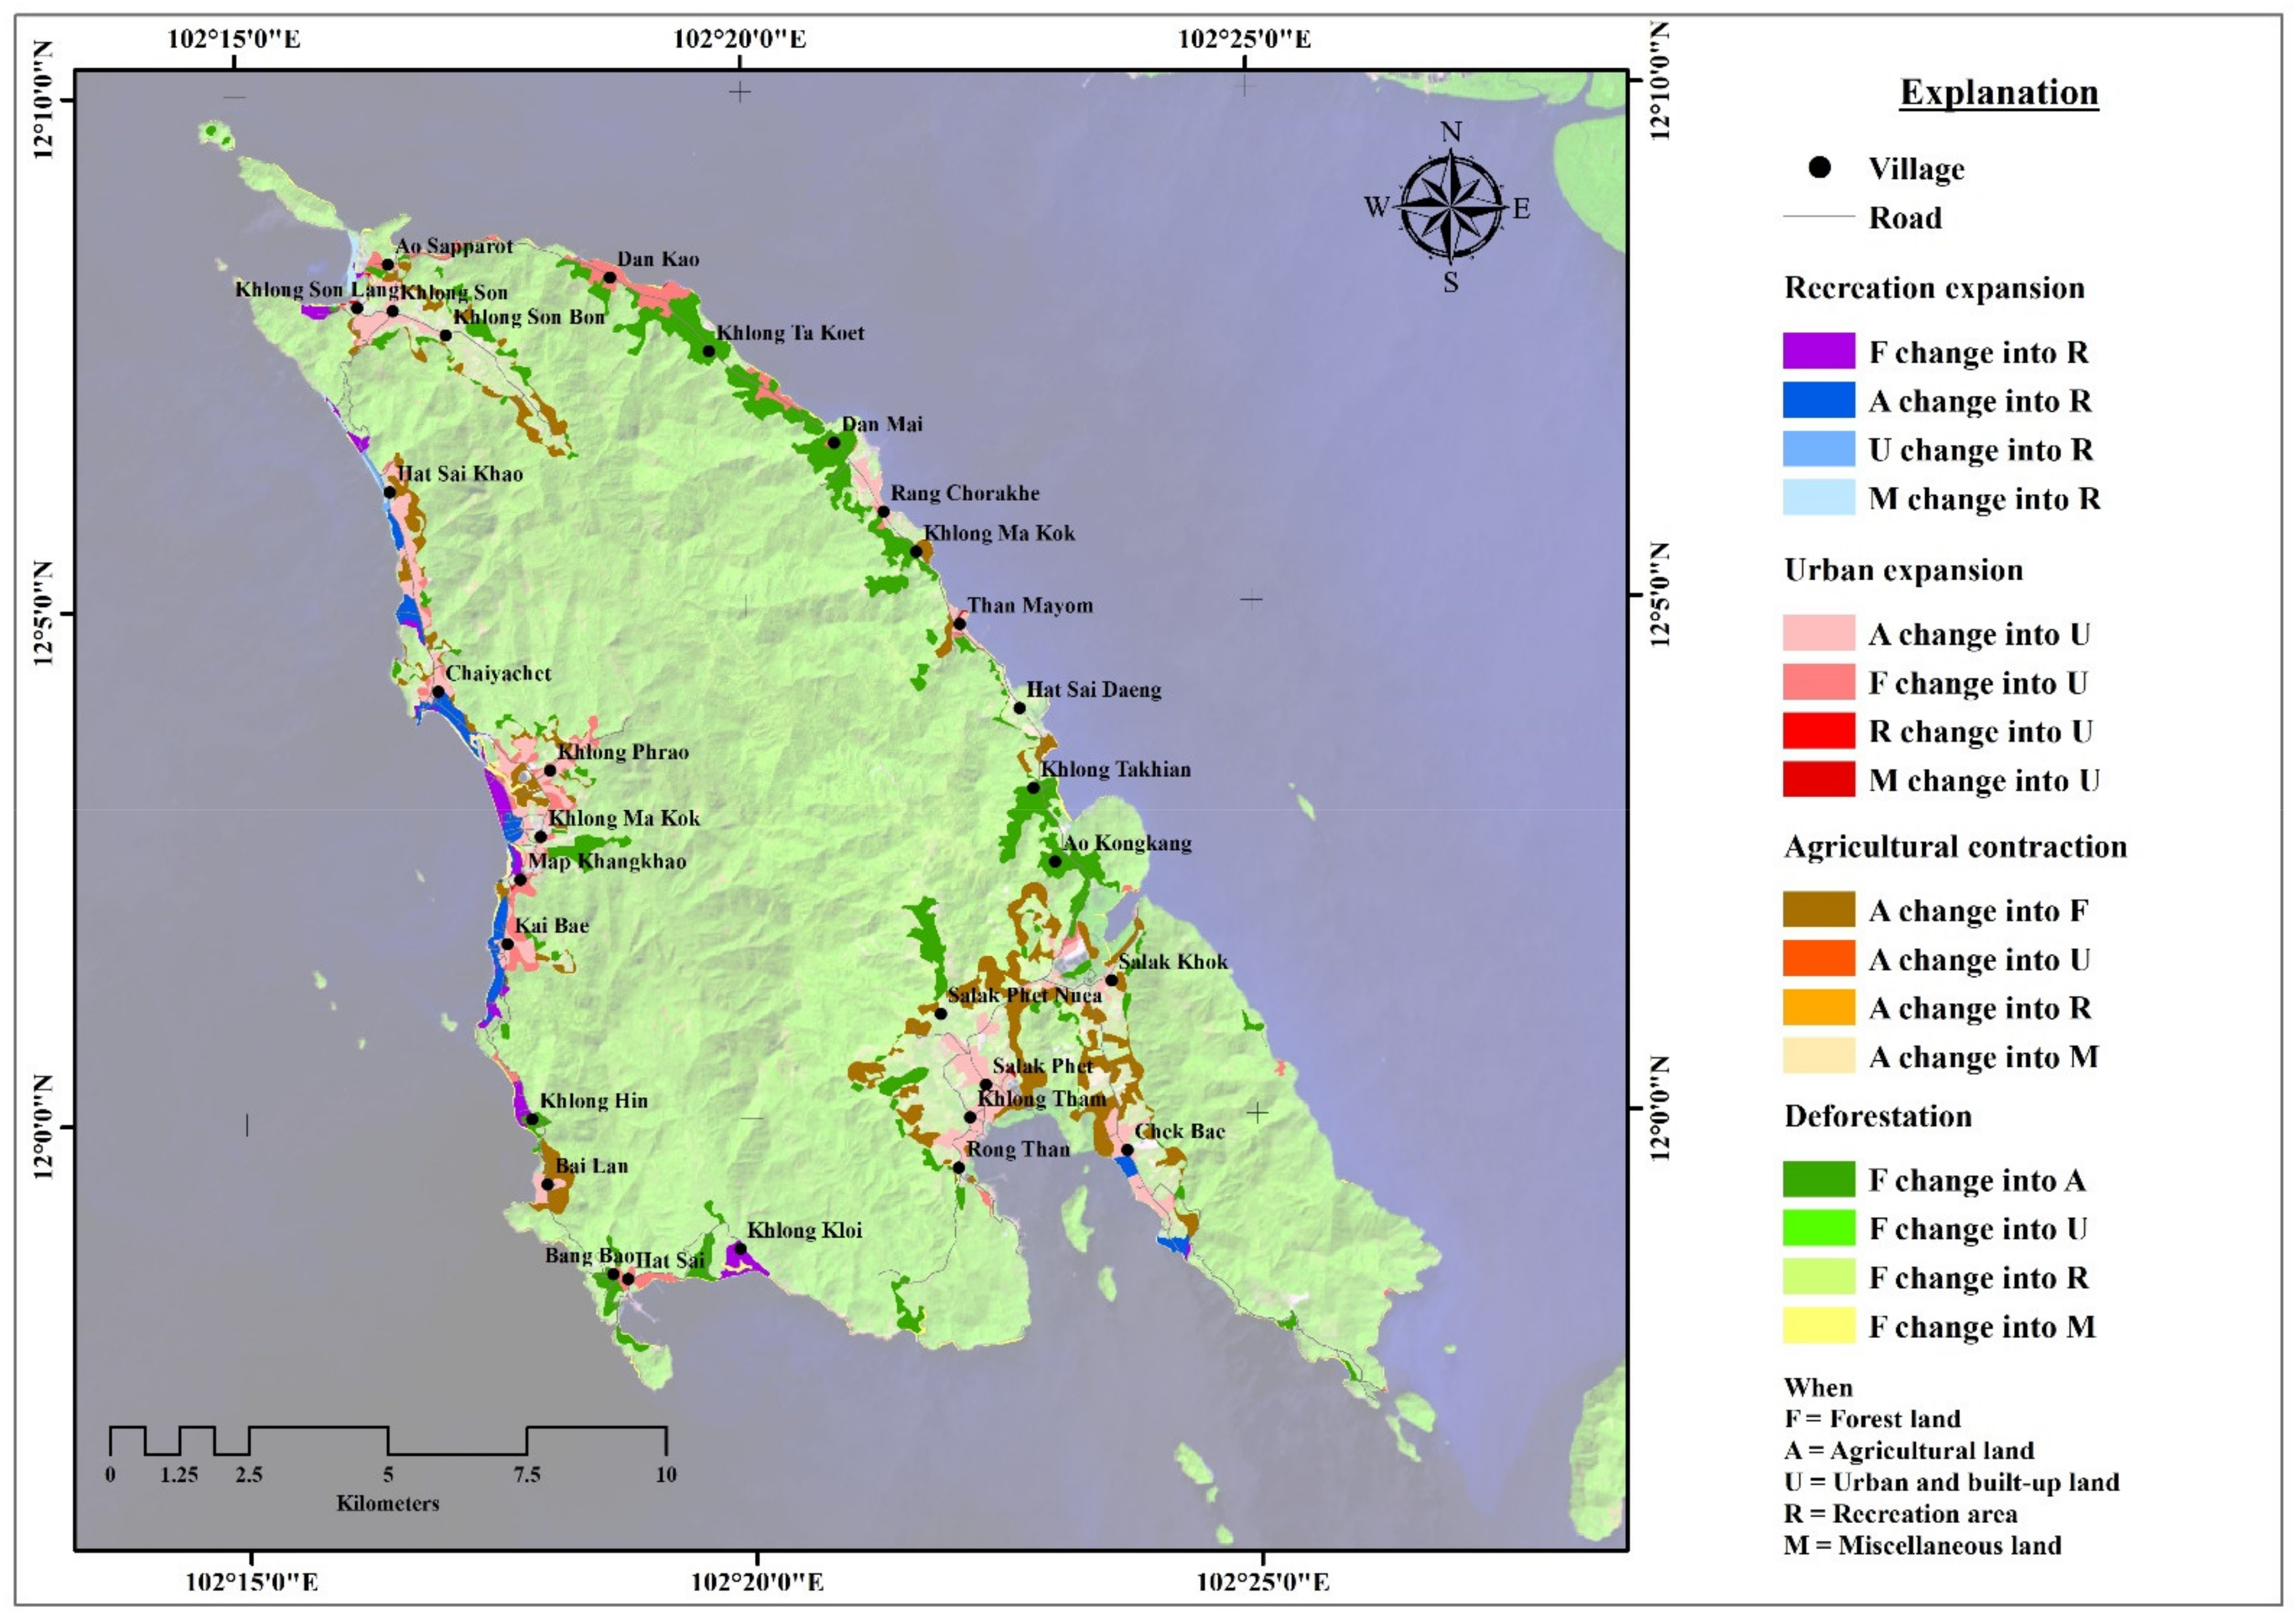
3.1.2. LUC Dynamic Transfer Analysis
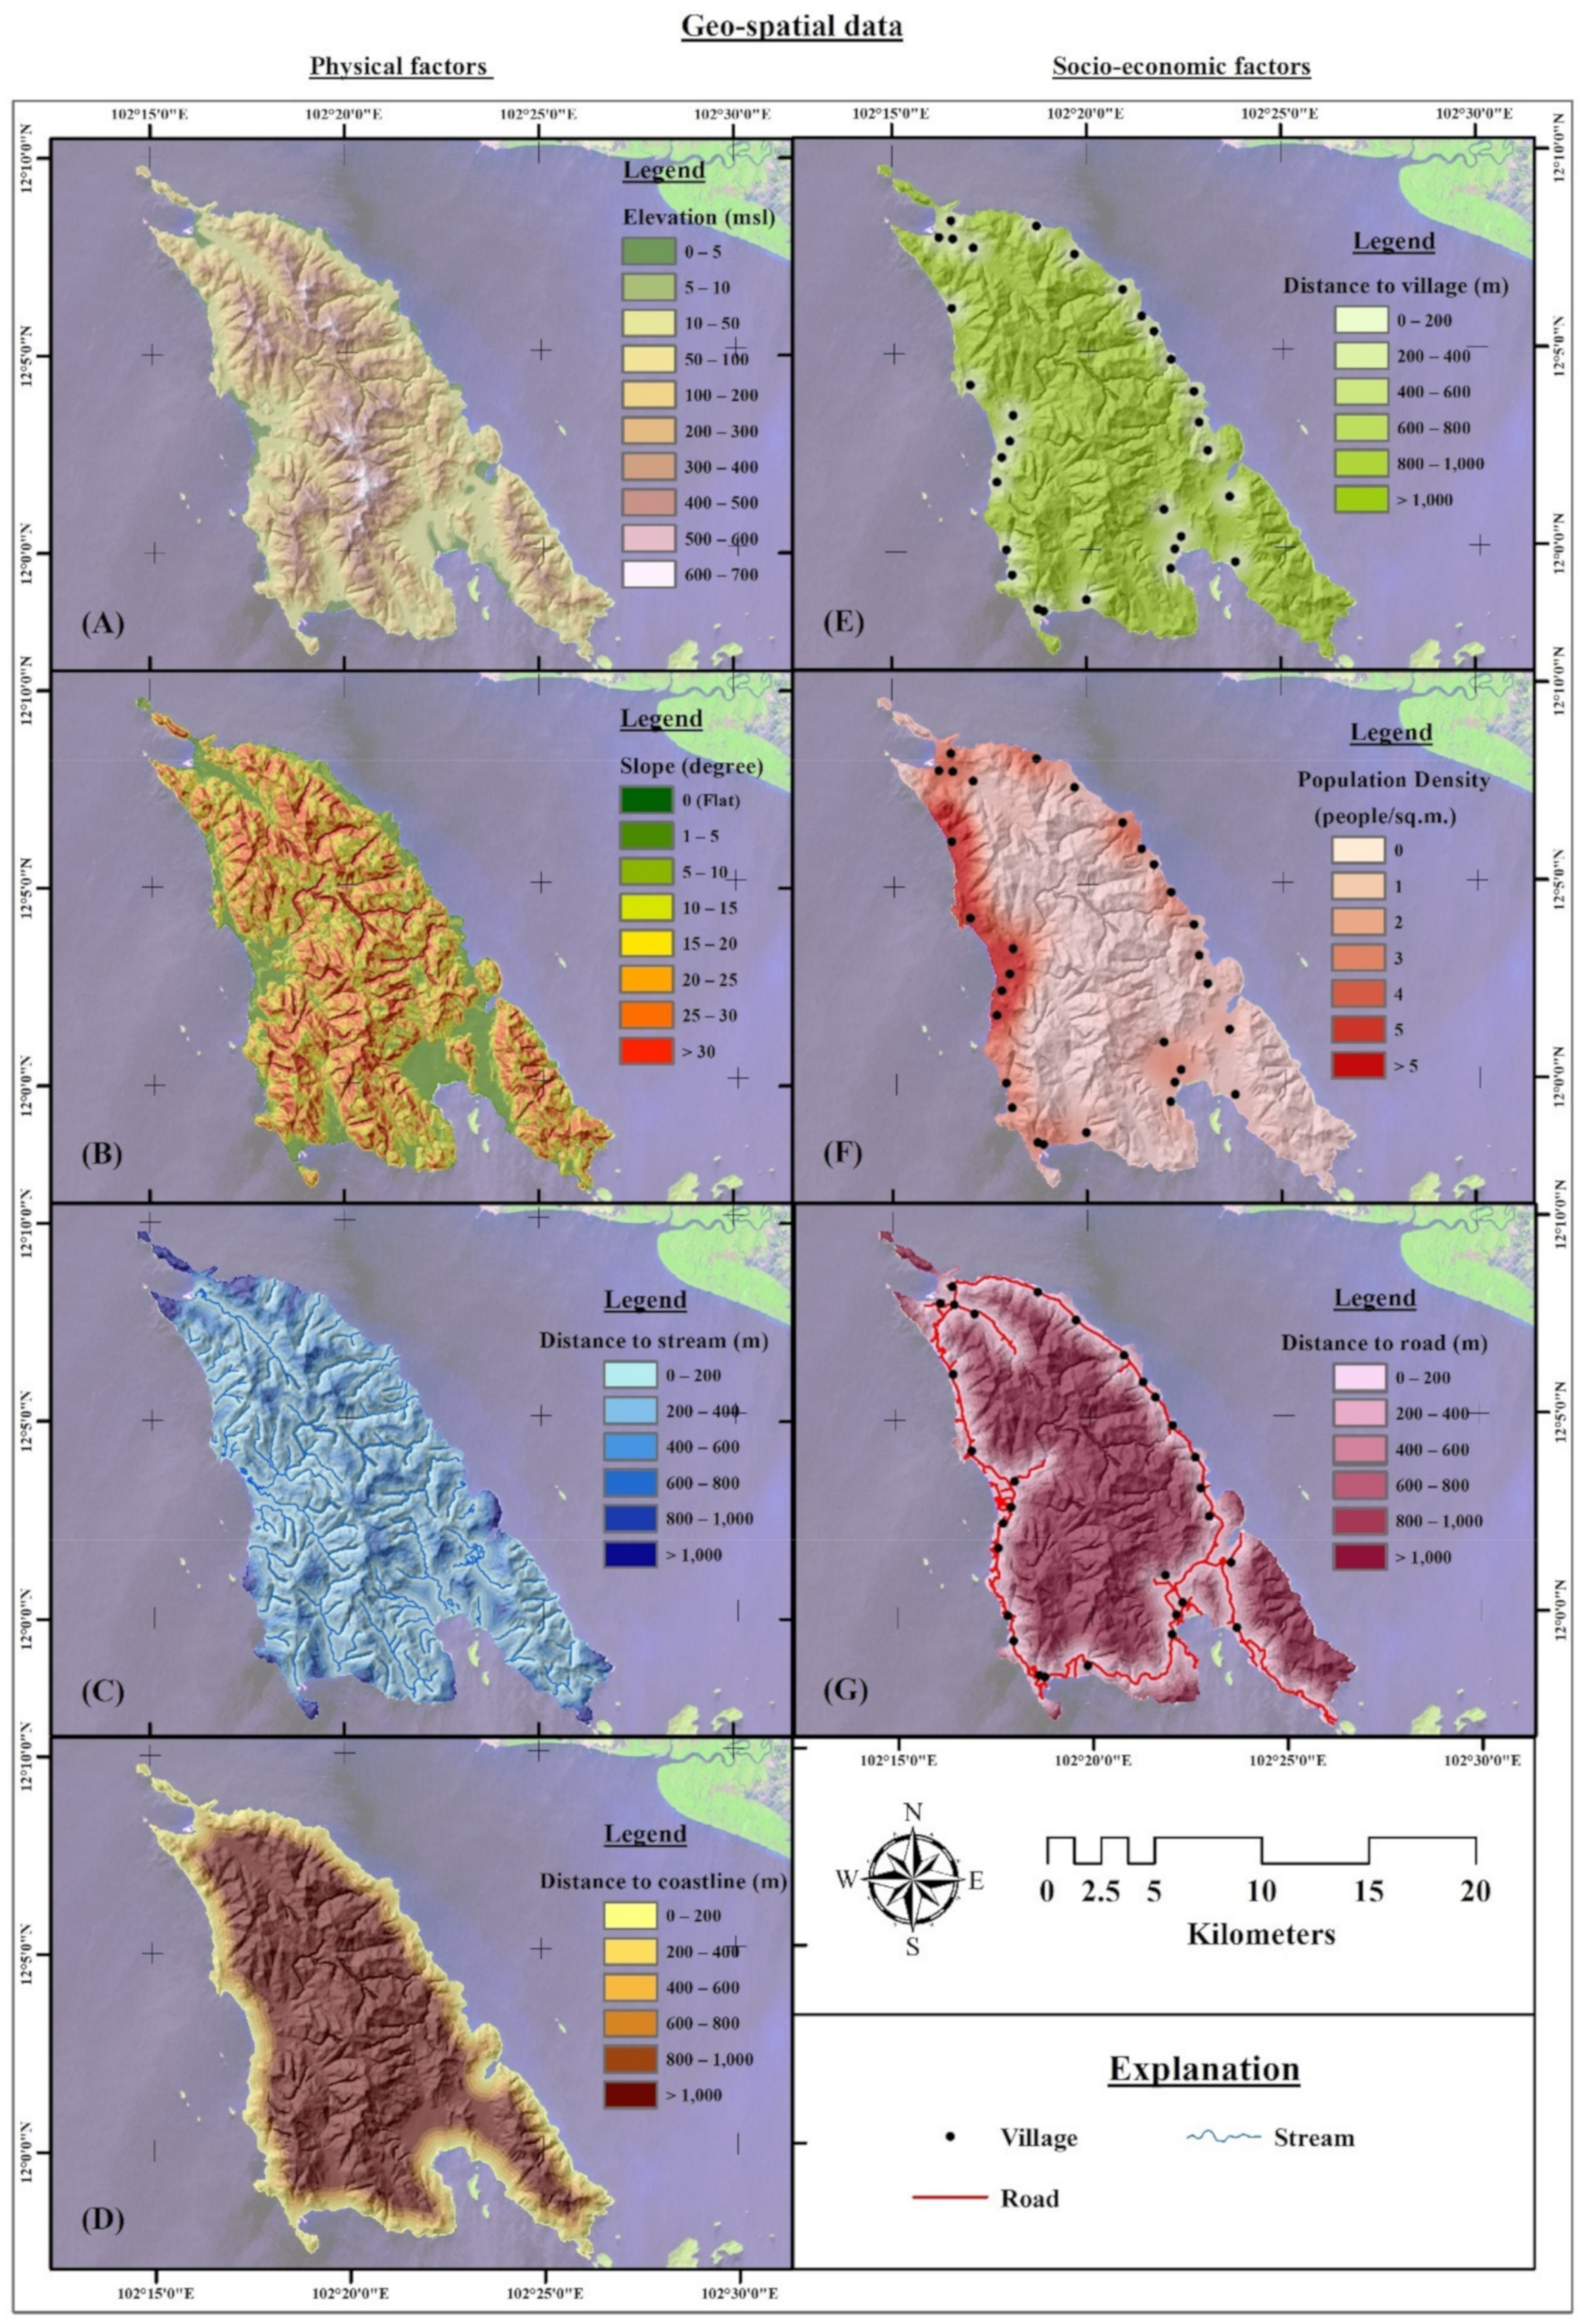
3.2. Driving Factors Analysis in Koh Chang
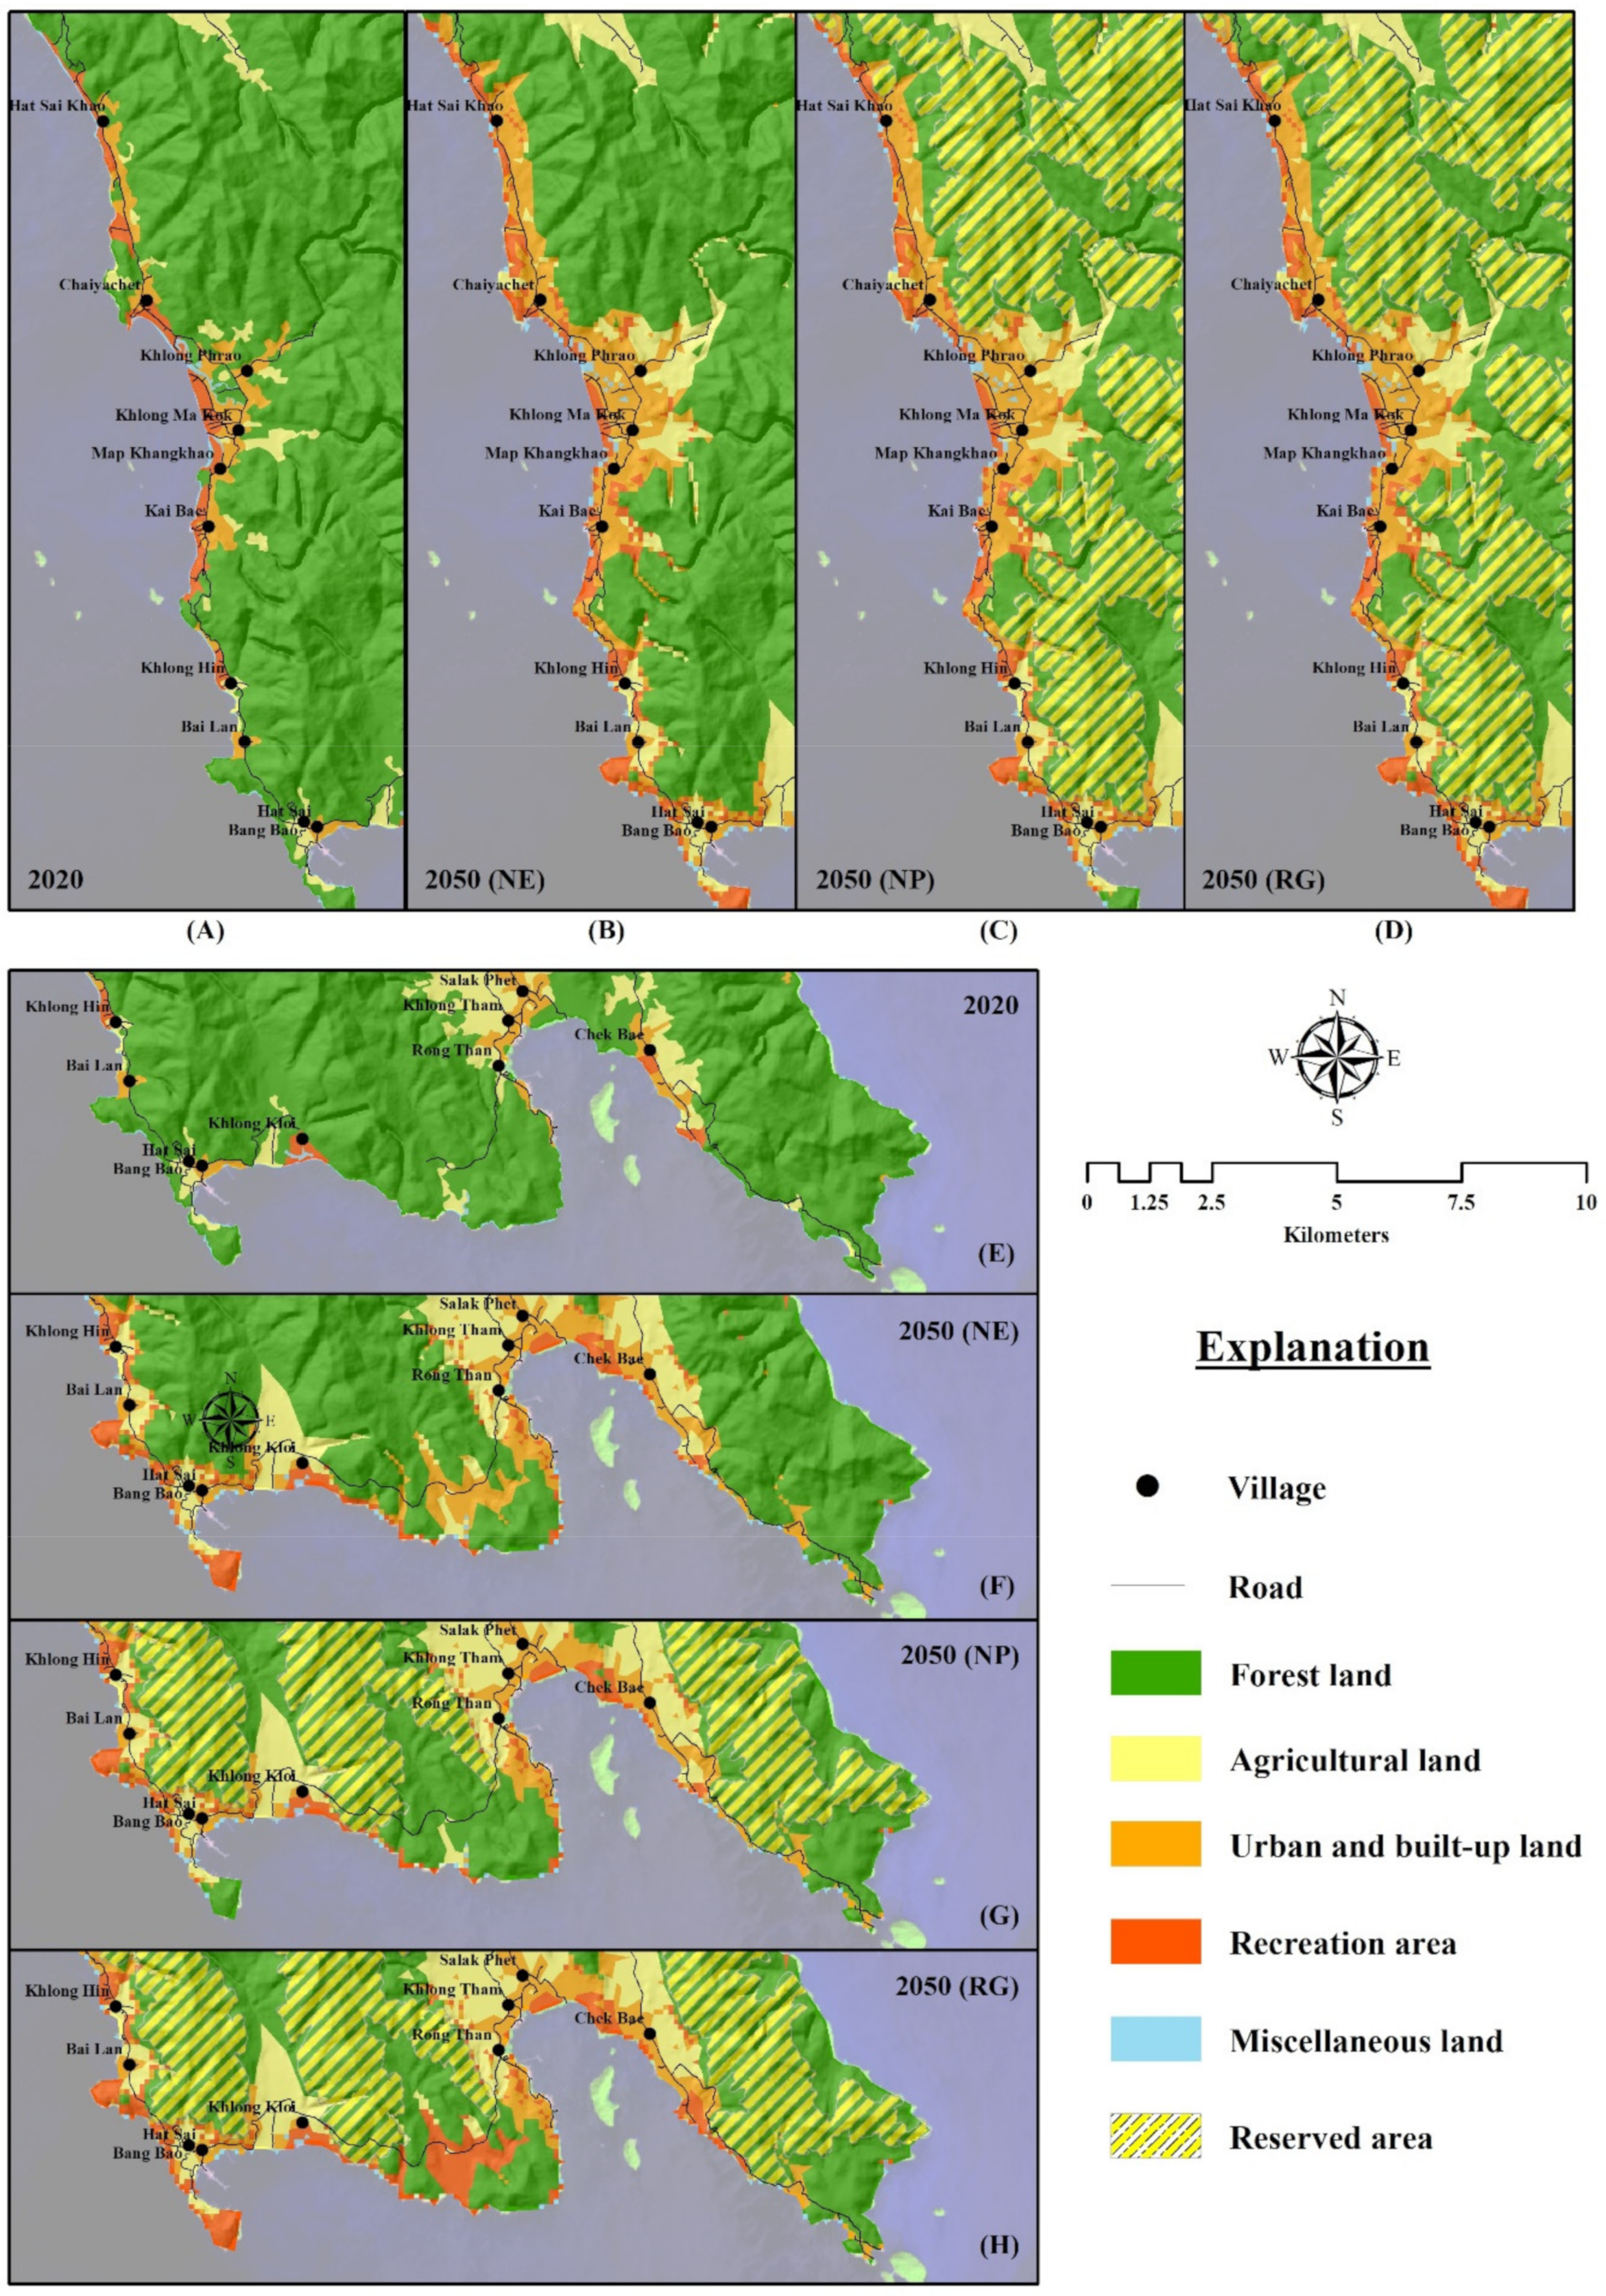
3.3. Simulation of LUC Patterns under Three Dynamic Scenarios in Koh Chang
3.3.1. Scenario-1 NE Scenario
3.3.2. Scenario-2 NP Scenario
3.3.3. Scenario-3 RG Scenario
4. Discussion
5. Conclusions
Supplementary Materials
Author Contributions
Funding
Institutional Review Board Statement
Informed Consent Statement
Data Availability Statement
Acknowledgments
Conflicts of Interest
References
- Bakr, N.; Weindorf, D.C.; Bahnassyb, M.H.; Mareib, S.M.; El-Badawi, M.M. Monitoring land cover changes in a newly reclaimedarea of Egypt using multi-temporal Landsat data. Appl. Geogr. 2010, 30, 592–605. [Google Scholar] [CrossRef]
- Orimoloye, I.R.; Ololade, O.O.; Mazinyo, S.P.; Kalumba, A.M.; Ekundayo, O.Y.; Busayo, E.T.; Nel, W. Spatial assessment of drought severity in Cape Town area, South Africa. Heliyon 2019, 5, e02148. [Google Scholar] [CrossRef]
- Lu, X.; Yao, S.; Fu, G.; Lv, X.; Mao, Y. Dynamic simulation test of a model of ecological system security for a coastal tourist city. J. Destin. Mark. Manag. 2019, 13, 73–82. [Google Scholar] [CrossRef]
- Hjalager, A. Land-use conflicts in coastal tourism and the quest for governance innovations. Land Use Policy 2020, 94, 104566. [Google Scholar] [CrossRef]
- Islam, K.; Jashimuddin, M.; Nath, B.; Kumar, T.N. Land use classification and change detection by using multi-temporal remotely sensed imagery: The case of Chunati wildlife sanctuary, Bangladesh. Egypt. J. Remote Sens. Space Sci. 2018, 21, 37–47. [Google Scholar] [CrossRef]
- Mark, M.; Oshneck, M.; Tatenda, M.; Rameck, D. A GIS and remote sensing aided assessment of land use/cover changes in resettlement areas; a case of ward 32 of Mazowe district, Zimbabwe. J. Environ. Manag. 2020, 276, 111312. [Google Scholar]
- Lambin, E.F.; Geist, H.J.; Lepers, E. Dynamics of land-use and land-cover change in tropical regions. Annu. Rev. Environ. Resour. 2003, 28, 205–241. [Google Scholar] [CrossRef]
- Bertolo, L.S.; Lima, G.T.N.P.; Santos, R.F. Identifying change trajectories and evolutive phases on coastal landscapes. Case study: São Sebastião Island, Brazil. Landsc. Urban Plan. 2012, 106, 115–123. [Google Scholar] [CrossRef]
- Shooshtari, S.J.; Silva, T.; Namin, B.R.; Shayesteh, K. Land Use and Cover Change Assessment and Dynamic Spatial Modeling in the Ghara-su Basin, Northeastern Iran. J. Indian Soc. Remote Sens. 2020, 48, 81–95. [Google Scholar] [CrossRef]
- Cerqua, A. The signalling effect of eco-labels in modern coastal tourism. J. Sustain. Tour. 2017, 25, 1159–1180. [Google Scholar] [CrossRef]
- Andersen, I.M.V.; Blichfeldt, B.S.; Liburd, J.J. Sustainability in coastal tourism development: An example from Denmark. Curr. Issues Tour. 2018, 21, 1329–1336. [Google Scholar] [CrossRef]
- Kityuttachai, K.; Tripathi, N.K.; Tipdecho, T.; Shrestha, R. CA-Markov Analysis of Constrained Coastal Urban Growth Modeling: Hua Hin Seaside City, Thailand. Sustainability 2013, 5, 1480–1500. [Google Scholar] [CrossRef]
- Gaughan, A.E.; Binford, M.W.; Southworth, J. Tourism, forest conversion, and land transformations in the Angkor basin, Cambodia. Appl. Geogr. 2009, 29, 212–223. [Google Scholar] [CrossRef]
- Dimobe, K.; Goetze, D.; Ouédraogo, A.; Forkuor, G.; Wala, K.; Porembski, S.; Thiombiano, A. Spatio-temporal dynamics in land use and habitat fragmentation within a protected area dedicated to tourism in a Sudanian savanna of West Africa. Landsc. Ecol. 2017, 10, 75–95. [Google Scholar] [CrossRef]
- Xi, J.C.; Zhao, M.F.; Wang, K. Land use evolution of growth tourism-town from 1986 to 2010: A case study of sanpo town in yesanpo tourism attraction in Hebei province. Geogr. Res. 2013, 32, 11–19. [Google Scholar]
- Verburg, P.H.; Overmars, K.P. Combining top-down and bottom-up dynamics in land use modeling: Exploring the future of abandoned farmlands in Europe with the Dyna-CLUE model. Landsc. Ecol. 2009, 24, 1167–1181. [Google Scholar] [CrossRef]
- Verburg, P.H.; Soepboer, W.; Veldkamp, A. Modeling the spatial dynamics of regional land use: The CLUE-S model. Environ. Manag. 2002, 3, 391–405. [Google Scholar] [CrossRef]
- Verburg, P.H.; Overmars, K.P.; Witte, N. Accessibility and land-use patterns at the forest fringe in the northeastern part of the Philippines. Geogr. J. 2004, 170, 238–255. [Google Scholar] [CrossRef]
- Verburg, P.; Overmars, K. Dynamic Simulation of Land-Use Change Trajectories with the Clue-S Model. In Modelling Land-Use Change; Koomen, E., Stillwell, J., Bakema, A., Scholten, H.J., Eds.; The GeoJournal Library: Dordrecht, The Netherlands; Springer: Dordrecht, The Netherlands, 2007; Volume 90, pp. 321–337. [Google Scholar]
- Price, B.; Kienast, F.; Seidl, I.; Ginzler, C.; Verburg, P.H.; Bolliger, J. Future landscapes of Switzerland: Risk areas for urbanisation and land abandonment. Appl. Geogr. 2015, 57, 32–41. [Google Scholar] [CrossRef]
- Das, P.; Behera, M.D.; Pal, S.; Chowdary, V.M.; Behera, P.R.; Singh, T.P. Studying land use dynamics using decadal satellite images and Dyna-CLUE model in the Mahanadi River basin, India. Environ. Monit. Assess. 2019, 191, 804. [Google Scholar] [CrossRef]
- Waiyasusri, K.; Wetchayont, P. Assessing Long-Term Deforestation in Nam San Watershed, Loei Province, Thailand Using A Dyna-Clue Model. Geogr. Environ. Sustain. 2020, 13, 81–97. [Google Scholar] [CrossRef]
- Adhikari, R.K.; Mohanasundaram, S.; Shrestha, S. Impacts of land-use changes on the groundwater recharge in the Ho Chi Minh city, Vietnam. Environ. Res. 2020, 185, 109440. [Google Scholar] [CrossRef]
- Khoi, D.N.; Loi, P.T.; Sam, T.T. Impact of Future Land-Use/Cover Change on Streamflow and Sediment Load in the Be River Basin, Vietnam. Water 2021, 13, 1244. [Google Scholar] [CrossRef]
- Srinonil, S.; Nittivattananon, V.; Noithammaraj, P.; Nitisoravut, R. Tourism Governance for Coastal Urbanization and Environment with Changing Climate on Koh Chang Island, Thailand. GMSARN Int. J. 2020, 14, 82–88. [Google Scholar]
- Ministry of Tourism and Sports (MOTS). The Second National Tourism Development Plan, 2017–2021; MOTS: Bangkok, Thailand, 2017.
- Lunn, K.E.; Dearden, P. Fishers’ Needs in Marine Protected Area Zoning: A Case Study from Thailand. Coast. Manag. 2006, 34, 183–198. [Google Scholar] [CrossRef]
- Tourism Authority of Thailand. Koh Chang. Available online: https://www.tourismthailand.org/Destinations/Provinces/ko-chang/467 (accessed on 8 August 2021).
- Nitivattananon, V.; Srinonil, S. Enhancing coastal areas governance for sustainable tourism in the context of urbanization and climate change in eastern Thailand. Adv. Clim. Chang. Res. 2019, 10, 47–58. [Google Scholar] [CrossRef]
- National Statistical Office of Thailand, Tourism and Sports Statistics. Available online: http://statbbi.nso.go.th/staticreport/page/sector/en/17.aspx (accessed on 8 August 2021).
- Department of Economic and Social Affairs. Sustainable Development, Goals 8 Promote Sustained, Inclusive and Sustainable Economic Growth, Full and Productive Employment and Decent Work for All. Available online: https://sdgs.un.org/topics/sustainable-tourism (accessed on 9 August 2021).
- Department of Economic and Social Affairs. Sustainable Development, Goals 14 Conserve and Sustainably Use the Oceans, Seas and Marine Resources for Sustainable Development. Available online: https://sdgs.un.org/topics/oceans-and-seas (accessed on 9 August 2021).
- Pumijumnong, N.; Payomrat, P. The Effective Ecological Factors and Vegetation at Koh Chang Island, Trat Province, Thailand. Open J. For. 2013, 3, 41–48. [Google Scholar] [CrossRef][Green Version]
- Englong, A.; Punwong, P.; Selby, K.; Marchant, R.; Traiperm, P.; Pumijumnong, N. Mangrove dynamics and environmental changes on Koh Chang, Thailand during the last millennium. Quat. Int. 2019, 500, 128–138. [Google Scholar] [CrossRef]
- Bissen, R.; Chawchai, S. Microplastics on beaches along the eastern Gulf of Thailand—A preliminary study. Mar. Pollut. Bull. 2020, 157, 111345. [Google Scholar] [CrossRef] [PubMed]
- United States Geological Survey, Landsat 8. Available online: https://www.usgs.gov/core-science-systems/nli/landsat/landsat-8?qt-science_support_page_related_con=0#qt-science_support_page_related_con (accessed on 11 August 2021).
- Kiefer, R.W.; Lillesand, T.M.; Chipman, J. Remote Sensing and Image Interpretation, 7th ed.; Wiley: New York, NY, USA, 2015; p. 736. [Google Scholar]
- Forkuor, G.; Dimobe, K.; Serme, I.; Tondoh, J.E. Landsat-8 vs. Sentinel-2: Examining the added value of sentinel-2′s red-edge bands to land-use and land-cover mapping in Burkina Faso. GISci. Remote Sens. 2018, 55, 331–354. [Google Scholar] [CrossRef]
- Egorov, A.V.; Hansen, M.C.; Roy, D.P.; Kommareddy, A.; Potapov, P.V. Image interpretation-guided supervised classification using nested segmentation. Remote Sens. Environ. 2015, 165, 135–147. [Google Scholar] [CrossRef]
- Guan, D.; Li, H.; Inohae, T.; Su, W.; Nagaie, T.; Hokao, K. Modeling urban land use change by the integration of cellular automaton and Markov model. Ecol. Model. 2011, 222, 3761–3772. [Google Scholar] [CrossRef]
- Muller, M.R.; Middleton, J. A Markov model of land-use change dynamics in the Niagara, Ontario, Canada. Landsc. Ecol. 1994, 9, 151–157. [Google Scholar]
- Wang, S.Y.; Liu, J.S.; Ma, T.B. Dynamics and changes in spatial patterns of land use in Yellow River Basin, China. Land Use Policy 2010, 27, 313–323. [Google Scholar] [CrossRef]
- Achmad, A.; Hasyim, S.; Dahlan, B.; Aulia, D.N. Modeling of urban growth in tsunami-prone city using logistic regression: Analysis of Banda Aceh, Indonesia. Appl. Geogr. 2015, 62, 237–246. [Google Scholar] [CrossRef]
- Lang, Y.; Song, W.; Zhang, Y. Responses of the water-yield ecosystem service to climate and land use change in Sancha River Basin, China. Phys. Chem. Earth 2017, 101, 102–111. [Google Scholar] [CrossRef]
- Schneider, L.C.; Pontius, R.G. Modeling land-use change in the Ipswich watershed, Massachusetts, USA. Agric. Ecosyst. Environ. 2001, 85, 83–94. [Google Scholar] [CrossRef]
- The National Economic and Social Development Board, Office of The Prime Minister of Thailand. The National Economic and Social Development Plan. Available online: https://www.nesdc.go.th/nesdb_en/ewt_w3c/ewt_dl_link.php?filename=develop_issue&nid=3782 (accessed on 20 August 2021).
- Martins, V.N.; Pires, R.; Cabral, P. Modelling of coastal vulnerability in the stretch between the beaches of Porto de Mós and Falésia, Algarve (Portugal). J. Coast. Conserv. 2012, 16, 503–510. [Google Scholar] [CrossRef]
- Robert, S.; Fox, D.; Boulay, G.; Grandclément, A.; Garrido, M.; Pasqualini, V.; Prévost, A.; Schleyer-Lindenmann, A.; Trémélo, M. A framework to analyse urban sprawl in the French Mediterranean coastal zone. Reg. Environ. Chang. 2019, 19, 559–572. [Google Scholar] [CrossRef]
- Moschetto, F.A.; Ribeiro, R.B.; De Freitas, D.M. Urban expansion, regeneration and socioenvironmental vulnerability in a mangrove ecosystem at the southeast coastal of São Paulo, Brazil. Ocean Coast. Manag. 2021, 200, 105418. [Google Scholar] [CrossRef]
- Waiyasusri, K.; Kulpanich, N.; Worachairungreung, M.; Sae-ngow, P.; Chaysmithikul, P. Flood Prone Risk area Analysis during 2005–2019 in Lam Se Bok Watershed, Ubon Ratchathani Province, Thailand. Geogr. Tech. 2021, 16, 141–153. [Google Scholar] [CrossRef]
- Lu, D.; Li, L.; Li, G.; Fan, P.; Ouyang, Z.; Moran, E. Examining Spatial Patterns of Urban Distribution and Impacts of Physical Conditions on Urbanization in Coastal and Inland Metropoles. Remote Sens. 2018, 10, 1101. [Google Scholar] [CrossRef]
- Bao, G.Y.; Huang, H.; Gao, Y.N.; Wang, D.B. Study on driving mechanisms of land use change in coastal area of Jiangsu, China. J. Coast. Res. 2017, 79, 104–108. [Google Scholar] [CrossRef]
- Amézquita-López, J.; Valdés-Atencio, J.; Angulo-García, D. Understanding Traffic Congestion via Network Analysis, Agent Modeling, and the Trajectory of Urban Expansion: A Coastal City Case. Infrastructures 2021, 6, 85. [Google Scholar] [CrossRef]
- Rimal, B.; Zhang, L.; Keshtkar, H.; Haack, B.N.; Rijal, S.; Zhang, P. Land Use/Land Cover Dynamics and Modeling of Urban Land Expansion by the Integration of Cellular Automata and Markov Chain. ISPRS Int. J. Geo-Inf. 2018, 7, 154. [Google Scholar] [CrossRef]
- Li, H.; Song, W. Pattern of spatial evolution of rural settlements in the Jizhou District of China during 1962–2030. Appl. Geogr. 2020, 122, 102247. [Google Scholar] [CrossRef]
- Aguilera, M.A.; Tapia, J.; Gallardo, C.; Núñez, P.; Varas-Belemmi, K. Loss of coastal ecosystem spatial connectivity and services by urbanization: Natural-to-urban integration for bay management. J. Environ. Manag. 2020, 276, 111297. [Google Scholar] [CrossRef]
- Nguyen, H.A.T.; Sophea, T.; Gheewala, S.H.; Rattanakom, R.; Areerob, T.; Prueksakorn, K. Integrating remote sensing and machine learning into environmental monitoring and assessment of land use change. Sustain. Prod. Consum. 2021, 27, 1239–1254. [Google Scholar] [CrossRef]


| Image Type | Path/Row | Band (R:G:B) 1 | Acquisition Date | Original | ||
|---|---|---|---|---|---|---|
| Format | Resolution | Source 2 | ||||
| Landsat-5TM | 128/52 | 5:4:3 | 26-Dec-1990 | TIFF | 30 m | USGS |
| Landsat-5TM | 128/52 | 5:4:3 | 1-Nov-2005 | TIFF | 30 m | USGS |
| Landsat-8OLI | 128/52 | 6:5:4 | 26-Nov-2020 | TIFF | 30 m | USGS |
| Driving Factors | Variable (Theme) | Year | Data Preparation Methodology | Sources |
|---|---|---|---|---|
| Physical Factors | Elevation | 2017 | Topo to raster on spatial analyst | Royal Thai Survey Department (RTSD) topographic map sheet series L7018 |
| Slope | 2017 | Slope on spatial analyst | Derived from the Elevation | |
| Distance to coastline | 2017 | Obtained from Euclidean distance analysis on ArcGIS Spatial Analyst extension | Department of Water Resource, Thailand | |
| Distance to stream | 2017 | Obtained from Euclidean distance analysis on ArcGIS Spatial Analyst extension | Department of Water Resource, Thailand | |
| Socio-economic factors | Distance to road | 2020 | Obtained from Euclidean distance analysis on ArcGIS Spatial Analyst extension | Department of Public Works and Town & Country Planning |
| Distance to village | 2020 | Obtained from Euclidean distance analysis on ArcGIS Spatial Analyst extension | Royal Thai Survey Department (RTSD) | |
| Population density | 1990–2021 | Interpolated grid theme contains a Kernel density from the population on spatial analyst | National Statistical Office of Thailand | |
| Other | Reserved area | 2007 | Department of Water Resource, Thailand |
| Area (km2) | Area Change (km2) | % Land Area | % Land Area Change | |||||||||
|---|---|---|---|---|---|---|---|---|---|---|---|---|
| Land-Use Class 1 | 1990 | 2005 | 2020 | 1990 to 2005 | 2005 to 2020 | 1990 to 2020 | 1990 | 2005 | 2020 | 1990–2005 | 2005–2020 | 1990–2020 |
| F | 184.83 | 178.68 | 178.71 | −6.15 | 0.03 | −6.12 | 87.56 | 84.64 | 84.66 | −3.33 | 0.02 | −3.31 |
| A | 24.06 | 23.31 | 19.61 | −0.75 | −3.70 | −4.45 | 11.40 | 11.04 | 9.29 | −3.12 | −15.87 | −18.50 |
| U | 1.46 | 6.76 | 8.57 | 5.30 | 1.81 | 7.11 | 0.69 | 3.20 | 4.06 | 363.01 | 26.78 | 486.99 |
| R | 0.09 | 0.61 | 2.74 | 0.52 | 2.13 | 2.65 | 0.04 | 0.29 | 1.30 | 577.78 | 349.18 | 2944.44 |
| M | 0.66 | 1.74 | 1.47 | 1.08 | −0.27 | 0.81 | 0.31 | 0.82 | 0.70 | 163.64 | −15.52 | 122.73 |
| Total | 211.10 | 211.10 | 211.10 | 100.00 | 100.00 | 100.00 | ||||||
| LUC 1 | 2020 | Changing Area | |||||||
|---|---|---|---|---|---|---|---|---|---|
| F | A | U | R | M | Total | km2 | % | ||
| 1990 | F | 171.05 | 9.09 | 2.63 | 1.12 | 0.94 | 184.83 | −6.19 | −3.35 |
| A | 7.18 | 10.30 | 5.01 | 1.31 | 0.26 | 24.06 | −4.45 | −18.50 | |
| U | 0.27 | 0.19 | 0.87 | 0.08 | 0.05 | 1.46 | 7.11 | 486.99 | |
| R | 0.01 | 0.00 | 0.01 | 0.06 | 0.01 | 0.09 | 2.65 | 2944.44 | |
| M | 0.20 | 0.03 | 0.05 | 0.17 | 0.21 | 0.66 | 0.88 | 133.33 | |
| Total | 178.71 | 19.61 | 8.57 | 2.74 | 1.47 | 0.00 | |||
| Land-Use | Forest Land | Agricultural Land | Urban and Built-Up Land | Recreation Area | Miscellaneous Land | |||||
|---|---|---|---|---|---|---|---|---|---|---|
| Variable’s Theme | β | Exp (β) | β | Exp (β) | β | Exp (β) | β | Exp (β) | β | Exp (β) |
| Elevation | 0.033 | 1.034 | −0.020 | 0.980 | −0.029 | 0.971 | −0.027 | 0.973 | −0.064 | 0.938 |
| Slope | 0.042 | 1.043 | - | - | −0.053 | 0.949 | - | - | - | - |
| Distance to coastline | 0.001 | 1.001 | 0.001 | 1.001 | - | - | −0.007 | 0.993 | −0.008 | 0.992 |
| Distance to stream | - | - | - | - | - | - | - | - | 0.001 | 1.001 |
| Distance to road | 0.005 | 1.005 | −0.001 | 0.999 | −0.002 | 0.998 | - | - | - | - |
| Distance to village | 0.001 | 1.001 | −0.001 | 0.999 | - | - | - | - | - | - |
| Population density | - | - | −0.665 | 0.514 | 0.306 | 1.358 | 0.700 | 2.014 | - | - |
| Constant | −3.828 | 1.874 | −0.483 | −1.870 | −0.264 | |||||
| ROC value | 0.957 | 0.882 | 0.900 | 0.959 | 0.949 | |||||
| Scenarios | Forest Land (F) | Agricultural Land (A) | Urban and Built-Up Land (U) | Recreation Area (R) | Miscellaneous Land (M) |
|---|---|---|---|---|---|
| Natural Evolution scenario (NE) | 147.08 | 31.37 | 21.13 | 10.13 | 1.39 |
| Reserved area Protection scenario (NP) | 151.71 | 30.94 | 18.87 | 8.38 | 1.20 |
| Recreation area Growth scenario (RG) | 147.08 | 30.89 | 19.24 | 12.63 | 1.26 |
Publisher’s Note: MDPI stays neutral with regard to jurisdictional claims in published maps and institutional affiliations. |
© 2022 by the authors. Licensee MDPI, Basel, Switzerland. This article is an open access article distributed under the terms and conditions of the Creative Commons Attribution (CC BY) license (https://creativecommons.org/licenses/by/4.0/).
Share and Cite
Waiyasusri, K.; Chotpantarat, S. Spatial Evolution of Coastal Tourist City Using the Dyna-CLUE Model in Koh Chang of Thailand during 1990–2050. ISPRS Int. J. Geo-Inf. 2022, 11, 49. https://doi.org/10.3390/ijgi11010049
Waiyasusri K, Chotpantarat S. Spatial Evolution of Coastal Tourist City Using the Dyna-CLUE Model in Koh Chang of Thailand during 1990–2050. ISPRS International Journal of Geo-Information. 2022; 11(1):49. https://doi.org/10.3390/ijgi11010049
Chicago/Turabian StyleWaiyasusri, Katawut, and Srilert Chotpantarat. 2022. "Spatial Evolution of Coastal Tourist City Using the Dyna-CLUE Model in Koh Chang of Thailand during 1990–2050" ISPRS International Journal of Geo-Information 11, no. 1: 49. https://doi.org/10.3390/ijgi11010049
APA StyleWaiyasusri, K., & Chotpantarat, S. (2022). Spatial Evolution of Coastal Tourist City Using the Dyna-CLUE Model in Koh Chang of Thailand during 1990–2050. ISPRS International Journal of Geo-Information, 11(1), 49. https://doi.org/10.3390/ijgi11010049