1. Introduction
The broad possibilities and limitations of geospatial analysis using GIS in educational research have been pointed out by many authors, especially in areas such as school choice or inequality of educational opportunities [
1,
2].
All instances of human mobility have temporal and spatial attributes [
3,
4]; for example, depending on the purpose of a trip, one’s place of residence may affect the selection of one’s destination [
5], including school trips. Research on education in conjunction with mobility has focused on finding links between the duration of education and mobility of the workforce, e.g., [
6], education and wages for women and men [
7], unemployment, poverty and location of places of residence [
8,
9], globalisation in education [
10], and the impact of the location of schools on the limited possibilities of using them by certain social groups [
11]. These all share a less geographical and more economic aspect. Social research has addressed, among others, the issues of mobility and human activity based on data collected on social media [
12], the impact of geographical distance changes caused by life events on the frequency of social interactions [
13], and the issue of the quality of geographical space around schools in relation to social justice [
14].
Education is a stage in the life cycle of a person that impacts their subsequent functioning in society. At an early stage of education, the choice of school is usually made by parents or guardians [
15], but over time young people have an increasing influence on the choice and location of their schools. The demand and supply of spots at reputable schools are not balanced. This is linked to the interests and intellectual capacity of young people, but also to the financial situation of their families, especially in higher education, e.g., university. The distance between successive schools is increasing, especially among young people living outside of academic centers. This increases the mobility of young people in terms of travelling from home to school, or the need to rent accommodation for the duration of their studies. There may be regional conditions for school selection and mobility in different countries, but the path itself is similar; one school must be completed in order to sign up for another. This has been dubbed a geographical educational path.
The geographical educational path refers to the collection of successively completed schools and links between them, during the period of education, taking into account the type of school and its geographical location. Depending on the number of schools, the path may vary in length and number of items. It consists of school address points and lines connecting successive schools (simply or by using transport networks), and may optionally include point or line attributes. It can be specified as:
where GEP refers to Geographical Educational Path; S
n is the address point of the school n (POIn); L
n−1,n represents line connecting points S
n−1 and S
n; A
mS
n refers to school attributes; A
rL
n−1,n refers to line attributes; n is the number of schools completed; m is the number of school attributes, and r is the number of line attributes.
In this paper, the author provides a new idea for the investigation of geographical educational paths with GIS and spatial statistics.
The overall aim of the study is to propose research on the geographical educational path. For this purpose:
They answered the following questions:
Where did the surveyed students come from?
Did they change their place of residence during the studies?
How long and by what means of transport did they travel to the University?
Where were their schools located before starting their studies?
What was their geographical educational path from the beginning of their studies?
This work is the first attempt to answer the question about the entire geographical educational path. In addition, the research allows us to determine the mobility of young people during education, as well as the range of influence of one of the faculties at the University of Lodz.
Lodz has a population of 700,000 and is the third-largest city in Poland. Young people in Poland have the possibility to study at 19 universities. The biggest of them include: the University of Lodz; Lodz University of Technology; Medical University; the Grażyna and Kiejstut Bacewicz Academy of Music; the Strzeminski Academy of Fine Arts; and the Polish National Film, Television and Theatre School.
The study of the geographical educational path was carried out among students of geoinformation, studying at the Faculty of Geographical Sciences at the University of Lodz (Poland) in the academic year 2016/2017. That year, the total number of geoinformation students in bachelor and master programmes was 151 (70 + 81). There were no large gender differences between the different years, with the share of women ranging from 41.77% to 58.6%. These students were born between 1989 and 1997, i.e., they were between the ages of 20 and 28.
The geographical educational path of the students examined in the first cycle consisted of at least three schools: primary, middle and secondary (high school/technical college). In the case of second cycle students, they had to have completed at least four stages of study.
2. Materials and Methods
A geographical educational path may be studied at any time during the life of a selected person, and during any stage of their education. It should be kept in mind that the education cycle may vary from country to country, and that it can undergo reforms within a single country. In Poland, between 1999 and 2016, the following order of education was in place: pre-primary education (only mandatory for 6-year-olds); primary education—six years; junior high school (middle school)—three years. For secondary schools: high school (three years) or technical college (four years). In their last year of education, the students take a compulsory exam, which verifies the skills obtained during their education [
16]. Higher education is carried out in accordance with the Bologna Declaration [
17] in a three-cycle system of bachelor–master–doctorate, (bachelor 3–3.5 years; master 1.5–2 years; doctorate 4 years). Specific study fields like medicine or law have master’s cycles of 5 years [
18].
2.1. Methodology
The study methodology covered issues related to the use of GIS to carry out the research project. It was decided that the entire research process would be carried out using GIS tools. This involved planning and using the relevant data, pre-processing, creating databases, and selecting relevant statistics and visualisation methods (
Figure 1).
2.2. Data Source
Data from external sources were collected for the study, namely:
Data was then obtained directly from the students of the selected major. One of three options was considered to obtain data: email survey, personal interview and telephone interview [
19]. Email survey was selected. The advantage of this type of survey is, above all, an easy access to the target group. The survey was sent by email to all students of geoinformation via the USOS university platform. This method of research generated low costs, access to the whole population, and anonymity, which is an important aspect for respondents. In addition, it gave them time to reflect on the correct answers, or check the answers in appropriate sources (e.g., questions concerning school addresses). However, its main disadvantage is usually a low percentage of responses and a lack of control over their answers. A number of 89 students responded to the survey questions, but 84 of them were complete and accepted for research, representing more than 55% of the total population. It can be assumed that the results obtained on this basis will be representative, as more than 50% of the population (
Table 1) was surveyed for each year.
The survey was created using Google Docs Forms. It was divided into three parts. The first part included questions concerning basic student information, demographic data (gender, year of birth, year of study), and the completed undergraduate studies by masters students (major and school). The second part covered the address of permanent residence and possible temporary residence for the duration of the study (voivodeship, postal code, town, street, optional block/house number). Students were also asked about the time it takes them to get to the university and their most frequently chosen means of transport. The third part concerned information relating to their educational path and completed schools: primary, middle and secondary (either high school or technical college). The answers to the individual questions were available in a .xlsx spreadsheet, with one row corresponding to one respondent and columns representing the survey questions. Survey data are reliable. The survey was completed by 55% of all students. Their structure by gender and place of residence reflects the structure of the total population.
2.3. Data Pre-Processing
The data obtained had to be adequately prepared. In the pre-processing, it was verified that all respondents answered each of the questions, i.e., that the surveys were complete. It was found that five people filled them out improperly, with missing answers, so they were discarded. Ultimately, eighty-four correctly completed questionnaires were used in the research. Geographical names were then checked. Here, there was also some carelessness in filling out town names, which was corrected manually, most often concerning the city of Łódź, spelled in various forms: Łodz, Lodz, Łódz, Łodź. The ambiguity of geographical names occurred when there were several towns in Poland with the same name, e.g., Moszczenica, and Zawada. The name of voivodeship and postal code were used to determine the correct location. Address data in .xlsx format was then geocoded using the Open Street Map address database. World Geodetic System ‘84 coordinate system was selected. This feature creates point shapefiles with new attributes. The address details of students from the Dean’s office of the Faculty of Geographical Sciences was submitted to the same procedure.
2.4. Analysis Methods
Cartographic methods were used to visualise student residence results, including point signatures, and circular and vector cartodiagrams. Simple descriptive statistics such as minimum, maximum, arithmetic mean, and standard deviation were calculated. It has been found that centrographic measures, centroid and standard deviation ellipse, serve well in the analysis of distribution of address points (POI) [
20]. This basic spatial “centrographic” statistic has been debated, and has developed over the past 90 years [
21,
22,
23]. Calculations were performed in geographic space (in the geographic coordinate system GCS_WGS_1984).
The time it took students to reach the university was presented using network analysis (Network Analyst available in ArcGIS), for which the address points and the road class of objects were required. The mode of transport declared by the respondents in the survey is shown in the graph.
3. Results
3.1. The Spatial Extent of the Origins of the Students
At the beginning, the spatial distribution of the places of residence of all students of geoinformation (151), and those who took part in the survey (83), was compared.
The spatial distribution of the places of residence of all 151 students (
Figure 2A,B) made it clear that more than 75% of came from Łódź voivodeship, in whose capital the University of Lodz is located. The remaining students came from neighbouring voivodeships, with only a few from places more than 200 km away from the university. This means that there were just a handful of people who demonstrated greater mobility, and have come to study from further regions of Poland, with most of them coming from the immediate vicinity of Łódź. This was also demonstrated by the size and shape of the standard deviation ellipse, which covered the area of Łódź voivodeship and only slightly covered the south-west of the neighbouring Masovian voivodeship (
Figure 2A).
The place of residence of students obtained from surveys (approx. 55% of the population) was almost identical to that obtained from the university (
Figure 2C,D), the sample showing a 10% surplus of the inhabitants of Łódź voivodeship, relative to the population as a whole. It was assumed that it was possible to make valid conclusions from the sample used. In a straight line, the furthest address point was located in Suwałki, almost 350 km north-east of the Faculty of Geographical Sciences, while the nearest was 0.2 km.
Of the surveyed students, 38.6% temporarily changed their residence (
Figure 3). The remaining 61.4% did not move during their studies, of which 28.4% lived in Łódź and 33% commuted to the university from outside of the city.
The most distant points of interest for students commuting almost daily were in villages located 83 km north and 81 km west of the faculty buildings (road distance). It is worth noting, however, that the distance of students’ residence from the university was not always proportional to the time they needed to get there—their means of transport is also important. Often, people who live further need less time when travelling by car than those who live closer but use public transport. The buildings of the Faculty of Geographical Sciences are located on national road no. 14, and are quite well connected to the surrounding towns.
The time it took to reach the university indicated in the answers ranged from 10 to 120 min, with most students needing no more than 30 min to get there. A large group of 23% declared that it took them more than one hour, whereas two commuted for two hours. A network layer provided as a service by the ArcGIS Online portal was used to analyze the distance along the transportation network, as well as the travel time of students to the buildings of the Faculty of Geographical Sciences. The layer was based on data provided by external providers (e.g., Here) and allowed the calculation of travel time, taking into account date, time of arrival and congestion. To account for morning traffic congestion, it was assumed that students would arrive for class on Wednesday, 6 October 2021 at 8 a.m.
The thresholds of 15 min were set. This is the basis for the division of road distance ranges used for visualisation (
Figure 4). Each address point had an attribute of average travel time [min] to the faculty, and road sections had an attribute assigned with the distance from the faculty [km]. According to the results obtained, the average travel time to the faculty was approximately 21 min, the shortest time was 0.5 min, and the longest was 84 min, from the village of Kowiesy where one student lived.
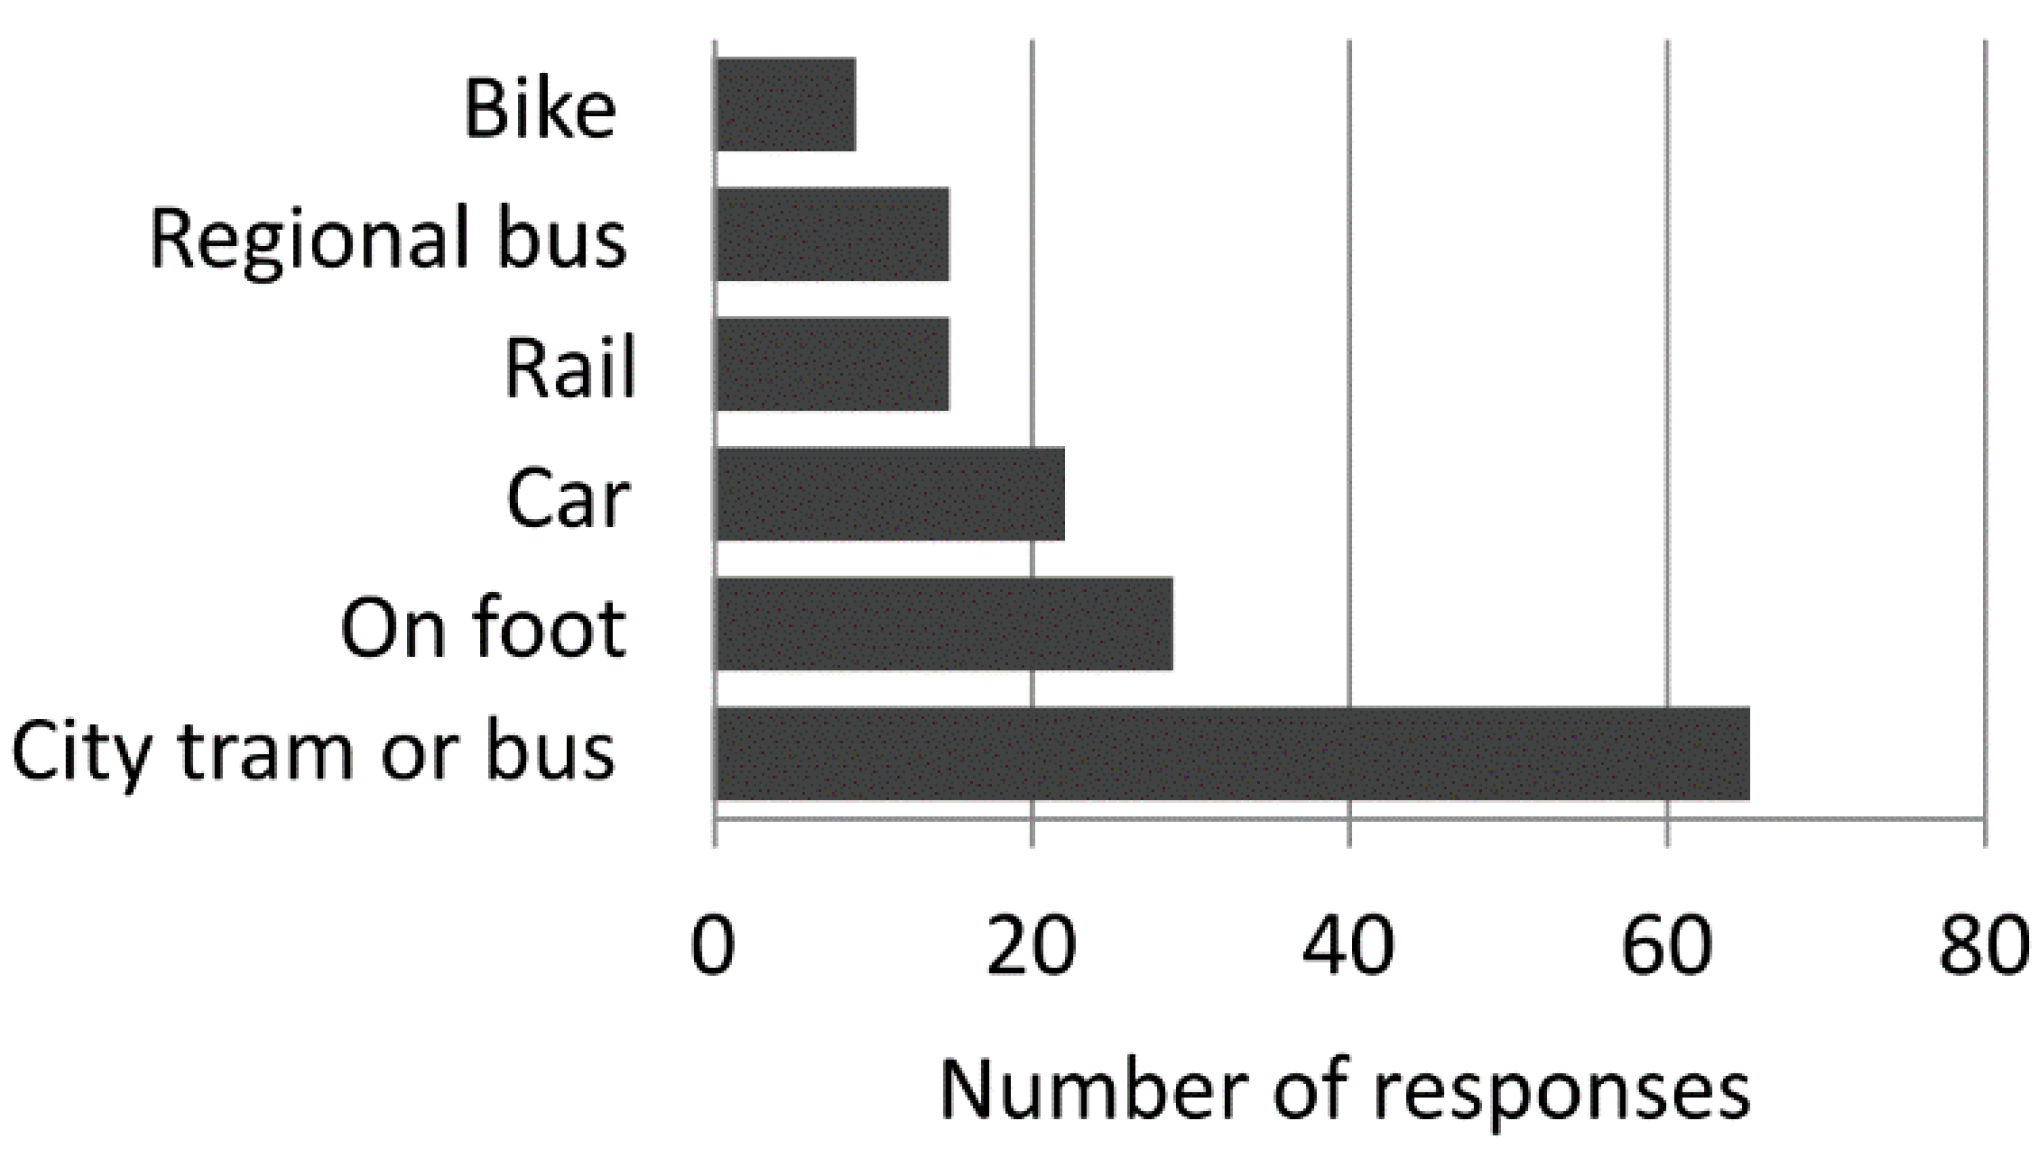
In the question on the modes of transport that geoinformation students used most frequently, no more than three variants could be chosen, as an assumption was made that there was a choice of modes of transport (tram or bus) and an ability to switch, e.g., from train to city bike or tram. The following types of transport could be indicated: walking, cycling, car, urban tram or bus, rail, bus or suburban bus, or other. The vast majority of the 73.9% surveyed chose urban tram or bus as their main mode of transport (
Figure 5); one third of the students also walked, but a small group used a bicycle (10%), which was surprising as there is a public bike system in the city, so there is no need to use one’s own means of transport. There is also bicycle parking at the faculty, but it is underutilised. Commuters from further distances identified the train (15%), bus or suburban bus (14%) and passenger car (25%) as their preferred means of transport.
3.2. Geographical Educational Path of Students Being Studied
At this point in the study, the origin of the students and their temporary migrations undertaken for educational purposes, and their daily migrations to reach the Faculty of Geographical Sciences, were already known.
The next part of the study concerned the entire geographical educational path of the students. An analysis of the address points of schools indicated by the respondents showed that they attended schools located near their homes (
Figure 6). In 12 years of education, only a few moved to other cities, and one person completed primary school and secondary school in Greece.
These conclusions confirm the size and distribution of standard deviation ellipses calculated and drawn for each level of education (excluding the student educated in Greece), which almost overlap, with the centroid within the limits of Łódź (
Figure 7). This may mean that neither students nor their parents have shown any greater mobility during 12 years of study.
The final stage of the study involved a search for the answer to the research question: what was the mobility and geographical learning path of students, expressed as the distance in a straight line [km] between their learning stages?
To complete this, the school’s address points were connected with lines (
Figure 8), basic statistics were calculated (
Table 2), and visualisation was performed. The smallest differences in distance occurred when changing from primary school to middle school, which may be due to the fact that the middle school was located in the same building or near the primary school. Only one person changed their place of residence and study by more than 100 km during this period. The completion of middle school was mandatory for young Poles, whereas further education was voluntary. In Poland, there are fewer secondary schools than middle schools, and they are located in towns with more residents and administrative functions. The students selected secondary schools in close proximity to their places of residence, and one student moved from Athens (Greece) to Łódź (more than 1500 km). This may have affected the results of statistics sensitive to outlier values, and it has therefore not been included in the calculations. Almost everyone completed public school, with only a handful educated in Catholic schools. High schools dominated among the students, with seven people completing the geodesic technical school.
Students of geoinformation had to take the longest route at the last stage of their education, though this mobility was not huge and can be considered regional, as most people come from the Łódź voivodeship (
Figure 8), and only a few came from the rest of Poland.
Around half of respondents studied Level II geoinformation. All of them were graduates of Level I studies at the University of Łódź, thus showing no mobility in the period when they were aged 21–25 and able to make such decisions on their own.
What were the motivations of the students when they chose their nearest academic centre? This question could only be answered by a deeper study. It can be assumed that, not unlike Sweden, the role of geographic variables was significant in individual decisions concerning higher education. In particular, the educational achievements and proximity of universities seem to have a tangible impact on individual decisions. These effects may be linked to the role of neighbourhood peers, labour market demand and the costs of attending studies [
24].
4. Discussion
The results obtained may be relevant to the “spatial turn” in the social sciences (including education) and the contribution of the discipline of geography to the field of education [
25].
This paper defines a geographical educational path and proposes a method for examining it with GIS and spatial statistics. The geographical educational path can be explored among different social groups at any stage of their education, as well as after graduation. Comparative research across different countries and education systems may bring interesting results. The results may depend on the economic level of the country or region, population density, settlement networks and school networks. It may be interesting to use it in social research covering different social classes. The concept of a geographic education path had more impact in the pre-pandemic world, but the pandemic does not undermine the methodology proposed in this article.
One social group of students of geoinformation at the Faculty of Geographical Sciences at the University of Lodz was selected for research. Their educational path was typical for young people studying in Poland, and the geographical educational path showed that most of them attended schools near their places of residence and decided to select the nearest university. The results of the study showed low mobility of students and, indirectly, their families, during the period of education.
Issues of mobility during education may also have an economic aspect, such as the cost of education and the cost of living (in Łódź, these are lower than in Warsaw, located 100 km to the east), as well as the opportunities to find a job during their education (this may be the opposite).
The entire research procedure was carried out in GIS (
Figure 1). It has been described step by step and can be used in comparison studies. It uses databases from external sources such as: the University of Lodz, geodesic data and OSM, as well as data from qualitative studies. Pre-processing and connecting the data in a geodatabase were one of the key issues of the research task. The visualization methods used seem appropriate as they provided answers to the research questions. With more data and attributes, the project may be expanded.
The results of a geographical educational path study may be used for a thorough study of spatial mobility in terms of daily, temporary and permanent movement. Another issue related to mobility in the course of education may be related to the choice of places of temporary residence during one’s studies, in combination with the problems of gentrification in academic cities. The results of the study may be useful to university authorities for marketing purposes, for example, to attract students from further areas and to seek answers to the question of why young people chose other academic centres (e.g., in Poland these are Cracow, Wrocław, Poznań, Warsaw).
The presented GIS approach for geographic education pathway analysis may have important and lasting implications for the future of educational research in terms of geography and GIScience.


