Technical Note

Official Statistics, Building Censuses, and OpenStreetMap Completeness in Italy

1
Italian National Institute of Statistics (ISTAT), Piazzale G. Marconi 16, I-00144 Rome, Italy
2
Department of Economics and Law, University of Macerata, Via Armaroli 43, I-62100 Macerata, Italy
*
Author to whom correspondence should be addressed.
ISPRS Int. J. Geo-Inf. 2022, 11(1), 29; https://doi.org/10.3390/ijgi11010029
Submission received: 21 October 2021 / Revised: 25 December 2021 / Accepted: 26 December 2021 / Published: 31 December 2021

Abstract

:
The present study provides a simplified framework verifying the degree of coverage and completeness of settlement maps derived from the OpenStreetMap (OSM) database at the national scale, with a possible use in official statistics. Measuring the completeness of the objects (i.e., buildings) derived from OpenStreetMap database supports its potential use in building/population censuses and other diachronic surveys, as well as administrative sources such as the register of building permits and land-use cadasters. A series of measurements at different scales are proposed and tested for Italy, in line with earlier studies. While recognizing the potential of the OpenStreetMap database for official statistics, the present work underlines the urgent need of an additional (spatially explicit) analysis overcoming the data heterogeneity and sub-optimal coverage of the OSM information source.

1. Introduction

Recent advances in Web 2.0 technologies have transformed Internet users from “content seekers” to “data producers” [1]. Notably, this process has simultaneously led to the search for free software and open data, in turn creating a collaborative consciousness where users become both data creators and data sharers [2]. Technological progress allows even less skilled stakeholders to produce significant data [3]. From this perspective, open software allows a reduction in the cost of assessment tools and solutions to repetitive operations [4]. In a context where each user becomes a sensor that acts in a global process of information sharing [5], data are no longer the monopoly of a given institution/authority. We are instead witnessing a process of “democratization” of geographic data or a sort of “new geography without geographers” [6]. On the one hand, one can arrive at the paradox that data produced by single users are more up-to-date and truthful than administrative data [7]. On the other hand, a question may arise: “How reliable are data from users?”. If all these assumptions serve to bring young people closer to geographical analysis, e.g., increasing awareness of the problems related to the area where they live, then this “new geography” literature is likely to be an appropriate tool for improving official statistics [8]. However, geography is more than the mere enumeration of place names, rather claiming to provide a truly systematic analysis of the individual elements within a given territory [9].
Contributing to the shift from “data users” to “data producers”, the OpenStreetMap (OSM) community was launched in July 2004. The limited access to free geographic data was a motivation at the base of its (so rapid) development [10]. In Europe, up to that time, spatially explicit data sources were mainly collected and disseminated by the National Statistical Institutes of individual countries [11]. Moreover—at least in some cases—these data were less precise and had a more restricted availability than equivalent systems, e.g., in the United States of America (the U.S. Tiger system releases extremely accurate data with regular updates). Dissemination of spatially explicit data is still difficult in European countries, and, for instance, the Eurostat system of official statistics currently provides a wide range of (aggregate) geographic information, which rarely goes below the municipal scale [12,13,14]. For this reason, the OSM archive—especially in Europe—may complement (and fill the lack of) spatially explicit data referring to, e.g., buildings, streets, and addresses. These elements were considered the necessary information for geo-referencing, geo-coding, and other operational procedures of interest for different disciplines and applications [15,16,17]. The main stimuli for digitization in an OSM frame came from the ability to acquire GPX tracks through Potlatch, and later through Yahoo, which made satellite imagery available since 2006 [9]. However, despite strong technological improvements, OSM users are still regarded as less skilled practitioners, mostly editing geographic objects for fun.
OSM includes easy technology, precise enough to be used for administrative purposes. Building and land-use maps from OSM were proposed to replace cadasters [8]. However, the use of administrative sources requires a careful analysis of spatial coverage. Which buildings have OSM users mapped? Which places received attention and careful inspection? To answer these questions, one would examine the individual building information available from OSM in representative areas. Based on empirical studies, OSM was demonstrated to provide significant improvements to Corine Land Cover maps [18], becoming essential, e.g., in emergency management. For instance, a significant boost in data production was observed as an indirect response to the Nepal earthquake [19], likely reflecting a sense of community and participation during disasters. At the same time, the “wikification” of geography [20] proved to be a problem in terms of object representation and map completeness. Who guarantees the quality of the released data? From this perspective, data quality includes both (i) accuracy of shapes and positioning of geographical elements with respect to reality, and (ii) precision of the supplementary information eventually associated with geographical data [21]. Additionally, can the considerable effort of users replace administrative sources? The geographical world is evolving, and the truth is no longer found in archives but in their sharing. In order to answer this last question, a series of statistical indicators can be proposed and calculated from the comparison of the OSM database and official sources [22]. Based on these premises, the present study evaluates the intrinsic quality of data derived from OSM with respect to official statistics (e.g., building maps). Additionally, the study suggests operational approaches to verify and improve the completeness and spatial coverage of the data collected for individual buildings within the frame of volunteered geographic information. The final objective of the study is to delineate advantages (and weaknesses) of an extensive use of OSM in official statistics.

2. Materials and Methods

2.1. Study Area and Logical Framework

The present study adopts Italy (301,330 km2) as a case study. A national coverage is appropriate when comparing the representativeness of open/volunteered information sources with official data sources. As far as the settlement maps derived from official statistics in Italy, the National Institute of Statistics (ISTAT) no longer carries out the traditional census of buildings, and the related maps produced in past surveys were—at some instances—partial [17]. Technical difficulties arose when managing these large amounts of data. Concerning the possible comparison of official information with other data sources, including OSM, an extensive and comparative analysis of the quality of building maps at enough large scales is particularly hard to realize [18]. An earlier study [23] has investigated the municipal territory at a very high spatial resolution using hexagonal grids (Figure 1). Grids overcome the intrinsic limits in the use of administrative boundaries, allowing a direct investigation of the coverage rate [10]. While documenting the relatively good coverage rate downtown in respect with that in the suburbs, the empirical results of such studies do not verify whether the differential coverage rate depends on the fact that OSM users may encounter difficulties in editing buildings (and collecting their basic characteristics) outside the boundaries of inner cities. More likely, given that most users only map their neighborhoods, differential coverage could be a consequence of a lower density of OSM users in suburban/rural areas [10] (p. 1078).
In the present work, we tried to improve the location accuracy of any investigated geographical element, e.g., checking for the position of the shape’s vertices in a representative sample of buildings [10]. The difficulty in applying this methodology to Italy lies in the partial availability of a reference geo-database whose semantic and geographical quality is fully known and certified. Considering that a total of 24,156,305 buildings were surveyed at the national level (building census), comparing homologous point features between OSM and official statistics is particularly complex. Similar works were carried out in small portions of the national territory; for instance, the full content of two databases was compared in a part of Pavia province, Northern Italy [24], performing a visual comparison between the buildings captured in the ortho-photographs made available on Google Maps and those surveyed in OSM (Figure 2). Application of such a methodology at the national scale implies editing all the individual buildings, which is time-consuming and methodologically complex. This issue is in common with other European (mostly Mediterranean) countries [25,26,27].
The choice of a reference database for computation arises as another important issue [11]. Up to few years ago, there were no open-license building archives at the national scale in Italy that can be used as a reference, both in terms of completeness and location accuracy. The Italian cadaster is considered the most authoritative source, although dissemination in digital, editable formats is still restricted to specific stakeholders. Although some cadastral data have been recently disseminated freely under the CC-BY license, only partial information is available via WMS services. Such a dissemination mode may allow the retrieval of information through relational queries, while preventing the direct use of geo-referenced geometries (i.e., shapefiles). The civil protection authority of Italy has recently made available a geo-database of buildings containing the “urban structural aggregates” for the entire national territory. These are geometries starting from the analysis of individual buildings’ shape based on various (regional) databases, which have been acquired into polygon formats containing individual buildings, which were identified with a sequential identifier. This archive was created for earthquake prevention, by aggregating contiguous buildings. In fact, in case of an earthquake, it is important to estimate the behavior of the aggregates and not only of the single buildings. The archive benefited of a wide spatial coverage under a CC BY 4.0 license. This condition allows users as well as the related administrative sources to reproduce the database’s content in any way. Based on this premises, this archive is taken as a key reference in the context of the present study and was extensively used as the buildings open data archive (BODA) in the following analysis.

2.2. Buildings Open Data Archive (BODA)

By paying particular attention to data resolution (understood as the ability to identify individual buildings) and data completeness, BODA integrated different cartographical sources of data, that include the following: (i) administrative sources of data derived from cartographic services and other technical offices of regions, provinces, municipalities, and other entities, most of them participating in the National Statistical System, SISTAN (Table 1); (ii) the National GeoPortal of Italy (http://www.pcn.minambiente.it/mattm/ accessed on 10 November 2021); (iii) individual data sources and geographical layers produced directly by the Italian Civil Protection service (https://rischi.protezionecivile.gov.it/it/approfondimento/dataset-nazionale-degli-aggregati-strutturali-italiani accessed on 10 November 2021).
Despite the extensive technical efforts, it was not always possible to monitor the quality of all administrative sources below the spatial level of regional authorities (e.g., provinces, municipalities). Only for Campania region (Southern Italy), the regional data were integrated with provincial data. By contrast, the Molise region did not provide administrative data for any territorial entity. For these reasons, the regional technical maps (CTR) identifying individual buildings with a relatively high spatial resolution were considered to achieve a complete national coverage. The National GeoPortal (GPN)—an application of the Italian Ministry of the Environment, Territory, and Sea (MATTM), where buildings in specific areas of the country (e.g., provincial capital towns, and formalized urban centers) were extensively mapped—was used to integrate these information sources. However, this is only a small part of the information typical of land (cadastral) registers in Italy. Considering that BODA surveyed aggregates of buildings, and not the individual buildings, this database was implemented taking account of the following issues: (i) all individual buildings surveyed from administrative and open data sources were considered in the final BODA archive; (ii) all the buildings derived from GPN that were not contiguous with any building surveyed in the archive were included in the archive and, finally, (iii) structural aggregates (“ensembles of buildings”) not intersecting any building in the archive were also included in the archive. Despite these technical adjustments, the geometric information derived from the regional technical maps is the dominant layer in the final BODA. Finally, it should be noted that, because of a recent hacker attack, the availability of administrative data produced and disseminated by the Latium Region, Central Italy, has been greatly reduced. The regional authority had in fact suspended the operation of the regional GeoPortal. We, therefore, resorted to copies of these administrative data available at other sources.

2.3. The Spatial Distribution of Buildings Derived from Official Statistics in Italy

To support census operations, ISTAT partitioned the Italian territory into more than 400 thousand polygons (“enumeration districts”) classified into four types of settlements, from LOC1 to LOC4 (for more details regarding the segmentation of the Italian territory into enumeration districts, see the technical notes of general censuses at www.istat.it website accessed on 30 December 2021). More precisely, the 2011 census database (the last census wave in Italy) was organized into (i) 271,229 LOC1 districts, including strictly built-up areas where buildings are located at a maximum distance of 70 m from each other (64,826 km2); (ii) 41,306 LOC2 districts of moderately dense built-up areas with buildings at a maximum distance of 30 m from each other—including peri-urban and rural dense settlements, and (iii) 89,586 LOC3 and LOC4 districts, respectively, with productive settlements (industry and services) and sparse settlements in rural areas covering the remaining part of Italy.

2.4. A Comparative Analysis of OSM and BODA Coverage in Italy

The spatial partition illustrated in Section 2.3 was used in the present study as a stratification variable for comparison of OSM and BODA building map coverage in Italy. More specifically, the stratification variable distinguished strictly urban, LOC1 districts from LOC2-3-4 districts, hereafter referred to as “rural”, based on the distance between buildings. Spatial stratification may provide additional information about the coverage of OSM database with respect to an official source such as BODA. Based on this stratification (urban vs. rural), a comparative analysis of OSM and BODA coverage was performed at the regional scale in Italy (20 regional authorities), considering together (i) the total number of buildings surveyed in OSM and BODA separately and (ii) the total surface area of surveyed buildings in both data sources. It is worth noting that different sources may interpret the same building differently. In particular, the editing process in OpenStreetMap may lead to the consideration of two or more adjacent buildings as a single polygon, e.g., because of an insufficient resolution of the selected ortho-photo-images. This is the case of semi-detached buildings (e.g., villas), which can be recorded as two (smaller) buildings within the administrative archive. Figure 3 provides two examples taken from the spatial overlap of OSM and BODA building shapes, documenting how buildings surveyed within administrative sources can be divided into different single entities with respect to the reality. Only a field inspection (or detailed interpretation of aerial photographs) may clarify this issue which is, at the same time, one of the possible explanations of the different coverage of building maps frequently in urban and rural districts [10].
Based on these premises, three different approaches were adopted in our study: (i) an aggregate, count-based comparison between OSM and BODA databases at the regional scale (i.e., considering the absolute number of buildings with the same characteristics in both archives), (ii) a refined count of individual buildings present in both databases based on centroid spatial superposition between OSM and BODA databases; and, finally, (iii) an “object-oriented” approach based on the calculation of building surfaces in OSM and BODA based on polygon intersection. For case (iii), an index computing the ratio between the intersect area and the reference area was made available [10]; this ratio equals 1 when the building surface in the two databases coincides. Results of these approaches were summarized at the regional scale in Italy, considered an appropriate domain of analysis for the implementation of official statistics [28]. Italian regions were ordered from north to south, following the unique identification code provided by ISTAT and ranging from 1 (Piedmont) and 20 (Sardinia). This coding system is used at the national and European level (i.e., Eurostat) within the Nomenclature of Territorial Statistical Units (NUTS).

3. Results

A comparative analysis of the content of OSM and BODA databases (Table 2) documents differences as far as the number of buildings and the surface area of buildings are concerned, suggesting relevant disparities in the coverage rate among regions in Italy. As expected, buildings in urban areas (LOC1 according with ISTAT classification) were more abundant than buildings located in rural areas (LOC2-3-4) for both data sources. A total of 14,121,227 buildings were included in the OSM repository for a total area of 3640 km2. A total of 25,981,541 buildings were enumerated in the BODA covering 5474 km2.

3.1. Comparing the Coverage of Building Surveys Derived from Different Data Sources

The content of OSM and BODA databases was compared according to empirical approaches presented in an earlier study (Hecht, 2013). The first one was based on aggregate counts of the elements surveyed in the different databases, e.g., by administrative region. However, this count does not guarantee that the two archives refer to the same building entity. The second step implied counts of the building centroids in the reference database (BODA) that overlap buildings’ polygons in the OSM database. This step is more detailed than the first one, but it does not consider whether the elements found in the same places are exactly the same entity. The third step included a specific analysis of the overlapping surface area of buildings surveyed in the two archives.

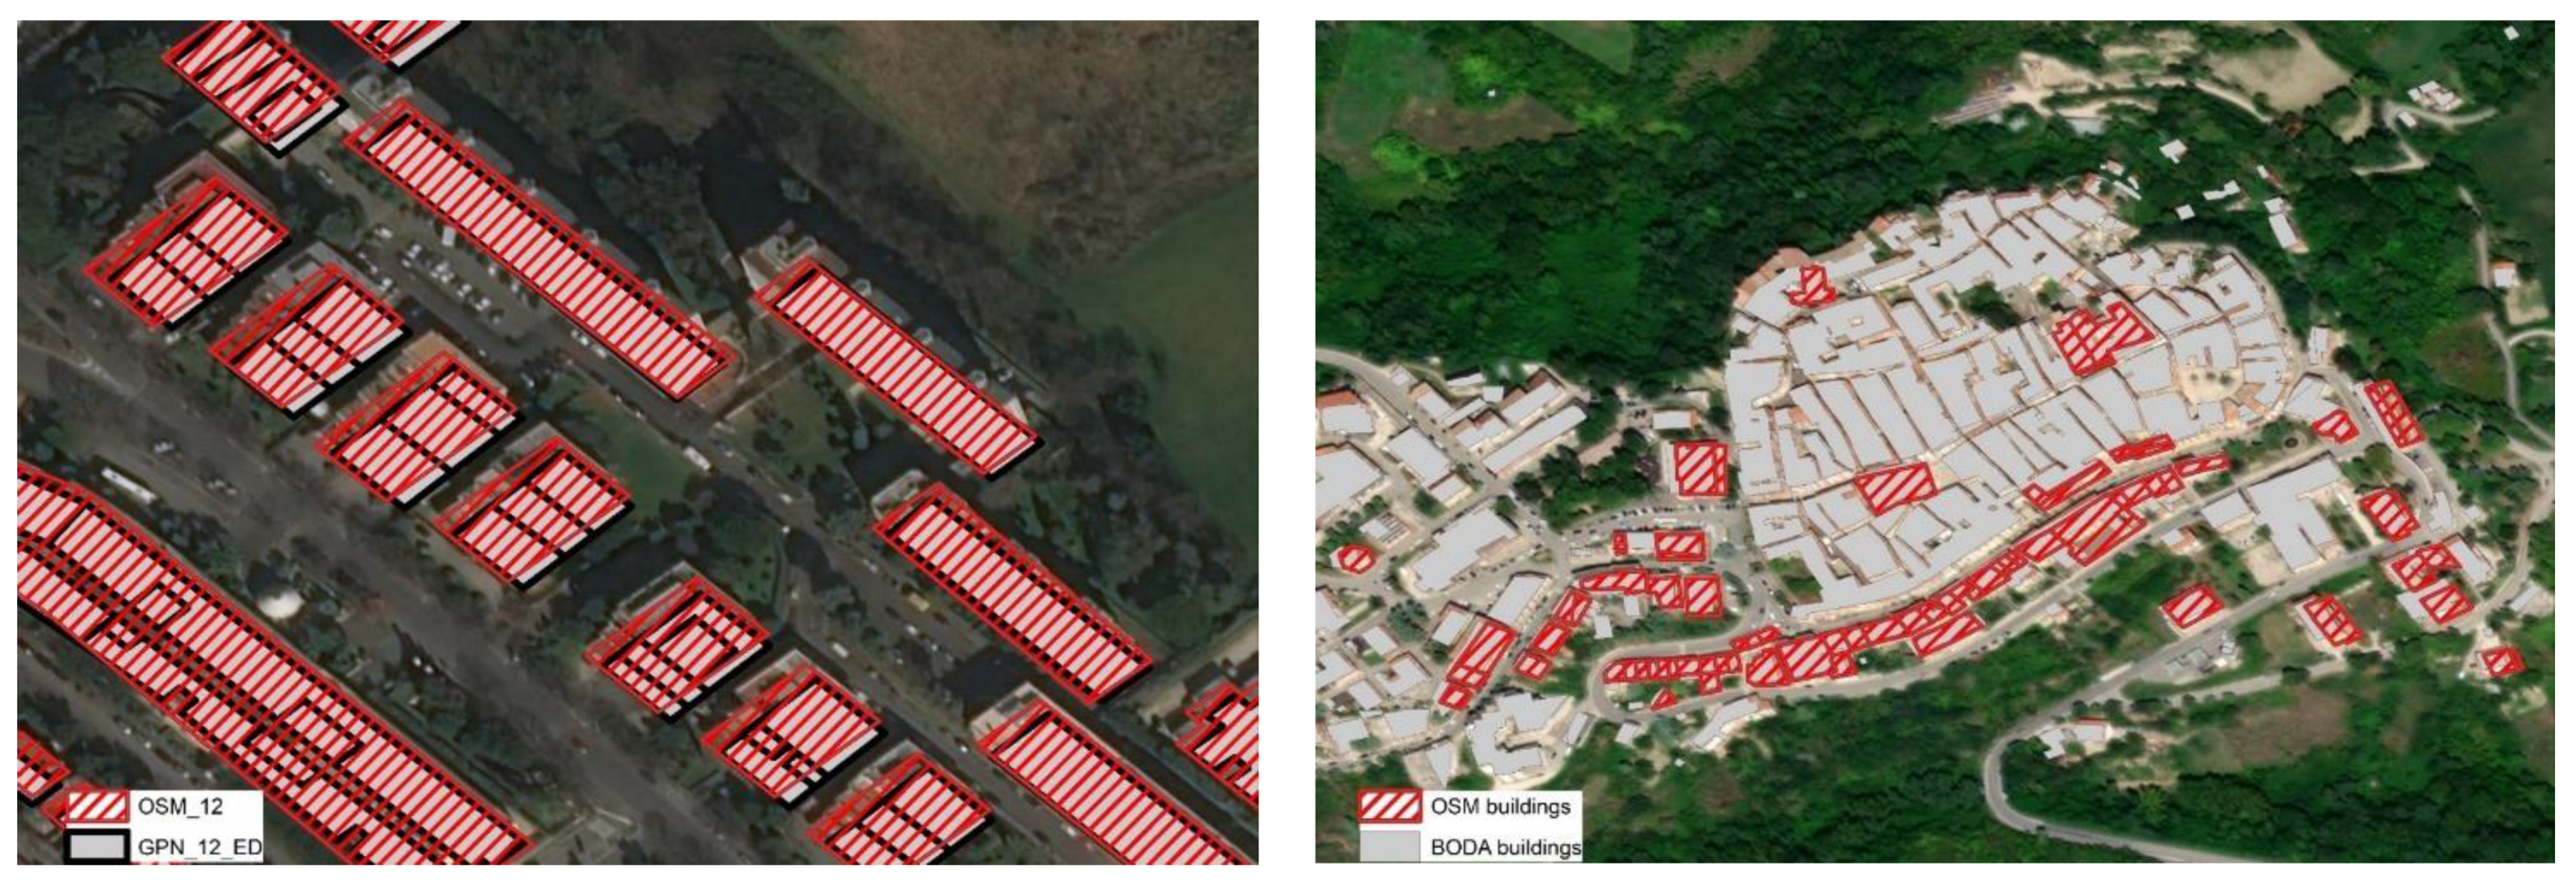
3.1.1. Count-Based Comparison between OSM and BODA Databases

The comparison was based on two indicators: (i) number of OSM buildings to the number of buildings found in BODA within the same region; (ii) total surface (m2) of buildings in OSM database in total surface (m2) of buildings in BODA within the same region. Considering separately the number of buildings and the related surface area may discriminate contexts where users interpret contiguous buildings as a single building. Since administrative archives—such as BODA—are mainly based on cadaster information while OSM users distinguish buildings by their roof, discrepancies are rather inevitable and should be, at least indirectly, estimated. The indicator quantifying OSM-to-BODA coverage rate for both the number of buildings and the surface area of buildings is indicative of such condition, with the former being 54.4 and the latter reaching 66.5 for Italy (Table 3). These values indicate a better representation of buildings in the OSM database as far as surface area is concerned and can be also explained with the possibly different definition/interpretation of individual/contiguous buildings adopted in OSM and BODA sources. Comparing indicators by administrative region allows the identification of Italian regions with a larger OSM spatial coverage. A separate analysis of urban and rural settlements revealed a particularly heterogeneous context, since the OSM database enumerates a number of urban buildings equal to about 59% of the buildings enumerated in BODA, compared with 47% of the rural buildings. This may confirm an earlier assumption regarding the different OSM coverage in urban and rural areas. Results of the empirical analysis indicate Apulia and Veneto as significant cases where urban and rural buildings, respectively, were better represented in the OSM database compared with BODA source. Notably, the official building map of Apulia (BODA) is recognized as quite obsolete, and OSM elements may contribute significantly to updating this map. In such cases, building records in the OSM that are not surveyed in administrative sources cannot be considered wrong/inappropriate, since a part of the regional maps is dated, and informal buildings are still present in some areas.

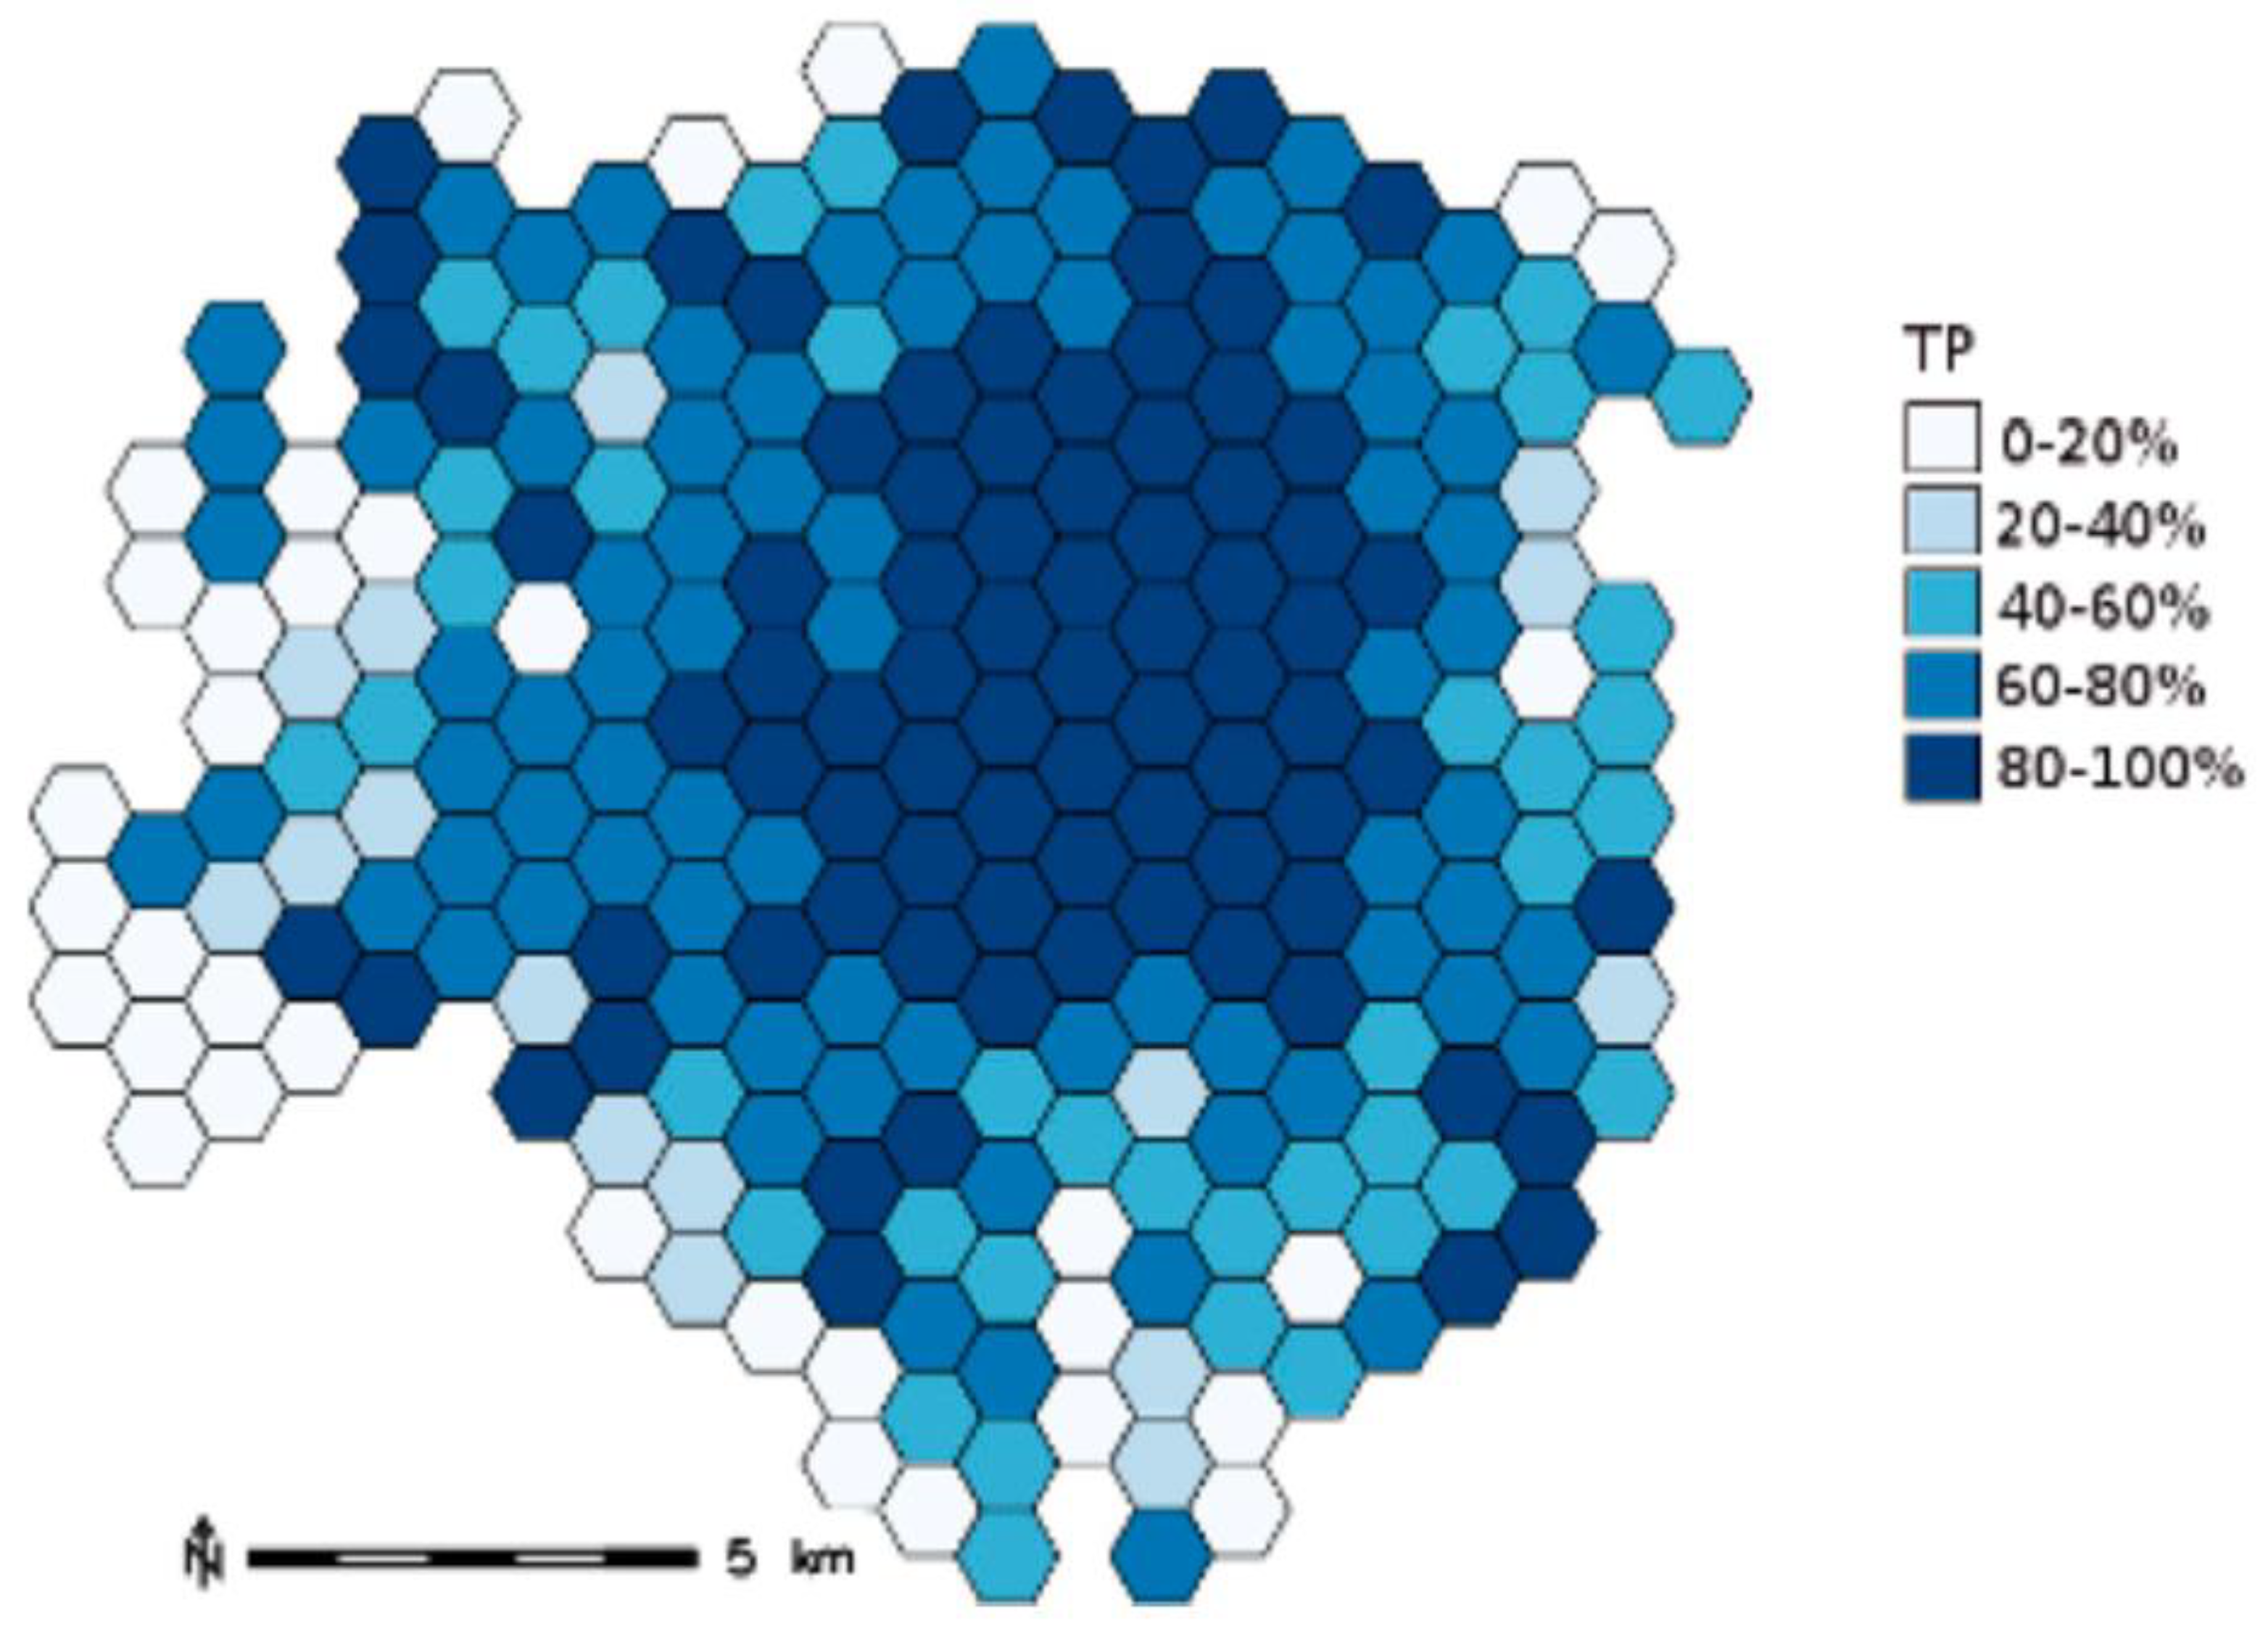
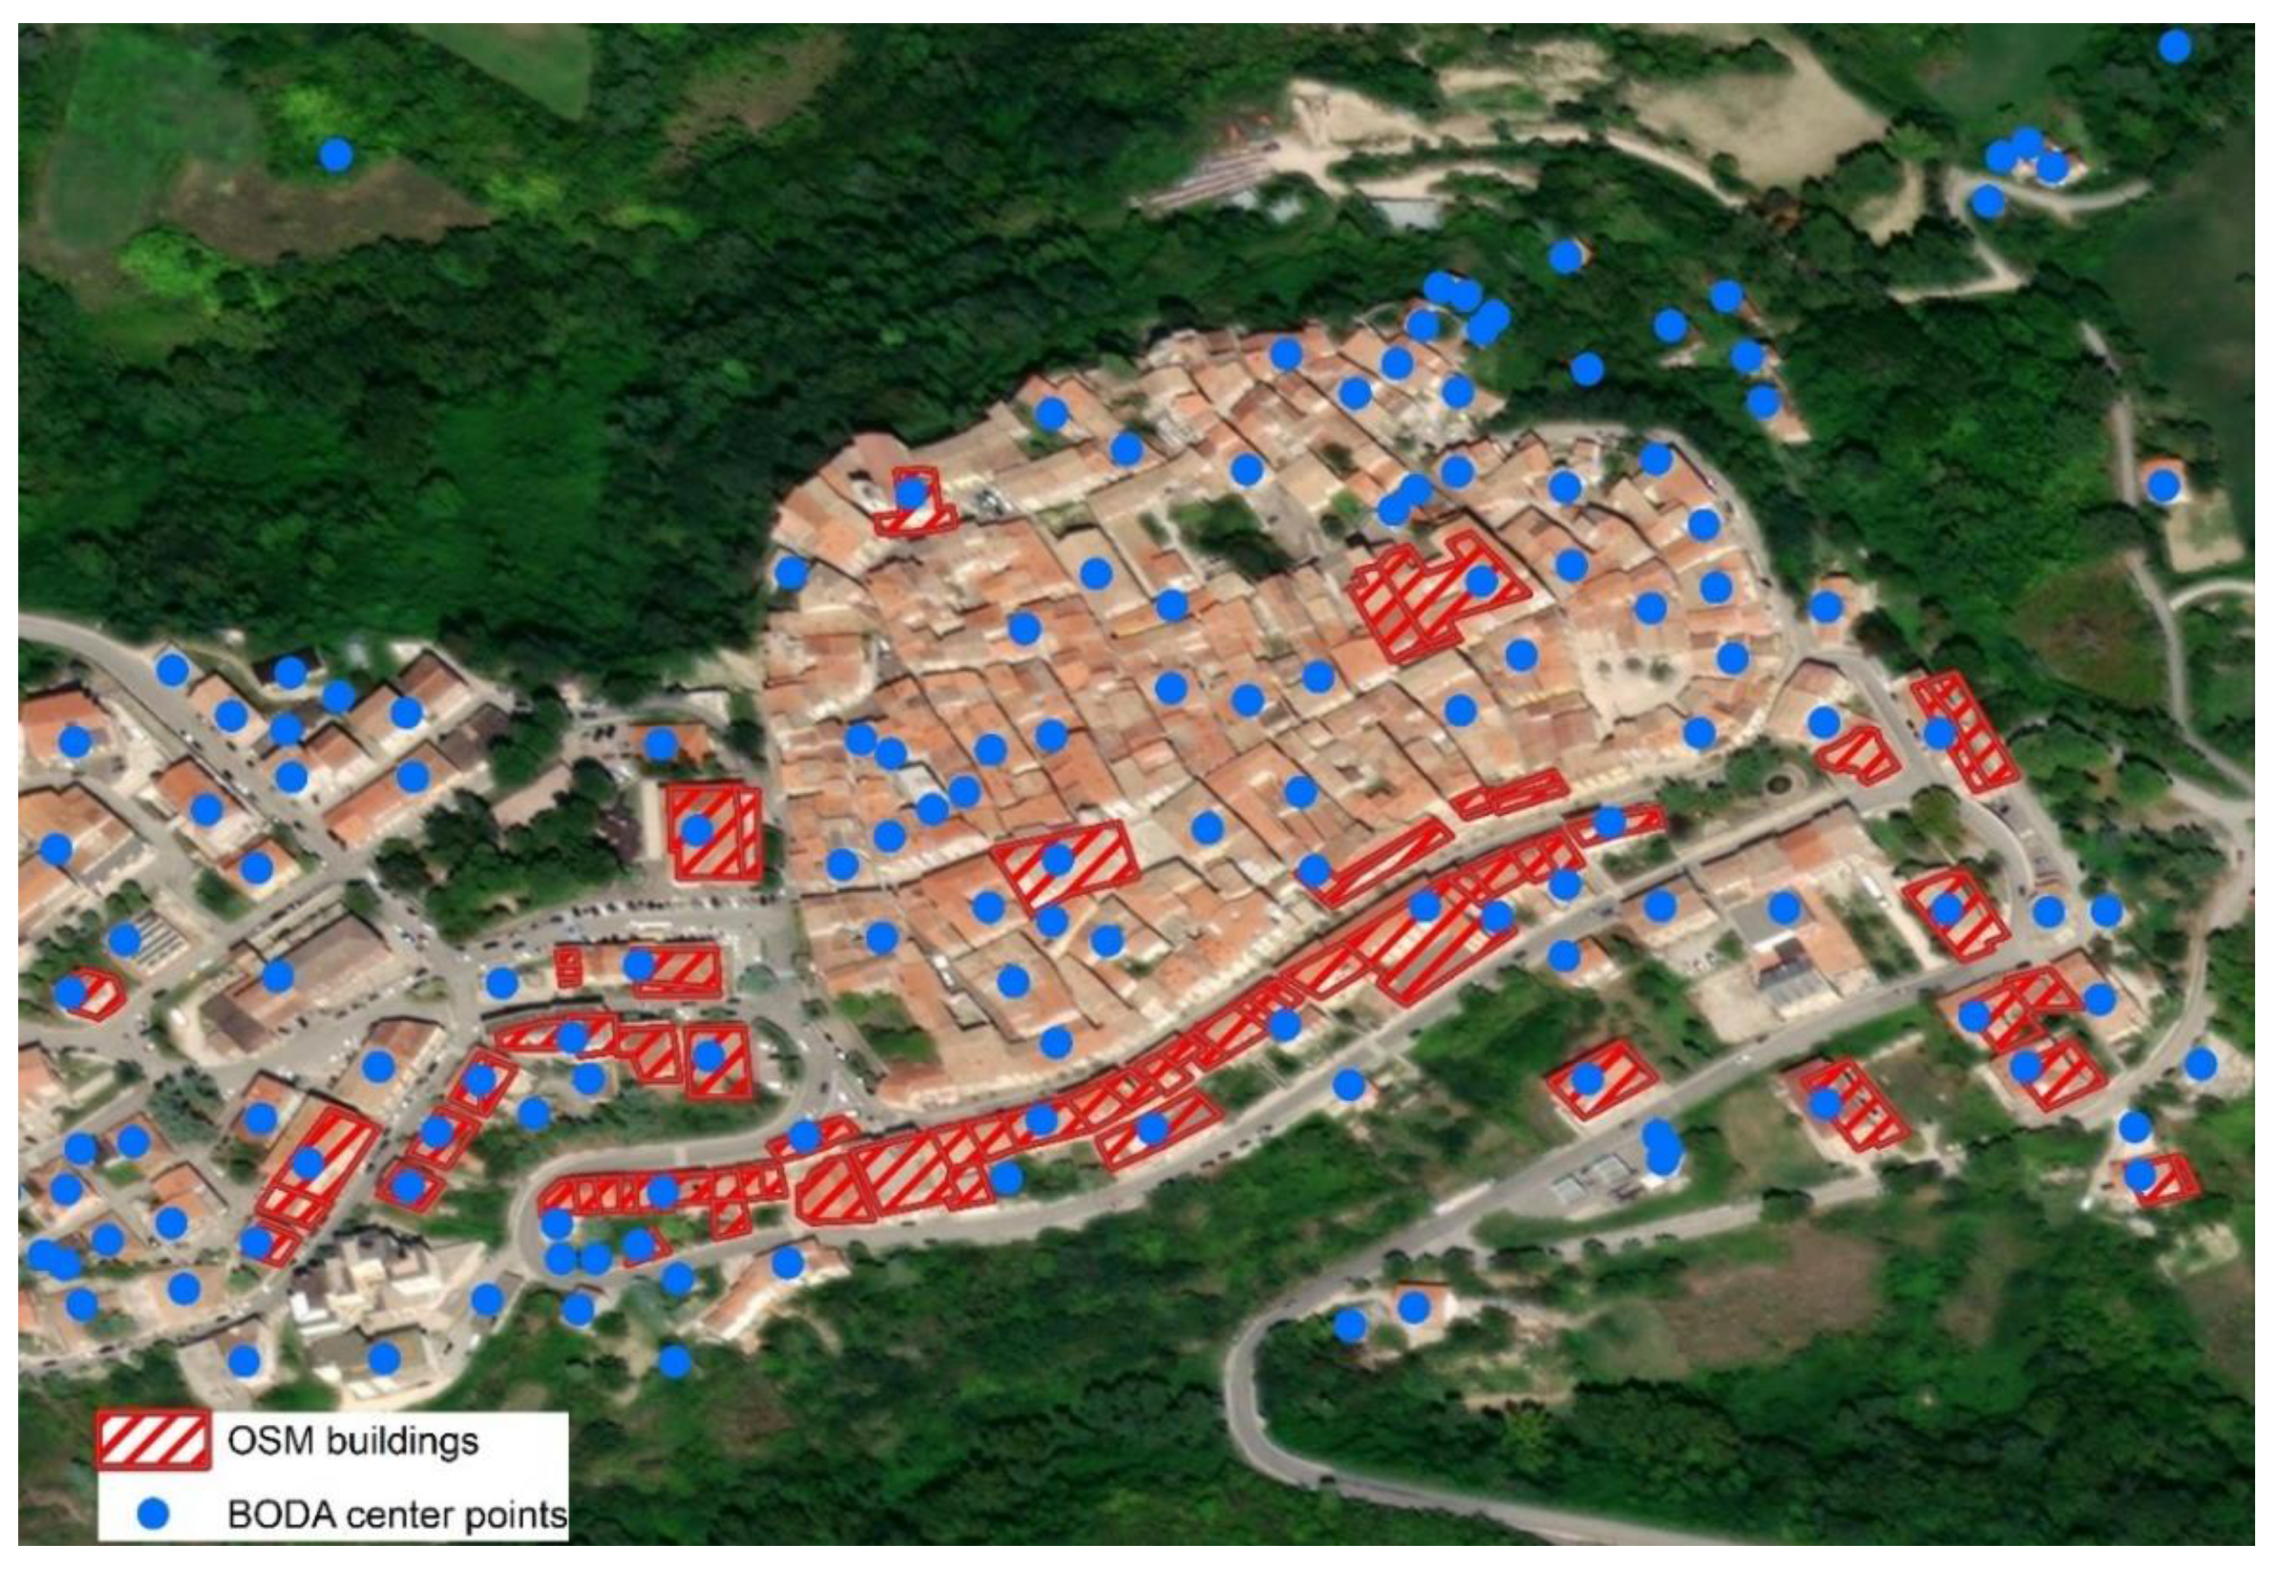
3.1.2. Building Centroid Superposition between OSM and BODA Databases

Since the two databases may indicate different (building) objects, it is appropriate to investigate further which types of OSM cartographic objects are found in BODA. For this purpose, we calculated how many centroids of BODA fell within OSM buildings. From this perspective, we calculated the “overlap share” [10] in accordance with local spatial patterns. The methodology consists in counting the buildings of the reference database that are located within the centroid of a building of the examined database, the OSM in this case (Figure 4).
Apulia and Veneto regions ranked in the first positions together with Liguria (93.2%) and Friuli–Venezia–Giulia (88.2%). These results also document the regional heterogeneity in the building representation typical of OSM and BODA databases (Table 4).

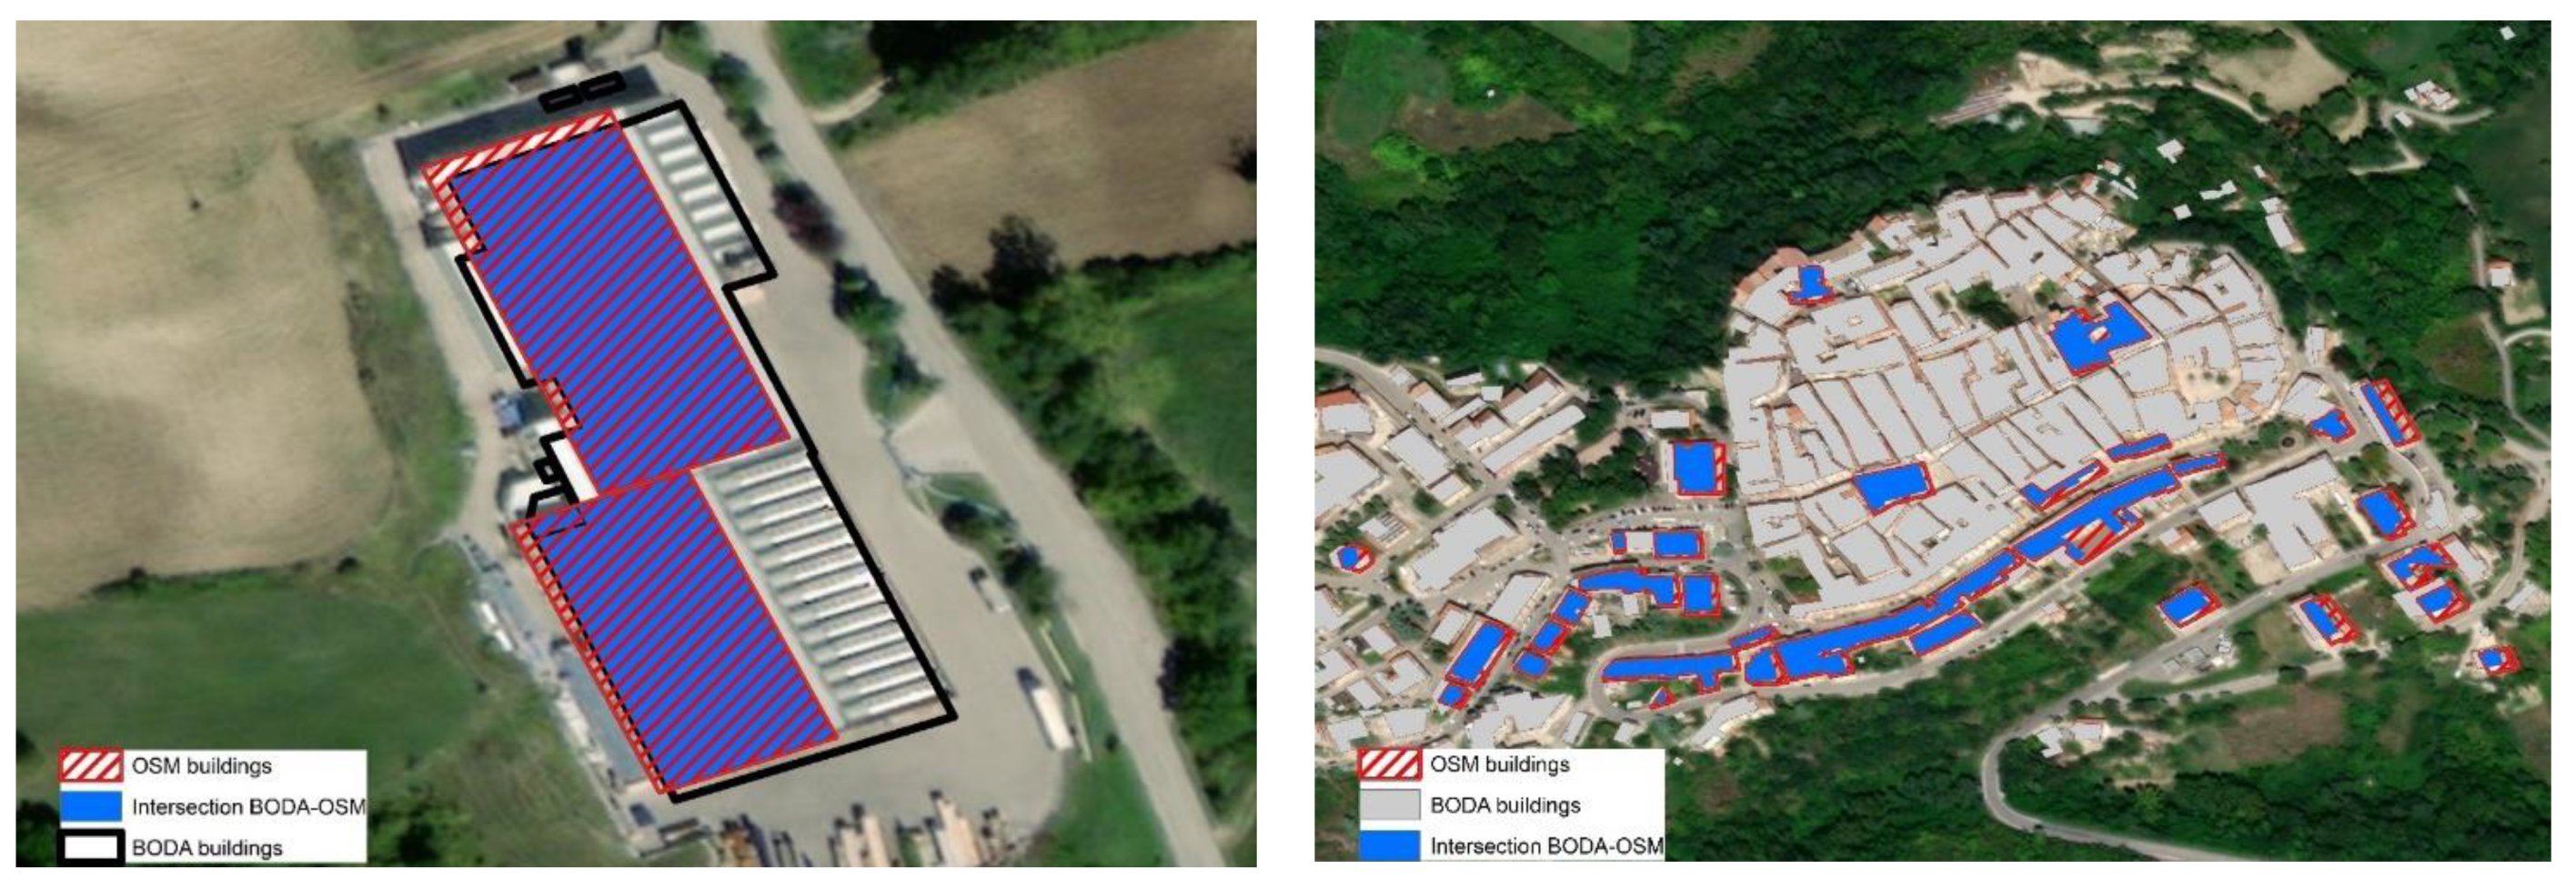
3.1.3. An “Object-Oriented” Approach Based on Polygon Intersection

The third approach was more refined in summarizing the level of completeness and correct positioning of the buildings in the OSM archive with respect to the administrative data (Figure 5). The largest intersection surface area was observed in Apulia (92%). The main advantage of this approach is that it does not take account of the issue of the semantic definition of “building” as a cartographical object, as it is substantially different among databases.

4. Conclusions

The analysis carried out in this study provides indirect support to the continuous improvement of OSM. At the same time, a comparative analysis of OSM coverage across Italian regions outlines the uncertainty of the reference data and the difficulty of identifying heterogeneity sources, both in the case of underestimations or in the case of overestimations of building numbers. One of the possible sources of heterogeneity lies in the fact that data entry into the OSM takes place in different ways, including data collection in the field, remote mapping, and direct import from independent sources. Direct import can be sometimes generate some overlaps between OSM and reference databases, generating an additional cause of data instability. Monitoring the progressive consolidation of OpenStreetMap contents (i.e., scrutinizing the stratification of input data sources forming the actual map coverage)—possibly distinguishing between individual imputation of primary (e.g., field) data, remote mapping, and direct import from external, secondary sources—is a particularly hard but challenging task. In Italian regions identified to have more accurate OSM databases, the different sources of heterogeneity could have acted even more intensively than in other socioeconomic contexts. The Apulia region may be considered a representative example of such dynamics. Further investigations on the impact of data source heterogeneity on OSM completeness for statistical use are particularly required in such contexts.
Despite the latent uncertainty in the autonomous use of OSM archives as a direct input to official statistics, our study justified further efforts exploring the role of open databases in large-scale cartographic assessments of individual buildings with enough spatial and semantic accuracy. While the empirical results of this study seem to discourage the use of OSM as a substitute of BODA, we demonstrate that, at least in certain areas of Italy, OSM may represent an authoritative source of information for the spatial distribution of different types and sizes of buildings—contributing to the verification of the quality and precision of official sources especially in specific contexts. Assuming a less intense coverage (with respect to that of official sources) of OSM in rural areas, the empirical results of our study are also of some interest for users who want to start mapping buildings in under-cover areas. A work of this type, however, requires special attention because not all the regional authorities in Italy, as well as in other European contexts, grant data licenses compatible with OSM data. Future research should finally concentrate on the implementation of new indicators testing the completeness of OSM data, considering the intrinsic characteristics of buildings as supplementary, but not secondary, information. The final objective of such studies is clearly the improvement of the geo-coding mechanisms’ precision, so that the OSM archive will become more reliable for both administrative and statistical purposes.

Author Contributions

Conceptualization, Gianluigi Salvucci; methodology, Gianluigi Salvucci; software, Gianluigi Salvucci; validation, Gianluigi Salvucci; formal analysis, Gianluigi Salvucci; investigation, Gianluigi Salvucci; resources, Luca Salvati; data curation, Gianluigi Salvucci; writing—original draft preparation, Gianluigi Salvucci and Luca Salvati; writing—review and editing, Gianluigi Salvucci and Luca Salvati; visualization, Gianluigi Salvucci; supervision, Luca Salvati; project administration, Luca Salvati; funding acquisition, Luca Salvati. All authors have read and agreed to the published version of the manuscript.

Funding

This research received no external funding.

Institutional Review Board Statement

Not applicable.

Informed Consent Statement

Not applicable.

Data Availability Statement

Official statistics released by the Italian National Statistical Institute (ISTAT) were used in this study.

Conflicts of Interest

The authors declare no conflict of interest.

References

  1. Girres, J.F.; Touya, G. Quality assessment of the French OpenStreetMap dataset. Trans. GIS 2010, 14, 435–459. [Google Scholar] [CrossRef]
  2. Mondzech, J.; Sester, M. Quality analysis of OpenStreetMap data based on application needs. Cartogr. Int. J. Geogr. Inf. Geovisualization 2011, 46, 115–125. [Google Scholar] [CrossRef]
  3. Fan, H.; Zipf, A.; Fu, Q.; Neis, P. Quality assessment for building footprints data on OpenStreetMap. Int. J. Geogr. Inf. Sci. 2014, 28, 700–719. [Google Scholar] [CrossRef]
  4. Ma, D.; Sandberg, M.; Jiang, B. Characterizing the heterogeneity of the OpenStreetMap data and community. ISPRS Int. J. Geo-Inf. 2015, 4, 535–550. [Google Scholar] [CrossRef]
  5. Goodchild, M. Citizens as Sensors: The world of volunteered geography. GeoJournal 2007, 69, 211–221. [Google Scholar] [CrossRef] [Green Version]
  6. Turner, A. Introduction to Neogeography. 2006. Available online: https://proquestcombo.safaribooksonline.com/0596529953 (accessed on 30 November 2021).
  7. Salvati, L. Towards a Polycentric Region? The Socio-economic Trajectory of Rome, an ‘Eternally Mediterranean’ City. Tijdschr. Voor Econ. En Soc. Geogr. 2014, 105, 268–284. [Google Scholar] [CrossRef]
  8. Basiouka, S.; Potsiou, C.; Bakogiannis, E. OpenStreetMap for cadastral purposes: An application using VGI for official processes in urban areas. Surv. Rev. 2015, 47, 1752270615Y.000. [Google Scholar] [CrossRef]
  9. Haklay, M.; Weber, P. OpenStreetMap: User-Generated Street Maps. IEEE Pervasive Comput. 2008, 7, 12–18. [Google Scholar] [CrossRef] [Green Version]
  10. Hecht, R. Measuring Completeness of Building Footprints in OpenStreetMap over Space and Time. ISPRS Int. J. Geo-Inf. 2013, 2, 1066–1091. [Google Scholar] [CrossRef]
  11. Zambon, I.; Colantoni, A.; Salvati, L. Horizontal vs vertical growth: Understanding latent patterns of urban expansion in large metropolitan regions. Sci. Total Environ. 2019, 654, 778–785. [Google Scholar] [CrossRef]
  12. Duvernoy, I.; Zambon, I.; Sateriano, A.; Salvati, L. Pictures from the other side of the fringe: Urban growth and peri-urban agriculture in a post-industrial city (Toulouse, France). J. Rural Stud. 2018, 57, 25–35. [Google Scholar] [CrossRef]
  13. Zambon, I.; Benedetti, A.; Ferrara, C.; Salvati, L. Soil matters? A multivariate analysis of socioeconomic constraints to urban expansion in Mediterranean Europe. Ecol. Econ. 2018, 146, 173–183. [Google Scholar] [CrossRef]
  14. Salvati, L.; Ciommi, M.T.; Serra, P.; Chelli, F.M. Exploring the spatial structure of housing prices under economic expansion and stagnation: The role of socio-demographic factors in metropolitan Rome, Italy. Land Use Policy 2019, 81, 143–152. [Google Scholar] [CrossRef]
  15. Pili, S.; Grigoriadis, E.; Carlucci, M.; Clemente, M.; Salvati, L. Towards sustainable growth? A multi-criteria assessment of (changing) urban forms. Ecol. Indic. 2017, 76, 71–80. [Google Scholar] [CrossRef]
  16. Kazemzadeh-Zow, A.; Zanganeh Shahraki, S.; Salvati, L.; Samani, N.N. A spatial zoning approach to calibrate and validate urban growth models. Int. J. Geogr. Inf. Sci. 2017, 31, 763–782. [Google Scholar] [CrossRef]
  17. Carlucci, M.; Chelli, F.M.; Salvati, L. Toward a new cycle: Short-term population dynamics, gentrification, and re-urbanization of Milan (Italy). Sustainability 2018, 10, 3014. [Google Scholar] [CrossRef] [Green Version]
  18. Fonte, C.C.; Patriarca, J.A.; Minghini, M.; Antoniou, V.; See, L.; Brovelli, M.A. Using OpenStreetMap to Create Land Use and Land Cover Maps Development of an Application. In Volunteered Geographic Information and the Future of Geospatial Data, edited by Cláudio Elízio Calazans Campelo, Michela Bertolotto, Padraig Corcoran; IGI Global: Amsterdam, The Netherlands, 2019; pp. 1100–1123. [Google Scholar]
  19. Ahmouda, A.; Hochmair, H.H.; Cvetojevic, S. Analyzing the effect of earthquakes on OpenStreetMap contribution patterns and tweeting activities. Geo-Spat. Inf. Sci. 2018, 21, 195–212. [Google Scholar] [CrossRef] [Green Version]
  20. Sui, D.Z. The Wwikification of GIS and its consequences: Or Angelina Jolie’s new tattoo and the future of GIS. Comput. Environ. Urban Syst. 2008, 32, 1–5. [Google Scholar] [CrossRef]
  21. Bajocco, S.; Ceccarelli, T.; Smiraglia, D.; Salvati, L.; Ricotta, C. Modeling the ecological niche of long-term land use changes: The role of biophysical factors. Ecol. Indic. 2016, 60, 231–236. [Google Scholar] [CrossRef]
  22. Salvati, L.; Zitti, M.; Sateriano, A. Changes in city vertical profile as an indicator of sprawl: Evidence from a Mediterranean urban region. Habitat Int. 2013, 38, 119–125. [Google Scholar] [CrossRef]
  23. Brovelli, M.A.; Minghini, M.; Molinari, M.E.; Zamboni, G. Positional accuracy assessment of the OpenStreetMap buildings layer through automatic homologous pairs detection: The method and a case study. ISPRS-Int. Arch. Photogramm. Remote Sens. Spat. Inf. Sci. 2016, 49, 615–620. [Google Scholar] [CrossRef] [Green Version]
  24. Franzini, M.; Annovazzi-Lodi, L.; Casella, V. Assessment of the Completeness of OpenStreetMap and Google Maps for the Province of Pavia (Italy). In Proceedings of the 6th International Conference on Geographical Information Systems Theory, Applications and Management, Prague, Czech Republic, 7–9 May 2020; pp. 270–277. [Google Scholar] [CrossRef]
  25. Ciommi, M.; Chelli, F.M.; Carlucci, M.; Salvati, L. Urban growth and demographic dynamics in southern Europe: Toward a new statistical approach to regional science. Sustainability 2018, 10, 2765. [Google Scholar] [CrossRef] [Green Version]
  26. Ciommi, M.; Chelli, F.M.; Salvati, L. Integrating parametric and non-parametric multivariate analysis of urban growth and commuting patterns in a European metropolitan area. Qual. Quant. 2019, 53, 957–979. [Google Scholar] [CrossRef]
  27. Bajocco, S.; Dragoz, E.; Gitas, I.; Smiraglia, D.; Salvati, L.; Ricotta, C. Mapping forest fuels through vegetation phenology: The role of coarse-resolution satellite time-series. PLoS ONE 2015, 10, e0119811. [Google Scholar] [CrossRef] [PubMed] [Green Version]
  28. Salvati, L.; Guandalini, A.; Carlucci, M.; Chelli, F.M. An empirical assessment of human development through remote sensing: Evidences from Italy. Ecol. Indic. 2017, 78, 167–172. [Google Scholar] [CrossRef]
Figure 1. An example of the spatial distribution of the percent share of OSM building area in total area of settlements derived from administrative archives (TP) in Milan municipality [23].
Ijgi 11 00029 g001
Figure 2. Identification of buildings from a reference database (overlap of Google maps (image) and OpenStreetMap (point) features): an example from Trivolzio, Pavia, Northern Italy (Franzini et al., 2020).
Ijgi 11 00029 g002
Figure 3. (Left) A visual example of the comparison of building data derived from the National Geo-Portal (GPN_12_ED) and the OSM database (OSM_12) in a strictly urban location of Rome, Central Italy (red and black indicate the building polygons identified through OSM and BODA, respectively); the full coverage of OSM with respect to the BODA archive is documented here. (Right) Spatial overlap of the content of OSM and BODA archives: an example from Frosolone, a rural municipality in Molise, Southern Italy; the partial coverage of OSM with respect to BODA is documented here.
Ijgi 11 00029 g003
Figure 4. An example of BODA building centroid overlay on OSM building database for the municipality of Frosolone, Molise (Southern Italy).
Ijgi 11 00029 g004
Figure 5. Examples of building intersection and the calculation of the related built-up surface area in Frosolone, Molise.
Ijgi 11 00029 g005
Table 1. List of administrative sources used for the construction of the BODA (last access on 10 November 2021.
RegionWebsite
Piedmonthttps://www.geoportale.piemonte.it/cms/progetti/progetto-mosaicatura-catastale
Aosta Valleyhttps://mappe.partout.it/pub/geonavitg/geodownload.asp?carta=CTR
Lombardyhttps://www.geoportale.regione.lombardia.it
Trentino Alto Adigehttp://www.openkat.it/
Venetohttps://idt2.regione.veneto.it/idt/downloader/download
Friuli Venezia Giuliahttp://irdat.regione.fvg.it/consultatore-dati-ambientali-territoriali/search
Liguriahttps://www.regione.liguria.it/open-data/item/7099-carta-tecnica-regionale-1-5000-dal-2007-ii-edizione-3d-db-topografico.html
Emilia Romagnahttps://geoportale.regione.emilia-romagna.it/download/download-data?type=dbtopo
Tuscanyhttp://www502.regione.toscana.it/geoscopio/
Umbriahttp://www.umbriageo.regione.umbria.it/pagina/fabbricati-sistema-ecografico-catastale-regione-um
Marchehttps://www.regione.marche.it/Regione-Utile/Paesaggio-Territorio-Urbanistica-Genio-Civile/Cartografia-regionale/Repertorio/Carta-tecnica-numerica-110000/opendata
Latiumhttp://dati.lazio.it/catalog/it/dataset/carta-tecnica-regionale-2002-2003-5k-roma
Abruzzohttp://opendata.regione.abruzzo.it/content/dbtr-regione-abruzzo-scala-15000-edizione-2007-formato-shp
MoliseNot available
Campaniahttp://sit.cittametropolitana.na.it/downloads.php
Apuliahttp://www.sit.puglia.it/portal/portale_cartografie_tecniche_tematiche/Download
Basilicatahttp://dati.regione.basilicata.it/catalog/dataset/database-topografico-tema-edificato
Calabriahttps://sciamlab.com/opendatahub/dataset/regcal_ctr5k-dbt
Sicilyhttps://www.sitr.regione.sicilia.it/download/download-carta-tecnica-2000/
Sardiniahttp://www.sardegnageoportale.it/areetematiche/databasegeotopografico/
Table 2. Statistical distribution of buildings in OSM and BODA databases for Italy, by urban/rural district and administrative region.
RegionTotal Number of BuildingsSurface Area of Buildings
UrbanRuralTotalUrban (%)Rural (%)UrbanRuralTotalUrban (%) Rural (%)
OSM archive
Piedmont688,877450,6151,139,49260.439.6194.52106.82301.3464.535.4
Aosta Valley37,09434,86871,96251.648.47.805.1412.9360.339.7
Lombardy1,239,227273,9401,513,16781.918.1424.04102.20526.2480.619.4
Trentino Alto Adige203,743134,095337,83860.339.761.6331.3192.9366.333.7
Veneto1,664,300793,5032,457,80367.732.3349.98157.48507.4669.031.0
Friuli Venezia Giulia479,667146,255625,92276.623.4108.2436.14144.3875.025.0
Liguria350,365171,120521,48567.232.865.6615.9881.6480.419.6
Emilia Romagna790,617516,4891,307,10660.539.5252.23135.08387.3165.134.9
Tuscany889,468435,1441,324,61267.132.8187.3875.65263.0371.228.8
Umbria68,47441,221109,69562.437.627.3312.1439.4869.230.8
Marche92,09666,264158,36058.241.832.0518.4150.4763.536.5
Latium491,448183,719675,16772.827.2171.0269.44240.4671.128.9
Abruzzo107,11733,876140,99376.024.036.0713.9650.0372.127.9
Molise29,01222,20351,21556.743.37.216.1213.3354.145.9
Campania404,56789,760494,32781.818.2145.9030.47176.3782.717.3
Apulia698,835896,9431,595,77843.856.2227.63131.55359.1863.436.6
Basilicata72,38585,295157,68045.954.117.7415.8733.6152.847.2
Calabria155,85443,101198,95578.321.735.8412.6148.4574.026.0
Sicily529,782119,042648,82481.618.3117.7735.70153.4676.723.3
Sardinia317,302273,544590,84653.746.3102.3155.36157.6764.935.1
Italy9,310,2304,810,99714,121,22765.934.12572.351067.433639.7770.729.3
BODA archive
Piedmont874,336706,1981,580,53455.344.7307.10184.13491.2362.5
Aosta Valley39,85839,91779,77550.050.09.205.7814.9861.4
Lombardy2,811,587796,4413,608,02877.922.1605.92179.67785.5977.1
Trentino Alto Adige273,803215,790489,59355.944.1134.8096.95231.7558.2
Veneto1,636,588759,1922,395,78068.331.7332.25135.17467.4271.1
Friuli Venezia Giulia2,000,977438,7512,439,72882.018.0297.3279.62376.9478.9
Liguria371,287172,686543,97368.231.764.8318.2983.1278.0
Emilia Romagna1,276,852925,6422,202,49458.042.0254.48157.00411.4861.9
Tuscany1,367,632674,1362,041,76867.033.0178.5576.38254.9370.0
Umbria278,379245,528523,90753.146.951.0333.1984.2260.6
Marche253,176309,649562,82545.055.079.7758.18137.9557.8
Latium941,431851,8581,793,28952.547.5209.32173.33382.6554.7
Abruzzo320,073304,192624,26551.348.766.9639.07106.0463.1
Molise54,37598,734153,10935.564.513.5713.6627.2349.8
Campania800,823730,9891,531,81252.347.7228.36164.43392.8058.1
Apulia508,183919,4891,427,67235.664.4175.37103.75279.1262.8
Basilicata133,259259,623392,88233.966.126.7027.5254.2249.2
Calabria564,671558,5301,123,20150.349.7115.0053.76168.7668.1
Sicily821,598972,5951,794,19345.854.2256.68320.55577.2344.5
Sardinia327,017345,696672,71348.651.4100.7745.86146.6468.7
Italy15,655,90510,325,63625,981,54160.339.73507.991966.325474.3164.1
Table 3. OSM-to-BODA coverage ratio (calculated separately for the total number of buildings and the total surface area of buildings) by Italian region and urban/rural district.
RegionTotal Number of BuildingsSurface Area of Buildings
UrbanRuralTotalUrbanRuralTotal
Piedmont78.7963.8172.1063.3458.0161.34
Aosta Valley93.0787.3590.2184.7188.9086.33
Lombardy44.0834.4041.9469.9856.8866.99
Trentino Alto Adige74.4162.1469.0045.7232.2940.10
Veneto101.69104.52102.59105.34116.50108.56
Friuli Venezia Giulia23.9733.3325.6636.4145.3938.30
Liguria94.3799.0995.87101.2887.3998.22
Emilia Romagna61.9255.8059.3599.1186.0494.13
Tuscany65.0464.5564.88104.9599.04103.18
Umbria24.6016.7920.9453.5636.5846.87
Marche36.3821.4028.1440.1931.6536.58
Latium52.2021.5737.6581.7040.0662.84
Abruzzo33.4711.1422.5953.8735.7347.18
Molise53.3622.4933.4553.1144.7948.93
Campania50.5212.2832.2763.8918.5344.90
Apulia137.5297.55111.77129.80126.80128.68
Basilicata54.3232.8540.1366.4557.6561.99
Calabria27.607.7217.7131.1623.4528.71
Sicily64.4812.2436.1645.8811.1426.59
Sardinia97.0379.1387.83101.53120.71107.53
Italy59.4746.5954.3573.3354.2966.49
Table 4. (Left) Percent share of BODA buildings found in the OSM archive in total BODA coverage; (right) percent share of OSM building area that overlaps with BODA building area in Italy in total OSM building area, by administrative region and urban/rural district.
RegionBODA Buildings in OSM ArchiveBODA Building Overlap with OSM
UrbanRuralTotalUrbanRuralTotal
Piemonte47.238.543.445.938.343.0
Aosta Valley64.151.458.060.247.355.2
Lombardy41.730.539.455.335.550.8
Trentino Alto Adige64.847.257.235.519.829.0
Veneto80.774.178.677.370.375.2
Friuli Venezia Giulia88.984.988.258.050.356.4
Liguria93.592.793.282.365.978.7
Emilia Romagna77.362.671.280.867.275.6
Tuscany74.859.669.980.463.875.4
Umbria26.713.320.537.720.330.8
Marche28.518.423.027.719.724.3
Latium43.416.730.854.926.041.8
Abruzzo24.08.116.433.420.228.5
Molise29.513.419.133.724.128.9
Campania35.28.222.443.711.430.1
Apulia93.878.783.996.085.191.9
Basilicata36.00.036.055.051.853.4
Calabria16.65.711.119.813.317.7
Sicily28.88.817.833.18.119.2
Sardinia83.471.177.079.797.985.3
Italy58.340.751.557.437.250.2
Publisher’s Note: MDPI stays neutral with regard to jurisdictional claims in published maps and institutional affiliations.

